Embed Size (px)
Citation preview
Prepared for the Foundation of the American College of Healthcare Executives
Session 25AB Transform the Patient Experience: Consistently Delivering Safe, High-
Quality, Patient-Centered Care
Presented by: Gary Yates, MD Craig Clapper Denise Murphy

1
Transform the Patient Experience:Consistently Delivering Safe, High-Quality,
Patient-Centered Care
Denise Murphy, RN, BSN, MPH, CIC, CPPS, FAAN
Craig Clapper, PE, CMQ/OE
Gary Yates, MD
Disclosure of RelevantFinancial RelationshipsThe following faculty of this continuing education activity has no relevant financial relationships with commercial interests to disclose:
• Denise Murphy
The following faculty of this continuing education activity has financial relationships with commercial interests to disclose:
Craig Clapper
• Press Ganey– Salary– Employee
Gary Yates, MD
• Press Ganey – Salary – Employee
2
2
Presenters
• Denise Murphy, RN, BSN, MPH, CIC, CPPS, FAAN
Vice-President for Patient Care Systems and Senior Nurse Executive, BJC HealthCare
• Craig Clapper, PE, CMQ/OE
Partner, Strategic Consulting, Press Ganey Associates
• Gary Yates, MD
Partner, Strategic Consulting, Press Ganey Associates
3
Learning Objectives
• Discuss the critical interdependency of safety, quality, and service as three elements of the patient experience and recognize the value of high reliability.
• Identify proven examples of organizational structures and practices that can be harnessed to improve all three elements of the patient experience.
4
3
Agenda
• The interdependency of safety, quality, and patient-centeredness
• High reliability as a chassis for improving the patient experience
• Health system case study
• Evolving thinking and current approaches
5
The Patient Experience: More Than Just Satisfaction
• Our starting point:
– Meeting the needs of patients cost-effectively
• Our goal:
– Deliver safe, high quality care with empathy and understanding for every patient every day
• More than just patient satisfaction or service experience or safety or quality alone
• Physician and employee engagement as the foundation
6
4
Av
erag
e N
atio
nal
Per
cen
tile
Ran
k
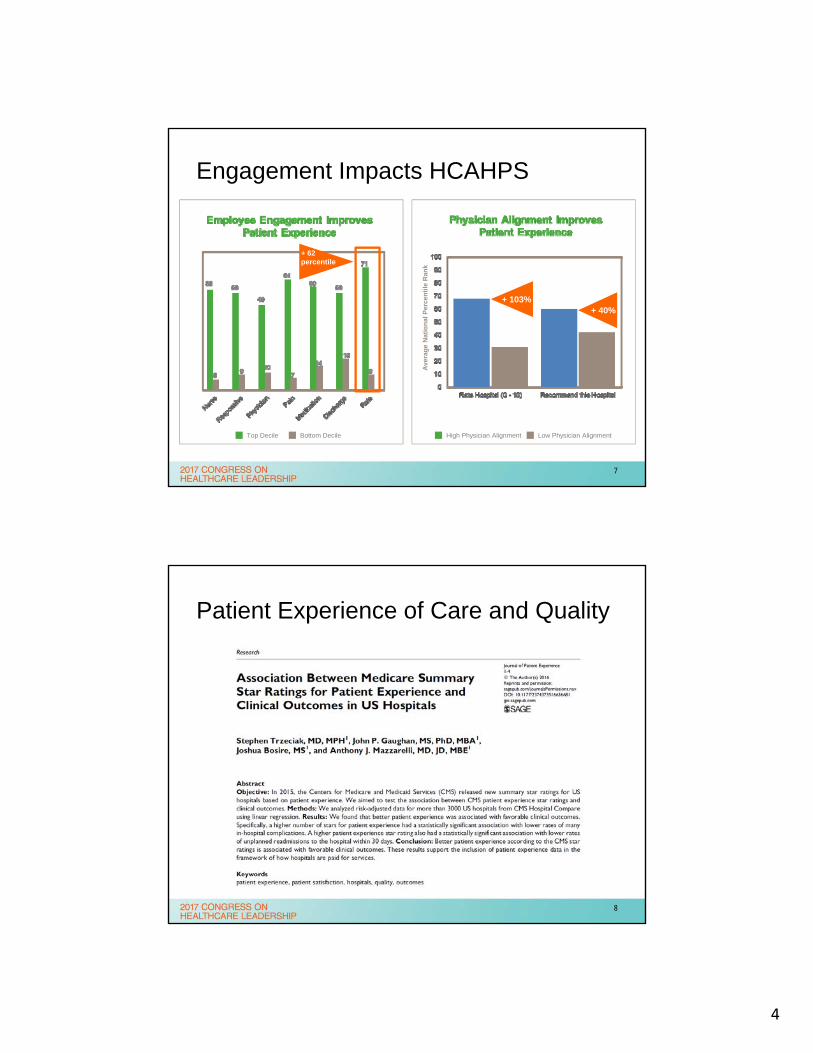
High Physician Alignment Low Physician AlignmentTop Decile Bottom Decile
Engagement Impacts HCAHPS
+ 4%
+ 62percentile
+ 103%+ 40%
7
Patient Experience of Care and Quality
8
5
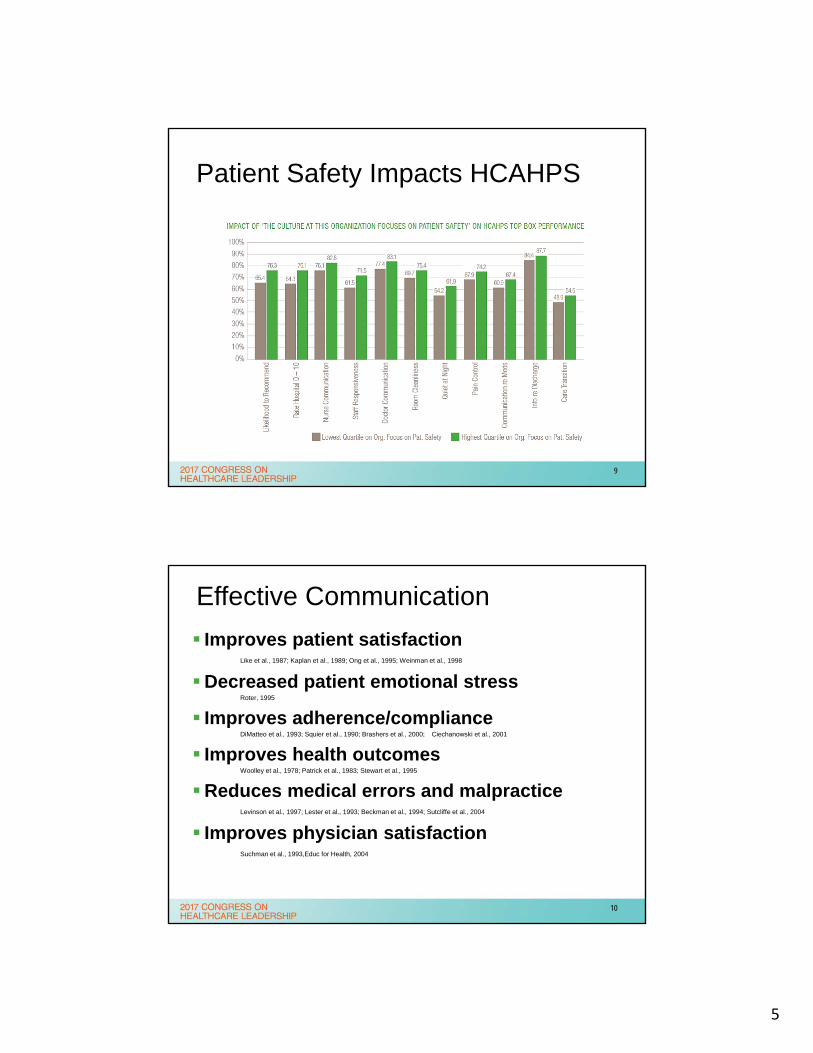
Patient Safety Impacts HCAHPS
9
Effective Communication
Improves patient satisfaction Like et al., 1987; Kaplan et al., 1989; Ong et al., 1995; Weinman et al., 1998
Decreased patient emotional stressRoter, 1995
Improves adherence/complianceDiMatteo et al., 1993; Squier et al., 1990; Brashers et al., 2000; Ciechanowski et al., 2001
Improves health outcomes Woolley et al., 1978; Patrick et al., 1983; Stewart et al., 1995
Reduces medical errors and malpractice Levinson et al., 1997; Lester et al., 1993; Beckman et al., 1994; Sutcliffe et al., 2004
Improves physician satisfactionSuchman et al., 1993,Educ for Health, 2004
10
6
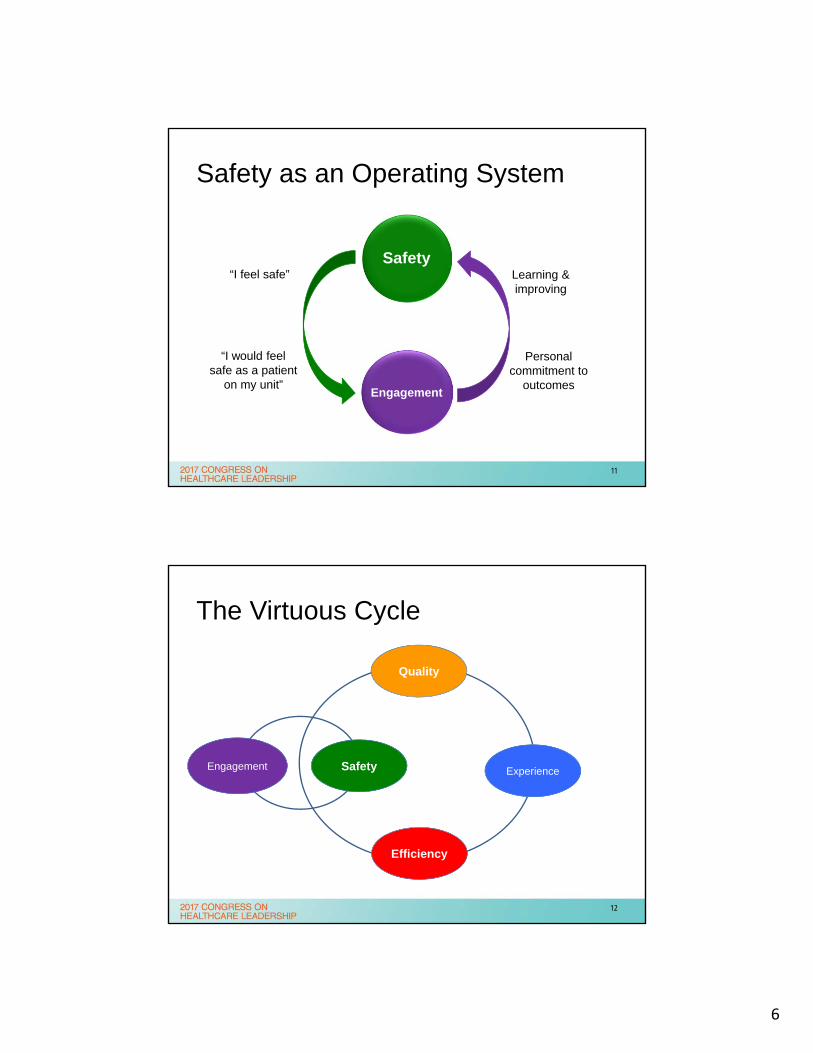
Safety as an Operating System
Safety
Engagement
“I feel safe”
“I would feel safe as a patient
on my unit”
Personal commitment to
outcomes
Learning &improving
11
The Virtuous Cycle
SafetyEngagement
Quality
Experience
Efficiency
12
7
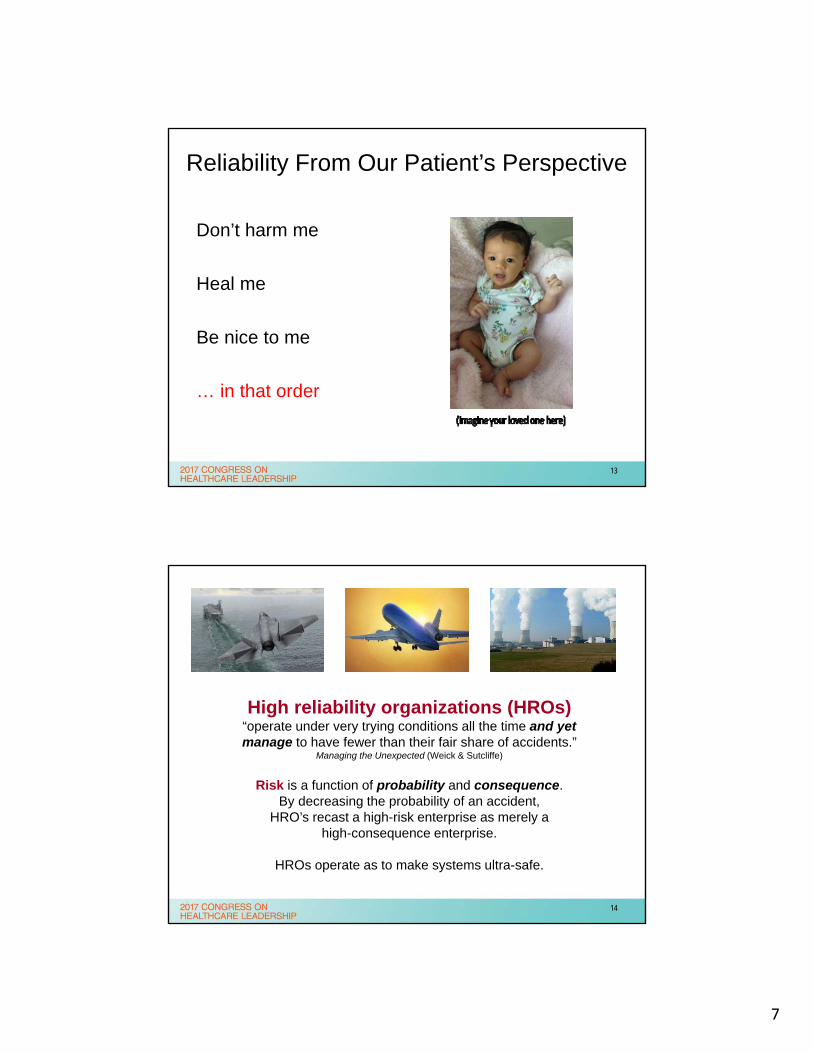
Reliability From Our Patient’s Perspective
Don’t harm me
Heal me
Be nice to me
… in that order
13
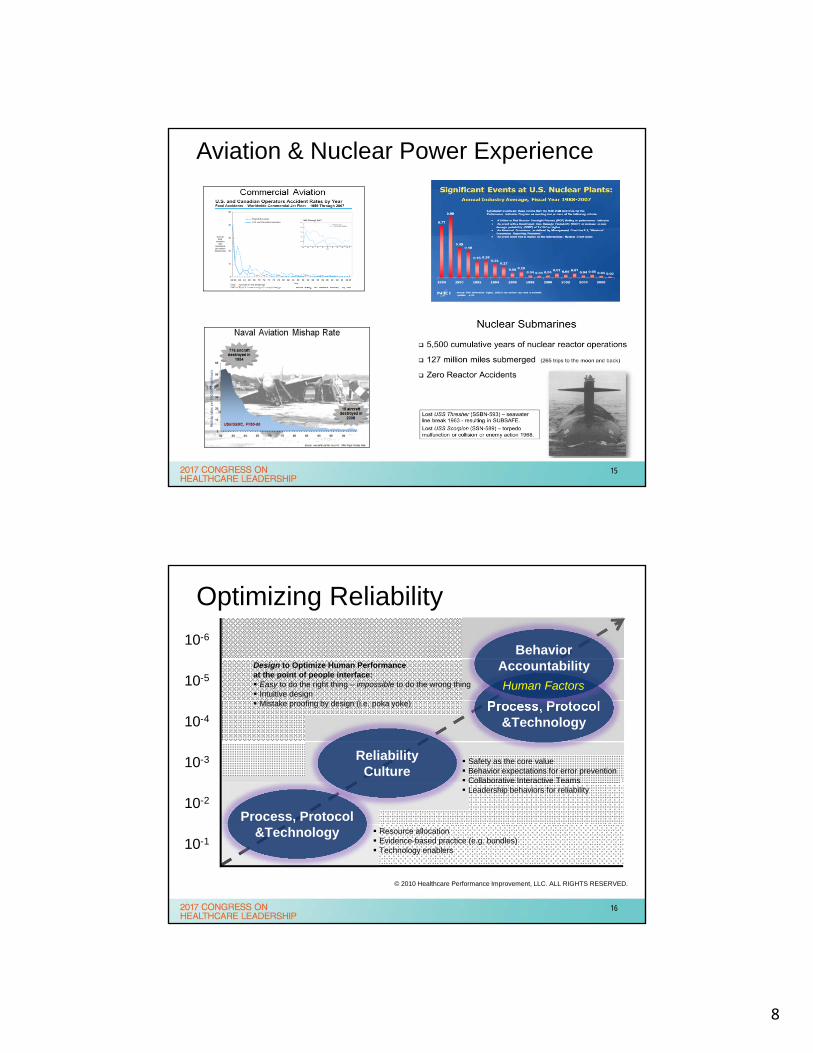
High reliability organizations (HROs)“operate under very trying conditions all the time and yet manage to have fewer than their fair share of accidents.”
Managing the Unexpected (Weick & Sutcliffe)
Risk is a function of probability and consequence.By decreasing the probability of an accident,
HRO’s recast a high-risk enterprise as merely ahigh-consequence enterprise.
HROs operate as to make systems ultra-safe.
14
8
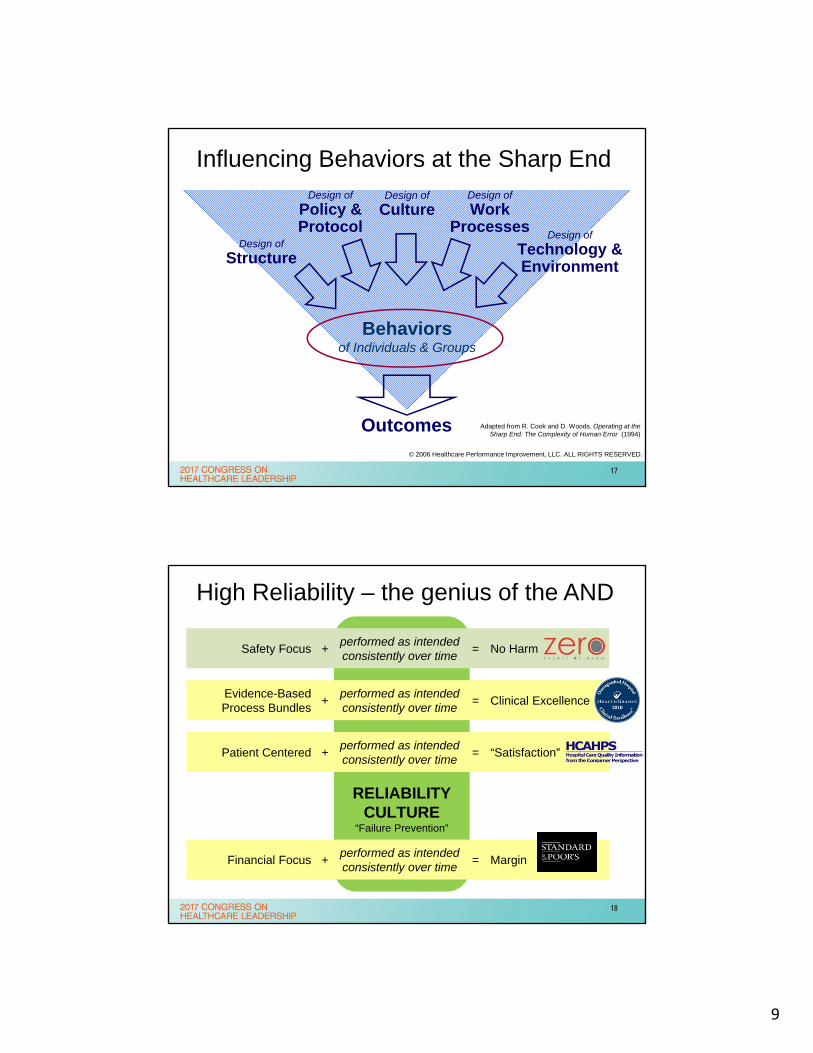
Aviation & Nuclear Power Experience
15
Optimizing Reliability
10-6
10-5
10-4
10-3
10-2
10-1
ReliabilityCulture
Safety as the core value Behavior expectations for error prevention Collaborative Interactive Teams Leadership behaviors for reliability
Process, Protocol&Technology Resource allocation
Evidence-based practice (e.g. bundles) Technology enablers
Process, Protocol&Technology
BehaviorAccountability
Human Factors
Design to Optimize Human Performanceat the point of people interface: Easy to do the right thing – impossible to do the wrong thing Intuitive design Mistake proofing by design (i.e. poka yoke)
© 2010 Healthcare Performance Improvement, LLC. ALL RIGHTS RESERVED.
16
9
Influencing Behaviors at the Sharp End
Adapted from R. Cook and D. Woods, Operating at the Sharp End: The Complexity of Human Error (1994)
Design of
Culture
Outcomes
Behaviorsof Individuals & Groups
Design of
Structure
Design of
Technology & Environment
Design of
WorkProcesses
Design of
Policy &Protocol
© 2006 Healthcare Performance Improvement, LLC. ALL RIGHTS RESERVED.
17
High Reliability – the genius of the AND
RELIABILITYCULTURE
“Failure Prevention”
Evidence-BasedProcess Bundles
+performed as intendedconsistently over time
= Clinical Excellence
Patient Centered +performed as intendedconsistently over time
= “Satisfaction”
Safety Focus +performed as intendedconsistently over time
= No Harm
Financial Focus +performed as intendedconsistently over time
= Margin
18
10
Journey to High Reliability:A Story from The Front Line
Denise Murphy, BSN, MPH, CIC, CPPS, FAAN
Vice President, Patient Care Systems, BJC HealthCare, St. Louis
Formerly: Vice President, Quality and Patient Safety, Main Line Health, Bryn Mawr, PA
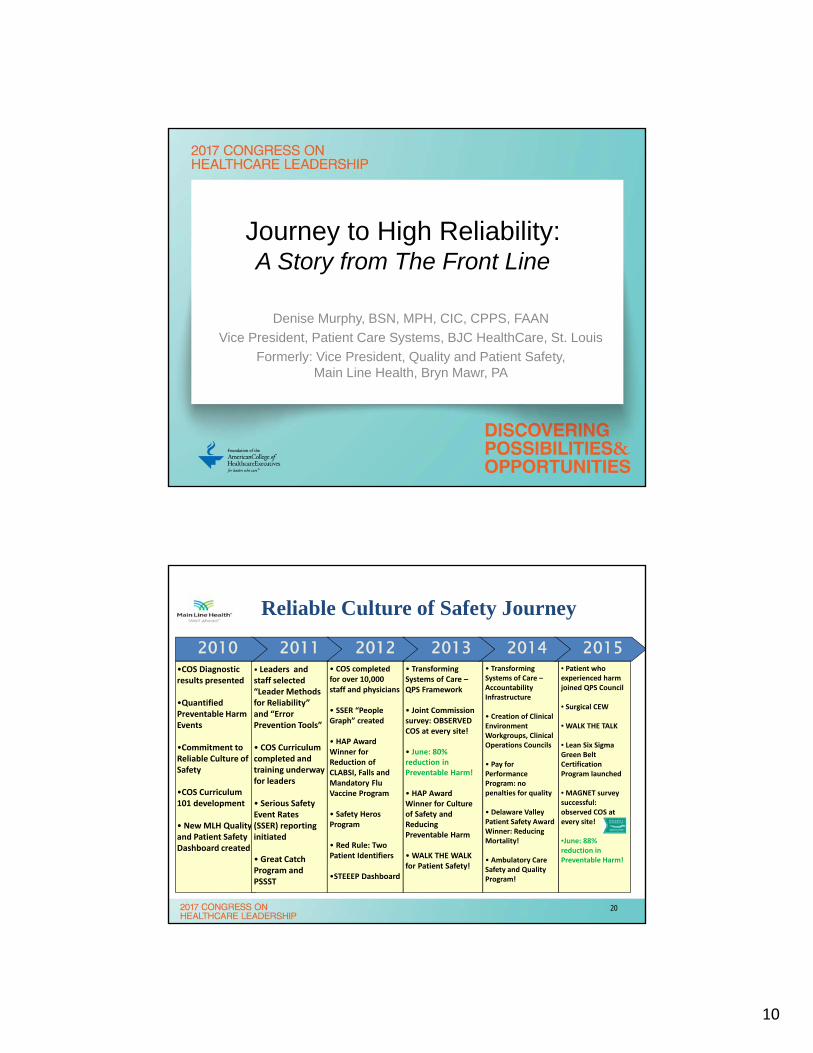
Reliable Culture of Safety Journey
•COS Diagnostic results presented
•Quantified Preventable Harm Events
•Commitment to Reliable Culture of Safety
•COS Curriculum 101 development
• New MLH Quality and Patient Safety Dashboard created
• Leaders and staff selected “Leader Methods for Reliability” and “Error Prevention Tools”
• COS Curriculum completed and training underway for leaders
• Serious Safety Event Rates (SSER) reporting initiated
• Great Catch Program and PSSST
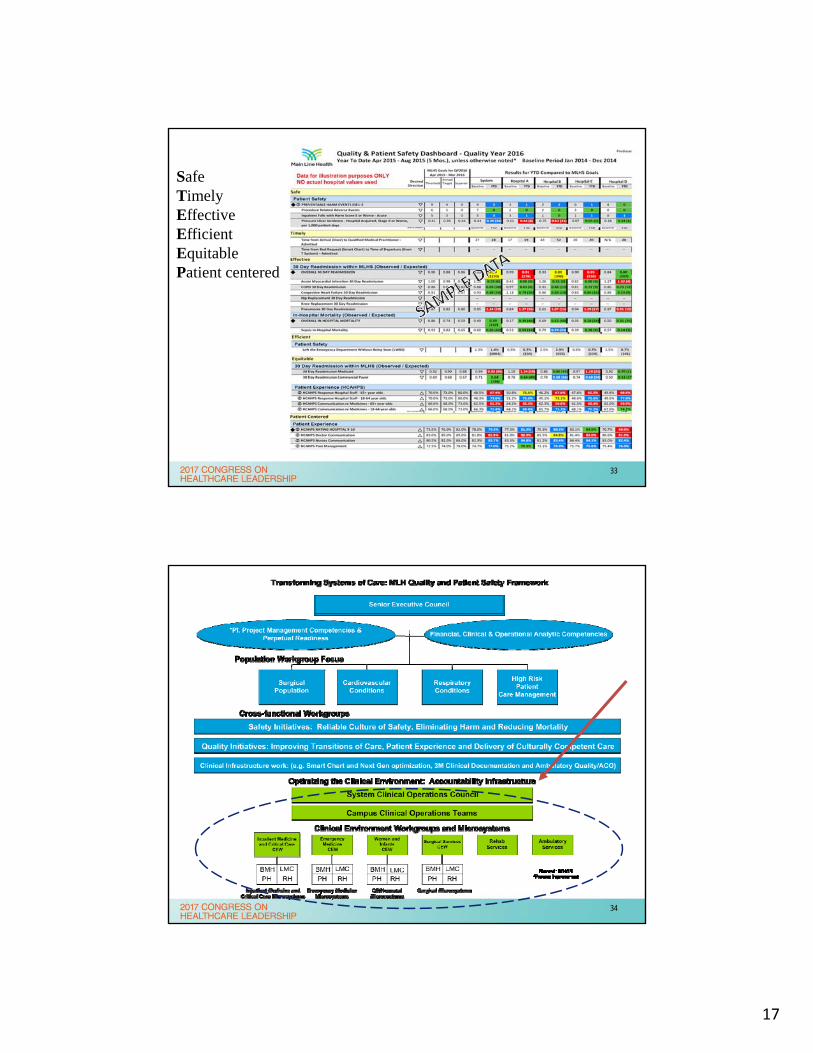
• Transforming Systems of Care –QPS Framework
• Joint Commission survey: OBSERVED COS at every site!
• June: 80% reduction in Preventable Harm!
• HAP Award Winner for Culture of Safety and Reducing Preventable Harm
•WALK THE WALK for Patient Safety!
• Transforming Systems of Care –Accountability Infrastructure
• Creation of Clinical Environment Workgroups, Clinical Operations Councils
• Pay for Performance Program: no penalties for quality
• Delaware Valley Patient Safety Award Winner: Reducing Mortality!
• Ambulatory Care Safety and Quality Program!
• Patient who experienced harm joined QPS Council
• Surgical CEW
• WALK THE TALK
• Lean Six Sigma Green Belt Certification Program launched
• MAGNET survey successful: observed COS at every site!
•June: 88% reduction in Preventable Harm!
• COS completed for over 10,000 staff and physicians
• SSER “People Graph” created
• HAP Award Winner for Reduction of CLABSI, Falls and Mandatory Flu Vaccine Program
• Safety HerosProgram
• Red Rule: Two Patient Identifiers
•STEEEP Dashboard
2011 201520142010 2012 2013
20
11
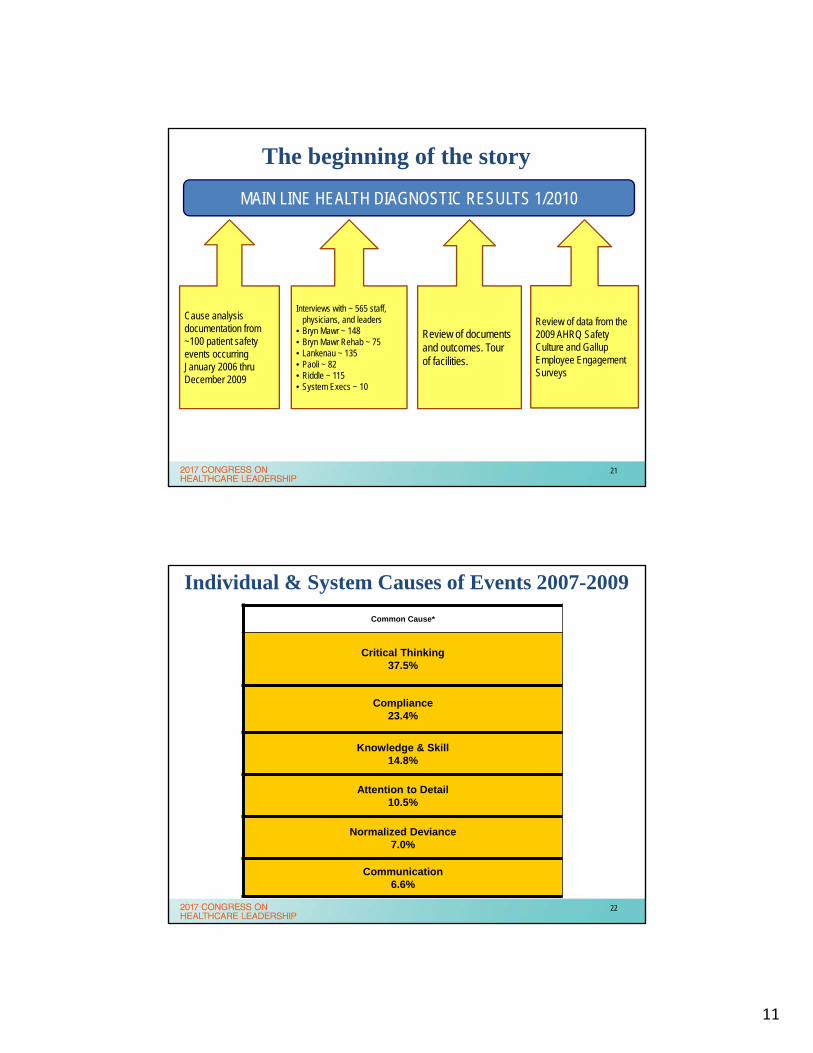
MAIN LINE HEALTH DIAGNOSTIC RESULTS 1/2010
Cause analysis documentation from ~100 patient safety events occurringJanuary 2006 thru December 2009
Interviews with ~ 565 staff, physicians, and leaders
• Bryn Mawr ~ 148• Bryn Mawr Rehab ~ 75• Lankenau ~ 135• Paoli ~ 82• Riddle ~ 115• System Execs ~ 10
Review of documents and outcomes. Tour of facilities.
Review of data from the 2009 AHRQ Safety Culture and Gallup Employee Engagement Surveys
The beginning of the story
21
Individual & System Causes of Events 2007-2009
Common Cause*
Critical Thinking37.5%
Compliance 23.4%
Knowledge & Skill14.8%
Attention to Detail10.5%
Normalized Deviance7.0%
Communication6.6%
22
12
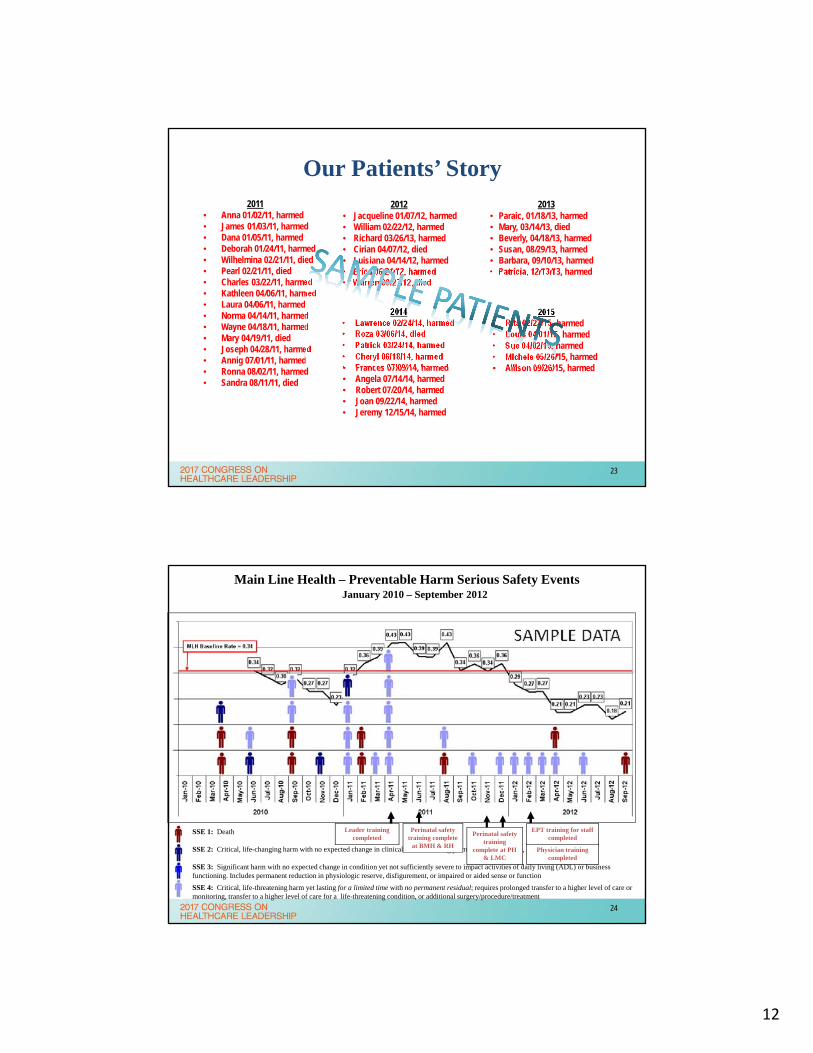
2011• Anna 01/02/11, harmed• James 01/03/11, harmed• Dana 01/05/11, harmed• Deborah 01/24/11, harmed• Wilhelmina 02/21/11, died• Pearl 02/21/11, died• Charles 03/22/11, harmed• Kathleen 04/06/11, harmed• Laura 04/06/11, harmed• Norma 04/14/11, harmed• Wayne 04/18/11, harmed• Mary 04/19/11, died• Joseph 04/28/11, harmed• Annig 07/01/11, harmed• Ronna 08/02/11, harmed• Sandra 08/11/11, died
2012• Jacqueline 01/07/12, harmed• William 02/22/12, harmed• Richard 03/26/13, harmed• Cirian 04/07/12, died• Luisiana 04/14/12, harmed• Erica 06/21/12, harmed• Warren 09/27/12, died
2014• Lawrence 02/24/14, harmed• Roza 03/06/14, died• Patrick 03/24/14, harmed• Cheryl 06/18/14, harmed• Frances 07/09/14, harmed• Angela 07/14/14, harmed• Robert 07/20/14, harmed• Joan 09/22/14, harmed• Jeremy 12/15/14, harmed
2015• Rita 02/23/15, harmed• Louis 04/01/15, harmed• Sue 04/02/15, harmed• Michele 05/26/15, harmed• Allison 09/26/15, harmed
Our Patients’ Story2013
• Paraic, 01/18/13, harmed• Mary, 03/14/13, died• Beverly, 04/18/13, harmed• Susan, 08/29/13, harmed• Barbara, 09/10/13, harmed• Patricia, 12/13/13, harmed
23
Main Line Health – Preventable Harm Serious Safety EventsJanuary 2010 – September 2012
SSE 1: Death
SSE 2: Critical, life-changing harm with no expected change in clinical status including permanent loss of organ, limb, or function
SSE 3: Significant harm with no expected change in condition yet not sufficiently severe to impact activities of daily living (ADL) or business functioning. Includes permanent reduction in physiologic reserve, disfigurement, or impaired or aided sense or function
SSE 4: Critical, life-threatening harm yet lasting for a limited time with no permanent residual; requires prolonged transfer to a higher level of care or monitoring, transfer to a higher level of care for a life-threatening condition, or additional surgery/procedure/treatment
Leader training completed
Physician training completed
Perinatal safety training complete
at BMH & RH
Perinatal safety training
complete at PH & LMC
EPT training for staff completed
24
13
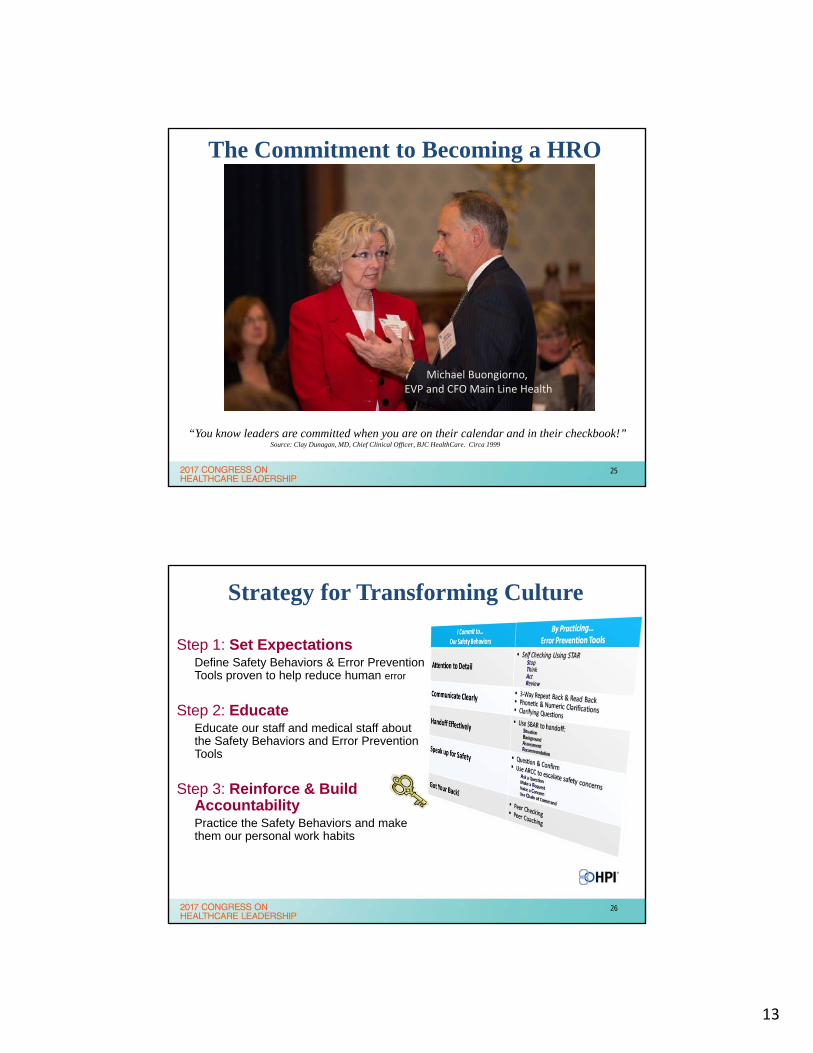
The Commitment to Becoming a HRO
“You know leaders are committed when you are on their calendar and in their checkbook!”Source: Clay Dunagan, MD, Chief Clinical Officer, BJC HealthCare. Circa 1999
Michael Buongiorno, EVP and CFO Main Line Health
25
Strategy for Transforming Culture
Step 1: Set ExpectationsDefine Safety Behaviors & Error Prevention Tools proven to help reduce human error
Step 2: EducateEducate our staff and medical staff about the Safety Behaviors and Error Prevention Tools
Step 3: Reinforce & Build AccountabilityPractice the Safety Behaviors and make them our personal work habits
26
14
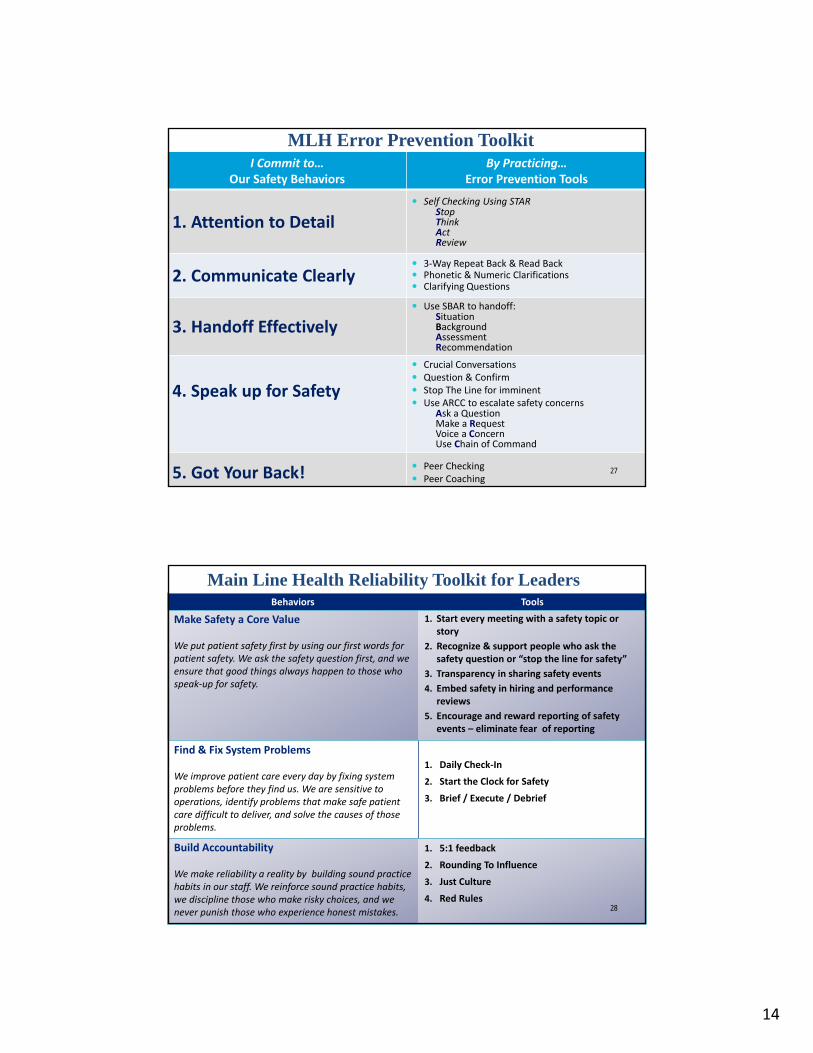
I Commit to…Our Safety Behaviors
By Practicing…Error Prevention Tools
1. Attention to Detail Self Checking Using STAR
StopThinkAct Review
2. Communicate Clearly 3‐Way Repeat Back & Read Back Phonetic & Numeric Clarifications Clarifying Questions
3. Handoff Effectively Use SBAR to handoff:
SituationBackgroundAssessmentRecommendation
4. Speak up for Safety
Crucial Conversations Question & Confirm Stop The Line for imminent Use ARCC to escalate safety concerns
Ask a QuestionMake a RequestVoice a ConcernUse Chain of Command
5. Got Your Back! Peer Checking Peer Coaching
MLH Error Prevention Toolkit
27
Behaviors Tools
Make Safety a Core Value
We put patient safety first by using our first words for patient safety. We ask the safety question first, and we ensure that good things always happen to those who speak‐up for safety.
1. Start every meeting with a safety topic or story
2. Recognize & support people who ask the safety question or “stop the line for safety”
3. Transparency in sharing safety events
4. Embed safety in hiring and performance reviews
5. Encourage and reward reporting of safety events – eliminate fear of reporting
Find & Fix System Problems
We improve patient care every day by fixing system problems before they find us. We are sensitive to operations, identify problems that make safe patient care difficult to deliver, and solve the causes of those problems.
1. Daily Check‐In
2. Start the Clock for Safety
3. Brief / Execute / Debrief
Build Accountability
We make reliability a reality by building sound practice habits in our staff. We reinforce sound practice habits, we discipline those who make risky choices, and we never punish those who experience honest mistakes.
1. 5:1 feedback
2. Rounding To Influence
3. Just Culture
4. Red Rules
Main Line Health Reliability Toolkit for Leaders
28
15
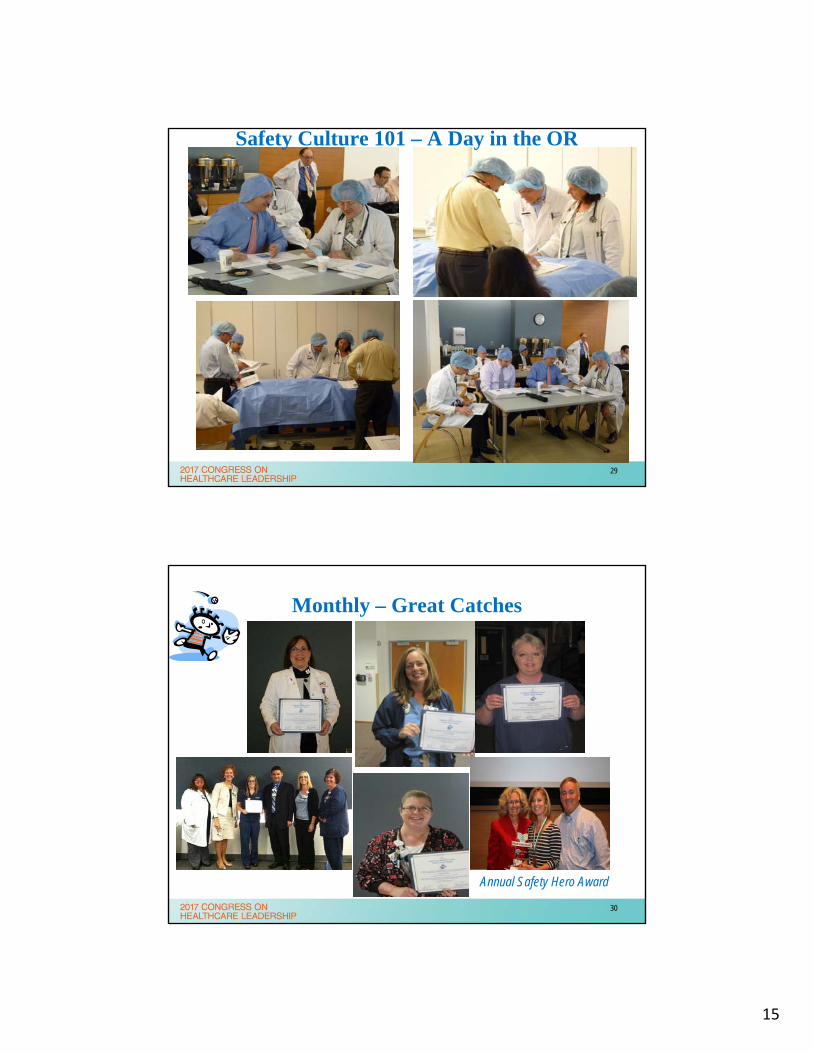
Safety Culture 101 – A Day in the OR
29
Monthly – Great Catches
Annual Safety Hero Award
30
16
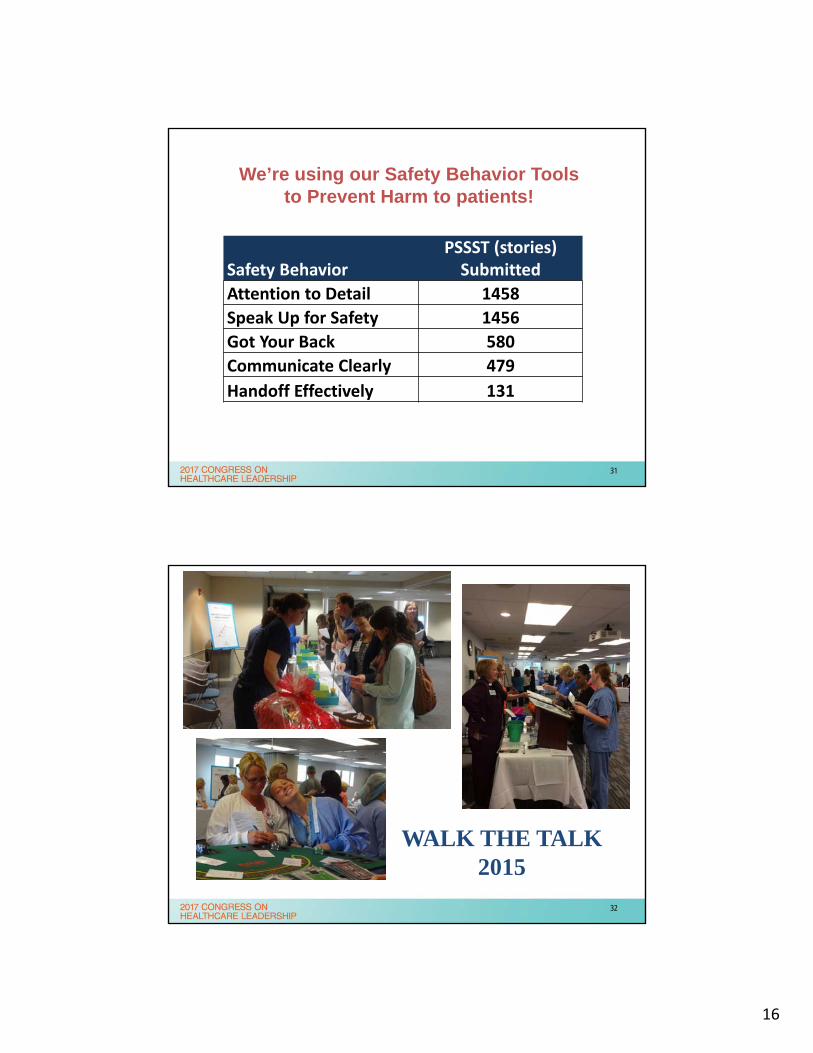
We’re using our Safety Behavior Tools to Prevent Harm to patients!
Safety BehaviorPSSST (stories) Submitted
Attention to Detail 1458
Speak Up for Safety 1456
Got Your Back 580
Communicate Clearly 479
Handoff Effectively 131
31
WALK THE TALK2015
32
17
SafeTimelyEffectiveEfficientEquitablePatient centered
33
34
18
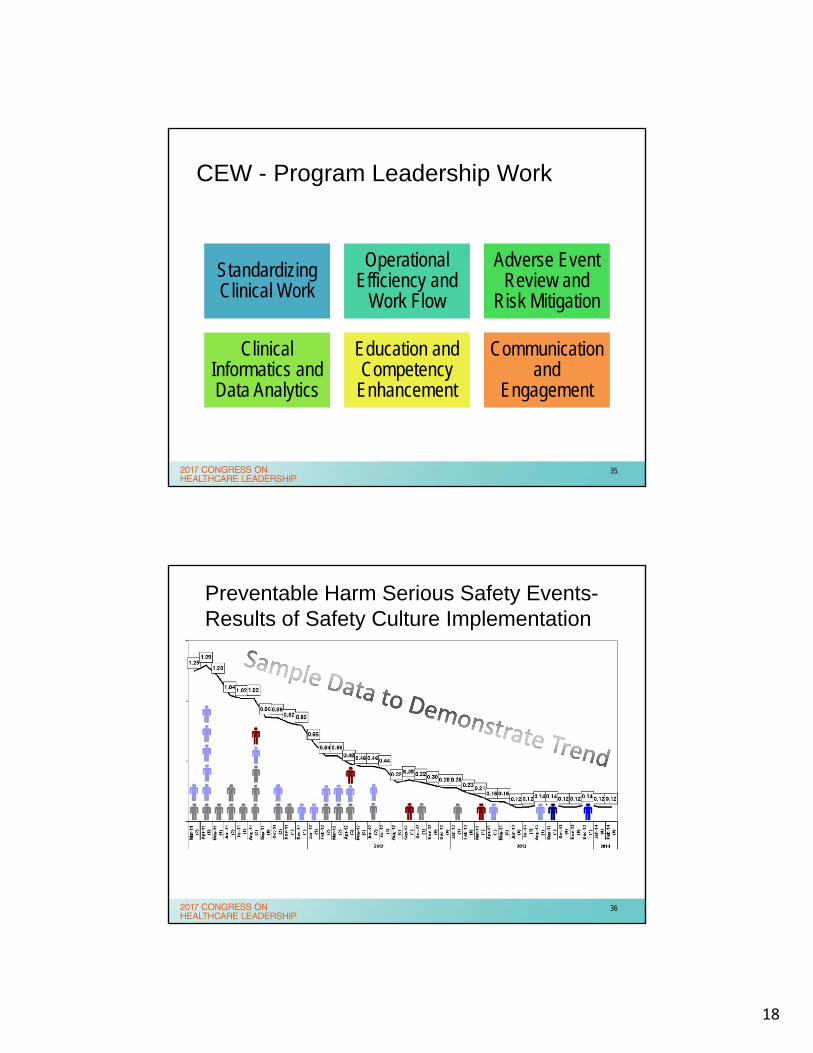
CEW - Program Leadership Work
Standardizing Clinical Work
Operational Efficiency and
Work Flow
Adverse Event Review and
Risk Mitigation
Clinical Informatics and Data Analytics
Education and Competency
Enhancement
Communication and
Engagement
35
Preventable Harm Serious Safety Events-Results of Safety Culture Implementation
36
19
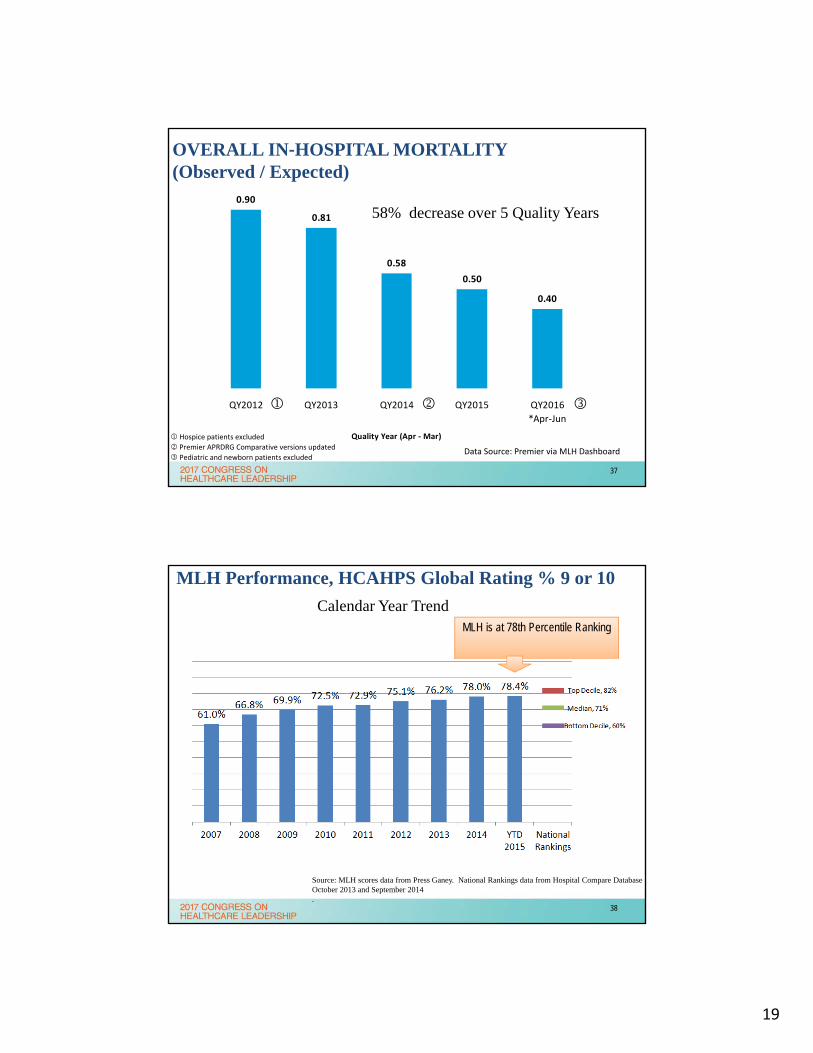
0.90
0.81
0.58
0.50
0.40
QY2012 QY2013 QY2014 QY2015 QY2016
*Apr‐Jun
Quality Year (Apr ‐ Mar)
OVERALL IN‐HOSPITAL MORTALITY (Observed / Expected)
Data Source: Premier via MLH Dashboard
58% decrease over 5 Quality Years
Hospice patients excluded
Premier APRDRG Comparative versions updated
Pediatric and newborn patients excluded
37
MLH Performance, HCAHPS Global Rating % 9 or 10
Source: MLH scores data from Press Ganey. National Rankings data from Hospital Compare Database October 2013 and September 2014 .
Calendar Year TrendMLH is at 78th Percentile Ranking
38
20
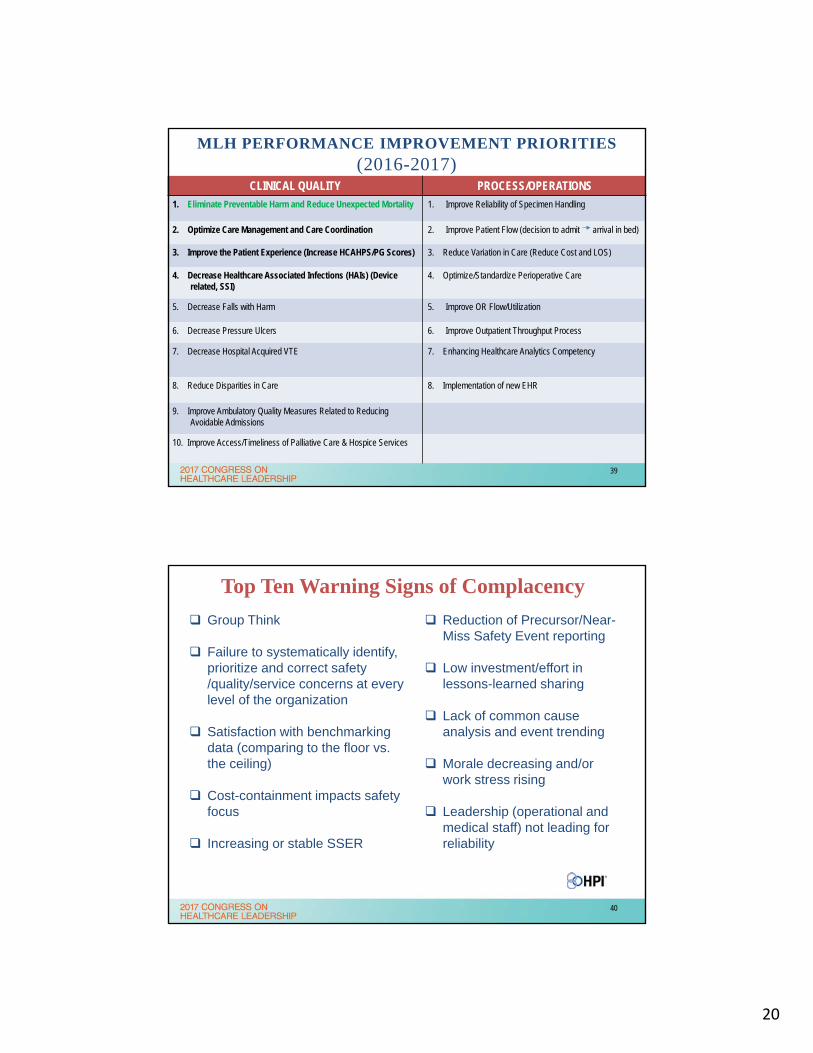
MLH PERFORMANCE IMPROVEMENT PRIORITIES(2016-2017)
CLINICAL QUALITY PROCESS/OPERATIONS
1. Eliminate Preventable Harm and Reduce Unexpected Mortality 1. Improve Reliability of Specimen Handling
2. Optimize Care Management and Care Coordination 2. Improve Patient Flow (decision to admit arrival in bed)
3. Improve the Patient Experience (Increase HCAHPS/PG Scores) 3. Reduce Variation in Care (Reduce Cost and LOS)
4. Decrease Healthcare Associated Infections (HAIs) (Device related, SSI)
4. Optimize/Standardize Perioperative Care
5. Decrease Falls with Harm 5. Improve OR Flow/Utilization
6. Decrease Pressure Ulcers 6. Improve Outpatient Throughput Process
7. Decrease Hospital Acquired VTE 7. Enhancing Healthcare Analytics Competency
8. Reduce Disparities in Care 8. Implementation of new EHR
9. Improve Ambulatory Quality Measures Related to Reducing Avoidable Admissions
10. Improve Access/Timeliness of Palliative Care & Hospice Services
39
Top Ten Warning Signs of Complacency
Group Think
Failure to systematically identify, prioritize and correct safety /quality/service concerns at every level of the organization
Satisfaction with benchmarking data (comparing to the floor vs. the ceiling)
Cost-containment impacts safety focus
Increasing or stable SSER
Reduction of Precursor/Near-Miss Safety Event reporting
Low investment/effort in lessons-learned sharing
Lack of common cause analysis and event trending
Morale decreasing and/or work stress rising
Leadership (operational and medical staff) not leading for reliability
40
21
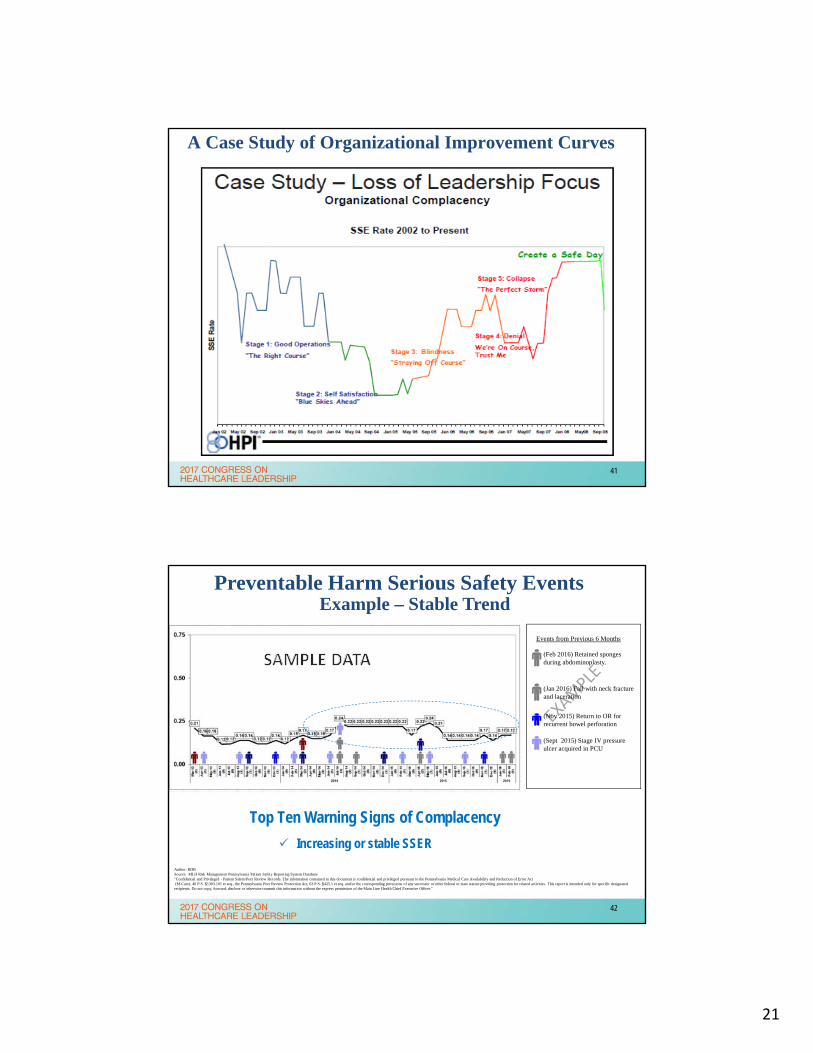
A Case Study of Organizational Improvement Curves
41
Preventable Harm Serious Safety EventsExample – Stable Trend
42
Events from Previous 6 Months
(Sept 2015) Stage IV pressure ulcer acquired in PCU
(Nov 2015) Return to OR for recurrent bowel perforation
(Jan 2016) Fall with neck fracture and laceration
(Feb 2016) Retained sponges during abdominoplasty.
Top Ten Warning Signs of Complacency
Increasing or stable SSER
Author: RDBSource: MLH Risk Management Pennsylvania Patient Safety Reporting System Database"Confidential and Privileged - Patient Safety/Peer Review Records. The information contained in this document is confidential and privileged pursuant to the Pennsylvania Medical Care Availability and Reduction of Error Act(M-Care), 40 P.S. §1303.101 et seq., the Pennsylvania Peer Review Protection Act, 63 P.S. §425.1 et seq. and/or the corresponding provisions of any successor or other federal or state statute providing protection for related activities. This report is intended only for specific designated recipients. Do not copy, forward, disclose or otherwise transmit this information without the express permission of the Main Line Health Chief Executive Officer."
42
22
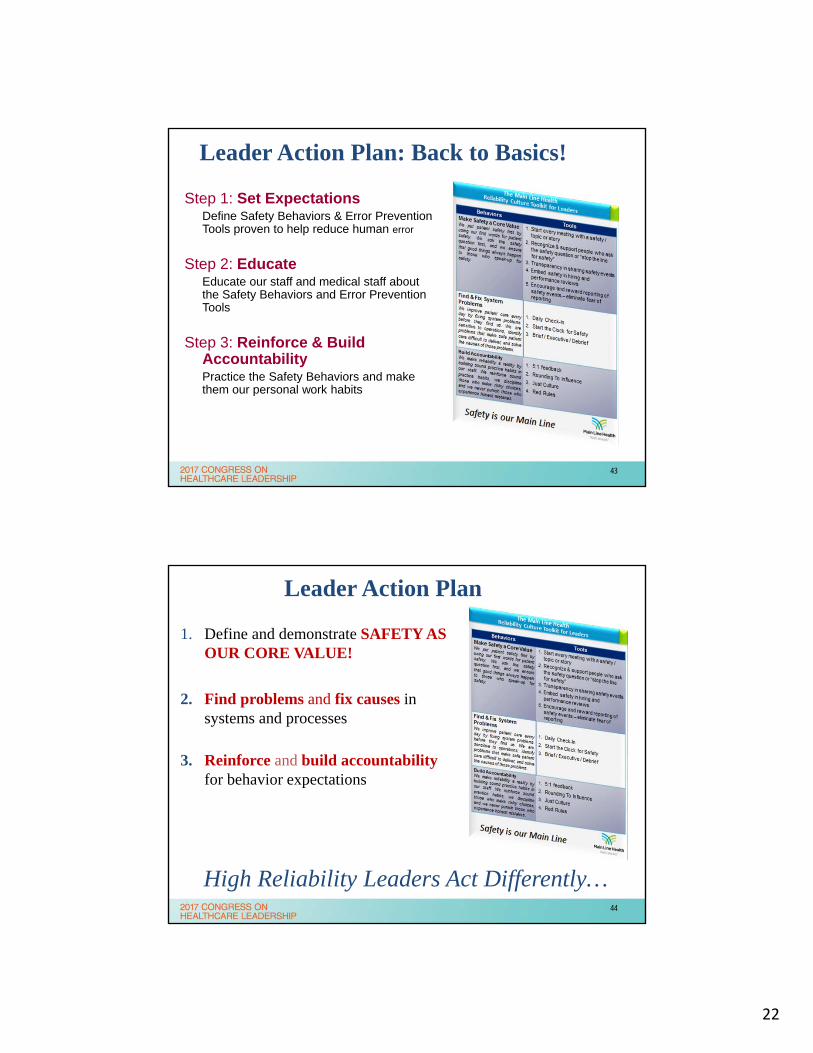
Leader Action Plan: Back to Basics!
Step 1: Set ExpectationsDefine Safety Behaviors & Error Prevention Tools proven to help reduce human error
Step 2: EducateEducate our staff and medical staff about the Safety Behaviors and Error Prevention Tools
Step 3: Reinforce & Build AccountabilityPractice the Safety Behaviors and make them our personal work habits
43
1. Define and demonstrate SAFETY AS OUR CORE VALUE!
2. Find problems and fix causes in systems and processes
3. Reinforce and build accountabilityfor behavior expectations
High Reliability Leaders Act Differently…
Leader Action Plan
44
23
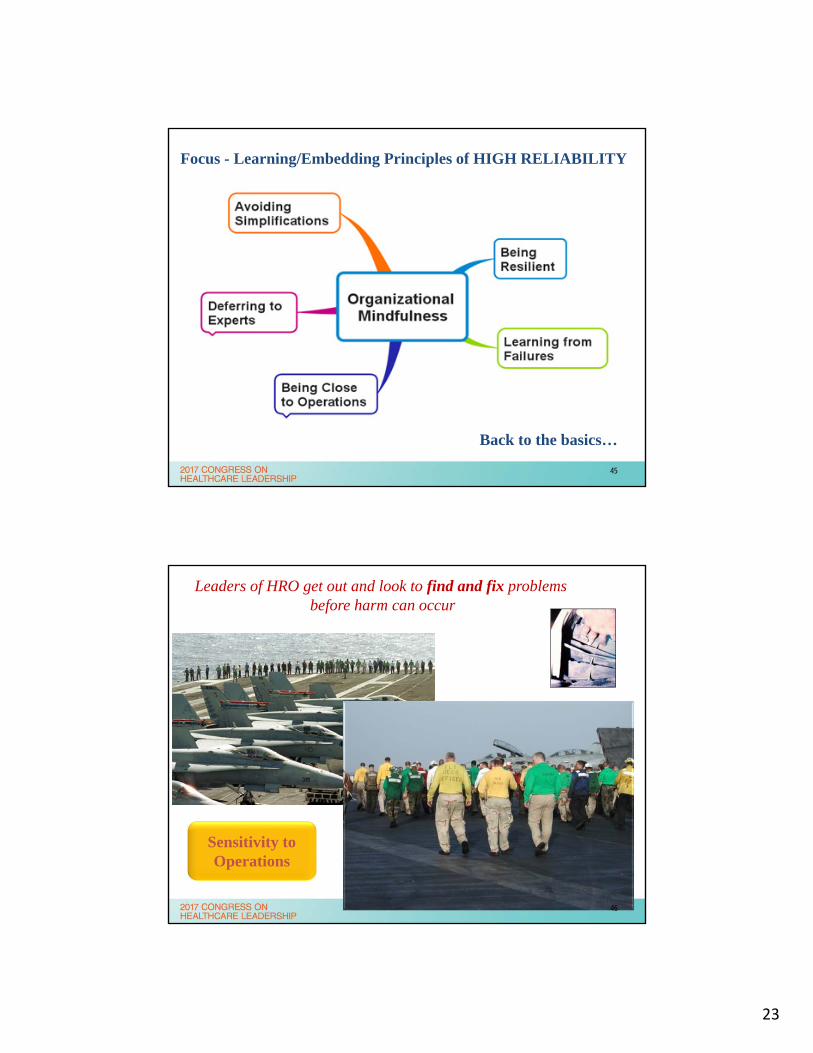
Focus - Learning/Embedding Principles of HIGH RELIABILITY
Back to the basics…
45
Leaders of HRO get out and look to find and fix problems before harm can occur
Sensitivity to Operations
46
24
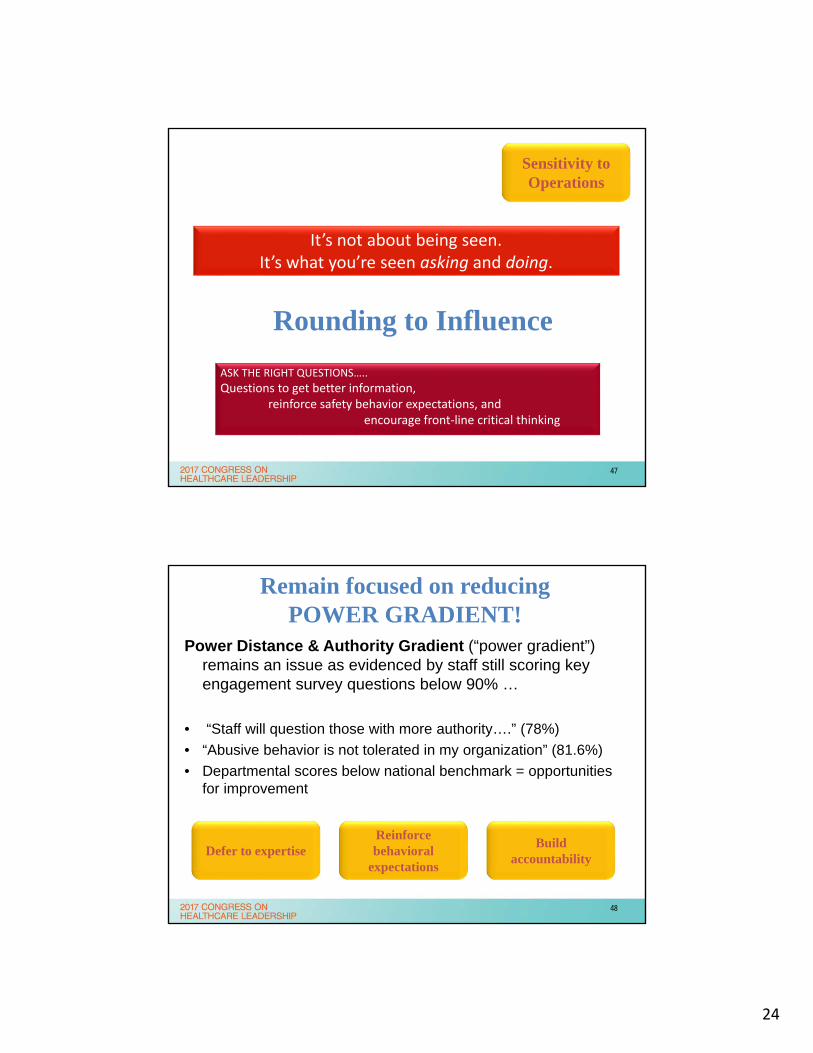
Rounding to Influence
It’s not about being seen.It’s what you’re seen asking and doing.
ASK THE RIGHT QUESTIONS…..
Questions to get better information,reinforce safety behavior expectations, and
encourage front‐line critical thinking
Sensitivity to Operations
47
Remain focused on reducing POWER GRADIENT!
Power Distance & Authority Gradient (“power gradient”) remains an issue as evidenced by staff still scoring key engagement survey questions below 90% …
• “Staff will question those with more authority….” (78%)
• “Abusive behavior is not tolerated in my organization” (81.6%)
• Departmental scores below national benchmark = opportunities for improvement
Defer to expertiseBuild
accountability
Reinforce behavioral
expectations
48
25
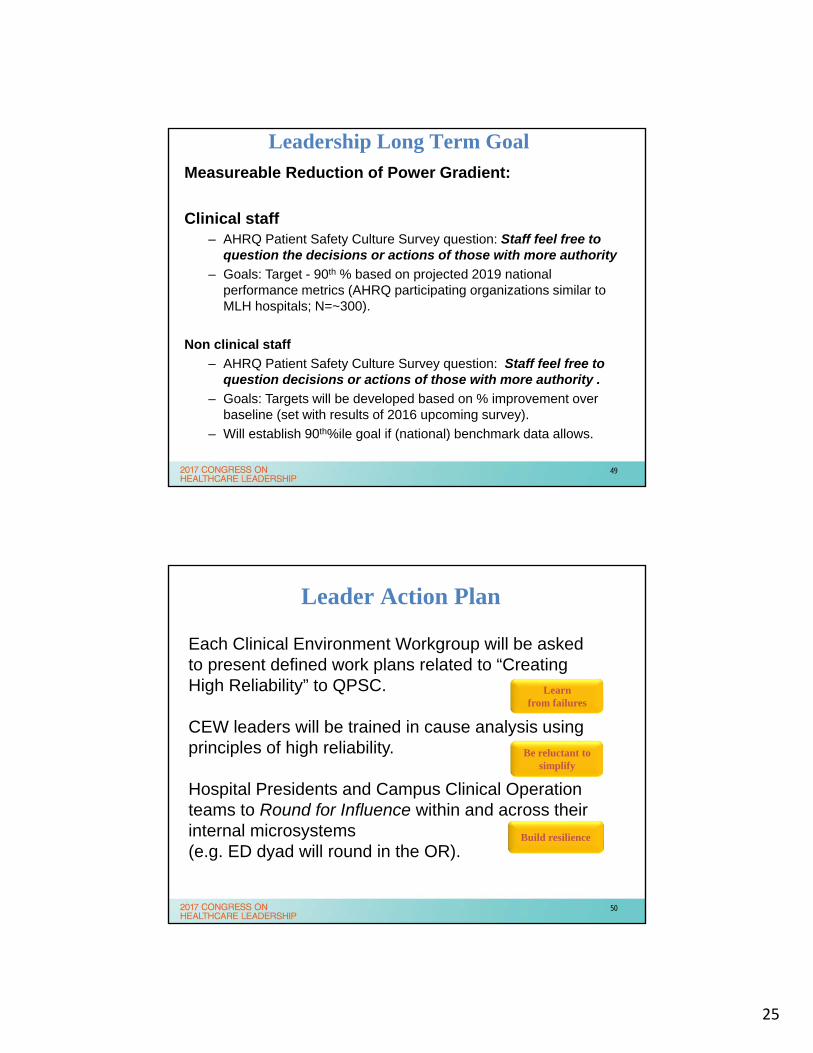
Measureable Reduction of Power Gradient:
Clinical staff– AHRQ Patient Safety Culture Survey question: Staff feel free to
question the decisions or actions of those with more authority
– Goals: Target - 90th % based on projected 2019 national performance metrics (AHRQ participating organizations similar to MLH hospitals; N=~300).
Non clinical staff
– AHRQ Patient Safety Culture Survey question: Staff feel free to question decisions or actions of those with more authority .
– Goals: Targets will be developed based on % improvement over baseline (set with results of 2016 upcoming survey).
– Will establish 90th%ile goal if (national) benchmark data allows.
Leadership Long Term Goal
49
Each Clinical Environment Workgroup will be asked to present defined work plans related to “Creating High Reliability” to QPSC.
CEW leaders will be trained in cause analysis using principles of high reliability.
Hospital Presidents and Campus Clinical Operation teams to Round for Influence within and across their internal microsystems (e.g. ED dyad will round in the OR).
Leader Action Plan
Learn from failures
Build resilience
Be reluctant to simplify
50
26
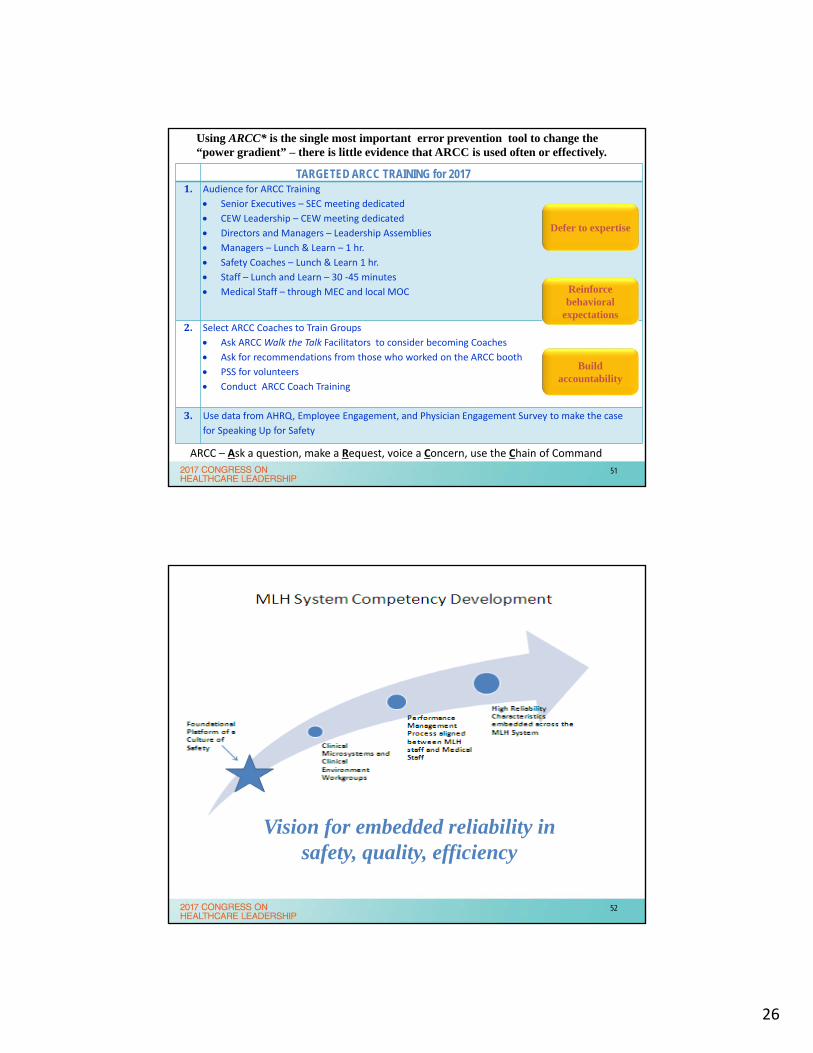
1. Audience for ARCC Training
Senior Executives – SEC meeting dedicated
CEW Leadership – CEW meeting dedicated
Directors and Managers – Leadership Assemblies
Managers – Lunch & Learn – 1 hr.
Safety Coaches – Lunch & Learn 1 hr.
Staff – Lunch and Learn – 30 ‐45 minutes
Medical Staff – through MEC and local MOC
2. Select ARCC Coaches to Train Groups
Ask ARCC Walk the Talk Facilitators to consider becoming Coaches
Ask for recommendations from those who worked on the ARCC booth
PSS for volunteers
Conduct ARCC Coach Training
3. Use data from AHRQ, Employee Engagement, and Physician Engagement Survey to make the case
for Speaking Up for Safety
TARGETED ARCC TRAINING for 2017
Using ARCC* is the single most important error prevention tool to change the “power gradient” – there is little evidence that ARCC is used often or effectively.
Reinforce behavioral
expectations
Defer to expertise
Build accountability
ARCC – Ask a question, make a Request, voice a Concern, use the Chain of Command
51
Vision for embedded reliability in safety, quality, efficiency
52
27
“The world is not a dangerous place because of those who do harm, but because of those who
look on and do nothing.”
» Albert Einstein
Thank you. [email protected]
53
54
28
HIGH RELIABILITY
Evidence-BasedProcess Bundles
+performed as intendedconsistently over time
= Clinical Excellence
Patient Centered +performed as intendedconsistently over time
= “Satisfaction”
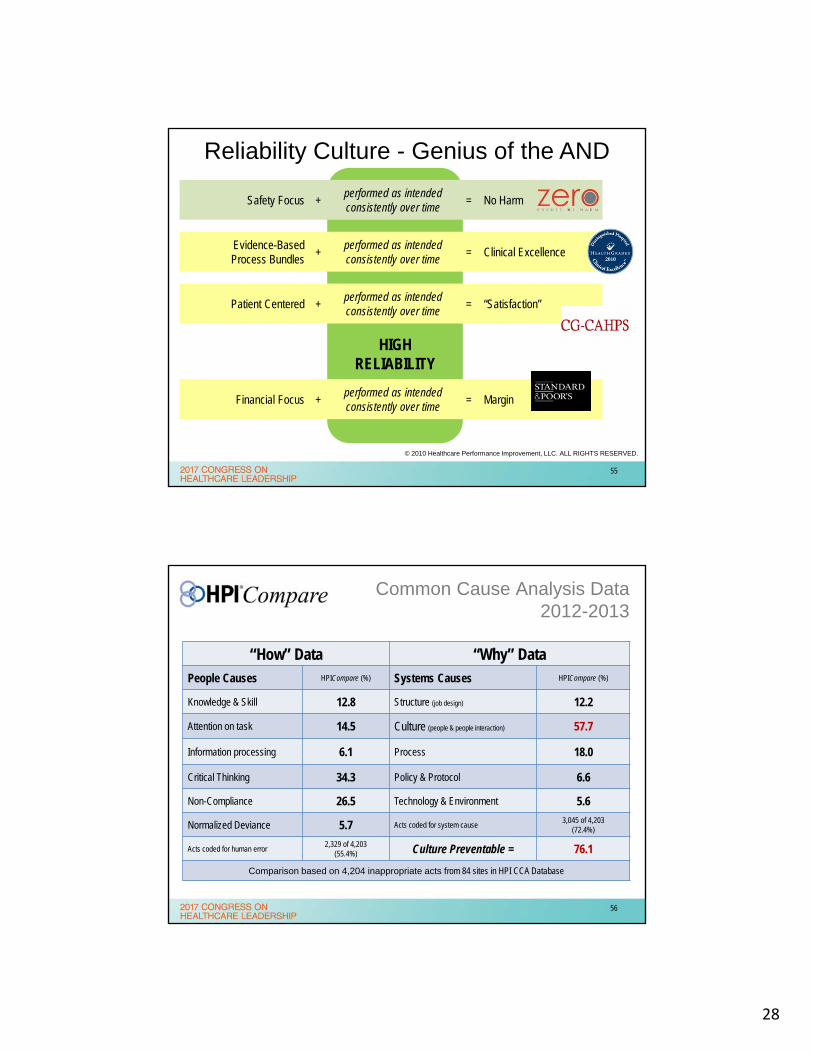
Reliability Culture - Genius of the AND
Safety Focus +performed as intendedconsistently over time
= No Harm
Financial Focus +performed as intendedconsistently over time
= Margin
© 2010 Healthcare Performance Improvement, LLC. ALL RIGHTS RESERVED.
55
“How” Data “Why” DataPeople Causes HPICompare (%) Systems Causes HPICompare (%)
Knowledge & Skill 12.8 Structure (job design) 12.2
Attention on task 14.5 Culture (people & people interaction) 57.7
Information processing 6.1 Process 18.0
Critical Thinking 34.3 Policy & Protocol 6.6
Non-Compliance 26.5 Technology & Environment 5.6
Normalized Deviance 5.7 Acts coded for system cause3,045 of 4,203
(72.4%)
Acts coded for human error2,329 of 4,203
(55.4%) Culture Preventable = 76.1
Comparison based on 4,204 inappropriate acts from 84 sites in HPI CCA Database
Common Cause Analysis Data2012-2013
56
29
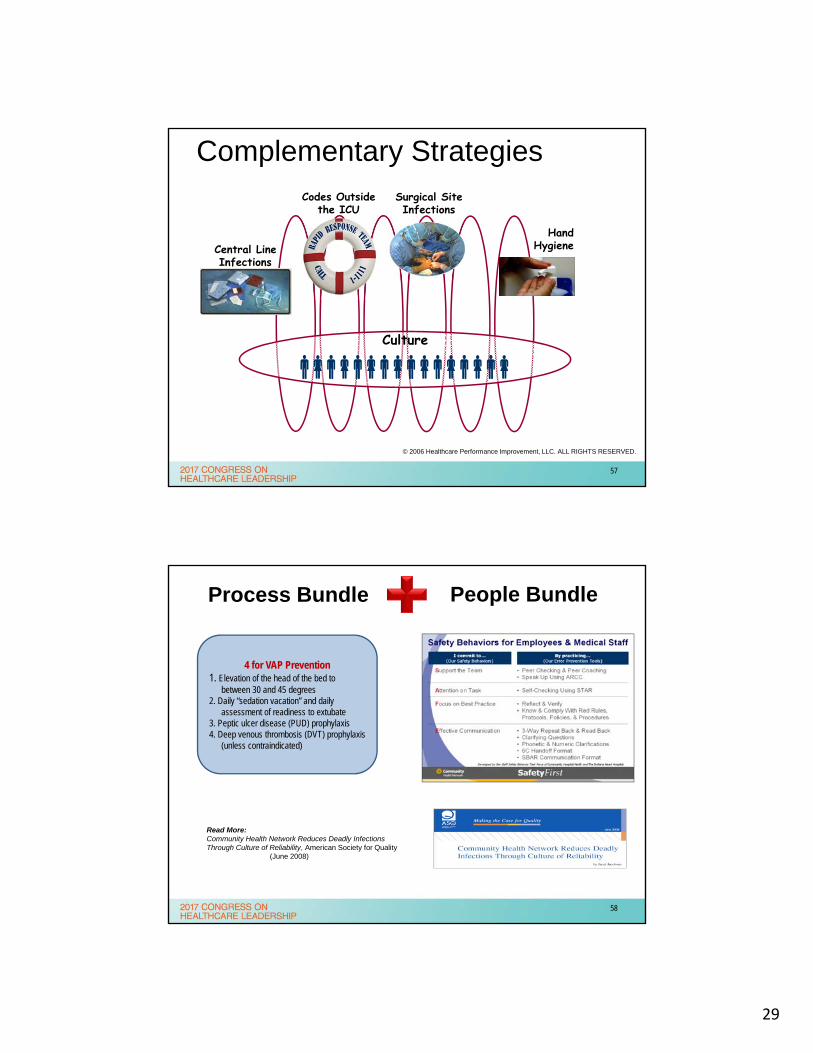
Complementary Strategies
© 2006 Healthcare Performance Improvement, LLC. ALL RIGHTS RESERVED.
Central LineInfections
HandHygiene
Surgical SiteInfections
Codes Outsidethe ICU
Culture
57
Process Bundle People Bundle
4 for VAP Prevention1. Elevation of the head of the bed to
between 30 and 45 degrees2. Daily “sedation vacation” and daily
assessment of readiness to extubate3. Peptic ulcer disease (PUD) prophylaxis4. Deep venous thrombosis (DVT) prophylaxis
(unless contraindicated)
Read More: Community Health Network Reduces Deadly Infections Through Culture of Reliability, American Society for Quality
(June 2008)
58
30
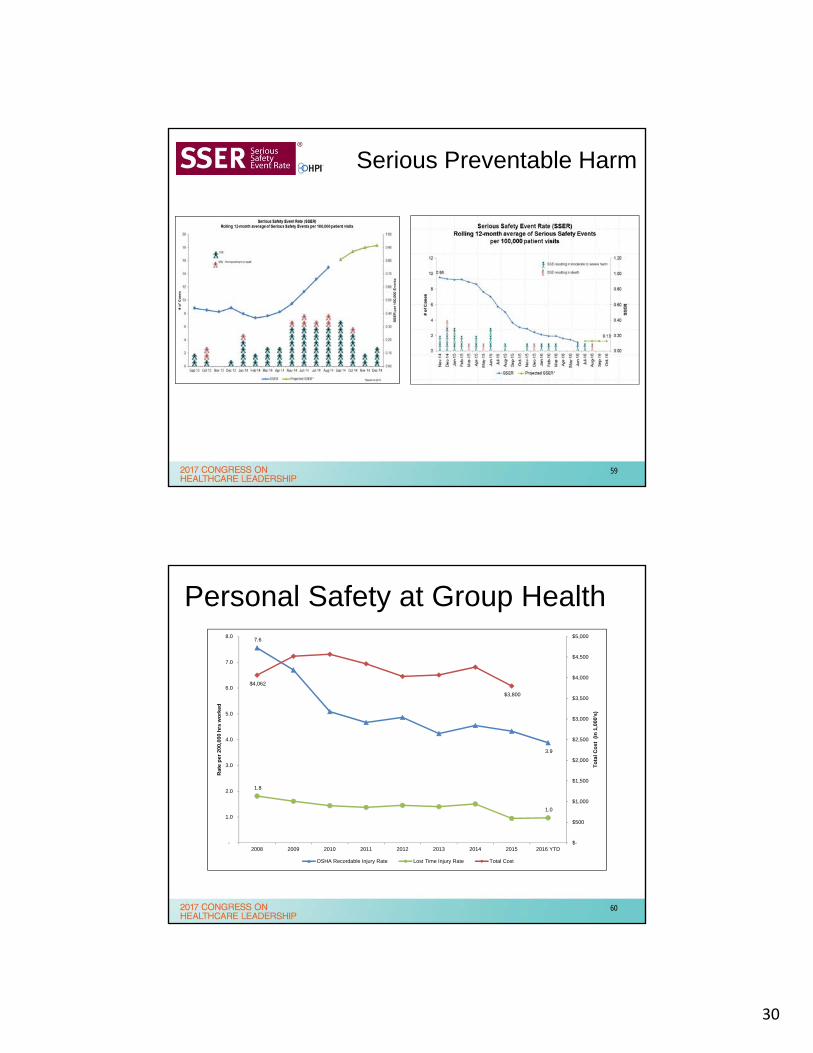
Serious Preventable Harm
59
Personal Safety at Group Health7.6
3.9
1.8
1.0
$4,062
$3,800
$-
$500
$1,000
$1,500
$2,000
$2,500
$3,000
$3,500
$4,000
$4,500
$5,000
-
1.0
2.0
3.0
4.0
5.0
6.0
7.0
8.0
2008 2009 2010 2011 2012 2013 2014 2015 2016 YTD
To
tal
Co
st (
in 1
,000
's)
Rat
e p
er 2
00,0
00 h
rs w
ork
ed
OSHA Recordable Injury Rate Lost Time Injury Rate Total Cost
60
31
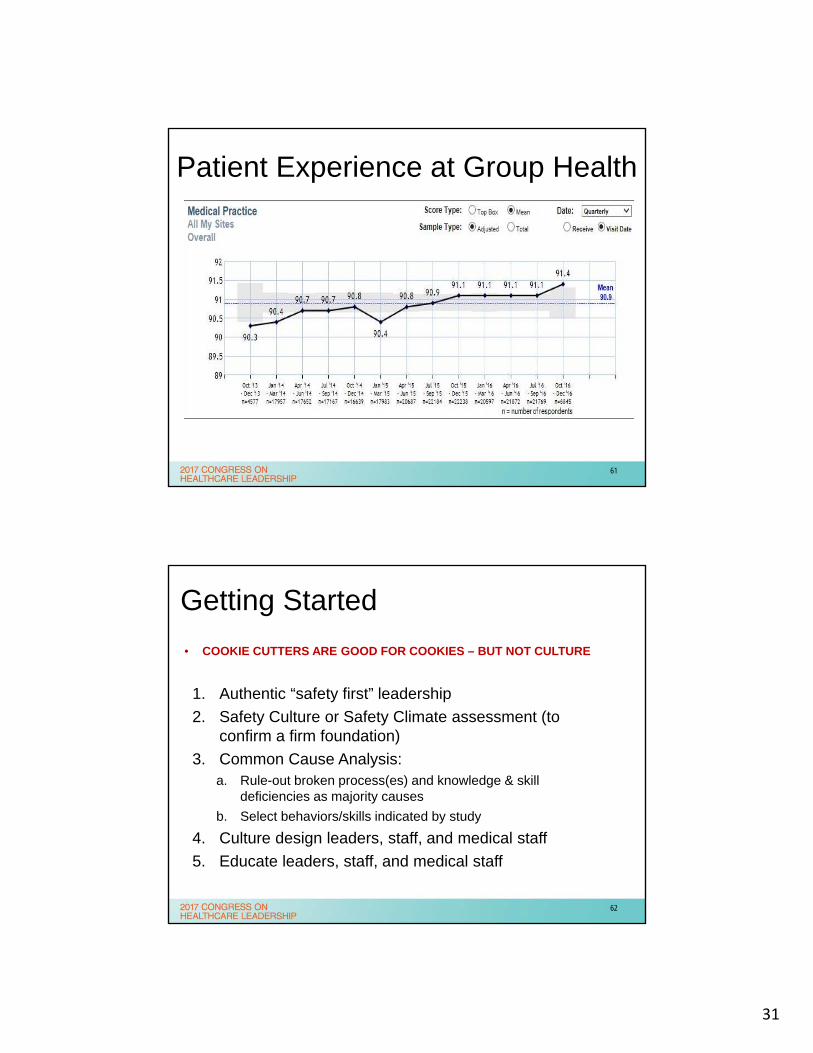
Patient Experience at Group Health
61
Getting Started
• COOKIE CUTTERS ARE GOOD FOR COOKIES – BUT NOT CULTURE
1. Authentic “safety first” leadership
2. Safety Culture or Safety Climate assessment (to confirm a firm foundation)
3. Common Cause Analysis:a. Rule-out broken process(es) and knowledge & skill
deficiencies as majority causes
b. Select behaviors/skills indicated by study
4. Culture design leaders, staff, and medical staff
5. Educate leaders, staff, and medical staff
62
32
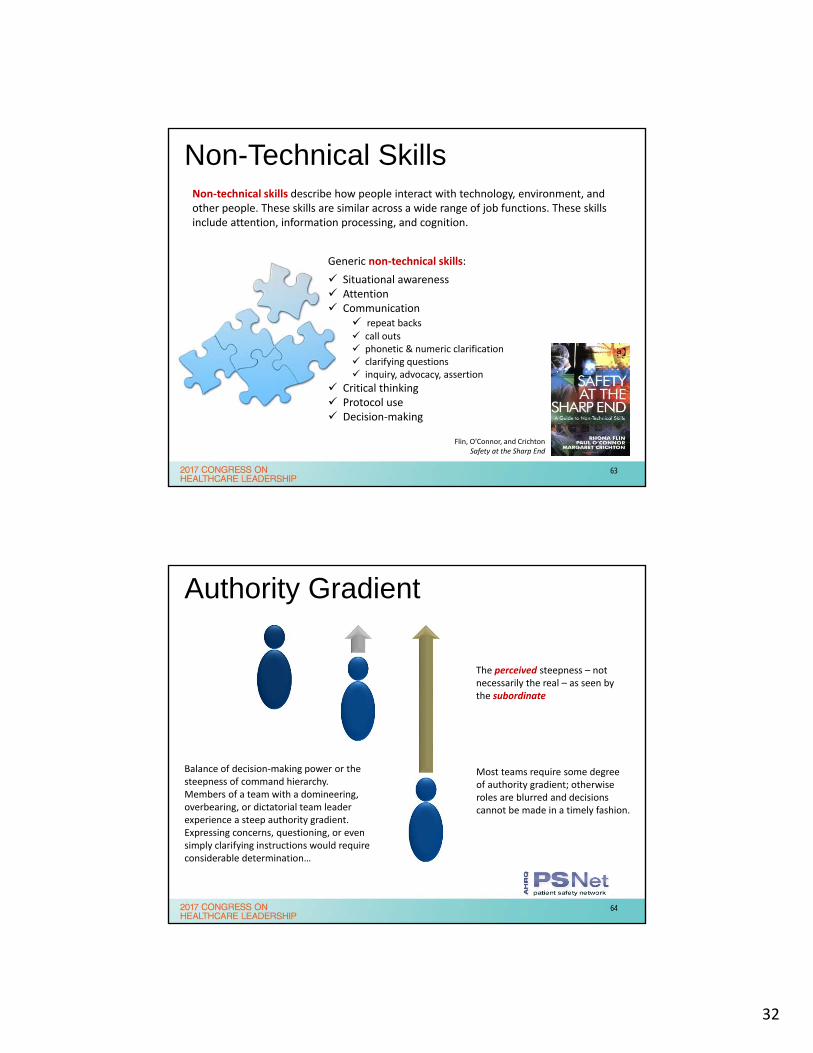
Non-Technical SkillsNon‐technical skills describe how people interact with technology, environment, and other people. These skills are similar across a wide range of job functions. These skills include attention, information processing, and cognition.
Flin, O’Connor, and CrichtonSafety at the Sharp End
Generic non‐technical skills:
Situational awareness Attention Communication
repeat backs call outs phonetic & numeric clarification clarifying questions inquiry, advocacy, assertion
Critical thinking Protocol use Decision‐making
63
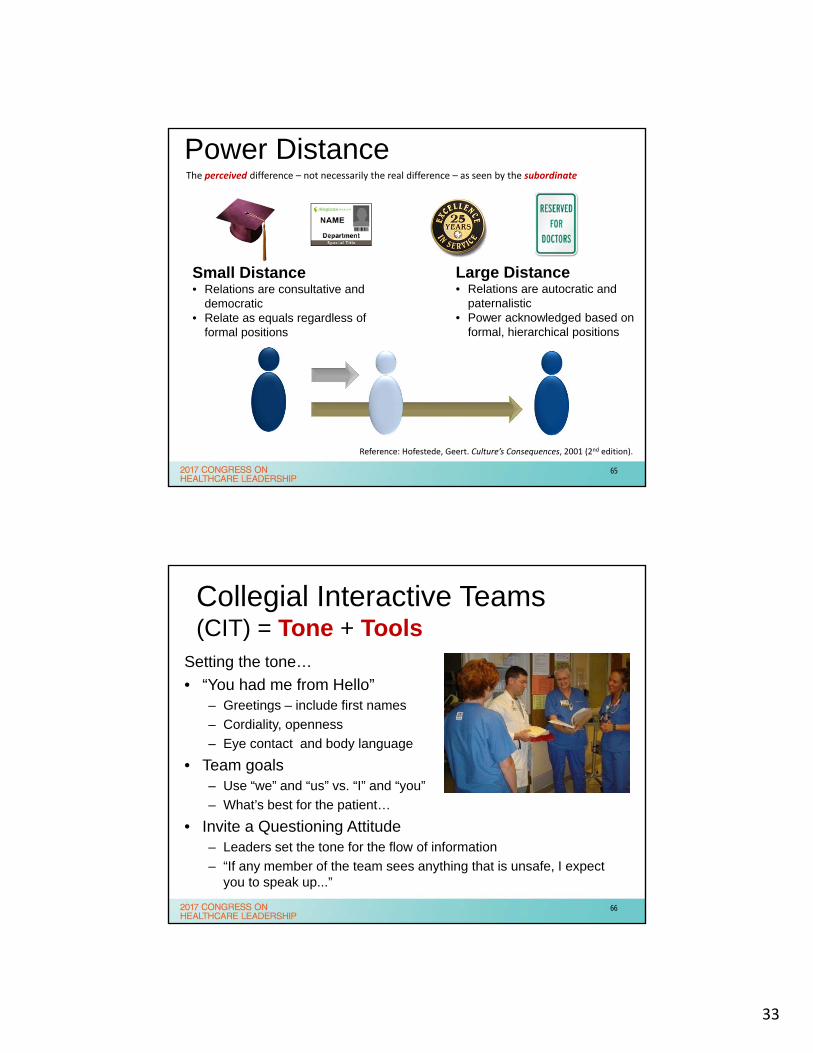
Authority Gradient
Most teams require some degree of authority gradient; otherwise roles are blurred and decisions cannot be made in a timely fashion.
Balance of decision‐making power or the steepness of command hierarchy. Members of a team with a domineering, overbearing, or dictatorial team leader experience a steep authority gradient. Expressing concerns, questioning, or even simply clarifying instructions would require considerable determination…
The perceived steepness – not necessarily the real – as seen by the subordinate
64
33
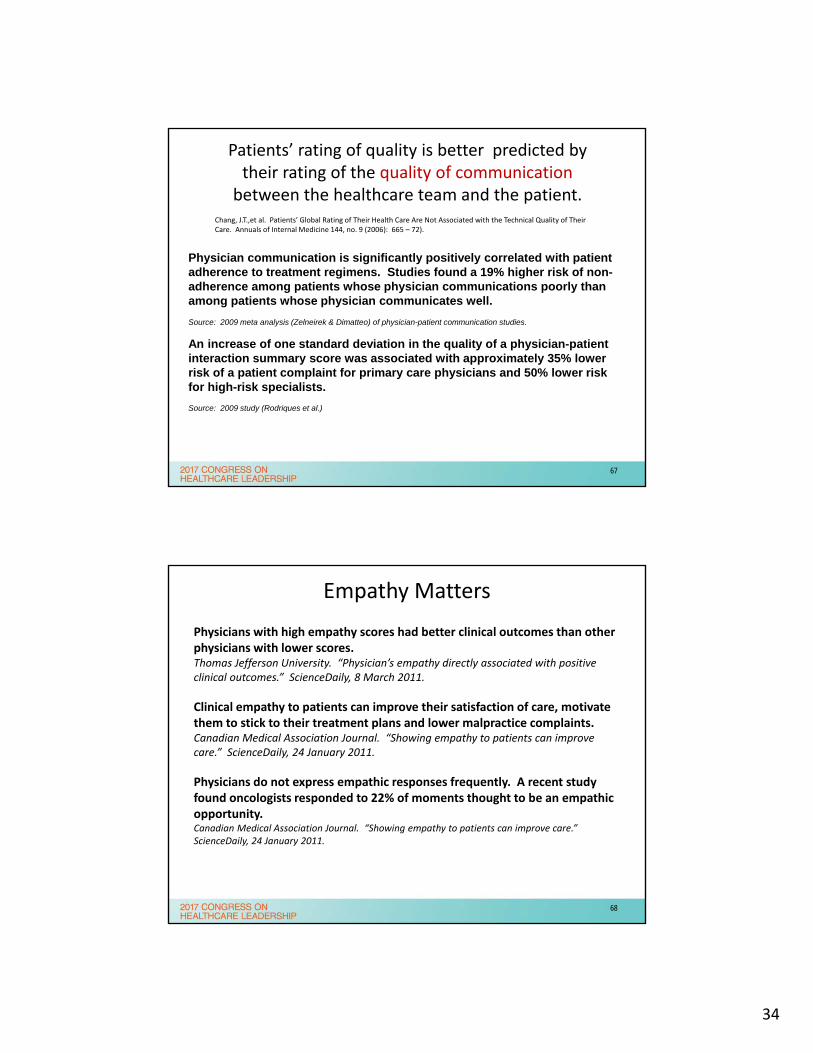
Power Distance
Large Distance• Relations are autocratic and
paternalistic• Power acknowledged based on
formal, hierarchical positions
The perceived difference – not necessarily the real difference – as seen by the subordinate
Small Distance• Relations are consultative and
democratic• Relate as equals regardless of
formal positions
Reference: Hofestede, Geert. Culture’s Consequences, 2001 (2nd edition).
65
Collegial Interactive Teams (CIT) = Tone + Tools
Setting the tone…
• “You had me from Hello”– Greetings – include first names
– Cordiality, openness
– Eye contact and body language
• Team goals– Use “we” and “us” vs. “I” and “you”
– What’s best for the patient…
• Invite a Questioning Attitude– Leaders set the tone for the flow of information
– “If any member of the team sees anything that is unsafe, I expect you to speak up...”
66
34
Patients’ rating of quality is better predicted by their rating of the quality of communicationbetween the healthcare team and the patient.
Chang, J.T.,et al. Patients’ Global Rating of Their Health Care Are Not Associated with the Technical Quality of Their Care. Annuals of Internal Medicine 144, no. 9 (2006): 665 – 72).
Physician communication is significantly positively correlated with patient adherence to treatment regimens. Studies found a 19% higher risk of non-adherence among patients whose physician communications poorly than among patients whose physician communicates well.
Source: 2009 meta analysis (Zelneirek & Dimatteo) of physician-patient communication studies.
An increase of one standard deviation in the quality of a physician-patient interaction summary score was associated with approximately 35% lower risk of a patient complaint for primary care physicians and 50% lower risk for high-risk specialists.
Source: 2009 study (Rodriques et al.)
67
Physicians with high empathy scores had better clinical outcomes than other physicians with lower scores.Thomas Jefferson University. “Physician’s empathy directly associated with positive clinical outcomes.” ScienceDaily, 8 March 2011.
Clinical empathy to patients can improve their satisfaction of care, motivate them to stick to their treatment plans and lower malpractice complaints.Canadian Medical Association Journal. “Showing empathy to patients can improve care.” ScienceDaily, 24 January 2011.
Physicians do not express empathic responses frequently. A recent study found oncologists responded to 22% of moments thought to be an empathic opportunity.Canadian Medical Association Journal. “Showing empathy to patients can improve care.” ScienceDaily, 24 January 2011.
Empathy Matters
68
35
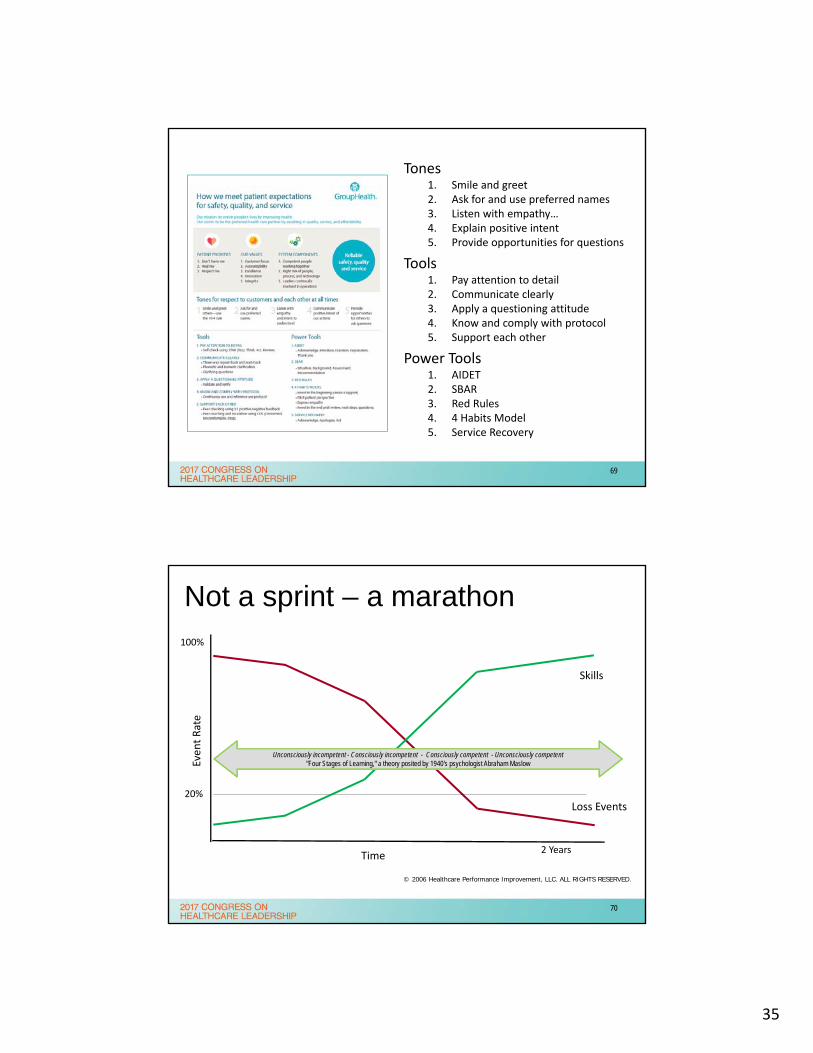
Tones1. Smile and greet2. Ask for and use preferred names3. Listen with empathy…4. Explain positive intent5. Provide opportunities for questions
Tools1. Pay attention to detail2. Communicate clearly3. Apply a questioning attitude4. Know and comply with protocol5. Support each other
Power Tools1. AIDET2. SBAR3. Red Rules4. 4 Habits Model5. Service Recovery
69
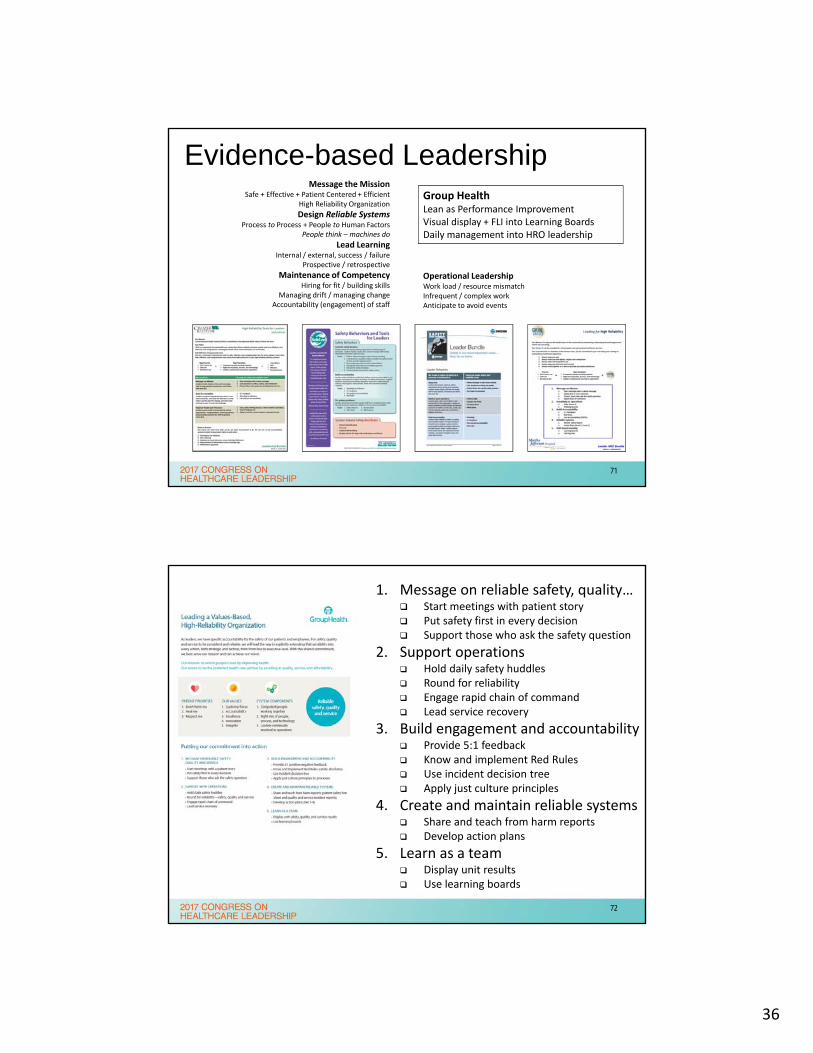
Not a sprint – a marathon
20%
Event Rate
Time
100%
2 Years
© 2006 Healthcare Performance Improvement, LLC. ALL RIGHTS RESERVED.
Unconsciously incompetent - Consciously incompetent - Consciously competent - Unconsciously competent"Four Stages of Learning," a theory posited by 1940's psychologist Abraham Maslow
Loss Events
Skills
70
36
Evidence-based LeadershipMessage the Mission
Safe + Effective + Patient Centered + EfficientHigh Reliability Organization
Design Reliable SystemsProcess to Process + People to Human Factors
People think – machines do
Lead LearningInternal / external, success / failure
Prospective / retrospective
Maintenance of CompetencyHiring for fit / building skills
Managing drift / managing changeAccountability (engagement) of staff
Operational LeadershipWork load / resource mismatchInfrequent / complex workAnticipate to avoid events
Group HealthLean as Performance ImprovementVisual display + FLI into Learning BoardsDaily management into HRO leadership
71
1. Message on reliable safety, quality… Start meetings with patient story Put safety first in every decision Support those who ask the safety question
2. Support operations Hold daily safety huddles Round for reliability Engage rapid chain of command Lead service recovery
3. Build engagement and accountability Provide 5:1 feedback Know and implement Red Rules Use incident decision tree Apply just culture principles
4. Create and maintain reliable systems Share and teach from harm reports Develop action plans
5. Learn as a team Display unit results Use learning boards
72
37
Bibliography/References
1. Press Ganey Associates, Inc. “Elevating Safety: Taking a Page from the High Reliability Playbook: Reducing the Unacceptably High Rate of Health Care Errors…” Press Ganey. N.p., 2016. Web 18 Nov 2016.
2. Lyren A, Brilli R, Bird M, Lashutka N, Muething S. Ohio Children's Hospitals' Solutions for Patient Safety: A Framework for Pediatric Patient Safety Improvement. J Healthc Qual. 2016 Jul Aug;38(4):213-22. PubMed PMID: 26042749.
3. Brilli RJ, McClead RE Jr, Crandall WV, Stoverock L, Berry JC, Wheeler TA, Davis JT. A comprehensive patient safety program can significantly reduce preventable harm, associated costs, and hospital mortality. J Pediatr. 2013 Dec;163(6):1638-45. PubMed PMID: 23910978.
4. Shabot MM, Monroe D, Inurria J, Garbade D, France AC. Memorial Hermann: high reliability from board to bedside. Jt Comm J Qual Patient Saf. 2013 Jun;39(6):253-7. PubMed PMID: 23789162.
5. Hilliard MA, Sczudlo R, Scafidi L, Cady R, Villard A, Shah R. Our journey to zero: reducing serious safety events by over 70% through high-reliability techniques and workforce engagement. J Healthc Risk Manag. 2012;32(2):4-18. PubMed PMID: 22996427.
73
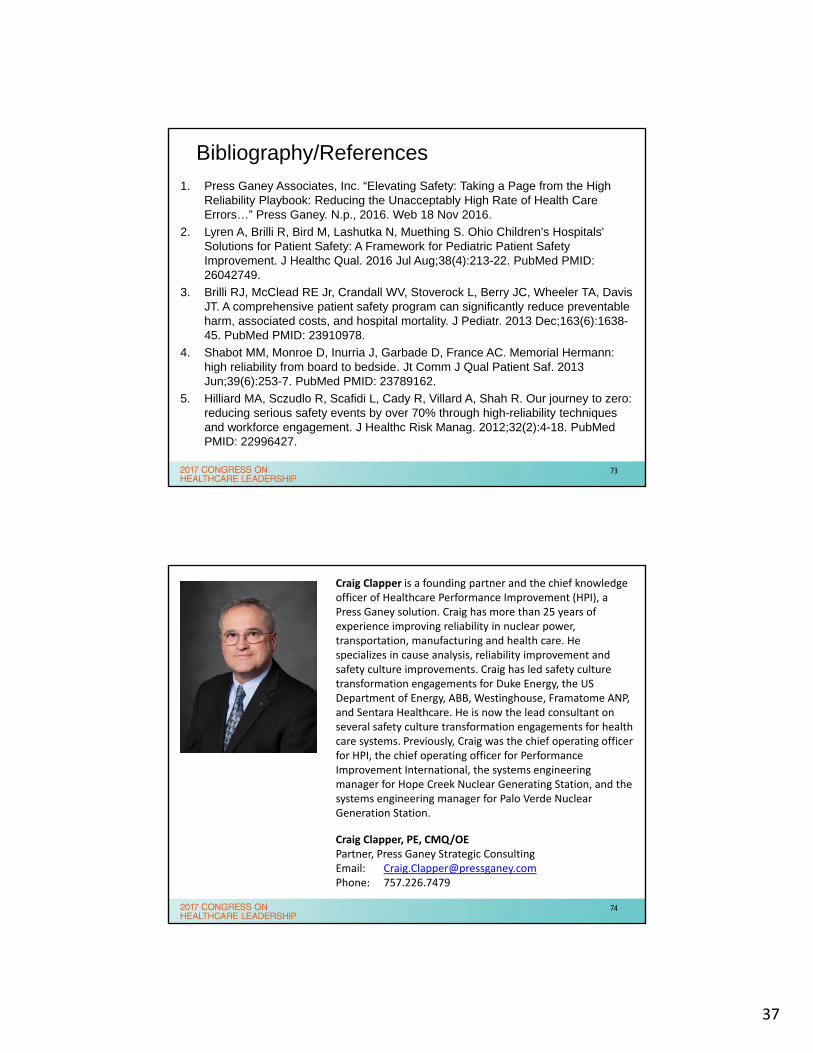
Craig Clapper is a founding partner and the chief knowledge officer of Healthcare Performance Improvement (HPI), a Press Ganey solution. Craig has more than 25 years of experience improving reliability in nuclear power, transportation, manufacturing and health care. He specializes in cause analysis, reliability improvement and safety culture improvements. Craig has led safety culture transformation engagements for Duke Energy, the US Department of Energy, ABB, Westinghouse, Framatome ANP, and Sentara Healthcare. He is now the lead consultant on several safety culture transformation engagements for health care systems. Previously, Craig was the chief operating officer for HPI, the chief operating officer for Performance Improvement International, the systems engineering manager for Hope Creek Nuclear Generating Station, and the systems engineering manager for Palo Verde Nuclear Generation Station.
Craig Clapper, PE, CMQ/OEPartner, Press Ganey Strategic ConsultingEmail: [email protected]: 757.226.7479
74
38
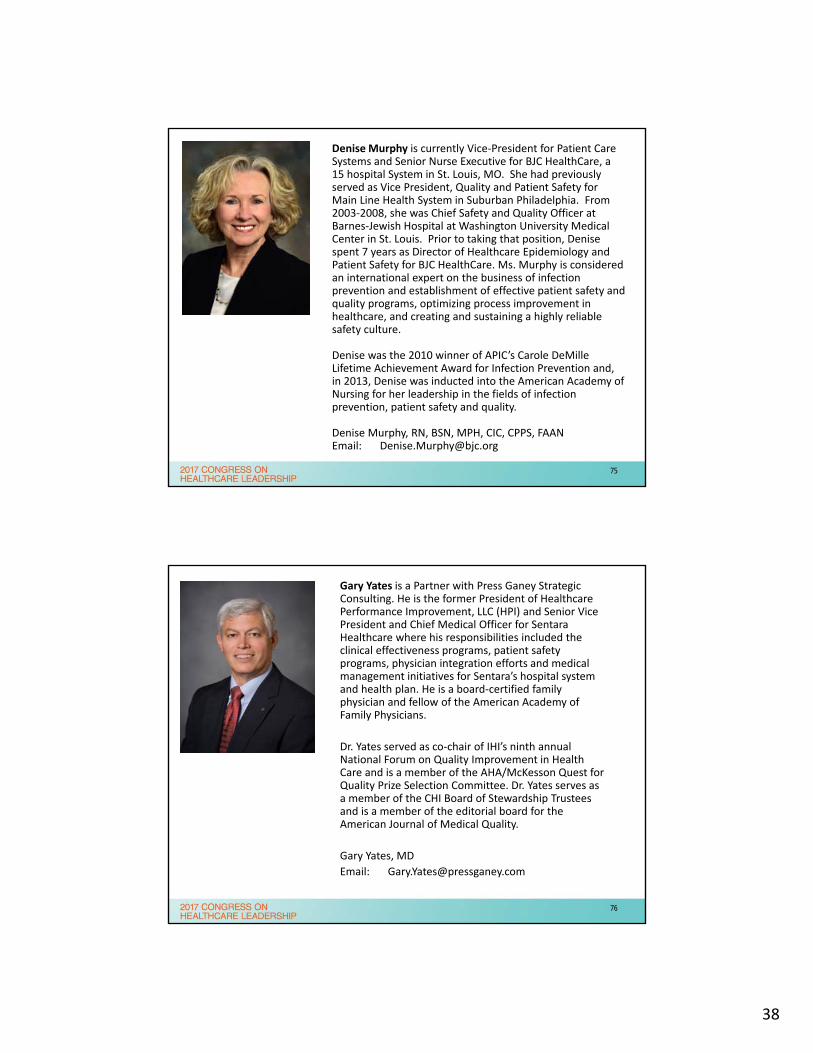
Denise Murphy is currently Vice‐President for Patient Care Systems and Senior Nurse Executive for BJC HealthCare, a 15 hospital System in St. Louis, MO. She had previously served as Vice President, Quality and Patient Safety for Main Line Health System in Suburban Philadelphia. From 2003‐2008, she was Chief Safety and Quality Officer at Barnes‐Jewish Hospital at Washington University Medical Center in St. Louis. Prior to taking that position, Denise spent 7 years as Director of Healthcare Epidemiology and Patient Safety for BJC HealthCare. Ms. Murphy is considered an international expert on the business of infection prevention and establishment of effective patient safety and quality programs, optimizing process improvement in healthcare, and creating and sustaining a highly reliable safety culture.
Denise was the 2010 winner of APIC’s Carole DeMille Lifetime Achievement Award for Infection Prevention and, in 2013, Denise was inducted into the American Academy of Nursing for her leadership in the fields of infection prevention, patient safety and quality.
Denise Murphy, RN, BSN, MPH, CIC, CPPS, FAANEmail: [email protected]
75
Gary Yates is a Partner with Press Ganey Strategic Consulting. He is the former President of Healthcare Performance Improvement, LLC (HPI) and Senior Vice President and Chief Medical Officer for Sentara Healthcare where his responsibilities included the clinical effectiveness programs, patient safety programs, physician integration efforts and medical management initiatives for Sentara’s hospital system and health plan. He is a board‐certified family physician and fellow of the American Academy of Family Physicians.
Dr. Yates served as co‐chair of IHI’s ninth annual National Forum on Quality Improvement in Health Care and is a member of the AHA/McKesson Quest for Quality Prize Selection Committee. Dr. Yates serves as a member of the CHI Board of Stewardship Trustees and is a member of the editorial board for the American Journal of Medical Quality.
Gary Yates, MD
Email: [email protected]
76