Embed Size (px)
Citation preview
1
National Therapeutic Indicators
2018
2
Foreword Medicines management continues to develop as an expert field in NHS Scotland, consistently
delivering improvements to patient safety, effective care and efficient spending. National
Therapeutic Indicators (NTIs) support this work, using prescription data to provide a measure of
prescribing activity in specified therapeutic areas and a comparison across Boards and GP practices.
Since 2012-13, the NTIs have been presented as a snapshot, however this year three year trends are
also provided.
To ensure as much consistency as possible, the relevant NTIs are included in the national prescribing
strategy documents for Polypharmacy, Diabetes, Respiratory Medicine and Chronic Pain. They
further complement the national Realistic Medicine agenda and the Scottish Patient Safety
Programme for Primary Care. They will soon be further supported by measures focussing on
secondary care prescribing.
National prescribing indicators have been developed for 6 years, initially as part of the Scottish
Government Quality and Efficiency Programme and more recently as part of the Effective Prescribing
and Therapeutics Branch. These indicators cover core therapeutic areas including proton pump
inhibitors, inhalers, hypnotics/anxiolytics, analgesics, antibiotics, antidiabetic drugs, non-steroidal
anti-inflammatory drugs and antimicrobial wound management products.
The availability of patient-level data from the national Prescription Information System provides an
opportunity to develop measures that directly address patient safety issues, particularly the
prescribing of drug combinations that are known to increase the risk of adverse drug reactions. In
the previous two iterations of this document, these indicators were designated Additional
Prescribing Measures but, as they are now widely accepted and used by NHS colleagues across
Scotland, they are fully incorporated within this suite of NTIs.
The NTIs for 2018-19 were developed at the end of 2017 by a reference group of representatives
from NHS Boards across Scotland and experts in specific topics (controlled drugs, patient safety).
They reviewed prescribing trends including the changes in prescribing patterns that could be
attributed to existing NTIs and APMs. They also considered the national prescribing strategy
documents mentioned previously and prescribing indicators used in other UK countries.
The NTI for total antibiotic prescribing is used by Scottish Governments Directorates as a HEAT
target in collaboration with the Scottish Antimicrobial Prescribing Group (SAPG).
Sean MacBride-Stewart Prescribing Adviser Effective Prescribing & Therapeutics Branch Directorate for Health Finance August 2018
Simon Hurding Clinical Lead
3
Background This report details the NTIs developed for the 2018-19 financial year providing data on the variation
in prescribing of GP practices within each NHS Board and across Scotland for the period October to
December 2017.
NHS staff with access to the national Prescription Information Systems (PIS or PRISMs) can run
reports from the NHS NSS Business Intelligence Reporting platform to get GP practice data. Currently
these include analysis of GP practices within selected NHS Boards and Health and Social Care
Partnerships. When details of GP Practice Clusters are available in PIS/PRISMS then the reports will
be updated.
Notable developments include:
Three year trends are now provided for each measure, showing the direction of travel for Boards
and NHS Scotland. Data tables have been reinstated following feedback.
An indicator looking at prescribing of valproate to women of child-bearing age, in support of
information provided by MHRA.
An indicator identifying patients prescribed 3 or more classes of antidiabetic agents, in support
of the national prescribing strategy document for diabetes.
Indicators identifying patients prescribed more than 14 inhaled corticosteroid inhalers per
annum or prescribed mucolytics long-term to support the national prescribing strategy
document for respiratory medicine.
Further newly developed indicators focus on specific patient safety issues:
o Risk of bone marrow suppression
o Risk of falls, fractures and delirium
A description is now provided for each indicator, commenting on the scale of variation and some
key interpretation of the charts.
4
Acknowledgements The National Therapeutic Indicators (NTIs) are developed and maintained by the Effective
Prescribing and Therapeutics Branch, Scottish Government. Mr Sean MacBride-Stewart provides
pharmaceutical leadership, Dr Simon B Hurding provides clinical leadership and Mr Paul Paxton
provides data analysis expertise.
Consensus is provided by working with the NTI Reference Group. In addition we wish to
acknowledge the support of the Claire Thomas (NHS Wales), the ISD Prescribing Team, the Scottish
Practice Pharmacy & Prescribing Advisors Association, the National Acute Pharmacists Group, the
Scottish Antimicrobial Prescribing Group, the National Chronic Pain Prescribing Strategy Group, the
Improvement Hub, the Scottish Patient Safety Programme, the All Wales Medicines Strategy Group
and the Controlled Drugs Accountable Officer Network Scotland.
Thanks to all involved for their time, patience and expertise.
The NTI reference group for 2018-2019 was made up of:
Sean MacBride-Stewart, NHS GGC (Chair) Elaine Anderson, NHS Lothian Karen Box, NHS Grampian Graeme Bryson, NHS GGC Keith Burns, NHS Western Isles Ainsley Campbell, NHS GGC Alban Clareburt, NHS GGC Jason Cormack, Therapeutics Branch Ruth Edwards, NHS GGC Kenneth Halliday, NHS Tayside Heather Harrison, NHS GGC Findlay Hickey, NHS Highland Simon Hurding, Therapeutics Branch Gordon Loughran, NHS Dumfries and Galloway Keith Maclure, NHS Borders Alpana Mair, Therapeutics Branch David Maxwell, HIS Stephen McBurney, NHS Lothian Jennifer McCaig, NHS Ayrshire and Arran Tony McDavitt, NHS Shetland Kenneth McGowan, NHS GGC Shenagh McKiernan, NHS Ayrshire and Arran Stuart McTaggart, ISD Barry Melia, ISD Anne Milne, NHS Lanarkshire Jill Nowell, NHS Tayside Paul Paxton, ISD Margaret Ryan, NHS GGC Sheila Tennant, NHS GGC Audrey Thompson, NHS GGC Anne Thomson, NHS GGC Iain Watt, NHS Forth Valley
Pills Image courtesy of jk1991 at FreeDigitalPhotos.net
5
Table of Contents Foreword ................................................................................................................................................. 2
Background ............................................................................................................................................. 3
Acknowledgements ................................................................................................................................. 4
Gabapentinoids: pregabalin and gabapentin DDDs per 1,000 List Size per day ..................................... 7
Gabapentinoids: pregabalin and gabapentin DDDs per 1,000 Weighted List Size per day .................... 9
Opioid analgesics: strong opioids (including tramadol preparations) DDDs per 1,000 LS per day ...... 11
Opioid analgesics: strong opioids (excluding tramadol preparations) DDDs per 1,000 LS per day ...... 13
Opioid analgesics: tramadol DDDs per 1,000 List Size per day ............................................................. 15
Opioid analgesics: strong opioids (including tramadol preparations) DDDs per 1,000 Weighted List
Size per day ........................................................................................................................................... 17
Opioid analgesics: strong opioids (excluding tramadol preparations) DDDs per 1,000 Weighted List
Size per day ........................................................................................................................................... 19
Opioid analgesics: tramadol DDDs per 1,000 Weighted List Size per day ............................................ 21
Lidocaine: lidocaine plasters GIC per 1,000 List Size per day ............................................................... 23
Lidocaine: lidocaine plasters GIC per 1,000 Weighted List Size per day ............................................... 25
Hypnotics and Anxiolytics: hypnotics and anxiolytics DDDs per 1,000 List Size per day ...................... 27
Hypnotics and Anxiolytics: hypnotics and anxiolytics DDDs per 1,000 Weighted List Size per day ..... 29
Antidiabetic Drugs: number of people prescribed metformin as percentage of all people prescribed
an anti-diabetic drug ............................................................................................................................. 31
SMBG: average cost per day of blood glucose test strips per person prescribed antidiabetic drugs
and/or insulins ...................................................................................................................................... 33
Proton Pump Inhibitors: proton pump inhibitors DDDs per 1,000 List Size per day ............................ 35
Proton Pump Inhibitors: proton pump inhibitors DDDs per 1,000 Weighted List Size per day ........... 37
Antibiotics: total antibiotic script items per 1,000 LS per day .............................................................. 39
Antibiotics: 4C antibiotics script items per 1,000 LS per 100 days ....................................................... 41
Valproate: females aged 13 to up to 45 prescribed valproate as a % of all females dispensed
valproate ............................................................................................................................................... 43
NSAIDs including Cox-2 inhibitors: NSAIDs (including COX-2 inhibitors) DDDs per 1,000 List Size per
day ......................................................................................................................................................... 45
NSAIDs including Cox-2 inhibitors: NSAID (including Cox-2 inhibitors) DDDs per 1,000 weighted list
size per day ........................................................................................................................................... 47
Acute Kidney Injury: number of people aged ≥65 years co-prescribed a NSAID and an ACE
inhibitor/angiotensin receptor blocker and a diuretic as a percentage of all people aged ≥65 years
prescribed an ACE inhibitor/angiotensin receptor blocker and a diuretic ........................................... 49
Antibiotics: Number of people prescribed >4 prescriptions for antibiotics per annum as a percentage
of all people prescribed antibiotics ....................................................................................................... 51
6
Antibiotics: number of 3-day course of acute UTI antibiotics prescribed to women as a percentage of
all acute UTI antibiotic courses prescribed to women ......................................................................... 53
Polypharmacy in Diabetes: number of people prescribed three or more categories of diabetes
medication as a percentage of all people prescribed an antidiabetic drug ......................................... 55
Antipsychotics: number of people aged ≥75 years prescribed an antipsychotic as a percentage of all
people aged ≥75 years .......................................................................................................................... 57
Bone Marrow Suppression: number of people prescribed methotrexate without co-prescription of
folic acid as a percentage of all people prescribed methotrexate† ...................................................... 59
Falls, Fractures and Delirium: number of people aged ≥75 years dispensed > 10 items of strong or
very strong anticholinergics (mARS 2&3) per annum as a percentage of all people aged ≥75 years .. 61
Falls, Fractures and Delirium: number of people prescribed a long term oral steroid without co-
prescription of a bone protecting agent as a percentage of all people prescribed a long term oral
steroid ................................................................................................................................................... 63
Sulfonylureas: number of people aged ≥ 75 years prescribed sulfonylureas as a percentage of all
people aged ≥ 75 years prescribed an anti-diabetic drugs ................................................................... 65
High Dose Corticosteroid Inhalers: high dose corticosteroid inhalers as a percentage of all
corticosteroid inhalers (items) using 2016 SIGN/BTS classification ..................................................... 67
Gabapentinoid dependency: number of people prescribed a gabapentinoid at an average daily dose
equivalent to >4800mg gabapentin over the previous 6 months as a percentage of all people
prescribed a gabapentinoid .................................................................................................................. 69
Opioid dependency: number of people prescribed an opioid at an average daily dose of opioid
equivalent to ≥ 120mg per day of morphine over the previous 6 months as a percentage of all people
prescribed step 2 and strong opioids† .................................................................................................. 71
Opioid Dependency: Number of people prescribed an opioid at an average daily dose of opioid
equivalent to ≥50mg per day of morphine over the previous 6 months as a percentage of all people
prescribed step 2 and strong opioids.................................................................................................... 73
Opioid dependency: number of people prescribed strong opioids (including tramadol preparations)
long term (>2 years) as a percentage of all people prescribed strong opioids .................................... 75
Poor Asthma Control: number of people prescribed more than 12 short-acting beta-agonist (SABA)
inhalers per annum as a percentage of all people prescribed SABAs .................................................. 77
Inhaled Corticosteroids: number of people prescribed >14 inhaled corticosteroid inhalers per annum
as a % of all people prescribed inhaled corticosteroid inhalers ........................................................... 79
Mucolytics: number of people prescribed mucolytics long term (> 2 years) per 1,000 LS† ................. 81
Mucolytics: Number of people prescribed mucolytics long term (>2 years) per 1,000 weighted LS ... 83
Antimicrobial Wound Products: Antimicrobial wound products as percentage of total wound
products (items) .................................................................................................................................... 85
7
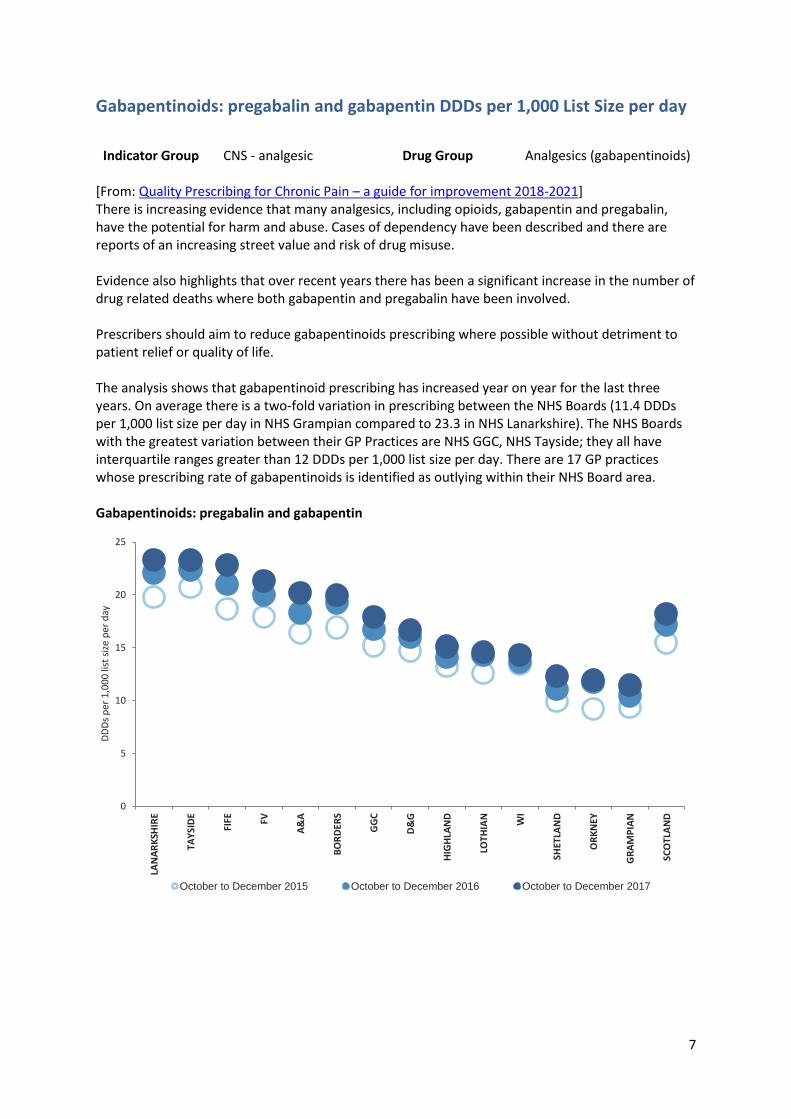
Gabapentinoids: pregabalin and gabapentin DDDs per 1,000 List Size per day
Indicator Group CNS - analgesic Drug Group Analgesics (gabapentinoids)
[From: Quality Prescribing for Chronic Pain – a guide for improvement 2018-2021] There is increasing evidence that many analgesics, including opioids, gabapentin and pregabalin, have the potential for harm and abuse. Cases of dependency have been described and there are reports of an increasing street value and risk of drug misuse. Evidence also highlights that over recent years there has been a significant increase in the number of drug related deaths where both gabapentin and pregabalin have been involved. Prescribers should aim to reduce gabapentinoids prescribing where possible without detriment to patient relief or quality of life. The analysis shows that gabapentinoid prescribing has increased year on year for the last three years. On average there is a two-fold variation in prescribing between the NHS Boards (11.4 DDDs per 1,000 list size per day in NHS Grampian compared to 23.3 in NHS Lanarkshire). The NHS Boards with the greatest variation between their GP Practices are NHS GGC, NHS Tayside; they all have interquartile ranges greater than 12 DDDs per 1,000 list size per day. There are 17 GP practices whose prescribing rate of gabapentinoids is identified as outlying within their NHS Board area. Gabapentinoids: pregabalin and gabapentin
0
5
10
15
20
25
LAN
AR
KSH
IRE
TAY
SID
E
FIFE FV
A&
A
BO
RD
ERS
GG
C
D&
G
HIG
HLA
ND
LOTH
IAN
WI
SHET
LAN
D
OR
KN
EY
GR
AM
PIA
N
SCO
TLA
ND
DD
Ds
per
1,0
00
list
siz
e p
er d
ay
October to December 2015 October to December 2016 October to December 2017
8
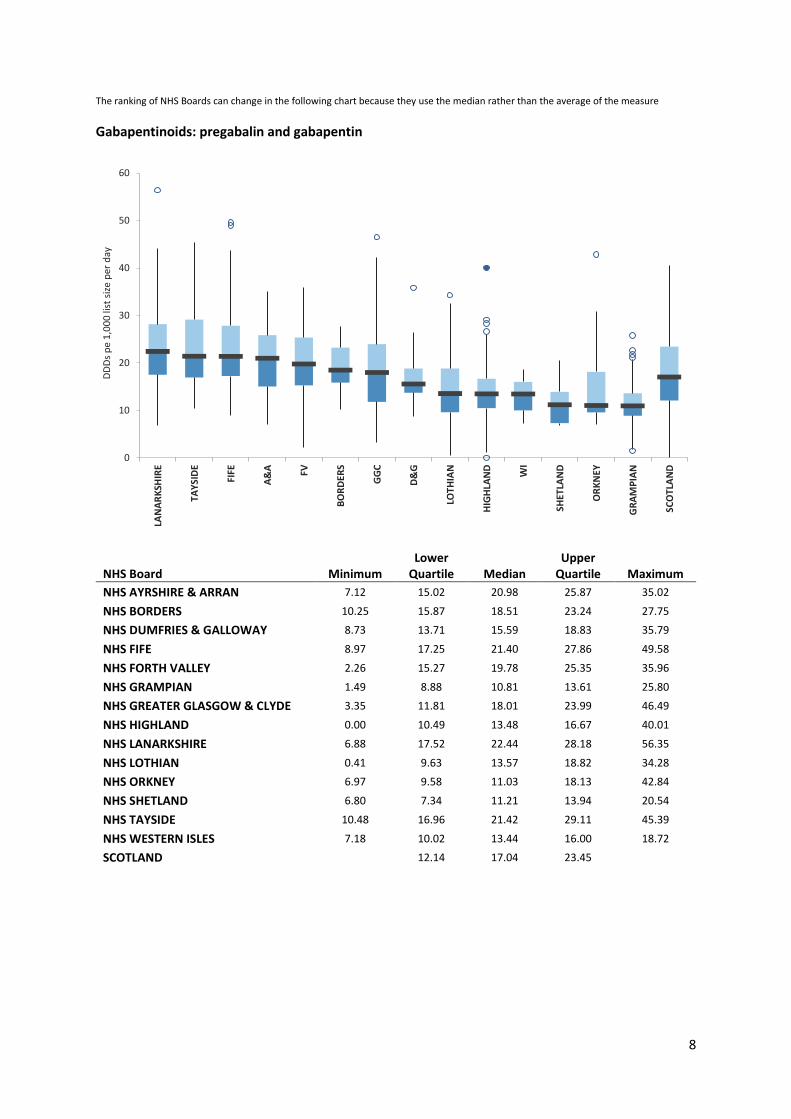
The ranking of NHS Boards can change in the following chart because they use the median rather than the average of the measure
Gabapentinoids: pregabalin and gabapentin
NHS Board Minimum Lower
Quartile Median Upper
Quartile Maximum
NHS AYRSHIRE & ARRAN 7.12 15.02 20.98 25.87 35.02
NHS BORDERS 10.25 15.87 18.51 23.24 27.75
NHS DUMFRIES & GALLOWAY 8.73 13.71 15.59 18.83 35.79
NHS FIFE 8.97 17.25 21.40 27.86 49.58
NHS FORTH VALLEY 2.26 15.27 19.78 25.35 35.96
NHS GRAMPIAN 1.49 8.88 10.81 13.61 25.80
NHS GREATER GLASGOW & CLYDE 3.35 11.81 18.01 23.99 46.49
NHS HIGHLAND 0.00 10.49 13.48 16.67 40.01
NHS LANARKSHIRE 6.88 17.52 22.44 28.18 56.35
NHS LOTHIAN 0.41 9.63 13.57 18.82 34.28
NHS ORKNEY 6.97 9.58 11.03 18.13 42.84
NHS SHETLAND 6.80 7.34 11.21 13.94 20.54
NHS TAYSIDE 10.48 16.96 21.42 29.11 45.39
NHS WESTERN ISLES 7.18 10.02 13.44 16.00 18.72
SCOTLAND 12.14 17.04 23.45
0
10
20
30
40
50
60
LAN
AR
KSH
IRE
TAY
SID
E
FIFE
A&
A FV
BO
RD
ERS
GG
C
D&
G
LOTH
IAN
HIG
HLA
ND
WI
SHET
LAN
D
OR
KN
EY
GR
AM
PIA
N
SCO
TLA
ND
DD
Ds
pe
1,0
00
list
siz
e p
er d
ay
9
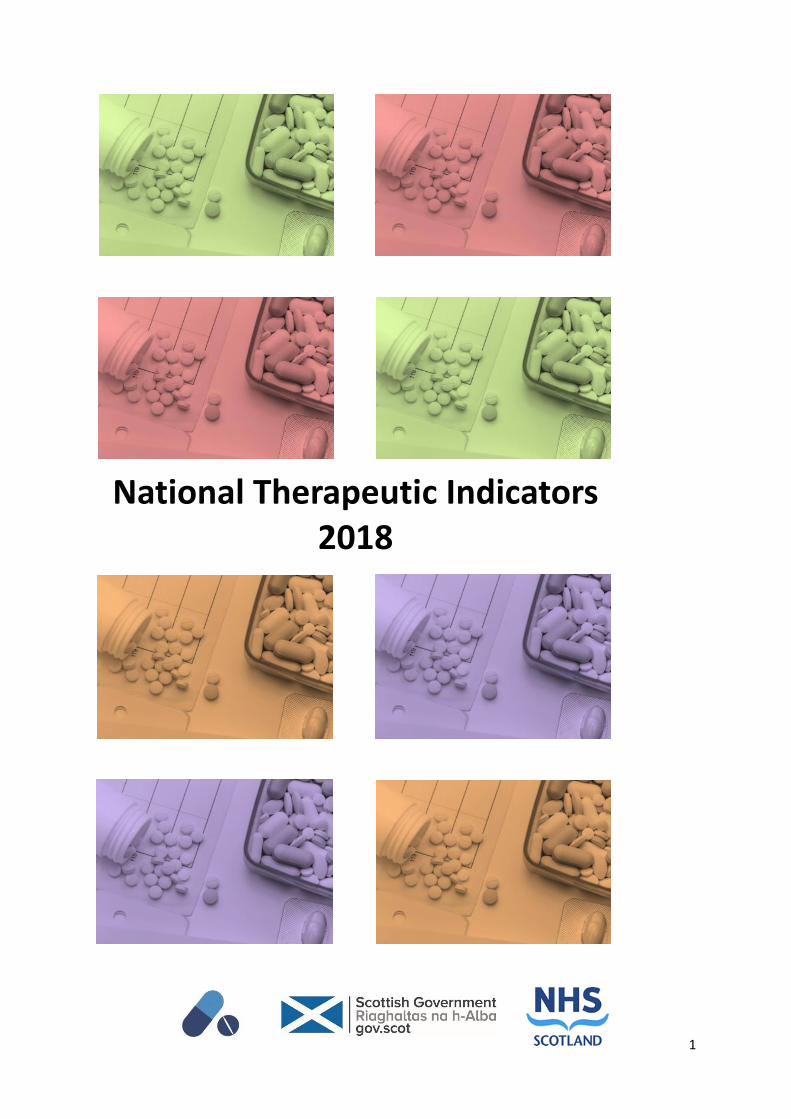
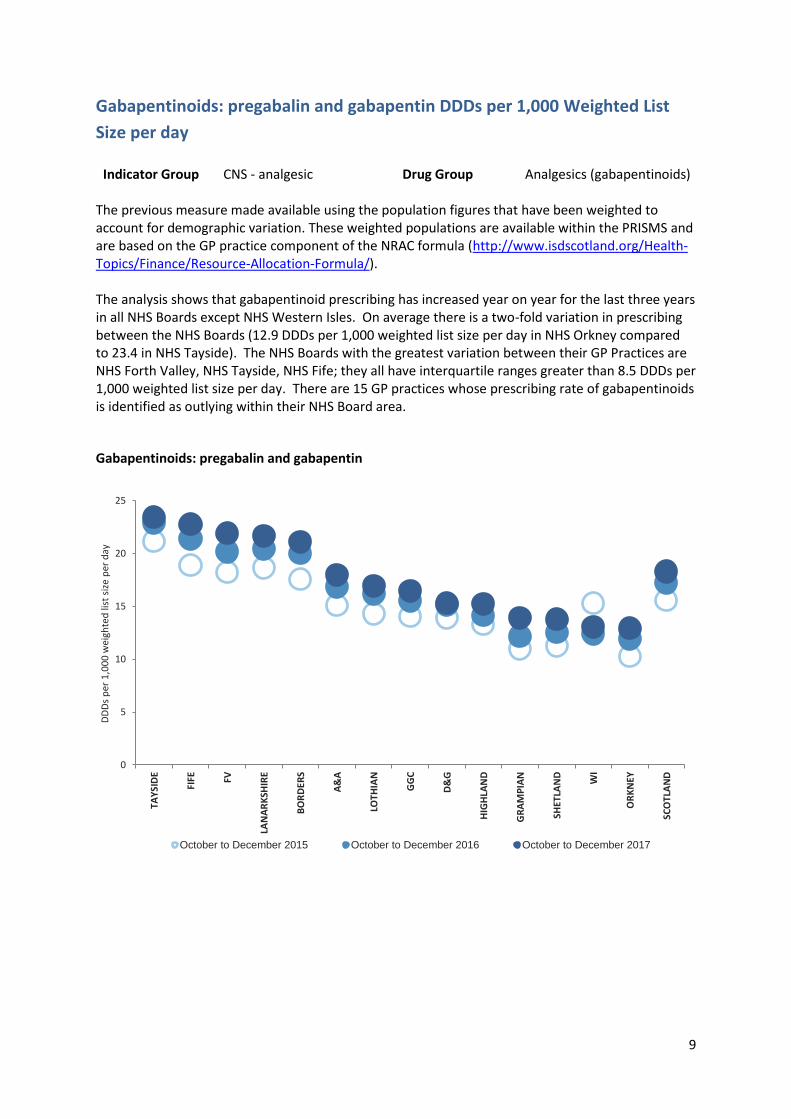
Gabapentinoids: pregabalin and gabapentin DDDs per 1,000 Weighted List
Size per day
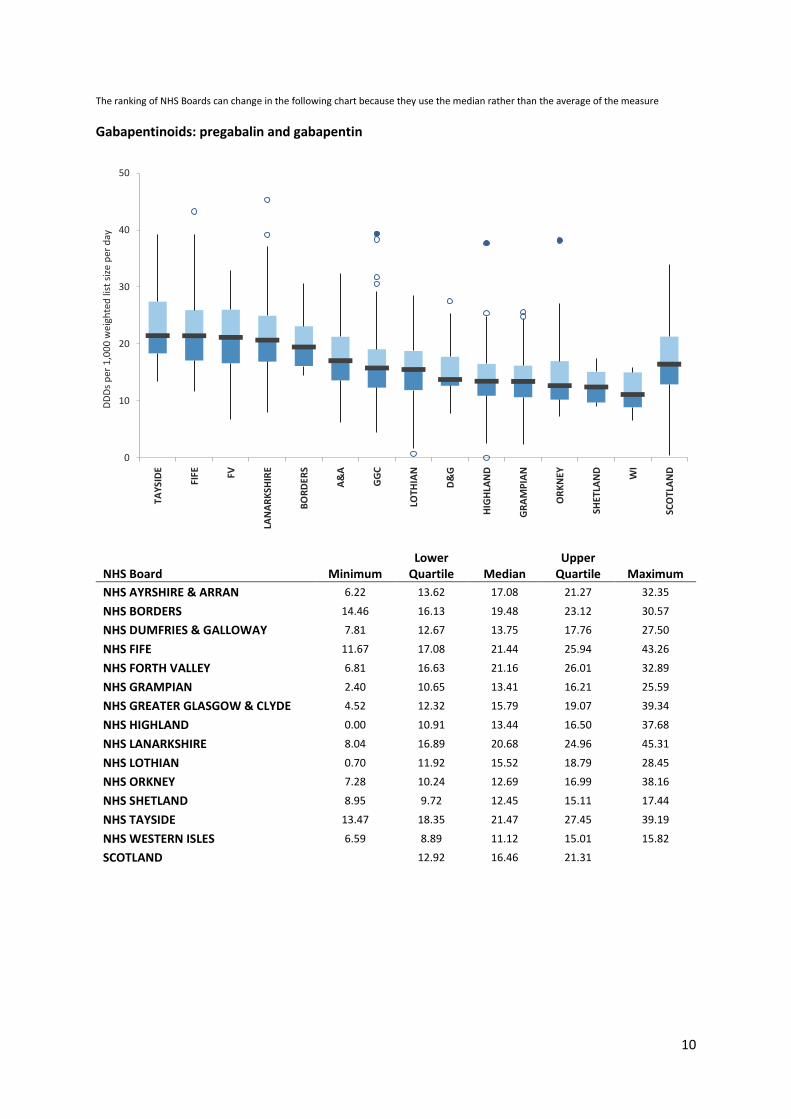
Indicator Group CNS - analgesic Drug Group Analgesics (gabapentinoids) The previous measure made available using the population figures that have been weighted to account for demographic variation. These weighted populations are available within the PRISMS and are based on the GP practice component of the NRAC formula (http://www.isdscotland.org/Health-Topics/Finance/Resource-Allocation-Formula/). The analysis shows that gabapentinoid prescribing has increased year on year for the last three years in all NHS Boards except NHS Western Isles. On average there is a two-fold variation in prescribing between the NHS Boards (12.9 DDDs per 1,000 weighted list size per day in NHS Orkney compared to 23.4 in NHS Tayside). The NHS Boards with the greatest variation between their GP Practices are NHS Forth Valley, NHS Tayside, NHS Fife; they all have interquartile ranges greater than 8.5 DDDs per 1,000 weighted list size per day. There are 15 GP practices whose prescribing rate of gabapentinoids is identified as outlying within their NHS Board area.
Gabapentinoids: pregabalin and gabapentin
0
5
10
15
20
25
TAY
SID
E
FIFE FV
LAN
AR
KSH
IRE
BO
RD
ERS
A&
A
LOTH
IAN
GG
C
D&
G
HIG
HLA
ND
GR
AM
PIA
N
SHET
LAN
D
WI
OR
KN
EY
SCO
TLA
ND
DD
Ds
per
1,0
00
wei
ghte
d li
st s
ize
per
day
October to December 2015 October to December 2016 October to December 2017
10
The ranking of NHS Boards can change in the following chart because they use the median rather than the average of the measure
Gabapentinoids: pregabalin and gabapentin
NHS Board Minimum Lower
Quartile Median Upper
Quartile Maximum
NHS AYRSHIRE & ARRAN 6.22 13.62 17.08 21.27 32.35
NHS BORDERS 14.46 16.13 19.48 23.12 30.57
NHS DUMFRIES & GALLOWAY 7.81 12.67 13.75 17.76 27.50
NHS FIFE 11.67 17.08 21.44 25.94 43.26
NHS FORTH VALLEY 6.81 16.63 21.16 26.01 32.89
NHS GRAMPIAN 2.40 10.65 13.41 16.21 25.59
NHS GREATER GLASGOW & CLYDE 4.52 12.32 15.79 19.07 39.34
NHS HIGHLAND 0.00 10.91 13.44 16.50 37.68
NHS LANARKSHIRE 8.04 16.89 20.68 24.96 45.31
NHS LOTHIAN 0.70 11.92 15.52 18.79 28.45
NHS ORKNEY 7.28 10.24 12.69 16.99 38.16
NHS SHETLAND 8.95 9.72 12.45 15.11 17.44
NHS TAYSIDE 13.47 18.35 21.47 27.45 39.19
NHS WESTERN ISLES 6.59 8.89 11.12 15.01 15.82
SCOTLAND 12.92 16.46 21.31
0
10
20
30
40
50
TA
YSI
DE
FIF
E
FV
LA
NA
RK
SHIR
E
BO
RD
ERS
A&
A
GG
C
LO
THIA
N
D&
G
HIG
HLA
ND
GR
AM
PIA
N
OR
KN
EY
SH
ETLA
ND
WI
SC
OTL
AN
D
DD
Ds
per
1,0
00
wei
ghte
d li
st s
ize
per
day
11
Opioid analgesics: strong opioids (including tramadol preparations) DDDs per
1,000 LS per day
Indicator Group CNS - analgesic Drug Group Analgesics (opioids)
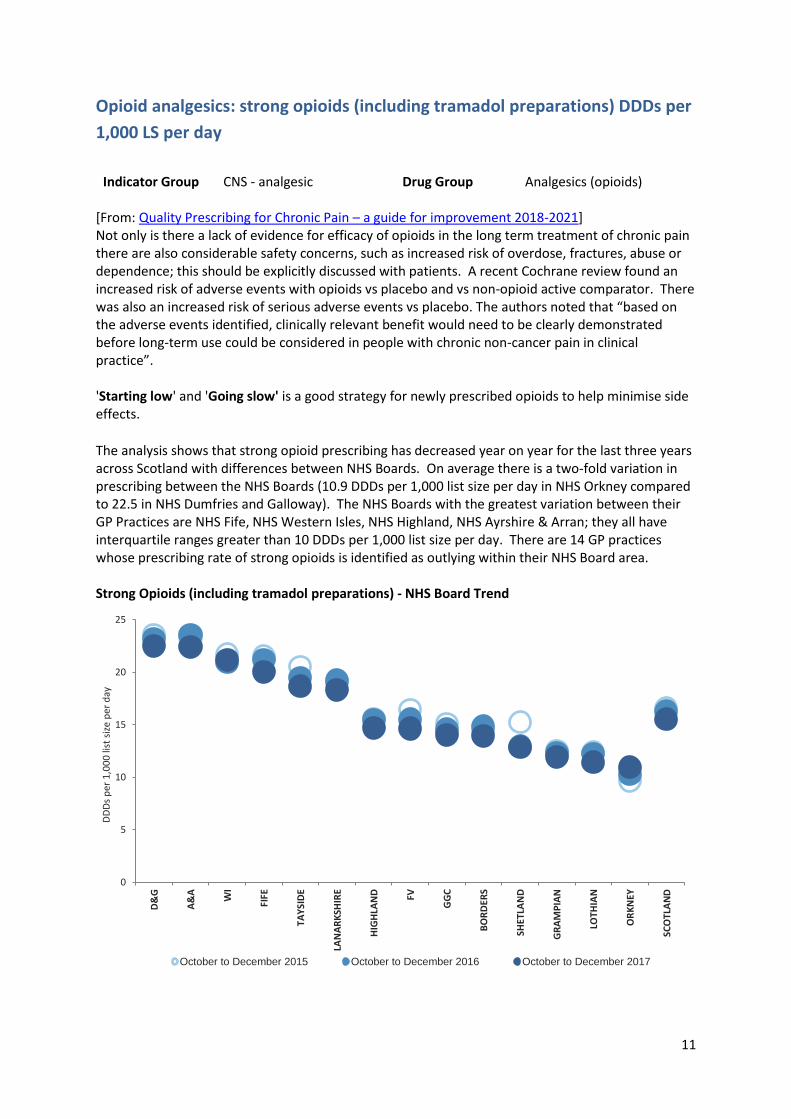
[From: Quality Prescribing for Chronic Pain – a guide for improvement 2018-2021] Not only is there a lack of evidence for efficacy of opioids in the long term treatment of chronic pain there are also considerable safety concerns, such as increased risk of overdose, fractures, abuse or dependence; this should be explicitly discussed with patients. A recent Cochrane review found an increased risk of adverse events with opioids vs placebo and vs non-opioid active comparator. There was also an increased risk of serious adverse events vs placebo. The authors noted that “based on the adverse events identified, clinically relevant benefit would need to be clearly demonstrated before long-term use could be considered in people with chronic non-cancer pain in clinical practice”. 'Starting low' and 'Going slow' is a good strategy for newly prescribed opioids to help minimise side effects.
The analysis shows that strong opioid prescribing has decreased year on year for the last three years across Scotland with differences between NHS Boards. On average there is a two-fold variation in prescribing between the NHS Boards (10.9 DDDs per 1,000 list size per day in NHS Orkney compared to 22.5 in NHS Dumfries and Galloway). The NHS Boards with the greatest variation between their GP Practices are NHS Fife, NHS Western Isles, NHS Highland, NHS Ayrshire & Arran; they all have interquartile ranges greater than 10 DDDs per 1,000 list size per day. There are 14 GP practices whose prescribing rate of strong opioids is identified as outlying within their NHS Board area. Strong Opioids (including tramadol preparations) - NHS Board Trend
0
5
10
15
20
25
D&
G
A&
A
WI
FIFE
TAY
SID
E
LAN
AR
KSH
IRE
HIG
HLA
ND FV
GG
C
BO
RD
ERS
SHET
LAN
D
GR
AM
PIA
N
LOTH
IAN
OR
KN
EY
SCO
TLA
ND
DD
Ds
per
1,0
00
list
siz
e p
er d
ay
October to December 2015 October to December 2016 October to December 2017
12
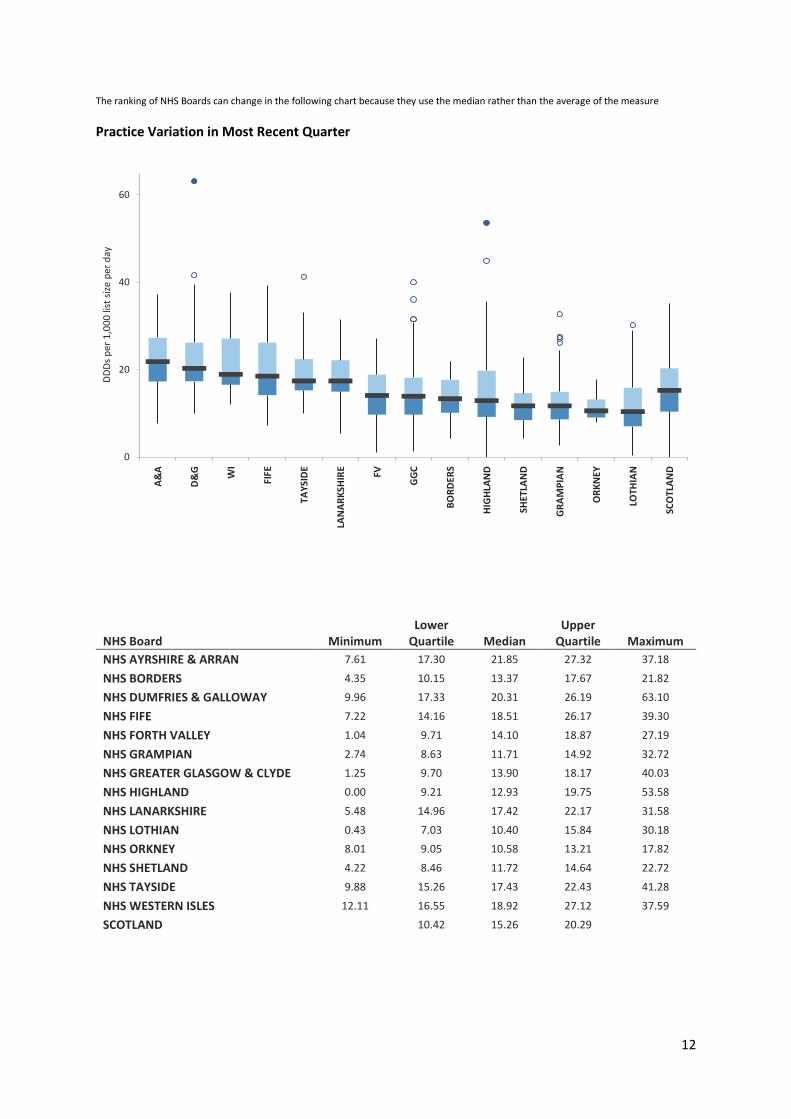
The ranking of NHS Boards can change in the following chart because they use the median rather than the average of the measure
Practice Variation in Most Recent Quarter
NHS Board Minimum Lower
Quartile Median Upper
Quartile Maximum
NHS AYRSHIRE & ARRAN 7.61 17.30 21.85 27.32 37.18
NHS BORDERS 4.35 10.15 13.37 17.67 21.82
NHS DUMFRIES & GALLOWAY 9.96 17.33 20.31 26.19 63.10
NHS FIFE 7.22 14.16 18.51 26.17 39.30
NHS FORTH VALLEY 1.04 9.71 14.10 18.87 27.19
NHS GRAMPIAN 2.74 8.63 11.71 14.92 32.72
NHS GREATER GLASGOW & CLYDE 1.25 9.70 13.90 18.17 40.03
NHS HIGHLAND 0.00 9.21 12.93 19.75 53.58
NHS LANARKSHIRE 5.48 14.96 17.42 22.17 31.58
NHS LOTHIAN 0.43 7.03 10.40 15.84 30.18
NHS ORKNEY 8.01 9.05 10.58 13.21 17.82
NHS SHETLAND 4.22 8.46 11.72 14.64 22.72
NHS TAYSIDE 9.88 15.26 17.43 22.43 41.28
NHS WESTERN ISLES 12.11 16.55 18.92 27.12 37.59
SCOTLAND 10.42 15.26 20.29
0
20
40
60
A&
A
D&
G
WI
FIF
E
TA
YSI
DE
LA
NA
RK
SHIR
E
FV
GG
C
BO
RD
ERS
HIG
HLA
ND
SH
ETLA
ND
GR
AM
PIA
N
OR
KN
EY
LO
THIA
N
SC
OTL
AN
D
DD
Ds
per
1,0
00
list
siz
e p
er d
ay
13
Opioid analgesics: strong opioids (excluding tramadol preparations) DDDs per
1,000 LS per day
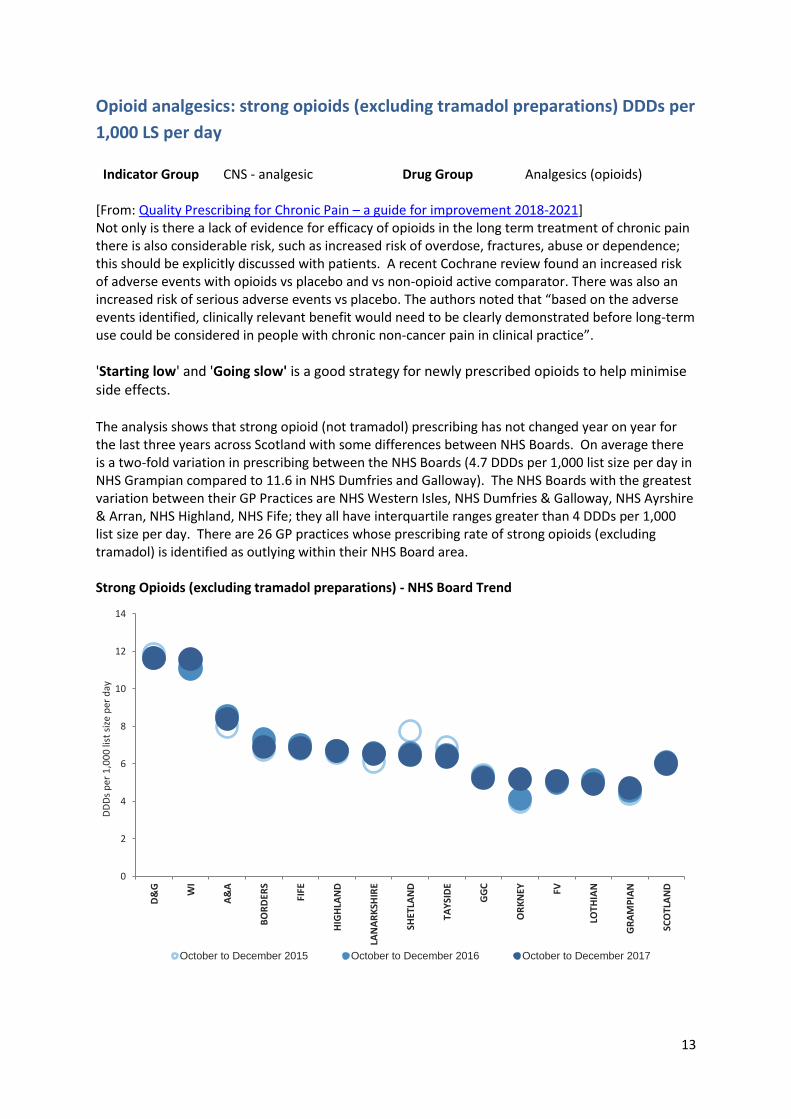
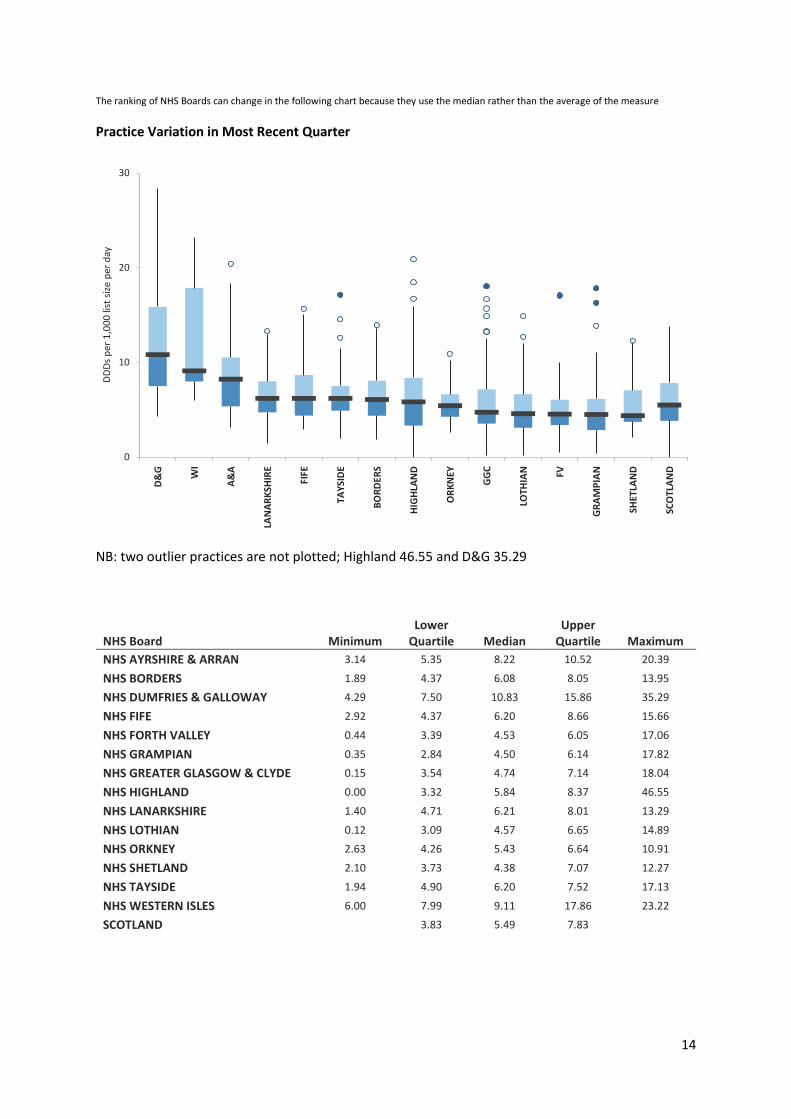
Indicator Group CNS - analgesic Drug Group Analgesics (opioids) [From: Quality Prescribing for Chronic Pain – a guide for improvement 2018-2021] Not only is there a lack of evidence for efficacy of opioids in the long term treatment of chronic pain there is also considerable risk, such as increased risk of overdose, fractures, abuse or dependence; this should be explicitly discussed with patients. A recent Cochrane review found an increased risk of adverse events with opioids vs placebo and vs non-opioid active comparator. There was also an increased risk of serious adverse events vs placebo. The authors noted that “based on the adverse events identified, clinically relevant benefit would need to be clearly demonstrated before long-term use could be considered in people with chronic non-cancer pain in clinical practice”.
'Starting low' and 'Going slow' is a good strategy for newly prescribed opioids to help minimise side effects. The analysis shows that strong opioid (not tramadol) prescribing has not changed year on year for the last three years across Scotland with some differences between NHS Boards. On average there is a two-fold variation in prescribing between the NHS Boards (4.7 DDDs per 1,000 list size per day in NHS Grampian compared to 11.6 in NHS Dumfries and Galloway). The NHS Boards with the greatest variation between their GP Practices are NHS Western Isles, NHS Dumfries & Galloway, NHS Ayrshire & Arran, NHS Highland, NHS Fife; they all have interquartile ranges greater than 4 DDDs per 1,000 list size per day. There are 26 GP practices whose prescribing rate of strong opioids (excluding tramadol) is identified as outlying within their NHS Board area. Strong Opioids (excluding tramadol preparations) - NHS Board Trend
0
2
4
6
8
10
12
14
D&
G
WI
A&
A
BO
RD
ERS
FIFE
HIG
HLA
ND
LAN
AR
KSH
IRE
SHET
LAN
D
TAY
SID
E
GG
C
OR
KN
EY FV
LOTH
IAN
GR
AM
PIA
N
SCO
TLA
ND
DD
Ds
per
1,0
00
list
siz
e p
er d
ay
October to December 2015 October to December 2016 October to December 2017
14
The ranking of NHS Boards can change in the following chart because they use the median rather than the average of the measure
Practice Variation in Most Recent Quarter
NB: two outlier practices are not plotted; Highland 46.55 and D&G 35.29
NHS Board Minimum Lower
Quartile Median Upper
Quartile Maximum
NHS AYRSHIRE & ARRAN 3.14 5.35 8.22 10.52 20.39
NHS BORDERS 1.89 4.37 6.08 8.05 13.95
NHS DUMFRIES & GALLOWAY 4.29 7.50 10.83 15.86 35.29
NHS FIFE 2.92 4.37 6.20 8.66 15.66
NHS FORTH VALLEY 0.44 3.39 4.53 6.05 17.06
NHS GRAMPIAN 0.35 2.84 4.50 6.14 17.82
NHS GREATER GLASGOW & CLYDE 0.15 3.54 4.74 7.14 18.04
NHS HIGHLAND 0.00 3.32 5.84 8.37 46.55
NHS LANARKSHIRE 1.40 4.71 6.21 8.01 13.29
NHS LOTHIAN 0.12 3.09 4.57 6.65 14.89
NHS ORKNEY 2.63 4.26 5.43 6.64 10.91
NHS SHETLAND 2.10 3.73 4.38 7.07 12.27
NHS TAYSIDE 1.94 4.90 6.20 7.52 17.13
NHS WESTERN ISLES 6.00 7.99 9.11 17.86 23.22
SCOTLAND 3.83 5.49 7.83
0
10
20
30
D&
G
WI
A&
A
LA
NA
RK
SHIR
E
FIF
E
TA
YSI
DE
BO
RD
ERS
HIG
HLA
ND
OR
KN
EY
GG
C
LO
THIA
N
FV
GR
AM
PIA
N
SH
ETLA
ND
SC
OTL
AN
D
DD
Ds
per
1,0
00
list
siz
e p
er d
ay
15
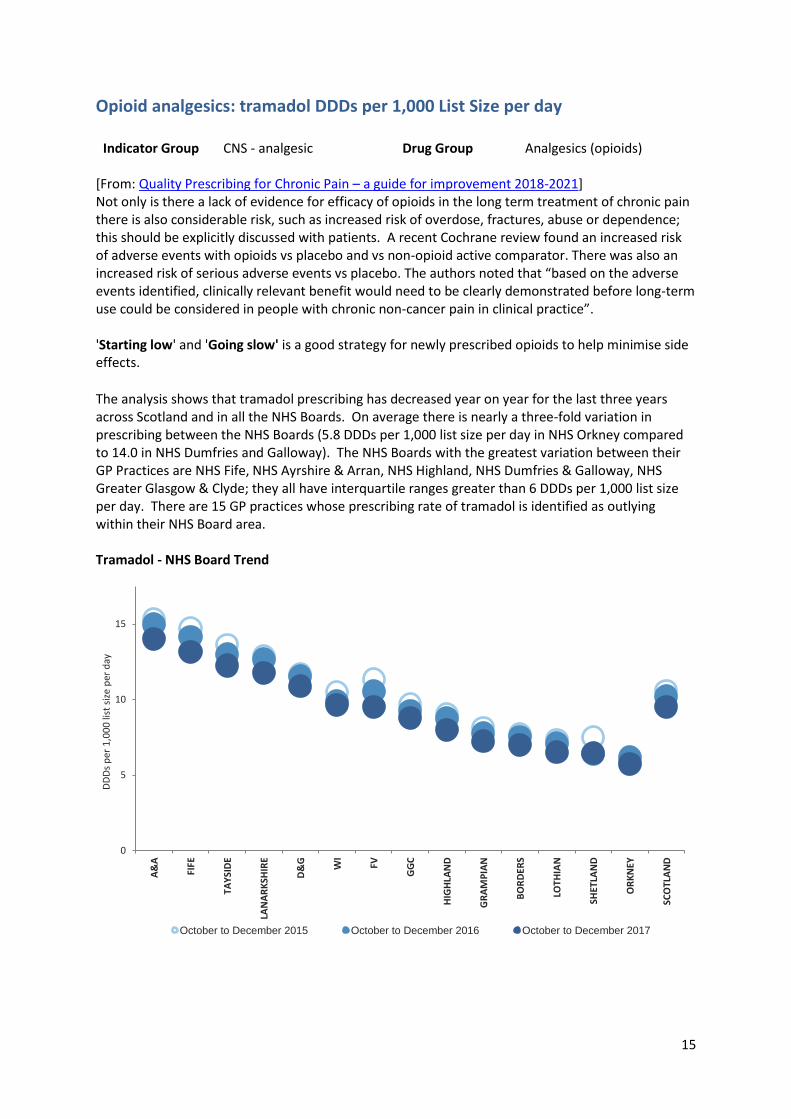
Opioid analgesics: tramadol DDDs per 1,000 List Size per day
Indicator Group CNS - analgesic Drug Group Analgesics (opioids) [From: Quality Prescribing for Chronic Pain – a guide for improvement 2018-2021] Not only is there a lack of evidence for efficacy of opioids in the long term treatment of chronic pain there is also considerable risk, such as increased risk of overdose, fractures, abuse or dependence; this should be explicitly discussed with patients. A recent Cochrane review found an increased risk of adverse events with opioids vs placebo and vs non-opioid active comparator. There was also an increased risk of serious adverse events vs placebo. The authors noted that “based on the adverse events identified, clinically relevant benefit would need to be clearly demonstrated before long-term use could be considered in people with chronic non-cancer pain in clinical practice”. 'Starting low' and 'Going slow' is a good strategy for newly prescribed opioids to help minimise side effects.
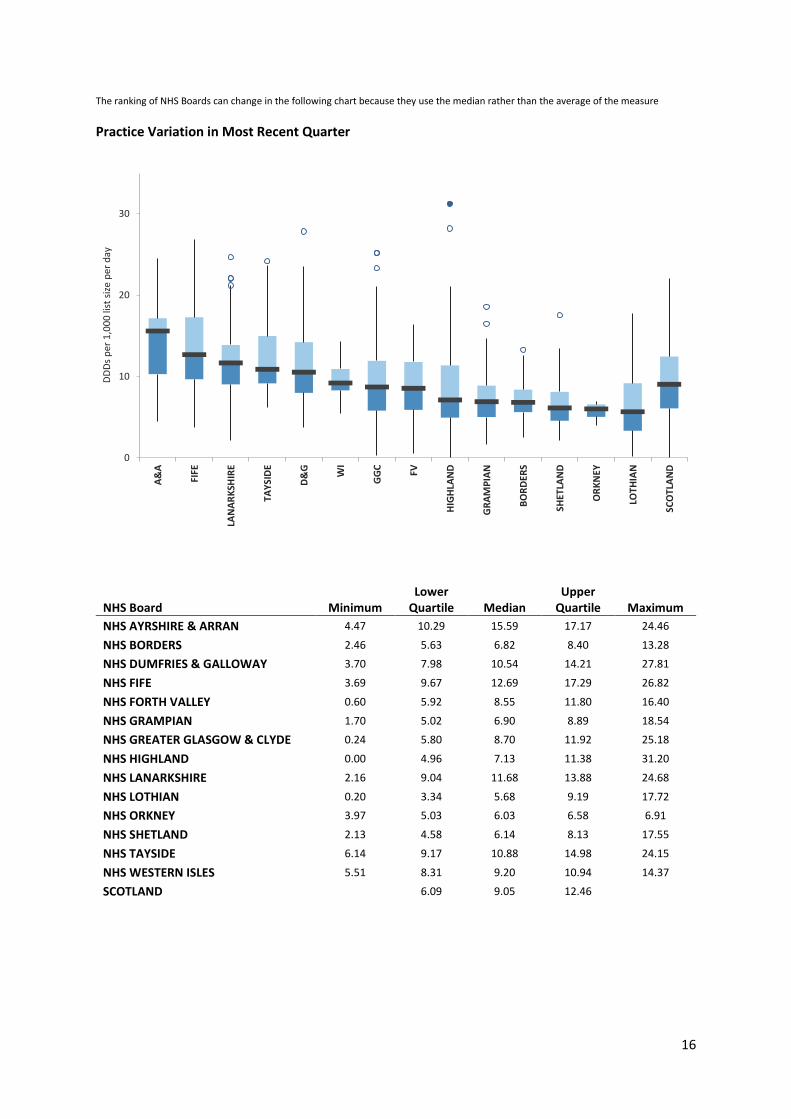
The analysis shows that tramadol prescribing has decreased year on year for the last three years across Scotland and in all the NHS Boards. On average there is nearly a three-fold variation in prescribing between the NHS Boards (5.8 DDDs per 1,000 list size per day in NHS Orkney compared to 14.0 in NHS Dumfries and Galloway). The NHS Boards with the greatest variation between their GP Practices are NHS Fife, NHS Ayrshire & Arran, NHS Highland, NHS Dumfries & Galloway, NHS Greater Glasgow & Clyde; they all have interquartile ranges greater than 6 DDDs per 1,000 list size per day. There are 15 GP practices whose prescribing rate of tramadol is identified as outlying within their NHS Board area. Tramadol - NHS Board Trend
0
5
10
15
A&
A
FIFE
TAY
SID
E
LAN
AR
KSH
IRE
D&
G
WI
FV
GG
C
HIG
HLA
ND
GR
AM
PIA
N
BO
RD
ERS
LOTH
IAN
SHET
LAN
D
OR
KN
EY
SCO
TLA
ND
DD
Ds
per
1,0
00
list
siz
e p
er d
ay
October to December 2015 October to December 2016 October to December 2017
16
The ranking of NHS Boards can change in the following chart because they use the median rather than the average of the measure
Practice Variation in Most Recent Quarter
NHS Board Minimum Lower
Quartile Median Upper
Quartile Maximum
NHS AYRSHIRE & ARRAN 4.47 10.29 15.59 17.17 24.46
NHS BORDERS 2.46 5.63 6.82 8.40 13.28
NHS DUMFRIES & GALLOWAY 3.70 7.98 10.54 14.21 27.81
NHS FIFE 3.69 9.67 12.69 17.29 26.82
NHS FORTH VALLEY 0.60 5.92 8.55 11.80 16.40
NHS GRAMPIAN 1.70 5.02 6.90 8.89 18.54
NHS GREATER GLASGOW & CLYDE 0.24 5.80 8.70 11.92 25.18
NHS HIGHLAND 0.00 4.96 7.13 11.38 31.20
NHS LANARKSHIRE 2.16 9.04 11.68 13.88 24.68
NHS LOTHIAN 0.20 3.34 5.68 9.19 17.72
NHS ORKNEY 3.97 5.03 6.03 6.58 6.91
NHS SHETLAND 2.13 4.58 6.14 8.13 17.55
NHS TAYSIDE 6.14 9.17 10.88 14.98 24.15
NHS WESTERN ISLES 5.51 8.31 9.20 10.94 14.37
SCOTLAND 6.09 9.05 12.46
0
10
20
30
A&
A
FIFE
LAN
AR
KSH
IRE
TAY
SID
E
D&
G
WI
GG
C
FV
HIG
HLA
ND
GR
AM
PIA
N
BO
RD
ERS
SHET
LAN
D
OR
KN
EY
LOTH
IAN
SCO
TLA
ND
DD
Ds
per
1,0
00
list
siz
e p
er d
ay
17
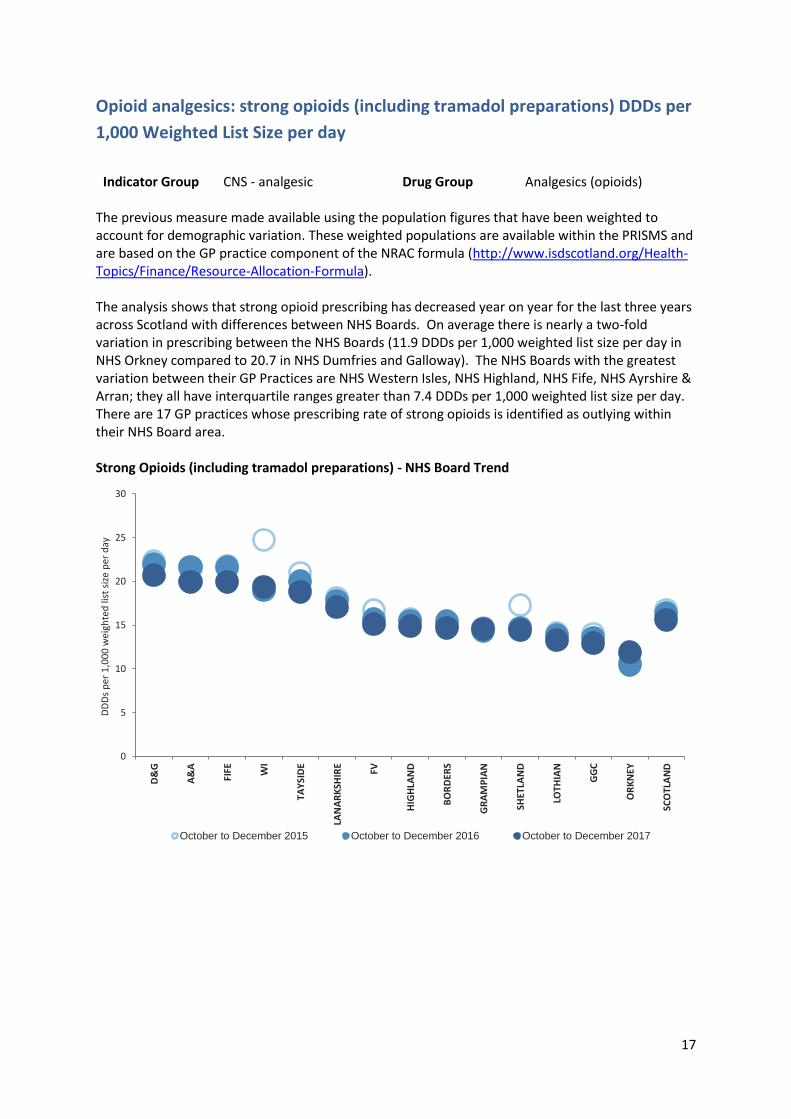
Opioid analgesics: strong opioids (including tramadol preparations) DDDs per
1,000 Weighted List Size per day
Indicator Group CNS - analgesic Drug Group Analgesics (opioids)
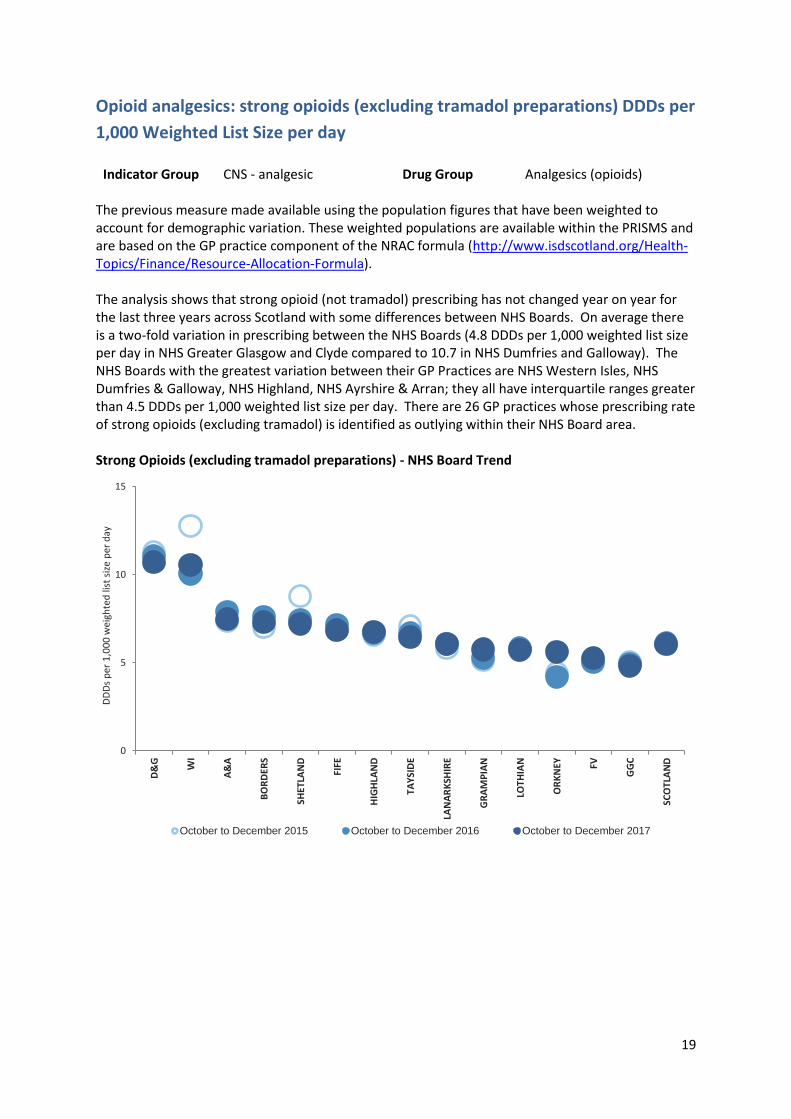
The previous measure made available using the population figures that have been weighted to account for demographic variation. These weighted populations are available within the PRISMS and are based on the GP practice component of the NRAC formula (http://www.isdscotland.org/Health-Topics/Finance/Resource-Allocation-Formula). The analysis shows that strong opioid prescribing has decreased year on year for the last three years across Scotland with differences between NHS Boards. On average there is nearly a two-fold variation in prescribing between the NHS Boards (11.9 DDDs per 1,000 weighted list size per day in NHS Orkney compared to 20.7 in NHS Dumfries and Galloway). The NHS Boards with the greatest variation between their GP Practices are NHS Western Isles, NHS Highland, NHS Fife, NHS Ayrshire & Arran; they all have interquartile ranges greater than 7.4 DDDs per 1,000 weighted list size per day. There are 17 GP practices whose prescribing rate of strong opioids is identified as outlying within their NHS Board area. Strong Opioids (including tramadol preparations) - NHS Board Trend
0
5
10
15
20
25
30
D&
G
A&
A
FIFE W
I
TAY
SID
E
LAN
AR
KSH
IRE
FV
HIG
HLA
ND
BO
RD
ERS
GR
AM
PIA
N
SHET
LAN
D
LOTH
IAN
GG
C
OR
KN
EY
SCO
TLA
ND
DD
Ds
per
1,0
00
wei
ghte
d li
st s
ize
per
day
October to December 2015 October to December 2016 October to December 2017
18
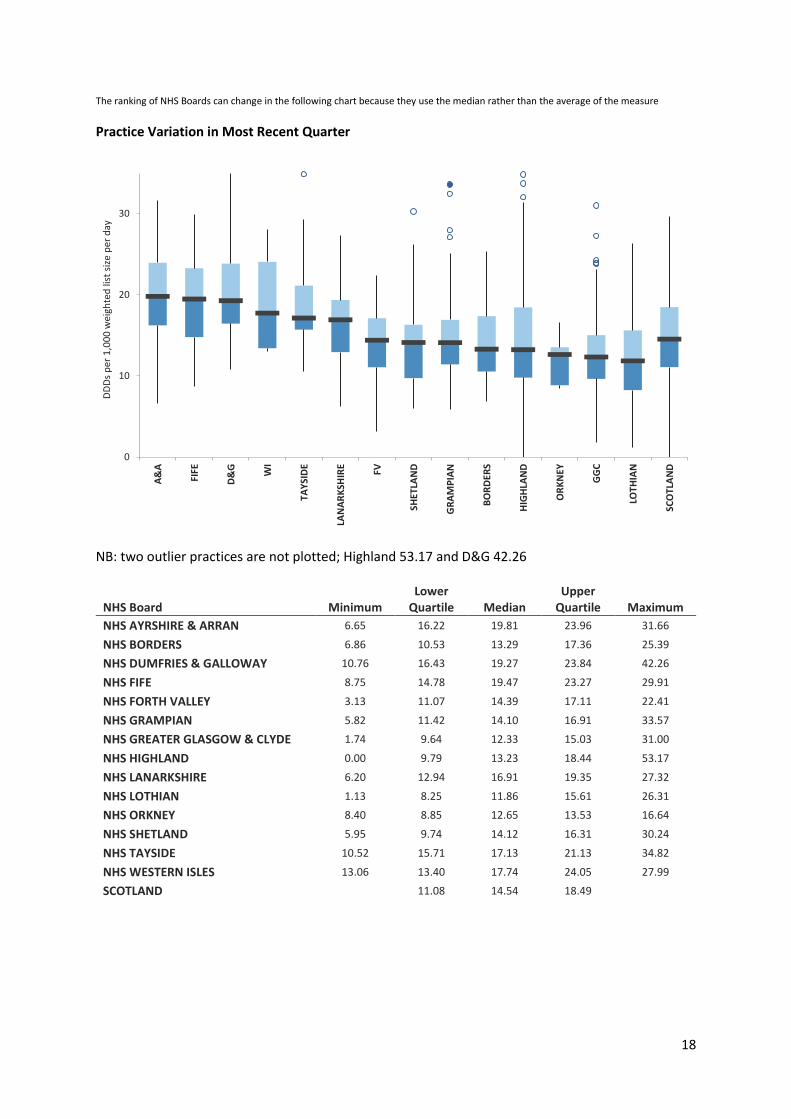
The ranking of NHS Boards can change in the following chart because they use the median rather than the average of the measure
Practice Variation in Most Recent Quarter
NB: two outlier practices are not plotted; Highland 53.17 and D&G 42.26
NHS Board Minimum Lower
Quartile Median Upper
Quartile Maximum
NHS AYRSHIRE & ARRAN 6.65 16.22 19.81 23.96 31.66
NHS BORDERS 6.86 10.53 13.29 17.36 25.39
NHS DUMFRIES & GALLOWAY 10.76 16.43 19.27 23.84 42.26
NHS FIFE 8.75 14.78 19.47 23.27 29.91
NHS FORTH VALLEY 3.13 11.07 14.39 17.11 22.41
NHS GRAMPIAN 5.82 11.42 14.10 16.91 33.57
NHS GREATER GLASGOW & CLYDE 1.74 9.64 12.33 15.03 31.00
NHS HIGHLAND 0.00 9.79 13.23 18.44 53.17
NHS LANARKSHIRE 6.20 12.94 16.91 19.35 27.32
NHS LOTHIAN 1.13 8.25 11.86 15.61 26.31
NHS ORKNEY 8.40 8.85 12.65 13.53 16.64
NHS SHETLAND 5.95 9.74 14.12 16.31 30.24
NHS TAYSIDE 10.52 15.71 17.13 21.13 34.82
NHS WESTERN ISLES 13.06 13.40 17.74 24.05 27.99
SCOTLAND 11.08 14.54 18.49
0
10
20
30
A&
A
FIFE
D&
G
WI
TAY
SID
E
LAN
AR
KSH
IRE
FV
SHET
LAN
D
GR
AM
PIA
N
BO
RD
ERS
HIG
HLA
ND
OR
KN
EY
GG
C
LOTH
IAN
SCO
TLA
ND
DD
Ds
per
1,0
00
wei
ghte
d li
st s
ize
per
day
19
Opioid analgesics: strong opioids (excluding tramadol preparations) DDDs per
1,000 Weighted List Size per day
Indicator Group CNS - analgesic Drug Group Analgesics (opioids) The previous measure made available using the population figures that have been weighted to account for demographic variation. These weighted populations are available within the PRISMS and are based on the GP practice component of the NRAC formula (http://www.isdscotland.org/Health-Topics/Finance/Resource-Allocation-Formula). The analysis shows that strong opioid (not tramadol) prescribing has not changed year on year for the last three years across Scotland with some differences between NHS Boards. On average there is a two-fold variation in prescribing between the NHS Boards (4.8 DDDs per 1,000 weighted list size per day in NHS Greater Glasgow and Clyde compared to 10.7 in NHS Dumfries and Galloway). The NHS Boards with the greatest variation between their GP Practices are NHS Western Isles, NHS Dumfries & Galloway, NHS Highland, NHS Ayrshire & Arran; they all have interquartile ranges greater than 4.5 DDDs per 1,000 weighted list size per day. There are 26 GP practices whose prescribing rate of strong opioids (excluding tramadol) is identified as outlying within their NHS Board area.
Strong Opioids (excluding tramadol preparations) - NHS Board Trend
0
5
10
15
D&
G
WI
A&
A
BO
RD
ERS
SHET
LAN
D
FIFE
HIG
HLA
ND
TAY
SID
E
LAN
AR
KSH
IRE
GR
AM
PIA
N
LOTH
IAN
OR
KN
EY FV
GG
C
SCO
TLA
ND
DD
Ds
per
1,0
00
wei
ghte
d li
st s
ize
per
day
October to December 2015 October to December 2016 October to December 2017
20
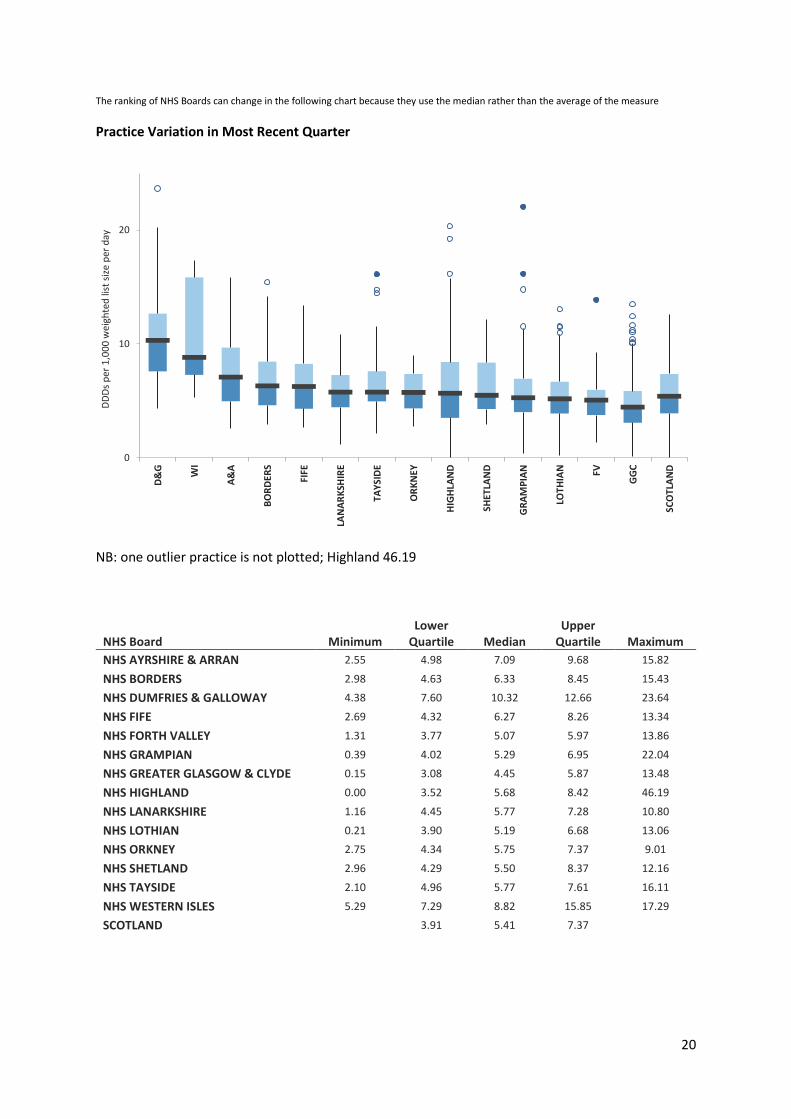
The ranking of NHS Boards can change in the following chart because they use the median rather than the average of the measure
Practice Variation in Most Recent Quarter
NB: one outlier practice is not plotted; Highland 46.19
NHS Board Minimum Lower
Quartile Median Upper
Quartile Maximum
NHS AYRSHIRE & ARRAN 2.55 4.98 7.09 9.68 15.82
NHS BORDERS 2.98 4.63 6.33 8.45 15.43
NHS DUMFRIES & GALLOWAY 4.38 7.60 10.32 12.66 23.64
NHS FIFE 2.69 4.32 6.27 8.26 13.34
NHS FORTH VALLEY 1.31 3.77 5.07 5.97 13.86
NHS GRAMPIAN 0.39 4.02 5.29 6.95 22.04
NHS GREATER GLASGOW & CLYDE 0.15 3.08 4.45 5.87 13.48
NHS HIGHLAND 0.00 3.52 5.68 8.42 46.19
NHS LANARKSHIRE 1.16 4.45 5.77 7.28 10.80
NHS LOTHIAN 0.21 3.90 5.19 6.68 13.06
NHS ORKNEY 2.75 4.34 5.75 7.37 9.01
NHS SHETLAND 2.96 4.29 5.50 8.37 12.16
NHS TAYSIDE 2.10 4.96 5.77 7.61 16.11
NHS WESTERN ISLES 5.29 7.29 8.82 15.85 17.29
SCOTLAND 3.91 5.41 7.37
0
10
20
D&
G
WI
A&
A
BO
RD
ERS
FIFE
LAN
AR
KSH
IRE
TAY
SID
E
OR
KN
EY
HIG
HLA
ND
SHET
LAN
D
GR
AM
PIA
N
LOTH
IAN FV
GG
C
SCO
TLA
ND
DD
Ds
per
1,0
00
wei
ghte
d li
st s
ize
per
day
21
Opioid analgesics: tramadol DDDs per 1,000 Weighted List Size per day
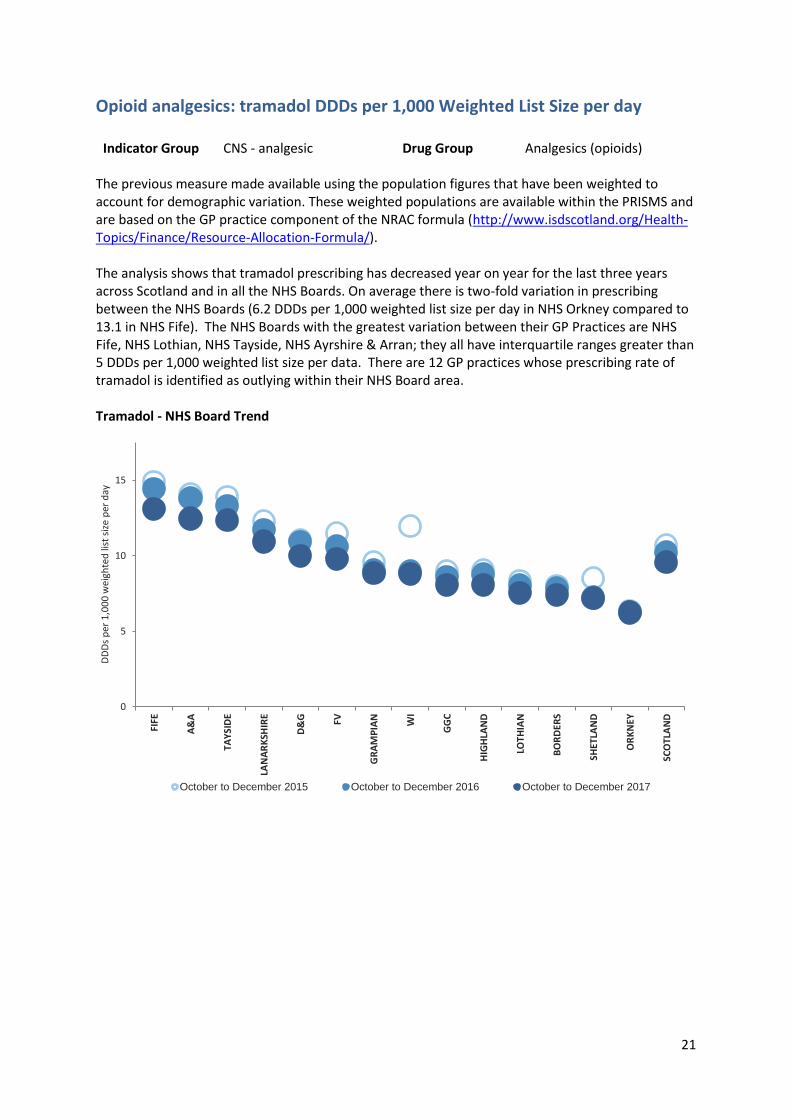
Indicator Group CNS - analgesic Drug Group Analgesics (opioids) The previous measure made available using the population figures that have been weighted to account for demographic variation. These weighted populations are available within the PRISMS and are based on the GP practice component of the NRAC formula (http://www.isdscotland.org/Health-Topics/Finance/Resource-Allocation-Formula/). The analysis shows that tramadol prescribing has decreased year on year for the last three years across Scotland and in all the NHS Boards. On average there is two-fold variation in prescribing between the NHS Boards (6.2 DDDs per 1,000 weighted list size per day in NHS Orkney compared to 13.1 in NHS Fife). The NHS Boards with the greatest variation between their GP Practices are NHS Fife, NHS Lothian, NHS Tayside, NHS Ayrshire & Arran; they all have interquartile ranges greater than 5 DDDs per 1,000 weighted list size per data. There are 12 GP practices whose prescribing rate of tramadol is identified as outlying within their NHS Board area. Tramadol - NHS Board Trend
0
5
10
15
FIFE
A&
A
TAY
SID
E
LAN
AR
KSH
IRE
D&
G FV
GR
AM
PIA
N
WI
GG
C
HIG
HLA
ND
LOTH
IAN
BO
RD
ERS
SHET
LAN
D
OR
KN
EY
SCO
TLA
ND
DD
Ds
per
1,0
00
wei
ghte
d li
st s
ize
per
day
October to December 2015 October to December 2016 October to December 2017
22
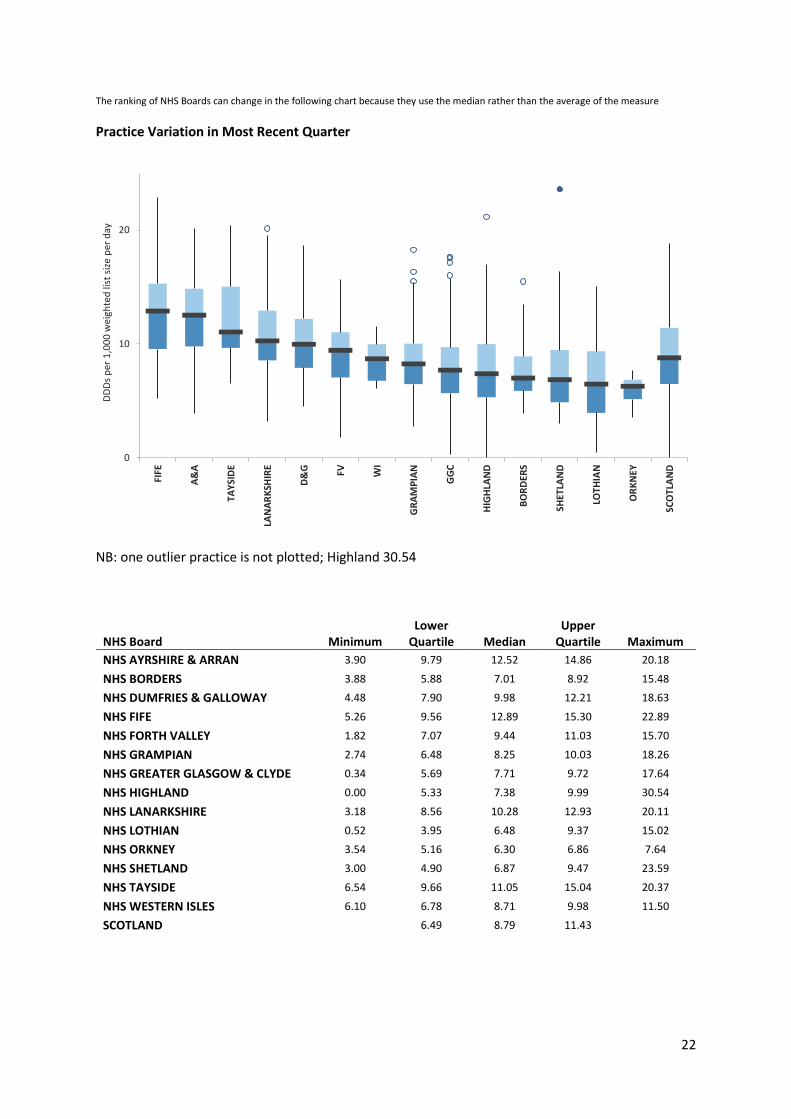
The ranking of NHS Boards can change in the following chart because they use the median rather than the average of the measure
Practice Variation in Most Recent Quarter
NB: one outlier practice is not plotted; Highland 30.54
NHS Board Minimum Lower
Quartile Median Upper
Quartile Maximum
NHS AYRSHIRE & ARRAN 3.90 9.79 12.52 14.86 20.18
NHS BORDERS 3.88 5.88 7.01 8.92 15.48
NHS DUMFRIES & GALLOWAY 4.48 7.90 9.98 12.21 18.63
NHS FIFE 5.26 9.56 12.89 15.30 22.89
NHS FORTH VALLEY 1.82 7.07 9.44 11.03 15.70
NHS GRAMPIAN 2.74 6.48 8.25 10.03 18.26
NHS GREATER GLASGOW & CLYDE 0.34 5.69 7.71 9.72 17.64
NHS HIGHLAND 0.00 5.33 7.38 9.99 30.54
NHS LANARKSHIRE 3.18 8.56 10.28 12.93 20.11
NHS LOTHIAN 0.52 3.95 6.48 9.37 15.02
NHS ORKNEY 3.54 5.16 6.30 6.86 7.64
NHS SHETLAND 3.00 4.90 6.87 9.47 23.59
NHS TAYSIDE 6.54 9.66 11.05 15.04 20.37
NHS WESTERN ISLES 6.10 6.78 8.71 9.98 11.50
SCOTLAND 6.49 8.79 11.43
0
10
20
FIFE
A&
A
TAY
SID
E
LAN
AR
KSH
IRE
D&
G FV WI
GR
AM
PIA
N
GG
C
HIG
HLA
ND
BO
RD
ERS
SHET
LAN
D
LOTH
IAN
OR
KN
EY
SCO
TLA
ND
DD
Ds
per
1,0
00
wei
ghte
d li
st s
ize
per
day
23
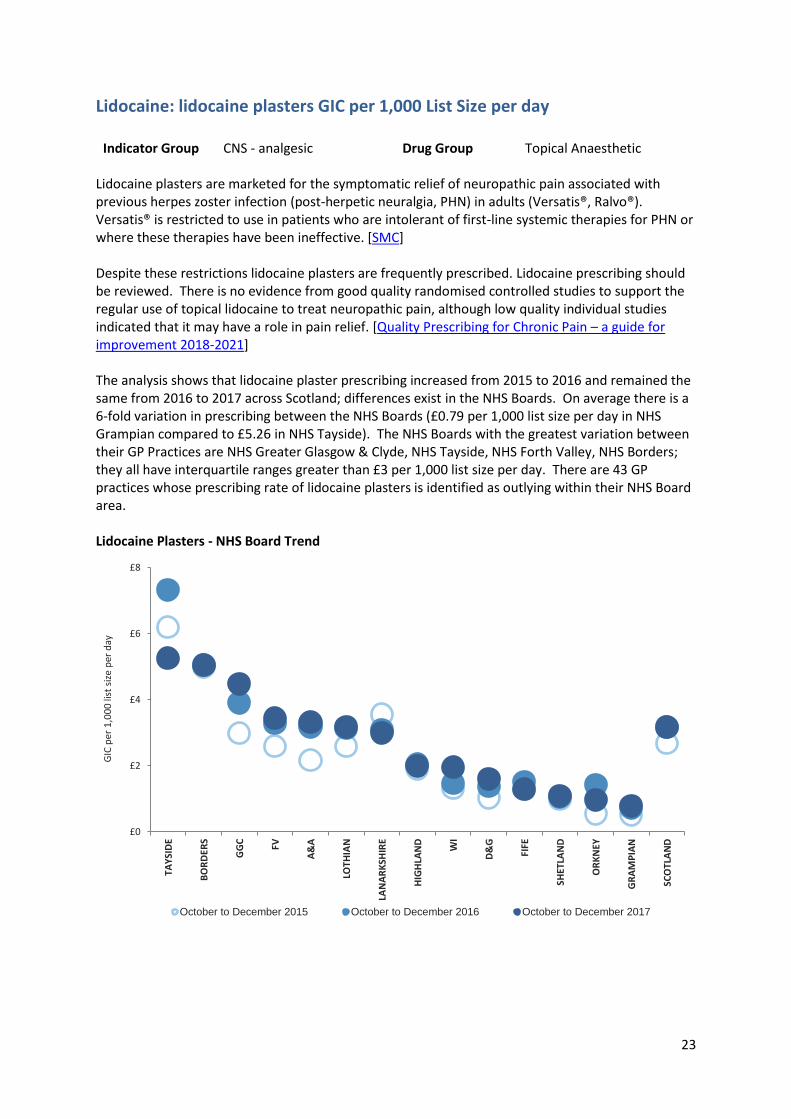
Lidocaine: lidocaine plasters GIC per 1,000 List Size per day
Indicator Group CNS - analgesic Drug Group Topical Anaesthetic Lidocaine plasters are marketed for the symptomatic relief of neuropathic pain associated with previous herpes zoster infection (post-herpetic neuralgia, PHN) in adults (Versatis®, Ralvo®). Versatis® is restricted to use in patients who are intolerant of first-line systemic therapies for PHN or where these therapies have been ineffective. [SMC] Despite these restrictions lidocaine plasters are frequently prescribed. Lidocaine prescribing should be reviewed. There is no evidence from good quality randomised controlled studies to support the regular use of topical lidocaine to treat neuropathic pain, although low quality individual studies indicated that it may have a role in pain relief. [Quality Prescribing for Chronic Pain – a guide for improvement 2018-2021] The analysis shows that lidocaine plaster prescribing increased from 2015 to 2016 and remained the same from 2016 to 2017 across Scotland; differences exist in the NHS Boards. On average there is a 6-fold variation in prescribing between the NHS Boards (£0.79 per 1,000 list size per day in NHS Grampian compared to £5.26 in NHS Tayside). The NHS Boards with the greatest variation between their GP Practices are NHS Greater Glasgow & Clyde, NHS Tayside, NHS Forth Valley, NHS Borders; they all have interquartile ranges greater than £3 per 1,000 list size per day. There are 43 GP practices whose prescribing rate of lidocaine plasters is identified as outlying within their NHS Board area. Lidocaine Plasters - NHS Board Trend
£0
£2
£4
£6
£8
TAY
SID
E
BO
RD
ERS
GG
C
FV
A&
A
LOTH
IAN
LAN
AR
KSH
IRE
HIG
HLA
ND
WI
D&
G
FIFE
SHET
LAN
D
OR
KN
EY
GR
AM
PIA
N
SCO
TLA
ND
GIC
per
1,0
00
list
siz
e p
er d
ay
October to December 2015 October to December 2016 October to December 2017

24
The ranking of NHS Boards can change in the following chart because they use the median rather than the average of the measure
Practice Variation in Most Recent Quarter
NB: one outlier practice is not plotted; Orkney £31.06
NHS Board Minimum Lower
Quartile Median Upper
Quartile Maximum
NHS AYRSHIRE & ARRAN £0.00 £1.67 £2.74 £3.67 £13.57
NHS BORDERS £0.00 £2.95 £5.30 £5.98 £7.87
NHS DUMFRIES & GALLOWAY £0.00 £0.56 £1.42 £2.06 £3.94
NHS FIFE £0.00 £0.51 £1.01 £1.54 £6.63
NHS FORTH VALLEY £0.00 £1.62 £2.99 £4.95 £10.99
NHS GRAMPIAN £0.00 £0.21 £0.62 £1.03 £4.03
NHS GREATER GLASGOW & CLYDE £0.00 £2.31 £3.94 £6.20 £15.98
NHS HIGHLAND £0.00 £0.18 £0.96 £2.80 £14.23
NHS LANARKSHIRE £0.00 £1.67 £2.60 £3.97 £12.29
NHS LOTHIAN £0.00 £1.86 £2.85 £3.90 £11.49
NHS ORKNEY £0.00 £0.24 £0.95 £1.94 £31.06
NHS SHETLAND £0.00 £0.00 £0.16 £0.83 £4.50
NHS TAYSIDE £0.72 £2.93 £4.62 £6.71 £12.85
NHS WESTERN ISLES £0.00 £0.77 £1.52 £1.97 £3.12
SCOTLAND £1.10 £2.56 £4.63
£0
£5
£10
£15
BO
RD
ERS
TA
YSI
DE
GG
C
FV
LO
THIA
N
A&
A
LA
NA
RK
SHIR
E
WI
D&
G
FIF
E
HIG
HLA
ND
OR
KN
EY
GR
AM
PIA
N
SH
ETLA
ND
SC
OTL
AN
D
GIC
per
1,0
00
list
siz
e p
er d
ay
25
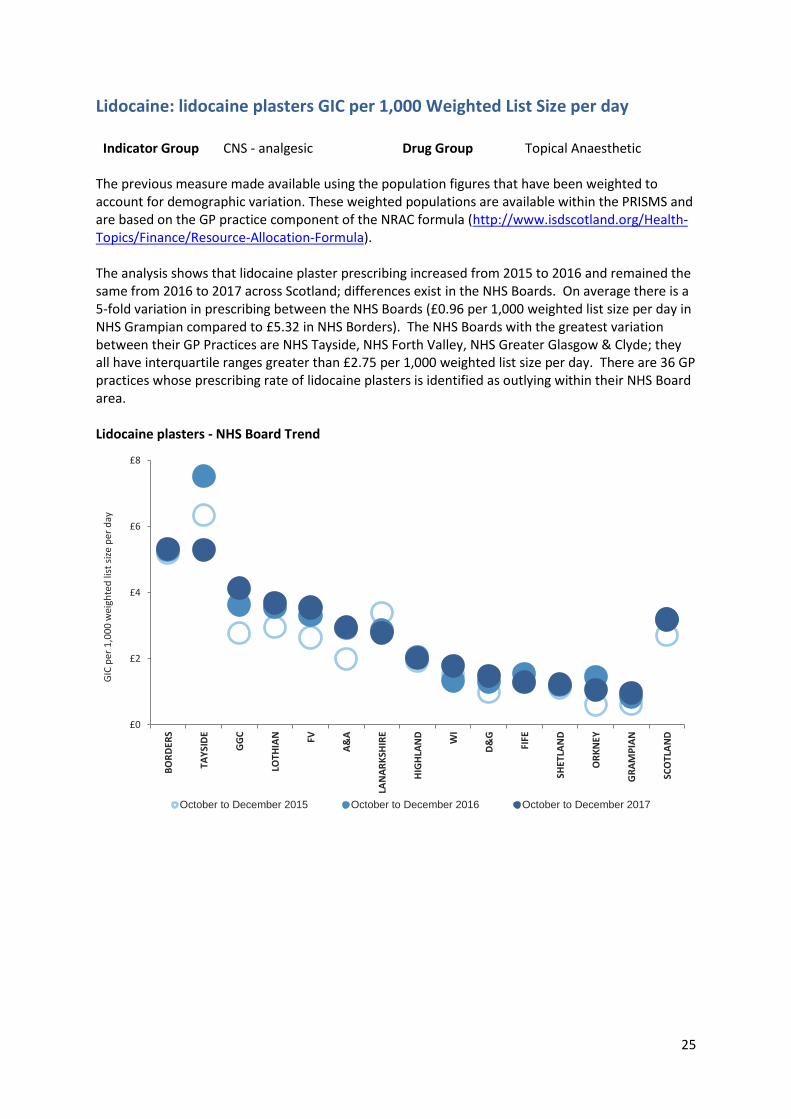
Lidocaine: lidocaine plasters GIC per 1,000 Weighted List Size per day
Indicator Group CNS - analgesic Drug Group Topical Anaesthetic The previous measure made available using the population figures that have been weighted to account for demographic variation. These weighted populations are available within the PRISMS and are based on the GP practice component of the NRAC formula (http://www.isdscotland.org/Health-Topics/Finance/Resource-Allocation-Formula). The analysis shows that lidocaine plaster prescribing increased from 2015 to 2016 and remained the same from 2016 to 2017 across Scotland; differences exist in the NHS Boards. On average there is a 5-fold variation in prescribing between the NHS Boards (£0.96 per 1,000 weighted list size per day in NHS Grampian compared to £5.32 in NHS Borders). The NHS Boards with the greatest variation between their GP Practices are NHS Tayside, NHS Forth Valley, NHS Greater Glasgow & Clyde; they all have interquartile ranges greater than £2.75 per 1,000 weighted list size per day. There are 36 GP practices whose prescribing rate of lidocaine plasters is identified as outlying within their NHS Board area. Lidocaine plasters - NHS Board Trend
£0
£2
£4
£6
£8
BO
RD
ERS
TAY
SID
E
GG
C
LOTH
IAN FV
A&
A
LAN
AR
KSH
IRE
HIG
HLA
ND
WI
D&
G
FIFE
SHET
LAN
D
OR
KN
EY
GR
AM
PIA
N
SCO
TLA
ND
GIC
per
1,0
00
wei
ghte
d li
st s
ize
per
day
October to December 2015 October to December 2016 October to December 2017
26
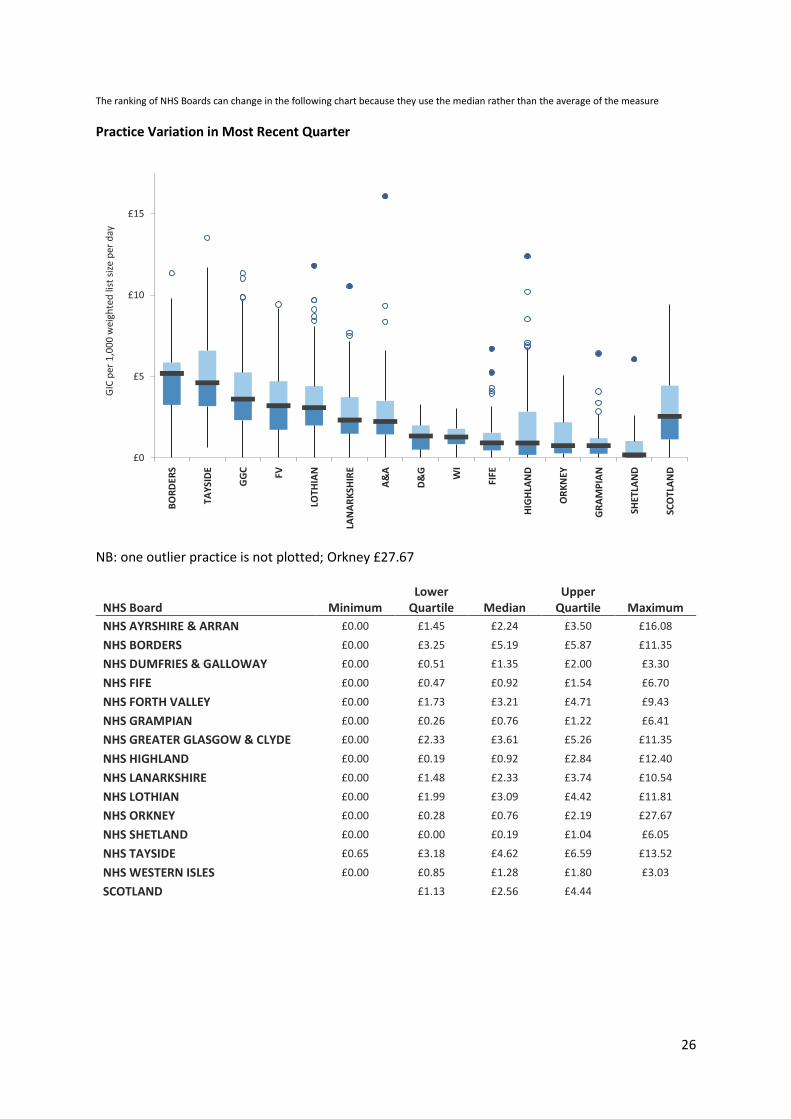
The ranking of NHS Boards can change in the following chart because they use the median rather than the average of the measure
Practice Variation in Most Recent Quarter
NB: one outlier practice is not plotted; Orkney £27.67
NHS Board Minimum Lower
Quartile Median Upper
Quartile Maximum
NHS AYRSHIRE & ARRAN £0.00 £1.45 £2.24 £3.50 £16.08
NHS BORDERS £0.00 £3.25 £5.19 £5.87 £11.35
NHS DUMFRIES & GALLOWAY £0.00 £0.51 £1.35 £2.00 £3.30
NHS FIFE £0.00 £0.47 £0.92 £1.54 £6.70
NHS FORTH VALLEY £0.00 £1.73 £3.21 £4.71 £9.43
NHS GRAMPIAN £0.00 £0.26 £0.76 £1.22 £6.41
NHS GREATER GLASGOW & CLYDE £0.00 £2.33 £3.61 £5.26 £11.35
NHS HIGHLAND £0.00 £0.19 £0.92 £2.84 £12.40
NHS LANARKSHIRE £0.00 £1.48 £2.33 £3.74 £10.54
NHS LOTHIAN £0.00 £1.99 £3.09 £4.42 £11.81
NHS ORKNEY £0.00 £0.28 £0.76 £2.19 £27.67
NHS SHETLAND £0.00 £0.00 £0.19 £1.04 £6.05
NHS TAYSIDE £0.65 £3.18 £4.62 £6.59 £13.52
NHS WESTERN ISLES £0.00 £0.85 £1.28 £1.80 £3.03
SCOTLAND £1.13 £2.56 £4.44
£0
£5
£10
£15
BO
RD
ERS
TA
YSI
DE
GG
C
FV
LO
THIA
N
LA
NA
RK
SHIR
E
A&
A
D&
G
WI
FIF
E
HIG
HLA
ND
OR
KN
EY
GR
AM
PIA
N
SH
ETLA
ND
SC
OTL
AN
D
GIC
per
1,0
00
wei
ghte
d li
st s
ize
per
day
27
Hypnotics and Anxiolytics: hypnotics and anxiolytics DDDs per 1,000 List Size
per day
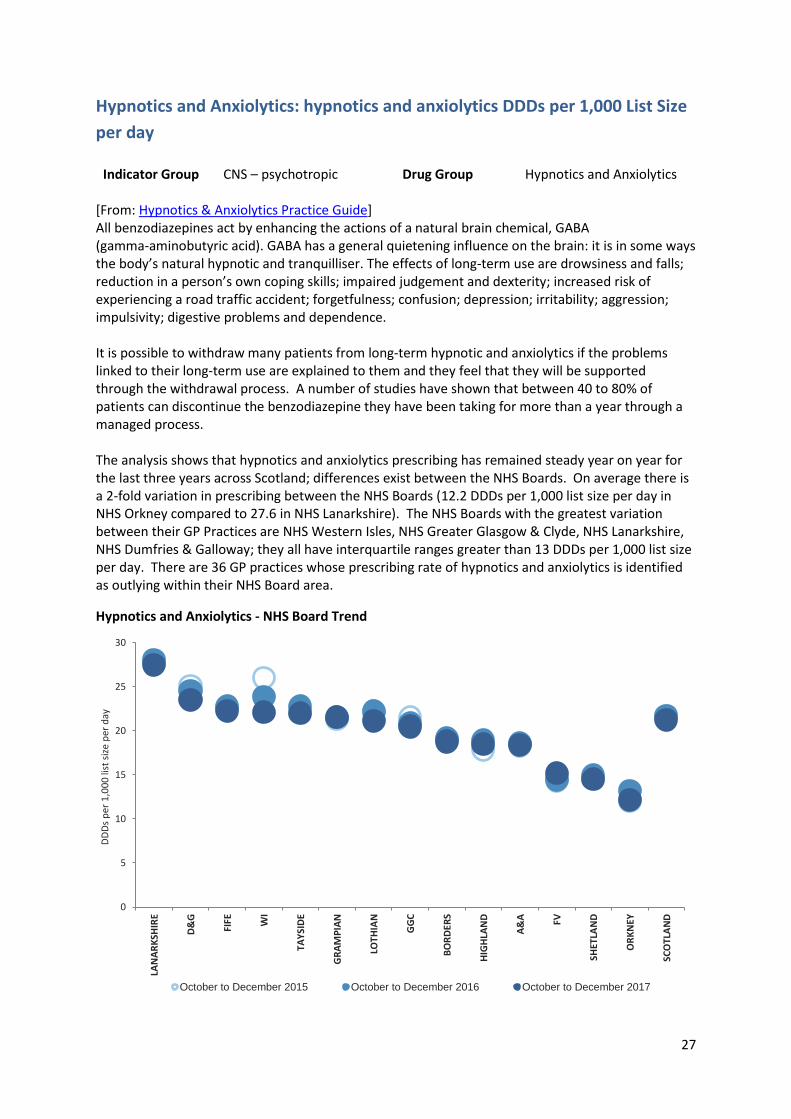
Indicator Group CNS – psychotropic Drug Group Hypnotics and Anxiolytics [From: Hypnotics & Anxiolytics Practice Guide] All benzodiazepines act by enhancing the actions of a natural brain chemical, GABA (gamma-aminobutyric acid). GABA has a general quietening influence on the brain: it is in some ways the body’s natural hypnotic and tranquilliser. The effects of long-term use are drowsiness and falls; reduction in a person’s own coping skills; impaired judgement and dexterity; increased risk of experiencing a road traffic accident; forgetfulness; confusion; depression; irritability; aggression; impulsivity; digestive problems and dependence. It is possible to withdraw many patients from long-term hypnotic and anxiolytics if the problems linked to their long-term use are explained to them and they feel that they will be supported through the withdrawal process. A number of studies have shown that between 40 to 80% of patients can discontinue the benzodiazepine they have been taking for more than a year through a managed process. The analysis shows that hypnotics and anxiolytics prescribing has remained steady year on year for the last three years across Scotland; differences exist between the NHS Boards. On average there is a 2-fold variation in prescribing between the NHS Boards (12.2 DDDs per 1,000 list size per day in NHS Orkney compared to 27.6 in NHS Lanarkshire). The NHS Boards with the greatest variation between their GP Practices are NHS Western Isles, NHS Greater Glasgow & Clyde, NHS Lanarkshire, NHS Dumfries & Galloway; they all have interquartile ranges greater than 13 DDDs per 1,000 list size per day. There are 36 GP practices whose prescribing rate of hypnotics and anxiolytics is identified as outlying within their NHS Board area.
Hypnotics and Anxiolytics - NHS Board Trend
0
5
10
15
20
25
30
LAN
AR
KSH
IRE
D&
G
FIFE W
I
TAY
SID
E
GR
AM
PIA
N
LOTH
IAN
GG
C
BO
RD
ERS
HIG
HLA
ND
A&
A FV
SHET
LAN
D
OR
KN
EY
SCO
TLA
ND
DD
Ds
per
1,0
00
list
siz
e p
er d
ay
October to December 2015 October to December 2016 October to December 2017
28
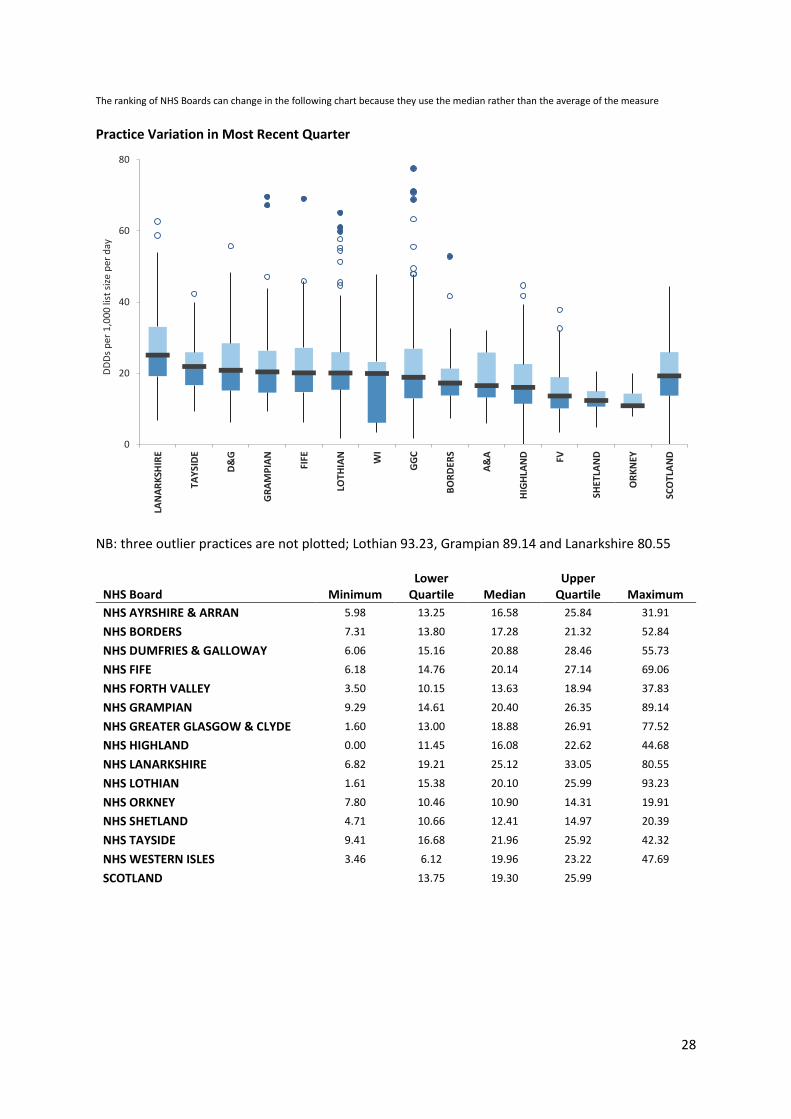
The ranking of NHS Boards can change in the following chart because they use the median rather than the average of the measure Practice Variation in Most Recent Quarter
NB: three outlier practices are not plotted; Lothian 93.23, Grampian 89.14 and Lanarkshire 80.55
NHS Board Minimum Lower
Quartile Median Upper
Quartile Maximum
NHS AYRSHIRE & ARRAN 5.98 13.25 16.58 25.84 31.91
NHS BORDERS 7.31 13.80 17.28 21.32 52.84
NHS DUMFRIES & GALLOWAY 6.06 15.16 20.88 28.46 55.73
NHS FIFE 6.18 14.76 20.14 27.14 69.06
NHS FORTH VALLEY 3.50 10.15 13.63 18.94 37.83
NHS GRAMPIAN 9.29 14.61 20.40 26.35 89.14
NHS GREATER GLASGOW & CLYDE 1.60 13.00 18.88 26.91 77.52
NHS HIGHLAND 0.00 11.45 16.08 22.62 44.68
NHS LANARKSHIRE 6.82 19.21 25.12 33.05 80.55
NHS LOTHIAN 1.61 15.38 20.10 25.99 93.23
NHS ORKNEY 7.80 10.46 10.90 14.31 19.91
NHS SHETLAND 4.71 10.66 12.41 14.97 20.39
NHS TAYSIDE 9.41 16.68 21.96 25.92 42.32
NHS WESTERN ISLES 3.46 6.12 19.96 23.22 47.69
SCOTLAND 13.75 19.30 25.99
0
20
40
60
80LA
NA
RK
SHIR
E
TAY
SID
E
D&
G
GR
AM
PIA
N
FIFE
LOTH
IAN
WI
GG
C
BO
RD
ERS
A&
A
HIG
HLA
ND FV
SHET
LAN
D
OR
KN
EY
SCO
TLA
ND
DD
Ds
per
1,0
00
list
siz
e p
er d
ay
29
Hypnotics and Anxiolytics: hypnotics and anxiolytics DDDs per 1,000
Weighted List Size per day
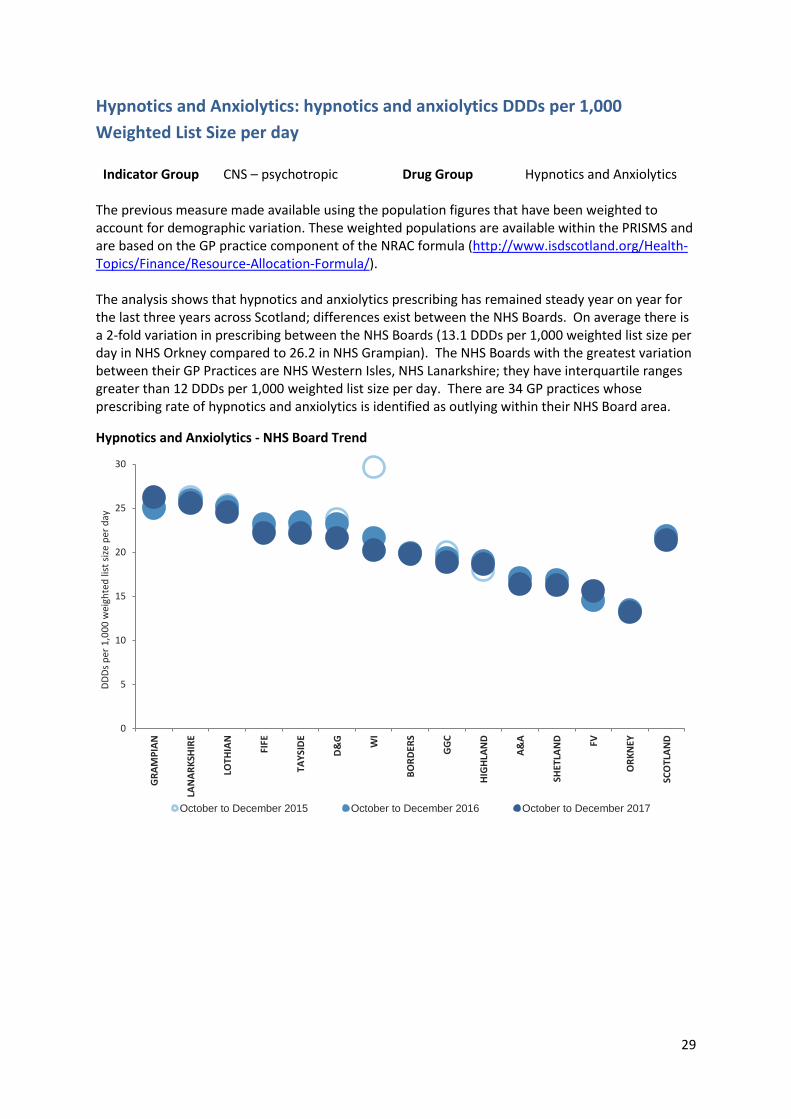
Indicator Group CNS – psychotropic Drug Group Hypnotics and Anxiolytics The previous measure made available using the population figures that have been weighted to account for demographic variation. These weighted populations are available within the PRISMS and are based on the GP practice component of the NRAC formula (http://www.isdscotland.org/Health-Topics/Finance/Resource-Allocation-Formula/). The analysis shows that hypnotics and anxiolytics prescribing has remained steady year on year for the last three years across Scotland; differences exist between the NHS Boards. On average there is a 2-fold variation in prescribing between the NHS Boards (13.1 DDDs per 1,000 weighted list size per day in NHS Orkney compared to 26.2 in NHS Grampian). The NHS Boards with the greatest variation between their GP Practices are NHS Western Isles, NHS Lanarkshire; they have interquartile ranges greater than 12 DDDs per 1,000 weighted list size per day. There are 34 GP practices whose prescribing rate of hypnotics and anxiolytics is identified as outlying within their NHS Board area.
Hypnotics and Anxiolytics - NHS Board Trend
0
5
10
15
20
25
30
GR
AM
PIA
N
LAN
AR
KSH
IRE
LOTH
IAN
FIFE
TAY
SID
E
D&
G
WI
BO
RD
ERS
GG
C
HIG
HLA
ND
A&
A
SHET
LAN
D FV
OR
KN
EY
SCO
TLA
ND
DD
Ds
per
1,0
00
wei
ghte
d li
st s
ize
per
day
October to December 2015 October to December 2016 October to December 2017
30
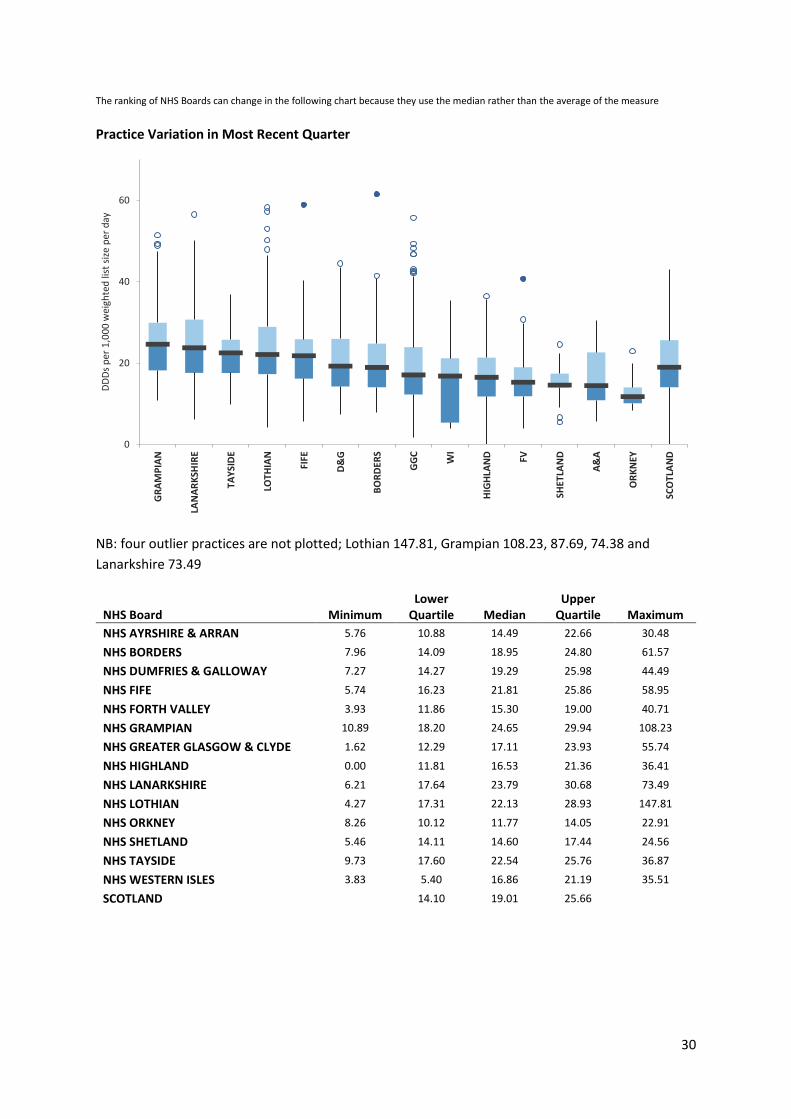
The ranking of NHS Boards can change in the following chart because they use the median rather than the average of the measure Practice Variation in Most Recent Quarter
NB: four outlier practices are not plotted; Lothian 147.81, Grampian 108.23, 87.69, 74.38 and
Lanarkshire 73.49
NHS Board Minimum Lower
Quartile Median Upper
Quartile Maximum
NHS AYRSHIRE & ARRAN 5.76 10.88 14.49 22.66 30.48
NHS BORDERS 7.96 14.09 18.95 24.80 61.57
NHS DUMFRIES & GALLOWAY 7.27 14.27 19.29 25.98 44.49
NHS FIFE 5.74 16.23 21.81 25.86 58.95
NHS FORTH VALLEY 3.93 11.86 15.30 19.00 40.71
NHS GRAMPIAN 10.89 18.20 24.65 29.94 108.23
NHS GREATER GLASGOW & CLYDE 1.62 12.29 17.11 23.93 55.74
NHS HIGHLAND 0.00 11.81 16.53 21.36 36.41
NHS LANARKSHIRE 6.21 17.64 23.79 30.68 73.49
NHS LOTHIAN 4.27 17.31 22.13 28.93 147.81
NHS ORKNEY 8.26 10.12 11.77 14.05 22.91
NHS SHETLAND 5.46 14.11 14.60 17.44 24.56
NHS TAYSIDE 9.73 17.60 22.54 25.76 36.87
NHS WESTERN ISLES 3.83 5.40 16.86 21.19 35.51
SCOTLAND 14.10 19.01 25.66
0
20
40
60
GR
AM
PIA
N
LAN
AR
KSH
IRE
TAY
SID
E
LOTH
IAN
FIFE
D&
G
BO
RD
ERS
GG
C
WI
HIG
HLA
ND FV
SHET
LAN
D
A&
A
OR
KN
EY
SCO
TLA
ND
DD
Ds
per
1,0
00
wei
ghte
d li
st s
ize
per
day
31
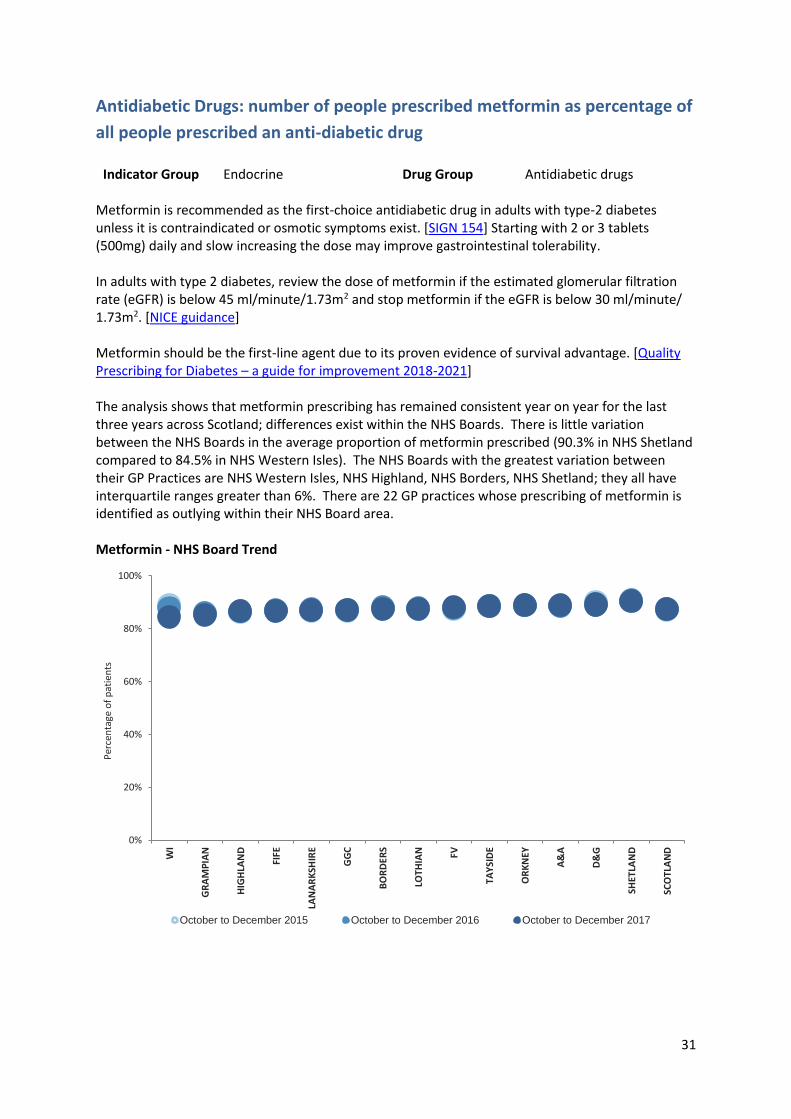
Antidiabetic Drugs: number of people prescribed metformin as percentage of
all people prescribed an anti-diabetic drug
Indicator Group Endocrine Drug Group Antidiabetic drugs Metformin is recommended as the first-choice antidiabetic drug in adults with type-2 diabetes unless it is contraindicated or osmotic symptoms exist. [SIGN 154] Starting with 2 or 3 tablets (500mg) daily and slow increasing the dose may improve gastrointestinal tolerability. In adults with type 2 diabetes, review the dose of metformin if the estimated glomerular filtration rate (eGFR) is below 45 ml/minute/1.73m2 and stop metformin if the eGFR is below 30 ml/minute/ 1.73m2. [NICE guidance] Metformin should be the first-line agent due to its proven evidence of survival advantage. [Quality Prescribing for Diabetes – a guide for improvement 2018-2021] The analysis shows that metformin prescribing has remained consistent year on year for the last three years across Scotland; differences exist within the NHS Boards. There is little variation between the NHS Boards in the average proportion of metformin prescribed (90.3% in NHS Shetland compared to 84.5% in NHS Western Isles). The NHS Boards with the greatest variation between their GP Practices are NHS Western Isles, NHS Highland, NHS Borders, NHS Shetland; they all have interquartile ranges greater than 6%. There are 22 GP practices whose prescribing of metformin is identified as outlying within their NHS Board area. Metformin - NHS Board Trend
0%
20%
40%
60%
80%
100%
WI
GR
AM
PIA
N
HIG
HLA
ND
FIFE
LAN
AR
KSH
IRE
GG
C
BO
RD
ERS
LOTH
IAN FV
TAY
SID
E
OR
KN
EY
A&
A
D&
G
SHET
LAN
D
SCO
TLA
ND
Per
cen
tage
of
pat
ien
ts
October to December 2015 October to December 2016 October to December 2017
32
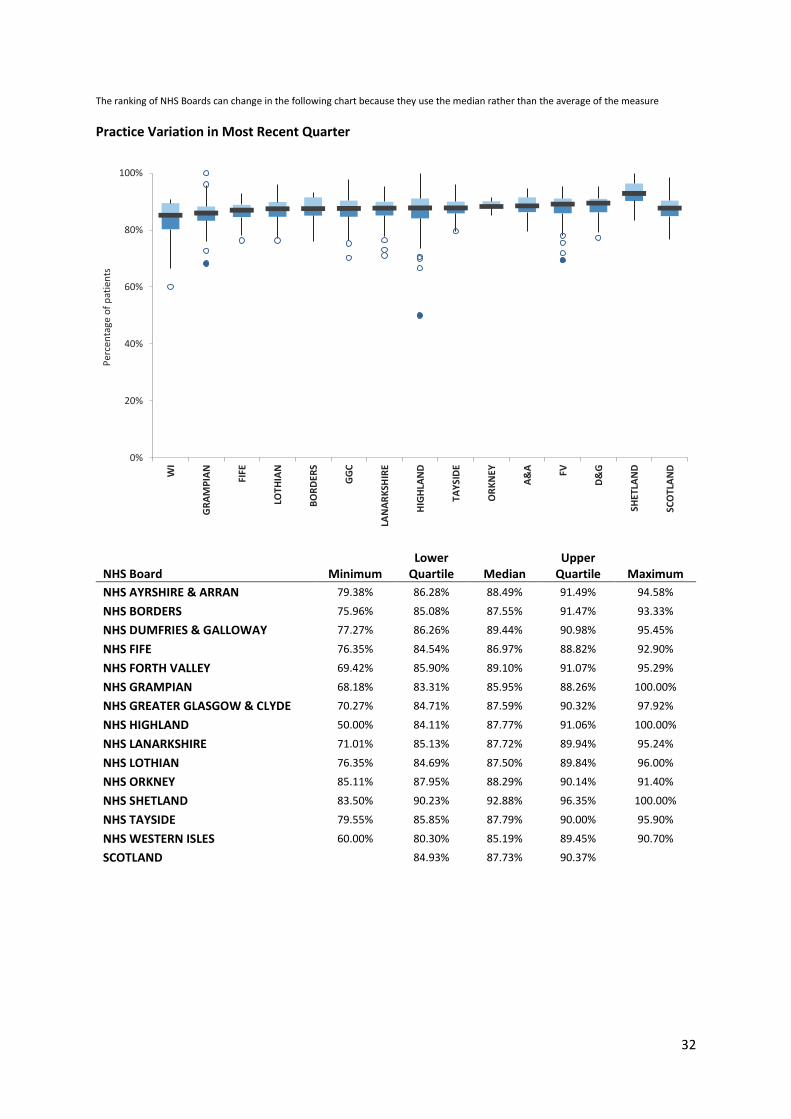
The ranking of NHS Boards can change in the following chart because they use the median rather than the average of the measure
Practice Variation in Most Recent Quarter
NHS Board Minimum Lower
Quartile Median Upper
Quartile Maximum
NHS AYRSHIRE & ARRAN 79.38% 86.28% 88.49% 91.49% 94.58%
NHS BORDERS 75.96% 85.08% 87.55% 91.47% 93.33%
NHS DUMFRIES & GALLOWAY 77.27% 86.26% 89.44% 90.98% 95.45%
NHS FIFE 76.35% 84.54% 86.97% 88.82% 92.90%
NHS FORTH VALLEY 69.42% 85.90% 89.10% 91.07% 95.29%
NHS GRAMPIAN 68.18% 83.31% 85.95% 88.26% 100.00%
NHS GREATER GLASGOW & CLYDE 70.27% 84.71% 87.59% 90.32% 97.92%
NHS HIGHLAND 50.00% 84.11% 87.77% 91.06% 100.00%
NHS LANARKSHIRE 71.01% 85.13% 87.72% 89.94% 95.24%
NHS LOTHIAN 76.35% 84.69% 87.50% 89.84% 96.00%
NHS ORKNEY 85.11% 87.95% 88.29% 90.14% 91.40%
NHS SHETLAND 83.50% 90.23% 92.88% 96.35% 100.00%
NHS TAYSIDE 79.55% 85.85% 87.79% 90.00% 95.90%
NHS WESTERN ISLES 60.00% 80.30% 85.19% 89.45% 90.70%
SCOTLAND 84.93% 87.73% 90.37%
0%
20%
40%
60%
80%
100%W
I
GR
AM
PIA
N
FIFE
LOTH
IAN
BO
RD
ERS
GG
C
LAN
AR
KSH
IRE
HIG
HLA
ND
TAY
SID
E
OR
KN
EY
A&
A FV
D&
G
SHET
LAN
D
SCO
TLA
ND
Per
cen
tage
of
pat
ien
ts
33
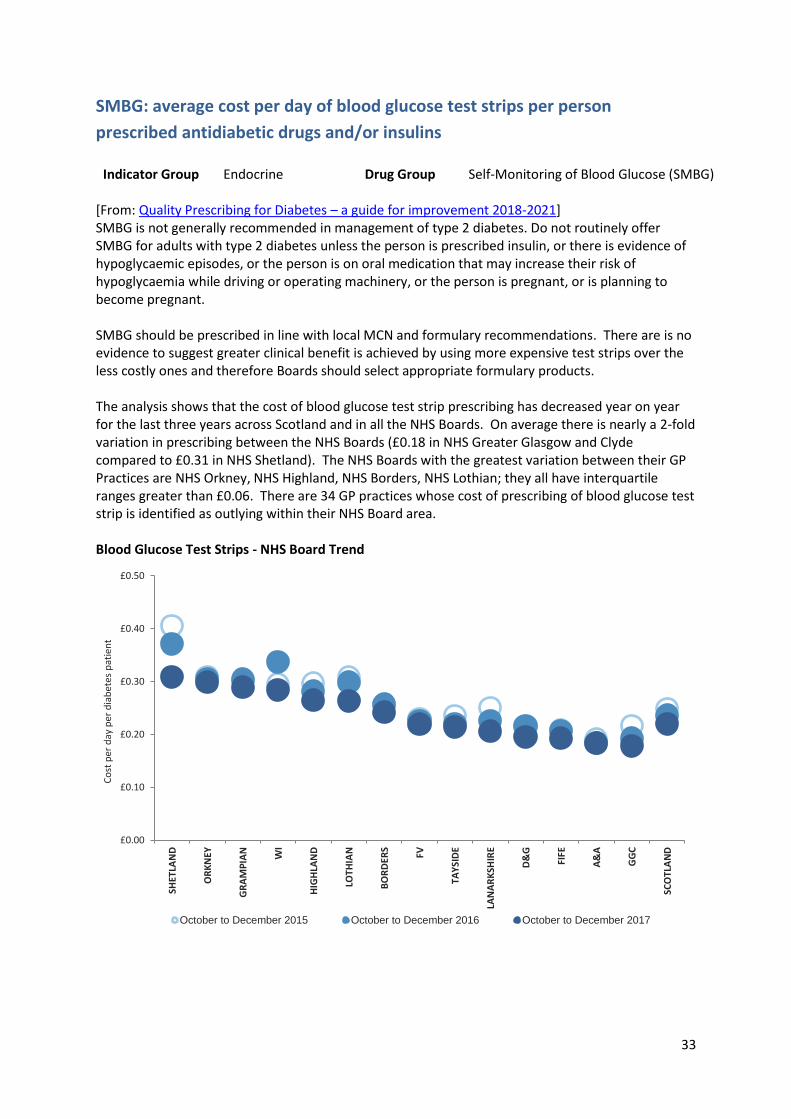
SMBG: average cost per day of blood glucose test strips per person
prescribed antidiabetic drugs and/or insulins
Indicator Group Endocrine Drug Group Self-Monitoring of Blood Glucose (SMBG) [From: Quality Prescribing for Diabetes – a guide for improvement 2018-2021] SMBG is not generally recommended in management of type 2 diabetes. Do not routinely offer SMBG for adults with type 2 diabetes unless the person is prescribed insulin, or there is evidence of hypoglycaemic episodes, or the person is on oral medication that may increase their risk of hypoglycaemia while driving or operating machinery, or the person is pregnant, or is planning to become pregnant. SMBG should be prescribed in line with local MCN and formulary recommendations. There are is no evidence to suggest greater clinical benefit is achieved by using more expensive test strips over the less costly ones and therefore Boards should select appropriate formulary products. The analysis shows that the cost of blood glucose test strip prescribing has decreased year on year for the last three years across Scotland and in all the NHS Boards. On average there is nearly a 2-fold variation in prescribing between the NHS Boards (£0.18 in NHS Greater Glasgow and Clyde compared to £0.31 in NHS Shetland). The NHS Boards with the greatest variation between their GP Practices are NHS Orkney, NHS Highland, NHS Borders, NHS Lothian; they all have interquartile ranges greater than £0.06. There are 34 GP practices whose cost of prescribing of blood glucose test strip is identified as outlying within their NHS Board area.
Blood Glucose Test Strips - NHS Board Trend
£0.00
£0.10
£0.20
£0.30
£0.40
£0.50
SHET
LAN
D
OR
KN
EY
GR
AM
PIA
N
WI
HIG
HLA
ND
LOTH
IAN
BO
RD
ERS
FV
TAY
SID
E
LAN
AR
KSH
IRE
D&
G
FIFE
A&
A
GG
C
SCO
TLA
ND
Co
st p
er d
ay p
er d
iab
etes
pat
ien
t
October to December 2015 October to December 2016 October to December 2017
34
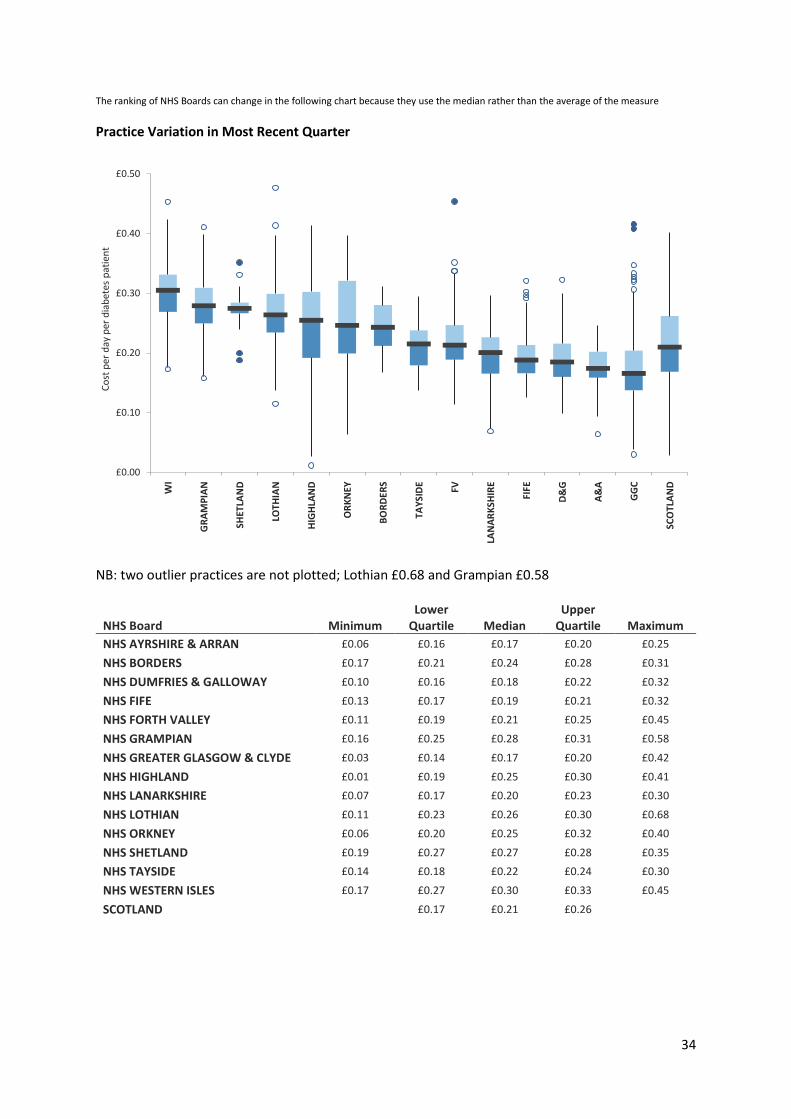
The ranking of NHS Boards can change in the following chart because they use the median rather than the average of the measure
Practice Variation in Most Recent Quarter
NB: two outlier practices are not plotted; Lothian £0.68 and Grampian £0.58
NHS Board Minimum Lower
Quartile Median Upper
Quartile Maximum
NHS AYRSHIRE & ARRAN £0.06 £0.16 £0.17 £0.20 £0.25
NHS BORDERS £0.17 £0.21 £0.24 £0.28 £0.31
NHS DUMFRIES & GALLOWAY £0.10 £0.16 £0.18 £0.22 £0.32
NHS FIFE £0.13 £0.17 £0.19 £0.21 £0.32
NHS FORTH VALLEY £0.11 £0.19 £0.21 £0.25 £0.45
NHS GRAMPIAN £0.16 £0.25 £0.28 £0.31 £0.58
NHS GREATER GLASGOW & CLYDE £0.03 £0.14 £0.17 £0.20 £0.42
NHS HIGHLAND £0.01 £0.19 £0.25 £0.30 £0.41
NHS LANARKSHIRE £0.07 £0.17 £0.20 £0.23 £0.30
NHS LOTHIAN £0.11 £0.23 £0.26 £0.30 £0.68
NHS ORKNEY £0.06 £0.20 £0.25 £0.32 £0.40
NHS SHETLAND £0.19 £0.27 £0.27 £0.28 £0.35
NHS TAYSIDE £0.14 £0.18 £0.22 £0.24 £0.30
NHS WESTERN ISLES £0.17 £0.27 £0.30 £0.33 £0.45
SCOTLAND £0.17 £0.21 £0.26
£0.00
£0.10
£0.20
£0.30
£0.40
£0.50 W
I
GR
AM
PIA
N
SH
ETLA
ND
LO
THIA
N
HIG
HLA
ND
OR
KN
EY
BO
RD
ERS
TA
YSI
DE
FV
LA
NA
RK
SHIR
E
FIF
E
D&
G
A&
A
GG
C
SC
OTL
AN
D
Co
st p
er d
ay p
er d
iab
etes
pat
ien
t
35
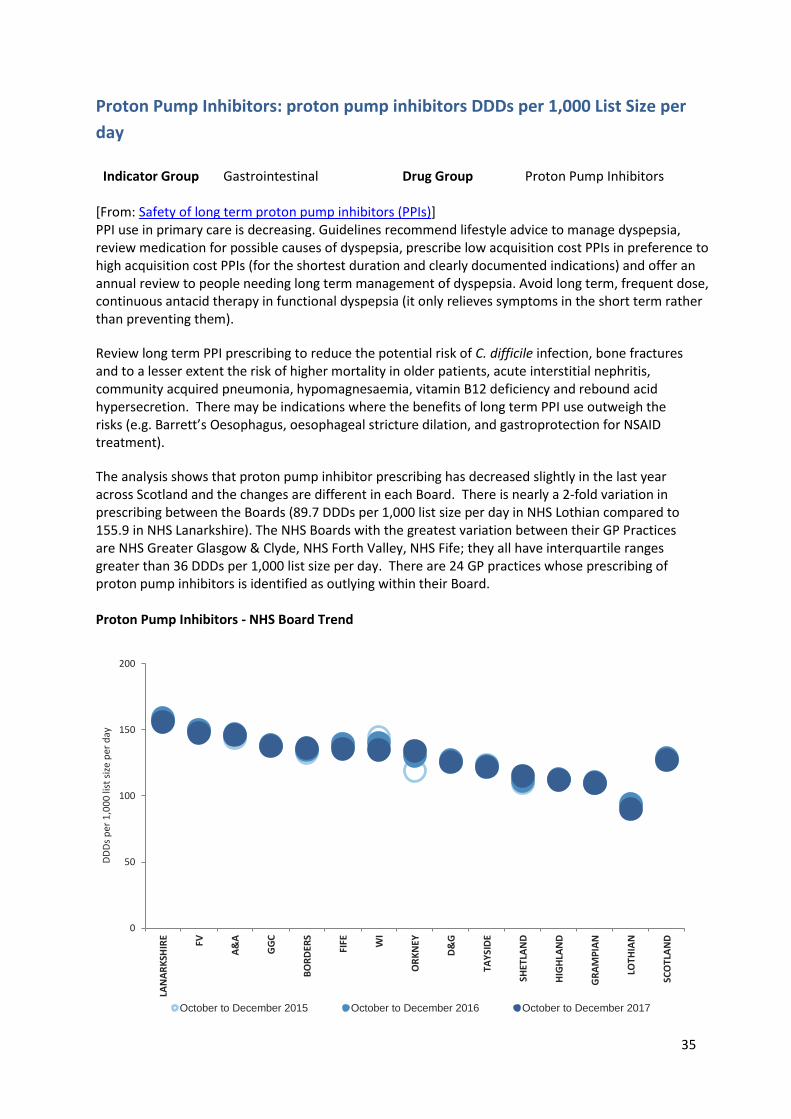
Proton Pump Inhibitors: proton pump inhibitors DDDs per 1,000 List Size per
day
Indicator Group Gastrointestinal Drug Group Proton Pump Inhibitors [From: Safety of long term proton pump inhibitors (PPIs)] PPI use in primary care is decreasing. Guidelines recommend lifestyle advice to manage dyspepsia, review medication for possible causes of dyspepsia, prescribe low acquisition cost PPIs in preference to high acquisition cost PPIs (for the shortest duration and clearly documented indications) and offer an annual review to people needing long term management of dyspepsia. Avoid long term, frequent dose, continuous antacid therapy in functional dyspepsia (it only relieves symptoms in the short term rather than preventing them).
Review long term PPI prescribing to reduce the potential risk of C. difficile infection, bone fractures and to a lesser extent the risk of higher mortality in older patients, acute interstitial nephritis, community acquired pneumonia, hypomagnesaemia, vitamin B12 deficiency and rebound acid hypersecretion. There may be indications where the benefits of long term PPI use outweigh the risks (e.g. Barrett’s Oesophagus, oesophageal stricture dilation, and gastroprotection for NSAID treatment).
The analysis shows that proton pump inhibitor prescribing has decreased slightly in the last year across Scotland and the changes are different in each Board. There is nearly a 2-fold variation in prescribing between the Boards (89.7 DDDs per 1,000 list size per day in NHS Lothian compared to 155.9 in NHS Lanarkshire). The NHS Boards with the greatest variation between their GP Practices are NHS Greater Glasgow & Clyde, NHS Forth Valley, NHS Fife; they all have interquartile ranges greater than 36 DDDs per 1,000 list size per day. There are 24 GP practices whose prescribing of proton pump inhibitors is identified as outlying within their Board.
Proton Pump Inhibitors - NHS Board Trend
0
50
100
150
200
LAN
AR
KSH
IRE
FV
A&
A
GG
C
BO
RD
ERS
FIFE W
I
OR
KN
EY
D&
G
TAY
SID
E
SHET
LAN
D
HIG
HLA
ND
GR
AM
PIA
N
LOTH
IAN
SCO
TLA
ND
DD
Ds
per
1,0
00
list
siz
e p
er d
ay
October to December 2015 October to December 2016 October to December 2017
36
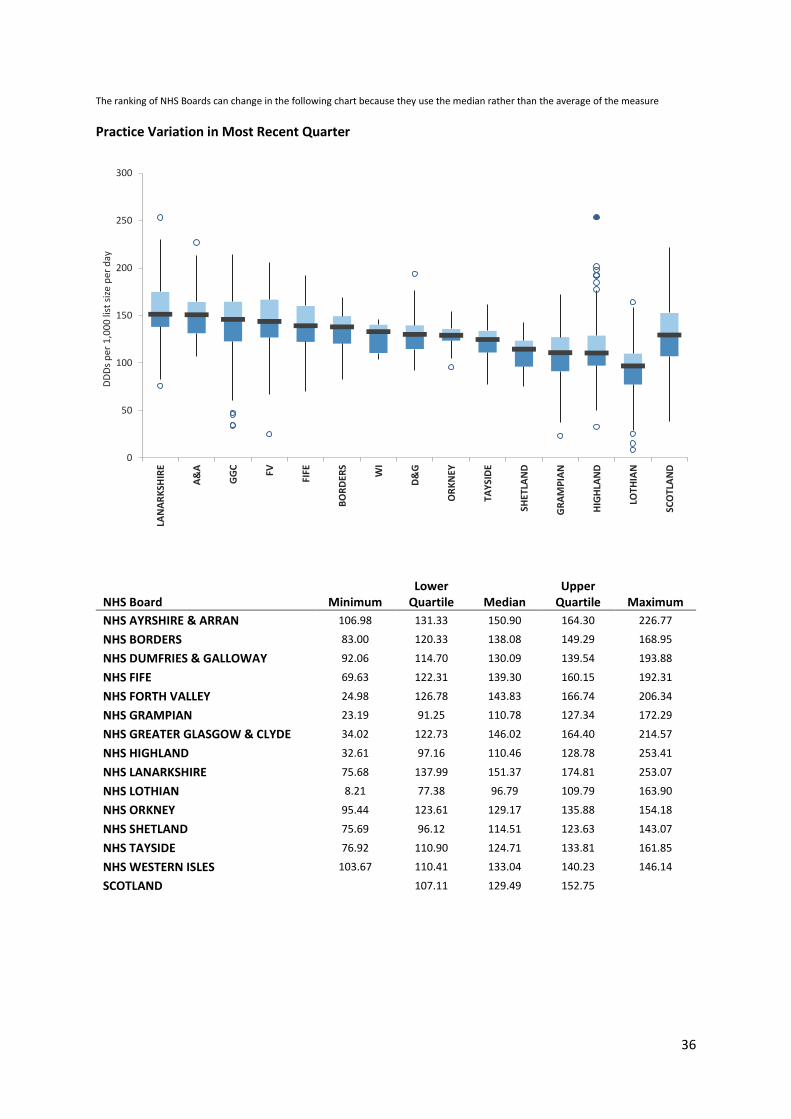
The ranking of NHS Boards can change in the following chart because they use the median rather than the average of the measure
Practice Variation in Most Recent Quarter
NHS Board Minimum Lower
Quartile Median Upper
Quartile Maximum
NHS AYRSHIRE & ARRAN 106.98 131.33 150.90 164.30 226.77
NHS BORDERS 83.00 120.33 138.08 149.29 168.95
NHS DUMFRIES & GALLOWAY 92.06 114.70 130.09 139.54 193.88
NHS FIFE 69.63 122.31 139.30 160.15 192.31
NHS FORTH VALLEY 24.98 126.78 143.83 166.74 206.34
NHS GRAMPIAN 23.19 91.25 110.78 127.34 172.29
NHS GREATER GLASGOW & CLYDE 34.02 122.73 146.02 164.40 214.57
NHS HIGHLAND 32.61 97.16 110.46 128.78 253.41
NHS LANARKSHIRE 75.68 137.99 151.37 174.81 253.07
NHS LOTHIAN 8.21 77.38 96.79 109.79 163.90
NHS ORKNEY 95.44 123.61 129.17 135.88 154.18
NHS SHETLAND 75.69 96.12 114.51 123.63 143.07
NHS TAYSIDE 76.92 110.90 124.71 133.81 161.85
NHS WESTERN ISLES 103.67 110.41 133.04 140.23 146.14
SCOTLAND 107.11 129.49 152.75
0
50
100
150
200
250
300
LAN
AR
KSH
IRE
A&
A
GG
C
FV
FIFE
BO
RD
ERS
WI
D&
G
OR
KN
EY
TAY
SID
E
SHET
LAN
D
GR
AM
PIA
N
HIG
HLA
ND
LOTH
IAN
SCO
TLA
ND
DD
Ds
per
1,0
00
list
siz
e p
er d
ay
37
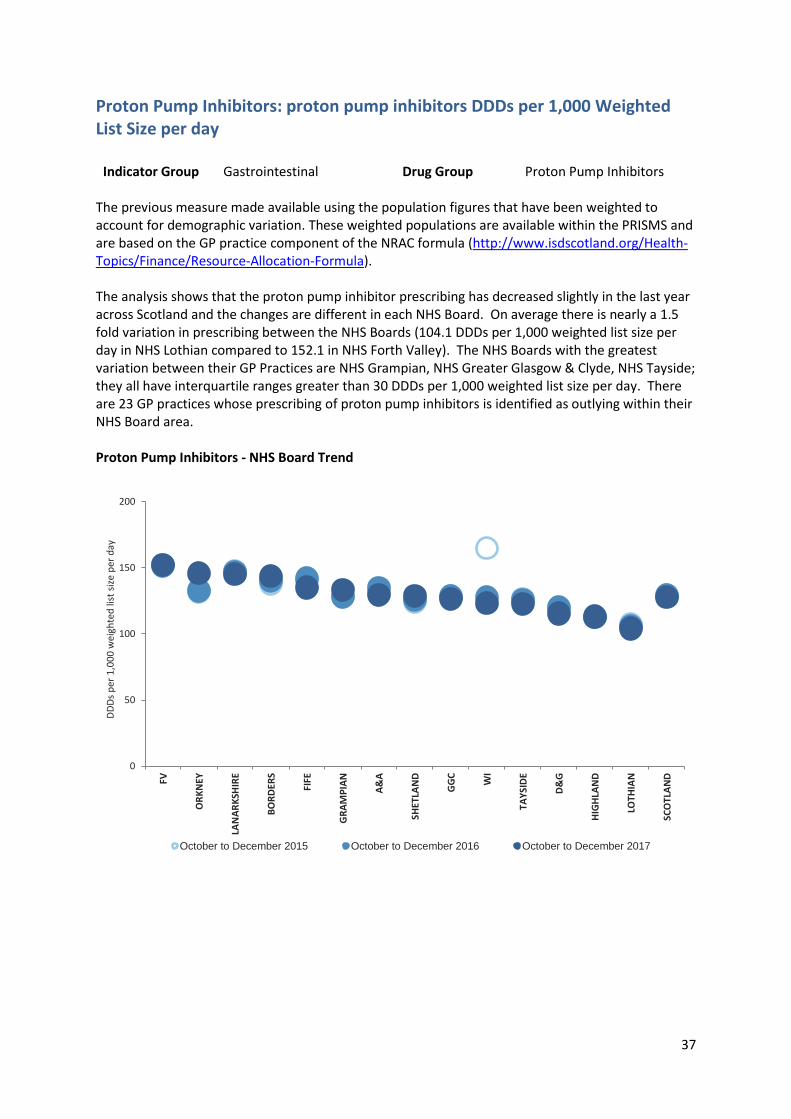
Proton Pump Inhibitors: proton pump inhibitors DDDs per 1,000 Weighted List Size per day
Indicator Group Gastrointestinal Drug Group Proton Pump Inhibitors The previous measure made available using the population figures that have been weighted to account for demographic variation. These weighted populations are available within the PRISMS and are based on the GP practice component of the NRAC formula (http://www.isdscotland.org/Health-Topics/Finance/Resource-Allocation-Formula). The analysis shows that the proton pump inhibitor prescribing has decreased slightly in the last year across Scotland and the changes are different in each NHS Board. On average there is nearly a 1.5 fold variation in prescribing between the NHS Boards (104.1 DDDs per 1,000 weighted list size per day in NHS Lothian compared to 152.1 in NHS Forth Valley). The NHS Boards with the greatest variation between their GP Practices are NHS Grampian, NHS Greater Glasgow & Clyde, NHS Tayside; they all have interquartile ranges greater than 30 DDDs per 1,000 weighted list size per day. There are 23 GP practices whose prescribing of proton pump inhibitors is identified as outlying within their NHS Board area. Proton Pump Inhibitors - NHS Board Trend
0
50
100
150
200
FV
OR
KN
EY
LAN
AR
KSH
IRE
BO
RD
ERS
FIFE
GR
AM
PIA
N
A&
A
SHET
LAN
D
GG
C
WI
TAY
SID
E
D&
G
HIG
HLA
ND
LOTH
IAN
SCO
TLA
ND
DD
Ds
per
1,0
00
wei
ghte
d li
st s
ize
per
day
October to December 2015 October to December 2016 October to December 2017
38
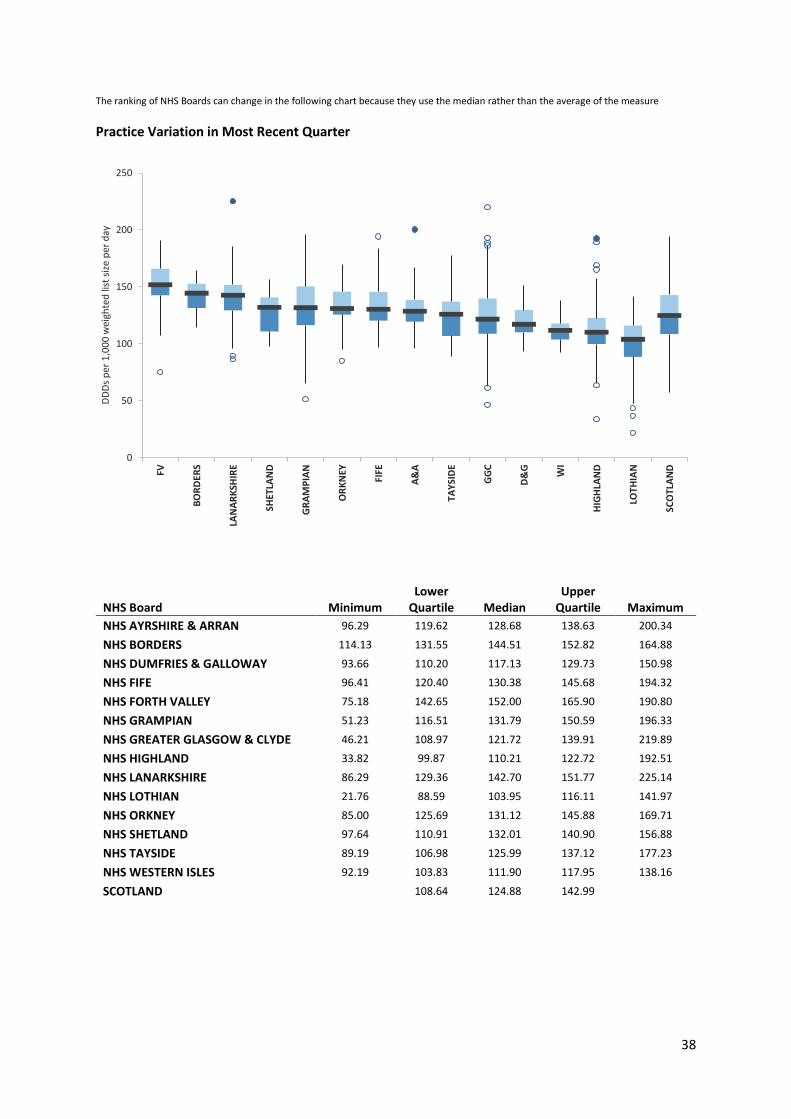
The ranking of NHS Boards can change in the following chart because they use the median rather than the average of the measure
Practice Variation in Most Recent Quarter
NHS Board Minimum Lower
Quartile Median Upper
Quartile Maximum
NHS AYRSHIRE & ARRAN 96.29 119.62 128.68 138.63 200.34
NHS BORDERS 114.13 131.55 144.51 152.82 164.88
NHS DUMFRIES & GALLOWAY 93.66 110.20 117.13 129.73 150.98
NHS FIFE 96.41 120.40 130.38 145.68 194.32
NHS FORTH VALLEY 75.18 142.65 152.00 165.90 190.80
NHS GRAMPIAN 51.23 116.51 131.79 150.59 196.33
NHS GREATER GLASGOW & CLYDE 46.21 108.97 121.72 139.91 219.89
NHS HIGHLAND 33.82 99.87 110.21 122.72 192.51
NHS LANARKSHIRE 86.29 129.36 142.70 151.77 225.14
NHS LOTHIAN 21.76 88.59 103.95 116.11 141.97
NHS ORKNEY 85.00 125.69 131.12 145.88 169.71
NHS SHETLAND 97.64 110.91 132.01 140.90 156.88
NHS TAYSIDE 89.19 106.98 125.99 137.12 177.23
NHS WESTERN ISLES 92.19 103.83 111.90 117.95 138.16
SCOTLAND 108.64 124.88 142.99
0
50
100
150
200
250
FV
BO
RD
ERS
LAN
AR
KSH
IRE
SHET
LAN
D
GR
AM
PIA
N
OR
KN
EY
FIFE
A&
A
TAY
SID
E
GG
C
D&
G
WI
HIG
HLA
ND
LOTH
IAN
SCO
TLA
ND
DD
Ds
per
1,0
00
wei
ghte
d li
st s
ize
per
day
39
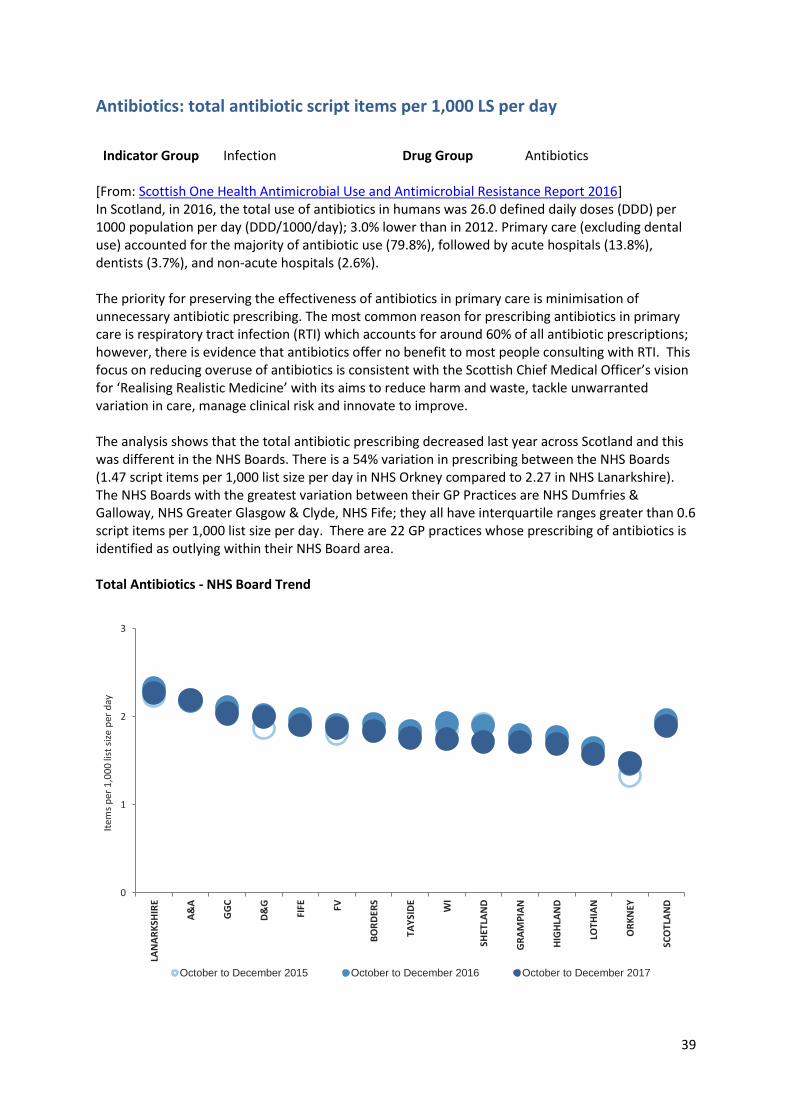
Antibiotics: total antibiotic script items per 1,000 LS per day
Indicator Group Infection Drug Group Antibiotics
[From: Scottish One Health Antimicrobial Use and Antimicrobial Resistance Report 2016] In Scotland, in 2016, the total use of antibiotics in humans was 26.0 defined daily doses (DDD) per 1000 population per day (DDD/1000/day); 3.0% lower than in 2012. Primary care (excluding dental use) accounted for the majority of antibiotic use (79.8%), followed by acute hospitals (13.8%), dentists (3.7%), and non-acute hospitals (2.6%). The priority for preserving the effectiveness of antibiotics in primary care is minimisation of unnecessary antibiotic prescribing. The most common reason for prescribing antibiotics in primary care is respiratory tract infection (RTI) which accounts for around 60% of all antibiotic prescriptions; however, there is evidence that antibiotics offer no benefit to most people consulting with RTI. This focus on reducing overuse of antibiotics is consistent with the Scottish Chief Medical Officer’s vision for ‘Realising Realistic Medicine’ with its aims to reduce harm and waste, tackle unwarranted variation in care, manage clinical risk and innovate to improve. The analysis shows that the total antibiotic prescribing decreased last year across Scotland and this was different in the NHS Boards. There is a 54% variation in prescribing between the NHS Boards (1.47 script items per 1,000 list size per day in NHS Orkney compared to 2.27 in NHS Lanarkshire). The NHS Boards with the greatest variation between their GP Practices are NHS Dumfries & Galloway, NHS Greater Glasgow & Clyde, NHS Fife; they all have interquartile ranges greater than 0.6 script items per 1,000 list size per day. There are 22 GP practices whose prescribing of antibiotics is identified as outlying within their NHS Board area. Total Antibiotics - NHS Board Trend
0
1
2
3
LAN
AR
KSH
IRE
A&
A
GG
C
D&
G
FIFE FV
BO
RD
ERS
TAY
SID
E
WI
SHET
LAN
D
GR
AM
PIA
N
HIG
HLA
ND
LOTH
IAN
OR
KN
EY
SCO
TLA
ND
Item
s p
er 1
,00
0 li
st s
ize
per
day
October to December 2015 October to December 2016 October to December 2017
40
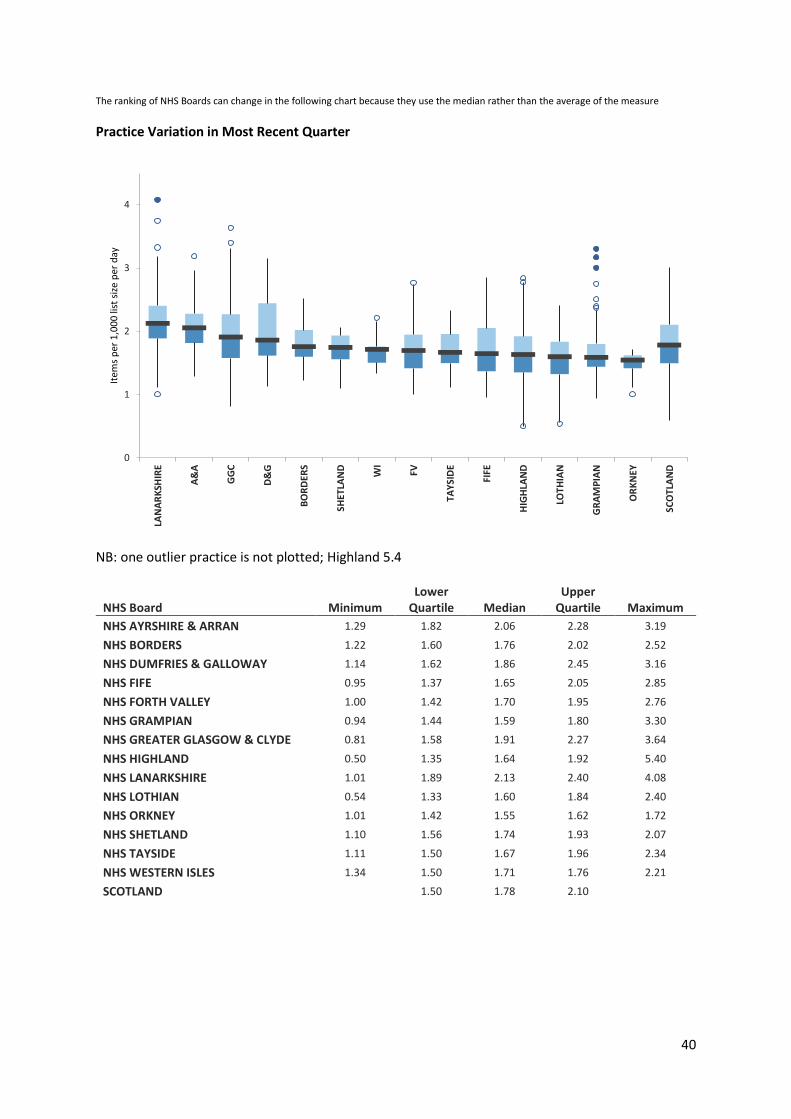
The ranking of NHS Boards can change in the following chart because they use the median rather than the average of the measure
Practice Variation in Most Recent Quarter
NB: one outlier practice is not plotted; Highland 5.4
NHS Board Minimum Lower
Quartile Median Upper
Quartile Maximum
NHS AYRSHIRE & ARRAN 1.29 1.82 2.06 2.28 3.19
NHS BORDERS 1.22 1.60 1.76 2.02 2.52
NHS DUMFRIES & GALLOWAY 1.14 1.62 1.86 2.45 3.16
NHS FIFE 0.95 1.37 1.65 2.05 2.85
NHS FORTH VALLEY 1.00 1.42 1.70 1.95 2.76
NHS GRAMPIAN 0.94 1.44 1.59 1.80 3.30
NHS GREATER GLASGOW & CLYDE 0.81 1.58 1.91 2.27 3.64
NHS HIGHLAND 0.50 1.35 1.64 1.92 5.40
NHS LANARKSHIRE 1.01 1.89 2.13 2.40 4.08
NHS LOTHIAN 0.54 1.33 1.60 1.84 2.40
NHS ORKNEY 1.01 1.42 1.55 1.62 1.72
NHS SHETLAND 1.10 1.56 1.74 1.93 2.07
NHS TAYSIDE 1.11 1.50 1.67 1.96 2.34
NHS WESTERN ISLES 1.34 1.50 1.71 1.76 2.21
SCOTLAND 1.50 1.78 2.10
0
1
2
3
4
LAN
AR
KSH
IRE
A&
A
GG
C
D&
G
BO
RD
ERS
SHET
LAN
D
WI
FV
TAY
SID
E
FIFE
HIG
HLA
ND
LOTH
IAN
GR
AM
PIA
N
OR
KN
EY
SCO
TLA
ND
Item
s p
er 1
,00
0 li
st s
ize
per
day
41
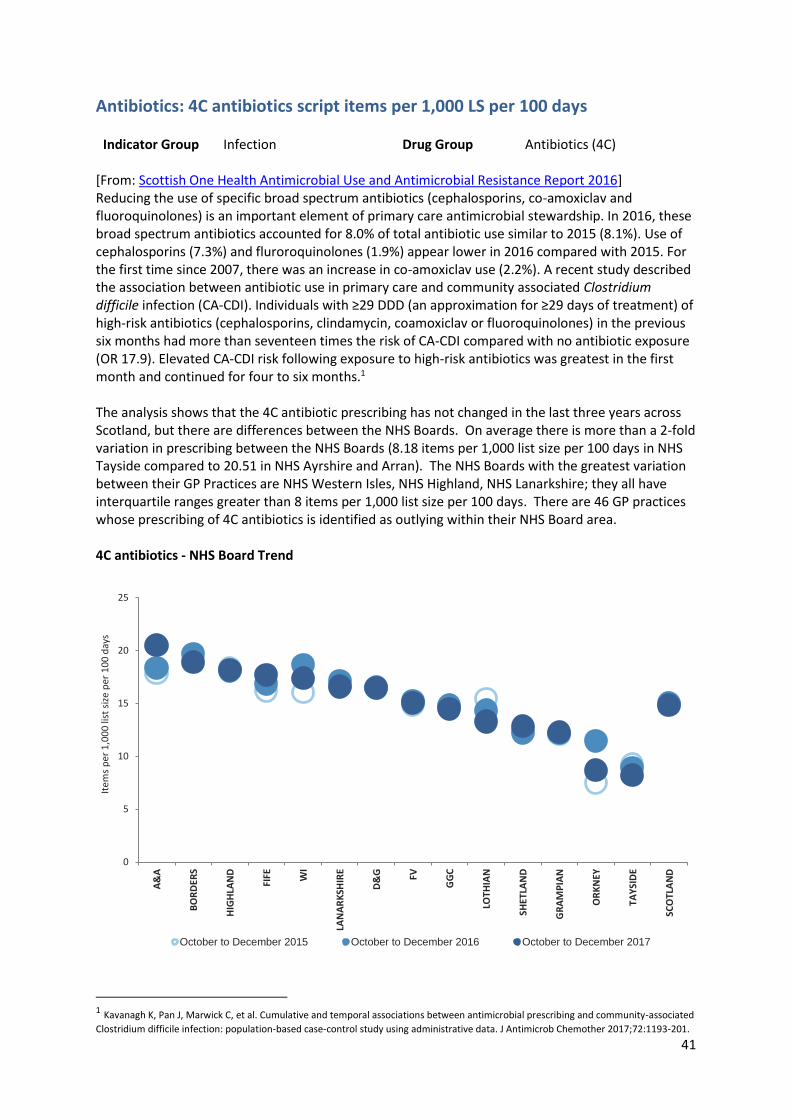
Antibiotics: 4C antibiotics script items per 1,000 LS per 100 days
Indicator Group Infection Drug Group Antibiotics (4C)
[From: Scottish One Health Antimicrobial Use and Antimicrobial Resistance Report 2016] Reducing the use of specific broad spectrum antibiotics (cephalosporins, co-amoxiclav and fluoroquinolones) is an important element of primary care antimicrobial stewardship. In 2016, these broad spectrum antibiotics accounted for 8.0% of total antibiotic use similar to 2015 (8.1%). Use of cephalosporins (7.3%) and fluroroquinolones (1.9%) appear lower in 2016 compared with 2015. For the first time since 2007, there was an increase in co-amoxiclav use (2.2%). A recent study described the association between antibiotic use in primary care and community associated Clostridium difficile infection (CA-CDI). Individuals with ≥29 DDD (an approximation for ≥29 days of treatment) of high-risk antibiotics (cephalosporins, clindamycin, coamoxiclav or fluoroquinolones) in the previous six months had more than seventeen times the risk of CA-CDI compared with no antibiotic exposure (OR 17.9). Elevated CA-CDI risk following exposure to high-risk antibiotics was greatest in the first month and continued for four to six months.1 The analysis shows that the 4C antibiotic prescribing has not changed in the last three years across Scotland, but there are differences between the NHS Boards. On average there is more than a 2-fold variation in prescribing between the NHS Boards (8.18 items per 1,000 list size per 100 days in NHS Tayside compared to 20.51 in NHS Ayrshire and Arran). The NHS Boards with the greatest variation between their GP Practices are NHS Western Isles, NHS Highland, NHS Lanarkshire; they all have interquartile ranges greater than 8 items per 1,000 list size per 100 days. There are 46 GP practices whose prescribing of 4C antibiotics is identified as outlying within their NHS Board area. 4C antibiotics - NHS Board Trend
1 Kavanagh K, Pan J, Marwick C, et al. Cumulative and temporal associations between antimicrobial prescribing and community-associated
Clostridium difficile infection: population-based case-control study using administrative data. J Antimicrob Chemother 2017;72:1193-201.
0
5
10
15
20
25
A&
A
BO
RD
ERS
HIG
HLA
ND
FIFE W
I
LAN
AR
KSH
IRE
D&
G FV
GG
C
LOTH
IAN
SHET
LAN
D
GR
AM
PIA
N
OR
KN
EY
TAY
SID
E
SCO
TLA
ND
Item
s p
er 1
,00
0 li
st s
ize
per
10
0 d
ays
October to December 2015 October to December 2016 October to December 2017
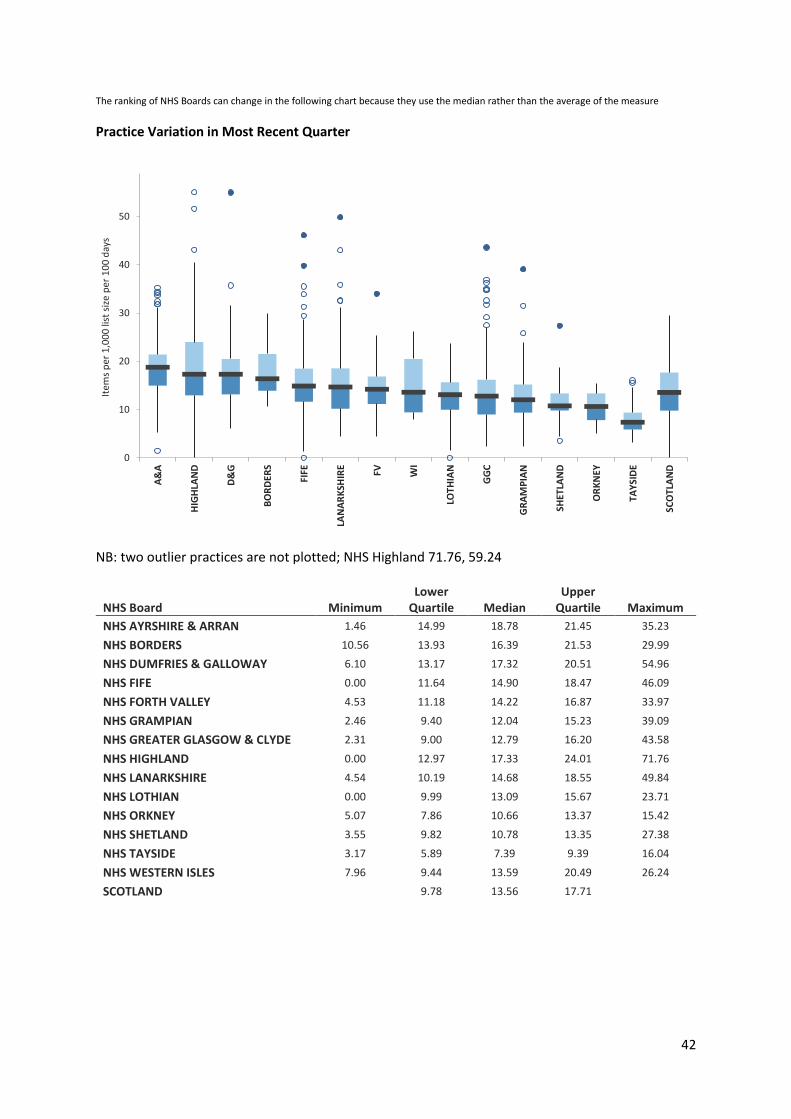
42
The ranking of NHS Boards can change in the following chart because they use the median rather than the average of the measure
Practice Variation in Most Recent Quarter
NB: two outlier practices are not plotted; NHS Highland 71.76, 59.24
NHS Board Minimum Lower
Quartile Median Upper
Quartile Maximum
NHS AYRSHIRE & ARRAN 1.46 14.99 18.78 21.45 35.23
NHS BORDERS 10.56 13.93 16.39 21.53 29.99
NHS DUMFRIES & GALLOWAY 6.10 13.17 17.32 20.51 54.96
NHS FIFE 0.00 11.64 14.90 18.47 46.09
NHS FORTH VALLEY 4.53 11.18 14.22 16.87 33.97
NHS GRAMPIAN 2.46 9.40 12.04 15.23 39.09
NHS GREATER GLASGOW & CLYDE 2.31 9.00 12.79 16.20 43.58
NHS HIGHLAND 0.00 12.97 17.33 24.01 71.76
NHS LANARKSHIRE 4.54 10.19 14.68 18.55 49.84
NHS LOTHIAN 0.00 9.99 13.09 15.67 23.71
NHS ORKNEY 5.07 7.86 10.66 13.37 15.42
NHS SHETLAND 3.55 9.82 10.78 13.35 27.38
NHS TAYSIDE 3.17 5.89 7.39 9.39 16.04
NHS WESTERN ISLES 7.96 9.44 13.59 20.49 26.24
SCOTLAND 9.78 13.56 17.71
0
10
20
30
40
50
A&
A
HIG
HLA
ND
D&
G
BO
RD
ERS
FIFE
LAN
AR
KSH
IRE
FV WI
LOTH
IAN
GG
C
GR
AM
PIA
N
SHET
LAN
D
OR
KN
EY
TAY
SID
E
SCO
TLA
ND
Item
s p
er 1
,00
0 li
st s
ize
per
10
0 d
ays
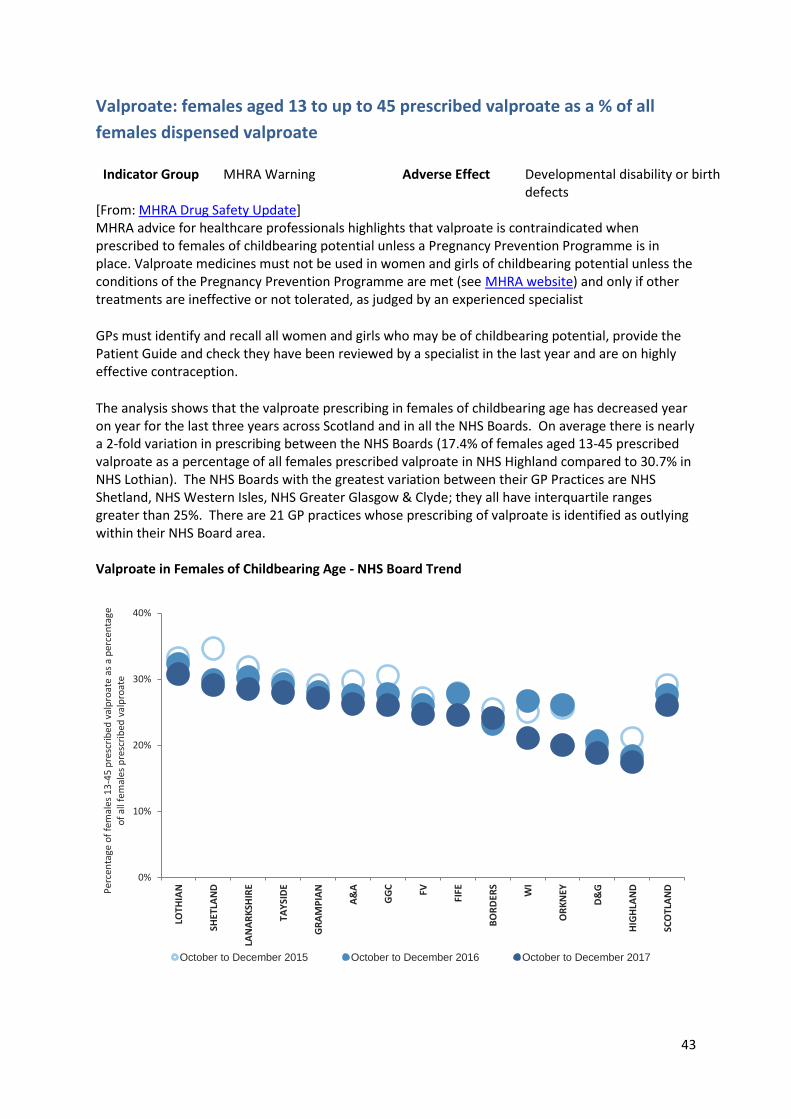
43
Valproate: females aged 13 to up to 45 prescribed valproate as a % of all
females dispensed valproate
Indicator Group MHRA Warning Adverse Effect Developmental disability or birth defects
[From: MHRA Drug Safety Update] MHRA advice for healthcare professionals highlights that valproate is contraindicated when prescribed to females of childbearing potential unless a Pregnancy Prevention Programme is in place. Valproate medicines must not be used in women and girls of childbearing potential unless the conditions of the Pregnancy Prevention Programme are met (see MHRA website) and only if other treatments are ineffective or not tolerated, as judged by an experienced specialist
GPs must identify and recall all women and girls who may be of childbearing potential, provide the Patient Guide and check they have been reviewed by a specialist in the last year and are on highly effective contraception.
The analysis shows that the valproate prescribing in females of childbearing age has decreased year on year for the last three years across Scotland and in all the NHS Boards. On average there is nearly a 2-fold variation in prescribing between the NHS Boards (17.4% of females aged 13-45 prescribed valproate as a percentage of all females prescribed valproate in NHS Highland compared to 30.7% in NHS Lothian). The NHS Boards with the greatest variation between their GP Practices are NHS Shetland, NHS Western Isles, NHS Greater Glasgow & Clyde; they all have interquartile ranges greater than 25%. There are 21 GP practices whose prescribing of valproate is identified as outlying within their NHS Board area. Valproate in Females of Childbearing Age - NHS Board Trend
0%
10%
20%
30%
40%
LOTH
IAN
SHET
LAN
D
LAN
AR
KSH
IRE
TAY
SID
E
GR
AM
PIA
N
A&
A
GG
C
FV
FIFE
BO
RD
ERS
WI
OR
KN
EY
D&
G
HIG
HLA
ND
SCO
TLA
NDPer
cen
tage
of
fem
ales
13
-45
pre
scri
bed
val
pro
ate
as a
per
cen
tage
o
f al
l fem
ales
pre
scri
bed
val
pro
ate
October to December 2015 October to December 2016 October to December 2017
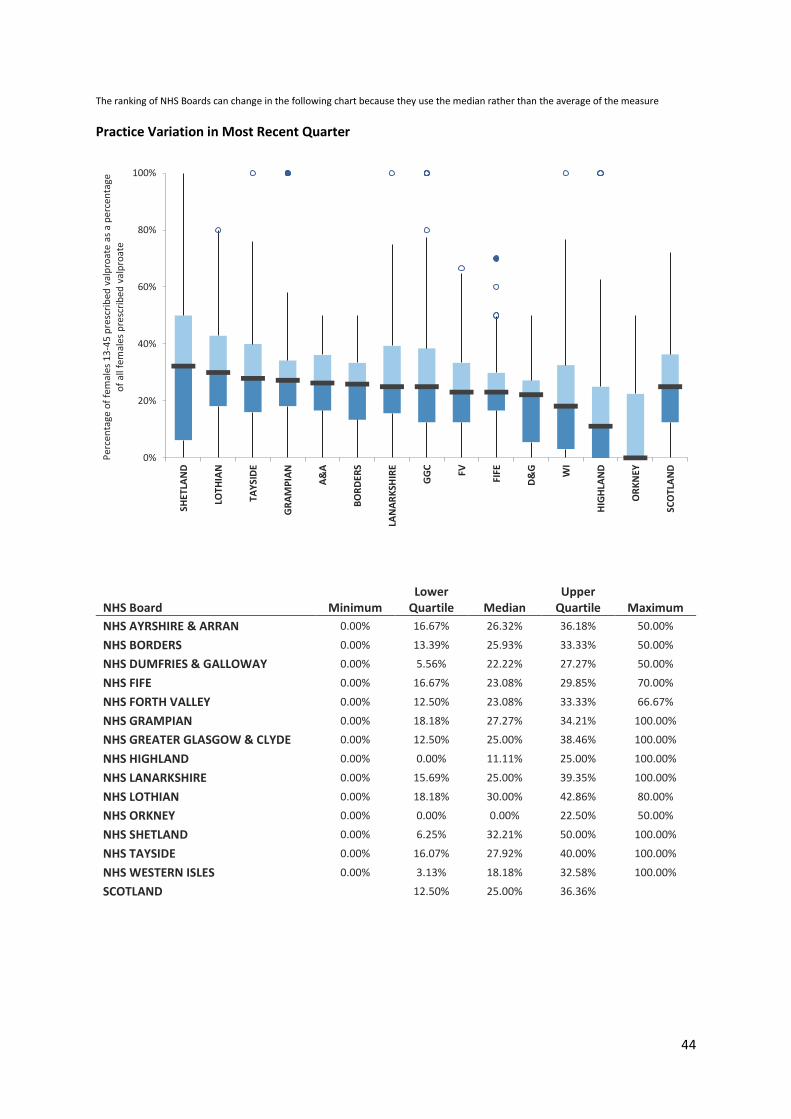
44
The ranking of NHS Boards can change in the following chart because they use the median rather than the average of the measure
Practice Variation in Most Recent Quarter
NHS Board Minimum Lower
Quartile Median Upper
Quartile Maximum
NHS AYRSHIRE & ARRAN 0.00% 16.67% 26.32% 36.18% 50.00%
NHS BORDERS 0.00% 13.39% 25.93% 33.33% 50.00%
NHS DUMFRIES & GALLOWAY 0.00% 5.56% 22.22% 27.27% 50.00%
NHS FIFE 0.00% 16.67% 23.08% 29.85% 70.00%
NHS FORTH VALLEY 0.00% 12.50% 23.08% 33.33% 66.67%
NHS GRAMPIAN 0.00% 18.18% 27.27% 34.21% 100.00%
NHS GREATER GLASGOW & CLYDE 0.00% 12.50% 25.00% 38.46% 100.00%
NHS HIGHLAND 0.00% 0.00% 11.11% 25.00% 100.00%
NHS LANARKSHIRE 0.00% 15.69% 25.00% 39.35% 100.00%
NHS LOTHIAN 0.00% 18.18% 30.00% 42.86% 80.00%
NHS ORKNEY 0.00% 0.00% 0.00% 22.50% 50.00%
NHS SHETLAND 0.00% 6.25% 32.21% 50.00% 100.00%
NHS TAYSIDE 0.00% 16.07% 27.92% 40.00% 100.00%
NHS WESTERN ISLES 0.00% 3.13% 18.18% 32.58% 100.00%
SCOTLAND 12.50% 25.00% 36.36%
0%
20%
40%
60%
80%
100%SH
ETLA
ND
LOTH
IAN
TAY
SID
E
GR
AM
PIA
N
A&
A
BO
RD
ERS
LAN
AR
KSH
IRE
GG
C
FV
FIFE
D&
G
WI
HIG
HLA
ND
OR
KN
EY
SCO
TLA
ND
Per
cen
tage
of
fem
ales
13
-45
pre
scri
bed
val
pro
ate
as a
per
cen
tage
o
f al
l fem
ales
pre
scri
bed
val
pro
ate
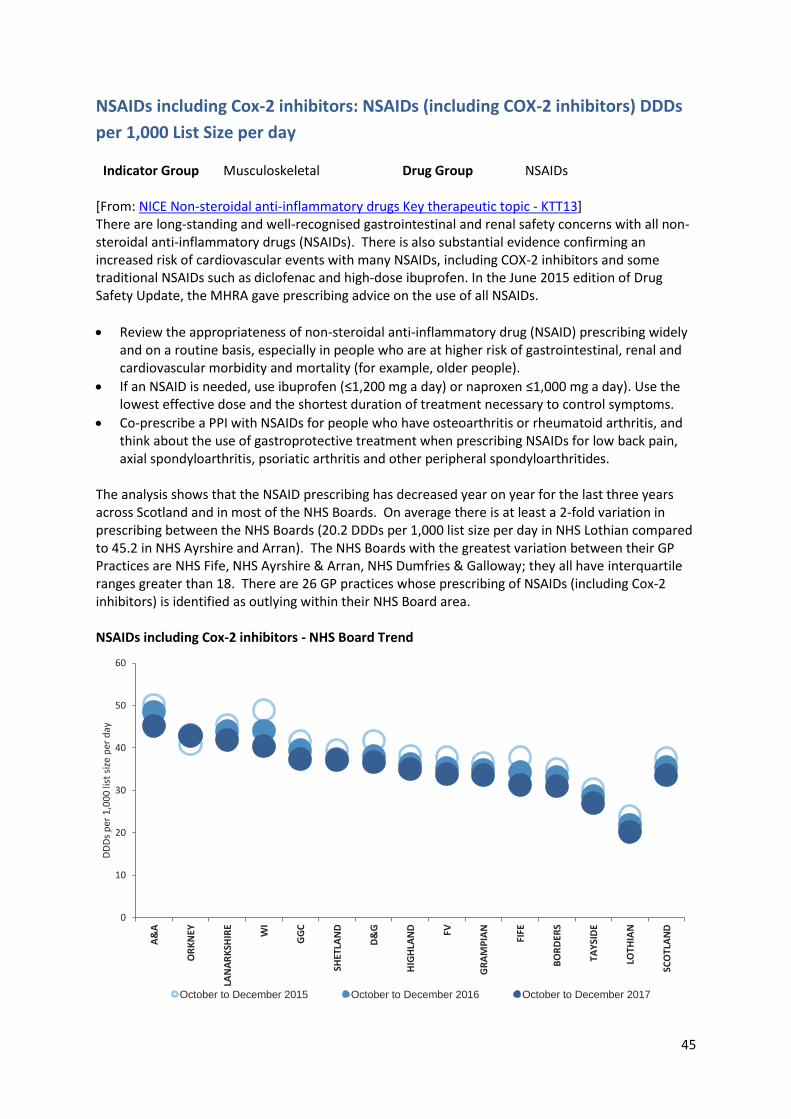
45
NSAIDs including Cox-2 inhibitors: NSAIDs (including COX-2 inhibitors) DDDs
per 1,000 List Size per day
Indicator Group Musculoskeletal Drug Group NSAIDs [From: NICE Non-steroidal anti-inflammatory drugs Key therapeutic topic - KTT13] There are long-standing and well-recognised gastrointestinal and renal safety concerns with all non-steroidal anti-inflammatory drugs (NSAIDs). There is also substantial evidence confirming an increased risk of cardiovascular events with many NSAIDs, including COX-2 inhibitors and some traditional NSAIDs such as diclofenac and high-dose ibuprofen. In the June 2015 edition of Drug Safety Update, the MHRA gave prescribing advice on the use of all NSAIDs.
Review the appropriateness of non-steroidal anti-inflammatory drug (NSAID) prescribing widely and on a routine basis, especially in people who are at higher risk of gastrointestinal, renal and cardiovascular morbidity and mortality (for example, older people).
If an NSAID is needed, use ibuprofen (≤1,200 mg a day) or naproxen ≤1,000 mg a day). Use the lowest effective dose and the shortest duration of treatment necessary to control symptoms.
Co-prescribe a PPI with NSAIDs for people who have osteoarthritis or rheumatoid arthritis, and think about the use of gastroprotective treatment when prescribing NSAIDs for low back pain, axial spondyloarthritis, psoriatic arthritis and other peripheral spondyloarthritides.
The analysis shows that the NSAID prescribing has decreased year on year for the last three years across Scotland and in most of the NHS Boards. On average there is at least a 2-fold variation in prescribing between the NHS Boards (20.2 DDDs per 1,000 list size per day in NHS Lothian compared to 45.2 in NHS Ayrshire and Arran). The NHS Boards with the greatest variation between their GP Practices are NHS Fife, NHS Ayrshire & Arran, NHS Dumfries & Galloway; they all have interquartile ranges greater than 18. There are 26 GP practices whose prescribing of NSAIDs (including Cox-2 inhibitors) is identified as outlying within their NHS Board area. NSAIDs including Cox-2 inhibitors - NHS Board Trend
0
10
20
30
40
50
60
A&
A
OR
KN
EY
LAN
AR
KSH
IRE
WI
GG
C
SHET
LAN
D
D&
G
HIG
HLA
ND FV
GR
AM
PIA
N
FIFE
BO
RD
ERS
TAY
SID
E
LOTH
IAN
SCO
TLA
ND
DD
Ds
per
1,0
00
list
siz
e p
er d
ay
October to December 2015 October to December 2016 October to December 2017
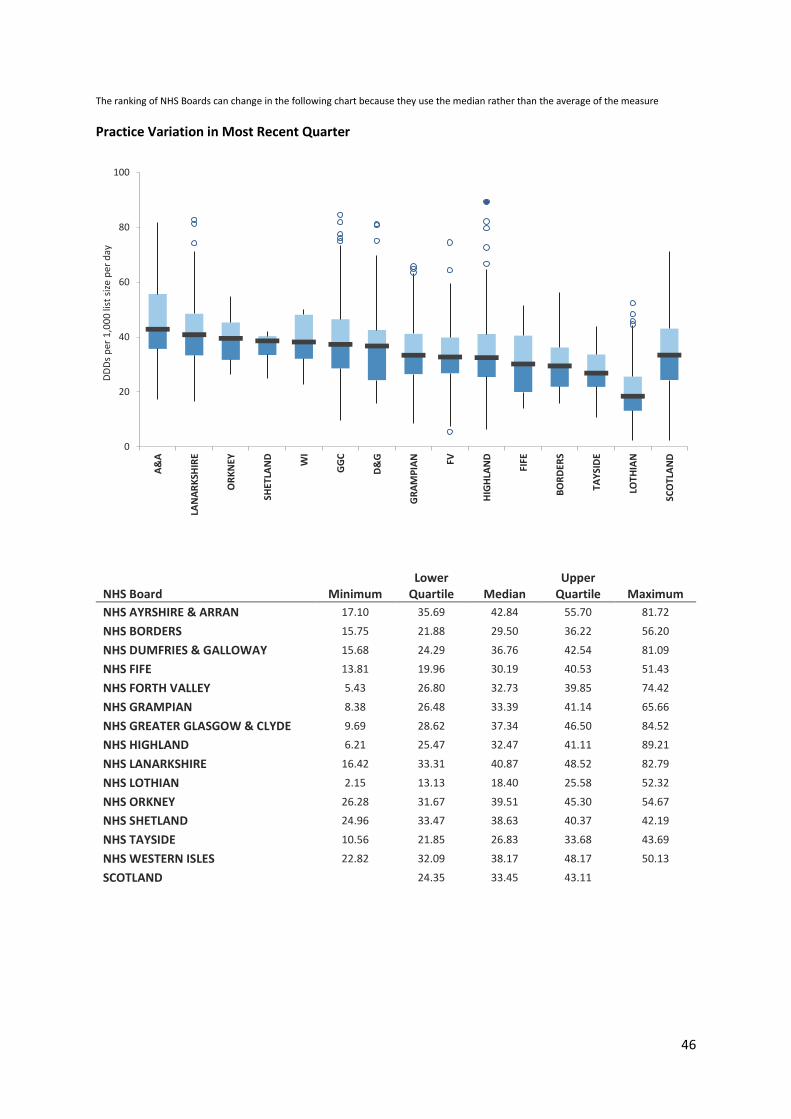
46
The ranking of NHS Boards can change in the following chart because they use the median rather than the average of the measure
Practice Variation in Most Recent Quarter
NHS Board Minimum Lower
Quartile Median Upper
Quartile Maximum
NHS AYRSHIRE & ARRAN 17.10 35.69 42.84 55.70 81.72
NHS BORDERS 15.75 21.88 29.50 36.22 56.20
NHS DUMFRIES & GALLOWAY 15.68 24.29 36.76 42.54 81.09
NHS FIFE 13.81 19.96 30.19 40.53 51.43
NHS FORTH VALLEY 5.43 26.80 32.73 39.85 74.42
NHS GRAMPIAN 8.38 26.48 33.39 41.14 65.66
NHS GREATER GLASGOW & CLYDE 9.69 28.62 37.34 46.50 84.52
NHS HIGHLAND 6.21 25.47 32.47 41.11 89.21
NHS LANARKSHIRE 16.42 33.31 40.87 48.52 82.79
NHS LOTHIAN 2.15 13.13 18.40 25.58 52.32
NHS ORKNEY 26.28 31.67 39.51 45.30 54.67
NHS SHETLAND 24.96 33.47 38.63 40.37 42.19
NHS TAYSIDE 10.56 21.85 26.83 33.68 43.69
NHS WESTERN ISLES 22.82 32.09 38.17 48.17 50.13
SCOTLAND 24.35 33.45 43.11
0
20
40
60
80
100
A&
A
LAN
AR
KSH
IRE
OR
KN
EY
SHET
LAN
D
WI
GG
C
D&
G
GR
AM
PIA
N FV
HIG
HLA
ND
FIFE
BO
RD
ERS
TAY
SID
E
LOTH
IAN
SCO
TLA
ND
DD
Ds
per
1,0
00
list
siz
e p
er d
ay
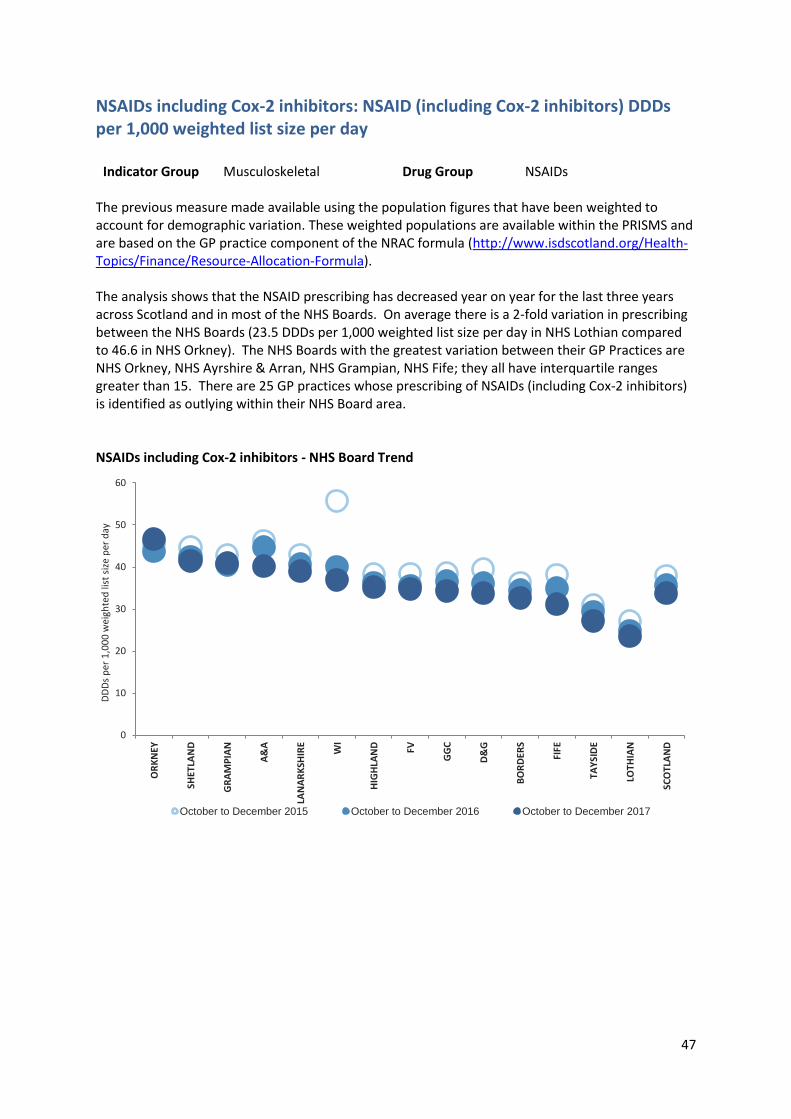
47
NSAIDs including Cox-2 inhibitors: NSAID (including Cox-2 inhibitors) DDDs per 1,000 weighted list size per day
Indicator Group Musculoskeletal Drug Group NSAIDs The previous measure made available using the population figures that have been weighted to account for demographic variation. These weighted populations are available within the PRISMS and are based on the GP practice component of the NRAC formula (http://www.isdscotland.org/Health-Topics/Finance/Resource-Allocation-Formula). The analysis shows that the NSAID prescribing has decreased year on year for the last three years across Scotland and in most of the NHS Boards. On average there is a 2-fold variation in prescribing between the NHS Boards (23.5 DDDs per 1,000 weighted list size per day in NHS Lothian compared to 46.6 in NHS Orkney). The NHS Boards with the greatest variation between their GP Practices are NHS Orkney, NHS Ayrshire & Arran, NHS Grampian, NHS Fife; they all have interquartile ranges greater than 15. There are 25 GP practices whose prescribing of NSAIDs (including Cox-2 inhibitors) is identified as outlying within their NHS Board area. NSAIDs including Cox-2 inhibitors - NHS Board Trend
0
10
20
30
40
50
60
OR
KN
EY
SHET
LAN
D
GR
AM
PIA
N
A&
A
LAN
AR
KSH
IRE
WI
HIG
HLA
ND FV
GG
C
D&
G
BO
RD
ERS
FIFE
TAY
SID
E
LOTH
IAN
SCO
TLA
ND
DD
Ds
per
1,0
00
wei
ghte
d li
st s
ize
per
day
October to December 2015 October to December 2016 October to December 2017
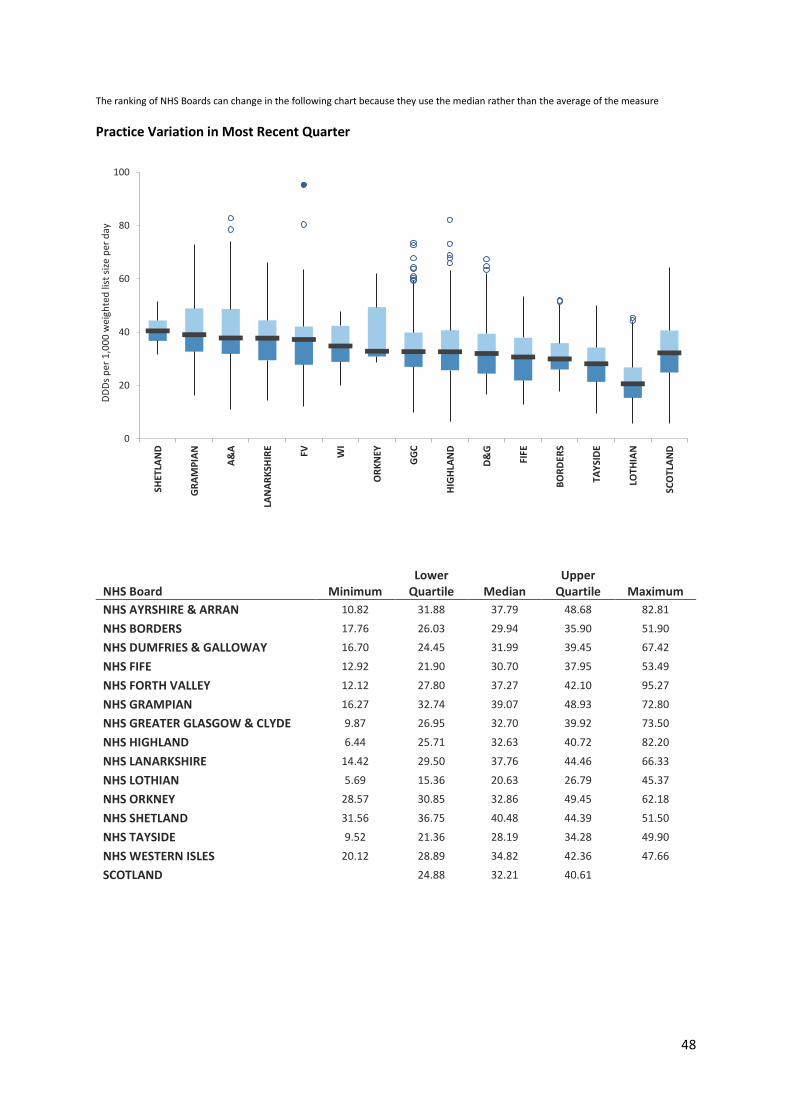
48
The ranking of NHS Boards can change in the following chart because they use the median rather than the average of the measure
Practice Variation in Most Recent Quarter
NHS Board Minimum Lower
Quartile Median Upper
Quartile Maximum
NHS AYRSHIRE & ARRAN 10.82 31.88 37.79 48.68 82.81
NHS BORDERS 17.76 26.03 29.94 35.90 51.90
NHS DUMFRIES & GALLOWAY 16.70 24.45 31.99 39.45 67.42
NHS FIFE 12.92 21.90 30.70 37.95 53.49
NHS FORTH VALLEY 12.12 27.80 37.27 42.10 95.27
NHS GRAMPIAN 16.27 32.74 39.07 48.93 72.80
NHS GREATER GLASGOW & CLYDE 9.87 26.95 32.70 39.92 73.50
NHS HIGHLAND 6.44 25.71 32.63 40.72 82.20
NHS LANARKSHIRE 14.42 29.50 37.76 44.46 66.33
NHS LOTHIAN 5.69 15.36 20.63 26.79 45.37
NHS ORKNEY 28.57 30.85 32.86 49.45 62.18
NHS SHETLAND 31.56 36.75 40.48 44.39 51.50
NHS TAYSIDE 9.52 21.36 28.19 34.28 49.90
NHS WESTERN ISLES 20.12 28.89 34.82 42.36 47.66
SCOTLAND 24.88 32.21 40.61
0
20
40
60
80
100
SHET
LAN
D
GR
AM
PIA
N
A&
A
LAN
AR
KSH
IRE
FV WI
OR
KN
EY
GG
C
HIG
HLA
ND
D&
G
FIFE
BO
RD
ERS
TAY
SID
E
LOTH
IAN
SCO
TLA
ND
DD
Ds
per
1,0
00
wei
ghte
d li
st s
ize
per
day
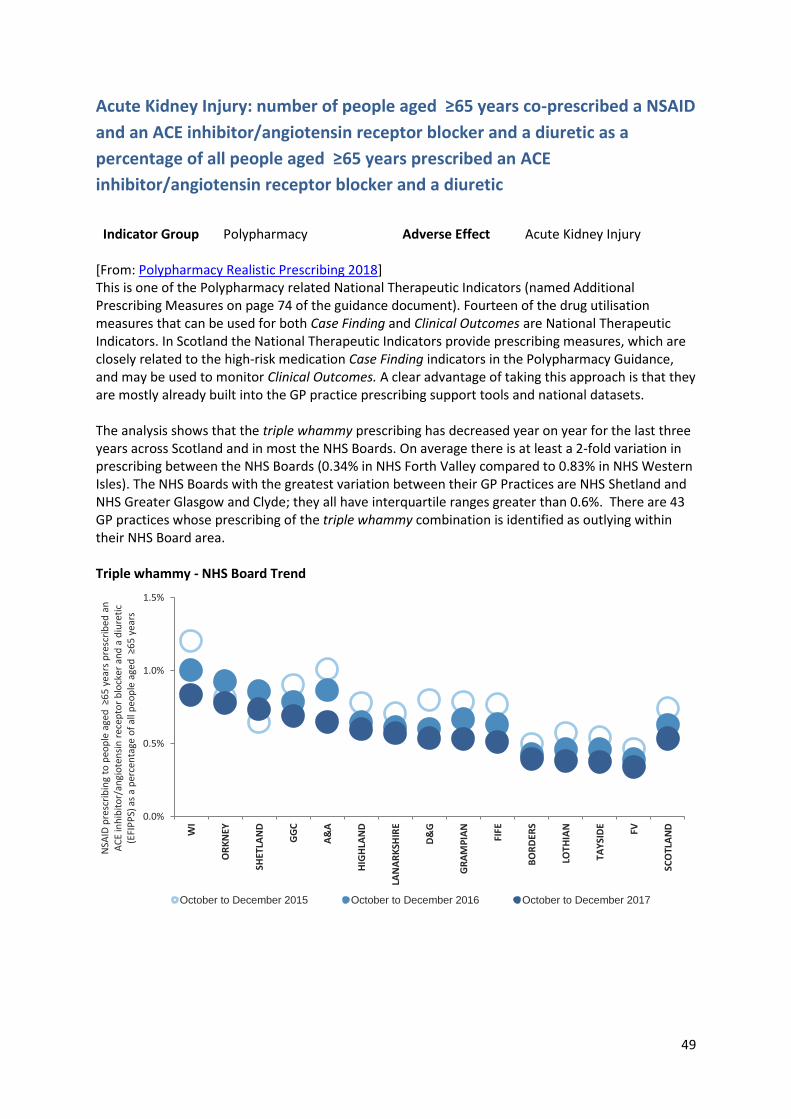
49
Acute Kidney Injury: number of people aged ≥65 years co-prescribed a NSAID
and an ACE inhibitor/angiotensin receptor blocker and a diuretic as a
percentage of all people aged ≥65 years prescribed an ACE
inhibitor/angiotensin receptor blocker and a diuretic
Indicator Group Polypharmacy Adverse Effect Acute Kidney Injury
[From: Polypharmacy Realistic Prescribing 2018] This is one of the Polypharmacy related National Therapeutic Indicators (named Additional Prescribing Measures on page 74 of the guidance document). Fourteen of the drug utilisation measures that can be used for both Case Finding and Clinical Outcomes are National Therapeutic Indicators. In Scotland the National Therapeutic Indicators provide prescribing measures, which are closely related to the high-risk medication Case Finding indicators in the Polypharmacy Guidance, and may be used to monitor Clinical Outcomes. A clear advantage of taking this approach is that they are mostly already built into the GP practice prescribing support tools and national datasets. The analysis shows that the triple whammy prescribing has decreased year on year for the last three years across Scotland and in most the NHS Boards. On average there is at least a 2-fold variation in prescribing between the NHS Boards (0.34% in NHS Forth Valley compared to 0.83% in NHS Western Isles). The NHS Boards with the greatest variation between their GP Practices are NHS Shetland and NHS Greater Glasgow and Clyde; they all have interquartile ranges greater than 0.6%. There are 43 GP practices whose prescribing of the triple whammy combination is identified as outlying within their NHS Board area. Triple whammy - NHS Board Trend
0.0%
0.5%
1.0%
1.5%
WI
OR
KN
EY
SHET
LAN
D
GG
C
A&
A
HIG
HLA
ND
LAN
AR
KSH
IRE
D&
G
GR
AM
PIA
N
FIFE
BO
RD
ERS
LOTH
IAN
TAY
SID
E
FV
SCO
TLA
ND
NSA
ID p
resc
rib
ing
to p
eop
le a
ged
≥6
5 y
ears
pre
scri
bed
an
A
CE
inh
ibit
or/
angi
ote
nsi
n r
ecep
tor
blo
cker
an
d a
diu
reti
c (E
FIP
PS)
as
a p
erce
nta
ge o
f al
l peo
ple
age
d ≥
65
yea
rs
October to December 2015 October to December 2016 October to December 2017
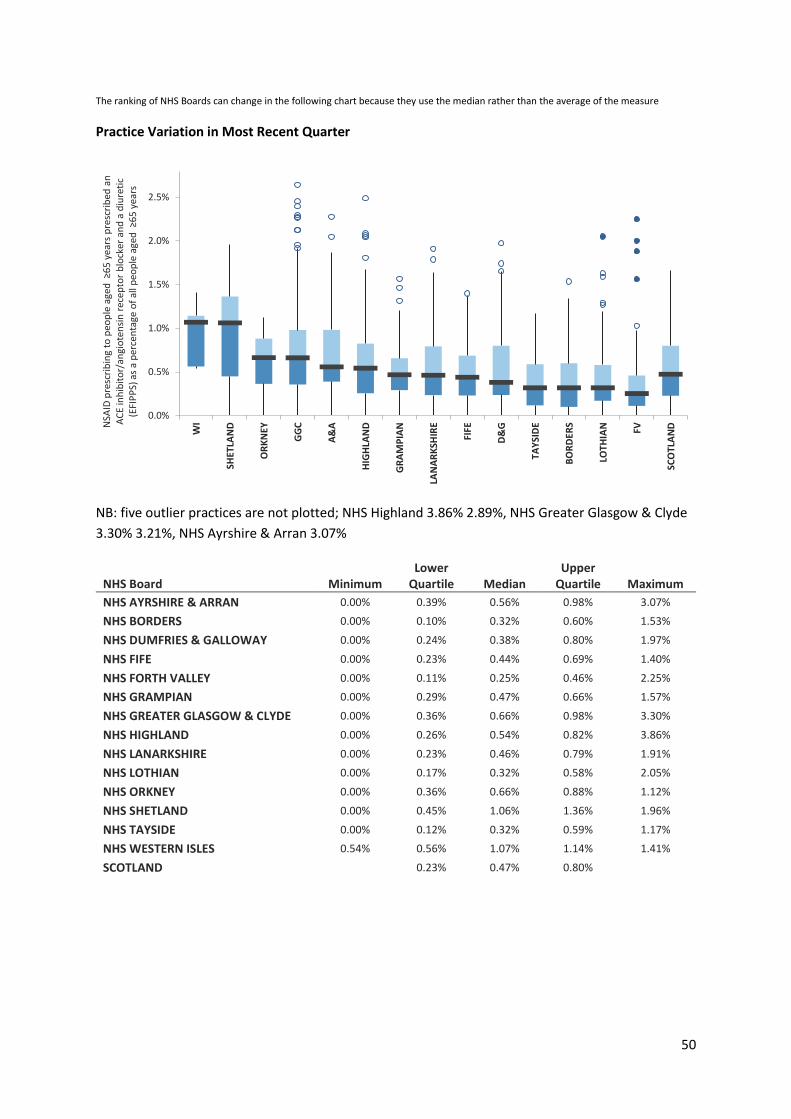
50
The ranking of NHS Boards can change in the following chart because they use the median rather than the average of the measure
Practice Variation in Most Recent Quarter
NB: five outlier practices are not plotted; NHS Highland 3.86% 2.89%, NHS Greater Glasgow & Clyde
3.30% 3.21%, NHS Ayrshire & Arran 3.07%
NHS Board Minimum Lower
Quartile Median Upper
Quartile Maximum
NHS AYRSHIRE & ARRAN 0.00% 0.39% 0.56% 0.98% 3.07%
NHS BORDERS 0.00% 0.10% 0.32% 0.60% 1.53%
NHS DUMFRIES & GALLOWAY 0.00% 0.24% 0.38% 0.80% 1.97%
NHS FIFE 0.00% 0.23% 0.44% 0.69% 1.40%
NHS FORTH VALLEY 0.00% 0.11% 0.25% 0.46% 2.25%
NHS GRAMPIAN 0.00% 0.29% 0.47% 0.66% 1.57%
NHS GREATER GLASGOW & CLYDE 0.00% 0.36% 0.66% 0.98% 3.30%
NHS HIGHLAND 0.00% 0.26% 0.54% 0.82% 3.86%
NHS LANARKSHIRE 0.00% 0.23% 0.46% 0.79% 1.91%
NHS LOTHIAN 0.00% 0.17% 0.32% 0.58% 2.05%
NHS ORKNEY 0.00% 0.36% 0.66% 0.88% 1.12%
NHS SHETLAND 0.00% 0.45% 1.06% 1.36% 1.96%
NHS TAYSIDE 0.00% 0.12% 0.32% 0.59% 1.17%
NHS WESTERN ISLES 0.54% 0.56% 1.07% 1.14% 1.41%
SCOTLAND 0.23% 0.47% 0.80%
0.0%
0.5%
1.0%
1.5%
2.0%
2.5%W
I
SHET
LAN
D
OR
KN
EY
GG
C
A&
A
HIG
HLA
ND
GR
AM
PIA
N
LAN
AR
KSH
IRE
FIFE
D&
G
TAY
SID
E
BO
RD
ERS
LOTH
IAN FV
SCO
TLA
NDN
SAID
pre
scri
bin
g to
peo
ple
age
d ≥
65
yea
rs p
resc
rib
ed a
n
AC
E in
hib
ito
r/an
gio
ten
sin
rec
epto
r b
lock
er a
nd
a d
iure
tic
(EFI
PP
S) a
s a
per
cen
tage
of
all p
eop
le a
ged
≥6
5 y
ears
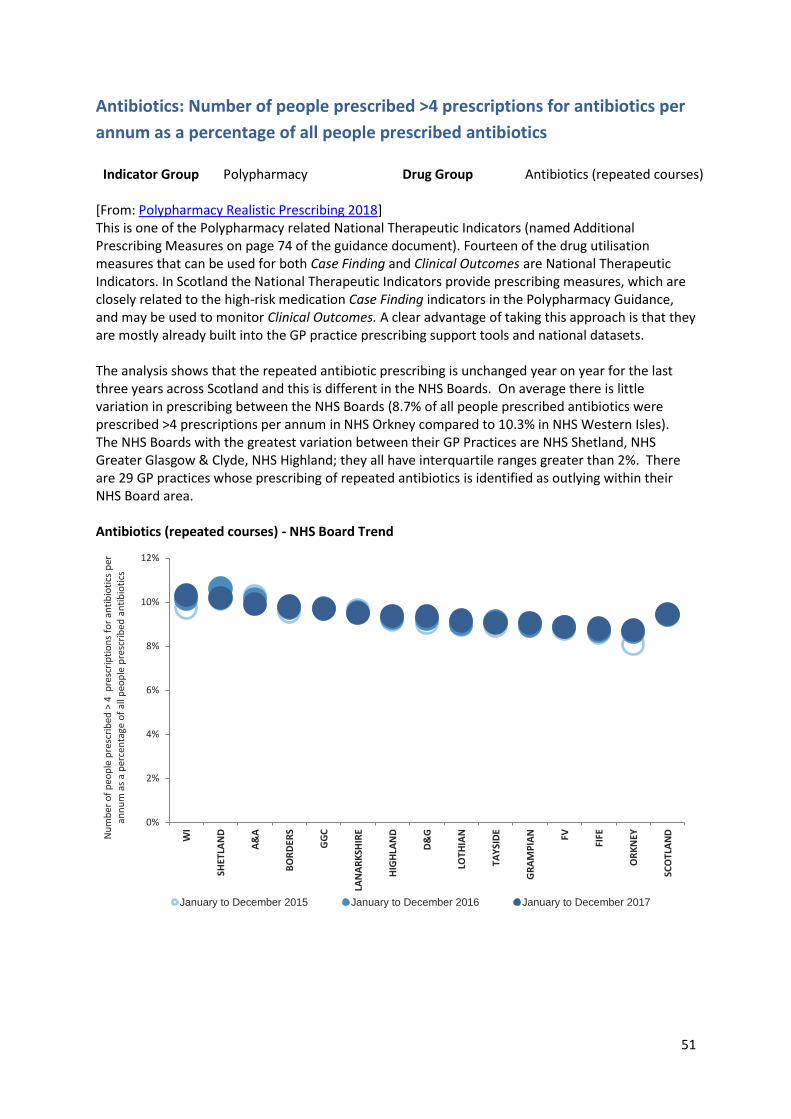
51
Antibiotics: Number of people prescribed >4 prescriptions for antibiotics per
annum as a percentage of all people prescribed antibiotics
Indicator Group Polypharmacy Drug Group Antibiotics (repeated courses) [From: Polypharmacy Realistic Prescribing 2018] This is one of the Polypharmacy related National Therapeutic Indicators (named Additional Prescribing Measures on page 74 of the guidance document). Fourteen of the drug utilisation measures that can be used for both Case Finding and Clinical Outcomes are National Therapeutic Indicators. In Scotland the National Therapeutic Indicators provide prescribing measures, which are closely related to the high-risk medication Case Finding indicators in the Polypharmacy Guidance, and may be used to monitor Clinical Outcomes. A clear advantage of taking this approach is that they are mostly already built into the GP practice prescribing support tools and national datasets. The analysis shows that the repeated antibiotic prescribing is unchanged year on year for the last three years across Scotland and this is different in the NHS Boards. On average there is little variation in prescribing between the NHS Boards (8.7% of all people prescribed antibiotics were prescribed >4 prescriptions per annum in NHS Orkney compared to 10.3% in NHS Western Isles). The NHS Boards with the greatest variation between their GP Practices are NHS Shetland, NHS Greater Glasgow & Clyde, NHS Highland; they all have interquartile ranges greater than 2%. There are 29 GP practices whose prescribing of repeated antibiotics is identified as outlying within their NHS Board area. Antibiotics (repeated courses) - NHS Board Trend
0%
2%
4%
6%
8%
10%
12%
WI
SHET
LAN
D
A&
A
BO
RD
ERS
GG
C
LAN
AR
KSH
IRE
HIG
HLA
ND
D&
G
LOTH
IAN
TAY
SID
E
GR
AM
PIA
N FV
FIFE
OR
KN
EY
SCO
TLA
NDNu
mb
er o
f p
eop
le p
resc
rib
ed >
4 p
resc
rip
tio
ns
for
anti
bio
tics
per
an
nu
m a
s a
per
cen
tage
of
all p
eop
le p
resc
rib
ed a
nti
bio
tics
January to December 2015 January to December 2016 January to December 2017
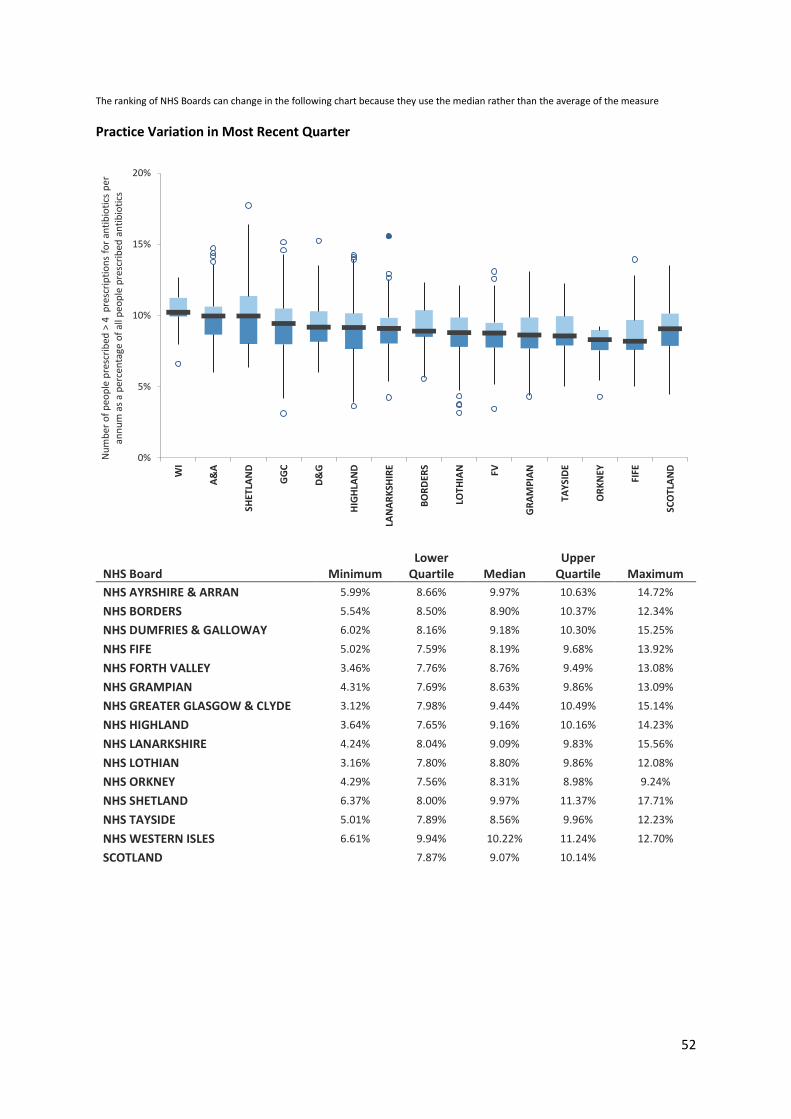
52
The ranking of NHS Boards can change in the following chart because they use the median rather than the average of the measure
Practice Variation in Most Recent Quarter
NHS Board Minimum Lower
Quartile Median Upper
Quartile Maximum
NHS AYRSHIRE & ARRAN 5.99% 8.66% 9.97% 10.63% 14.72%
NHS BORDERS 5.54% 8.50% 8.90% 10.37% 12.34%
NHS DUMFRIES & GALLOWAY 6.02% 8.16% 9.18% 10.30% 15.25%
NHS FIFE 5.02% 7.59% 8.19% 9.68% 13.92%
NHS FORTH VALLEY 3.46% 7.76% 8.76% 9.49% 13.08%
NHS GRAMPIAN 4.31% 7.69% 8.63% 9.86% 13.09%
NHS GREATER GLASGOW & CLYDE 3.12% 7.98% 9.44% 10.49% 15.14%
NHS HIGHLAND 3.64% 7.65% 9.16% 10.16% 14.23%
NHS LANARKSHIRE 4.24% 8.04% 9.09% 9.83% 15.56%
NHS LOTHIAN 3.16% 7.80% 8.80% 9.86% 12.08%
NHS ORKNEY 4.29% 7.56% 8.31% 8.98% 9.24%
NHS SHETLAND 6.37% 8.00% 9.97% 11.37% 17.71%
NHS TAYSIDE 5.01% 7.89% 8.56% 9.96% 12.23%
NHS WESTERN ISLES 6.61% 9.94% 10.22% 11.24% 12.70%
SCOTLAND 7.87% 9.07% 10.14%
0%
5%
10%
15%
20%W
I
A&
A
SHET
LAN
D
GG
C
D&
G
HIG
HLA
ND
LAN
AR
KSH
IRE
BO
RD
ERS
LOTH
IAN FV
GR
AM
PIA
N
TAY
SID
E
OR
KN
EY
FIFE
SCO
TLA
ND
Nu
mb
er o
f p
eop
le p
resc
rib
ed >
4 p
resc
rip
tio
ns
for
anti
bio
tics
per
an
nu
m a
s a
per
cen
tage
of
all p
eop
le p
resc
rib
ed a
nti
bio
tics
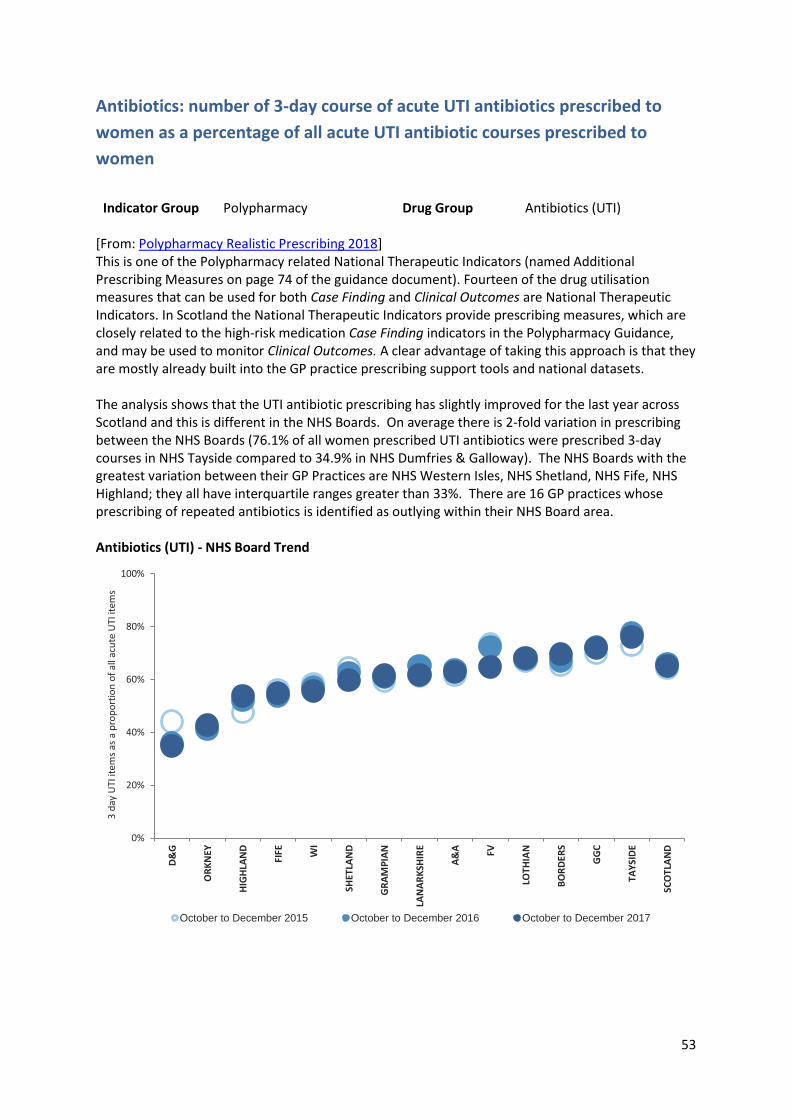
53
Antibiotics: number of 3-day course of acute UTI antibiotics prescribed to
women as a percentage of all acute UTI antibiotic courses prescribed to
women
Indicator Group Polypharmacy Drug Group Antibiotics (UTI)
[From: Polypharmacy Realistic Prescribing 2018] This is one of the Polypharmacy related National Therapeutic Indicators (named Additional Prescribing Measures on page 74 of the guidance document). Fourteen of the drug utilisation measures that can be used for both Case Finding and Clinical Outcomes are National Therapeutic Indicators. In Scotland the National Therapeutic Indicators provide prescribing measures, which are closely related to the high-risk medication Case Finding indicators in the Polypharmacy Guidance, and may be used to monitor Clinical Outcomes. A clear advantage of taking this approach is that they are mostly already built into the GP practice prescribing support tools and national datasets. The analysis shows that the UTI antibiotic prescribing has slightly improved for the last year across Scotland and this is different in the NHS Boards. On average there is 2-fold variation in prescribing between the NHS Boards (76.1% of all women prescribed UTI antibiotics were prescribed 3-day courses in NHS Tayside compared to 34.9% in NHS Dumfries & Galloway). The NHS Boards with the greatest variation between their GP Practices are NHS Western Isles, NHS Shetland, NHS Fife, NHS Highland; they all have interquartile ranges greater than 33%. There are 16 GP practices whose prescribing of repeated antibiotics is identified as outlying within their NHS Board area. Antibiotics (UTI) - NHS Board Trend
0%
20%
40%
60%
80%
100%
D&
G
OR
KN
EY
HIG
HLA
ND
FIFE W
I
SHET
LAN
D
GR
AM
PIA
N
LAN
AR
KSH
IRE
A&
A FV
LOTH
IAN
BO
RD
ERS
GG
C
TAY
SID
E
SCO
TLA
ND
3 d
ay U
TI it
ems
as a
pro
po
rtio
n o
f al
l acu
te U
TI it
ems
October to December 2015 October to December 2016 October to December 2017
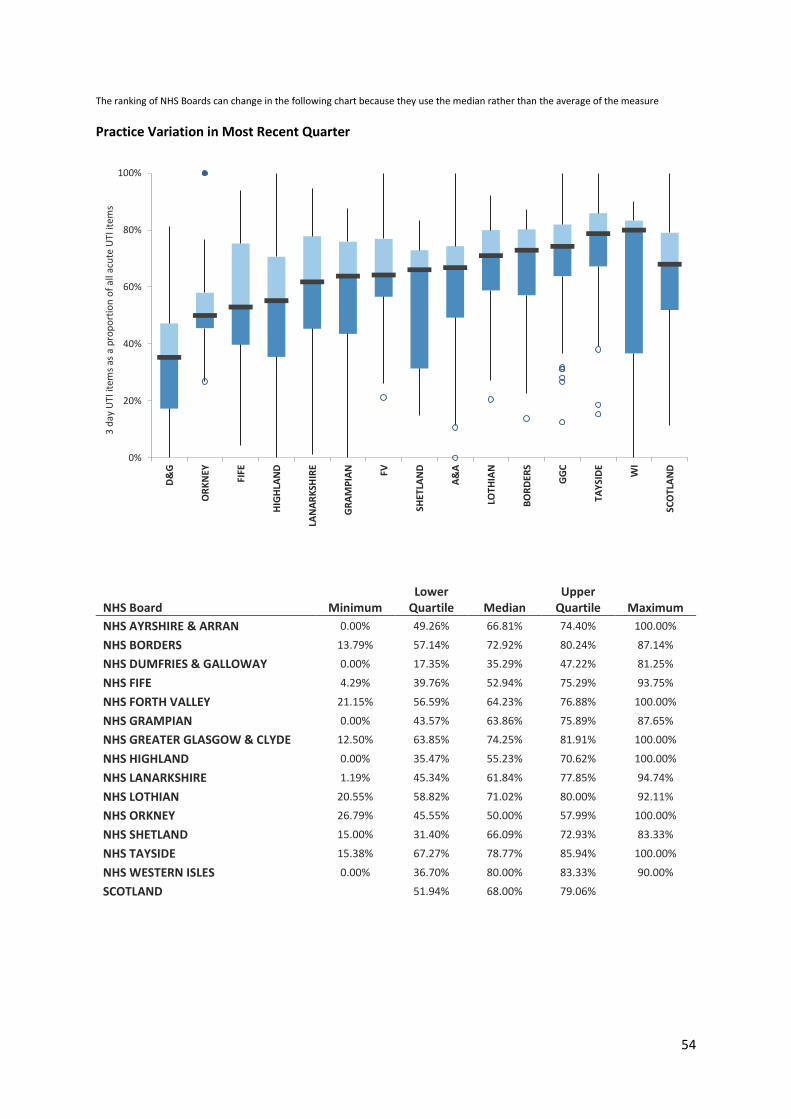
54
The ranking of NHS Boards can change in the following chart because they use the median rather than the average of the measure
Practice Variation in Most Recent Quarter
NHS Board Minimum Lower
Quartile Median Upper
Quartile Maximum
NHS AYRSHIRE & ARRAN 0.00% 49.26% 66.81% 74.40% 100.00%
NHS BORDERS 13.79% 57.14% 72.92% 80.24% 87.14%
NHS DUMFRIES & GALLOWAY 0.00% 17.35% 35.29% 47.22% 81.25%
NHS FIFE 4.29% 39.76% 52.94% 75.29% 93.75%
NHS FORTH VALLEY 21.15% 56.59% 64.23% 76.88% 100.00%
NHS GRAMPIAN 0.00% 43.57% 63.86% 75.89% 87.65%
NHS GREATER GLASGOW & CLYDE 12.50% 63.85% 74.25% 81.91% 100.00%
NHS HIGHLAND 0.00% 35.47% 55.23% 70.62% 100.00%
NHS LANARKSHIRE 1.19% 45.34% 61.84% 77.85% 94.74%
NHS LOTHIAN 20.55% 58.82% 71.02% 80.00% 92.11%
NHS ORKNEY 26.79% 45.55% 50.00% 57.99% 100.00%
NHS SHETLAND 15.00% 31.40% 66.09% 72.93% 83.33%
NHS TAYSIDE 15.38% 67.27% 78.77% 85.94% 100.00%
NHS WESTERN ISLES 0.00% 36.70% 80.00% 83.33% 90.00%
SCOTLAND 51.94% 68.00% 79.06%
0%
20%
40%
60%
80%
100%D
&G
OR
KN
EY
FIFE
HIG
HLA
ND
LAN
AR
KSH
IRE
GR
AM
PIA
N FV
SHET
LAN
D
A&
A
LOTH
IAN
BO
RD
ERS
GG
C
TAY
SID
E
WI
SCO
TLA
ND
3 d
ay U
TI it
ems
as a
pro
po
rtio
n o
f al
l acu
te U
TI it
ems
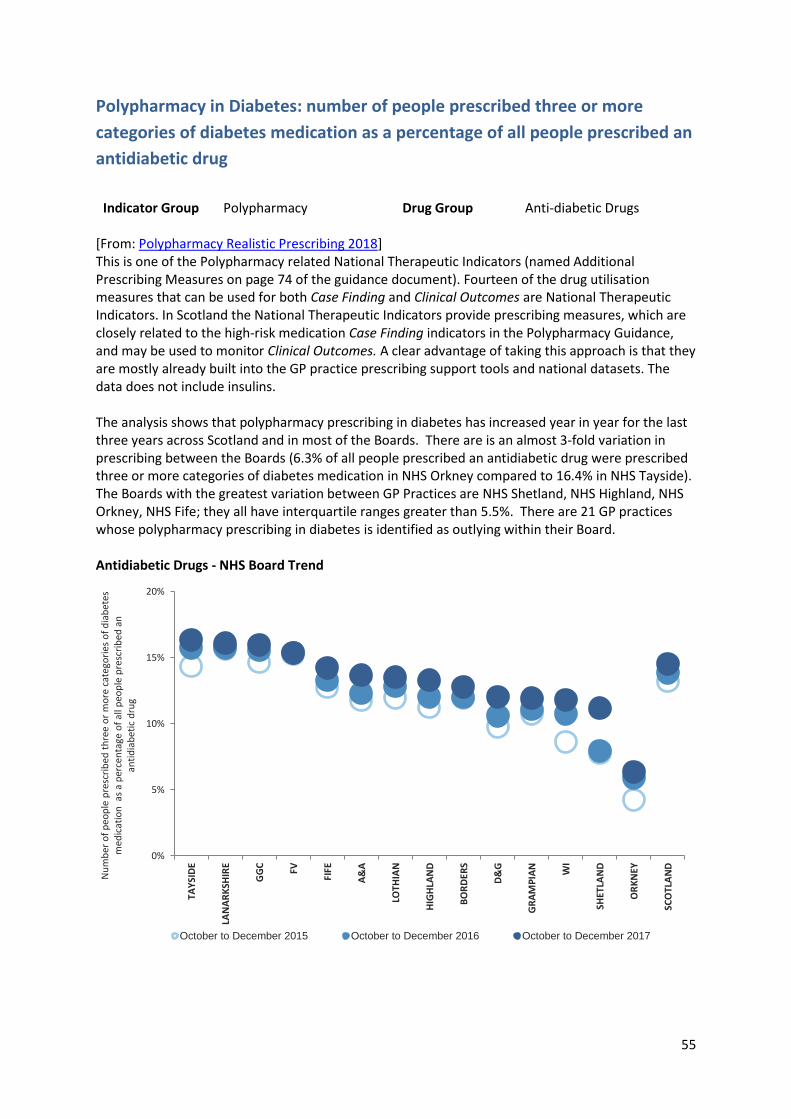
55
Polypharmacy in Diabetes: number of people prescribed three or more
categories of diabetes medication as a percentage of all people prescribed an
antidiabetic drug
Indicator Group Polypharmacy Drug Group Anti-diabetic Drugs
[From: Polypharmacy Realistic Prescribing 2018] This is one of the Polypharmacy related National Therapeutic Indicators (named Additional Prescribing Measures on page 74 of the guidance document). Fourteen of the drug utilisation measures that can be used for both Case Finding and Clinical Outcomes are National Therapeutic Indicators. In Scotland the National Therapeutic Indicators provide prescribing measures, which are closely related to the high-risk medication Case Finding indicators in the Polypharmacy Guidance, and may be used to monitor Clinical Outcomes. A clear advantage of taking this approach is that they are mostly already built into the GP practice prescribing support tools and national datasets. The data does not include insulins. The analysis shows that polypharmacy prescribing in diabetes has increased year in year for the last three years across Scotland and in most of the Boards. There are is an almost 3-fold variation in prescribing between the Boards (6.3% of all people prescribed an antidiabetic drug were prescribed three or more categories of diabetes medication in NHS Orkney compared to 16.4% in NHS Tayside). The Boards with the greatest variation between GP Practices are NHS Shetland, NHS Highland, NHS Orkney, NHS Fife; they all have interquartile ranges greater than 5.5%. There are 21 GP practices whose polypharmacy prescribing in diabetes is identified as outlying within their Board. Antidiabetic Drugs - NHS Board Trend
0%
5%
10%
15%
20%
TAY
SID
E
LAN
AR
KSH
IRE
GG
C
FV
FIFE
A&
A
LOTH
IAN
HIG
HLA
ND
BO
RD
ERS
D&
G
GR
AM
PIA
N
WI
SHET
LAN
D
OR
KN
EY
SCO
TLA
ND
Nu
mb
er o
f p
eop
le p
resc
rib
ed t
hre
e o
r m
ore
cat
ego
ries
of
dia
bet
es
med
icat
ion
as
a p
erce
nta
ge o
f al
l peo
ple
pre
scri
bed
an
an
tid
iab
etic
dru
g
October to December 2015 October to December 2016 October to December 2017
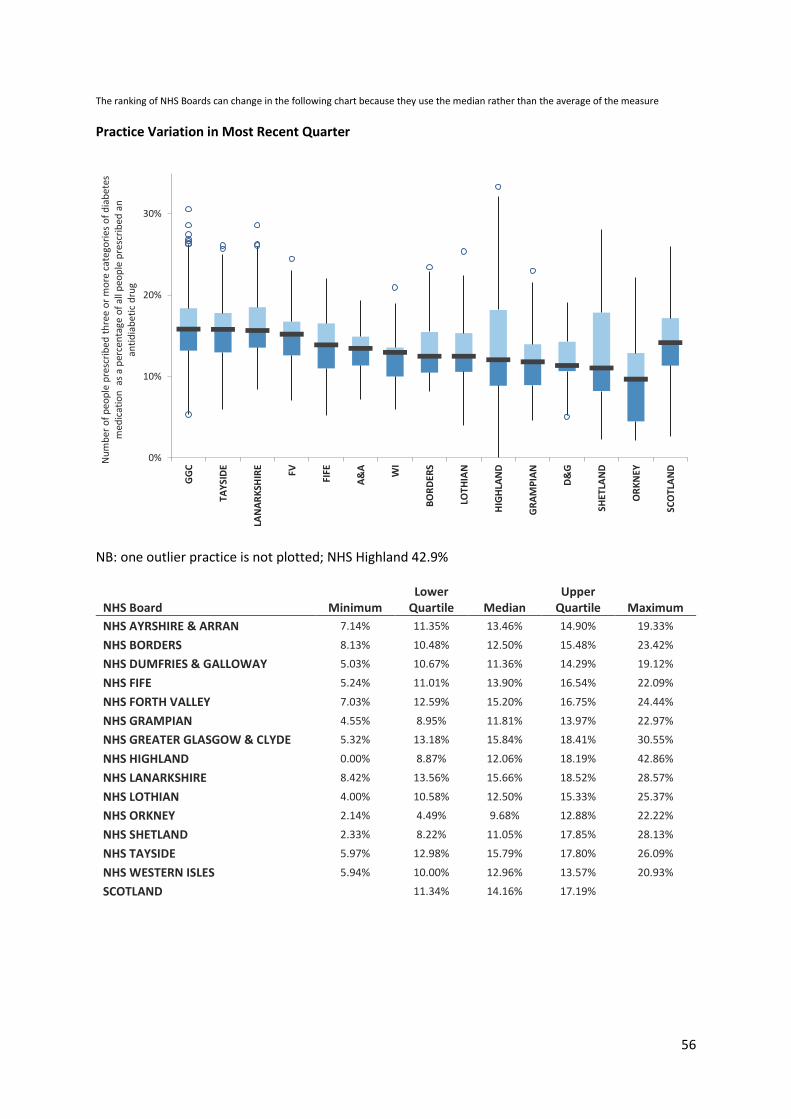
56
The ranking of NHS Boards can change in the following chart because they use the median rather than the average of the measure
Practice Variation in Most Recent Quarter
NB: one outlier practice is not plotted; NHS Highland 42.9%
NHS Board Minimum Lower
Quartile Median Upper
Quartile Maximum
NHS AYRSHIRE & ARRAN 7.14% 11.35% 13.46% 14.90% 19.33%
NHS BORDERS 8.13% 10.48% 12.50% 15.48% 23.42%
NHS DUMFRIES & GALLOWAY 5.03% 10.67% 11.36% 14.29% 19.12%
NHS FIFE 5.24% 11.01% 13.90% 16.54% 22.09%
NHS FORTH VALLEY 7.03% 12.59% 15.20% 16.75% 24.44%
NHS GRAMPIAN 4.55% 8.95% 11.81% 13.97% 22.97%
NHS GREATER GLASGOW & CLYDE 5.32% 13.18% 15.84% 18.41% 30.55%
NHS HIGHLAND 0.00% 8.87% 12.06% 18.19% 42.86%
NHS LANARKSHIRE 8.42% 13.56% 15.66% 18.52% 28.57%
NHS LOTHIAN 4.00% 10.58% 12.50% 15.33% 25.37%
NHS ORKNEY 2.14% 4.49% 9.68% 12.88% 22.22%
NHS SHETLAND 2.33% 8.22% 11.05% 17.85% 28.13%
NHS TAYSIDE 5.97% 12.98% 15.79% 17.80% 26.09%
NHS WESTERN ISLES 5.94% 10.00% 12.96% 13.57% 20.93%
SCOTLAND 11.34% 14.16% 17.19%
0%
10%
20%
30%
GG
C
TAY
SID
E
LAN
AR
KSH
IRE
FV
FIFE
A&
A
WI
BO
RD
ERS
LOTH
IAN
HIG
HLA
ND
GR
AM
PIA
N
D&
G
SHET
LAN
D
OR
KN
EY
SCO
TLA
ND
Nu
mb
er o
f p
eop
le p
resc
rib
ed t
hre
e o
r m
ore
cat
ego
ries
of
dia
bet
es
med
icat
ion
as
a p
erce
nta
ge o
f al
l peo
ple
pre
scri
bed
an
an
tid
iab
etic
dru
g
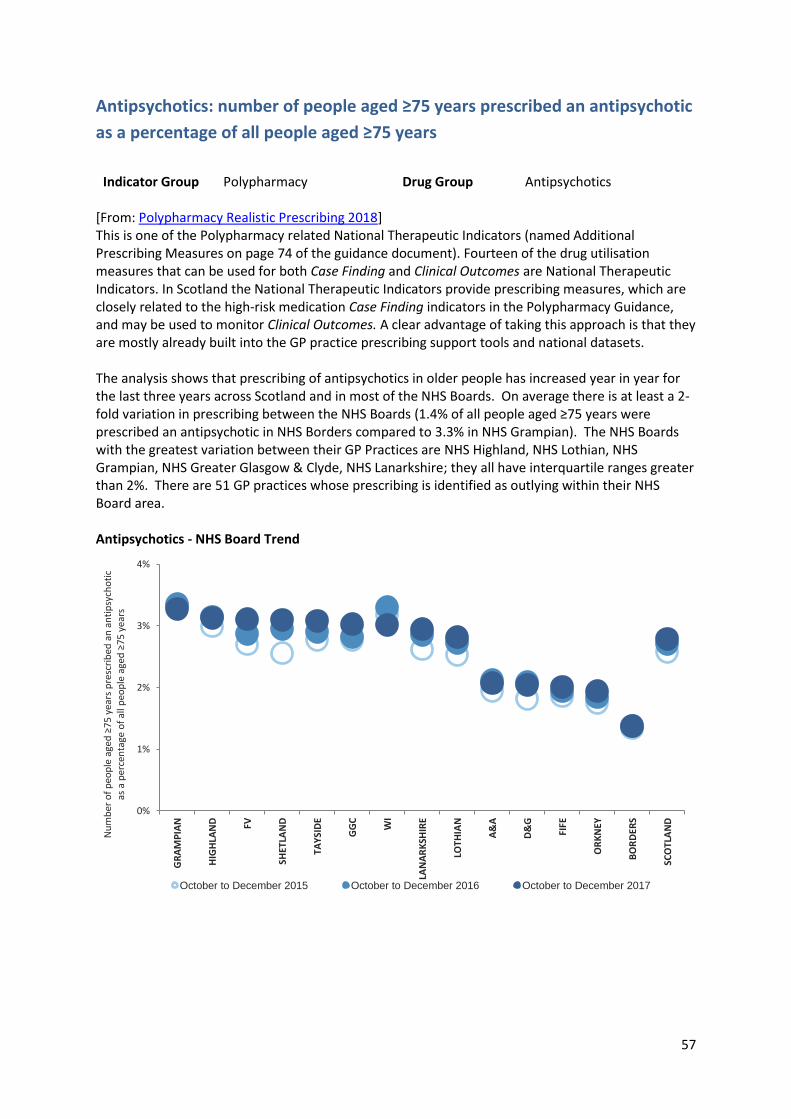
57
Antipsychotics: number of people aged ≥75 years prescribed an antipsychotic
as a percentage of all people aged ≥75 years
Indicator Group Polypharmacy Drug Group Antipsychotics
[From: Polypharmacy Realistic Prescribing 2018] This is one of the Polypharmacy related National Therapeutic Indicators (named Additional Prescribing Measures on page 74 of the guidance document). Fourteen of the drug utilisation measures that can be used for both Case Finding and Clinical Outcomes are National Therapeutic Indicators. In Scotland the National Therapeutic Indicators provide prescribing measures, which are closely related to the high-risk medication Case Finding indicators in the Polypharmacy Guidance, and may be used to monitor Clinical Outcomes. A clear advantage of taking this approach is that they are mostly already built into the GP practice prescribing support tools and national datasets. The analysis shows that prescribing of antipsychotics in older people has increased year in year for the last three years across Scotland and in most of the NHS Boards. On average there is at least a 2-fold variation in prescribing between the NHS Boards (1.4% of all people aged ≥75 years were prescribed an antipsychotic in NHS Borders compared to 3.3% in NHS Grampian). The NHS Boards with the greatest variation between their GP Practices are NHS Highland, NHS Lothian, NHS Grampian, NHS Greater Glasgow & Clyde, NHS Lanarkshire; they all have interquartile ranges greater than 2%. There are 51 GP practices whose prescribing is identified as outlying within their NHS Board area. Antipsychotics - NHS Board Trend
0%
1%
2%
3%
4%
GR
AM
PIA
N
HIG
HLA
ND FV
SHET
LAN
D
TAY
SID
E
GG
C
WI
LAN
AR
KSH
IRE
LOTH
IAN
A&
A
D&
G
FIFE
OR
KN
EY
BO
RD
ERS
SCO
TLA
ND
Nu
mb
er o
f p
eop
le a
ged
≥7
5 y
ears
pre
scri
bed
an
an
tip
sych
oti
c as
a p
erce
nta
ge o
f al
l peo
ple
age
d ≥
75
yea
rs
October to December 2015 October to December 2016 October to December 2017
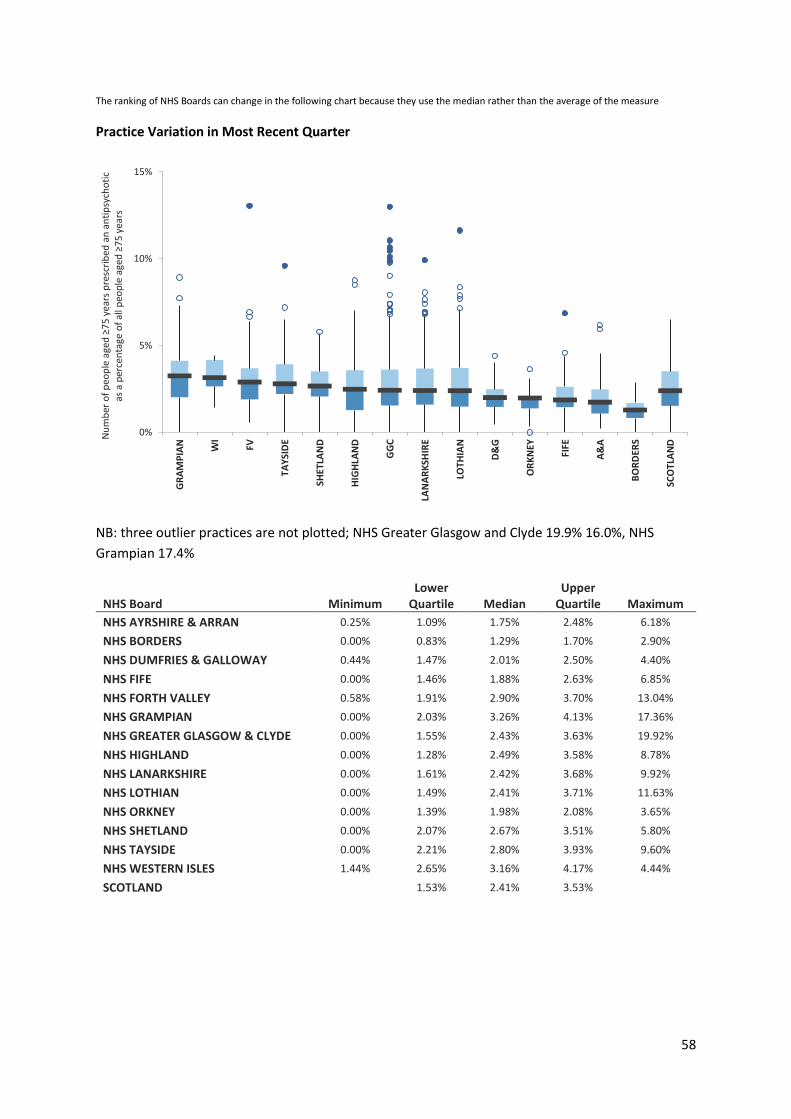
58
The ranking of NHS Boards can change in the following chart because they use the median rather than the average of the measure
Practice Variation in Most Recent Quarter
NB: three outlier practices are not plotted; NHS Greater Glasgow and Clyde 19.9% 16.0%, NHS
Grampian 17.4%
NHS Board Minimum Lower
Quartile Median Upper
Quartile Maximum
NHS AYRSHIRE & ARRAN 0.25% 1.09% 1.75% 2.48% 6.18%
NHS BORDERS 0.00% 0.83% 1.29% 1.70% 2.90%
NHS DUMFRIES & GALLOWAY 0.44% 1.47% 2.01% 2.50% 4.40%
NHS FIFE 0.00% 1.46% 1.88% 2.63% 6.85%
NHS FORTH VALLEY 0.58% 1.91% 2.90% 3.70% 13.04%
NHS GRAMPIAN 0.00% 2.03% 3.26% 4.13% 17.36%
NHS GREATER GLASGOW & CLYDE 0.00% 1.55% 2.43% 3.63% 19.92%
NHS HIGHLAND 0.00% 1.28% 2.49% 3.58% 8.78%
NHS LANARKSHIRE 0.00% 1.61% 2.42% 3.68% 9.92%
NHS LOTHIAN 0.00% 1.49% 2.41% 3.71% 11.63%
NHS ORKNEY 0.00% 1.39% 1.98% 2.08% 3.65%
NHS SHETLAND 0.00% 2.07% 2.67% 3.51% 5.80%
NHS TAYSIDE 0.00% 2.21% 2.80% 3.93% 9.60%
NHS WESTERN ISLES 1.44% 2.65% 3.16% 4.17% 4.44%
SCOTLAND 1.53% 2.41% 3.53%
0%
5%
10%
15%G
RA
MP
IAN
WI
FV
TAY
SID
E
SHET
LAN
D
HIG
HLA
ND
GG
C
LAN
AR
KSH
IRE
LOTH
IAN
D&
G
OR
KN
EY
FIFE
A&
A
BO
RD
ERS
SCO
TLA
ND
Nu
mb
er o
f p
eop
le a
ged
≥7
5 y
ears
pre
scri
bed
an
an
tip
sych
oti
c as
a p
erce
nta
ge o
f al
l peo
ple
age
d ≥
75
yea
rs
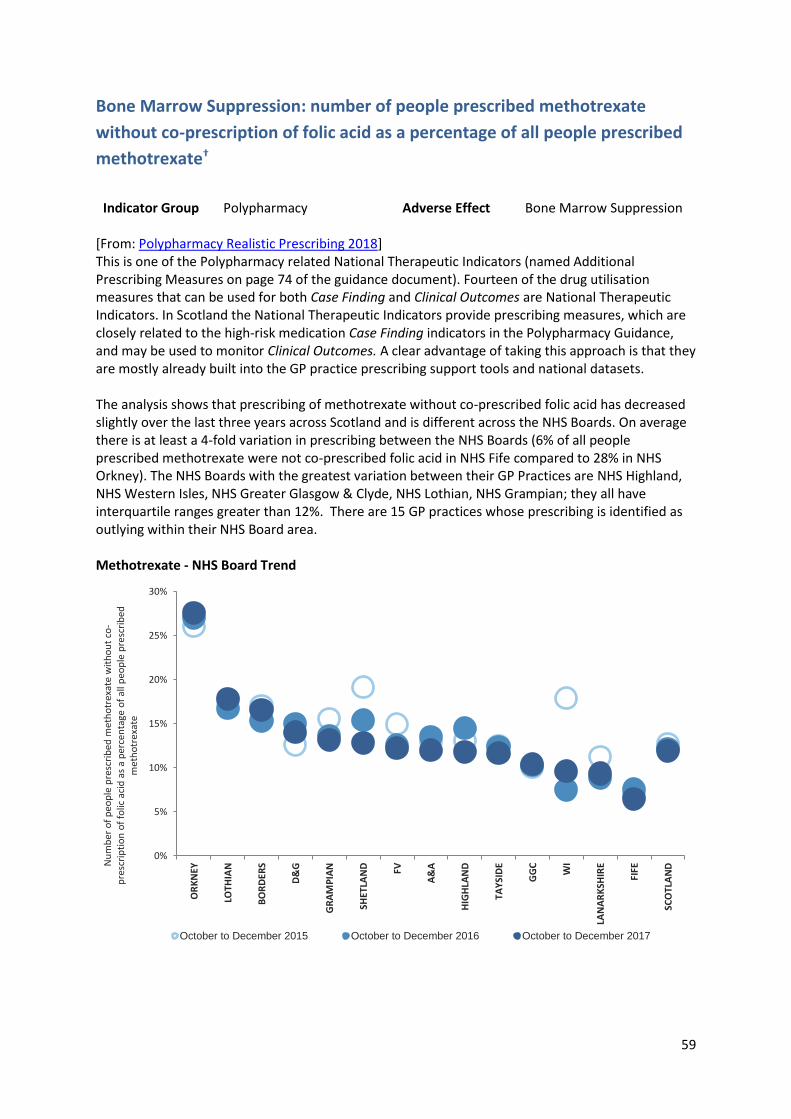
59
Bone Marrow Suppression: number of people prescribed methotrexate
without co-prescription of folic acid as a percentage of all people prescribed
methotrexate†
Indicator Group Polypharmacy Adverse Effect Bone Marrow Suppression
[From: Polypharmacy Realistic Prescribing 2018] This is one of the Polypharmacy related National Therapeutic Indicators (named Additional Prescribing Measures on page 74 of the guidance document). Fourteen of the drug utilisation measures that can be used for both Case Finding and Clinical Outcomes are National Therapeutic Indicators. In Scotland the National Therapeutic Indicators provide prescribing measures, which are closely related to the high-risk medication Case Finding indicators in the Polypharmacy Guidance, and may be used to monitor Clinical Outcomes. A clear advantage of taking this approach is that they are mostly already built into the GP practice prescribing support tools and national datasets. The analysis shows that prescribing of methotrexate without co-prescribed folic acid has decreased slightly over the last three years across Scotland and is different across the NHS Boards. On average there is at least a 4-fold variation in prescribing between the NHS Boards (6% of all people prescribed methotrexate were not co-prescribed folic acid in NHS Fife compared to 28% in NHS Orkney). The NHS Boards with the greatest variation between their GP Practices are NHS Highland, NHS Western Isles, NHS Greater Glasgow & Clyde, NHS Lothian, NHS Grampian; they all have interquartile ranges greater than 12%. There are 15 GP practices whose prescribing is identified as outlying within their NHS Board area. Methotrexate - NHS Board Trend
0%
5%
10%
15%
20%
25%
30%
OR
KN
EY
LOTH
IAN
BO
RD
ERS
D&
G
GR
AM
PIA
N
SHET
LAN
D FV
A&
A
HIG
HLA
ND
TAY
SID
E
GG
C
WI
LAN
AR
KSH
IRE
FIFE
SCO
TLA
NDN
um
ber
of
peo
ple
pre
scri
bed
met
ho
trex
ate
wit
ho
ut
co-
pre
scri
pti
on
of
folic
aci
d a
s a
per
cen
tage
of
all p
eop
le p
resc
rib
ed
met
ho
trex
ate
October to December 2015 October to December 2016 October to December 2017
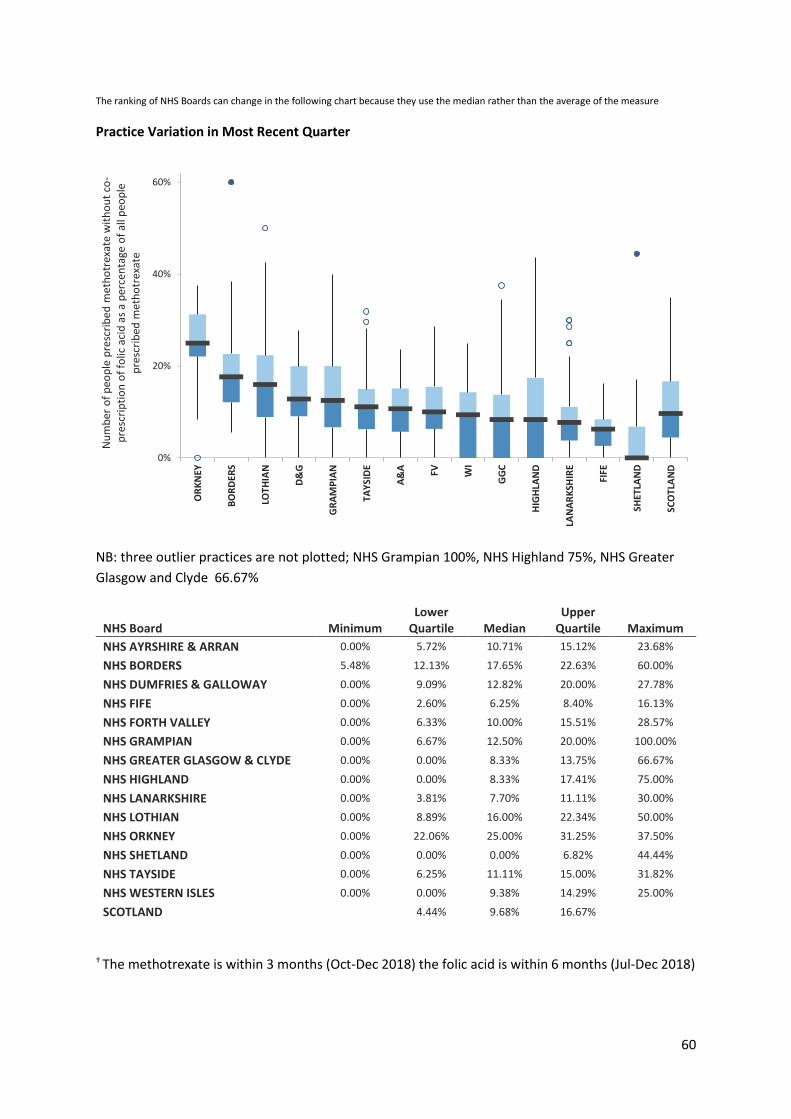
60
The ranking of NHS Boards can change in the following chart because they use the median rather than the average of the measure
Practice Variation in Most Recent Quarter
NB: three outlier practices are not plotted; NHS Grampian 100%, NHS Highland 75%, NHS Greater
Glasgow and Clyde 66.67%
NHS Board Minimum Lower
Quartile Median Upper
Quartile Maximum
NHS AYRSHIRE & ARRAN 0.00% 5.72% 10.71% 15.12% 23.68%
NHS BORDERS 5.48% 12.13% 17.65% 22.63% 60.00%
NHS DUMFRIES & GALLOWAY 0.00% 9.09% 12.82% 20.00% 27.78%
NHS FIFE 0.00% 2.60% 6.25% 8.40% 16.13%
NHS FORTH VALLEY 0.00% 6.33% 10.00% 15.51% 28.57%
NHS GRAMPIAN 0.00% 6.67% 12.50% 20.00% 100.00%
NHS GREATER GLASGOW & CLYDE 0.00% 0.00% 8.33% 13.75% 66.67%
NHS HIGHLAND 0.00% 0.00% 8.33% 17.41% 75.00%
NHS LANARKSHIRE 0.00% 3.81% 7.70% 11.11% 30.00%
NHS LOTHIAN 0.00% 8.89% 16.00% 22.34% 50.00%
NHS ORKNEY 0.00% 22.06% 25.00% 31.25% 37.50%
NHS SHETLAND 0.00% 0.00% 0.00% 6.82% 44.44%
NHS TAYSIDE 0.00% 6.25% 11.11% 15.00% 31.82%
NHS WESTERN ISLES 0.00% 0.00% 9.38% 14.29% 25.00%
SCOTLAND 4.44% 9.68% 16.67%
† The methotrexate is within 3 months (Oct-Dec 2018) the folic acid is within 6 months (Jul-Dec 2018)
0%
20%
40%
60%
OR
KN
EY
BO
RD
ERS
LOTH
IAN
D&
G
GR
AM
PIA
N
TAY
SID
E
A&
A FV WI
GG
C
HIG
HLA
ND
LAN
AR
KSH
IRE
FIFE
SHET
LAN
D
SCO
TLA
ND
Nu
mb
er o
f p
eop
le p
resc
rib
ed m
eth
otr
exat
e w
ith
ou
t co
-p
resc
rip
tio
n o
f fo
lic a
cid
as
a p
erce
nta
ge o
f al
l peo
ple
p
resc
rib
ed m
eth
otr
exat
e
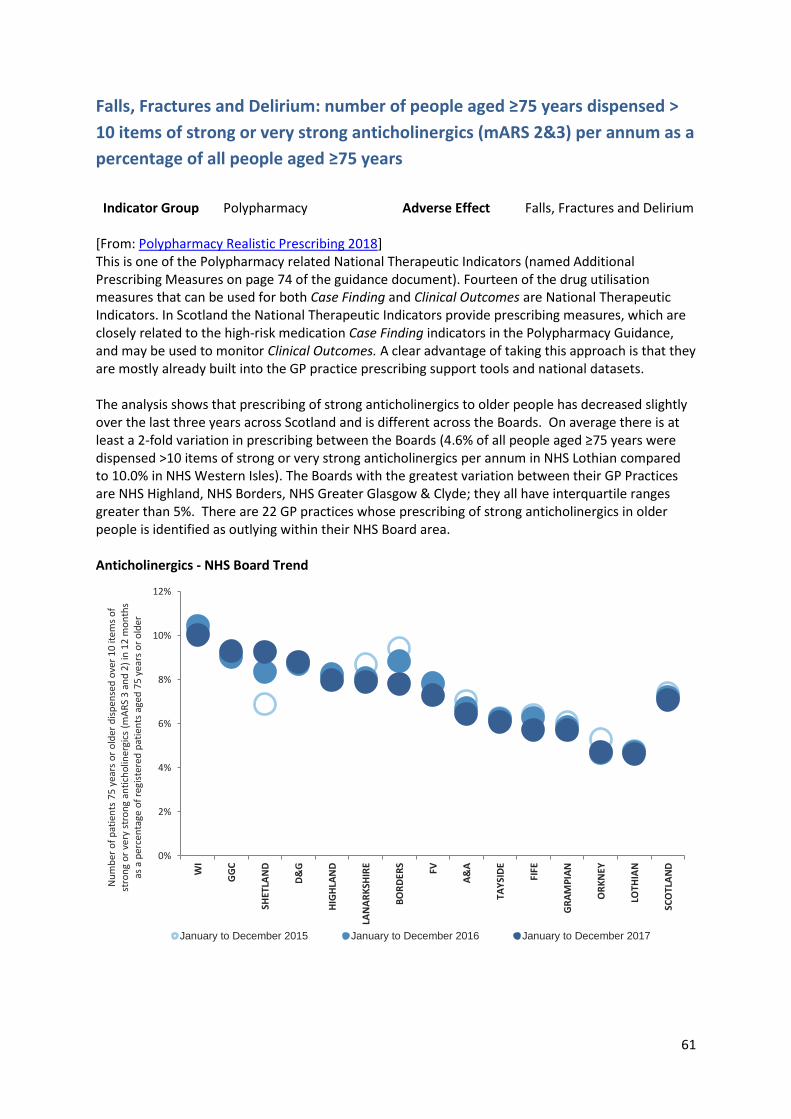
61
Falls, Fractures and Delirium: number of people aged ≥75 years dispensed >
10 items of strong or very strong anticholinergics (mARS 2&3) per annum as a
percentage of all people aged ≥75 years
Indicator Group Polypharmacy Adverse Effect Falls, Fractures and Delirium
[From: Polypharmacy Realistic Prescribing 2018] This is one of the Polypharmacy related National Therapeutic Indicators (named Additional Prescribing Measures on page 74 of the guidance document). Fourteen of the drug utilisation measures that can be used for both Case Finding and Clinical Outcomes are National Therapeutic Indicators. In Scotland the National Therapeutic Indicators provide prescribing measures, which are closely related to the high-risk medication Case Finding indicators in the Polypharmacy Guidance, and may be used to monitor Clinical Outcomes. A clear advantage of taking this approach is that they are mostly already built into the GP practice prescribing support tools and national datasets. The analysis shows that prescribing of strong anticholinergics to older people has decreased slightly over the last three years across Scotland and is different across the Boards. On average there is at least a 2-fold variation in prescribing between the Boards (4.6% of all people aged ≥75 years were dispensed >10 items of strong or very strong anticholinergics per annum in NHS Lothian compared to 10.0% in NHS Western Isles). The Boards with the greatest variation between their GP Practices are NHS Highland, NHS Borders, NHS Greater Glasgow & Clyde; they all have interquartile ranges greater than 5%. There are 22 GP practices whose prescribing of strong anticholinergics in older people is identified as outlying within their NHS Board area. Anticholinergics - NHS Board Trend
0%
2%
4%
6%
8%
10%
12%
WI
GG
C
SHET
LAN
D
D&
G
HIG
HLA
ND
LAN
AR
KSH
IRE
BO
RD
ERS
FV
A&
A
TAY
SID
E
FIFE
GR
AM
PIA
N
OR
KN
EY
LOTH
IAN
SCO
TLA
ND
Nu
mb
er o
f p
atie
nts
75
yea
rs o
r o
lder
dis
pen
sed
ove
r 1
0 it
ems
of
stro
ng
or
very
str
on
g an
tich
olin
ergi
cs (
mA
RS
3 a
nd
2)
in 1
2 m
on
ths
as a
per
cen
tage
of
regi
ster
ed p
atie
nts
age
d 7
5 y
ears
or
old
er
January to December 2015 January to December 2016 January to December 2017
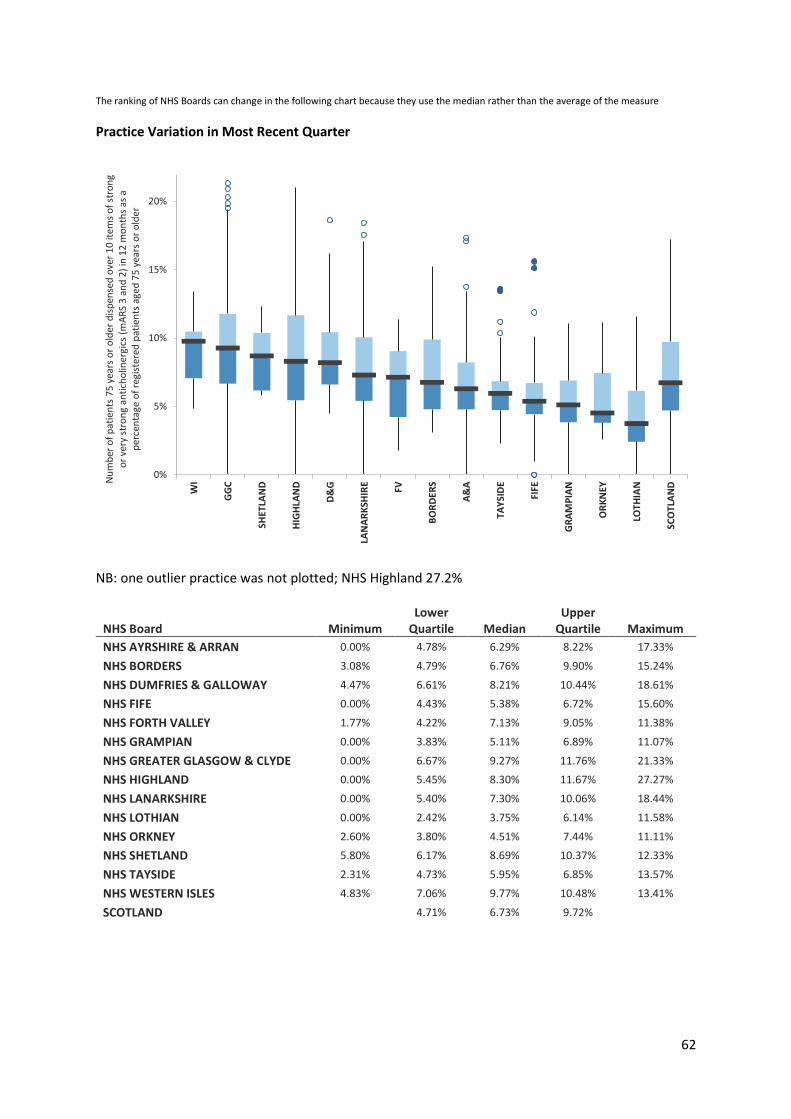
62
The ranking of NHS Boards can change in the following chart because they use the median rather than the average of the measure
Practice Variation in Most Recent Quarter
NB: one outlier practice was not plotted; NHS Highland 27.2%
NHS Board Minimum Lower
Quartile Median Upper
Quartile Maximum
NHS AYRSHIRE & ARRAN 0.00% 4.78% 6.29% 8.22% 17.33%
NHS BORDERS 3.08% 4.79% 6.76% 9.90% 15.24%
NHS DUMFRIES & GALLOWAY 4.47% 6.61% 8.21% 10.44% 18.61%
NHS FIFE 0.00% 4.43% 5.38% 6.72% 15.60%
NHS FORTH VALLEY 1.77% 4.22% 7.13% 9.05% 11.38%
NHS GRAMPIAN 0.00% 3.83% 5.11% 6.89% 11.07%
NHS GREATER GLASGOW & CLYDE 0.00% 6.67% 9.27% 11.76% 21.33%
NHS HIGHLAND 0.00% 5.45% 8.30% 11.67% 27.27%
NHS LANARKSHIRE 0.00% 5.40% 7.30% 10.06% 18.44%
NHS LOTHIAN 0.00% 2.42% 3.75% 6.14% 11.58%
NHS ORKNEY 2.60% 3.80% 4.51% 7.44% 11.11%
NHS SHETLAND 5.80% 6.17% 8.69% 10.37% 12.33%
NHS TAYSIDE 2.31% 4.73% 5.95% 6.85% 13.57%
NHS WESTERN ISLES 4.83% 7.06% 9.77% 10.48% 13.41%
SCOTLAND 4.71% 6.73% 9.72%
0%
5%
10%
15%
20%W
I
GG
C
SHET
LAN
D
HIG
HLA
ND
D&
G
LAN
AR
KSH
IRE
FV
BO
RD
ERS
A&
A
TAY
SID
E
FIFE
GR
AM
PIA
N
OR
KN
EY
LOTH
IAN
SCO
TLA
NDN
um
ber
of
pat
ien
ts 7
5 y
ears
or
old
er d
isp
ense
d o
ver
10
item
s o
f st
ron
g o
r ve
ry s
tro
ng
anti
cho
liner
gics
(m
AR
S 3
an
d 2
) in
12
mo
nth
s as
a
per
cen
tage
of
regi
ster
ed p
atie
nts
age
d 7
5 y
ears
or
old
er
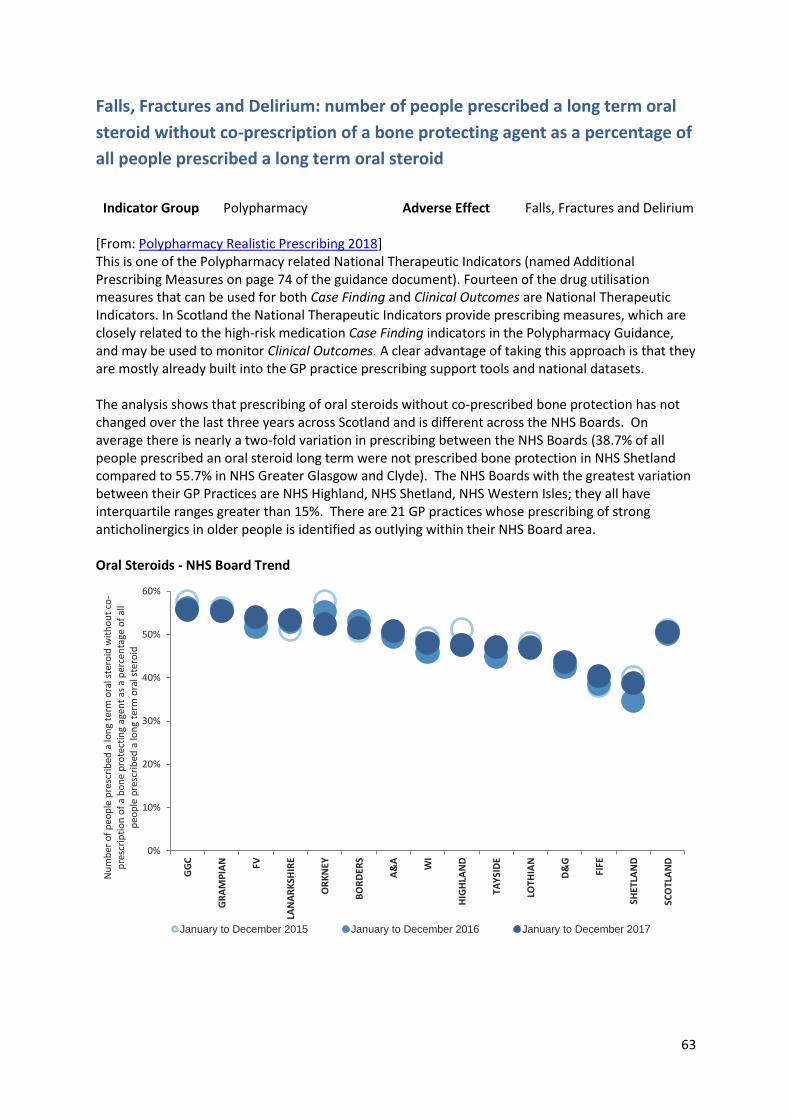
63
Falls, Fractures and Delirium: number of people prescribed a long term oral
steroid without co-prescription of a bone protecting agent as a percentage of
all people prescribed a long term oral steroid
Indicator Group Polypharmacy Adverse Effect Falls, Fractures and Delirium
[From: Polypharmacy Realistic Prescribing 2018] This is one of the Polypharmacy related National Therapeutic Indicators (named Additional Prescribing Measures on page 74 of the guidance document). Fourteen of the drug utilisation measures that can be used for both Case Finding and Clinical Outcomes are National Therapeutic Indicators. In Scotland the National Therapeutic Indicators provide prescribing measures, which are closely related to the high-risk medication Case Finding indicators in the Polypharmacy Guidance, and may be used to monitor Clinical Outcomes. A clear advantage of taking this approach is that they are mostly already built into the GP practice prescribing support tools and national datasets. The analysis shows that prescribing of oral steroids without co-prescribed bone protection has not changed over the last three years across Scotland and is different across the NHS Boards. On average there is nearly a two-fold variation in prescribing between the NHS Boards (38.7% of all people prescribed an oral steroid long term were not prescribed bone protection in NHS Shetland compared to 55.7% in NHS Greater Glasgow and Clyde). The NHS Boards with the greatest variation between their GP Practices are NHS Highland, NHS Shetland, NHS Western Isles; they all have interquartile ranges greater than 15%. There are 21 GP practices whose prescribing of strong anticholinergics in older people is identified as outlying within their NHS Board area. Oral Steroids - NHS Board Trend
0%
10%
20%
30%
40%
50%
60%
GG
C
GR
AM
PIA
N FV
LAN
AR
KSH
IRE
OR
KN
EY
BO
RD
ERS
A&
A
WI
HIG
HLA
ND
TAY
SID
E
LOTH
IAN
D&
G
FIFE
SHET
LAN
D
SCO
TLA
ND
Nu
mb
er o
f p
eop
le p
resc
rib
ed a
lon
g te
rm o
ral s
tero
id w
ith
ou
t co
-p
resc
rip
tio
n o
f a
bo
ne
pro
tect
ing
agen
t as
a p
erce
nta
ge o
f al
l p
eop
le p
resc
rib
ed a
lon
g te
rm o
ral s
tero
id
January to December 2015 January to December 2016 January to December 2017
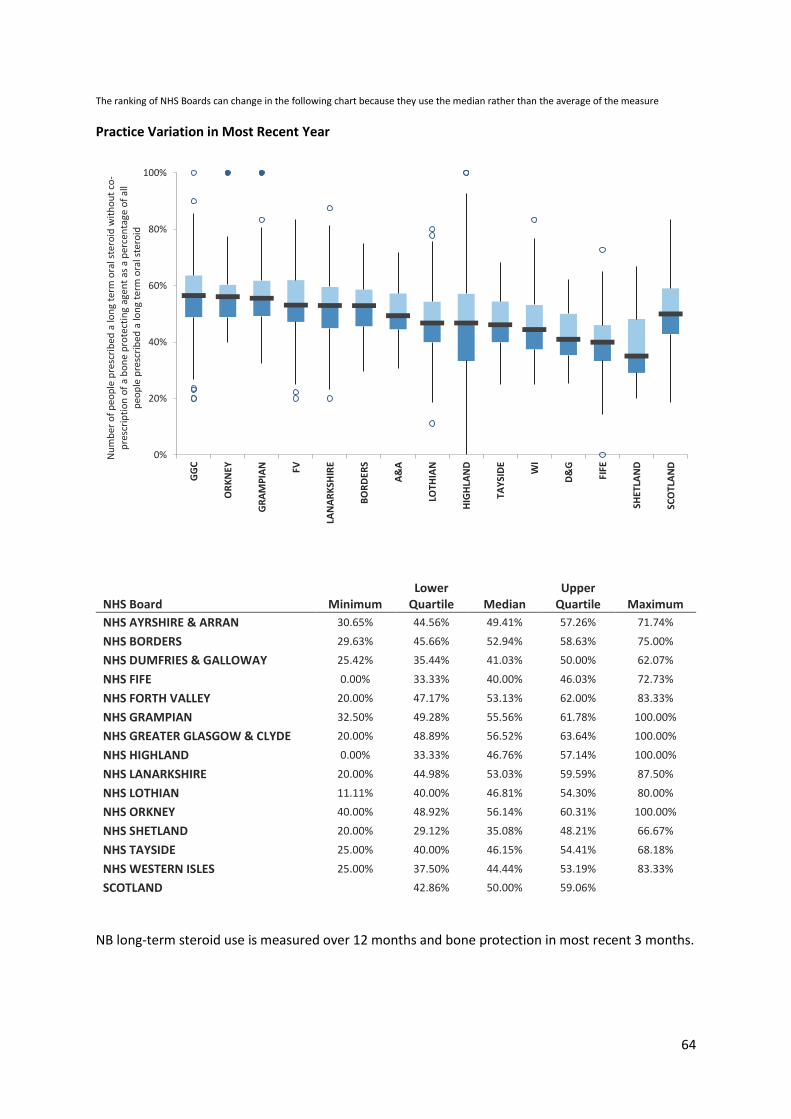
64
The ranking of NHS Boards can change in the following chart because they use the median rather than the average of the measure
Practice Variation in Most Recent Year
NHS Board Minimum Lower
Quartile Median Upper
Quartile Maximum
NHS AYRSHIRE & ARRAN 30.65% 44.56% 49.41% 57.26% 71.74%
NHS BORDERS 29.63% 45.66% 52.94% 58.63% 75.00%
NHS DUMFRIES & GALLOWAY 25.42% 35.44% 41.03% 50.00% 62.07%
NHS FIFE 0.00% 33.33% 40.00% 46.03% 72.73%
NHS FORTH VALLEY 20.00% 47.17% 53.13% 62.00% 83.33%
NHS GRAMPIAN 32.50% 49.28% 55.56% 61.78% 100.00%
NHS GREATER GLASGOW & CLYDE 20.00% 48.89% 56.52% 63.64% 100.00%
NHS HIGHLAND 0.00% 33.33% 46.76% 57.14% 100.00%
NHS LANARKSHIRE 20.00% 44.98% 53.03% 59.59% 87.50%
NHS LOTHIAN 11.11% 40.00% 46.81% 54.30% 80.00%
NHS ORKNEY 40.00% 48.92% 56.14% 60.31% 100.00%
NHS SHETLAND 20.00% 29.12% 35.08% 48.21% 66.67%
NHS TAYSIDE 25.00% 40.00% 46.15% 54.41% 68.18%
NHS WESTERN ISLES 25.00% 37.50% 44.44% 53.19% 83.33%
SCOTLAND 42.86% 50.00% 59.06%
NB long-term steroid use is measured over 12 months and bone protection in most recent 3 months.
0%
20%
40%
60%
80%
100%
GG
C
OR
KN
EY
GR
AM
PIA
N FV
LAN
AR
KSH
IRE
BO
RD
ERS
A&
A
LOTH
IAN
HIG
HLA
ND
TAY
SID
E
WI
D&
G
FIFE
SHET
LAN
D
SCO
TLA
ND
Nu
mb
er o
f p
eop
le p
resc
rib
ed a
lon
g te
rm o
ral s
tero
id w
ith
ou
t co
-p
resc
rip
tio
n o
f a
bo
ne
pro
tect
ing
agen
t as
a p
erce
nta
ge o
f al
l p
eop
le p
resc
rib
ed a
lon
g te
rm o
ral s
tero
id
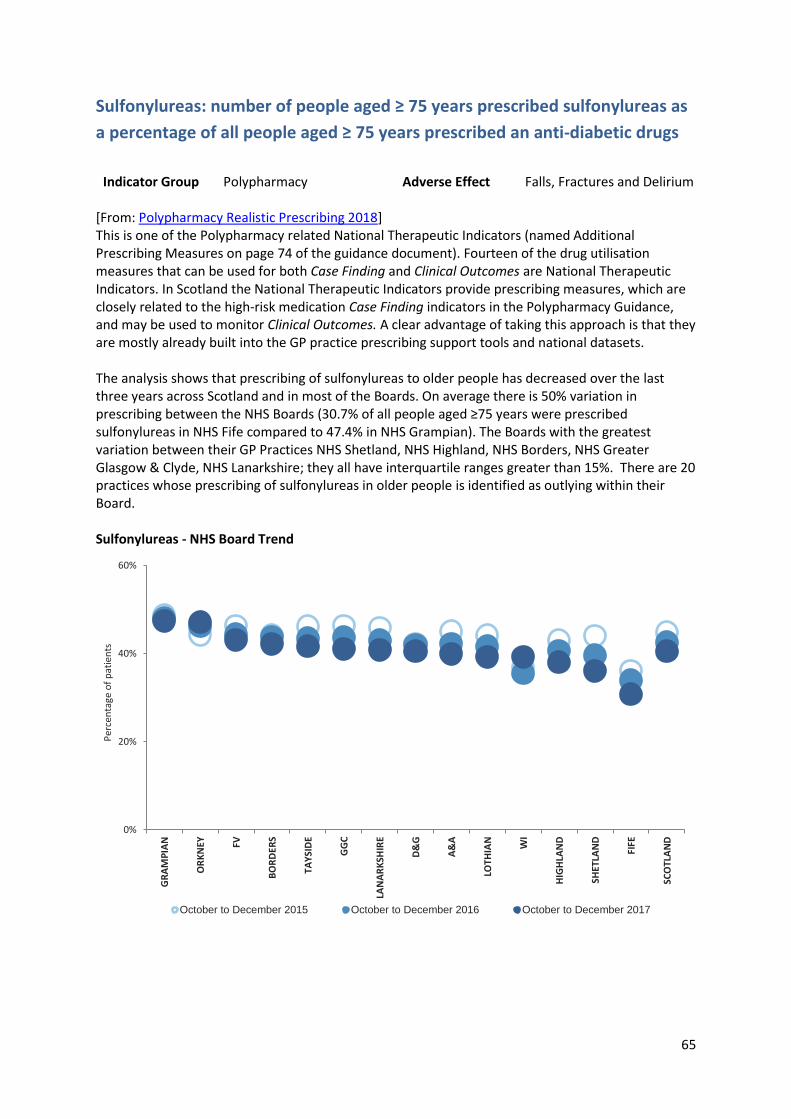
65
Sulfonylureas: number of people aged ≥ 75 years prescribed sulfonylureas as
a percentage of all people aged ≥ 75 years prescribed an anti-diabetic drugs
Indicator Group Polypharmacy Adverse Effect Falls, Fractures and Delirium
[From: Polypharmacy Realistic Prescribing 2018] This is one of the Polypharmacy related National Therapeutic Indicators (named Additional Prescribing Measures on page 74 of the guidance document). Fourteen of the drug utilisation measures that can be used for both Case Finding and Clinical Outcomes are National Therapeutic Indicators. In Scotland the National Therapeutic Indicators provide prescribing measures, which are closely related to the high-risk medication Case Finding indicators in the Polypharmacy Guidance, and may be used to monitor Clinical Outcomes. A clear advantage of taking this approach is that they are mostly already built into the GP practice prescribing support tools and national datasets. The analysis shows that prescribing of sulfonylureas to older people has decreased over the last three years across Scotland and in most of the Boards. On average there is 50% variation in prescribing between the NHS Boards (30.7% of all people aged ≥75 years were prescribed sulfonylureas in NHS Fife compared to 47.4% in NHS Grampian). The Boards with the greatest variation between their GP Practices NHS Shetland, NHS Highland, NHS Borders, NHS Greater Glasgow & Clyde, NHS Lanarkshire; they all have interquartile ranges greater than 15%. There are 20 practices whose prescribing of sulfonylureas in older people is identified as outlying within their Board. Sulfonylureas - NHS Board Trend
0%
20%
40%
60%
GR
AM
PIA
N
OR
KN
EY FV
BO
RD
ERS
TAY
SID
E
GG
C
LAN
AR
KSH
IRE
D&
G
A&
A
LOTH
IAN
WI
HIG
HLA
ND
SHET
LAN
D
FIFE
SCO
TLA
ND
Per
cen
tage
of
pat
ien
ts
October to December 2015 October to December 2016 October to December 2017
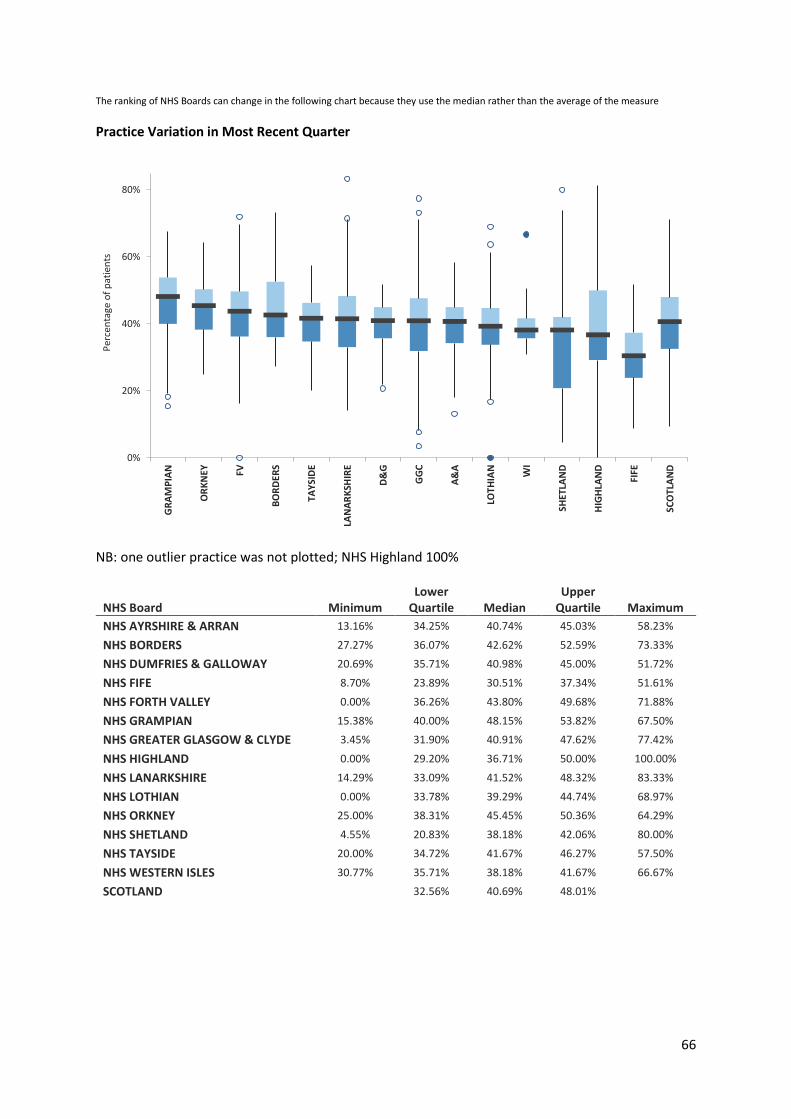
66
The ranking of NHS Boards can change in the following chart because they use the median rather than the average of the measure
Practice Variation in Most Recent Quarter
NB: one outlier practice was not plotted; NHS Highland 100%
NHS Board Minimum Lower
Quartile Median Upper
Quartile Maximum
NHS AYRSHIRE & ARRAN 13.16% 34.25% 40.74% 45.03% 58.23%
NHS BORDERS 27.27% 36.07% 42.62% 52.59% 73.33%
NHS DUMFRIES & GALLOWAY 20.69% 35.71% 40.98% 45.00% 51.72%
NHS FIFE 8.70% 23.89% 30.51% 37.34% 51.61%
NHS FORTH VALLEY 0.00% 36.26% 43.80% 49.68% 71.88%
NHS GRAMPIAN 15.38% 40.00% 48.15% 53.82% 67.50%
NHS GREATER GLASGOW & CLYDE 3.45% 31.90% 40.91% 47.62% 77.42%
NHS HIGHLAND 0.00% 29.20% 36.71% 50.00% 100.00%
NHS LANARKSHIRE 14.29% 33.09% 41.52% 48.32% 83.33%
NHS LOTHIAN 0.00% 33.78% 39.29% 44.74% 68.97%
NHS ORKNEY 25.00% 38.31% 45.45% 50.36% 64.29%
NHS SHETLAND 4.55% 20.83% 38.18% 42.06% 80.00%
NHS TAYSIDE 20.00% 34.72% 41.67% 46.27% 57.50%
NHS WESTERN ISLES 30.77% 35.71% 38.18% 41.67% 66.67%
SCOTLAND 32.56% 40.69% 48.01%
0%
20%
40%
60%
80%
GR
AM
PIA
N
OR
KN
EY FV
BO
RD
ERS
TAY
SID
E
LAN
AR
KSH
IRE
D&
G
GG
C
A&
A
LOTH
IAN
WI
SHET
LAN
D
HIG
HLA
ND
FIFE
SCO
TLA
ND
Per
cen
tage
of
pat
ien
ts
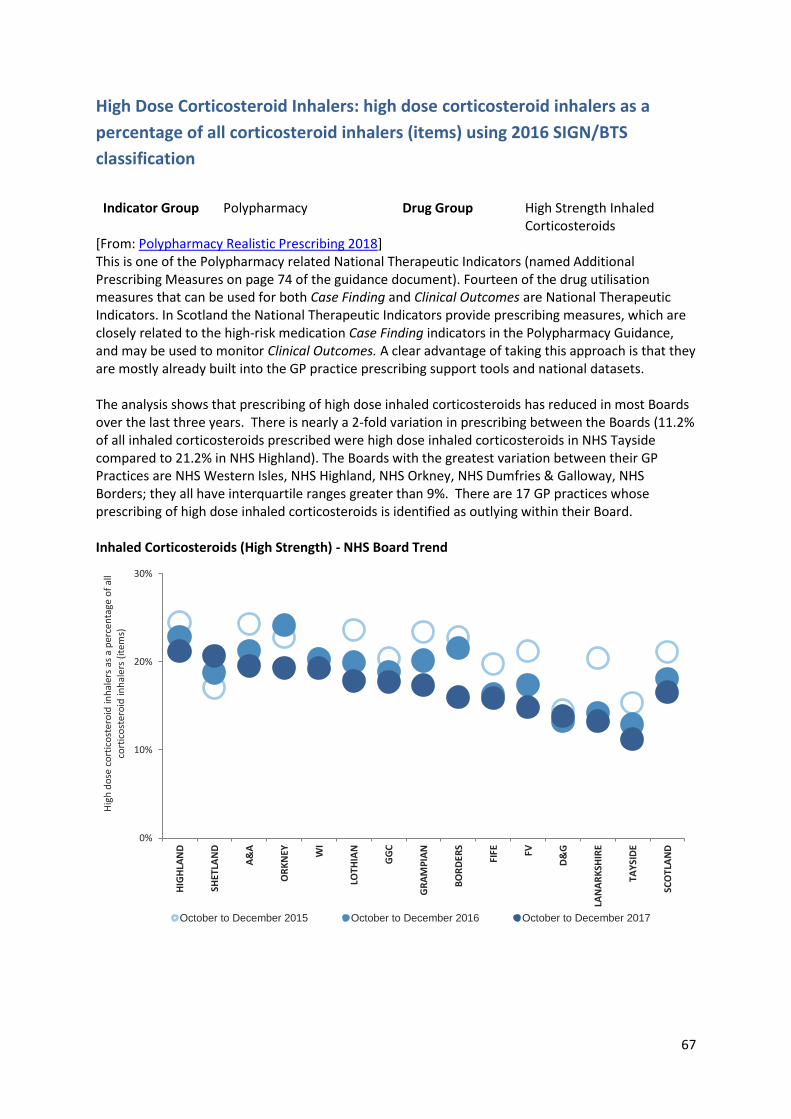
67
High Dose Corticosteroid Inhalers: high dose corticosteroid inhalers as a
percentage of all corticosteroid inhalers (items) using 2016 SIGN/BTS
classification
Indicator Group Polypharmacy Drug Group High Strength Inhaled
Corticosteroids [From: Polypharmacy Realistic Prescribing 2018] This is one of the Polypharmacy related National Therapeutic Indicators (named Additional Prescribing Measures on page 74 of the guidance document). Fourteen of the drug utilisation measures that can be used for both Case Finding and Clinical Outcomes are National Therapeutic Indicators. In Scotland the National Therapeutic Indicators provide prescribing measures, which are closely related to the high-risk medication Case Finding indicators in the Polypharmacy Guidance, and may be used to monitor Clinical Outcomes. A clear advantage of taking this approach is that they are mostly already built into the GP practice prescribing support tools and national datasets. The analysis shows that prescribing of high dose inhaled corticosteroids has reduced in most Boards over the last three years. There is nearly a 2-fold variation in prescribing between the Boards (11.2% of all inhaled corticosteroids prescribed were high dose inhaled corticosteroids in NHS Tayside compared to 21.2% in NHS Highland). The Boards with the greatest variation between their GP Practices are NHS Western Isles, NHS Highland, NHS Orkney, NHS Dumfries & Galloway, NHS Borders; they all have interquartile ranges greater than 9%. There are 17 GP practices whose prescribing of high dose inhaled corticosteroids is identified as outlying within their Board.
Inhaled Corticosteroids (High Strength) - NHS Board Trend
0%
10%
20%
30%
HIG
HLA
ND
SHET
LAN
D
A&
A
OR
KN
EY WI
LOTH
IAN
GG
C
GR
AM
PIA
N
BO
RD
ERS
FIFE FV
D&
G
LAN
AR
KSH
IRE
TAY
SID
E
SCO
TLA
ND
Hig
h d
ose
co
rtic
ost
ero
id in
hal
ers
as a
per
cen
tage
of
all
cort
ico
ster
oid
inh
aler
s (i
tem
s)
October to December 2015 October to December 2016 October to December 2017
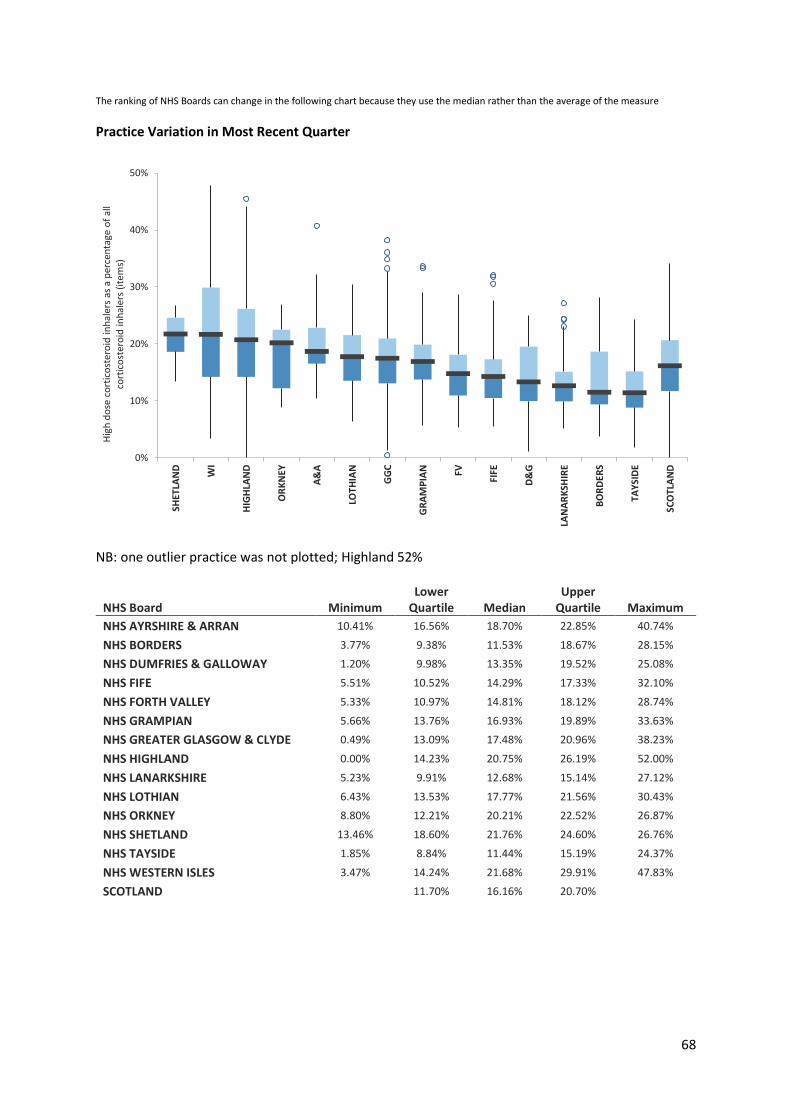
68
The ranking of NHS Boards can change in the following chart because they use the median rather than the average of the measure
Practice Variation in Most Recent Quarter
NB: one outlier practice was not plotted; Highland 52%
NHS Board Minimum Lower
Quartile Median Upper
Quartile Maximum
NHS AYRSHIRE & ARRAN 10.41% 16.56% 18.70% 22.85% 40.74%
NHS BORDERS 3.77% 9.38% 11.53% 18.67% 28.15%
NHS DUMFRIES & GALLOWAY 1.20% 9.98% 13.35% 19.52% 25.08%
NHS FIFE 5.51% 10.52% 14.29% 17.33% 32.10%
NHS FORTH VALLEY 5.33% 10.97% 14.81% 18.12% 28.74%
NHS GRAMPIAN 5.66% 13.76% 16.93% 19.89% 33.63%
NHS GREATER GLASGOW & CLYDE 0.49% 13.09% 17.48% 20.96% 38.23%
NHS HIGHLAND 0.00% 14.23% 20.75% 26.19% 52.00%
NHS LANARKSHIRE 5.23% 9.91% 12.68% 15.14% 27.12%
NHS LOTHIAN 6.43% 13.53% 17.77% 21.56% 30.43%
NHS ORKNEY 8.80% 12.21% 20.21% 22.52% 26.87%
NHS SHETLAND 13.46% 18.60% 21.76% 24.60% 26.76%
NHS TAYSIDE 1.85% 8.84% 11.44% 15.19% 24.37%
NHS WESTERN ISLES 3.47% 14.24% 21.68% 29.91% 47.83%
SCOTLAND 11.70% 16.16% 20.70%
0%
10%
20%
30%
40%
50%SH
ETLA
ND
WI
HIG
HLA
ND
OR
KN
EY
A&
A
LOTH
IAN
GG
C
GR
AM
PIA
N FV
FIFE
D&
G
LAN
AR
KSH
IRE
BO
RD
ERS
TAY
SID
E
SCO
TLA
ND
Hig
h d
ose
co
rtic
ost
ero
id in
hal
ers
as a
per
cen
tage
of
all
cort
ico
ster
oid
inh
aler
s (i
tem
s)
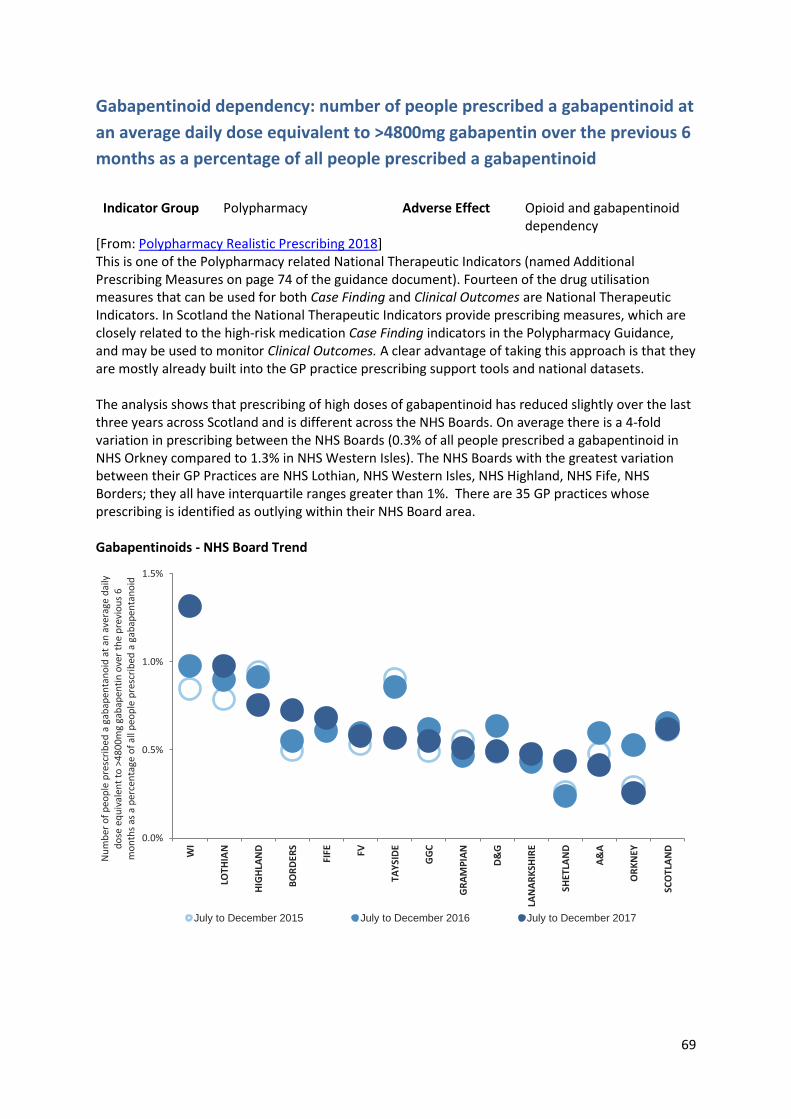
69
Gabapentinoid dependency: number of people prescribed a gabapentinoid at
an average daily dose equivalent to >4800mg gabapentin over the previous 6
months as a percentage of all people prescribed a gabapentinoid
Indicator Group Polypharmacy Adverse Effect Opioid and gabapentinoid
dependency [From: Polypharmacy Realistic Prescribing 2018] This is one of the Polypharmacy related National Therapeutic Indicators (named Additional Prescribing Measures on page 74 of the guidance document). Fourteen of the drug utilisation measures that can be used for both Case Finding and Clinical Outcomes are National Therapeutic Indicators. In Scotland the National Therapeutic Indicators provide prescribing measures, which are closely related to the high-risk medication Case Finding indicators in the Polypharmacy Guidance, and may be used to monitor Clinical Outcomes. A clear advantage of taking this approach is that they are mostly already built into the GP practice prescribing support tools and national datasets. The analysis shows that prescribing of high doses of gabapentinoid has reduced slightly over the last three years across Scotland and is different across the NHS Boards. On average there is a 4-fold variation in prescribing between the NHS Boards (0.3% of all people prescribed a gabapentinoid in NHS Orkney compared to 1.3% in NHS Western Isles). The NHS Boards with the greatest variation between their GP Practices are NHS Lothian, NHS Western Isles, NHS Highland, NHS Fife, NHS Borders; they all have interquartile ranges greater than 1%. There are 35 GP practices whose prescribing is identified as outlying within their NHS Board area. Gabapentinoids - NHS Board Trend
0.0%
0.5%
1.0%
1.5%
WI
LOTH
IAN
HIG
HLA
ND
BO
RD
ERS
FIFE FV
TAY
SID
E
GG
C
GR
AM
PIA
N
D&
G
LAN
AR
KSH
IRE
SHET
LAN
D
A&
A
OR
KN
EY
SCO
TLA
ND
Nu
mb
er o
f p
eop
le p
resc
rib
ed a
gab
apen
tan
oid
at
an a
vera
ge d
aily
d
ose
eq
uiv
alen
t to
>4
80
0m
g ga
bap
enti
n o
ver
the
pre
vio
us
6
mo
nth
s as
a p
erce
nta
ge o
f al
l peo
ple
pre
scri
bed
a g
abap
enta
no
id
July to December 2015 July to December 2016 July to December 2017
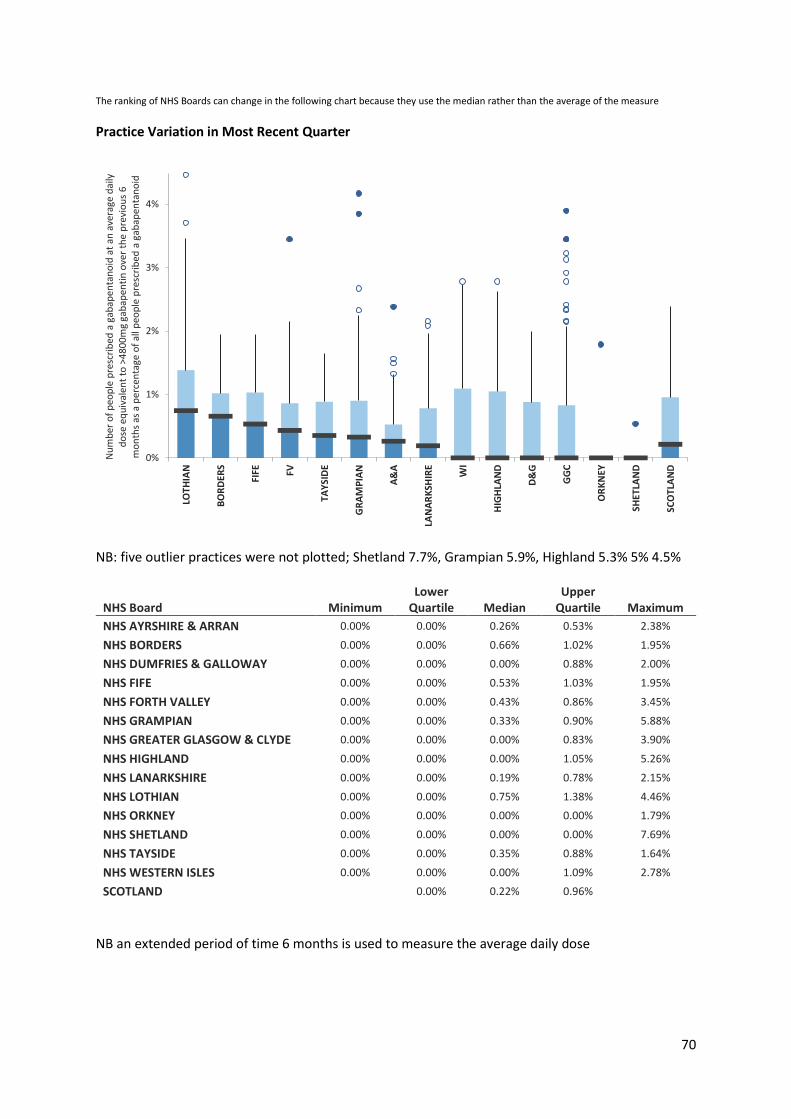
70
The ranking of NHS Boards can change in the following chart because they use the median rather than the average of the measure
Practice Variation in Most Recent Quarter
NB: five outlier practices were not plotted; Shetland 7.7%, Grampian 5.9%, Highland 5.3% 5% 4.5%
NHS Board Minimum Lower
Quartile Median Upper
Quartile Maximum
NHS AYRSHIRE & ARRAN 0.00% 0.00% 0.26% 0.53% 2.38%
NHS BORDERS 0.00% 0.00% 0.66% 1.02% 1.95%
NHS DUMFRIES & GALLOWAY 0.00% 0.00% 0.00% 0.88% 2.00%
NHS FIFE 0.00% 0.00% 0.53% 1.03% 1.95%
NHS FORTH VALLEY 0.00% 0.00% 0.43% 0.86% 3.45%
NHS GRAMPIAN 0.00% 0.00% 0.33% 0.90% 5.88%
NHS GREATER GLASGOW & CLYDE 0.00% 0.00% 0.00% 0.83% 3.90%
NHS HIGHLAND 0.00% 0.00% 0.00% 1.05% 5.26%
NHS LANARKSHIRE 0.00% 0.00% 0.19% 0.78% 2.15%
NHS LOTHIAN 0.00% 0.00% 0.75% 1.38% 4.46%
NHS ORKNEY 0.00% 0.00% 0.00% 0.00% 1.79%
NHS SHETLAND 0.00% 0.00% 0.00% 0.00% 7.69%
NHS TAYSIDE 0.00% 0.00% 0.35% 0.88% 1.64%
NHS WESTERN ISLES 0.00% 0.00% 0.00% 1.09% 2.78%
SCOTLAND 0.00% 0.22% 0.96%
NB an extended period of time 6 months is used to measure the average daily dose
0%
1%
2%
3%
4%
LOTH
IAN
BO
RD
ERS
FIFE FV
TAY
SID
E
GR
AM
PIA
N
A&
A
LAN
AR
KSH
IRE
WI
HIG
HLA
ND
D&
G
GG
C
OR
KN
EY
SHET
LAN
D
SCO
TLA
ND
Nu
mb
er o
f p
eop
le p
resc
rib
ed a
gab
apen
tan
oid
at
an a
vera
ge d
aily
d
ose
eq
uiv
alen
t to
>4
80
0m
g ga
bap
enti
n o
ver
the
pre
vio
us
6
mo
nth
s as
a p
erce
nta
ge o
f al
l peo
ple
pre
scri
bed
a g
abap
enta
no
id
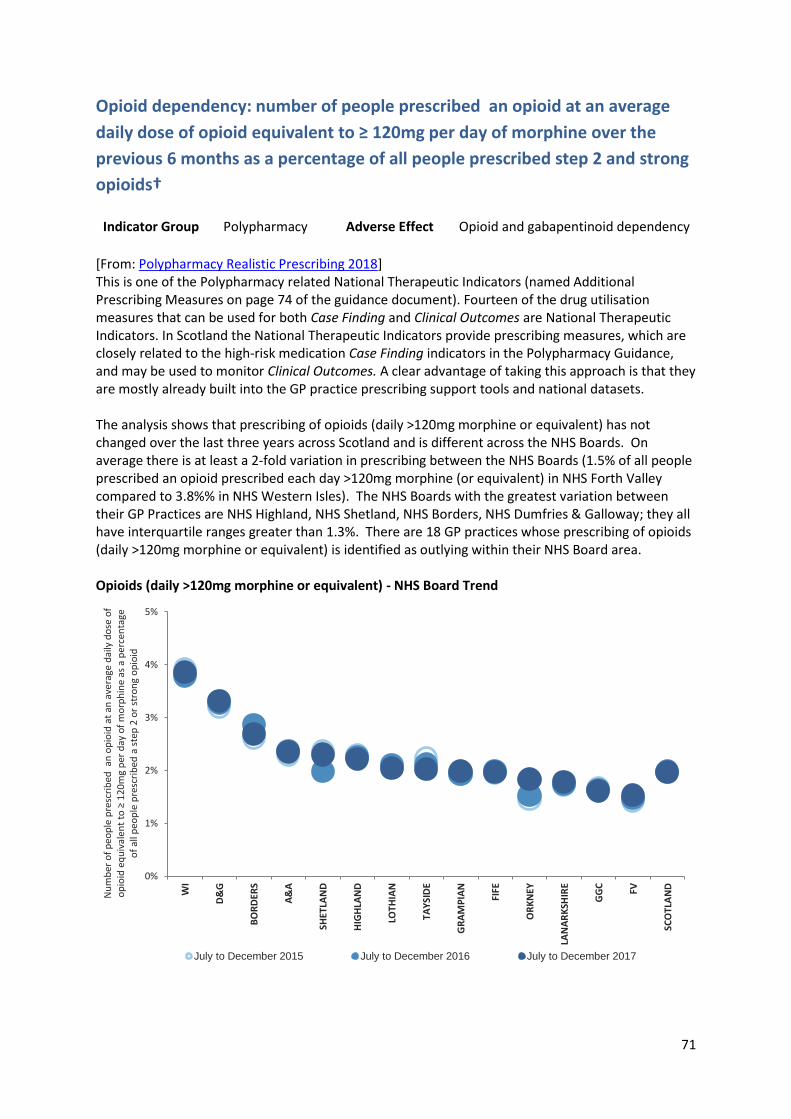
71
Opioid dependency: number of people prescribed an opioid at an average
daily dose of opioid equivalent to ≥ 120mg per day of morphine over the
previous 6 months as a percentage of all people prescribed step 2 and strong
opioids†
Indicator Group Polypharmacy Adverse Effect Opioid and gabapentinoid dependency
[From: Polypharmacy Realistic Prescribing 2018] This is one of the Polypharmacy related National Therapeutic Indicators (named Additional Prescribing Measures on page 74 of the guidance document). Fourteen of the drug utilisation measures that can be used for both Case Finding and Clinical Outcomes are National Therapeutic Indicators. In Scotland the National Therapeutic Indicators provide prescribing measures, which are closely related to the high-risk medication Case Finding indicators in the Polypharmacy Guidance, and may be used to monitor Clinical Outcomes. A clear advantage of taking this approach is that they are mostly already built into the GP practice prescribing support tools and national datasets. The analysis shows that prescribing of opioids (daily >120mg morphine or equivalent) has not changed over the last three years across Scotland and is different across the NHS Boards. On average there is at least a 2-fold variation in prescribing between the NHS Boards (1.5% of all people prescribed an opioid prescribed each day >120mg morphine (or equivalent) in NHS Forth Valley compared to 3.8%% in NHS Western Isles). The NHS Boards with the greatest variation between their GP Practices are NHS Highland, NHS Shetland, NHS Borders, NHS Dumfries & Galloway; they all have interquartile ranges greater than 1.3%. There are 18 GP practices whose prescribing of opioids (daily >120mg morphine or equivalent) is identified as outlying within their NHS Board area. Opioids (daily >120mg morphine or equivalent) - NHS Board Trend
0%
1%
2%
3%
4%
5%
WI
D&
G
BO
RD
ERS
A&
A
SHET
LAN
D
HIG
HLA
ND
LOTH
IAN
TAY
SID
E
GR
AM
PIA
N
FIFE
OR
KN
EY
LAN
AR
KSH
IRE
GG
C
FV
SCO
TLA
ND
Nu
mb
er o
f p
eop
le p
resc
rib
ed a
n o
pio
id a
t an
ave
rage
dai
ly d
ose
of
op
ioid
eq
uiv
alen
t to
≥ 1
20
mg
per
day
of
mo
rph
ine
as a
per
cen
tage
o
f al
l peo
ple
pre
scri
bed
a s
tep
2 o
r st
ron
g o
pio
id
July to December 2015 July to December 2016 July to December 2017
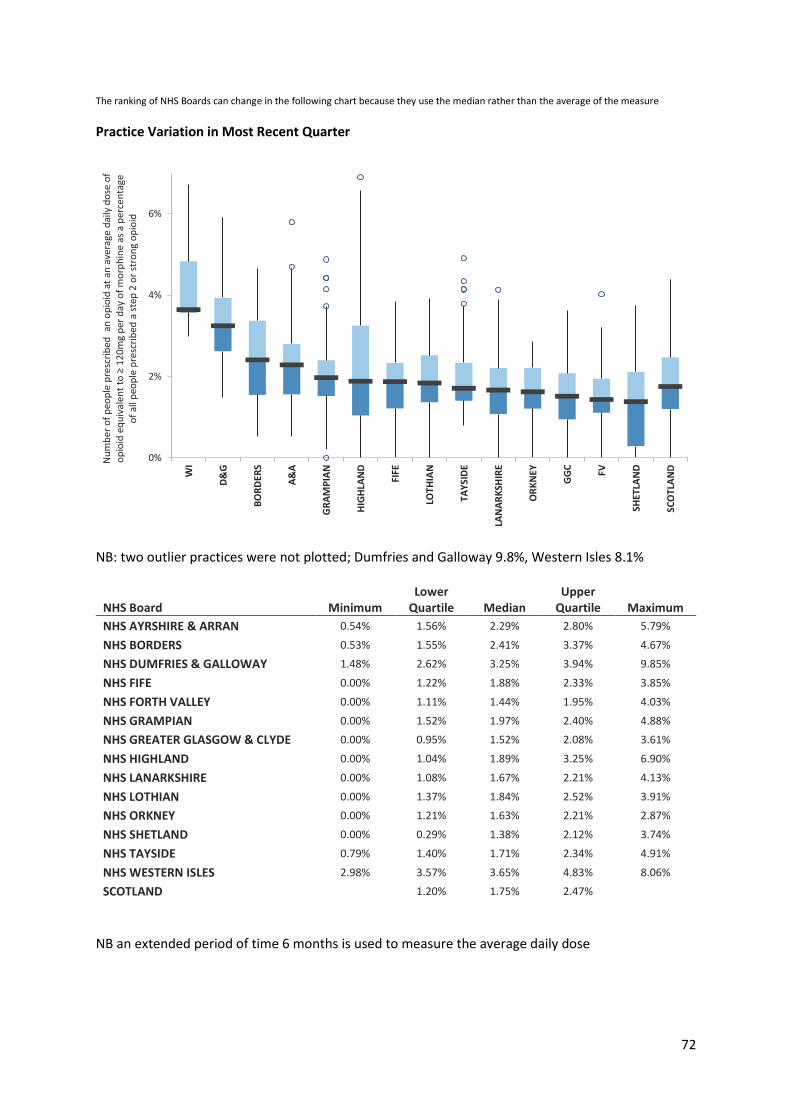
72
The ranking of NHS Boards can change in the following chart because they use the median rather than the average of the measure
Practice Variation in Most Recent Quarter
NB: two outlier practices were not plotted; Dumfries and Galloway 9.8%, Western Isles 8.1%
NHS Board Minimum Lower
Quartile Median Upper
Quartile Maximum
NHS AYRSHIRE & ARRAN 0.54% 1.56% 2.29% 2.80% 5.79%
NHS BORDERS 0.53% 1.55% 2.41% 3.37% 4.67%
NHS DUMFRIES & GALLOWAY 1.48% 2.62% 3.25% 3.94% 9.85%
NHS FIFE 0.00% 1.22% 1.88% 2.33% 3.85%
NHS FORTH VALLEY 0.00% 1.11% 1.44% 1.95% 4.03%
NHS GRAMPIAN 0.00% 1.52% 1.97% 2.40% 4.88%
NHS GREATER GLASGOW & CLYDE 0.00% 0.95% 1.52% 2.08% 3.61%
NHS HIGHLAND 0.00% 1.04% 1.89% 3.25% 6.90%
NHS LANARKSHIRE 0.00% 1.08% 1.67% 2.21% 4.13%
NHS LOTHIAN 0.00% 1.37% 1.84% 2.52% 3.91%
NHS ORKNEY 0.00% 1.21% 1.63% 2.21% 2.87%
NHS SHETLAND 0.00% 0.29% 1.38% 2.12% 3.74%
NHS TAYSIDE 0.79% 1.40% 1.71% 2.34% 4.91%
NHS WESTERN ISLES 2.98% 3.57% 3.65% 4.83% 8.06%
SCOTLAND 1.20% 1.75% 2.47%
NB an extended period of time 6 months is used to measure the average daily dose
0%
2%
4%
6%
WI
D&
G
BO
RD
ERS
A&
A
GR
AM
PIA
N
HIG
HLA
ND
FIFE
LOTH
IAN
TAY
SID
E
LAN
AR
KSH
IRE
OR
KN
EY
GG
C
FV
SHET
LAN
D
SCO
TLA
ND
Nu
mb
er o
f p
eop
le p
resc
rib
ed a
n o
pio
id a
t an
ave
rage
dai
ly d
ose
of
op
ioid
eq
uiv
alen
t to
≥ 1
20
mg
per
day
of
mo
rph
ine
as a
per
cen
tage
o
f al
l peo
ple
pre
scri
bed
a s
tep
2 o
r st
ron
g o
pio
id
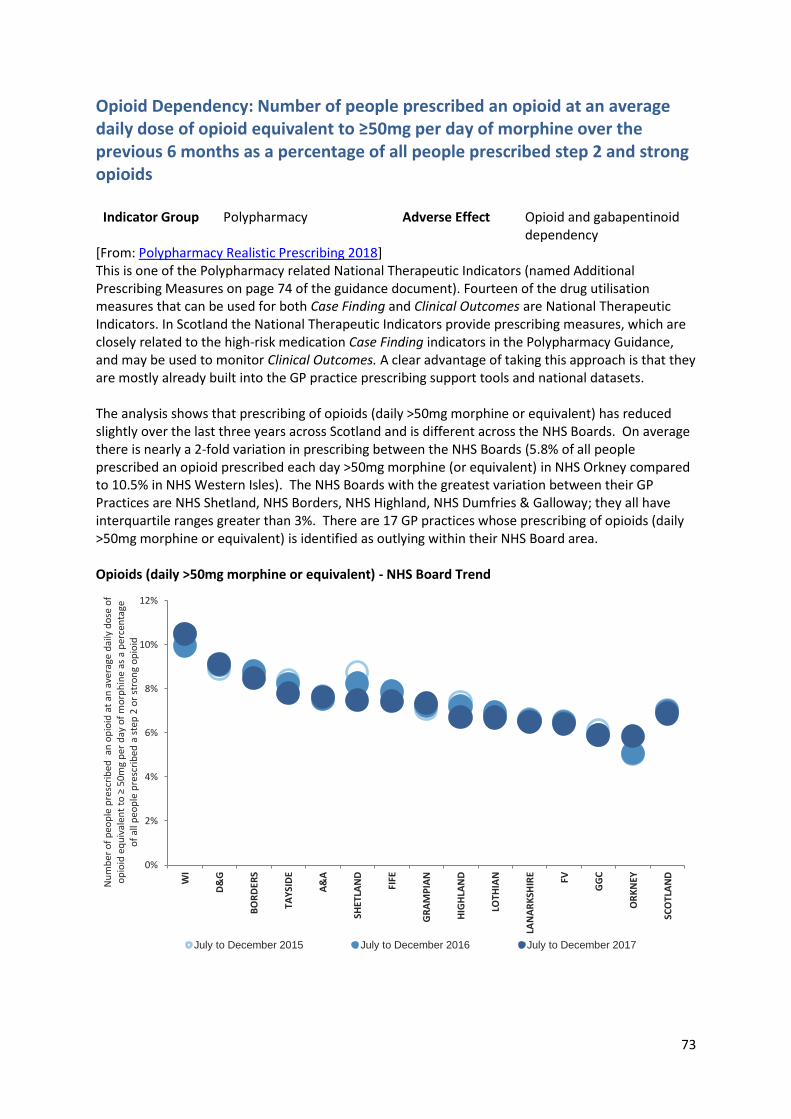
73
Opioid Dependency: Number of people prescribed an opioid at an average daily dose of opioid equivalent to ≥50mg per day of morphine over the previous 6 months as a percentage of all people prescribed step 2 and strong opioids
Indicator Group Polypharmacy Adverse Effect Opioid and gabapentinoid dependency
[From: Polypharmacy Realistic Prescribing 2018] This is one of the Polypharmacy related National Therapeutic Indicators (named Additional Prescribing Measures on page 74 of the guidance document). Fourteen of the drug utilisation measures that can be used for both Case Finding and Clinical Outcomes are National Therapeutic Indicators. In Scotland the National Therapeutic Indicators provide prescribing measures, which are closely related to the high-risk medication Case Finding indicators in the Polypharmacy Guidance, and may be used to monitor Clinical Outcomes. A clear advantage of taking this approach is that they are mostly already built into the GP practice prescribing support tools and national datasets. The analysis shows that prescribing of opioids (daily >50mg morphine or equivalent) has reduced slightly over the last three years across Scotland and is different across the NHS Boards. On average there is nearly a 2-fold variation in prescribing between the NHS Boards (5.8% of all people prescribed an opioid prescribed each day >50mg morphine (or equivalent) in NHS Orkney compared to 10.5% in NHS Western Isles). The NHS Boards with the greatest variation between their GP Practices are NHS Shetland, NHS Borders, NHS Highland, NHS Dumfries & Galloway; they all have interquartile ranges greater than 3%. There are 17 GP practices whose prescribing of opioids (daily >50mg morphine or equivalent) is identified as outlying within their NHS Board area. Opioids (daily >50mg morphine or equivalent) - NHS Board Trend
0%
2%
4%
6%
8%
10%
12%
WI
D&
G
BO
RD
ERS
TAY
SID
E
A&
A
SHET
LAN
D
FIFE
GR
AM
PIA
N
HIG
HLA
ND
LOTH
IAN
LAN
AR
KSH
IRE
FV
GG
C
OR
KN
EY
SCO
TLA
ND
Nu
mb
er o
f p
eop
le p
resc
rib
ed a
n o
pio
id a
t an
ave
rage
dai
ly d
ose
of
op
ioid
eq
uiv
alen
t to
≥ 5
0m
g p
er d
ay o
f m
orp
hin
e as
a p
erce
nta
ge
of
all p
eop
le p
resc
rib
ed a
ste
p 2
or
stro
ng
op
ioid
July to December 2015 July to December 2016 July to December 2017
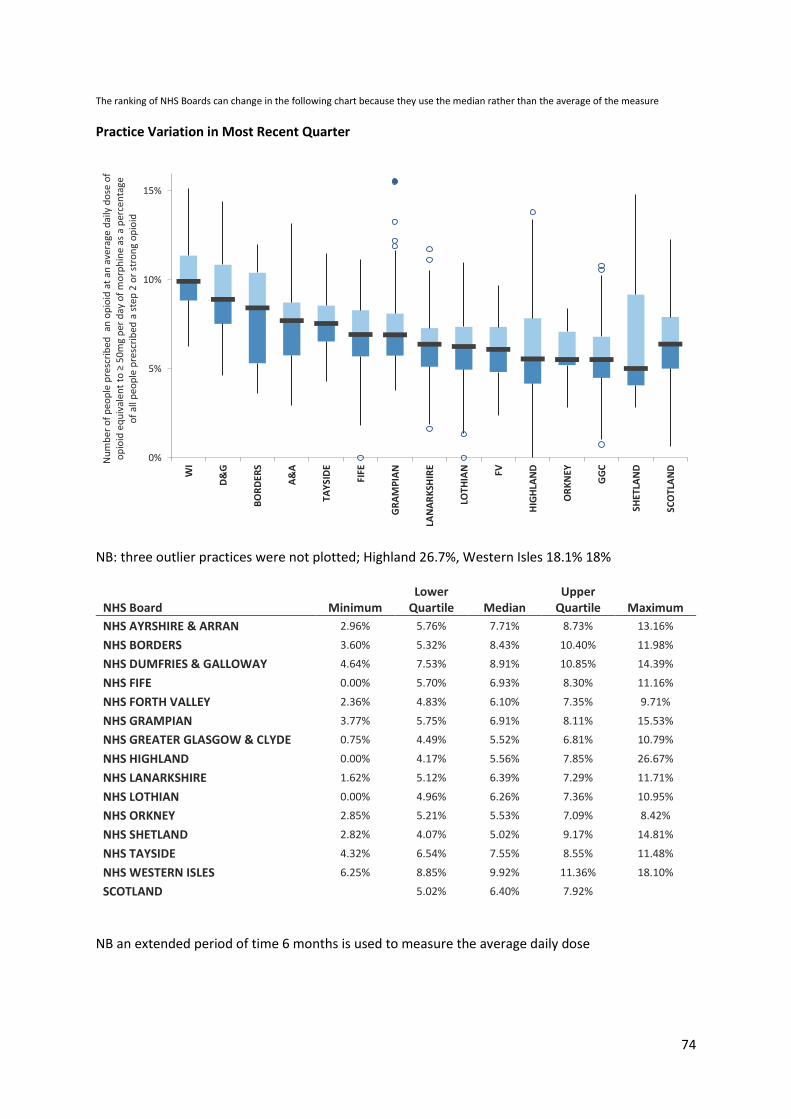
74
The ranking of NHS Boards can change in the following chart because they use the median rather than the average of the measure
Practice Variation in Most Recent Quarter
NB: three outlier practices were not plotted; Highland 26.7%, Western Isles 18.1% 18%
NHS Board Minimum Lower
Quartile Median Upper
Quartile Maximum
NHS AYRSHIRE & ARRAN 2.96% 5.76% 7.71% 8.73% 13.16%
NHS BORDERS 3.60% 5.32% 8.43% 10.40% 11.98%
NHS DUMFRIES & GALLOWAY 4.64% 7.53% 8.91% 10.85% 14.39%
NHS FIFE 0.00% 5.70% 6.93% 8.30% 11.16%
NHS FORTH VALLEY 2.36% 4.83% 6.10% 7.35% 9.71%
NHS GRAMPIAN 3.77% 5.75% 6.91% 8.11% 15.53%
NHS GREATER GLASGOW & CLYDE 0.75% 4.49% 5.52% 6.81% 10.79%
NHS HIGHLAND 0.00% 4.17% 5.56% 7.85% 26.67%
NHS LANARKSHIRE 1.62% 5.12% 6.39% 7.29% 11.71%
NHS LOTHIAN 0.00% 4.96% 6.26% 7.36% 10.95%
NHS ORKNEY 2.85% 5.21% 5.53% 7.09% 8.42%
NHS SHETLAND 2.82% 4.07% 5.02% 9.17% 14.81%
NHS TAYSIDE 4.32% 6.54% 7.55% 8.55% 11.48%
NHS WESTERN ISLES 6.25% 8.85% 9.92% 11.36% 18.10%
SCOTLAND 5.02% 6.40% 7.92%
NB an extended period of time 6 months is used to measure the average daily dose
0%
5%
10%
15%W
I
D&
G
BO
RD
ERS
A&
A
TAY
SID
E
FIFE
GR
AM
PIA
N
LAN
AR
KSH
IRE
LOTH
IAN FV
HIG
HLA
ND
OR
KN
EY
GG
C
SHET
LAN
D
SCO
TLA
ND
Nu
mb
er o
f p
eop
le p
resc
rib
ed a
n o
pio
id a
t an
ave
rage
dai
ly d
ose
of
op
ioid
eq
uiv
alen
t to
≥ 5
0m
g p
er d
ay o
f m
orp
hin
e as
a p
erce
nta
ge
of
all p
eop
le p
resc
rib
ed a
ste
p 2
or
stro
ng
op
ioid
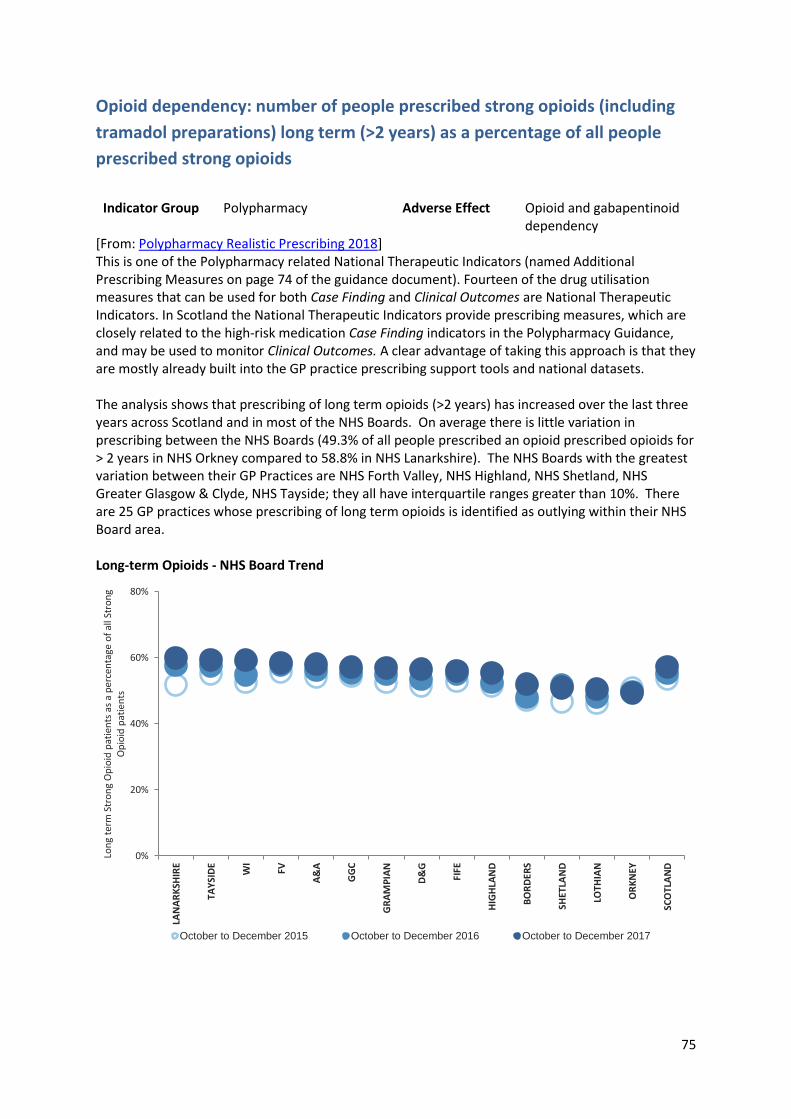
75
Opioid dependency: number of people prescribed strong opioids (including
tramadol preparations) long term (>2 years) as a percentage of all people
prescribed strong opioids
Indicator Group Polypharmacy Adverse Effect Opioid and gabapentinoid
dependency [From: Polypharmacy Realistic Prescribing 2018] This is one of the Polypharmacy related National Therapeutic Indicators (named Additional Prescribing Measures on page 74 of the guidance document). Fourteen of the drug utilisation measures that can be used for both Case Finding and Clinical Outcomes are National Therapeutic Indicators. In Scotland the National Therapeutic Indicators provide prescribing measures, which are closely related to the high-risk medication Case Finding indicators in the Polypharmacy Guidance, and may be used to monitor Clinical Outcomes. A clear advantage of taking this approach is that they are mostly already built into the GP practice prescribing support tools and national datasets. The analysis shows that prescribing of long term opioids (>2 years) has increased over the last three years across Scotland and in most of the NHS Boards. On average there is little variation in prescribing between the NHS Boards (49.3% of all people prescribed an opioid prescribed opioids for > 2 years in NHS Orkney compared to 58.8% in NHS Lanarkshire). The NHS Boards with the greatest variation between their GP Practices are NHS Forth Valley, NHS Highland, NHS Shetland, NHS Greater Glasgow & Clyde, NHS Tayside; they all have interquartile ranges greater than 10%. There are 25 GP practices whose prescribing of long term opioids is identified as outlying within their NHS Board area. Long-term Opioids - NHS Board Trend
0%
20%
40%
60%
80%
LAN
AR
KSH
IRE
TAY
SID
E
WI
FV
A&
A
GG
C
GR
AM
PIA
N
D&
G
FIFE
HIG
HLA
ND
BO
RD
ERS
SHET
LAN
D
LOTH
IAN
OR
KN
EY
SCO
TLA
ND
Lon
g te
rm S
tro
ng
Op
ioid
pat
ien
ts a
s a
per
cen
tage
of
all S
tro
ng
Op
ioid
pat
ien
ts
October to December 2015 October to December 2016 October to December 2017
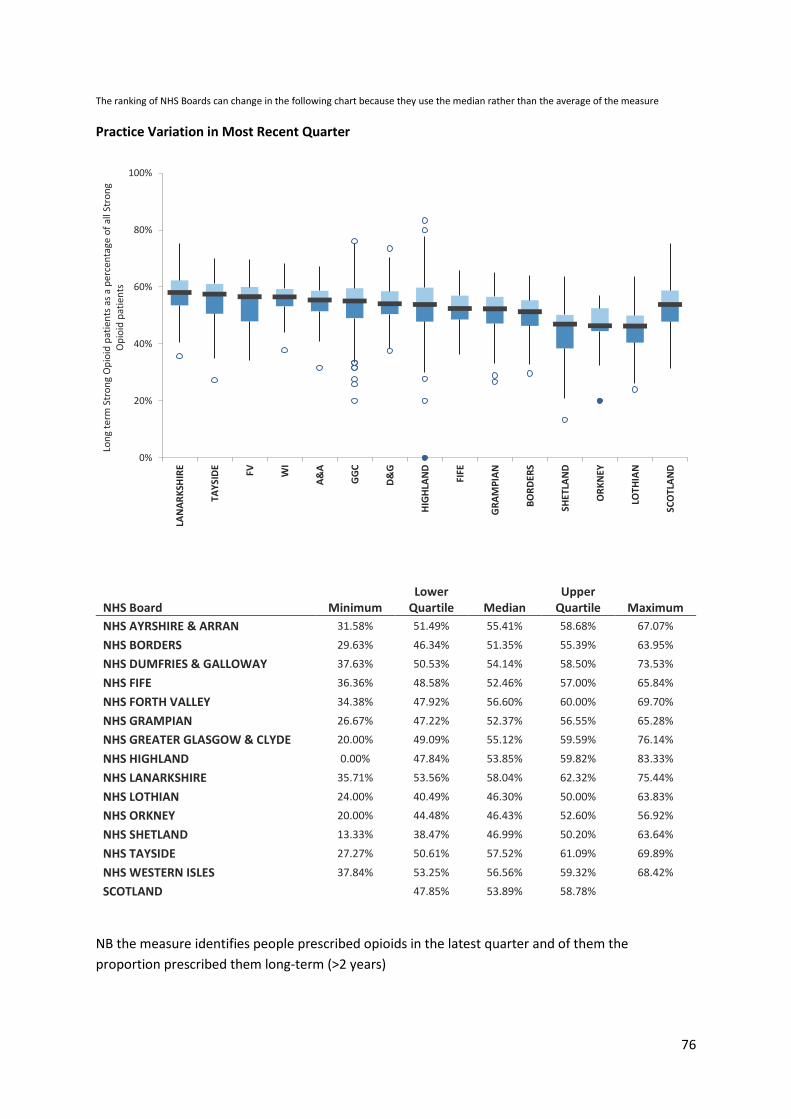
76
The ranking of NHS Boards can change in the following chart because they use the median rather than the average of the measure
Practice Variation in Most Recent Quarter
NHS Board Minimum Lower
Quartile Median Upper
Quartile Maximum
NHS AYRSHIRE & ARRAN 31.58% 51.49% 55.41% 58.68% 67.07%
NHS BORDERS 29.63% 46.34% 51.35% 55.39% 63.95%
NHS DUMFRIES & GALLOWAY 37.63% 50.53% 54.14% 58.50% 73.53%
NHS FIFE 36.36% 48.58% 52.46% 57.00% 65.84%
NHS FORTH VALLEY 34.38% 47.92% 56.60% 60.00% 69.70%
NHS GRAMPIAN 26.67% 47.22% 52.37% 56.55% 65.28%
NHS GREATER GLASGOW & CLYDE 20.00% 49.09% 55.12% 59.59% 76.14%
NHS HIGHLAND 0.00% 47.84% 53.85% 59.82% 83.33%
NHS LANARKSHIRE 35.71% 53.56% 58.04% 62.32% 75.44%
NHS LOTHIAN 24.00% 40.49% 46.30% 50.00% 63.83%
NHS ORKNEY 20.00% 44.48% 46.43% 52.60% 56.92%
NHS SHETLAND 13.33% 38.47% 46.99% 50.20% 63.64%
NHS TAYSIDE 27.27% 50.61% 57.52% 61.09% 69.89%
NHS WESTERN ISLES 37.84% 53.25% 56.56% 59.32% 68.42%
SCOTLAND 47.85% 53.89% 58.78%
NB the measure identifies people prescribed opioids in the latest quarter and of them the
proportion prescribed them long-term (>2 years)
0%
20%
40%
60%
80%
100%LA
NA
RK
SHIR
E
TAY
SID
E
FV WI
A&
A
GG
C
D&
G
HIG
HLA
ND
FIFE
GR
AM
PIA
N
BO
RD
ERS
SHET
LAN
D
OR
KN
EY
LOTH
IAN
SCO
TLA
ND
Lon
g te
rm S
tro
ng
Op
ioid
pat
ien
ts a
s a
per
cen
tage
of
all S
tro
ng
Op
ioid
pat
ien
ts
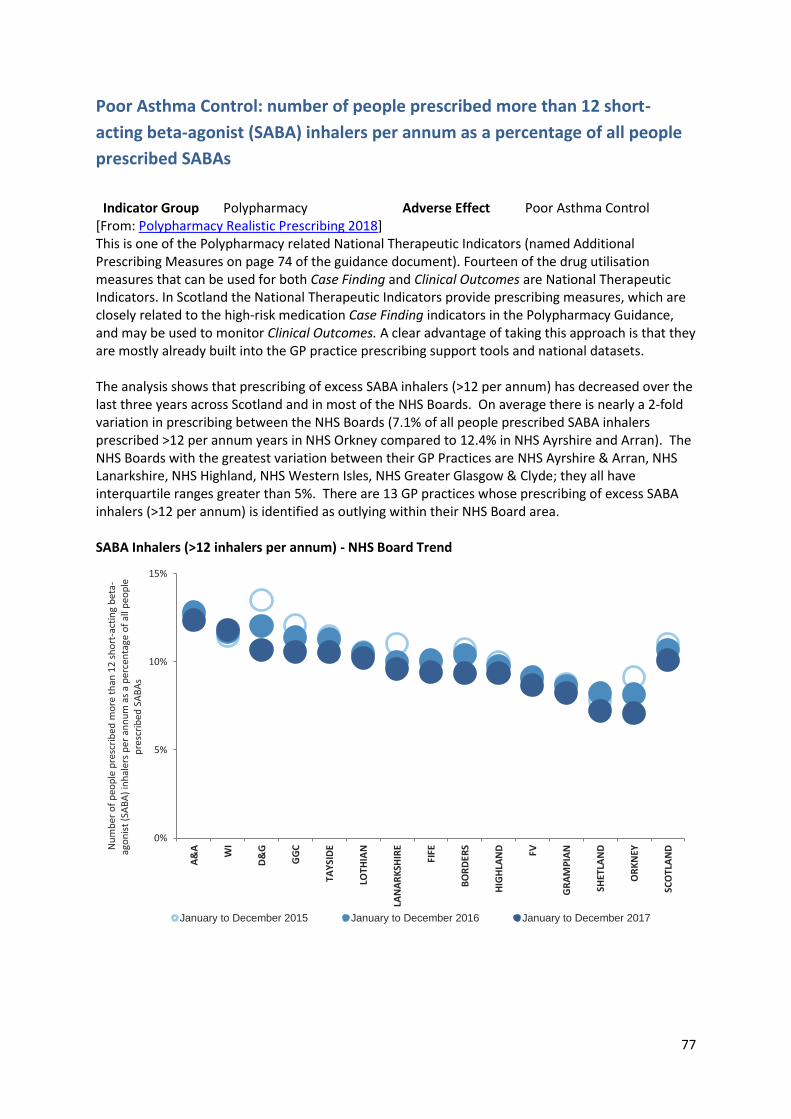
77
Poor Asthma Control: number of people prescribed more than 12 short-
acting beta-agonist (SABA) inhalers per annum as a percentage of all people
prescribed SABAs
Indicator Group Polypharmacy Adverse Effect Poor Asthma Control
[From: Polypharmacy Realistic Prescribing 2018] This is one of the Polypharmacy related National Therapeutic Indicators (named Additional Prescribing Measures on page 74 of the guidance document). Fourteen of the drug utilisation measures that can be used for both Case Finding and Clinical Outcomes are National Therapeutic Indicators. In Scotland the National Therapeutic Indicators provide prescribing measures, which are closely related to the high-risk medication Case Finding indicators in the Polypharmacy Guidance, and may be used to monitor Clinical Outcomes. A clear advantage of taking this approach is that they are mostly already built into the GP practice prescribing support tools and national datasets. The analysis shows that prescribing of excess SABA inhalers (>12 per annum) has decreased over the last three years across Scotland and in most of the NHS Boards. On average there is nearly a 2-fold variation in prescribing between the NHS Boards (7.1% of all people prescribed SABA inhalers prescribed >12 per annum years in NHS Orkney compared to 12.4% in NHS Ayrshire and Arran). The NHS Boards with the greatest variation between their GP Practices are NHS Ayrshire & Arran, NHS Lanarkshire, NHS Highland, NHS Western Isles, NHS Greater Glasgow & Clyde; they all have interquartile ranges greater than 5%. There are 13 GP practices whose prescribing of excess SABA inhalers (>12 per annum) is identified as outlying within their NHS Board area. SABA Inhalers (>12 inhalers per annum) - NHS Board Trend
0%
5%
10%
15%
A&
A
WI
D&
G
GG
C
TAY
SID
E
LOTH
IAN
LAN
AR
KSH
IRE
FIFE
BO
RD
ERS
HIG
HLA
ND FV
GR
AM
PIA
N
SHET
LAN
D
OR
KN
EY
SCO
TLA
NDN
um
ber
of
peo
ple
pre
scri
bed
mo
re t
han
12
sh
ort
-act
ing
bet
a-ag
on
ist
(SA
BA
) in
hal
ers
per
an
nu
m a
s a
per
cen
tage
of
all p
eop
le
pre
scri
bed
SA
BA
s
January to December 2015 January to December 2016 January to December 2017
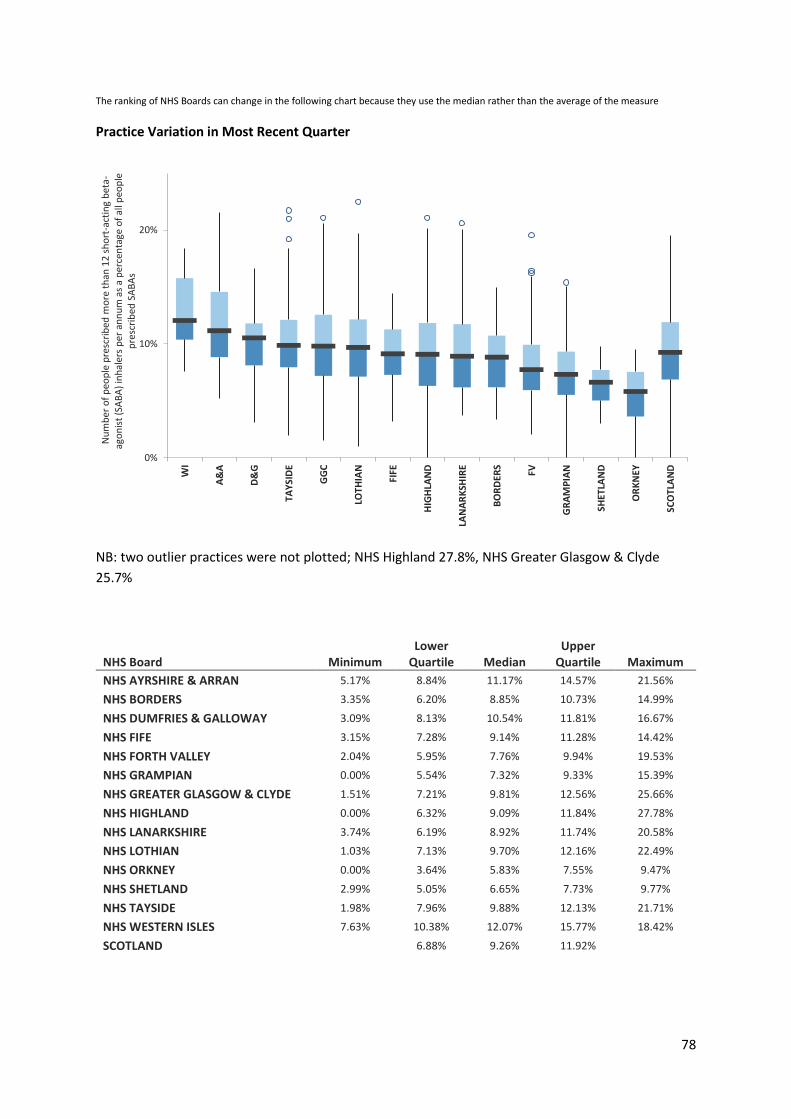
78
The ranking of NHS Boards can change in the following chart because they use the median rather than the average of the measure
Practice Variation in Most Recent Quarter
NB: two outlier practices were not plotted; NHS Highland 27.8%, NHS Greater Glasgow & Clyde
25.7%
NHS Board Minimum Lower
Quartile Median Upper
Quartile Maximum
NHS AYRSHIRE & ARRAN 5.17% 8.84% 11.17% 14.57% 21.56%
NHS BORDERS 3.35% 6.20% 8.85% 10.73% 14.99%
NHS DUMFRIES & GALLOWAY 3.09% 8.13% 10.54% 11.81% 16.67%
NHS FIFE 3.15% 7.28% 9.14% 11.28% 14.42%
NHS FORTH VALLEY 2.04% 5.95% 7.76% 9.94% 19.53%
NHS GRAMPIAN 0.00% 5.54% 7.32% 9.33% 15.39%
NHS GREATER GLASGOW & CLYDE 1.51% 7.21% 9.81% 12.56% 25.66%
NHS HIGHLAND 0.00% 6.32% 9.09% 11.84% 27.78%
NHS LANARKSHIRE 3.74% 6.19% 8.92% 11.74% 20.58%
NHS LOTHIAN 1.03% 7.13% 9.70% 12.16% 22.49%
NHS ORKNEY 0.00% 3.64% 5.83% 7.55% 9.47%
NHS SHETLAND 2.99% 5.05% 6.65% 7.73% 9.77%
NHS TAYSIDE 1.98% 7.96% 9.88% 12.13% 21.71%
NHS WESTERN ISLES 7.63% 10.38% 12.07% 15.77% 18.42%
SCOTLAND 6.88% 9.26% 11.92%
0%
10%
20%
WI
A&
A
D&
G
TAY
SID
E
GG
C
LOTH
IAN
FIFE
HIG
HLA
ND
LAN
AR
KSH
IRE
BO
RD
ERS
FV
GR
AM
PIA
N
SHET
LAN
D
OR
KN
EY
SCO
TLA
ND
Nu
mb
er o
f p
eop
le p
resc
rib
ed m
ore
th
an 1
2 s
ho
rt-a
ctin
g b
eta-
ago
nis
t (S
AB
A)
inh
aler
s p
er a
nn
um
as
a p
erce
nta
ge o
f al
l peo
ple
p
resc
rib
ed S
AB
As
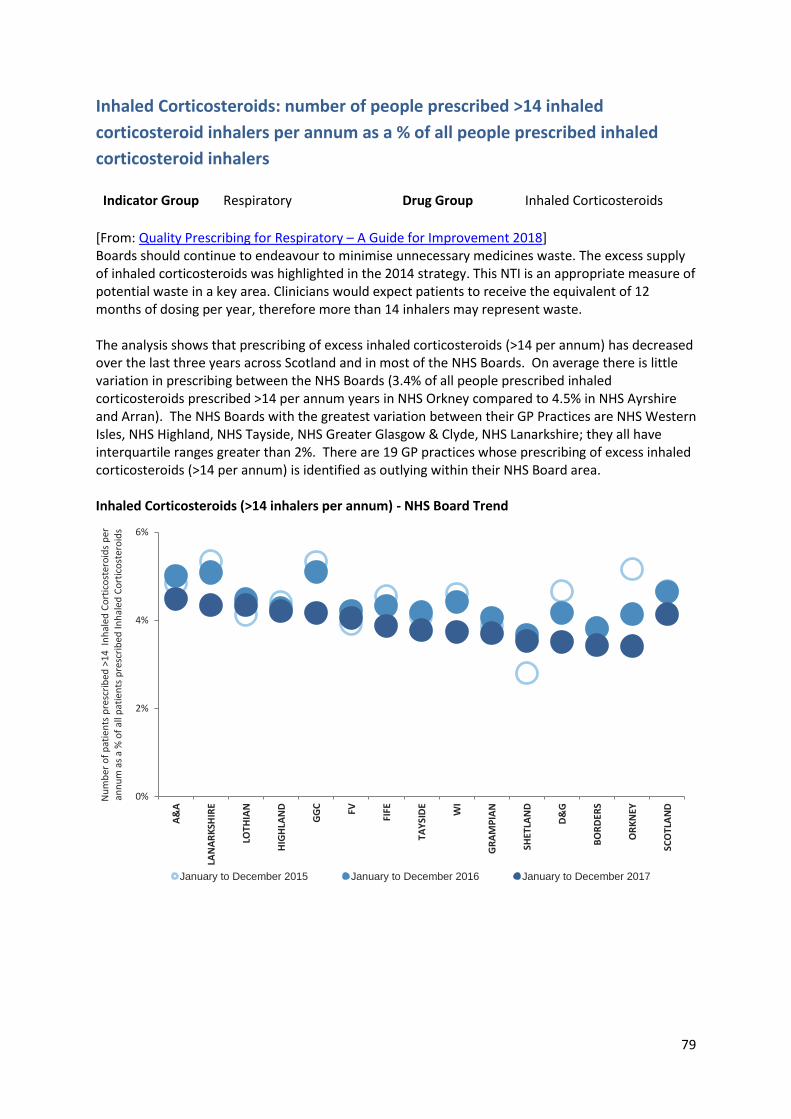
79
Inhaled Corticosteroids: number of people prescribed >14 inhaled
corticosteroid inhalers per annum as a % of all people prescribed inhaled
corticosteroid inhalers
Indicator Group Respiratory Drug Group Inhaled Corticosteroids
[From: Quality Prescribing for Respiratory – A Guide for Improvement 2018] Boards should continue to endeavour to minimise unnecessary medicines waste. The excess supply of inhaled corticosteroids was highlighted in the 2014 strategy. This NTI is an appropriate measure of potential waste in a key area. Clinicians would expect patients to receive the equivalent of 12 months of dosing per year, therefore more than 14 inhalers may represent waste. The analysis shows that prescribing of excess inhaled corticosteroids (>14 per annum) has decreased over the last three years across Scotland and in most of the NHS Boards. On average there is little variation in prescribing between the NHS Boards (3.4% of all people prescribed inhaled corticosteroids prescribed >14 per annum years in NHS Orkney compared to 4.5% in NHS Ayrshire and Arran). The NHS Boards with the greatest variation between their GP Practices are NHS Western Isles, NHS Highland, NHS Tayside, NHS Greater Glasgow & Clyde, NHS Lanarkshire; they all have interquartile ranges greater than 2%. There are 19 GP practices whose prescribing of excess inhaled corticosteroids (>14 per annum) is identified as outlying within their NHS Board area. Inhaled Corticosteroids (>14 inhalers per annum) - NHS Board Trend
0%
2%
4%
6%
A&
A
LAN
AR
KSH
IRE
LOTH
IAN
HIG
HLA
ND
GG
C
FV
FIFE
TAY
SID
E
WI
GR
AM
PIA
N
SHET
LAN
D
D&
G
BO
RD
ERS
OR
KN
EY
SCO
TLA
ND
Nu
mb
er o
f p
atie
nts
pre
scri
bed
>1
4 I
nh
aled
Co
rtic
ost
ero
ids
per
an
nu
m a
s a
% o
f al
l pat
ien
ts p
resc
rib
ed In
hal
ed C
ort
ico
ster
oid
s
January to December 2015 January to December 2016 January to December 2017
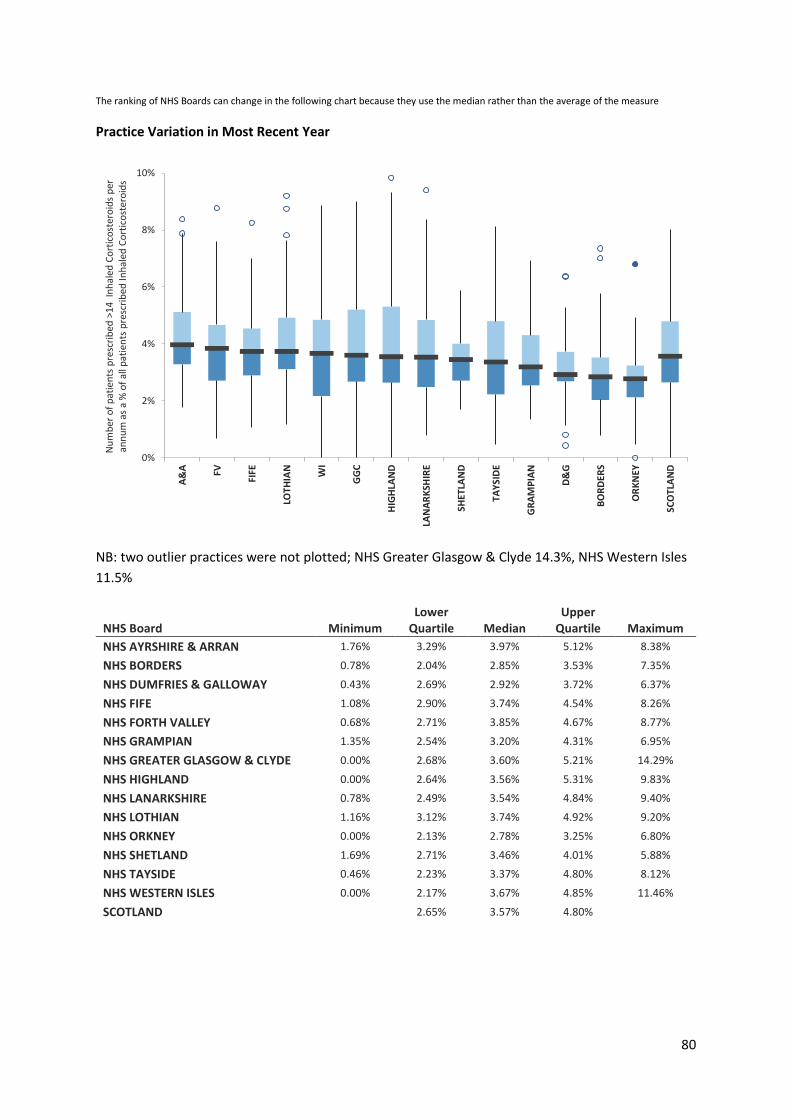
80
The ranking of NHS Boards can change in the following chart because they use the median rather than the average of the measure
Practice Variation in Most Recent Year
NB: two outlier practices were not plotted; NHS Greater Glasgow & Clyde 14.3%, NHS Western Isles
11.5%
NHS Board Minimum Lower
Quartile Median Upper
Quartile Maximum
NHS AYRSHIRE & ARRAN 1.76% 3.29% 3.97% 5.12% 8.38%
NHS BORDERS 0.78% 2.04% 2.85% 3.53% 7.35%
NHS DUMFRIES & GALLOWAY 0.43% 2.69% 2.92% 3.72% 6.37%
NHS FIFE 1.08% 2.90% 3.74% 4.54% 8.26%
NHS FORTH VALLEY 0.68% 2.71% 3.85% 4.67% 8.77%
NHS GRAMPIAN 1.35% 2.54% 3.20% 4.31% 6.95%
NHS GREATER GLASGOW & CLYDE 0.00% 2.68% 3.60% 5.21% 14.29%
NHS HIGHLAND 0.00% 2.64% 3.56% 5.31% 9.83%
NHS LANARKSHIRE 0.78% 2.49% 3.54% 4.84% 9.40%
NHS LOTHIAN 1.16% 3.12% 3.74% 4.92% 9.20%
NHS ORKNEY 0.00% 2.13% 2.78% 3.25% 6.80%
NHS SHETLAND 1.69% 2.71% 3.46% 4.01% 5.88%
NHS TAYSIDE 0.46% 2.23% 3.37% 4.80% 8.12%
NHS WESTERN ISLES 0.00% 2.17% 3.67% 4.85% 11.46%
SCOTLAND 2.65% 3.57% 4.80%
0%
2%
4%
6%
8%
10%A
&A FV
FIFE
LOTH
IAN
WI
GG
C
HIG
HLA
ND
LAN
AR
KSH
IRE
SHET
LAN
D
TAY
SID
E
GR
AM
PIA
N
D&
G
BO
RD
ERS
OR
KN
EY
SCO
TLA
ND
Nu
mb
er o
f p
atie
nts
pre
scri
bed
>1
4 I
nh
aled
Co
rtic
ost
ero
ids
per
an
nu
m a
s a
% o
f al
l pat
ien
ts p
resc
rib
ed In
hal
ed C
ort
ico
ster
oid
s
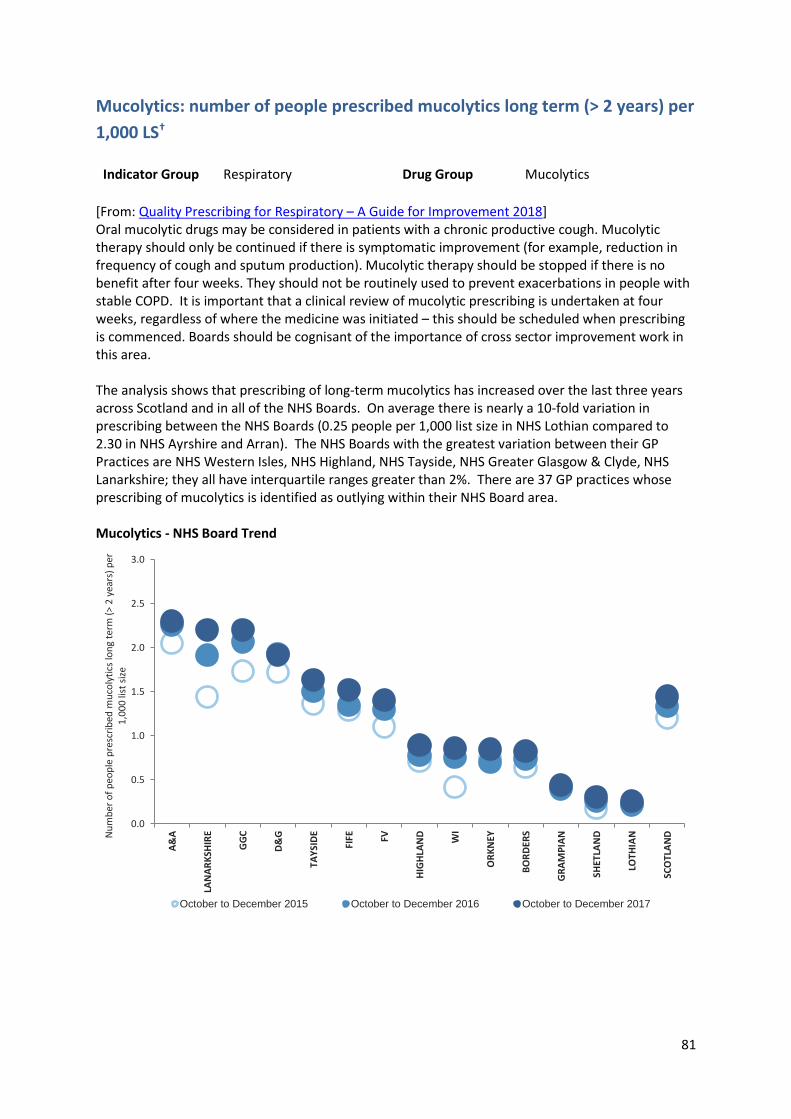
81
Mucolytics: number of people prescribed mucolytics long term (> 2 years) per
1,000 LS†
Indicator Group Respiratory Drug Group Mucolytics
[From: Quality Prescribing for Respiratory – A Guide for Improvement 2018] Oral mucolytic drugs may be considered in patients with a chronic productive cough. Mucolytic therapy should only be continued if there is symptomatic improvement (for example, reduction in frequency of cough and sputum production). Mucolytic therapy should be stopped if there is no benefit after four weeks. They should not be routinely used to prevent exacerbations in people with stable COPD. It is important that a clinical review of mucolytic prescribing is undertaken at four weeks, regardless of where the medicine was initiated – this should be scheduled when prescribing is commenced. Boards should be cognisant of the importance of cross sector improvement work in this area. The analysis shows that prescribing of long-term mucolytics has increased over the last three years across Scotland and in all of the NHS Boards. On average there is nearly a 10-fold variation in prescribing between the NHS Boards (0.25 people per 1,000 list size in NHS Lothian compared to 2.30 in NHS Ayrshire and Arran). The NHS Boards with the greatest variation between their GP Practices are NHS Western Isles, NHS Highland, NHS Tayside, NHS Greater Glasgow & Clyde, NHS Lanarkshire; they all have interquartile ranges greater than 2%. There are 37 GP practices whose prescribing of mucolytics is identified as outlying within their NHS Board area. Mucolytics - NHS Board Trend
0.0
0.5
1.0
1.5
2.0
2.5
3.0
A&
A
LAN
AR
KSH
IRE
GG
C
D&
G
TAY
SID
E
FIFE FV
HIG
HLA
ND
WI
OR
KN
EY
BO
RD
ERS
GR
AM
PIA
N
SHET
LAN
D
LOTH
IAN
SCO
TLA
NDN
um
ber
of
peo
ple
pre
scri
bed
mu
coly
tics
lon
g te
rm (
> 2
yea
rs)
per
1
,00
0 li
st s
ize
October to December 2015 October to December 2016 October to December 2017
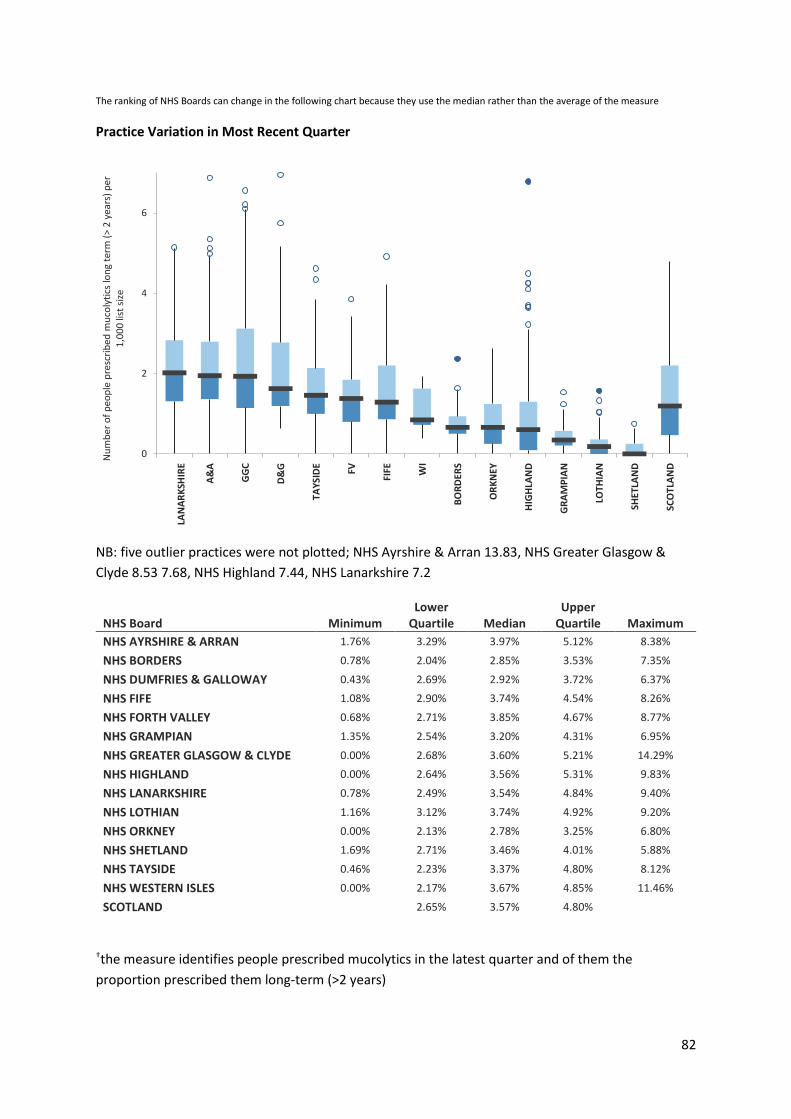
82
The ranking of NHS Boards can change in the following chart because they use the median rather than the average of the measure
Practice Variation in Most Recent Quarter
NB: five outlier practices were not plotted; NHS Ayrshire & Arran 13.83, NHS Greater Glasgow &
Clyde 8.53 7.68, NHS Highland 7.44, NHS Lanarkshire 7.2
NHS Board Minimum Lower
Quartile Median Upper
Quartile Maximum
NHS AYRSHIRE & ARRAN 1.76% 3.29% 3.97% 5.12% 8.38%
NHS BORDERS 0.78% 2.04% 2.85% 3.53% 7.35%
NHS DUMFRIES & GALLOWAY 0.43% 2.69% 2.92% 3.72% 6.37%
NHS FIFE 1.08% 2.90% 3.74% 4.54% 8.26%
NHS FORTH VALLEY 0.68% 2.71% 3.85% 4.67% 8.77%
NHS GRAMPIAN 1.35% 2.54% 3.20% 4.31% 6.95%
NHS GREATER GLASGOW & CLYDE 0.00% 2.68% 3.60% 5.21% 14.29%
NHS HIGHLAND 0.00% 2.64% 3.56% 5.31% 9.83%
NHS LANARKSHIRE 0.78% 2.49% 3.54% 4.84% 9.40%
NHS LOTHIAN 1.16% 3.12% 3.74% 4.92% 9.20%
NHS ORKNEY 0.00% 2.13% 2.78% 3.25% 6.80%
NHS SHETLAND 1.69% 2.71% 3.46% 4.01% 5.88%
NHS TAYSIDE 0.46% 2.23% 3.37% 4.80% 8.12%
NHS WESTERN ISLES 0.00% 2.17% 3.67% 4.85% 11.46%
SCOTLAND 2.65% 3.57% 4.80%
†the measure identifies people prescribed mucolytics in the latest quarter and of them the
proportion prescribed them long-term (>2 years)
0
2
4
6
LAN
AR
KSH
IRE
A&
A
GG
C
D&
G
TA
YSI
DE
FV
FIF
E
WI
BO
RD
ERS
OR
KN
EY
HIG
HLA
ND
GR
AM
PIA
N
LO
THIA
N
SH
ETLA
ND
SC
OTL
AN
D
Nu
mb
er o
f p
eop
le p
resc
rib
ed m
uco
lyti
cs lo
ng
term
(>
2 y
ears
) p
er
1,0
00
list
siz
e
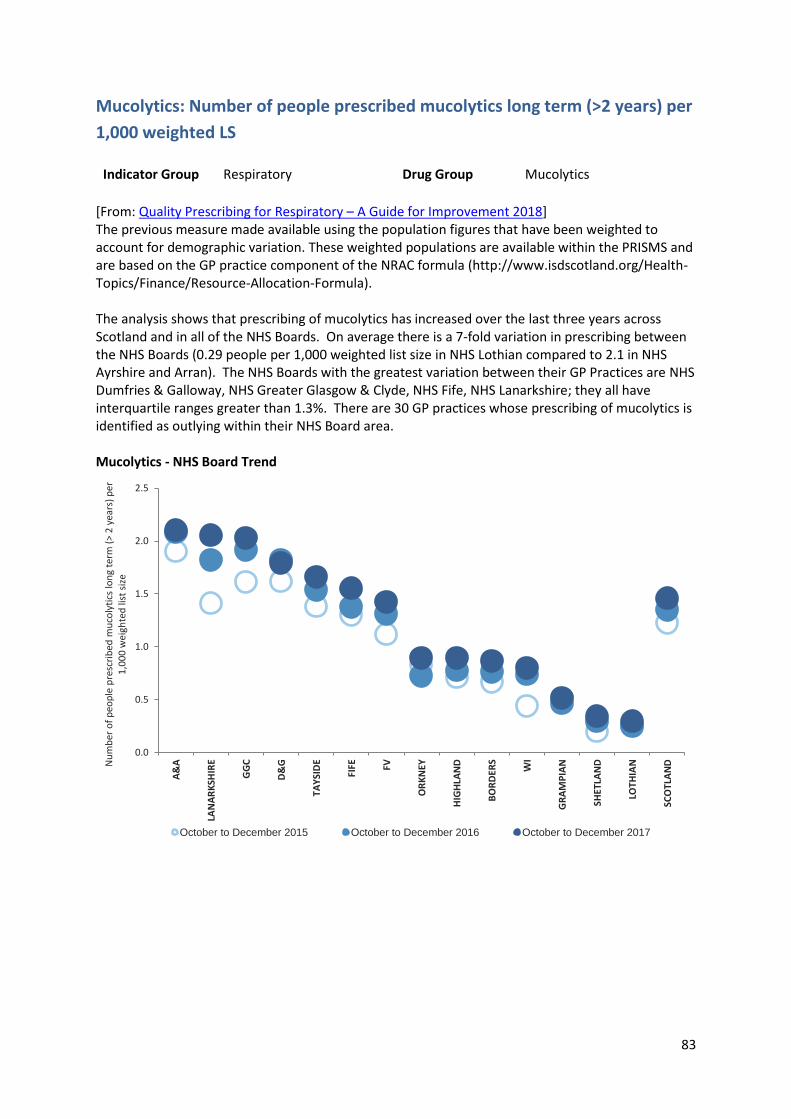
83
Mucolytics: Number of people prescribed mucolytics long term (>2 years) per
1,000 weighted LS
Indicator Group Respiratory Drug Group Mucolytics
[From: Quality Prescribing for Respiratory – A Guide for Improvement 2018] The previous measure made available using the population figures that have been weighted to account for demographic variation. These weighted populations are available within the PRISMS and are based on the GP practice component of the NRAC formula (http://www.isdscotland.org/Health-Topics/Finance/Resource-Allocation-Formula). The analysis shows that prescribing of mucolytics has increased over the last three years across Scotland and in all of the NHS Boards. On average there is a 7-fold variation in prescribing between the NHS Boards (0.29 people per 1,000 weighted list size in NHS Lothian compared to 2.1 in NHS Ayrshire and Arran). The NHS Boards with the greatest variation between their GP Practices are NHS Dumfries & Galloway, NHS Greater Glasgow & Clyde, NHS Fife, NHS Lanarkshire; they all have interquartile ranges greater than 1.3%. There are 30 GP practices whose prescribing of mucolytics is identified as outlying within their NHS Board area. Mucolytics - NHS Board Trend
0.0
0.5
1.0
1.5
2.0
2.5
A&
A
LAN
AR
KSH
IRE
GG
C
D&
G
TAY
SID
E
FIFE FV
OR
KN
EY
HIG
HLA
ND
BO
RD
ERS
WI
GR
AM
PIA
N
SHET
LAN
D
LOTH
IAN
SCO
TLA
NDN
um
ber
of
peo
ple
pre
scri
bed
mu
coly
tics
lon
g te
rm (
> 2
yea
rs)
per
1
,00
0 w
eigh
ted
list
siz
e
October to December 2015 October to December 2016 October to December 2017
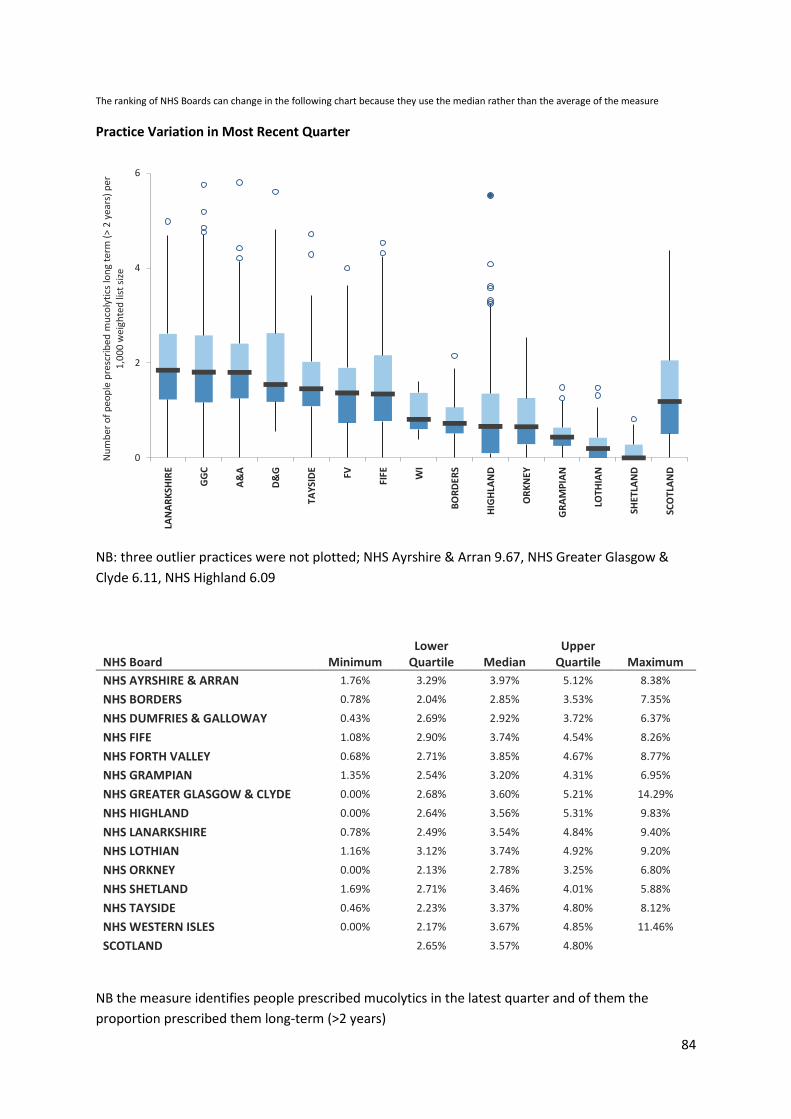
84
The ranking of NHS Boards can change in the following chart because they use the median rather than the average of the measure
Practice Variation in Most Recent Quarter
NB: three outlier practices were not plotted; NHS Ayrshire & Arran 9.67, NHS Greater Glasgow &
Clyde 6.11, NHS Highland 6.09
NHS Board Minimum Lower
Quartile Median Upper
Quartile Maximum
NHS AYRSHIRE & ARRAN 1.76% 3.29% 3.97% 5.12% 8.38%
NHS BORDERS 0.78% 2.04% 2.85% 3.53% 7.35%
NHS DUMFRIES & GALLOWAY 0.43% 2.69% 2.92% 3.72% 6.37%
NHS FIFE 1.08% 2.90% 3.74% 4.54% 8.26%
NHS FORTH VALLEY 0.68% 2.71% 3.85% 4.67% 8.77%
NHS GRAMPIAN 1.35% 2.54% 3.20% 4.31% 6.95%
NHS GREATER GLASGOW & CLYDE 0.00% 2.68% 3.60% 5.21% 14.29%
NHS HIGHLAND 0.00% 2.64% 3.56% 5.31% 9.83%
NHS LANARKSHIRE 0.78% 2.49% 3.54% 4.84% 9.40%
NHS LOTHIAN 1.16% 3.12% 3.74% 4.92% 9.20%
NHS ORKNEY 0.00% 2.13% 2.78% 3.25% 6.80%
NHS SHETLAND 1.69% 2.71% 3.46% 4.01% 5.88%
NHS TAYSIDE 0.46% 2.23% 3.37% 4.80% 8.12%
NHS WESTERN ISLES 0.00% 2.17% 3.67% 4.85% 11.46%
SCOTLAND 2.65% 3.57% 4.80%
NB the measure identifies people prescribed mucolytics in the latest quarter and of them the
proportion prescribed them long-term (>2 years)
0
2
4
6 L
AN
AR
KSH
IRE
GG
C
A&
A
D&
G
TA
YSI
DE
FV
FIF
E
WI
BO
RD
ERS
HIG
HLA
ND
OR
KN
EY
GR
AM
PIA
N
LO
THIA
N
SH
ETLA
ND
SC
OTL
AN
D
Nu
mb
er o
f p
eop
le p
resc
rib
ed m
uco
lyti
cs lo
ng
term
(>
2 y
ears
) p
er
1,0
00
wei
ghte
d li
st s
ize
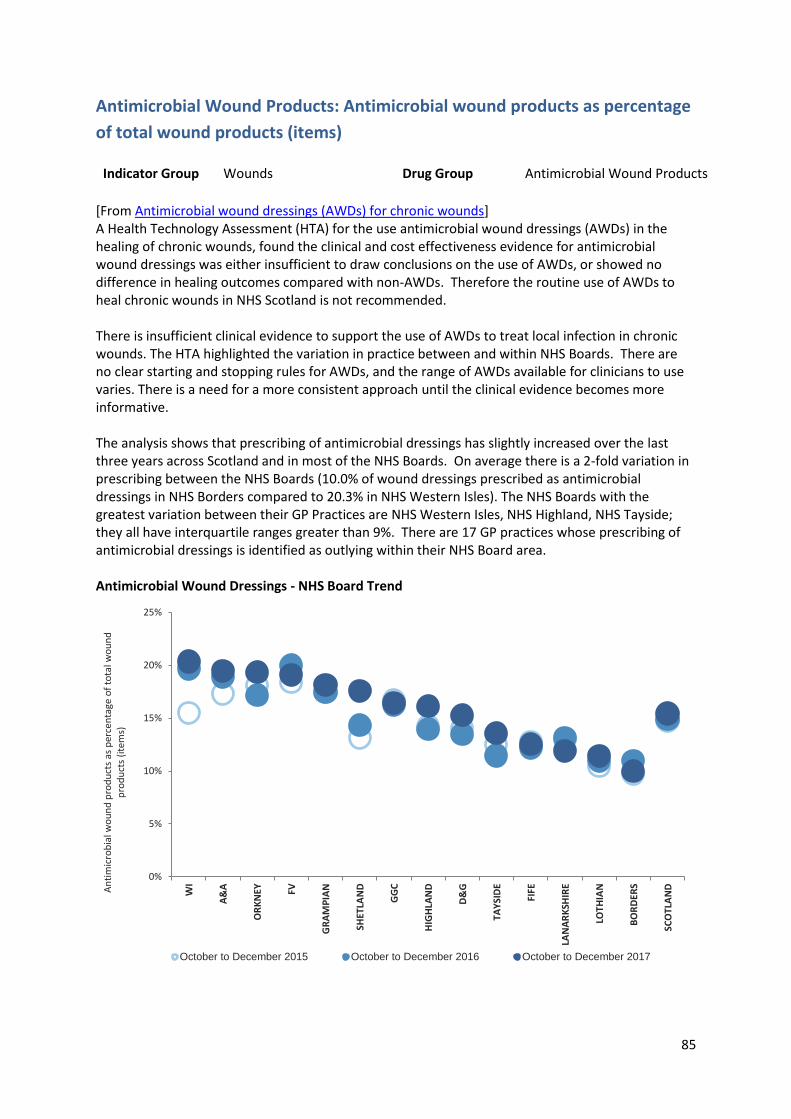
85
Antimicrobial Wound Products: Antimicrobial wound products as percentage
of total wound products (items)
Indicator Group Wounds Drug Group Antimicrobial Wound Products
[From Antimicrobial wound dressings (AWDs) for chronic wounds] A Health Technology Assessment (HTA) for the use antimicrobial wound dressings (AWDs) in the healing of chronic wounds, found the clinical and cost effectiveness evidence for antimicrobial wound dressings was either insufficient to draw conclusions on the use of AWDs, or showed no difference in healing outcomes compared with non-AWDs. Therefore the routine use of AWDs to heal chronic wounds in NHS Scotland is not recommended. There is insufficient clinical evidence to support the use of AWDs to treat local infection in chronic wounds. The HTA highlighted the variation in practice between and within NHS Boards. There are no clear starting and stopping rules for AWDs, and the range of AWDs available for clinicians to use varies. There is a need for a more consistent approach until the clinical evidence becomes more informative. The analysis shows that prescribing of antimicrobial dressings has slightly increased over the last three years across Scotland and in most of the NHS Boards. On average there is a 2-fold variation in prescribing between the NHS Boards (10.0% of wound dressings prescribed as antimicrobial dressings in NHS Borders compared to 20.3% in NHS Western Isles). The NHS Boards with the greatest variation between their GP Practices are NHS Western Isles, NHS Highland, NHS Tayside; they all have interquartile ranges greater than 9%. There are 17 GP practices whose prescribing of antimicrobial dressings is identified as outlying within their NHS Board area. Antimicrobial Wound Dressings - NHS Board Trend
0%
5%
10%
15%
20%
25%
WI
A&
A
OR
KN
EY FV
GR
AM
PIA
N
SHET
LAN
D
GG
C
HIG
HLA
ND
D&
G
TAY
SID
E
FIFE
LAN
AR
KSH
IRE
LOTH
IAN
BO
RD
ERS
SCO
TLA
NDAn
tim
icro
bia
l wo
un
d p
rod
uct
s as
per
cen
tage
of
tota
l wo
un
d
pro
du
cts
(ite
ms)
October to December 2015 October to December 2016 October to December 2017
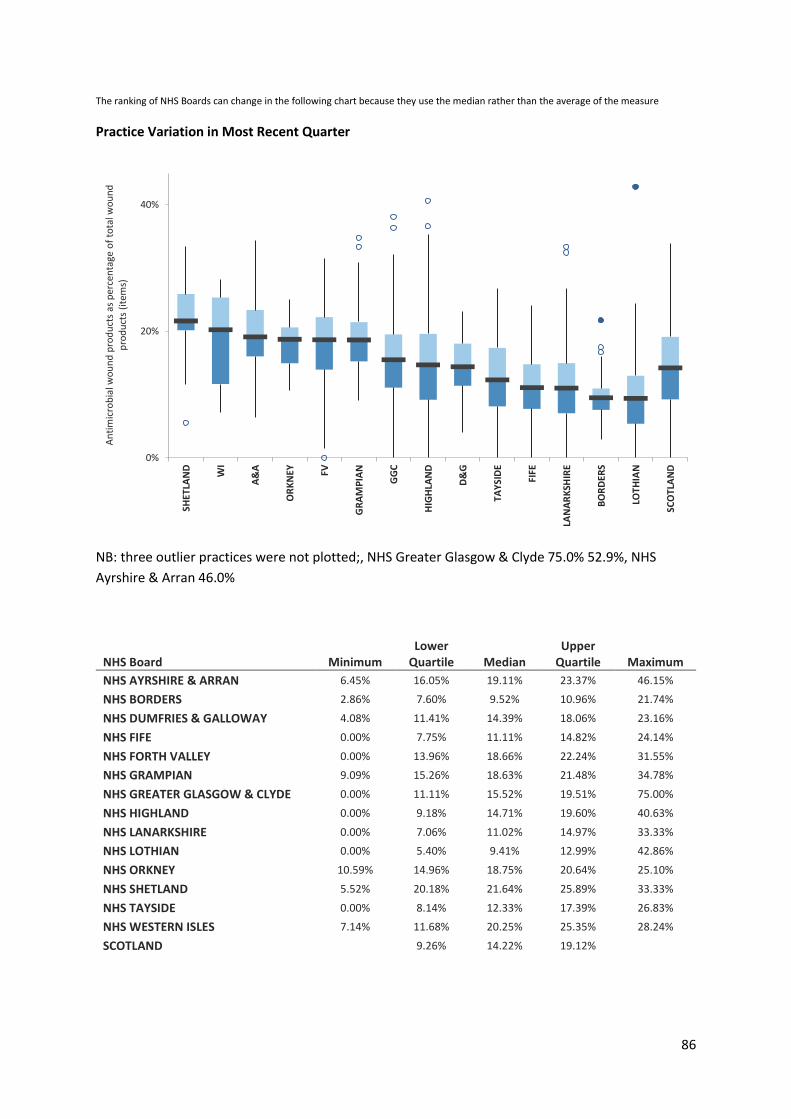
86
The ranking of NHS Boards can change in the following chart because they use the median rather than the average of the measure
Practice Variation in Most Recent Quarter
NB: three outlier practices were not plotted;, NHS Greater Glasgow & Clyde 75.0% 52.9%, NHS
Ayrshire & Arran 46.0%
NHS Board Minimum Lower
Quartile Median Upper
Quartile Maximum
NHS AYRSHIRE & ARRAN 6.45% 16.05% 19.11% 23.37% 46.15%
NHS BORDERS 2.86% 7.60% 9.52% 10.96% 21.74%
NHS DUMFRIES & GALLOWAY 4.08% 11.41% 14.39% 18.06% 23.16%
NHS FIFE 0.00% 7.75% 11.11% 14.82% 24.14%
NHS FORTH VALLEY 0.00% 13.96% 18.66% 22.24% 31.55%
NHS GRAMPIAN 9.09% 15.26% 18.63% 21.48% 34.78%
NHS GREATER GLASGOW & CLYDE 0.00% 11.11% 15.52% 19.51% 75.00%
NHS HIGHLAND 0.00% 9.18% 14.71% 19.60% 40.63%
NHS LANARKSHIRE 0.00% 7.06% 11.02% 14.97% 33.33%
NHS LOTHIAN 0.00% 5.40% 9.41% 12.99% 42.86%
NHS ORKNEY 10.59% 14.96% 18.75% 20.64% 25.10%
NHS SHETLAND 5.52% 20.18% 21.64% 25.89% 33.33%
NHS TAYSIDE 0.00% 8.14% 12.33% 17.39% 26.83%
NHS WESTERN ISLES 7.14% 11.68% 20.25% 25.35% 28.24%
SCOTLAND 9.26% 14.22% 19.12%
0%
20%
40%
SHET
LAN
D
WI
A&
A
OR
KN
EY FV
GR
AM
PIA
N
GG
C
HIG
HLA
ND
D&
G
TAY
SID
E
FIFE
LAN
AR
KSH
IRE
BO
RD
ERS
LOTH
IAN
SCO
TLA
ND
An
tim
icro
bia
l wo
un
d p
rod
uct
s as
per
cen
tage
of
tota
l wo
un
d
pro
du
cts
(ite
ms)