Embed Size (px)
Citation preview

Report to Congress
Economic Research Service
Administrative Publication Number 068
January 2015
United States Department of Agriculture
Trends in U.S. Local and Regional Food Systems
Economic Research Service www.ers.usda.gov
The U.S. Department of Agriculture (USDA) prohibits discrimination in all its programs and activities on the basis of race, color, national origin, age, disability, and, where applicable, sex, marital status, familial status, parental status, religion, sexual orientation, genetic information, political beliefs, reprisal, or because all or a part of an individual’s income is derived from any public assistance program. (Not all prohibited bases apply to all programs.) Persons with disabilities who require alternative means for communication of program information (Braille, large print, audiotape, etc.) should contact USDA’s TARGET Center at (202) 720-2600 (voice and TDD).
To file a complaint of discrimination write to USDA, Director, Office of Civil Rights, 1400 Independence Avenue, S.W., Washington, D.C. 20250-9410 or call (800) 795-3272 (voice) or (202) 720-6382 (TDD). USDA is an equal opportunity provider and employer.
United States Department of Agriculture
Access this report online:
www.ers.usda.gov/publications/ap-administrative-publication/ap-068
Download the charts contained in this report:
• Go to the report’s index page www.ers.usda.gov/publications/ ap-administrative-publication/ap-068
• Click on the bulleted item “Download ap068.zip”
• Open the chart you want, then save it to your computer
Recommended citation format for this publication:
Low, Sarah A., Aaron Adalja, Elizabeth Beaulieu, Nigel Key, Steve Martinez, Alex Melton, Agnes Perez, Katherine Ralston, Hayden Stewart, Shellye Suttles, Stephen Vogel, and Becca B.R. Jablonski. Trends in U.S. Local and Regional Food Systems, AP-068, U.S. Department of Agriculture, Economic Research Service, January 2015.
Cover images: Shutterstock.
Use of commercial and trade names does not imply approval or constitute endorsement by USDA.

United States Department of Agriculture
Errata
On February 23, 2015, the following figures were corrected to include Alaska and Hawaii: Figure 2, “Total direct-to-consumer sales, by county, 2012”; Figure 3, “Change in direct-to-consumer sales, 2007-12 using constant 2012 dollars”; and Figure 4, “Farms with direct sales to retail or restaurants, 2012, and food hubs, 2014.”
On March 20, 2015, near the bottom of page 2, the first year in which the Census of Agriculture began to collect information on farmers’ direct-to-consumer sales was corrected to 1978 rather than 1976. Also, a data source identified in Figure 1 was corrected to read “National Farm to School Network.”
Economic Research Service
Administrative Publication Number 068
January 2015
AbstractThis report provides an overview of local and regional food systems across several dimensions. It details the latest economic information on local food producers, consumers, and policy, relying on findings from several national surveys and a synthesis of recent literature to assess the current size of and recent trends in local and regional food systems. Data are presented on producer characteristics, survival rates and growth, and prices. The local food literature on consumer willingness to pay, environmental impacts, food safety regulations, and local economic impacts is synthesized when nationally representative data are unavailable. Finally, this report provides an over-view of Federal and selected State and regional policies designed to support local food systems and collaboration among market participants.
Keywords: local food systems, direct to consumer marketing, intermediated marketing, farm to school, food hubs, farmers’ markets, local food prices, Food Safety Modernization Act, Farm Bill, environmental issues, Census of Agriculture, Agricultural Resource Management Survey
AcknowledgmentsWe thank Elanor Starmer (Office of the Secretary), Luanne Lohr (Agricultural Marketing Service), Deborah Kane (Food and Nutrition Service), Cathy Greene, Bob Hoppe, Tim Park, Roger Claassen, all of ERS; Cheryl Brown (West Virginia University); and two anonymous reviewers for their extensive comments. We also thank Travis Minor (Food and Drug Administration), Ken Petersen and Leanne Skelton (Agricultural Marketing Service), and ERS colleagues John Bovay, Linda Calvin, Bob Dubman, Kathy Kassel, Ken Mathews, Kevin Patrick, Marc Ribaudo, Suzanne Thornsbury and Marca Weinberg for technical assistance; Christy Meyer and Tom Birkett (National Agricultural Statistics Service) for assistance in clearing Census estimates; as well as ERS editor Dale Simms and ERS designer Cynthia A. Ray.
Sarah A. Low, Aaron Adalja, Elizabeth Beaulieu, Nigel Key, Steve Martinez, Alex Melton, Agnes Perez, Katherine Ralston, Hayden Stewart, Shellye Suttles, and Stephen Vogel, of USDA Economic Research Service, and Becca B.R. Jablonski, of Colorado State University
Trends in U.S. Local and Regional Food Systems
A Report to Congress

ii Trends in U.S. Local and Regional Food Systems: A Report to Congress, AP-068
Economic Research Service/USDA
Content
Summary . . . . . . . . . . . . . . . . . . . . . . . . . . . . . . . . . . . . . . . . . . . . . . . . . . . . . . . . . . . . . . . . . . . . . iii
Introduction . . . . . . . . . . . . . . . . . . . . . . . . . . . . . . . . . . . . . . . . . . . . . . . . . . . . . . . . . . . . . . . . . . . .1
Local and Regional Food Producers . . . . . . . . . . . . . . . . . . . . . . . . . . . . . . . . . . . . . . . . . . . . . . .2
Growth in Certain Local Food Marketing Channels . . . . . . . . . . . . . . . . . . . . . . . . . . . . . . . . . . .2
Geography and Characteristics of Farmers in Local and Regional Food Systems . . . . . . . . . . . .2
Farm Business Survival and Growth and Direct-to-Consumer Marketing . . . . . . . . . . . . . . . . .12
Local Food Systems and the Local Economy . . . . . . . . . . . . . . . . . . . . . . . . . . . . . . . . . . . . . . . 16
Food Safety and Local Food Production, Processing, and Marketing . . . . . . . . . . . . . . . . . . . . . . . . . . . . . . . . . . . . . . . . . . . . . . . . . . . . . . . . . . . . . . . . .20
Current Food Safety Standards Affecting the Local Marketing of Fresh Produce . . . . . . . . . . .20
Food Safety Regulations and Locally Marketed Meat . . . . . . . . . . . . . . . . . . . . . . . . . . . . . . . . .22
The Food Safety Modernization Act . . . . . . . . . . . . . . . . . . . . . . . . . . . . . . . . . . . . . . . . . . . . . .24
Who Buys Local and Regional Foods and Why? . . . . . . . . . . . . . . . . . . . . . . . . . . . . . . . . . . . . .30
What Motivates Consumers to Shop for Local Food? . . . . . . . . . . . . . . . . . . . . . . . . . . . . . . . . .30
How Much Do Demographic Characteristics Matter? . . . . . . . . . . . . . . . . . . . . . . . . . . . . . . . . 31
How Much Will Consumers Pay for Local Food? . . . . . . . . . . . . . . . . . . . . . . . . . . . . . . . . . . . 31
Institutional Local Food Consumers . . . . . . . . . . . . . . . . . . . . . . . . . . . . . . . . . . . . . . . . . . . . . .33
Farm to School . . . . . . . . . . . . . . . . . . . . . . . . . . . . . . . . . . . . . . . . . . . . . . . . . . . . . . . . . . . . . . .33
Prices at Direct-to-Consumer Marketing Outlets Versus Competing Retailers . . . . . . . . . . .37
Comparison of DTC and Retail Prices Using Nielsen Homescan Data, 2006 . . . . . . . . . . . . . . .38
Environmental Issues Related to Local and Regional Foods . . . . . . . . . . . . . . . . . . . . . . . . . . .44
Onfarm Environmental Effects for Farms With Direct-to-Consumer Sales . . . . . . . . . . . . . . . .44
Comparison of Onfarm Conservation Practices . . . . . . . . . . . . . . . . . . . . . . . . . . . . . . . . . . . . .45
Environmental Effects from the Farm to the Fork… and to the Landfill . . . . . . . . . . . . . . . . . .50
Policies Supporting Local and Regional Food Systems . . . . . . . . . . . . . . . . . . . . . . . . . . . . . . . .52
New and Expanded Federal Policies for 2014 . . . . . . . . . . . . . . . . . . . . . . . . . . . . . . . . . . . . . . .52
Reauthorized Federal Policies . . . . . . . . . . . . . . . . . . . . . . . . . . . . . . . . . . . . . . . . . . . . . . . . . . .55
State and Substate Local Food Policies and Programs . . . . . . . . . . . . . . . . . . . . . . . . . . . . . . . .57
Glossary . . . . . . . . . . . . . . . . . . . . . . . . . . . . . . . . . . . . . . . . . . . . . . . . . . . . . . . . . . . . . . . . . . . . . .62
References . . . . . . . . . . . . . . . . . . . . . . . . . . . . . . . . . . . . . . . . . . . . . . . . . . . . . . . . . . . . . . . . . . . .64
Appendix: Variability in the 2008-11 ARMS Data and Developing Synthetic Estimates of Total Local Food Sales . . . . . . . . . . . . . . . . . . . . . . . . . . . . . . . . . . . . . . . . . . . . . . .78

United States Department of Agriculture
A report summary from the Economic Research Service
ERS is a primary source of economic research and
analysis from the U.S. Department of Agriculture, providing timely informa-
tion on economic and policy issues related to agriculture, food, the environment,and
rural America. www.ers.usda.gov
Report to Congress
Economic Research Service
Administrative Publication Number 068
January 2015
United States Department of Agriculture
Trends in U.S. Local and Regional Food Systems
January 2015
Find the full report at www.ers.usda.
gov/publications/ap-administrative-publi-cation/ap-068.aspx
Sarah A. Low, Aaron Adalja, Elizabeth Beaulieu, Nigel Key, Steve Martinez, Alex Melton, Agnes Perez, Katherine Ralston, Hayden Stewart, Shellye Suttles, Stephen Vogel, and Becca B.R. Jablonski
Trends in U.S. Local and Regional Food Systems: A Report to Congress
What Is the Issue?
This is a congressionally mandated report, written at the request of the House Agriculture Committee as a part of the Fiscal Year 2014 Appropriations Bill, in January 2014. The Committee directed the Economic Research Service (ERS) to provide a report assessing the scope of and trends in local and regional food systems and to make it publicly available on the ERS website.
Local food has been the subject of Federal, State, and local government policy in recent years as consumer interest in and demand for local foods has grown. Because local foods have been linked to the full suite of USDA priorities—including enhancing the rural economy, the envi-ronment, food access and nutrition, informing consumer demand, and strengthening agricul-tural producers and markets—up-to-date information is critical for understanding the evolution and effects of local and regional food systems across the country.
What Did the Study Find?
Producer participation in local food systems is growing, and the value of local food sales, defined as the sale of food for human consumption through both direct-to-consumer (e.g., farmers’ markets) and intermediated marketing channels (e.g., sales to institutions or regional distributors), appears to be increasing.
• In 2012, 163,675 farms (7.8 percent of U.S. farms) were marketing foods locally, defined as conducting either direct-to-consumer (DTC) or intermediated sales of food for human consumption, according to census of agriculture data. Of these farms, 70 percent used only DTC marketing channels, which include farmers’ markets and community supported agri-culture (CSA) arrangements. The other 30 percent used a combination of DTC and interme-diated channels or only intermediated channels.
• The number of farms with DTC sales increased by 17 percent and sales increased by 32 percent between 2002 and 2007; however, between 2007 and 2012 the number of farms with DTC sales increased 5.5 percent, with no change in DTC sales. That DTC sales did not increase may be due to plateauing consumer interest or to growth in non-direct sales of local food (i.e., local food sold through intermediated marketing channels like grocery stores or institutions), the value of which is not measured by the census of agriculture.
• Agricultural Resource and Management Survey (ARMS) and census of agriculture data indi-cate that local food sales totaled an estimated $6.1 billion in 2012. This is only an estimate because neither data source collects complete information on the value of intermediated sales.
• Farms with gross cash farm income below $75,000 accounted for 85 percent of local food farms in 2012, according to census data. These farms are estimated to account for only 13

percent of local food sales. Local food farms with gross cash farm income above $350,000 accounted for 5 percent of local food farms and 67 percent of sales.
• Farms selling local food through DTC marketing channels were more likely to remain in business over 2007-12 than all farms not using DTC marketing channels, according to census of agriculture data. Farms with DTC sales tended to experience smaller increases in sales than all other farms, however.
• It is difficult to draw conclusions about the local economic impact of local foods systems because the existing literature has narrow geographic and market scope, making comparing studies complicated. Data necessary to conduct economic impact analyses are costly to obtain, and researchers have yet to agree on a standard way of accounting for the opportunity costs involved when local foods are produced and purchased or on a standard set of economic modeling assumptions. Many questions surrounding the economic impact of local foods remain unan-swered and could be addressed by future research (e.g., Are local food systems good for the rural economy? Might the economic benefits of expanding local food systems be unevenly distributed?)
The Food Safety Modernization Act (FSMA) calls for sweeping changes to the U.S. food safety system. Regulatory focus shifts from response (to contamination) to prevention in order to ensure that the U.S. food supply is safe. This will be the first time that the U.S. Food and Drug Administration (FDA) will have jurisdiction over onfarm activities, and FSMA will impose relative uniformity of standards across suppliers of fresh produce. Currently, food safety in produce is a hodgepodge of decisions by individuals, grower organizations, buyers, and governments that can vary by farm size, commodity, region, and country.
• Although FSMA was passed in 2011, the rulemaking process for FSMA is ongoing and will ultimately include numerous new rules (i.e., regulations) and guidance documents.
• Both the proposed Produce Safety Rule and the proposed Preventive Controls Rule may affect local food farmers; these rules build on prevailing voluntary food safety guidelines. DTC farms apply more manure than all non-DTC farms and thus could be disproportionately affected by any FSMA regulations on the application of biological soil amendments.
Understanding who buys local foods and why is valuable for targeting marketing efforts by producers, grocery stores, restaurants, and others needing information on consumer demand for local food. ERS analysis of the USDA Farm to School Census, 2011-2012, finds farm to school programs exist in more than 4 out of 10 school districts across the country.
ERS analysis of 2006 Nielsen Homescan data finds that selected produce prices at DTC outlets are generally lower, on average, than prices at retail stores in all seasons. Nonetheless, DTC food prices for some product/location combina-tions were higher than retail store prices.
We draw no conclusion on whether local food production has a different environmental impact but do present some information about environmental practices of farms with and without DTC sales and synthesize literature on the nexus between the environment and local/regional food systems.
Many States and localities are supporting local food system development. While this report does not inventory such activities, we highlight some programs going on at the regional level. Collaboration is a common theme. Communities appear to be leveraging both Federal and State programs, while also partnering with nonprofits, the private sector, and other government entities.
Federal policies related to local and regional food systems were greatly expanded by the Food, Conservation, and Energy Act of 2008, and are further expanded in the Agricultural Act of 2014, which strengthened support for inter-mediated marketing channels.
How Was the Study Conducted?
This report draws on USDA surveys, censuses, and statistical analyses as well as the available academic literature to provide the latest information on the economics of local and regional food systems. Specifically, this report uses the latest (2012) Census of Agriculture data to describe local food producer characteristics, geography, and farm business survival and growth rates. This report also uses the ERS/NASS Agricultural Resource Management Surveys from 2008 to 2011 to provide a larger sample of local food farms than previous research. The report also summarizes find-ings from the 2011-12 USDA Farm to School Census. We believe this report is also the first to present a nationally representative comparison of produce prices at direct and conventional retail outlets; for this analysis we use 2006 Nielsen Homescan data.
www.ers.usda.gov

1 Trends in U.S. Local and Regional Food Systems: A Report to Congress, AP-068
Economic Research Service/USDA
Trends in U.S. Local and Regional Food SystemsA Report to Congress
Introduction
Consumer, producer, and policymaker interest in local foods appears to be growing. Farm operations with direct-to-consumer (DTC) sales of food for human consumption increased from 116,733 to 144,530 between 2002 and 2012. Consumers have more opportunities to purchase food directly from producers, with 8,268 farmers’ markets operating in 2014, up 180 percent since 2006. Martinez et al. (2010) offer a comprehensive overview of the concepts, impacts, and issues surrounding local food systems, noting that growing interest in local foods in the United States is the result of consumer interest in environmental and community concerns (where community concerns include supporting local farmers and the local economy but also increasing access to healthful foods). To complement these interests, Federal, State, regional, and local policy to support local food systems is growing. This report builds on the work of Martinez et al. (2010) by synthesizing research subsequent to its publication, and adding original analysis of data on local food producers, consumers, and prices.
What, exactly, do we mean by the term “local foods”? The definition of local food is complex, varying with purpose, geography, and data availability (Martinez et al., 2010). For some consumers, “localness” may not be based on distance, but rather on local ownership of the farm (Adams and Adams, 2011). For others, local food is associated with natural, organic, and other specialty foods marketed through DTC outlets, grocers and restaurants, and foodservice providers in institutions such as schools, universities, and hospitals.
“Local and regional food systems” refers to place-specific clusters of agricultural producers of all kinds—farmers, ranchers, fishers—along with consumers and institutions engaged in producing, processing, distributing, and selling foods. Since neither term is well defined, the distinction between local and regional food systems is unclear; hence, these terms are often used interchangeably, as in this report.
This report provides the latest economic information on local food systems with the goal of better informing producers, consumers, and policymakers about local and regional food systems. For example, understanding who buys local food and why they do so is not only valuable for producers hoping to market food locally, but also for grocery stores and restaurants.

2 Trends in U.S. Local and Regional Food Systems: A Report to Congress, AP-068
Economic Research Service/USDA
Local and Regional Food Producers
In 2012, 7.8 percent of U.S. farms sold food through local food marketing channels, including direct-to-consumer (DTC) marketing channels (e.g., farmers’ markets, roadside stands, u-pick) and inter-mediated marketing channels (e.g., direct to restaurants, institutions or to regional food aggregators). In addition to producing food, these farms must consider how they will market their output.
This section of the report focuses on what we know about producers marketing food locally and their economic impact on the local economy. We begin the chapter by discussing recent growth in marketing channels associated with local food systems; we find growth in the number of intermedi-ated markets. but the value of these sales is difficult to estimate given a lack of data. Working with available data, we examine the size and scope of local food farms, their characteristics, and geog-raphy. Between 2007 and 2012, more farms participated in DTC marketing channels but there has been no corresponding change in the value of DTC sales. We then compare survival rates of DTC farms with similarly sized farms without DTC sales, finding that while DTC farms are more likely to remain in business, they are less likely to experience growing sales than farms not involved in DTC sales. The section concludes with an overview of recent literature on the local economic impact of local food systems although it cannot draw generalizable conclusions because existing studies are based on specific local contexts and requisite national-level data are unavailable.
Growth in Certain Local Food Marketing Channels
Several local food marketing channels have experienced growth since 2006-7.1 As of 2014, there were 8,268 farmers’ markets in the United States, having grown by 180 percent since 2006 (fig. 1). While the growth in farmers’ markets signals increased consumer interest, for some local food farmers marketing food in multiple locations can increase marketing and transportation costs, reducing overall net farm income. Intermediated marketing channels (e.g., food hubs, direct sales to restaurants) may reduce marketing and transportation costs for participating producers.
Regional food hubs are enterprises that aggregate locally sourced food to meet wholesale, retail, institutional and even individual demand (see box, “Regional Food Hubs”). Since 2006-07, the number of food hubs has increased by 288 percent (fig. 1).
Farm to school programs have multiple objectives, ranging from nutrition education to serving locally sourced food in school meals. According to the USDA Farm to School Census, 4,322 school districts have farm to school programs, a 430-percent increase since 2006 (fig. 1).2
Geography and Characteristics of Farmers in Local and Regional Food Systems
Since 1978, the census of agriculture has asked farmers to report the sales of food for human consumption marketed directly to consumers through various DTC outlets such as farmers’ markets
1Data on these three local food marketing channels provide only a partial picture of local and regional food systems. National data collected over time do not exist for many marketing channels, including farm-to-college/hospital/prison arrangements, nor for the extent to which farmers have sold commodities by using Internet portals such as Market Maker.
2More results from the USDA Farm to School Census are available on pages 39-42 of this report.

3 Trends in U.S. Local and Regional Food Systems: A Report to Congress, AP-068
Economic Research Service/USDA
and farm stands.3 For the first time, the 2012 Census of Agriculture asked farmers to report if they sold any food for human consumption through outlets that in turn sell directly to consumers (including restaurants, grocery stores, schools, hospitals, or other businesses). Including these nondi-rect local food marketing channels brings the census closer to consumer notions of local foods, (e.g., locally produced, but purchased from the grocery store), and Matteson and Hunt’s (2012) definition of retail agriculture. King et al. (2010) and Low and Vogel (2011) refer to these nondirect marketing channels as intermediated marketing channels. Farm use of local food marketing channels is often correlated with the size of the farm operation and whether livestock or crop commodities are being produced (see box, “Definition of Terms”).
Using the Census of Agriculture To Examine Direct-to-Consumer Marketing
DTC sales averaged 0.4 percent of total agricultural sales over 2002-12 (table 2). Between 2002 and 2007, the number of DTC farmers increased by 17 percent, while the value of DTC sales increased by 32 percent, when measured in inflation-adjusted (constant) dollars. Between 2007 and 2012, the number of farmers using DTC channels increased by 5.5 percent, while the value of DTC sales actually declined by nearly 1 percent when measured in constant dollars. In 2012, counties with the highest DTC sales remained concentrated in the Northeast and the West Coast (fig. 2), as in 2007 (Martinez et al., 2010). Such geographic clustering does not exist for 2007-12 change in DTC sales, as measured in constant dollars (fig. 3). While much of the country had little change in DTC sales between 2007 and 2012, some counties had a decline while others exhibited an increase, predomi-nantly counties in or near urban areas.4
3The U.S. Department of Commerce, Bureau of Census conducted the census of agriculture every 5 years through 1992, after which USDA’s National Agricultural Statistics Service took over this task.
4We define no change as +/-$123,000 because this value represents one standard deviation of the 2007 distribution.
Sources: USDA, Agricultural Marketing Service, Food Nutrition Service; National Farm to School Network.
Figure 1
Increase in local & regional marketing channels
0 100 200 300 400
Percent change
Since 2007, growth in--
Farmers’ markets(2014)
Regional foodhubs (2014)
School Districts withfarm to school programs
(2011-12 school year)

4 Trends in U.S. Local and Regional Food Systems: A Report to Congress, AP-068
Economic Research Service/USDA
Regional Food Hubs
Regional food hubs have emerged as collaborative enterprises for moving local foods into larger mainstream markets, providing scale-appropriate markets for midsized farmers and opportunities for small and beginning farmers to scale up without increasing time spent marketing food (Barham, et al., 2012). According to the 2013 National Food Hub Survey, conducted by scientists at Michigan State University, 76 percent of food hubs worked exclusively or mostly with farmers with sales under $500,000, of which 26 percent were beginning farmers (those with less than 10 years’ experience farming) (Fischer, 2013).
Food hubs work with farmers to preserve the source-identified characteristic of the food’s origin and any special practices or circumstances under which the food was grown. By maintaining this information transparency throughout the local food supply chain, food hubs attempt to provide premium prices to farmers by selling differ-entiated products. Most food hubs do not necessarily require that farmers adopt specific production practices, but give preference to food grown meeting certain standards. According to the 2013 National Food Hub Survey, over 70 percent of food hubs expressed preferences for non-certified, but practicing organic farms and for commodi-ties grown using integrated pest management, while over 60 percent expressed preferences for animal products raised free range/pasture and/or grass fed and for food meeting certified standards (e.g., USDA organic, humane, Fair Trade, or food safety practices) (Fischer et al., 2013).
Many food hubs also offer technical assistance to producers with the objective of maintaining a continuous supply and quality control standards demanded by retail and institutional consumers. According to the 2013 National Food Hub Survey, over 40 percent of the food hubs offered production and post-harvesting services, business management services, and food safety training. Over 60 percent provided product differentiation marketing strategies, and 80 percent offered marketing services to producers or helped them find new markets (Fischer, et al., 2013).
Food hubs have diverse business models. Of the 302 food hubs in the United States, 40 percent operate as private businesses, almost 30 percent as nonprofits, and 20 percent as cooperatives (table 1). While 40 percent of food hubs provide locally sourced food commodities to consumers, other food hubs are equally likely to cater exclu-sively to business and institutional buyers or operate as a hybrid, catering to both businesses/institutions and consumers. Business models and missions likely vary because food hubs are responding to the needs of local producers, consumers, and communities.
Table 1
Food hubs in the U.S. by legal status and food hub type
Food hub clients:
Legal statusFarm to business/
institution Farm to consumer
Hybrid: business/ institution and
consumer Totals
Cooperative 18 25 18 61
Nonprofit 23 43 21 87
Privately held business 39 41 43 123
Other* 7 10 14 31
Total 87 119 96 302
*Incorporated, publicly and privately held corporations, and informally organized.
Source: USDA, Agricultural Marketing Service, List of Food Hubs, April 28, 2014.

5 Trends in U.S. Local and Regional Food Systems: A Report to Congress, AP-068
Economic Research Service/USDA
Two factors may have contributed to the lack of growth in DTC sales since 2007. First, consumer demand for local food purchased through DTC outlets may have plateaued, such that DTC outlets are competing for the same consumer dollar. Lohr et al. (2011) linked survey data on the distances that farmers and consumers are willing to travel to farmers’ markets. In densely populated urban
Definition of Terms
In this report, local food farms collectively refer to farms and ranches earning income from selling food for human consumption through any local food marketing channel (referred to as local food sales). Local food marketing channels are classified into two types. In direct-to-consumer (DTC) marketing channels, producers engage consumers in face-to-face market transactions at roadside stands, farmers’ markets, pick-your-own, onfarm stores, and commu-nity supported agricultural arrangements (CSAs). The majority of available data on local food marketing covers only these DTC marketing channels.
Intermediated marketing channels generally include all marketing opportunities in the local supply chain that are not farmer-to-consumer transactions, including farmers selling to grocers, restaurants, regional aggregators such as food hubs, and buying arrangements with the food service operations of schools, universities, hospitals, and other institutions. This definition of intermediated marketing channels is very broad. Data on specific intermediated marketing chan-nels only recently began to be collected. For example, the 2011 USDA Agricultural Resource Management Survey (ARMS) asks farmers, for the first time, to explicitly report institu-tional sales. The 2012 Census of Agriculture does not include in its question on intermediated marketing channels any explicit intermediated channels, such as food hubs or institutional sales, nor does it ask about the value of sales through intermediated channels.
In this report, data on farmers’ use of marketing channels are drawn from the 2008-11 ARMS and the 2002, 2007, and 2012 Censuses of Agriculture. Given the limitations of the ARMS and census of agriculture data, we categorize farmers’ local food marketing options in three discrete categories: farms selling exclusively through DTC marketing channels, exclusively through intermediated channels, or through both DTC and intermediated marketing channels.
Table 2
Number of direct-to-consumer farms and sales, 2002-12
Item
Census year:
2002 2007 2012
All farms reporting direct-to-consumer sales 116,733 136,817 144,530
Percent of all farms 5.5 6.2 6.9
Direct-to-consumer sales (million dollars) 812 1,211 1,310
Percent of all farm sales 0.4 0.4 0.3
Direct-to-consumer sales (millions of constant dollars: 2012 = 100) 1,002 1,322 1,310
Percent change from previous census 36.1 31.9 -0.9
Source: USDA, National Agricultural Statistics Service, Census of Agriculture data, various years; Council of Economic Advisors, Economic Report of the President (2014), Table B-3: Quantity and price indexes for gross domestic product, and percent changes, 1965–2013.

6 Trends in U.S. Local and Regional Food Systems: A Report to Congress, AP-068
Economic Research Service/USDA
Source: USDA Economic Research Service, data from Census of Agriculture, 2012.
Figure 2
Total direct-to-consumer sales, by county, 2012
NA
Less than $123,000
$123K - $1M
$1M - $2.5M
> $2.5M
Source: USDA Economic Research Service, data from Census of Agriculture, 2012 and 2007.
Figure 3
Change in direct-to-consumer sales, 2007-12 using constant 2012 dollars
Decreased by more than $123,000
Little change (-$123K to $123K)Increase ($124K-$1M)
Increase over $1M

7 Trends in U.S. Local and Regional Food Systems: A Report to Congress, AP-068
Economic Research Service/USDA
areas, farmers’ markets often compete with each other for vendors and consumers. In other areas, newer, more strategically located farmers’ markets may lead to the decline of previously estab-lished markets.
Second, where local food systems have been thriving, farmers may have been able to increase sales through intermediated marketing channels. That is, growing consumer demand for local food may have been met by retailers rather than through DTC sales. Although a grocer-industry consultant reported that local sourcing of farm products was the top grocer trend in 2012, Guptill and Wilkins (2002) found a decade earlier that large grocers were beginning to market locally produced food in response to consumers frequenting farmers’ markets and other DTC outlets. In a Mississippi case study, Morgan and Alipoe (2001) found that farmers’ markets, farm stands, and pick-your-own arrangements did not compete with grocers in filling consumer demand for food but were comple-mentary activities. Unfortunately, no national data are available to test this finding.
Food hubs may compete with other types of local food sales in certain regions. Existing research suggests that local food marketing outlets may be more competitive than complementary, but research on whether food hubs and farmers’ markets are competitive or complementary outlets for local food is not available.
Most food hubs are found in metropolitan counties.5 Fifty-six percent of the food hubs are found in a broad northeastern quadrant stretching from Wisconsin to North Carolina, and 23 percent are on the West Coast, extending inland (fig. 4).6 Counties in which 100 or more farmers use intermediated marketing channels are concentrated in areas of the Northeast and Mid-Atlantic States, and on the West Coast (fig. 4), as are DTC farms (fig. 2).
Deficiencies in the Data: Developing Synthetic Estimates of Local Food Sales Value
Central to understanding the national scope of farmers’ involvement in local and regional food systems is collecting the appropriate data at the farm gate. By including a question on farmers’ use of inter-mediated marketing channels, the 2012 Census provides a national benchmark estimate of the total number of local food farms in the United States. In the 2012 Census questionnaire, however, farmers were not asked to report the value of their sales using intermediated marketing channels.
The ARMS, which queried farmers about use of intermediated marketing channels and the value of sales from these channels for 2008-11, generated estimates exhibiting substantial year-to-year variation. This variation stems from (1) the ARMS mission and survey design, which is not geared to collect data on small, niche agricultural sectors; and (2) the growth and innovation of local food marketing channels during this period, which changed faster than the ARMS questionnaires could be adapted.7
5Over 50 percent of the food hub’s customers were within 50 miles of the food hub and 23 percent were between 50 and 100 miles of the food hub. Three-quarters of the food hubs were located in metropolitan counties, and 16 percent in adjacent nonmetropolitan counties (Fischer et al., 2013).
6The list of food hubs was provided by USDA’s Agricultural Marketing Service (April, 28, 2014) (http://www.ams.usda.gov/foodhubs).
7See the appendix for a full discussion of the year-to-year variation in the ARMS data. The appendix also contains a procedure we used to derive synthetic estimates of total local food sales.

8 Trends in U.S. Local and Regional Food Systems: A Report to Congress, AP-068
Economic Research Service/USDA
Table 3 presents 2008-11 ARMS estimates and 2012 Census counts of the number of local farms using the three marketing channel options: (i) exclusively using DTC outlets, (ii) using both DTC and intermediated marketing channels, or (iii) exclusively using intermediated marketing channels. The 2012 Census counts 163,675 farmers marketing local foods, of which 70 percent used only DTC channels and 30 percent used intermediated marketing channels only or both types of marketing channels. Averaged over 2008-2011, the smaller ARMS estimate (146,238 farmers) is 11 percent lower than the number of farmers using both marketing channels in the Census and 51 percent lower than the number of farmers in the Census exclusively using intermediated marketing channels. It may be that the ARMS underestimates the number of local food farms exclusively using intermedi-ated marketing channels. It may be that the ARMS also underestimates the value of all local food sales in the United States since farmers using both types of marketing channels or only intermedi-ated marketing channels generate higher sales per farm than farmers relying solely on DTC outlets (Low and Vogel, 2011).
Toward a Synthetic Estimate
Absent a census estimate of the total value of local food sales in the United States, we produce a synthetic estimate using the strengths of both the 2012 Census and pooled ARMS data. The census estimates on number of farms participating in DTC and intermediated marketing channels are comprehensive. The ARMS contain more detailed information on farm characteristics. Accepting the ARMS estimates of average sales per unit as given, a synthetic estimate of the value of local food sales can be obtained by multiplying the number of farms in the 2012 Census by ARMS esti-
Source: USDA Economic Research Service, data from Census of Agriculture, 2012; USDA Agricultural Marketing Service, 2014.
Figure 4
Farms with direct sales to retail or restaurants, 2012, and food hubs, 2014
Farms with intermediated sales
NA10 or fewer farms11 to 50 farms51 to 100 farmsOver 100 farmsFood hubs

9 Trends in U.S. Local and Regional Food Systems: A Report to Congress, AP-068
Economic Research Service/USDA
mates of local food sales per farm (table 4).8 Using this approach, we estimate that total local food sales are $6.1 billion. This estimate is 466 percent higher than the census value of total DTC sales ($1.31 billion). The $6.1 billion estimate is less than the 2013 grocer-industry consultant estimate of $9.0 billion, but higher than the average annual ARMS estimate of $4.0 billion (appendix table 1).
The 2012 Census data on the number of farms by farm size, marketing channel type, and produc-tion type (i.e., produce or livestock) allow us to compute estimates of local food sales tabulated by farm size and market channel type and by market channel and production type (see the appendix for a discussion on why we do not use ARMS, instead). Multiplying 2012 Census farm counts by the corresponding ARMS estimates of local food sales per farm means that each two-way comparison will introduce error in the two-way estimates. As such, the synthetic estimates of the totals are not equal.9 These two-way comparisons exploit detailed ARMS data on farm structure not available in
8See appendix for a detailed discussion about the assumptions made to obtain this estimate.9The aggregate estimate of $6.1 billion in local food sales is bounded by the two-way estimates of $5.8 billion in sales
summed across market channel use and production type and by the estimated $6.6 billion summed across farm size classes and market channels used. See the appendix for the tables constructing the two-way synthetic estimates of local food sales and for more details on the motivation and construction of the synthetic estimate.
Table 3
Estimated number of local food farms by marketing channel options, ARMS and 2012 Census of Agriculture
Item ARMS (2008-11 average) 2012 Census of Agriculture
Local food farms using:Number of farms Percent
Number of farms Percent
Direct-to-consumer channels only 114,001 78 115,304 70
Direct-to-consumer and intermediated marketing channels 21,201 14 25,756 16
Intermediated marketing channels only 11,036 8 22,615 14
All local food farms 146,238 100 163,675 100
Note: The ARMS estimates are annual averages computed by dividing by 4 the data pooled over the years 2008-11. The 2012 Census reports 144,530 direct-to-consumer farms in Table 1. The estimate of 141,060 (115,304 + 25,756) direct-to-consumer farms in this table excludes 3,740 farmers not answering the census question on intermediated marketing channel use.
Source: USDA, Economic Research Service/National Agricultural Statistics Service, Agricultural Resource Management Surveys (ARMS), 2008-2011; Economic Research Service analysis of USDA, National Agricultural Statistics Service, 2012 Census of Agriculture data.
Table 4
Synthetic estimate of local food sales
Item 2012 Census2008-2011
ARMS averageEstimated 2012 local food sales
Number of farms X LF sales per farm / 106 =
millions of dollars
Local food farms using:
Direct-to-consumer channels only 115,304 9,990 1,152
Direct-to-consumer and intermediated marketing channels 25,756 62,599
1,612
Intermediated marketing channels only 22,615 148,091 3,349
Total 163,675 – 6,113
Source: USDA, Economic Research Service/National Agricultural Statistics Service, Agricultural Resource Management Surveys (ARMS), 2008-2011; Economic Research Service analysis of USDA, National Agricultural Statistics Service, 2012 Census of Agriculture data.

10 Trends in U.S. Local and Regional Food Systems: A Report to Congress, AP-068
Economic Research Service/USDA
the 2012 Census. Despite unavoidable measurement error, the information on what size farm grows what commodities marketed through which marketing channel options is preserved as shares of all local food farms in figures 5 and 6. The aggregate estimate of $6.1 billion is the control total for all local food farms in figures 5 and 6.
Farm Participation in Local Food Systems, Using Synthetic Estimates
Farmers’ use of particular local food marketing channels is correlated with both the average size of farm operations, as measured by gross cash farm income (GCFI), and what they produce. Local food farms with less than $75,000 in GCFI account for 85 percent of all local food farms (fig. 5). Local food farms with GCFI between $75,000 and $350,000 represent 10 percent of local food farms—half earning GCFI up to $150,000 and half earning GCFI of $150,000 up to $350,000. Local food farms with CGFI under $75,000 generate only 13 percent of all local food sales, while the 5 percent of local food farms that have $350,000 or more in GCFI generated 67 percent of the value of total local food sales (fig. 5).
Note: The share of farms by farm size and marketing channel use are based on 2012 Census benchmark counts; the shares of total value of local food sales by farm size and marketing channel use are synthetic estimates. DTC = direct-to-consumer; GCFI = Gross cash farm income. Source: USDA, ERS/NASS, ARMS data, 2008-2011; USDA, NASS, 2012 Census of Agriculture.
Figure 5
Local food farms and sales by farm size and market channel use
Percent
Percent
DTC only
Local food sales (billion $) Number of local food farms
Both Intermediated only
0
10
20
30
40
50
60
70
80
90
All LF farms
(163,675)
GCFI less than $75,000
(138,598)
$75,000 - $349,999(16,610)
$350,000or more(8,467)
0
10
20
30
40
50
60
70
80
All LF farms(6.1)
GCFI less than $75,000
(0.78)
$75,000 - $349,999
(1.2)
$350,000or more
(4.1)
Farm size (Number of farms) Farm size (Food sales)

11 Trends in U.S. Local and Regional Food Systems: A Report to Congress, AP-068
Economic Research Service/USDA
Produce farms—those producing fruit, vegetables, or nuts—represent 29 percent of all local food farms and account for 51 percent of all local food sales (fig. 6).10 In 2012, 34 percent of all U.S. produce farms sold food through local food marketing channels, whereas only 3 percent of all other crop farms and 8 percent of livestock and livestock product farms did so.
The extent to which farmers sell local food through intermediated marketing channels is correlated with farm size.11 Even within farm size categories, however, those local food farmers marketing some food through intermediated marketing channels appear to earn disproportionately larger shares of local food sales generated by farms in each farm sales class.
In 2012, 74 percent of the 138,600 local food farms with GCFI less than $75,000 used DTC marketing channels only (fig. 5). Farmers using only DTC marketing outlets accounted for 54 percent of the $778 million in local food sales earned by local food farmers in this sales class.
Among the 16,600 local food farms with GCFI between $75,000 and $350,000, 53 percent used DTC outlets exclusively and earned only 31 percent of $1.2 billion in local food sales generated by farmers in this farm sales class. We estimate that local food farmers with CGFI between $75,000 and $350,000 using intermediated marketing channels, either exclusively or in combination with DTC sales, earned a disproportionately large share of local food sales in this sales class, accounting for 69 percent of local food sales.
Local food farms with GCFI over $350,000 that marketed exclusively through intermediated marketing outlets generated the largest average sales and accounted for 71 percent of local food sales
10ARMS and Census classify farms by production type according to the agricultural commodity that accounts for at least 50 percent of farm sales. Farm production classification of local food farms are aggregated into three basic categories: fruit/vegetable/nut farms (produce farms), all other crop farms, and farms producing livestock and livestock products. We assume that farms classified by production type sell commodities within that production type locally. It is possible, for example, that a livestock farm may sell vegetables grown on a small plot through local marketing channels. In census questionnaires, farmers were asked to identify what commodities were sold through DTC channels; however, producer responses were never intended to be coded, preventing us from exploring the extent to which this practice occurs.
11In this section, data on the number of farms and shares of all local food farms by category are based on 2012 Census benchmark counts; the shares of total value of local food sales by category are synthetic estimates.
Farm Sales Classes Defined
The recently updated ERS farm typology classifies U.S. family farms with gross cash farm income (GCFI) of less than $350,000 as small farms, those with GCFI between $350,000 and up to $1 million as midsized farms, and those with GCFI of $1 million or more as large farms (Hoppe and MacDonald, 2013). The recently updated ERS farm typology also defines a subcat-egory of small farms generating GCFI of less than $150,000 as low-sales family farms.
The distribution of local food farms is concentrated at low levels of GCFI. To facilitate compari-sons of similarly sized farms with and without DTC sales, we examine local food farms by farm size using three size categories, two of which comprise subcategories of small farms: local food farms having less than $75,000 in GCFI, local food farms having GCFI of $75,000 up to $349,999, and the third category, local food farms having GCFI of $350,000 or more. Adjusted for inflation, these categories correspond to those used in Low and Vogel (2011).

12 Trends in U.S. Local and Regional Food Systems: A Report to Congress, AP-068
Economic Research Service/USDA
by farms reporting CGFI greater than $350,000. In contrast, the other 66 percent of local food farms of this sales class accounted for the remaining 29 percent of local food sales.
Produce farms’ value of sales in local foods marketing channels stands out. Produce farms represent 26 percent of the 115,300 farmers using DTC sales exclusively; however, they generate 45 percent of the $1.2 billion in exclusive DTC food sales (fig. 6). Almost half of all farms using both DTC and intermediated outlets are produce farms; they generate $1.0 billion in local food sales (64 percent of $1.6 billion total sales by local food farmers using both marketing channels). Although produce farms comprise only 25 percent of farmers using intermediated channels exclusively, they earn 46 percent of its sales, or $1.5 billion.12
Farm Business Survival and Growth and Direct-to-Consumer Marketing
Operating a farm is a financially risky undertaking. Farm businesses operate in a competitive envi-ronment, with income that can vary substantially from year to year as product prices, input prices,
12With respect to marketing exclusively through intermediated channels, the produce farmers’ share of total local food sales in 2012 appears to have declined since 2008, when produce farmers generated 60 percent of local food sales exclu-sively marketed through intermediated channels (Low and Vogel, 2011). This decline may be indicative of the emergence of local meats and dairy (Johnson et al., 2013).
Note: The share of farms by marketing channel use and farm production type are based on 2012 Census benchmark counts; the shares of total value of local food sales by marketing channel use and farm production type are synthetic estimates. Source: USDA, ERS/NASS, ARMS data, 2008-2011; USDA, NASS, 2012 Census of Agriculture.
Figure 6
Local food farms and sales by market channel use and farm type
Percent Percent
0
10
20
30
40
50
60
70
Direct toconsumer
only(115,304)
Inter-mediated
only(22,615)
All localfood farms(163,675)
Type of marketing channel(Number of farms)
Number of farms
0
10
20
30
40
50
60
70
Direct toconsumer
only(1.2)
Both(1.6)
Inter-mediated
only(3.3)
All localfood farms
(6.1)
Type of marketing channel(Food sales)
Other crops Vegetables, fruit, and nuts Livestock & products
Local food sales (billion $)
Both(25,756)

13 Trends in U.S. Local and Regional Food Systems: A Report to Congress, AP-068
Economic Research Service/USDA
and yields vary. This section discusses farm business survival and growth rates of farms using DTC marketing channels and finds that these farms are more likely to remain in business than all other farms but less likely to increase in size (measured by sales) over time.
Farm Business Survival
In the United States, the farm business survival rate is low.13 According to census of agriculture data, only 55.7 percent of all farms having positive sales in 2007 also reported positive sales in 2012. Beginning farmers (those farming for no more than 10 years) are even less likely to report positive sales in consecutive census years. Only 48.1 percent of beginning farmers in 2007 reported positive sales 5 years later.
The census data also show that farmers who market food for human consumption directly to consumers have a greater chance of reporting positive sales in 2007 and 2012 than those who market through traditional channels.14 The first two columns in table 5 compare the survival rates (the share of farmers who reported positive sales in 2007 and 2012) for farms in four sales categories. In each category, farmers with DTC sales had a higher 2007-12 survival rate. The differences in survival rates were substantial, ranging from 10 percentage points for the smallest farms to about 6 percentage points for the largest. The 2007-12 survival and growth rates reported in tables 5 and 6 display similar patterns to the 2002-07 survival and growth rates (not reported here).15
Direct marketing was also associated with higher survival rates among beginning farmers (columns 3 and 4, table 5). On average, beginning farmers who marketed directly to consumers had a 54.3-percent survival rate, compared to 47.4 percent for those who marketed their goods through tradi-tional channels.
What is it about DTC sales that seem to enhance farmers’ chances of maintaining positive sales? One advantage might stem from the fact that, for a given level of sales, farmers with direct marketing purchased less machinery and land than did those with traditional marketing. According to the 2012 Census of Agriculture data, farmers who marketed directly owned $20.82 worth of machinery per dollar of sales, compared to $31.10 for those who marketed through conventional channels. Farmers selling directly to consumers also owned less land: $240 worth of land per dollar of sales, compared to $309 per dollar of sales for other farmers. Because they did not need to purchase as much machinery and land to achieve a certain level of sales, farmers with direct sales did not need to leverage as much of their wealth to obtain financing. This is confirmed by the census data, which show that farmers with direct sales had annual interest payments of only $7.85 per $1,000 of owned assets, compared to $10.55 for those with no direct sales. A lower debt-to-asset ratio should indicate a better ability to repay loans and has been shown to reduce the risk of small business failure (Tveteras and Eide, 2000; Strotmann, 2007; Fotopoulos and Louri, 2000).
13In this section, a farm business is considered to have survived (not exited) if its operator reported positive sales in consecutive censuses. This understates actual survival rates since some operations may remain in business with no sales—e.g., if there were a total crop failure but the operator had sufficient crop insurance to continue operating.
14This section uses farms with DTC sales and does not cover farms with intermediated sales because the 2007 Census of Agriculture contained no information on whether farms participated in intermediated markets. The “old” ERS farm typology (with farms having sales in excess of $250,000 considered “large”) is used because it was in place when the 2007 Census of Agriculture was conducted.
15The findings illustrated in tables 5 and 6 are robust to controls for operation and operator characteristics, including farm location, farm business organization, type of commodity produced, and the operators’ age and education.

14 Trends in U.S. Local and Regional Food Systems: A Report to Congress, AP-068
Economic Research Service/USDA
Farm income risk is another factor that could explain some of the differences in survival rates. For farmers who do not sell directly to consumers, profits can fluctuate widely because of changes in input and output prices and yields. Farmers who market to consumers are also exposed to these risks; however, these farmers derive some of their income from their marketing activities and not just production. Income from marketing depends on the margin between the wholesale and retail price and the time spent marketing. Even when input and output prices vary, the markup between the wholesale and retail prices should remain relatively stable. Hence, the additional income that can be earned from selling directly to consumers versus to wholesalers should not vary substantially because of price fluctuations. Therefore, it is plausible that total farm income is less risky for DTC farmers, but future research is needed to answer this question.
Farm Business Growth
While farmers who directly market to consumers are more likely to continue farming than those who do not, their businesses expand at a slower rate. Table 6 compares the arc percent change in nominal total gross sales between 2007 and 2012 for surviving farms in different sales catego-
Table 5
Business survival rates 2007-12 by initial farm size and marketing arrangement
All operationsBeginning farmer
in 2007
2007 sales categoryNo direct sales
in 2007Direct sales
in 2007No direct sales
in 2007Direct sales
in 2007
$1-9,999
Survival rate, 2007-12 0.453 0.549*** 0.416 0.507***
Observations 484,211 51,535 177,392 22,170
$10,000-49,999
Survival rate, 2007-12 0.581 0.667*** 0.521 0.611***
Observations 268,758 23,729 68,053 7,647
$50,000-249,999
Survival rate, 2007-12 0.656 0.738*** 0.593 0.649***
Observations 194,563 11,270 35,364 2,661
$250,000+
Survival rate, 2007-12 0.728 0.791*** 0.66 0.704***
Observations 178,515 5,450 27,115 800
All
Survival rate, 2007-12 0.553 0.609*** 0.474 0.543***
Observations 1,126,047 91,984 307,924 33,278
Notes: Asterisks denote rejection of the null hypothesis that the difference in means is zero at the (*) 10%; (**) 1%; and (***) 0.1% statistical significance levels. Sample includes all operations with positive sales in 2007. The survival rate is defined as the share of 2007 Census respondents with positive sales who reported positive sales in the Census in 2012.
Source: USDA, NASS, Census of Agriculture, 2007, 2012.

15 Trends in U.S. Local and Regional Food Systems: A Report to Congress, AP-068
Economic Research Service/USDA
ries.16 Sales by farms using direct marketing grew less than those with no direct sales in every size category. On average, surviving farmers with direct sales in 2007 increased their total sales by 13.5 percent between 2007 and 2012, compared to 19.3 percent for farmers with no direct sales.
Among beginning farmers, direct sales were also associated with slower growth (columns 3 and 4 in table 6). On average, beginning farmers with direct sales increased sales by 17.9 percent between 2007 and 2012, compared to 25.6 percent for those without direct sales. For all but the smallest farm size category, the differences in growth rates between those with and without direct sales were larger for beginning farmers than for the full sample.
The difference in growth rates may stem from differences in labor requirements. Selling directly to consumers through farm stands, farmers’ markets, or CSAs is labor-intensive. The 2012 Census data indicate that in every sales category, farmers with direct sales hire significantly more labor than farmers with no direct sales. Because farms that market through traditional channels require less labor, these farms can become larger before labor must be hired. In contrast, farms using direct
16The arc percent change for farm i is defined as: 100* (xit+1 - xit)/0.5*(xit+1+xit ). The arc percent change is prefer-able to the percent change because the arc percent change is: 1) symmetric regarding increases or decreases over time, 2) defined for zero values, and 3) bounded between -200 and 200. The third reason provides for more stable estimates when x has a skewed distribution with some observations having very large changes over time.
Table 6
Percent change in sales 2007-12 by initial farm size and marketing arrangement
All operations Beginning farmer in 2007
2007 sales categoryNo direct sales
in 2007Direct sales
in 2007No direct sales
in 2007Direct sales
in 2007
$1-9,999
Arc percent change, 2007-12 36.9 31.8*** 41.5 35.4***
Observations 225,862 28,981 76,121 11,521
$10,000-49,999
Arc percent change, 2007-12 2.8 -12.1*** 2.1 -16.7***
Observations 158,367 16,057 35,902 4,736
$50,000-249,999
Arc percent change, 2007-12 12.1 -3.3*** 14.6 -6.5***
Observations 128,175 8,350 20,941 1,736
$250,000+
Arc percent change, 2007-12 12.3 3.9*** 11.5 -9.8***
Observations 130,434 4,336 17,936 559
All
Arc percent change, 2007-12 19.3 13.5*** 25.6 17.9***
Observations 642,838 57,724 150,900 18,552
Notes: Asterisks denote rejection of the null hypothesis that the difference in means is zero at the (*) 10%; (**) 1%; and (***) 0.1% statisti-cal significance levels. Sample includes all operations with positive sales in 2007. The percent change for farm i is defined: 100*(xit+1 - xit )/0.5*(xit+1 + xit).
Source: USDA, NASS, Census of Agriculture, 2007, 2012.

16 Trends in U.S. Local and Regional Food Systems: A Report to Congress, AP-068
Economic Research Service/USDA
marketing would need to begin hiring labor at a smaller scale of production. Transaction costs asso-ciated with hiring labor could provide a disincentive for expansion.
The finding that farms with direct sales have both higher survival rates and slower growth might be explained by differences in off-farm opportunity costs. Gimeno et al. (1997) found evidence that small business survival depends not only on economic performance, but also on the entrepreneur’s human capital and alternative employment opportunities. Farmers with limited off-farm income opportunities would be more inclined to remain in farming, despite lower farm profits and less ability to expand the business. We do not observe in the census data the time spent working on the farm so we cannot evaluate the returns to labor from farming.
We can compare off-farm income indirectly by examining total household income, however. The 2007 Census of Agriculture data indicate that only 48.9 percent of farmers with direct sales reported that their household income was greater than $50,000 annually, which is statistically significantly less than the 51.2 percent of farmers with no direct sales.17 Additionally, 15.9 percent of farmers with direct sales reported less than $20,000 in annual household income—statistically significantly more than the 14.0 percent of those with no direct sales. The lower total household income suggests that farmers with direct sales may have had less favorable off-farm income opportunities. If true, this could provide them with an incentive to remain in business even if they have less ability or opportu-nity to expand production.
Higher survival rates and slower growth for those with direct sales might also be explained by different attitudes toward farm versus nonfarm work. Researchers have found evidence that nonpecuniary benefits from self-employment explain why small business owners remain in business despite earning less income (Hamilton, 2000). There is also evidence that the non-pecuniary benefits to farming (e.g., greater autonomy, independence, and lifestyle factors) are substantial (Key and Roberts, 2009). It is possible that farmers who sell directly to consumers derive greater nonpecuniary benefits from their work—perhaps they enjoy interacting with their customers. This would provide a greater incentive for them to remain in business even with lower business expansion possibilities.
Local Food Systems and the Local Economy
Despite the recent growth in local food systems and markets, economic impact assessments of these activities are still nascent (Boys and Hughes, 2013; O’Hara and Pirog, 2013). Martinez et al. (2010) found empirical support for the notion that local economic benefits may accrue from greater local retention of the spent food dollar, from spillovers to nearby businesses, and from increased entre-preneurship. Subsequent research largely focusing on case studies adds to the evidence reviewed by Martinez et al. that some positive economic impacts can occur. These studies are based in specific local contexts, however, and lack requisite data for complete evaluation. Thus, it is difficult to draw generalizable conclusions about the contributions of local food systems to a region’s economy and there are many important areas for future research.
Economic Impact Assessments of Local Food Systems
Most of the local food economic impact assessment studies that are peer-reviewed and have explicit, reliable methodologies focus on the economic impacts of marketing channels, including farm to
17The 2007 Census of Agriculture data are used because the 2012 Census did not ask about household income levels.

17 Trends in U.S. Local and Regional Food Systems: A Report to Congress, AP-068
Economic Research Service/USDA
school programs (Gunter and Thilmany, 2012), food hubs (Schmit et al. 2013), agritourism (Brown et al., forthcoming; Mansury and Hara, 2007), and farmers’ markets (Henneberry et al., 2009; Hughes et al., 2008; Sadler et al., 2013). Other studies assess the hypothetical local economic impacts resulting from increased local consumption of locally grown agricultural products (Conner et al., 2008), and look at the links between community-focused agriculture and regional economic growth (Brown et al., forthcoming).
As Martinez et al. (2010) note, the most direct way local food systems can affect local economies is through import substitution—consumers purchasing food produced locally (instead of importing food from a neighboring region, State, or country), which increases economic impacts when local workers and businesses spend additional income (multiplier effects) on inputs or other products locally (Swenson, 2009). (Of course, import substitution can be a “zero-sum game” for the national economy, as regions reducing imports of say, leafy greens, may hurt the region of California depen-dent upon exporting leafy greens.) The total economic impact is composed of direct effects (the value of new food production and the labor income generated), indirect effects (the value of locally supplied inputs and services), and induced effects (the value of earnings spent in the study region by workers in the direct and indirect supply sectors).
Economic impact assessments of farmers’ markets feature most prominently in the literature princi-pally because there is more data on farmers’ markets than other marketing channels. Martinez et al. (2010) reviewed this literature, reporting job multiplier effects ranging from 1.41 to 1.78. In essence, each full-time equivalent (FTE) job created at farmers’ markets supports approximately half (0.41 to 0.78) a FTE job in other sectors of the region’s (in this case, State’s) economy.18 These studies used a case study approach due to the effort required to obtain data and the heterogeneity of producers who sell through farmers’ markets (Hardesty and Leff, 2010; LeRoux et al., 2010). Case studies are particularly useful when studying local food systems because policy, non-governmental organiza-tion contributions, and other circumstances that affect local food markets tend to vary across locales. Unfortunately, the case study approach makes generalizing research results difficult.
Schmit et al. (2013) conducted the first economic impact assessment of increased demand for food hub goods and services. They find output (dollar) multiplier impacts in New York State ranging from 1.82 to 1.63, which are higher than multiplier impacts from comparable industries such as wholesale trade and truck transportation.
Mansury and Hara (2007) examine a hypothetical agritourism promotion that increases demand for organic produce in a region of New York. They find that a successful campaign to promote organic agriculture increases production output and accrues most benefits to the smallest farm households in the region. Brown et al. (forthcoming) provide the first examination to include both DTC sales and agritourism income. They find no general association between growth in U.S. agricultural sales and growth in DTC and agritourism income, but they do find a positive relationship between the two in certain regions. Brown et al. conclude that DTC sales and agritourism income did not make significant contributions to national economic growth between 2002 and 2007, likely because local or regional impacts are to some extent a zero-sum game. They found that a $1 increase in farm sales led to an annualized increase of $0.04 in personal income in the county.
Swenson’s (2011) study of small-scale meat processing in Iowa found that every $1 million in meat processing output required 13.3 jobs that paid $464,870 in labor income. When including the
18For a full discussion on interpreting multiplier effects, see Martinez et al. (2010, p. 44.)

18 Trends in U.S. Local and Regional Food Systems: A Report to Congress, AP-068
Economic Research Service/USDA
multiplier impacts, $1 million of output supports a total of 17.6 jobs, $613,117 in labor income, and $738,777 in Iowa gross domestic product.
The economic benefits of farmers’ markets may also extend beyond multiplier effects, which measure short-term impacts. Lev et al. (2003), for example, found that businesses near farmers’ markets reported higher sales on market days. Not only were these additional sales found to directly support the businesses themselves, but they also generated extra tax revenue for the communities in which the markets were located. Brown (2002) found some evidence that farmers’ markets increase property values in the market district.
Additionally, farmers’ markets can function as business incubators by providing the infrastructure necessary to build skills and gain business experience (Feenstra et al., 2003; Gillespie et al., 2007). Regular interactions can “generate and circulate knowledge that vendors might use to develop new products and creative ways of marketing them” (Hinrichs et al., 2004: 32-33). Feenstra et al. (2003), for example, explored New York, Iowa, and California farmers’ market contributions to the devel-opment of vendors’ capacity as entrepreneurs and found that 66 percent of vendors expanded an existing product line, 50 percent added a new product category, and 40 percent made new business contacts. Sales income may be less important than the skills and business experience developed through participation in farmers’ markets (Brown et al., 2007).
Challenges With Local Food Economic Impact Assessments
It is difficult to draw overarching conclusions from the existing body of research because most studies have narrow geographic and market scope (O’Hara and Pirog, 2013). Also, there are many definitions of “local food,” and clearly delineating what should and should not be included is neces-sary in order to quantify economic impacts. Gunter and Thilmany (2012) provide the only peer-reviewed research that provides “scenarios” for local food definitions, modeling a hyper-local impact (a two-county farm to school program) and a regional impact (five-county region). As expected, the larger the definition of local, the larger the resulting economic impact.
Low and Vogel (2011) find that most local food systems involve intermediary businesses (e.g., aggre-gators, distributors, wholesalers) to get the product from farm to market.
Acknowledging the myriad of actors involved in sustaining local food systems is critical to deter-mining its overall economic impact. The varied ownership structures and business headquarter loca-tions (to which profits frequently accrue) of input, distribution, and other businesses servicing the local food system make definitions of both the system and the region challenging.
Other problems plague the existing body of research on local economic impacts. First, most of the current research makes assumptions about local food participants’ patterns of expenditure, which may not accurately reflect their interindustry linkages, and so may miscalculate local economic impact.
Second, opportunity costs—or what O’Hara and Pirog (2013) refer to as “interpretation chal-lenges”—remain largely unconsidered (Boys and Hughes, 2013). O’Hara and Pirog (2013) point out that measuring opportunity cost is not straightforward, and requires information about the extent to which increased consumer purchases of locally grown food offset other types of purchases, change market prices and/or supply chain characteristics, or affect land use. For example, to what extent do farmers’ markets divert purchases from another “local” outlet versus increase overall purchases? If local food systems in rural areas require public subsidy, what are the opportunity costs of that

19 Trends in U.S. Local and Regional Food Systems: A Report to Congress, AP-068
Economic Research Service/USDA
subsidy? If acreage is converted from field crops to vegetables, by how much does the income from the vegetables offset the decreased income from field crops? Without accounting for opportunity cost, economic impacts are likely to be overstated, or at least not fully understood.
Only a handful of local food economic impact assessments explicitly acknowledge the need to consider opportunity cost (Conner et al., 2008; Hughes et al., 2008; Gunter and Thilmany, 2012; Tuck et al., 2010; Swenson, 2008, 2010). However, none of this body of research collects the data necessary to more fully understand the opportunity costs of increased local purchases. For example, Hughes et al. (2008) assume a loss in grocery store sales due to expenditures at farmers’ markets. They find that the economic impact of farmers’ markets was still significant, but reduced substan-tially when accounting for the opportunity cost of such spending.
Schmit et al. (2013) are the first study to collect primary data to assess the opportunity cost associ-ated with policies that support food hubs. However, their data collection is limited to customers currently purchasing product from food hubs. Even with this limited sample, they find that 49 percent of customers reduce purchases from other sources due to the availability of food hub goods and services and that, on average, total purchases from the local wholesale trade sector are reduced by 11 percent. This reduces the overall multiplier impact of food hubs by 10 percent.
It is not clear how estimates of net economic benefits would be affected if the costs of public invest-ments in local food markets are included. Gunter and Thilmany (2012), for example, write in refer-ence to their economic impact assessment of a farm to school program in Colorado that “as with past studies, a positive economic impact on the local community was found from increased purchasing of locally produced foods. But the impact is quite small and may or may not justify the cost (private and/or public) of the new investments necessary to build needed infrastructure, particularly when the net rather than gross impacts are analyzed.”
Another unexplored dimension of opportunity cost is how impacts from local food systems are distributed between urban and rural places. As one might expect, the demand for local food appears to be concentrated in urban areas (Lichter and Brown, 2011; Hinrichs and Charles, 2012; Jablonski, 2014; Jackson-Smith and Sharp, 2008; Low and Vogel, 2011).
Studies of rural farmers’ markets point toward urban advantages. Malone and Whitacre (2012) found that the most rural counties were under-represented in DTC sales. Schmit and Gomez (2011) and Jablonski et al. (2011) reported limited overall vendor sales in their studies of rural markets across northern and central New York, respectively. Even in studies of rural communities demonstrating consumer willingness to pay a premium for locally grown produce, evidence shows that there are often not enough customers to offset the production and harvesting expenses (Biermacher et al., 2007).

20 Trends in U.S. Local and Regional Food Systems: A Report to Congress, AP-068
Economic Research Service/USDA
Food Safety and Local Food Production, Processing, and Marketing
Recent foodborne illness outbreaks in the United States have increased efforts from both govern-ment and industry groups to ensure that the U.S. food supply is safe (Palma et al., 2010). This section first discusses the current food safety regulations and standards affecting farms marketing produce and meat locally and then discusses the Food Safety Modernization Act (FSMA) that was signed into law on January 4, 2011. FSMA calls for sweeping changes to the U.S. food safety system for produce as focus shifts from ex post control and reaction to food safety incidents to risk-based preventive action with a focus on public health.
Current Food Safety Standards Affecting the Local Marketing of Fresh Produce
Based on the 2012 Census of Agriculture and ERS calculations, 37 percent of farms selling produce are engaged in DTC or intermediated sales. Prior to the passage of FSMA, Federal statutory law did not regulate the safety of fresh produce, which is grown on 8.4 percent of U.S. farms. Instead, private food safety standards—either voluntary, imposed by buyers, or industry-led commodity-specific initiatives—are prevalent throughout fresh produce markets.
A public food safety education program for fresh produce growers and packers began in 1998 when the Food and Drug Administration (FDA) published its Guide to Minimize Microbial Food Safety Hazards for Fresh Fruits and Vegetables. All producers, including small producers of locally marketed fruit and vegetables, are encouraged to be Good Agricultural Practices (GAP) compliant. With partial support from FDA and USDA, a National GAPs Program was established to reduce microbial risks in fruits and vegetables by developing a comprehensive extension and education program for growers and packers (http://www.gaps.cornell.edu/index.html).
For more than a decade, USDA’s Agricultural Marketing Service (AMS) has offered voluntary GAP and Good Handling Practices (GHP) audits of produce suppliers throughout the production and supply chain (USDA AMS, 2014). In 2012, the USDA Audit Program performed over 3,000 audits in 46 States, Canada, and Chile, covering over 90 commodities. Many produce buyers and food-service companies—including the USDA Commodity Procurement Program, Sysco, Subway, and Wal-Mart—recognize USDA’s GAP and GHP certifications as an approved supplier audit (Wallace Center Winrock International, 2012).
Growers are motivated to become GAP certified in order to ensure customers of food safety, meet buyers’ requirements, maintain market access, and manage their own business risk as an outbreak can damage a brand name or bankrupt a business (Becot et al., 2012; Calvin et al., 2004; Durham et al., 2011). Local food producers participating in farm to school programs may be compelled by schools or by the State to keep a record of their agricultural and manufacturing practices, and to observe quality control measures (Holcomb et al., 2013).
In response to small producer concerns regarding the cost and time needed for food safety verifica-tion, AMS crafted the Group GAP Pilot Project in 2010 (Wallace Center Winrock International, 2012). Small and midsize farms may be less likely to become certified under GAPs and GHP because of the perceived burden of recordkeeping and modifying farm infrastructure and equip-

21 Trends in U.S. Local and Regional Food Systems: A Report to Congress, AP-068
Economic Research Service/USDA
ment (e.g., adding bathrooms, handwashing stations, and washing/rinsing systems for produce). The Group GAP Pilot Project is based on an international standard whereby a group of farms develop shared quality standards and operating procedures and are audited as one entity.19
Successfully transitioning USDA’s Group GAP pilot project into a working, market-ready system will help alleviate some compliance challenges faced by small local producers of fruit and vegeta-bles, providing much needed support to local and regional food systems. Following early pilot work with Good Natured Family Farms in the Kansas City region, AMS teamed up with the Wallace Center in 2013 to spearhead the selection of initial pilots (hubs or farmer groups), develop the first draft of a group GAP for use by the pilots, and raise funds to support development, outreach, and implementation of the program.
Private firms also provide independent third-party food safety audits for fresh produce. Buyers often require suppliers to abide by particular food safety requirements and compliance audits as they respond to increased consumer demand for food safety and assess their own liability risk. Produce farms, including small farms, wishing to market to big retailers must comply with their food safety requirements. Holcomb et al. (2013) indicate that many buyers now want a food safety audit that is recognized by the Global Food Safety Initiative (GFSI).20 In 2008, Wal-Mart became the first nationwide U.S. grocery chain to require suppliers of its private label and other food products (i.e., produce, meat, fish, poultry and ready-to-eat foods) to have their factories certified against GFSI standards. For growers, a GFSI-compliant audit will often fulfill the needs of multiple buyers.
Holcomb et al. also cited Wal-Mart as recently embracing corporatewide efforts to make fresh produce suppliers adhere to the Produce Traceability Initiative requirements, without exemp-tions or exclusions for small farms or local produce. Increasingly, larger foodservice establish-ments (e.g., schools, hospitals, food retailers, and even farmers’ markets) are requiring that their suppliers have food product liability insurance in order to mitigate the financial burden of food-borne illness outbreaks. In Boys’ (2013) study, surveyed specialty crop farms in the Southeast were motivated to purchase liability insurance by traceability concerns, buyer requirements, and marketing strategy goals.
Some fresh-produce industry groups have developed their own commodity-specific food safety plans, often after a major foodborne illness linked to their industry.21 For example, in 2006 a major foodborne illness outbreak was linked to spinach from California contaminated with E. coli O157:H7. The outbreak involved 204 illnesses in 26 U.S. States and Canada, 104 hospitalizations, 31 cases of kidney failure, and 3 deaths. The following year, the California Leafy Greens Marketing Agreement (LGMA) was established. It is a voluntary marketing agreement that establishes food safety standards and a process for mandatory audits for participants, organized by the California Department of Food and Agriculture with assistance from USDA’s Agricultural Marketing Service
19For more information, see http://www.ngfn.org/resources/food-safety/introduction-to-globalgap-group-certification-option-2.
20GFSI was launched in 2000 as a non-profit organization focusing on a collaborative approach to the harmonization of food safety standards throughout the supply chain. Presently, the focus is to facilitate collaboration among international food safety experts for the continuous improvement of food safety management systems. Activities include harmoniza-tion of the definition of food safety requirements, development of a capacity building plan for small and/or less developed businesses to facilitate access to local markets, and a common consensus on the skills, knowledge and attributes for competency among food safety auditors (GFSI, 2014).
21Large, concentrated, homogenous industries often have an easier time organizing to develop a food safety program than smaller, more dispersed, or more heterogeneous groups of farmers (Avendaño and Calvin, 2006).

22 Trends in U.S. Local and Regional Food Systems: A Report to Congress, AP-068
Economic Research Service/USDA
(Calvin, 2007). The food safety standards in the LGMA are much more specific than the FDA GAPs (which are generic for any commodity). For example, GAPs instruct growers to make sure that the water quality is adequate to carry out food safety protocols but do not specify acceptable water quality standards. LGMA membership stands at over 100 handlers22 representing 99 percent of the volume of California leafy greens production (LGMA, 2014). Other commodity-specific audit programs include the Arizona LGMA, Mushroom Good Agricultural Practices, and the Tomato Food Safety Audit Protocol.23
Food Safety Regulations and Locally Marketed Meat
The number of livestock farms with DTC sales increased by 1,349 (1.2 percent) between the 2007 and 2012 Censuses of Agriculture, even as the number of livestock farms declined by 269,833 (18.6 percent); consequently, the share of livestock farms with DTC sales rose from 7.5 percent to 9.3 percent in 2012.24 In 2012, livestock farms reported $648 million in earnings from DTC sales, nearly half the value of all DTC sales.25
Under the Federal Meat Inspection Act, all meat slaughter and production for interstate commerce must fall under inspection administered by USDA’s Food Safety and Inspection Service (FSIS) or by cooperative state inspection programs.
There are some exemptions to inspection. For instance, an owner of a live animal may have that animal slaughtered at an establishment known as “custom-exempt.” This exemption allows the processor to forgo daily State or Federal inspection, though the processing still must occur under basic sanitation. The resulting product must be labeled “not-for-sale.” Custom-exempt processing cannot be used when a producer is marketing local meat, only when marketing live animals—e.g., selling a finished steer to a buyer who has it slaughtered for personal use (Johnson et al., 2012).
Studies show that food safety requirements for meat processors place a large burden on smaller processors—those most likely to serve producers marketing meat locally (Muth et al., 2007). The most common barrier affecting the smallest meat processors was that their average cost of compli-ance, as a share of revenue, was high relative to the industry average. USDA FSIS has a Small Plant Help Desk and prepares compliance guides to assist in dealing with regulatory matters. Moreover, the food safety requirements provide benefits to consumers, producers, and processors by greatly limiting the possibility that unsafe product enters commerce. Thus, the consumer is protected from illness, and the producer and processor are protected from product liability.
FSIS also has jurisdiction for poultry slaughter under the Poultry Products Inspection Act, although that law carries an exemption to daily inspection for producers who slaughter fewer than 20,000
22A handler is any person or company that handles, processes, ships or distributes leafy green product for market whether as owner, agent, employee, broker, or otherwise; retailers are not considered handlers (LGMA 2011/12 Annual Report).
23For more information on commodity audit programs see: http://www.ams.usda.gov/AMSv1.0/CommodityAudit.24Data on intermediated sales were not collected in the 2007 Census of Agriculture, so we focus on DTC sales, for
which we can assess growth. In 2012, 119,620 livestock farms had intermediated or DTC sales whereas 109,955 had DTC sales.
25This value includes DTC sales from livestock farms selling through only DTC channels and those selling through both DTC and intermediated channels.

23 Trends in U.S. Local and Regional Food Systems: A Report to Congress, AP-068
Economic Research Service/USDA
birds per year.26 Generally, poultry processed under this exemption can be marketed only directly to consumers, hotels and restaurants, or regional distributors like food hubs (USDA FSIS, 2006). The exemption prohibits producers/processors from selling their product to other processors for further processing (e.g., chicken sausage production). The exemption also prohibits interstate sales, although FSIS does have a cooperative program with qualified state inspection systems to allow the retail of state-inspected product out of state under limited circumstances.
Another opportunity for small producers is mobile slaughter. A mobile slaughter unit may travel from producer to producer to slaughter and process individual animals under Federal or State inspection.
Processing Locally Marketed Meats
Access to meat processors with required inspection processes and the ability to customize orders is key to providing customers with locally produced meat products. While large processers typically produce standardized products, allowing for greater economies of scale, many small processors gain compara-tive advantage by providing customized products like special cuts, sausages, cured meats, and custom packaging/labeling. Difficulty aggregating animals of similar size and biosafety concerns limit the ability of large meat processors to serve small meat producers. Small producers and processors alike are faced with the need to manage costs without the benefit of economies of scale, requiring meat producers to identify small processors that can match their size and unique needs.
While demand for locally sourced animal products has increased (Woods, 2013), the number of small federally inspected cattle slaughter plants (those slaughtering under 10,000 head per year) has declined by 12 percent since 2001 to 554 in 2013, according to USDA NASS data. The majority of meat production in the United States takes place at large facilities built to process up to millions of animals annually. Ninety-four percent of cattle slaughtered in 2013 were processed in facilities that slaughtered at least 100,000 cattle during the year (USDA, NASS 2014). The scale of these operations is not suitable for customized orders, as evidenced by the overwhelming variation in processing, marketing, and distribution costs between locally marketed products and commodity products processed in large facilities (fig. 7).
Case studies have shown that producer/processor cooperation is crucial to satisfying the needs of local producers and processors. For example, Smucker’s Meats in Mount Joy, Pennsylvania, has operated since 1965, but has expanded significantly in recent years after focusing on federally inspected processing for local customers on a fee-for-service basis (Gwin et al., 2013). Of Smucker’s 150 regular customers, around 20-30 provide a steady amount of animals for processing on a weekly or monthly basis, thus guaranteeing a consistent revenue stream for the company. In return, Smucker’s has provided producers with marketing assistance, delivery discounts, and help in finding markets for unwanted trim.
26To put 20,000 birds in perspective, slaughtering 20,000 birds might gross a producer $118,044 in 2013. This figure is estimated with the following assumptions: In the United States, 8.6 billion chickens were slaughtered in 2013 (USDA, NASS, 2014). The 2013 average live weight for young chickens (broilers) totaled 5.92 pounds. In 2013, the wholesale market price for broiler meat averaged 99.7 cents/lb (USDA, ERS, 2014). Thus, using the average weights and price as proxies, slaughtering 20,000 birds could gross a producer $118,044 in 2013.

24 Trends in U.S. Local and Regional Food Systems: A Report to Congress, AP-068
Economic Research Service/USDA
The Food Safety Modernization Act
Despite the mix of public and private standards in place, food safety incidents continue to occur. According to recent data from the Centers for Disease Control and Prevention, about 48 million people (1 in 6 Americans) get sick, 128,000 are hospitalized, and 3,000 die each year from food-borne diseases (http://www.fda.gov/Food/GuidanceRegulation/FSMA/ucm239907.htm). The 2011 Food Safety Modernization Act (FSMA) calls for sweeping changes to the U.S. food safety system for produce. Regulatory focus shifts from contamination containment to prevention. Language was included in FSMA legislation directing the FDA to implement the law in a way that is flexible, participative, consistent with Codex standards, and sympathetic to small business issues and indus-try’s role in food safety with an overarching focus on public health. The rulemaking process for FSMA is ongoing and will ultimately include numerous new rules (i.e., regulations) and guidance documents. Five rules lay the cornerstone of the prevention-based, modern food safety system to be developed under FSMA.27
Compliance with food safety regulations may pose special challenges for food producers marketing their products locally. These producers tend to be smaller than farms and firms selling their prod-
27While FSMA will encompass multiple rules, FDA has identified Standards for Growing, Harvesting, Packing, and Holding of Produce for Human Consumption (The Produce Safety Rule), Current Good Manufacturing Practice and Hazard Analysis and Risk-Based Preventive Controls for Human Food (Preventative Controls Rule), Food Supplier Verification Programs (FSVP) for Importers of Food for Humans and Animals (Foreign Supplier Verification Program), Accreditation of Third-Party Auditors/Certification Bodies to Conduct Food Safety Audits and to Issue Certifications (Accredited Third-Party Certification), Current Good Manufacturing Practice and Hazard Analysis and Risk-Based Preventive Controls for Food for Animals (Animal Food) as the five cornerstone rules.
Note: Assumes 20 USDA select 660-lb carcasses, 62-percent carcass-to-meat yield and conventional margins. Commodity beef processing costs are generally fully offset by sales of byproducts.Source: Gwin et al., 2013.
Figure 7
Illustrative costs for marketing local and commodity beef
Dollars per 20 cattle
0
10,000
20,000
30,000
40,000
50,000
60,000
70,000
Local Commodity
Retailer margin
Marketing/distributionmargin
Processing
Livestock trucking
Cattle

25 Trends in U.S. Local and Regional Food Systems: A Report to Congress, AP-068
Economic Research Service/USDA
ucts on the national market. In addition, much of the food marketed locally is marketed directly to consumers and without any prevailing requirements for food safety practices or standards. The meat industry is almost entirely unaffected by FSMA, which increases the regulatory authority of FDA. USDA’s Food Safety and Inspection Service (FSIS) has the authority to regulate the safety of meat and poultry products (and, under the 2014 Farm Bill, fish of the order Siluriformes, commonly known as catfish), while FDA regulates the safety of non-livestock products and other seafood.28 For this reason, the remainder of this section focuses solely on the impact of FSMA on produce production, with an emphasis on fresh produce intended for local marketing.
Produce Safety and Preventive Controls Rules and Growers Marketing Locally
With the growing importance of produce in a healthy diet and recognition of several high-profile foodborne illness outbreaks associated with these foods, FSMA (Section 105) directs FDA to establish minimum science-based standards for the safe production and handling of fruits and vegetables. FDA’s analysis of available foodborne illness outbreak data document 131 outbreaks associated with contaminated produce between 1996 and 2010, causing more than 14,000 illnesses and 34 deaths (FSMA Proposed Rule for Produce Safety http://www.fda.gov/downloads/Food/GuidanceRegulation/FSMA/UCM359258.pdf). Two draft rules focusing on fresh produce build on prevailing voluntary industry guidelines for food safety. These draft rules focus on setting enforce-able standards that are reasonably necessary to prevent the introduction of known or reasonably foreseeable biological hazards and providing reasonable assurances that produce is not adulterated on account of these hazards. This will be the first time that FDA will have jurisdiction over onfarm activities, and FSMA will impose relative uniformity of standards across suppliers of fresh produce. Currently, food safety in produce is a mixture of decisions by individuals, grower organizations, buyers, and governments that can vary by farm size, commodity, region, and country.
Two proposed rules of particular interest to produce growers were initially released for public comment in January 2013. These are the Produce Safety Rule—Standards for Growing, Harvesting, Packing, and Holding of Produce for Human Consumption—and the Preventive Controls Rule—Current Good Manufacturing Practice and Hazard Analysis and Risk-Based Preventive Controls for Human Food. At the same time, a preliminary regulatory impact analysis was released, and FDA began soliciting stakeholder feedback through a series of public listening sessions, multiple site visits, and written comments.29
While no final rule is yet in place, the draft Produce Safety Rule would establish science-based minimum standards for the safe growing, harvesting, packing, and holding of produce in its raw or natural (unprocessed) state on farms. Other than sprouts, where risks were determined to be particu-
28FDA also has authority to regulate the safety of products with “relatively small proportions of livestock ingredients,” e.g., with 2 percent or less cooked meat or poultry ingredients, by weight (USDA, 2005: http://www.fsis.usda.gov/OP-PDE/larc/Policies/Labeling_Policy_Book_082005.pdf).
29Feedback was extensive from consumers and producers (small and large growers and handlers). Based on input received, FDA announced in December 2013 it would revise sections of the Produce Safety Rule. The revised rule was released while this report was in the process of being cleared for publication (September 29, 2014), and comments on the revised provisions are being accepted for 75 days after the publication date. Although not necessarily an exclusive list, sections of the January 2013 draft rules specifically identified for updates include water quality and testing, standards for using raw manure and compost, some provisions for mixed-use facilities, and procedures to withdraw qualified exemp-tion (Taylor, 2013 http://www.fda.gov/Food/GuidanceRegulation/FSMA/ucm379397.htm).

26 Trends in U.S. Local and Regional Food Systems: A Report to Congress, AP-068
Economic Research Service/USDA
larly high, the focus is on identified routes of microbial contamination (agricultural water; manure, and other biological soil amendments of animal origin; worker health and hygiene; equipment tools, buildings, and sanitation; and domesticated and wild animals) rather than commodity-specific stan-dards. The proposed Rule applies to raw agricultural commodities (RAC) and activities within the farm definition. (See box for FSMA product coverage.)30
Several limitations on coverage will be particularly relevant for small and local fresh produce suppliers. Farms will be partially exempt from the proposed rule if their food sales average less than $500,000 per year during the last 3 years and a majority of the value of food sales is sold directly to qualified end-users. Qualified end-users include the direct consumer of the food (i.e., consumers purchasing food at DTC outlets) or a restaurant or retail food establishment (e.g., a grocery store) located in the same State as the farm or not more than 275 miles away.31 These farms will need to label their products with the name and business address of the farm, visible at the point of sale, and the exemption can be withdrawn if the farm is directly linked to an outbreak or if FDA determines it is necessary to protect the public health.
Additional exemptions are included for small farms with less than $25,000 in annual value of food sold during the previous 3-year period and for produce that is used for personal or onfarm consump-tion. While these qualified exemptions from FSMA food safety standards will apply to small produce farms, individual buyers will determine whether to require FSMA—or other food safety standards—from their suppliers. In addition to the exemptions based on farm size, commodities that FDA determines constitute the lowest risk with respect to biological hazards are excluded from regulation under the FSMA rule on produce safety. These are products that are rarely consumed raw (like artichoke or eggplant) or that are destined for further processing that includes a kill step.
The extent to which fruit and vegetable farms may be exempt is unclear. In 2012, 60 percent of U.S. farms growing fruit and vegetables had annual farm sales less than or equal to $25,000 (U.S. Census of Agriculture, 2012).32 Although this number is not directly comparable to the FSMA exemption, which is for a 3-year average, this percentage suggests a large proportion of fruit and vegetable farms meet the first criterion for exemption under the proposed Produce Safety Rule. Farms with sales under $25,000 in 2012 accounted for only 1.3 percent of U.S. fruit/vegetable farm sales, so most of the value of fruit/vegetable farm sales would be non-exempt. With regard to the qualified exemption, 35.3 percent of all fruit and vegetable farms had both DTC or intermediated sales and sales under $500,000, the closest proxy for “qualified end users” available using census of agriculture data.33
The Produce Safety Rule is proposed to become effective 60 days after FDA issues a final rule in the Federal Register, but producers will not be expected to comply immediately. At the time this report was written, the proposed rule stipulated that most farms would have 2 years to comply while
30Under the January 2013 FSMA definition, a farm is characterized as a facility in one general location that grows and harvests crops or raises animals (plus seafood) or both. Included are facilities that pack or hold food provided that the food packed or held in storage is grown, raised, or consumed on the farm or another farm with the same owner. Facilities that manufacture or process food may also be considered a farm if all the food processed in that farm is consumed on the same farm or another farm with the same owner.
31Qualified end users do not include food hubs or regional food aggregators.32FDA’s published estimates on number of farms that will be exempt and partially exempt from the proposed produce
safety rule are different from these estimates; our estimates are based on 2012 Census of Agriculture data.33The Census of Agriculture does not report a value for intermediated sales, only a count of farms with intermediated
sales and the value of direct-to-consumer sales.

27 Trends in U.S. Local and Regional Food Systems: A Report to Congress, AP-068
Economic Research Service/USDA
smaller operations are granted a longer grace period. Farms with less than $250,000 in average annual value of food sales over the previous 3 years will have 4 years to comply. Farms with $250,000 to $500,000 in average annual food sales would have 3 years to comply. For some water requirements, 2 extra years to comply will apply to all farms regardless of size.
Some of the proposed standards conflict with current production practices but may be changed as FDA prepares revisions to the Produce Safety Rule. For example, the January 2013 draft proposes standards for the use of biological soil amendments (manure and compost) that are more restrictive than USDA’s requirement for organic production (NOP).34 Under the proposed rule, when untreated manure is applied in a manner that does not contact covered produce and minimizes the potential for contact with covered produce after application, a 9-month waiting period is required between application and harvest.35 The NOP, on the other hand, imposes a shorter interval between manure application and harvest (90- and 120-day intervals), depending on whether the edible portion of the crop comes in contact with the soil. Local food farms are more likely to use manure as a fertilizer and will thus be affected disproportionately, whether or not they are organic (see table 9 for share of DTC farms using manure as fertilizer versus non-DTC farms). Because of the longer wait time, local food farmers may choose to switch from manure to synthetic fertilizers (with associated costs). In the United States, 40 percent of organic farms market in DTC outlets.
34While FDA published voluntary guidelines in 1998 for manure and compost use for all agricultural producers, USDA established mandatory requirements for organic producers as part of the national organic regulation published in 2000.
35FDA’s supplemental proposal will likely revise this to focus on developing a risk assessment and needed research prior to establishing the waiting period between application and harvest in the final rule.
Product scope under FSMA’s proposed produce safety rule
The January 2013 draft produce rule applies to most fruit and vegetable commodities, including mushrooms, sprouts, peanuts, tree nuts, and herbs, in a raw or natural (unprocessed) state destined for human consumption. The draft rule does not apply to the following products:
• Produce that is rarely consumed raw;
• Produce that is not considered a raw agricultural commodity (RAC);
• Produce that is intended for commercial processing with a kill step such as canning, cooking, drying to create a distinct product like raisins, or pasteurizing (documentation is still required); and
• Produce used for personal or onfarm consumption.
FDA defines a RAC as “any food in its raw or natural state, including all fruits that are washed, colored, or otherwise treated in their unpeeled natural form prior to marketing.” For example, a head of field-packed lettuce for sale is considered a RAC, but a head of lettuce processed into a bagged salad is not a RAC (Calvin, 2013). Similarly, a bag of fresh apples is considered a RAC but fresh-sliced apples in individual-serving packages are not a RAC. Commodities not typically consumed raw are exempted and include arrowhead, arrowroot, artichokes, asparagus, beets, black-eyed peas, bok choy, brussel sprouts, chick peas, collard greens, cranapples, cranberries, eggplant, figs, ginger root, kale, kidney beans, lentils, lima beans, okra, parsnips, peanuts, pinto beans, plantains, potatoes, pumpkin, rhubarb, rutabaga, sugarbeet, sweet corn, sweet potatoes, taro, turnips, water chestnuts, winter squash (acorn and butternut squash), and yams.

28 Trends in U.S. Local and Regional Food Systems: A Report to Congress, AP-068
Economic Research Service/USDA
The January 2013 draft Preventive Controls Rule focuses on reducing food safety risks in facili-ties that manufacture, process, pack, or hold human food, including farms participating in these activities. The 2012 Census of Agriculture reports that 7.5 percent of U.S. fruit/vegetable farms had packing facilities; of these farms, 85 percent engaged in DTC or intermediated sales. The Preventive Controls Rule proposes that each food facility registered with FDA have in place a written food safety plan that includes hazard analysis, risk-based preventive controls (to include a blueprint for recall in case of a foodborne crisis), monitoring procedures, corrective actions, verification, and recordkeeping. Activities within the definition of farm would not be subject to this proposed rule. If a farm manufactures, processes, packs, or holds food that is not grown, raised, or consumed on that farm or is from someone else’s farm then, under the January 2013 draft, the Preventive Controls Rule applies. Additionally, if a farm manufactures or processes food (including food manufactured or processed from another farm they own) but the food is not consumed on any of the farms they own, then the Preventive Controls Rule applies.
FSMA and Small Produce Farms Marketing Locally
While benefits from FSMA are calculated in terms of reduced illness and improved public health outcomes, additional costs incurred by individual producers or businesses will vary depending on current practices, access to exemptions, and timing of implementation. Research on the potential economic impacts of FSMA for smaller producers—the vast majority of local food farms—and processors is limited. Some insights on the potential economic implications of FSMA on the local and regional food industry, however, can be gleaned from related studies examining the economic impact of food safety initiatives and programs on smaller fruit and vegetable producers. The Oregon Public Health Institute indicated that, among the small and midsized fresh fruit and vegetable farms surveyed in Oregon, limited net farm income constrained the financial capacity of some growers to make costly onfarm improvements to meet GAP and GHP requirements (Prenguber and Gilroy, 2013).
In implementing FSMA standards, larger producers may benefit from economies of scale (Becot et al., 2012; Bovay and Sumner, 2013; Parker et al., 2012; Paggi et al., 2010). A survey of California leafy greens growers found that small and midsized farms incurred higher average costs per acre than large farms for all LGMA-dictated modifications since many larger farmers already had the required practices in place (Hardesty and Kusunose, 2009). Implementation of food safety require-ments across farms, even with some fixed cost, can provide new marketing windows from smaller production areas if supply patterns shift, however. Woods et al. (2012) found that adoption of GAPs by fresh strawberry growers nationally could open in-season marketing windows for smaller produc-tion areas.36
Like all producers, small producers participating in local food systems may be unclear about how new food safety regulatory agendas will influence their cost structure, profitability, and market access (Martinez et al., 2010). A challenge is determining what they need to know and determining what they need to do, which must occur in conjunction with choosing their local food marketing channels.
Survey results of vegetable growers in Minnesota indicate that the greatest need in educational GAP training—particularly for small producers growing a diverse set of vegetable crops and marketing via DTC outlets—is in the areas of treating wash and processing water, taking measures to keep animals out of production fields, and sanitizing harvesting tools and containers on a scheduled basis
36Firms were not explicitly modeled, so production area can only serve as a proxy for firm-size in this example.

29 Trends in U.S. Local and Regional Food Systems: A Report to Congress, AP-068
Economic Research Service/USDA
(Hultberg et al., 2012). Many private consulting firms and programs offer assistance with regulatory awareness and compliance, but their services may be costly for small farms.
Several publicly available training and outreach efforts are available to assist all producers including those that are resource-limited. The Produce Safety Alliance (PSA) and the Food Safety Preventive Controls Alliance (FSPCA) were launched in 2011. The Sprout Safety Alliance (SSA) was launched in 2012. All three efforts are designed to serve as broad-based public-private forums consisting of key industry, academic, and government stakeholders whose mission is to support safe food produc-tion by developing a nationwide core curriculum, training, and outreach programs. PSA is a collab-orative project between Cornell University, USDA, and FDA that aims to provide industry training and education opportunities on current best practices and to guide future regulatory requirements, with special emphasis on small and very small farms and packinghouses (Produce Safety Alliance, 2014).37
37FDA also provides support for FSPCA and SSA.

30 Trends in U.S. Local and Regional Food Systems: A Report to Congress, AP-068
Economic Research Service/USDA
Who Buys Local and Regional Foods and Why?
Understanding who buys local foods and why are valuable for targeting marketing efforts by producers as well as grocery stores, restaurants, and other food sellers. This information can also be useful when shaping public policies and programs aimed to support the local and regional food systems. Studies of consumers’ willingness to pay (WTP) a premium for local food provide insights into whether any higher prices for local foods will provide a sufficient incentive to sell food locally, either through a DTC outlet or through an intermediary such as a grocery store. Martinez et al. (2010) reviewed literature on consumer WTP for local food as well as demographic characteristics of consumers that purchased local food. This section updates the literature review in Martinez et al.
What Motivates Consumers to Shop for Local Food?
In the nationally representative U.S. Grocery Shopper Trends Survey, conducted by a supermarket industry association, over 80 percent of surveyed grocery store shoppers reported purchasing local foods occasionally, while 9 percent reported purchasing local foods whenever possible (Food Marketing Institute, 2011). The survey also asked consumers’ top reasons for buying locally grown foods in grocery stores. Freshness was the most frequent reason (83 percent) cited, and taste was the number three reason (with 56 percent) for buying local food (Food Marketing Institute, 2011). An earlier national survey, collected in 2003, found an interest in healthy, safe, and fresh foods increased the likelihood of buying locally (Zepeda and Nie, 2012).
Local food shoppers in the 2011 Trends survey were also concerned about supporting the local economy, a reason cited by 68 percent of grocery store shoppers shoppers (the second most-cited reason for buying locally-grown foods in grocery stores). Regional studies find a similar pattern (Rainey et al., 2011; Bean and Sharp, 2011).
Several studies have found that the social desirability of buying local food plays a central role in influencing consumers to participate in the local food economy.38 A national survey found consumers who bought directly from farmers were strongly influenced by others around them, and felt confident that their actions “make a difference” for public and private outcomes (Onozaka et al., 2010). In Michigan, local food consumer activists reported a feeling of empowerment that comes from sourcing their own food locally (Bingen et al., 2010, Bingen et al., 2011). In another Michigan study, the perceived social desirability of buying local food may have led consumers to exaggerate the level of shopping at farmers markets (Conner et al., 2010).
Interestingly, the Trends survey did not identify food safety as a top motivation for purchasing local food, although knowing the foods’ source—cited by 40 percent—could reflect concern for food safety. Studies in the Southeast and Arkansas found food safety to be among the motivations of farmers’ market shoppers, with respect to both general food safety concern (Maples et al., 2013) and conscious attempts to avoid synthetic chemicals in food (Crandall et al., 2011). It is hard to gener-alize from smaller scale studies such as these, and results may apply only to the studies’ respective area or set of circumstances.
38This literature review updates Martinez et al. (2010), which found that both national and regional studies found local food shoppers had certain attitudes in common, such as interest in cooking/gardening and supporting local businesses and producers.

31 Trends in U.S. Local and Regional Food Systems: A Report to Congress, AP-068
Economic Research Service/USDA
The 2011 Trends survey found that 27 percent of respondents cited concern over the environmental impact of transporting food, but this was not one of the top motivations for buying local food in grocery stores. A 2003 national study found that concern for the environment increased the likeli-hood of buying locally (Zepeda and Nie, 2012).
How Much Do Demographic Characteristics Matter?
Studies found mixed results on the relationship between consumers’ demographic factors and their likelihood of acquiring local food.39 Some studies found that surveyed farmers’ market patrons were predominantly female (Mayes, 2013) and that buying local produce was more likely among white families (Racine et al., 2013). In a study of Michigan consumers, Colasanti and colleagues (2010) cited the consensus of previous literature that farmers’ markets tend to be patronized by narrow segments of society, especially White and middle to upper class. Still, among diverse study partici-pants, interest in fresh, local products was widespread.
A national study found that consumer interest in local food varies regionally. Survey respondents who live in the Northeast were most likely to shop farm-to-consumer venues at least weekly (Blanck et al., 2011). Rural-urban differences have also been observed, but are not consistent in direction. Two separate studies in North Carolina found that local buying behavior was more likely in rural areas (Racine et al., 2013; McGuirt et al., 2014), partly due to price savings. In Albuquerque, New Mexico, consumers living in the most urbanized area had a stronger preference for “non-conven-tional”—local or organic—produce (Holmes and Yan, 2012).
Not surprisingly, distance to the local food outlet may be equally or more important than the metro status or region of consumers’ location. In North Carolina and Texas, participants were increasingly willing to shop at the farmers’ market when the market was incrementally closer to their residence (McGuirt et al., 2014, Abelló et al., 2014). In Albuquerque, consumers who travel the smallest distance for food shopping were most likely to buy “non-conventional” produce even in conven-tional grocery stores (Holmes and Yan, 2012), although this result could reflect correlation between distance traveled and other factors.
Recent literature has also identified differences in direct-market consumers according to venue type, which is of particular interest because many data sources do not differentiate between DTC marketing venues. Such differences could be related to the different levels of financial commitment required for CSA membership versus shopping at farmers’ markets.
How Much Will Consumers Pay for Local Food?
Willingness to pay (WTP) studies use a variety of techniques to estimate the premium that consumers are willing to pay for a given attribute. Like the WTP studies reviewed by Martinez et al. (2010), more recent studies also show a large range in WTP among different locations and products (fig. 8). The studies also shed light on what is driving consumer WTP for local food, although comparisons are limited by differences in methodology and lack of generalizability of the
39This literature review updates Martinez et al. (2010), which found that studies of consumer characteristics varied in their conclusions, with two national studies finding education and income unimportant but some State and regional stud-ies finding that local food purchases were more likely among higher income and more educated consumers.

32 Trends in U.S. Local and Regional Food Systems: A Report to Congress, AP-068
Economic Research Service/USDA
studies. The following review focuses primarily on WTP studies published after the 2010 review by Martinez et al.40
The relationship between WTP and distance is not consistent across studies, similar to results from studies of consumers who already purchase local food. One study focusing on the role of distance found that average WTP increased for labels claiming production closer to home (Burnett et al., 2011). Another study found WTP for blackberry jam labeled as having been produced in a specific area of the State was higher than for jam bearing a State label, but a broader regional label was apparently valued just as highly as substate claims (Hu et al., 2012).
More recent studies have further explored the role of attributes associated with local food as well as interactions among multiple “non-conventional” attributes. Onozaka and Thilmany-McFadden (2012) explored the interactions and substitutions among multiple attributes in a national survey focusing on apples and tomatoes. The study quantified WTP for different combinations of claims, including product origin (locally grown; imported from Chile, Canada, or Mexico), certified organic, certified fair trade, and carbon footprint. WTP for local was higher than for the other attributes.
40Martinez et al. (2010) found that estimates of consumers’ WTP for local food ranged from a 9-percent premium for New England specialty products (syrup) and Colorado potatoes to a 50-percent premium for fresh Florida-grown produce. Consumers with higher WTP placed higher importance on quality, nutrition, the environment, and helping local farmers.
Source: Willingness to pay as a percent of base price calculated from reported results from the following: Apples/Vermont from Wang et al., 2010, averaged over respondents that had and had not purchased organic food. Apples/Colorado from Costanigro et al., 2011. Blueberries from Shi et al., 2013. Tomatoes/national and Apples/national from Onozaka and Thilmany, 2012. Blackberry jam from Hu et al., 2012. Fresh produce/Vanderburgh County from Burnett et al., 2011.
Figure 8
Willingness to pay for local food (percent premium)
0 10 20 30 40 50 60 70 80 90
Blackberry jam, "Ohio Proud" or "Kentucky Proud" label
Apples, national study
Fresh produce, Vanderburgh County, Indiana
Blackberry jam, "Ohio River Valley" label
Tomatoes, national study
Blueberries, Pittsburgh and Orlando
Apples, Colorado
Apples, Vermont
Percent

33 Trends in U.S. Local and Regional Food Systems: A Report to Congress, AP-068
Economic Research Service/USDA
Costanigro and colleagues (2014) found that increased information can have different effects on WTP for different consumers. James et al. (2009) also studied the effect of information through background knowledge of agriculture, nutrition, and the environment and found that increased knowledge decreased WTP for local applesauce (James et al., 2009). The authors suggest that consumers with more knowledge about agriculture expect additional benefits for a higher price and feel they are able to judge these benefits.
Institutional Local Food Consumers
Restaurants also provide a channel for local food to reach consumers. In some cases, producers have organized cooperative efforts to market to restaurants, such as Colorado Crop to Cuisine (Thilmany, 2004). The type of restaurant was an important factor in the prevalence of local sourcing, with anec-dotal evidence that smaller gourmet restaurants were more likely to purchase local food (Curtis and Cowee, 2009).
Recent surveys in Alabama, Nevada, and upstate New York have explored the prevalence of local sourcing in restaurants and barriers to sourcing locally. While survey response rates are low, ranging from 10 to 26 percent, the results provide some insights into perceived obstacles to local sourcing for restaurants. The studies found similar barriers, including inadequate availability, inconvenience, and lack of knowledge about where to purchase local food or what is available locally.
Availability of local ingredients through regular food distributors may be important. In Alabama, where 51 percent of respondents reported sourcing local ingredients, 70 percent of those that purchased locally obtained local food through their distributors, while about half bought from farmers’ markets and 40 percent bought directly from farmers (Reynolds-Allie and Fields, 2012). Since the time required to buy local food was cited as an obstacle, increasing availability of local food through distributors could mitigate this barrier.
Other institutions such as hospitals, colleges, and universities have expressed interest in using locally produced food in foodservice. Huang et al. (2011) found that about 6 percent of hospitals surveyed nationally had started a local food buying program, among other practices to enhance sustainability. Some institutions have begun sourcing locally in response to encouragement from the American Dietetic Association’s statement on sustainability. The nonprofit group Health Care Without Harm encourages hospitals to source food locally both for environmental reasons and to provide fresh and healthful food for patients and staff.
Farm to School
USDA encourages school districts to source locally produced food primarily through its Farm to School Program, established by the Healthy Hunger-Free Kids Act of 2010. To better understand participation, the USDA Farm to School Census was conducted by USDA’s Farm to School Program in collaboration with ERS (USDA Food and Nutrition Service, 2014). All public school district School Food Authorities were invited to participate (for a total of 13,133), and 75 percent (9,887) completed a questionnaire that explored their involvement in farm to school activities.

34 Trends in U.S. Local and Regional Food Systems: A Report to Congress, AP-068
Economic Research Service/USDA
More than 4 in 10 public school districts reported participating in farm to school activities during the 2011-2012 school year or starting during the 2012-13 school year.41 Participation rates among districts varied widely with participation rates of greater than 75 percent in the Northeastern States (Maine, Massachusetts, New Hampshire, Rhode Island, and Vermont) as well as Delaware, Hawaii, Maryland, and North Carolina. Of school districts with farm to school activities, 83 percent served at least some local food in school meals in school year 2011-2012. Other farm to school activities included the promotion of local foods through themed or branded promotions such as Harvest of the Month (42 percent), taste tests of local foods (38 percent), edible school gardens (31 percent), and field trips to farms (30 percent). The top food categories sourced locally were fruits and vegetables, cited by over three quarters of farm to school districts. Milk (37 percent), baked goods (22 percent), and other types of dairy products (18 percent) were also among the top food categories sourced locally.
Nearly two-thirds of school districts that participate in farm to school activities purchase local foods through a distributor (fig. 9), indicating that distributors are increasingly able to make local foods available to districts interested in providing them in school meals. More than 4 in 10 districts that had farm to school activities (44 percent) obtained food directly from producers.
41Statistics are unweighted. Almost all public school district School Food Authorities contain a single public school district, so for simplicity we refer to all Farm to School Census respondents as school districts.
Source: Farm to School Census (USDA Food and Nutrition Service, 2014). N=9,887. Statistics are unweighted, from a universe survey of public school district School Food Authorities with a response rate of 75 percent. Percentages sum to over 100 percent because respondents could identify multiple sources. DOD = Department of Defense.
Figure 9
Local food procurement sources for school districts participating in farm to school activities
Percent
0 10 20 30 40 50 60 70
Obtained directly from CSA
Obtained through State Farm to School Program
Obtained directly from farmers' market
Obtained through food service management company
Obtained through buying cooperative
Obtained directly from producer cooperative
Obtained through the DOD Fresh program
Obtained through USDA Foods
Obtained directly from food processors and manufacturers
Obtained directly from producer
Obtained through distributor
Percent of farm to school districts obtaining local food from a given source

35 Trends in U.S. Local and Regional Food Systems: A Report to Congress, AP-068
Economic Research Service/USDA
Other methods used by school districts to source local foods included direct from food processors and manufacturers (40 percent), which could include milk from dairy processors as well as locally baked goods such as bread; USDA Foods (36 percent); and the Department of Defense (DOD) Fresh program (27 percent). USDA Foods refers to the commodities donated by USDA to school districts for use in school meals. Some States, such as Texas, arrange to have State-produced fruits and vegetables included in USDA Foods, and school districts can receive this produce as part of their allotments of USDA Foods. The DOD Fresh Program allows districts to use the dollar value of their allotments for USDA Foods to procure fresh fruits and vegetables from the DOD procurement system, and districts can request that these items be sourced locally or regionally.
Expenditures on local food were calculated for districts that were able to report total food expendi-tures for food service and the share of expenditures that were sourced locally. Local food expendi-tures, while incomplete due to reporting gaps, totaled over $385 million in the 2011-12 school year, and for the districts that were able to provide data, represented on average 13 percent of reported school district expenditures on food.42 The value of local food donated by USDA through the DOD Fresh program was an additional $8 million.43
Respondents—from districts that had farm to school activities and those that did not—were also asked to indicate problems encountered in procuring locally produced food (fig. 10). The top problem cited by both groups was the lack of year-round availability of key items, cited by 68 percent of districts with farm to school activities and 55 percent of those with none. Other top difficulties for school districts with farm to school activities were high prices (46 percent) and unavailability of local foods from primary vendors (37 percent). High prices, while among the top difficulties cited, were cited by less than half of farm to school districts as problematic, consistent with results showing that prices for local foods are not necessarily higher than for convention-ally marketed foods. For school districts without farm to school activities, other top difficulties in procurement were lack of availability from primary vendors (41 percent) and difficulty finding suppliers for local food (27 percent).
42The $385 million is not directly comparable to the total direct and intermediated sales reported in the first section of this report because it includes processed foods, e.g., direct from manufacturer.
43Data on local sourcing through DOD Fresh provided by the DOD Fresh Program.

36 Trends in U.S. Local and Regional Food Systems: A Report to Congress, AP-068
Economic Research Service/USDA
Source: Farm to School Census (USDA Food and Nutrition Service, 2014). N = 9,887. Statistics are unweighted, from a universe survey of public school district School Food Authorities with a response rate of 75 percent. Percentages sum to over 100 percent because respondents could identify multiple problems.
Figure 10
Problems with local procurement by farm to school participation status, school year 2011-12
Percent0 20 40 60 80
Resolving problem deliveries
Having quantity delivered equal to quantity ordered
Hard to place orders with vendors
Lack of compliance with your institution's purchasing regulations & policies
Inability to pay farmers according to farmers’ needsdue to school district payment procedures
Getting on-time deliveries
Unstable product prices
Getting product delivered that meets your quality requirementsand other specs, such as size
Lack of availability of processed/precut products
Lack of reliability in delivering ordered items
Hard to get information about product availability
Vendors for local items don't offer a broad range of products
Higher prices
Hard to find new suppliers/growers or distributors
Local items not available from primary vendors
Hard to find year-round availability of key items
Percent citing given problem,non-farm to school districts
Percent citing given problem,farm to school districts

37 Trends in U.S. Local and Regional Food Systems: A Report to Congress, AP-068
Economic Research Service/USDA
Prices at Direct-to-Consumer Marketing Outlets Versus Competing Retailers
Perceptions about prices at DTC outlets versus retail stores vary widely. Higher prices at DTC outlets may discourage patronage of these venues (Claro, 2011; Chambers et al., 2007). Local food advocates suggest that farmers who market through DTC venues can receive higher returns than through conventional marketing channels (Anderson, 2007). After subtracting marketing costs, producers may receive higher per-unit revenue and retain a greater share of the retail price. This may be especially important to small producers, many of whom rely exclusively on DTC outlets (Low and Vogel, 2011). This section briefly examines the literature comparing prices at DTC outlets and more conventional outlets. Our own national analysis of Nielsen Homescan data finds that selected produce prices at DTC outlets are lower, on average, than prices at retail stores in all seasons.
Peer-reviewed case studies have found that consumers perceive items at farmers’ markets to be lower or more reasonably priced, and of higher quality, than items at supermarkets (Brown, 2003; Wolf et al., 2005). Others have found that participants in Federal nutrition programs that promote DTC purchases (e.g., Senior Farmers’ Market Nutrition Program) perceive quality of produce to be as good (or better) and/or prices to be lower at the farmers’ market compared to their grocery store (McCormack et al., 2010). But media coverage reflects inconsistency in how farmers’ market prices compare to supermarkets (Ruth-McSwain, 2012). Only a handful of studies have compared contem-poraneous prices for comparable products at DTC venues versus nearby retail food stores.
Analyses of prices at DTC outlets are limited and have focused on specific geographic areas. Six case studies were conducted in California, North Carolina, Iowa, and Vermont during select months of a particular year rather than over a number of years. These studies typically compare farmers’ market prices to prices collected at grocery stores located nearby. Sommer et al. (1980) found prices for fruits and vegetables, in the summer/fall of 1979, to be 39 percent and 37 percent lower, respec-tively, at farmers’ markets.
Since 2009, as interest in locally produced foods has grown, a few additional studies have emerged. When market basket comparisons are made, farmers’ market prices are often found to be lower. For example, McGuirt et al. (2011) compare summertime prices of 230 produce items in 12 North Carolina counties and find an average price savings of 18 percent at the farmers’ markets. However, it is difficult to generalize results for individual items. Claro (2011), for instance, compares the price of 14 produce items during July and August in Vermont. The average price for six items at the farmers’ markets was found to be statistically significantly higher than the average price at corre-sponding grocery stores, while the average price at farmers’ markets was statistically significantly lower for only two items.44
Comparison of DTC and Retail Prices Using Nielsen Homescan Data, 2006
To our knowledge, there are no studies using national data to analyze prices at DTC outlets across produce type, season, and geographic areas. The 2006 Nielsen Homescan panel data provide an
44Given the dearth of studies that compare prices for different items at different locations and times of the year, it is difficult to generalize how relative prices might be changing over time.

38 Trends in U.S. Local and Regional Food Systems: A Report to Congress, AP-068
Economic Research Service/USDA
opportunity to compare U.S. average produce prices at DTC outlets, grocery stores, and super-centers. The Nielsen Homescan panel is a nationwide survey of households and their retail food purchases (see box, “Nielsen Homescan Panel Data”). The data include quantities, expenditures, product attributes, marketing channel or retailer type (grocery stores, supercenters, warehouse clubs, drug stores, mass merchandisers, convenience stores, health food stores, and “all other” retailers), store name, and household demographic data.
Prices (net of promotional and sales discounts) of two fruit items (apples, grapes) and three vege-table items (tomatoes, potatoes, peppers) are computed by dividing total expenditure by quantity purchased (e.g., Huang and Lin, 2007; Lin et al., 2008). These produce items are chosen because they are the five most popular random-weight produce items purchased by Nielsen Homescan panel-ists in terms of both purchase frequency and expenditures.
Statistical tests (T-tests) are used to compare differences in the mean price between DTC outlets and other retail food stores, including grocery stores and supercenters.45 Average produce prices are compared for different seasons of the year and across seven regions of the country.
45Volpe and Lavoie (2008) estimated average prices to be 14 to 23 percent lower at supercenters compared to super-markets for national brand products across 6 major departments.
Nielsen Homescan Panel Data
The Nielsen Homescan panel consists of representative U.S. households that provide weekly reports of food purchased for at-home consumption from various retail outlets in at least 10 months of the year. A panel household scans either the UPC or a designated code for non-UPC, random-weight products (e.g., fresh fruits and vegetables, bakery products produced and pack-aged in the store, meat products cut and packaged in the store) of all purchases. About 32,000 households record their UPC-labeled items, and 8,000 households (Fresh Foods panel) also record random-weight products.
In 2007, Nielsen replaced the Fresh Foods Panel with the Total Sample View, which no longer contains details on the random-weight items. Specifically, after 2006, item characteristics and the quantity purchased are no longer recorded.
Because purchases from DTC outlets would not have UPCs, they would likely be recorded only via the random-weight collection methodology. For this reason, our analysis includes only prod-ucts purchased as random-weight items in 2006. According to Nielsen, panelists would likely use the store name “fruit stand,” which is included in the “all other” retailer type, to record purchases from DTC outlets including farmers’ markets, roadside fruit stands, onfarm sales, and other DTC outlets (Nielsen, 2009).
While we are able to identify sales from DTC outlets, we are unable to verify that the items sold at DTC outlets are actually local. For example, some fruit stands may carry both locally grown produce and imported produce, which is sold in order to provide their customers a one-stop shopping experience. Sales of non-local items at DTC outlets may be more prevalent in the winter months, especially for produce with a short storage period. In case studies, analysts are better able to distinguish between locally sourced versus non-local produce at direct marketing outlets. For example, Sommer et al. (1980) restricted their price comparisons to certi-fied farmers’ markets only to provide some assurance that vendors were marketing their own produce. Also, unlike case studies, we compare prices at DTC outlets to those at retail food stores over a much broader geographic area rather than stores located near the DTC outlet.

39 Trends in U.S. Local and Regional Food Systems: A Report to Congress, AP-068
Economic Research Service/USDA
Seasonal Differences in Relative Prices
The price for each produce item varies by retail outlet and also exhibits seasonal variation (table 7). Produce prices at DTC outlets are lower, on average, than prices at grocery stores in all seasons. The U.S. average price discount at DTC outlets as a share of the grocery store price is estimated to range from 8.4 percent for grapes in the winter to 38.4 percent for winter tomatoes. DTC price discounts compared to supercenter prices are smaller than those compared to grocery stores. Only tomatoes and apples exhibit statistically significant discounts in all seasons.
For tomatoes, percentage discounts in DTC prices compared to grocery store prices are estimated to be smallest in the summer (24.6 percent) when grocery store prices are lowest. The largest price discounts for apples occur in the summer (27.5 percent) when grocery store prices are highest. On the other hand, grapes at DTC outlets are estimated to be relatively cheapest in the spring (24.9 percent) when prices at DTC and retail stores are at their lowest. The largest discount relative to supercenters is for winter tomatoes (28.8 percent). DTC apple prices are 13- 14 percent lower than supercenter prices in each season. For peppers, there is no statistically significant difference between prices at DTC outlets and supercenters.
Regional Differences in Relative Prices
Average prices at direct sales outlets also exhibit regional price variation, which may account for differences in relative price comparisons (fig. 11). In most regions, produce at direct sales outlets generally sell at a discount compared to supercenters and grocery stores, and the discounts tend to be larger for direct sales compared to grocery stores (table 8). Price discounts range from 1.1 percent compared to supercenter grapes in the southeast to 48.4 percent relative to grocery store tomatoes in the Rocky Mountain region. Prices at direct marketing outlets tend to be lower in the Rocky Mountain region compared to other regions. Households are estimated to pay the highest price for tomatoes, potatoes, and grapes at direct marketing outlets located in the Far West region compared to the other regions.

40 Trends in U.S. Local and Regional Food Systems: A Report to Congress, AP-068
Economic Research Service/USDA
Table 7
Average prices for produce by season and type of retail outlet, 2006 (dollars per pound)1
Outlet type Tomatoes Potatoes Peppers Apples Grapes
Spring
Grocery store $1.60 $0.81 $1.49 $1.19 $1.48
Supercenter $1.34 $0.70 $1.06 $1.07 $1.28
DTC outlets $1.08 $0.69 $1.03 $0.92 $1.11
Percentage difference in direct sales price compared to:
Supercenter -19.1 -0.83 -3.03 -14.3 -13.6
Grocery store -32.4 -14.5 -31 -22.6 -24.9
Summer
Grocery store $1.47 $0.85 $1.48 $1.39 $1.63
Supercenter $1.34 $0.76 $1.05 $1.18 $1.53
DTC outlets $1.11 $0.67 $1.10 $1.01 $1.48
Percentage difference in direct sales price compared to:
Supercenter -17 -12.9 4.93 -14.1 -3.33
Grocery store -24.6 -21.8 -25.5 -27.5 -9.3
Fall
Grocery store $2.01 $0.79 $1.54 $1.26 $1.58
Supercenter $1.73 $0.70 $1.07 $1.17 $1.40
DTC outlets $1.33 $0.66 $1.12 $1.02 $1.42
Percentage difference in direct sales price compared to:
Supercenter -23.2 -6.32 4.33 -13.1 1.93
Grocery store -34 -16.9 -27.1 -19.1 -9.9
Winter
Grocery store $1.97 $0.80 $1.63 $1.22 $1.68
Supercenter $1.70 $0.68 $1.11 $1.08 $1.57
DTC outlets $1.21 $0.65 $1.11 $0.92 $1.54
Percentage difference in direct sales price compared to:
Supercenter -28.8 -4.73 0.13 -14.4 -2.13
Grocery store -38.4 -18.5 -31.9 -24.3 -8.4
1Winter months are December, January, and February; Spring months are March, April, and May; Summer months are June, July, and August; Fall months are September, October, and November (Glossary of Meteorology, 2nd edition, American Meteorological Society, 2012). All price differences between direct sales outlets and supercenters or grocery stores are statistically significantly different at the 1-percent significance level, unless otherwise noted. 2Statistically significant at the 10-percent significance level.3Difference is not statistically significant. DTC = direct to consumer.
Source: Calculated by USDA, Economic Research Service based on Nielsen Homescan data.

41 Trends in U.S. Local and Regional Food Systems: A Report to Congress, AP-068
Economic Research Service/USDA
Source: Calculated by USDA, Economic Research Service based on Nielsen Homescan data.
Figure 11
Average price at direct sales outlets by region, 2006
$ per pound
0
0.20
0.40
0.60
0.80
1.00
1.20
1.40
1.60
1.80
Tomato
Potato
Pepper
Apple
Grape
Far West RockyMountain
Southwest NorthCentral
Southeast Mid-Atlantic
Northeast

42 Trends in U.S. Local and Regional Food Systems: A Report to Congress, AP-068
Economic Research Service/USDA
Table 8
Average prices for produce by region and type of retail outlet, 2006 (dollars per pound)1
Outlet type Tomatoes Potatoes Peppers Apples Grapes
Far West
Grocery store $1.70 $0.84 $1.48 $1.21 $1.60
Supercenter $1.35 $0.62 $0.98 $1.05 $1.32
DTC outlets $1.30 $0.86 $1.15 $0.97 $1.60
Percentage difference in direct sales price compared to:
Supercenter -3.64 37.9 17.1 -7.93 21
Grocery store -23.4 2.64 -22.8 -19.8 -0.44
Rocky Mountain
Grocery store $1.52 $0.83 $1.17 $1.10 $1.40
Supercenter $1.39 $0.70 $1.10 $1.04 $1.36
DTC outlets $0.79 $0.54 $0.96 $0.89 $0.76
Percentage difference in direct sales price compared to:
Supercenter -43.5 -22.82 -12.52 -14.64 -44.3
Grocery store -48.4 -35 -17.7 -19.64 -45.8
Southwest
Grocery store $1.47 $0.83 $1.13 $1.23 $1.42
Supercenter $1.36 $0.72 $1.06 $1.07 $1.39
DTC outlets $1.01 $0.59 $1.09 $0.96 $0.88
Percentage difference in direct sales price compared to:
Supercenter -25.4 -18.2 2.94 -10.4 -36.7
Grocery store -31.4 -29.1 -3.54 -22.4 -38.1
North Central
Grocery store $1.61 $0.71 $1.44 $1.18 $1.42
Supercenter $1.66 $0.68 $1.11 $1.14 $1.41
DTC outlets $1.07 $0.57 $0.98 $0.93 $1.19
Percentage difference in direct sales price compared to:
Supercenter -35.3 -17.1 -11.72 -19.1 -15.5
Grocery store -33.6 -20.3 -31.6 -21.2 -16.4
Southeast
Grocery store $1.75 $0.79 $1.59 $1.41 $1.74
Supercenter $1.60 $0.73 $1.05 $1.18 $1.51
DTC outlets $1.11 $0.64 $1.19 $0.95 $1.50
Percentage difference in direct sales price compared to:
Supercenter -30.6 -12.5 13.02 -19.6 -1.1
Grocery store -36.5 -19.5 -25.1 -32.7 -14.2
continued—

43 Trends in U.S. Local and Regional Food Systems: A Report to Congress, AP-068
Economic Research Service/USDA
Table 8
Average prices for produce by region and type of retail outlet, 2006 (dollars per pound)1
Outlet type Tomatoes Potatoes Peppers Apples Grapes
Mid-Atlantic
Grocery store $1.96 $0.83 $1.80 $1.31 $1.67
Supercenter $1.56 $0.68 $1.06 $1.14 $1.37
DTC outlets $1.21 $0.61 $1.03 $1.01 $1.40
Percentage difference in direct sales price compared to:
Supercenter -22.5 -11 -3.14 -10.9 1.84
Grocery store -38.6 -26.9 -42.7 -22.6 -16.7
Northeast
Grocery store $1.86 $0.83 $1.73 $1.27 $1.65
Supercenter $1.79 $0.66 $1.30 $1.14 $1.42
DTC outlets $1.18 $0.70 $1.20 $0.90 $1.26
Percentage difference in direct sales price compared to:
Supercenter -34.3 6.14 -7.54 -20.9 -11.93
Grocery store -36.5 -16.1 -30.9 -28.6 -23.81Far West = Alaska, California, Hawaii, Nevada, Oregon, Washington; Rocky Mountain = Arizona, Colorado, Idaho, New Mexico, Montana, Utah, Wyoming; Southwest = Arkansas, Louisiana, Oklahoma, Texas; North Central = Illinois, Indiana, Iowa, Kansas, Michigan, Minnesota, Missouri, Nebraska, North Dakota, Ohio, South Dakota, Wisconsin; Southeast = Alabama, Florida, Georgia, Kentucky, Mississippi, North Carolina, South Carolina, Tennessee; Mid-Atlantic = Delaware, Washington DC, Maryland, New Jersey, Pennsylvania, Virginia, West Virginia; Northeast = Connecticut, Maine, Massachusetts, New Hampshire, New York, Rhode Island, Vermont.All price differences between direct sales outlets and supercenters or grocery stores are statistically significant at the 1-percent significance level, unless otherwise noted.2Statistically significant at the 5-percent significance level.3Statistically significant at the 10-percent significance level.4Difference is not statistically significant. DTC = direct to consumer.
Source: Calculated by USDA, Economic Research Service based on Nielsen Homescan data.
—continued

44 Trends in U.S. Local and Regional Food Systems: A Report to Congress, AP-068
Economic Research Service/USDA
Environmental Issues Related to Local and Regional Foods
In popular culture, there are many terms used to express the purported environmental benefits of the local food movement—natural, environmentally friendly, pesticide-free, sustainable, and more. Academic and marketing literature often cites environmental benefits of purchasing local foods that include reduced transportation, less processing and packaging, and farmland preserva-tion (Grubinger, 2010; Klavinski, 2013; University of Florida IFAS Extension, 2014). This chapter explores the environmental practices of local and regional food producers in the United States, and finds a much more nuanced story.
Using data from the 2007 and 2012 Censuses of Agriculture and focusing on producers conducting DTC sales46, we find that conventional producers spend more, on average, for chemical inputs and fertilizers, while DTC farms are more likely to use manure. Between 2007 and 2012, the share of U.S. farms using chemical fertilizers fell, with the biggest changes occurring on fruit/nut and berry farms. The biggest declines occurred on non-DTC farms. In the same time span, the share of farms using chemicals to control weeds increased across the board, with smaller increases occurring on DTC farms in most cases.
Contrary to some perceptions, the literature also suggests that the provision of local foods may actu-ally result in a larger transportation “footprint,” in terms of greenhouse gas emissions and energy consumption, than foods marketed through commercial outlets due to transportation inefficiencies. The link between local foods and food waste is even more unclear; an inverse relationship may exist between the amount of food waste and packaging waste.
Onfarm Environmental Effects for Farms With Direct-to-Consumer Sales
Farm production practices can affect soil, water, and air quality, as well as biodiversity. Crop and livestock production can also contribute to climate change through emissions of greenhouse gases (GHG). Conversely, farmers can help mitigate climate change by reducing their GHG emissions and by sequestering carbon in soils and biomass. Weber and Matthews (2008) found that GHG emis-sions from the production phase account for over 80 percent of the average U.S. household’s carbon footprint from food consumption. Onfarm production inputs contributing to GHG emissions include machinery, fertilizers, fuel, and electricity. The use of these inputs, as well as pesticides and other chemicals, may affect soil, water, and air quality, as well as wildlife health and habitat. The U.S. Geological Survey (2007) finds that U.S. agricultural production is associated with the reduction and alteration of wildlife habitats as a result of changes in land use as well as elevated levels of nutrients (Dubrovsky et al., 2010). If nutrients are not properly managed, livestock production can contribute to excess bacteria and pathogens in streams and ground water. Intensive agriculture can hasten soil erosion and the removal of rich organic matter, plant nutrients, and soil particles from surface soils.
46The 2012 Census of Agriculture contains certain information about production, marketing, and conservation prac-tices of farmers participating in DTC sales, as well as the number of farms participating in intermediated sales. Because the 2007 Census did not include intermediated sales, we limit our comparisons to those farms with DTC sales. Due to a small sample of DTC farm operator responses in the Agricultural Resource Management Survey (ARMS), we opt for 2012 Census responses.

45 Trends in U.S. Local and Regional Food Systems: A Report to Congress, AP-068
Economic Research Service/USDA
To explore consumer notions that local foods are grown in a more environmentally “friendly” way, we examine the differences in onfarm input use and conservation practices between DTC and conventional producers. The 2012 Census of Agriculture allows us to compare input use—such as fertilizers, chemicals, irrigation, machinery, equipment, utilities, and fuel—between DTC and non-DTC producers during the 2012 calendar year.
For operations engaged in greenhouse, fruit/nut, and berry production, higher shares of DTC than non-DTC producers apply chemical fertilizers (table 9). At the same time, a higher share of DTC producers apply animal manure across all crop types. DTC producers were less likely to apply pesti-cides and herbicides to control weeds and insects than were conventional producers, with the excep-tion of chemicals to control insects and weeds in fruit/nut and berry crops.
Comparison of Onfarm Conservation Practices
The land-use impacts of growth in local food systems are largely unknown. That is, if more land goes into production due to increased demand for local food, will things like natural habitats suffer? Despite total agricultural land remaining essentially steady between 1964 and 2007, productive crop-land often transitions among idle cropland, pastureland, and forestland (Nickerson et al., 2011).
Table 9
Use of manure and chemicals in crop production, by crop production and marketing types, 2012
Field crops Greenhouse Veg & melons Fruit & nuts Berries
DTCNon- DTC
DTCNon- DTC
DTCNon- DTC
DTCNon- DTC
DTCNon- DTC
Number of farms 14,320 488,368 1,303 1,606 25,409 26,486 16,848 79,906 16,835 13,701
Dollars
Average value of chemicals purchased 9,711 23,247 2,887 12,176 4,828 59,511 6,081 24,261 5,256 23,629
Average value of fertilizer purchased 22,564 45,019 12,943 67,163 7,899 82,223 4,706 17,096 5,870 19,591
Percent
Farms using:
Chemical fertilizers 87 88 41 37 74 73 57 53 71 61
Animal manure 63 24 20 11 31 18 17 8 30 14
Chemicals to control insects 33 40 29 31 63 67 50 42 60 52
Chemicals to control weeds 83 88 24 29 63 69 51 51 61 57
Change from 2007
Farms using:
Chemical fertilizers -2 -3 -7 -8 -4 -7 -16 -28 -6 -19
Animal manure -1 -5 0 2 0 0 0 0 0 0
Chemicals to control insects
1 1 3 -1 15 13 -5 -16 9 4
Chemicals to control weeds
8 13 2 6 19 24 3 0 12 15
DTC = Source: USDA NASS, 2012 Census of Agriculture.

46 Trends in U.S. Local and Regional Food Systems: A Report to Congress, AP-068
Economic Research Service/USDA
In 2012, USDA offered several land conservation programs—such as the Conservation Reserve Program (CRP) and Wetlands Reserve Program (WRP)47—that allow eligible agricultural land owners can participate in environmental conservation and provide ecosystem services. CRP, for example, provides an annual rental payment to farmers for removing environmentally sensitive land from agricultural production and planting vegetation that will improve environmental quality. These conservation programs have increased wildlife populations and reduced soil erosion (Allen and Vandever, 2003; Feather et al., 1999; USDA Farm Services Agency, 2013).
A smaller share of DTC than non-DTC producers were enrolled in government-sponsored land retirement programs in 2012 (table 10). This may be because DTC producers tend to operate on fewer acres and may not have marginal acres to spare for conservation programs.
Producers can also enhance environmental quality by adopting conservation practices such as low-till or no-till practices, filter strips, and the production of renewable energy. A higher share of conventional producers than DTC producers used no-till or conservation tillage in 2012. However, higher shares of DTC producers generated onfarm energy and harvested biomass for bioenergy (table 10).
USDA does provide financial and technical assistance to eligible farmers for adopting conservation practices on working farmland through the Environmental Quality Incentives Program (EQIP). In addition, beginning and limited-resource farmers are eligible for an increased payment rate.
One relatively new aspect of EQIP that may be of particular interest to local foods farmers is its Seasonal High Tunnel Initiative (see box, “Greenhouses and High Tunnels”). While census data do not distinguish between greenhouses and high tunnels—and so no clear link can be made to the High Tunnel Initiative—one particularly striking result is the dramatic increase in the number of DTC farmers using high tunnels or greenhouses to produce tomatoes, vegetables, and herbs between 2007 and 2012. Moreover, both the absolute number and proportionate changes are largest for DTC farmers with less than $75,000 in sales.
47The 2014 Farm Bill incorporated WRP into the Agricultural Conservation Easement Program (ACEP).
Table 10
Participation in conservation practices by marketing type, 2012
DTC Non-DTC
Number of farms 144,530 1,964,773
Percent
Participants in CRP, WRP, FWP, or CREP 3.9 14.6
Farms with conservation easements 4.0 3.4
Farms using no-till 9.4 12.9
Farms using conservation tillage 6.6 9.2
Farms producing alternative energy 6.9 2.4
Farms harvesting biomass for bioenergy 1.0 0.5
Alternative energy is defined as the generation of energy or electricity on the farm using wind or solar technology, methane digesters, etc. CRP = Conservation Reserve Program; WRP = Wetlands Reserve Program; FWP = Farmable Wetlands Program; CREP = Conservation Reserve Enhancement Program.
Source: USDA NASS, 2012 Census of Agriculture.

47 Trends in U.S. Local and Regional Food Systems: A Report to Congress, AP-068
Economic Research Service/USDA
Greenhouses and High Tunnels
Greenhouses and high tunnels are an important production strategy for some U.S. producers, particularly those who market produce directly to consumers. Greenhouses (or glasshouses) are structures used for growing plants and flowers that allow for greater control of the growing environment. Greenhouses can be made of either plastic or glass, with paved floors and raised beds, and often involve equipment for heating, cooling, and lighting. High tunnels (or hoop houses)—typically a single layer of plastic or woven fabric that can be used raised or lowered as needed—are simpler, less expensive versions of plastic greenhouses. High tunnels most often protect crops grown directly in the soil and do not usually require electricity or fuel to achieve heating and cooling, but take advantage of adjustable sides to change the temperature inside the tunnel (Gu, 2009). On occasion, small space heaters are used in extremely low temperatures to protect crops in high tunnels.
In 2010, USDA’s Natural Resources Conservation Service, under the Environmental Quality Incentives Program, began offering financial assistance to farmers for the installation of high tunnels up to 2,178 square feet (NRCS, 2014). According to NRCS, the goal of the initiative is to assist producers to extend the growing season for high-value crops in an environmentally safe manner. (http://www.nrcs.usda.gov/wps/portal/nrcs/detailfull/national/programs/?cid=stelprdb1046250)
ERS analysis of census data indicates that crop producers who use greenhouses or high tunnels (and thus have “protected” crops) consume more energy than producers growing unprotected crops.1 Among greenhouse and high tunnel users, DTC producers used less utilities and fuel than did conventional producers, however (see
1In the census analysis, we define greenhouse crops as all food crops, including tomatoes, vegetables, fresh-cut herbs, fruits, ber-ries, and mushrooms, grown under any type of protection,. The 2012 Census does not distinguish between the type of crop protection, whether nursery, greenhouse, cave, or high tunnel.
Greenhouse/high tunnel crop producers and energy use by marketing type and size, 2012
DTC Non-DTC
Percent change from 2007
DTC Non-DTC
Operations with < $75,000 in total sales
Number of farms Tomatoes 3,377 1,172 155 107
Vegetables & herbs 3,168 1,044 246 108
Fruits & berries 364 136 247 92
Mushrooms 378 127 129 31
$/acre Average utilities 28.25 33.51 6 -7
Average fuel 31.99 44.10 -19 -18
Operations with > $75,000 in total sales
Number of farms Tomatoes 1,271 503 75 64
Vegetables & herbs 699 357 124 18
Fruits & berries 110 63 206 70
Mushrooms 68 139 113 -17
$/acre Average utilities 85.53 544.31 11 2
Average fuel 106.68 505.57 -4 -18
Source: USDA NASS, 2012 Census of Agriculture.
48 Trends in U.S. Local and Regional Food Systems: A Report to Congress, AP-068
Economic Research Service/USDA
One group of farms that is often associated with environmentally friendly farming practices are those certified as organic. Unlike local foods, organic production is well defined and strictly regulated in the United States. Organic production involves agricultural conservation practices that, according to USDA’s Agricultural Marketing Service (2000), integrate cultural, biological, and mechanical practices that foster cycling of resources, promote ecological balance, and conserve biodiversity (e.g., the elimi-nation of synthetic pesticide use and reduction of nonsynthetic pesticide use).
If considerable overlap exists between local and organic producers, we might assume that local food is grown differently from conventionally marketed food. But based on 2012 Census data, while some local food is produced organically, certified organic producers do not comprise a large share of DTC producers. In fact, the overlap between local (DTC or intermediated) food farmers and certified and certification-exempt organic farmers is relatively small (7,556 farms, see fig. 12). Only about 5 percent of local foods farms are organic farms, though nearly half of certified organic farms market in local foods outlets. Approximately the same share of farms with DTC sales are certified organic (6,468 farms). Among certified organic or organic-exempt farms marketing locally in 2012, 39 percent partic-ipated in DTC outlets, while another 7 percent sold only through intermediated channels.
Research has noted that the low supply of and demand for organic produce at farmers’ markets was due to a limited number of organic farmers, limited awareness about organic production, and nega-tive perceptions about organic product pricing (Kremen et al., 2004). On the other hand, focusing on intermediated sales, Dimtri and Oberholtzer (2009) find that nearly half (48 percent) of organic fruits and vegetables were sold in local or regional marketing channels in 2007.
While the numbers are small, DTC producers are more likely than non-DTC producers to use the environmentally friendly management practices ascribed to organic production.48 Indeed, among farms that are exempt from organic certification requirements (most likely due to having less than $5,000 in sales for 2012), many more DTC farms than non-DTC farms claim to be producing according to USDA National Organic Program standards (table 11).
In addition to typical conservation practices in agricultural production, farms may offer opportu-nities for recreation and natural amenities. Onfarm recreation and agritourism includes hunting, fishing, horseback riding, Christmas tree sales, pick-your-own produce, and petting zoos. In the
48The 2012 Census of Agriculture asked if the operation had: (1) production of organic products according to the USDA’s National Organic Program (NOP) standards or acres transitioning into USDA NOP production, (2) USDA NOP certified organic production, (3) USDA NOP organic production exempt from certification (typically less than $5,000 in sales), (4) acres transitioning into USDA NOP production, and (5) production according to USDA NOP standards but neither certified nor exempt. USDA considers only farm operations that are certified (2) or exempt (3) to be organic operations.
figure). There is a statistically significant difference in utility and fuel consumption between larger (above $75,000 in annual sales) DTC and non-DTC greenhouse operations as well; conventional producers consumed approximately six times the value of utilities and five times the value of fuel, per acre, compared to DTC producers. Among the smallest farms (with annual sales less than $75,000), DTC producers spent less per acre on fuel and utilities than non-DTC farms, though the magnitude of the difference was smaller. However, the 2012 Census of Agriculture did not distinguish between the use of greenhouses and high tunnels in farmers’ responses, so these (scale) differences in energy consumption may be attributed to the differences in energy use of high-input greenhouses versus low-input high tunnels.

49 Trends in U.S. Local and Regional Food Systems: A Report to Congress, AP-068
Economic Research Service/USDA
context of local foods production, Low and Vogel (2011) found that DTC farms are often near densely populated urban areas, particularly in the Northeast and West Coast regions. As of 2013, the preservation of farmland by State programs totaled 2.4 million acres at a cumulative cost of over $3.6 billion (http://www.farmlandinfo.org/sites/default/files/FIC_State_PACE%2009-2013_0.pdf). Many of these acres are in or near urban areas (where farmland is most vulnerable to development pressures). Their protection may complement local foods programs:
• Local foods outlets in urban areas require nearby farms, and the preservation of farmland helps secure the existence of such farms.
Note: Local defined as farms with DTC or intermediated sales. Organic defined as certified organic or organic-exempt farms.Source: USDA Economic Research Service using data from USDA, National Agricultural Statistics Service, 2012 Census of Agriculture.
Figure 12
Intersection between 2012 local and organic production
Farms withorganic sales
16,525
Farms with both organic and local sales
7,556
Farms with local (direct-to-consumer or
with intermediated) sales163,675
Table 11
Characteristics of organic producers, by marketing type, 2012
DTC Non-DTC
Number of certified organic producers 4,107 8,664
Number of certification-exempt organic producers 2,361 1,393
Percent of farms certified or certification-exempt organic 4.5 0.5
Number of transitioning organic producers 1,236 2,004
Note: Organic producers are defined as farm operations that indicated a positive total value of crop, livestock, and live-stock products (including eggs and milk) sold as USDA NOP certified or certification-exempt organic.
Source: USDA NASS, 2012 Census of Agriculture.

50 Trends in U.S. Local and Regional Food Systems: A Report to Congress, AP-068
Economic Research Service/USDA
• Demand for local foods can enhance the markets available to local farms, possibly increasing their financial viability.
In addition, farmland preservation programs do more than encourage food production—they can also provide rural amenities such as open space, agrarian cultural heritage, and recreational opportuni-ties. Brown and Reeder (2007) note that onfarm recreation and agritourism can benefit both farmers and surrounding communities by offering urban and suburban residents the opportunity to experience preserved agricultural land and related natural amenities, such as forests, streams, and wildlife
That said, the relationship between rural amenities and farmland preservation is not straightfor-ward. The public’s notions about what rural amenities farmland protection should provide, and what farmland protection programs actually focus on, are not always in sync. For example, an increased interest in local foods may reduce the provision of other rural amenities provided by “farmland” (Hellerstein et al., 2002).
Environmental Effects from the Farm to the Fork… and to the Landfill
Once produce is harvested or livestock is slaughtered, it is usually stored, transported, and distrib-uted before reaching consumers. Each of these activities uses energy to some degree and may affect other environmental indicators.
Transportation
The premise of local food is minimizing the distance between agricultural producers and food consumers. As a result, many researchers have focused on the environmental effects of “farm to fork” transportation. Claims about reductions in fuel use and GHG emissions during transporta-tion of local food are numerous, but more recent research finds that transportation accounts for a small portion (11 percent) of lifecycle GHG emissions from conventional agricultural production. Additionally, the mode of transportation and other energy used along the supply chain may be more important environmentally than transportation distance (Avetisyan et al., 2013; Weber and Matthews, 2008). By weight, inland water and rail transportation are associated with fewer GHG emissions than truck transportation.
Various efficiencies are achieved from economies of scale in food transportation. King et al. (2010) find that transportation fuel use is more affected by the structure and size of the food supply chain than by distance traveled. They also find that fuel use per unit is often less in supermarket supply chains than in local supply chains due to larger, more efficient loads. In the United Kingdom, Coley et al. (2009) find that a supply chain in which consumers travel to the farm to purchase produce causes more GHG emissions than a supply chain of large food retailers. These findings suggest that local produce transportation may be more environmentally damaging than transportation for non-local produce.
Processing, Packaging, and Food Waste
According to Canning et al. (2010), processing, packaging, and selling food uses more than ten times as much energy as the transportation of food. Even as early as the 1970s, 75 percent of food grown on U.S. farms was processed in some way before it was consumed (Hendrickson, 2008). As

51 Trends in U.S. Local and Regional Food Systems: A Report to Congress, AP-068
Economic Research Service/USDA
a result, food packaging has become increasingly energy intensive, especially with the popularity of individually wrapped, single-serving portions. Packaging for both food and non-food products represented one-third of U.S. municipal waste in the 1990s (Ackerman, 1996), and has likely grown since then. Ackerman cites an inverse relationship between the amount of food waste and packaging waste. If a household produces more waste from fresh foods by discarding inedible portions, it is most likely producing less waste from commercially prepared or packaged foods. Alternatively, food processing reduces total waste compared to fresh foods because inedible portions are often collected by processing plants and used for other purposes instead of being discarded by the household (Marsh and Bugusu, 2007).
An additional source of waste for both conventional and local foods is food loss and food waste. Many lifecycle assessments ignore disposal in landfills, which is an important stage in the lifecycle of food products in a “cradle to grave” analysis. According to U.S. EPA (2014), food waste is the largest source of municipal solid waste (MSW) and the largest source of biomass for MSW bioen-ergy. A reduction in the amount of food waste can have significant economic and environmental benefits, such as a reduction in the use of resources associated with agricultural production, in the release of methane from landfills, and in disposal costs. If claims that local foods use less processing and packaging are correct, then evidence shows that local foods would create more food waste from spoilage and less efficient home preparation. For more information on general postharvest food loss and waste at the retail and consumer levels, see Buzby et al. (2014).

52 Trends in U.S. Local and Regional Food Systems: A Report to Congress, AP-068
Economic Research Service/USDA
Policies Supporting Local and Regional Food Systems
In recent years, Federal, State, and local policies have expanded to include programs supporting local and regional food systems. At the national level, these policies are set through overarching farm legislation, approximately every 5 years. The most recent, the Agricultural Act of 2014 (2014 Farm Bill, Pub.L. 113-79), was signed into law on February 7, 2014, and includes a number of poli-cies and provisions related to local and regional food. Most notably, support for intermediated marketing channels is greatly increased. Policies and provisions enacted in the 2008 Farm Bill are generally continued or expanded. A number of States have recently passed legislation to address access to and expansion of farmers’ markets and urban agriculture. At the regional and local levels, zoning and regulation, fiscal incentives, and institutions are used to strengthen local food systems. This growing investment across all levels of government may fuel continued collaboration, aiding the development of local and regional food systems.
New and Expanded Federal Policies for 2014
The 2014 Farm Bill provides support for several new and significantly revamped programs that promote the production and marketing of food locally and regionally, but also access to healthy foods.
Expanded Marketing Programs
The Farmers’ Market Promotion Program (FMPP, Sec. 10003), created in 2002, has been renamed the Farmers’ Market and Local Food Promotion Program and its scope expanded. While the FMPP supported marketing exclusively through DTC outlets (e.g., farmers’ markets, CSAs), the new program includes intermediated channels such as farm-to-institution, food hubs, and other busi-nesses that process, distribute, aggregate, or store locally or regionally marketed food products. This new component is implemented through the Local Food Promotion Program (LFPP, Sec. 10003), which offers planning and implementation grant funds to eligible entities with a 25-percent match (USDA ARS, 2014). The overall program receives a three-fold increase in mandatory funding, providing $30 million per year for 2014-18, split equally between DTC and intermediated marketing, with an additional $10 million in annual appropriations for 2014-18 (USDA ERS, 2014).
The scope and funding for the Specialty Crop Block Grants (SCBG, Sec. 10010) program also expanded in 2014. The 2014 Farm Bill authorizes multistate projects under this program for the first time. SCBG is administered through State departments of agriculture and regularly includes funding for projects related to locally and regionally marketed food (particularly fruit and vegetable produc-tion). Its flexible scope allows funding support for a variety of local food projects such as farm to school programs, food safety training, food hubs, and marketing research, thus providing a broad base of support for the development of local and regional food systems. Annual mandatory funding increased from $55 million to $72.5 million for 2014-17 and $85 million per year thereafter.
Expanded Production Programs
The Value-Added Producer Grant program (Sec. 6203), which is designed to help farmers develop farm-based value-added products (e.g., cheese, jam, packaged meats, sausages), was reprioritized to better target small and midsized family farms as well as beginning, socially disadvantaged, and veteran farmers. Annual mandatory funding has increased from $15 million to $63 million for 2014-
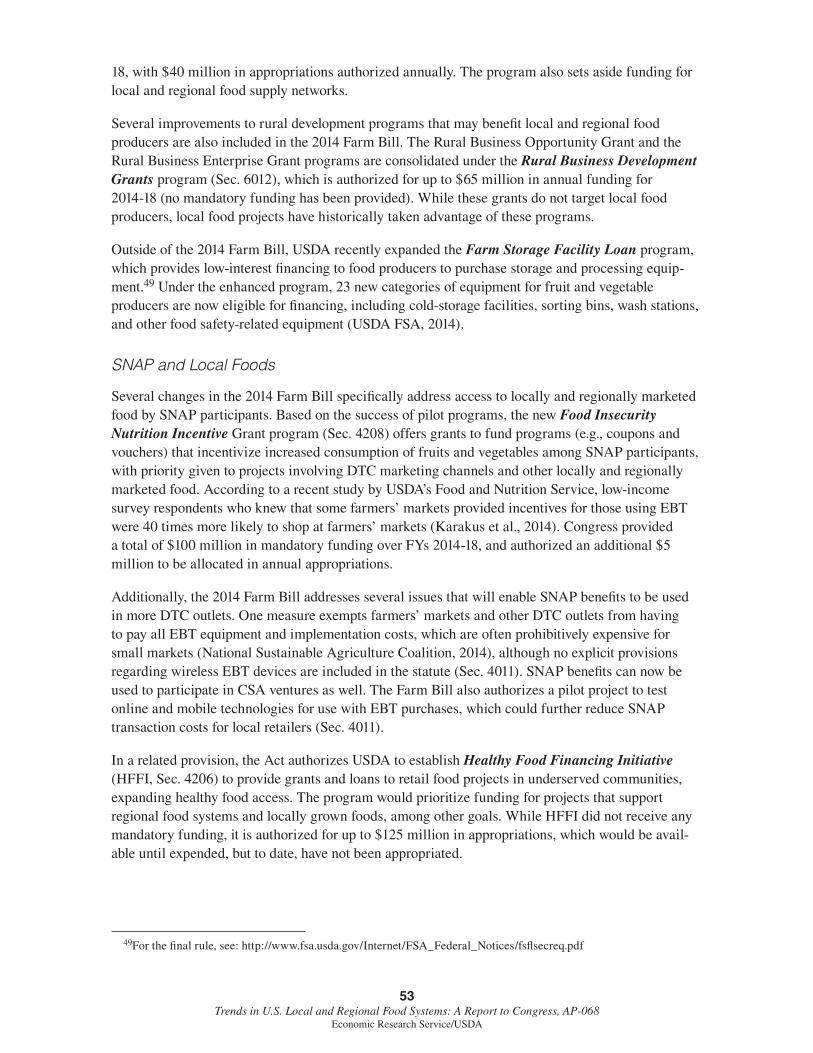
53 Trends in U.S. Local and Regional Food Systems: A Report to Congress, AP-068
Economic Research Service/USDA
18, with $40 million in appropriations authorized annually. The program also sets aside funding for local and regional food supply networks.
Several improvements to rural development programs that may benefit local and regional food producers are also included in the 2014 Farm Bill. The Rural Business Opportunity Grant and the Rural Business Enterprise Grant programs are consolidated under the Rural Business Development Grants program (Sec. 6012), which is authorized for up to $65 million in annual funding for 2014-18 (no mandatory funding has been provided). While these grants do not target local food producers, local food projects have historically taken advantage of these programs.
Outside of the 2014 Farm Bill, USDA recently expanded the Farm Storage Facility Loan program, which provides low-interest financing to food producers to purchase storage and processing equip-ment.49 Under the enhanced program, 23 new categories of equipment for fruit and vegetable producers are now eligible for financing, including cold-storage facilities, sorting bins, wash stations, and other food safety-related equipment (USDA FSA, 2014).
SNAP and Local Foods
Several changes in the 2014 Farm Bill specifically address access to locally and regionally marketed food by SNAP participants. Based on the success of pilot programs, the new Food Insecurity Nutrition Incentive Grant program (Sec. 4208) offers grants to fund programs (e.g., coupons and vouchers) that incentivize increased consumption of fruits and vegetables among SNAP participants, with priority given to projects involving DTC marketing channels and other locally and regionally marketed food. According to a recent study by USDA’s Food and Nutrition Service, low-income survey respondents who knew that some farmers’ markets provided incentives for those using EBT were 40 times more likely to shop at farmers’ markets (Karakus et al., 2014). Congress provided a total of $100 million in mandatory funding over FYs 2014-18, and authorized an additional $5 million to be allocated in annual appropriations.
Additionally, the 2014 Farm Bill addresses several issues that will enable SNAP benefits to be used in more DTC outlets. One measure exempts farmers’ markets and other DTC outlets from having to pay all EBT equipment and implementation costs, which are often prohibitively expensive for small markets (National Sustainable Agriculture Coalition, 2014), although no explicit provisions regarding wireless EBT devices are included in the statute (Sec. 4011). SNAP benefits can now be used to participate in CSA ventures as well. The Farm Bill also authorizes a pilot project to test online and mobile technologies for use with EBT purchases, which could further reduce SNAP transaction costs for local retailers (Sec. 4011).
In a related provision, the Act authorizes USDA to establish Healthy Food Financing Initiative (HFFI, Sec. 4206) to provide grants and loans to retail food projects in underserved communities, expanding healthy food access. The program would prioritize funding for projects that support regional food systems and locally grown foods, among other goals. While HFFI did not receive any mandatory funding, it is authorized for up to $125 million in appropriations, which would be avail-able until expended, but to date, have not been appropriated.
49For the final rule, see: http://www.fsa.usda.gov/Internet/FSA_Federal_Notices/fsflsecreq.pdf
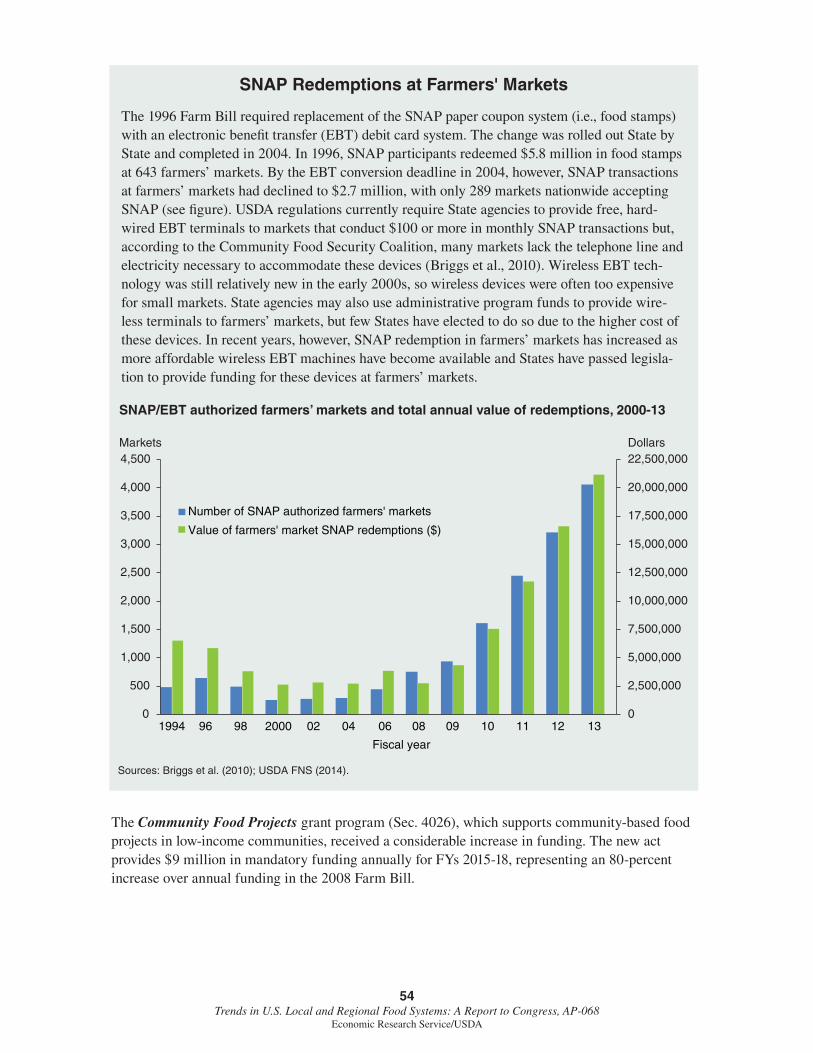
54 Trends in U.S. Local and Regional Food Systems: A Report to Congress, AP-068
Economic Research Service/USDA
The Community Food Projects grant program (Sec. 4026), which supports community-based food projects in low-income communities, received a considerable increase in funding. The new act provides $9 million in mandatory funding annually for FYs 2015-18, representing an 80-percent increase over annual funding in the 2008 Farm Bill.
SNAP Redemptions at Farmers' Markets
The 1996 Farm Bill required replacement of the SNAP paper coupon system (i.e., food stamps) with an electronic benefit transfer (EBT) debit card system. The change was rolled out State by State and completed in 2004. In 1996, SNAP participants redeemed $5.8 million in food stamps at 643 farmers’ markets. By the EBT conversion deadline in 2004, however, SNAP transactions at farmers’ markets had declined to $2.7 million, with only 289 markets nationwide accepting SNAP (see figure). USDA regulations currently require State agencies to provide free, hard-wired EBT terminals to markets that conduct $100 or more in monthly SNAP transactions but, according to the Community Food Security Coalition, many markets lack the telephone line and electricity necessary to accommodate these devices (Briggs et al., 2010). Wireless EBT tech-nology was still relatively new in the early 2000s, so wireless devices were often too expensive for small markets. State agencies may also use administrative program funds to provide wire-less terminals to farmers’ markets, but few States have elected to do so due to the higher cost of these devices. In recent years, however, SNAP redemption in farmers’ markets has increased as more affordable wireless EBT machines have become available and States have passed legisla-tion to provide funding for these devices at farmers’ markets.
Sources: Briggs et al. (2010); USDA FNS (2014).
SNAP/EBT authorized farmers’ markets and total annual value of redemptions, 2000-13
0
2,500,000
5,000,000
7,500,000
10,000,000
12,500,000
15,000,000
17,500,000
20,000,000
22,500,000
0
500
1,000
1,500
2,000
2,500
3,000
3,500
4,000
4,500
1994 96 98 2000 02 04 06 08 09 10 11 12 13
Fiscal year
Number of SNAP authorized farmers' markets
Value of farmers' market SNAP redemptions ($)
Markets Dollars

55 Trends in U.S. Local and Regional Food Systems: A Report to Congress, AP-068
Economic Research Service/USDA
Program Evaluation Legislation
The 2014 Farm Bill also includes provisions to establish a data infrastructure to facilitate analysis of local food systems. The act requires USDA (Sec. 5105) to develop crop valuation methods to further facilitate lending to producers marketing locally. USDA is also tasked with implementing a device for local producers to establish price history. The act also includes an initiative requiring USDA to collect data on local food production and marketing, to facilitate data sharing, and to monitor the effectiveness of programs designed to promote local food systems (Sec. 10016). No mandatory funding was authorized for this provision, so startup funding must be arranged through an annual appropriations act.
Reauthorized Federal Policies
In addition to new and expanded Federal programs, the 2014 Farm Bill reauthorizes many programs from the previous Farm Bill that support local and regional food systems, with only minor modi-fications or changes to spending levels. Overall, the new Farm Bill represents an additional $501.5 million investment over the next 5 years (fig. 13) in programs that may affect local and regional food systems. The reauthorized programs generally address issues of food access and food production.
Reauthorized Food Access Programs
The Senior Farmers’ Market Nutrition Program (Sec. 4203) remains unchanged for 2014. This program provides low-income seniors with coupons and vouchers that can be used for eligible
*Permanently funded programs. Figures represents increases over previous farm act levels only.Source: National Sustainable Agriculture Coalition, 2014.
Figure 13
Five-year total spending levels in the 2008 and 2014 Farm Bills for select programs related to locally and regionally marketed food
0 25 50 75 100 125 150 175 200 225 250
Farmers Market and Local Food Promotion Program
Specialty Crop Block Grant*
Value Added Producer Grant Program
Rural Microentrepreneur Assistance Program
National Organic Certification Cost Share
Senior Farmers Market Nutrition Program*
Food Insecurity Nutrition Incentives (SNAP incentives)
Community food projects*
Funding ($ millions)
2014 Farm Bill 2008 Farm Bill

56 Trends in U.S. Local and Regional Food Systems: A Report to Congress, AP-068
Economic Research Service/USDA
foods at farmers’ markets, CSAs, and roadside stands. The program is permanently authorized and receives mandatory funding of $20.6 million annually.
Similarly, the Fresh Fruit and Vegetable Program, which provides fruit and vegetable snacks to school children throughout the day, is a permanently authorized and funded national program. The 2014 Farm Bill maintains the $50-million annual minimum requirement for USDA fresh fruit and vegetable acquisitions for schools (Chite, 2014). While this provision does not explicitly priori-tize locally and regionally produced food, an accompanying pilot program has been authorized to address this (Sec. 4214).
Reauthorized Food Production Programs
The National Organic Certification Cost-Share Program (Sec. 10014) helps organic farmers offset the cost of annual certification, which may benefit organic local and regional producers. In the 2014 Farm Bill, mandatory funding for this program increased to $11.5 million annually for 2014-18—more than double the amount from the 2008 Act.
The Rural Microentrepreneur Assistance Program (RMAP), which was created by the 2008 Farm Bill, provides grants and direct loans to organizations that provide microloans, of up to $50,000 each, to rural microenterprises for a variety of purposes. The 2014 Farm Bill maintains manda-tory funding levels for RMAP at $3 million annually as in the previous act (Sec. 6203). Similarly, support was renewed for the Farm Service Agency (FSA) Microloan program. This program, a modification of the FSA Operating Loan Program, is designed to serve farmers, particularly those who are smaller and less established; the program features streamlined loan applications and flexible eligibility requirements. The maximum loan amount is $35,000, and the funds can be used for all approved operating expenses (Sec. 5106).
Also, in the 2008 Farm Bill, the Local and Regional Food Enterprise Loan account was established within the Business and Industry (B&I) Guaranteed Loan Program (reauthorized by the 2014 Farm Bill, Sec. 6010). The larger B&I program provides Federal guarantees of commercial loans to rural businesses. The purpose of this subprogram is to support development of local food system infrastructure (businesses that process, distribute, aggregate, store, and market foods produced either instate or transported less than 400 miles from the origin of the product). The program also has the authority to fund projects in urban areas if they support farm and ranch income and expand healthy food access in underserved communities. The 2008 Act mandated that at least 5 percent of B&I funds be appropriated to local and regional food enterprises and the 2014 Farm Bill maintains this 5-percent floor. Overall funding for the B&I Loan program is set through the annual appropriations act, and in May 2014, USDA announced that $48 million in loan guarantees is available for local food projects.
National Farm to School Program
School districts are encouraged to source locally produced food for school meals. The Healthy-Hunger Free Kids Act of 2010 (Pub.L. 111-296) created a Farm to School Program within USDA to increase access to local foods by schools. Operated by the Food and Nutrition Service (FNS), USDA’s program includes grants, training/technical assistance, and research. The grant program provides up to $5 million in annual funding to help school districts plan and implement farm to school programs to source locally and regionally produced food products for school meals.

57 Trends in U.S. Local and Regional Food Systems: A Report to Congress, AP-068
Economic Research Service/USDA
Additionally, the USDA conducted the first-ever nationwide Farm to School Census, documenting farm to school activities in school year 2011-12 (results of this census are detailed in the consumer section of this report). Most recently, a new pilot project authorized in the 2014 Farm Bill will allow up to eight States additional flexibility for using USDA Foods entitlement dollars to purchase locally sourced, if desired, unprocessed fruits and vegetables using geographic preference. Furthermore, in the last decade, many States have passed legislation supporting to school programs (National Farm to School Network and Vermont Law School Center for Agriculture and Food Systems, 2014). Nonprofit organization like the National Farm to School Network also aid in the procurement of locally produced food for school meals.
Know Your Farmer, Know Your Food
Know Your Farmer, Know Your Food (KYF2) is a USDA-wide initiative to strengthen USDA’s support for local and regional food systems. Since 2009, KYF2 has helped foster the connection between farmers and consumers and serves as a clearinghouse for information on USDA programs available to support local and regional food systems. The initiative is carried out through a task force of USDA employees representing all agencies in the Department, through which USDA integrates programs and policies to promote local and regional food systems. In 2012, the initiative launched a map of USDA investments in local and regional food systems called the Compass; projects supported by other federal Departments were added in 2013. Data on the Compass are pulled from over 30 grant and loan programs and updated annually. KYF2 also provides an online repository of tools and resources to help farmers, consumers, and other stakeholders take advantage of local and regional food systems at http://www.usda.gov/knowyourfarmer.
State and Substate Local Food Policies and Programs
At the State level, local and regional food policies are often tied to State actions to promote healthy communities and access to healthy food (Winterfeld et al., 2012). Recent legislation in many States has focused on expansion of food access and urban agriculture.
State Support for Increased Access to Local Food
Several States have adopted legislation to provide financial incentives for food retail outlets, some of which include local food retailers, to locate in areas with low access to healthy food with the goal of increased food access50 (Winterfeld et al., 2012). For example, in 2011, the District of Columbia established the Healthy Food Retail Program to provide grants and loans to farmers’ markets, corner stores, and other small food outlets that sell fresh produce. Participants are encouraged to accept SNAP benefits and must agree to retail produce for at least 3 years. California passed a law in 2011 that created the California Healthy Food Financing Initiative51 to expand access to healthy food in underserved communities, although the initiative is not limited to local and regional food.
50For more information on how USDA measures food access, see the Food Access Research Atlas at http://www.ers.usda.gov/data-products/food-access-research-atlas.aspx.
51This program is separate from the Federal HFFI program included in the 2014 Farm Bill. Funding for California’s program is provided through a public-private partnership.

58 Trends in U.S. Local and Regional Food Systems: A Report to Congress, AP-068
Economic Research Service/USDA
In recent years, farm to school programs have received considerable support at the State level, with the goal of increasing food access and awareness52 (Winterfeld et al., 2012). For example, in 2011, Oregon unanimously passed a law appropriating $200,000 to establish a grant program that provides funding of up to 15 cents per lunch to schools to use Oregon-grown, processed or manufactured food in school meals and to provide education related to local agriculture. Missouri established the Farm to Table Advisory Board to investigate options to use locally grown food in schools and State institutions and to promote awareness of the connection between local food and healthy eating. New Jersey established the annual “Jersey Fresh Farm to School Week,” organized by the Department of Agriculture and Department of Education, which includes a variety of programs to encourage the use of locally marketed food products.
State Legislation on Farmers’ Markets
Farmers’ markets are another target for State legislation, including access, market expansion, and nutrition programs (fig. 14). According to the National Conference of State Legislatures (NCSL), between 2008 and 2012, 11 States passed legislation to help increase the use of EBT machines at farmers’ markets (NCSL, 2014a). Most of these programs also have specifically appropriated funds to help farmers’ markets purchase wireless EBT machines.
State legislatures have also prioritized expansion of farmers’ markets and, more generally, local food systems through various initiatives. According to the National Conference of State Legislatures, in 2012, Florida, Georgia, Mississippi, New York, North Carolina, and South Carolina each appropri-
52These examples represent a small portion of the State activities related to Farm to School. More information can be obtained from the Farm to School Network regional and State leads (http://www.farmtoschool.org/our-network).
*The figure for community gardens legislation does not include pre-existing statutes in six states.Source: National Conference of State Legislatures, 2014.
Figure 14
Recently enacted State-level local food policy legislation by topic and year
Cumulative number of laws
0
5
10
15
20
25
30
35
2007 2008 2009 2010 2011 2012 2013
Community Gardens*
Urban Agriculture
Farmers' Market Access
Farmers' Market Expansion
Farmers' Market Nutrition Programs

59 Trends in U.S. Local and Regional Food Systems: A Report to Congress, AP-068
Economic Research Service/USDA
ated funds ranging from $50,000 to $7 million for construction, repair, and maintenance of capital infrastructure for farmers’ markets (NCSL, 2014a). Between 2008 and 2012, Colorado, Illinois, Louisiana, and Oklahoma each established a committee or task force to support farmers’ markets, while Connecticut, Louisiana, and Rhode Island funded grant and marketing programs to promote local agriculture. Some States also provide tax relief for farmers’ markets such as sales tax exemp-tions (Mississippi and Tennessee) and property tax exemptions (Washington).
Another area of State legislation that supports farmers’ markets and local food systems is nutrition programs for low-income residents. State programs in this area are typically tied to the federally subsidized Farmers’ Market Nutrition Program, Farmers’ Market Coupon Program, and Seniors Farmers’ Market Nutrition Program (NCSL, 2014a). In 2012, Illinois, Massachusetts, Mississippi, New Jersey, and West Virginia each appropriated State funds for one or more of these programs, ranging in amount from $30,000 to $1.5 million.
State Support for Local Food Infrastructure
Some States have also adopted legislation to support infrastructure for local food production and consumption. Connecticut was the first State to establish a State food policy council53 in 1997, and by 2011, 12 additional States had done so (Hood et al., 2012). Building on this, Connecticut recently authorized municipalities to create local and regional councils as well to promote and support local agricultural systems. (Winterfeld et al., 2012). New York expanded the New York State Urban Development Corporation Act to allow funds to be used to finance distribution of State produce to institutions in underserved communities. Iowa and Vermont both implemented comprehensive local food programs to promote production, distribution, and marketing of local foods. Both initiatives also established a statewide local food coordinator position to manage the program.
Urban Agriculture and Community Gardens
State legislators have also targeted support to local and regional food systems through statutes and programs focusing on urban agriculture and community gardens. Since 2007, several States and the District of Columbia have passed laws that improve land access for urban agriculture (NCSL, 2014b). Programs provide tax incentives for urban land conversion to agricultural use and urban farming and gardening generally. Many more States have established committees to develop recom-mendations for expanding local food production.
A few States have specific statutes in their State code related to community gardens that benefit local food systems (NCSL, 2014c). For example, California is authorized to develop programs to support organizations that develop community gardens, lease State land for use as community gardens, provide grants to school districts for school gardens, and allow municipal bodies to dedicate land to community gardens. In the District of Columbia, the Food Production and Urban Gardens Program compiles a list of vacant lots in the city for use as urban and community gardens. In Illinois, community gardens are included in the nutrition programs funded by the State-administered Federal Community Services Block Grant program. Massachusetts State law authorizes the Bureau of
53A food policy council is a public-private advisory council—typically comprised of food sector stakeholders, commu-nity leaders, and representatives from other public and private sector partners—that works with State, regional, and local government to develop policies and programs that support local and regional food systems.

60 Trends in U.S. Local and Regional Food Systems: A Report to Congress, AP-068
Economic Research Service/USDA
Agriculture Land Use to obtain both private and public land to provide to groups and organizations for use as community gardens, with priority given to raising food crops.
Other Substate Policies and Programs
City, county, and regional governments have implemented innovative public policies to support local and regional food systems. Policy instruments employed include official plans, regulations, fiscal incentives, and government institutions and programs. Official government plans guide local investment and community development. According to a report by the Food Systems and Healthy Communities Lab at the University of Buffalo, some local governments have incorporated food systems into their comprehensive or environmental plans, while others have developed stand-alone food system plans (Neuner et al., 2011). Regulatory tools such as permitting, licensing, and moni-toring can also help or hinder the development of local and regional food systems by regulating various aspects of production, processing, distribution, consumption, and disposal of food (Neuner et al., 2011). For example, local governments can modify zoning ordinances to permit urban agricul-ture in cities or to allow farmers’ markets in certain districts.
Local governments are also providing fiscal incentives—including loans, grants, or reduced permit and license fees—to local food producers (e.g., urban farms or community gardens), retail stores, or farmers’ markets (Neuner et al., 2011). Some cities also provide loans and grants to support mobile vending of fresh produce (e.g., the Green Cart Initiative in New York City). Local government insti-tutions that support local and regional food systems were uncommon in the past, but recently these mechanisms have begun to play a larger role in local food policy. Institutional structures may exist directly within local government agencies, such as a department of planning. Private-public food policy councils have also emerged to address local and regional food policy. In these councils, local government officials and stakeholders work together to develop policies that support local food systems (Neuner et al., 2011). Today, over 150 local and regional food policy councils exist in the United States, in addition to State-level food policy councils established in over half the States (fig. 15).
Government and NGO Collaboration To Support Local Food at the State and Regional Levels
Aside from government legislation, a number of nongovernmental programs and organizations exist to support and promote local and regional food systems. State farmers’ market associations typically provide member markets with technical assistance, marketing and promotion services, networking opportunities, assistance with insurance, and general advocacy, according to the Farmers Market Coalition (Wasserman, 2009). As of 2014, associations exist in 26 States. FoodRoutes Network, for example, is a Pennsylvania-based nonprofit organization that promotes local food systems and sustainable agriculture and manages the development of State and local Buy Fresh Buy Local® chap-ters. Buy Fresh Buy Local® chapters organize outreach events, local food guides, and educational materials to promote locally produced food and farmers. As of 2014, 65 State and regional/local Buy Fresh Buy Local® chapters have been established in 21 States.
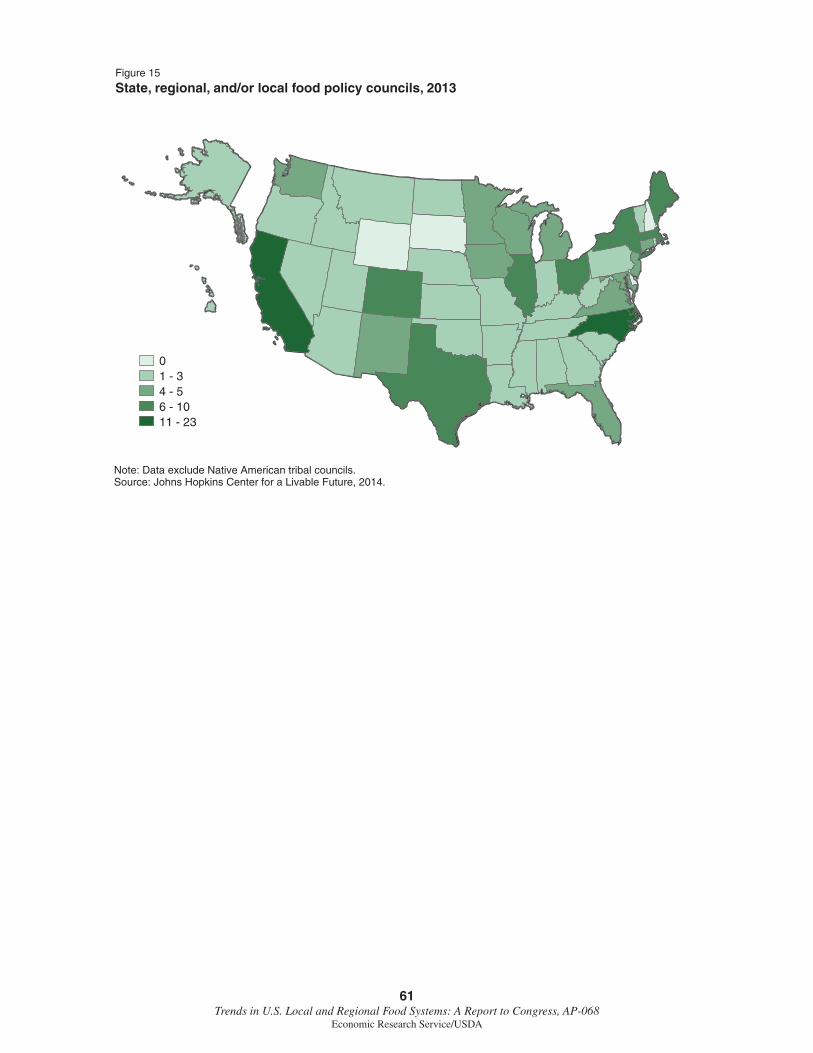
61 Trends in U.S. Local and Regional Food Systems: A Report to Congress, AP-068
Economic Research Service/USDA
Note: Data exclude Native American tribal councils.Source: Johns Hopkins Center for a Livable Future, 2014.
Figure 15
State, regional, and/or local food policy councils, 2013
01 - 34 - 56 - 1011 - 23

62 Trends in U.S. Local and Regional Food Systems: A Report to Congress, AP-068
Economic Research Service/USDA
Glossary
Agricultural Resource Management Survey (ARMS): USDA’s primary source of information on the financial condition, production practices, and resource use of America’s farm businesses and the economic well-being of America’s farm households. ARMS is a nationally representative survey administered using several phases—sample screener, field-level, and farm-level phases—targeting about 5,000 fields and 30,000 farms each year.
Community Supported Agriculture (CSA): Marketing arrangement in which members purchase shares of a farmer’s expected yield before planting. Each week during the growing season the farmer delivers each member’s weekly share of food to predetermined locations or packs the share for members to pick up at the farm.
Department of Defense (DOD): U.S. government agency in charge of the three military branches. The DOD Fresh Fruit and Vegetable Program allow schools to use USDA Foods entitlement dollars to buy fresh produce. The program is operated by the Defense Logistics Agency at DOD.
Direct-to-Consumer (DTC) Marketing: Local food marketing arrangement in which producers sell agricultural products directly to the final consumers, such as sales to consumers through farmers’ markets, CSAs or farm stands.
Electronic Benefits Transfer (EBT): An electronic system that allows a recipient to authorize transfer of their government benefits from a Federal account to a retailer account to pay for products received. The 1996 Farm Bill required replacement of the SNAP paper coupon system (i.e. food stamps) by an EBT debit card system, which was rolled out on a State-by-State basis and completed in 2004.
Food hub: Regional enterprises that aggregate locally-sourced food to meet wholesale, retail, institutional, and even individuals’ demand. They have become key entities in local food systems’ infrastructure allowing small and midsized farmers to adapt to increases in demand by outsourcing marketing to them.
Food Safety Modernization Act (FSMA, Pub .L . 111-353): A federal law passed in 2011 calls for sweeping changes to the U.S. food safety system by shifting the focus of Federal regulators from outbreak response to prevention. Part of this legislation obliges FDA to develop science-based and risk-based mandatory microbial food safety practices. This will be the first time that produce growers come under mandatory FDA regulation.
Good Agricultural Practices (GAP): The public food safety education program for produce began in 1998 when the Food and Drug Administration (FDA) published its Guide to Minimize Microbial Food Safety Hazards for Fresh Fruits and Vegetables, voluntary guidelines popularly referred to as GAP.
Gross Cash Farm Income (GCFI): Monetary revenue actually received by the farm, including other farm income such as agritourism, custom work, and forest products, but excluding the value of farm production accruing to share landlords and contractors.

63 Trends in U.S. Local and Regional Food Systems: A Report to Congress, AP-068
Economic Research Service/USDA
Good Handling Practices (GHP): Voluntary standards based on FDA’s GAP guidance that outline best agricultural practices to verify that fruit and vegetables are packed, handled, and stored in the safest way, reducing microbial food safety risks associated with fresh produce.
Hazard Analysis and Critical Control Point (HACCP): Management system in which food safety is addressed through the analysis and control of biological, chemical, and physical hazards from raw material production, procurement and handling, to manufacturing, distribution and consumption of the finished product.
Intermediated sales: Sales through non-direct local food marketing channels that in turn sell directly to consumers, such as restaurants, grocery stores, schools, hospitals, or regional food aggregators.
National Organic Program (NOP): The NOP regulates all organic crops, livestock, and agricul-tural products certified to the USDA organic standards. Organic certification agencies inspect and verify that organic farmers, ranchers, distributors, processors, and traders are complying with the USDA organic regulations.
Supplemental Nutrition Assistance Program (SNAP): Federal program administered by USDA FNS that offers nutrition assistance to eligible, low-income individuals and families. FNS works with State agencies to ensure that those eligible for nutrition assistance can access benefits.
Special Supplemental Nutrition Program for Women, Infants, and Children (WIC): Federal program administered by USDA FNS that provides Federal grants to States for supplemental foods, health care referrals, and nutrition education for low-income pregnant, breastfeeding, and non-breastfeeding postpartum women, and to infants and children up to age five who are found to be at nutritional risk.

64 Trends in U.S. Local and Regional Food Systems: A Report to Congress, AP-068
Economic Research Service/USDA
References
Abelló, F.J., M.A. Palma, D.P. Anderson, and M.W. Waller. 2014. “Evaluating the factors influencing the number of visits to farmers’ markets,” Journal of Food Products Marketing 20:17-35.
Ackerman, F. 1996. Environmental Impacts of Packaging in the U.S. and Mexico. Society for Philosophy and Technology 2(2).
Adams, D.C., and A.E. Adams. 2011. “De-placing local at the farmers’ market: consumer concep-tions of local foods,” Journal of Rural Social Sciences 26(2):74-100.
Aleci, Linda S., and Douglas T. Smith. 2011. “Mapping the Eastern Market in Lancaster, PA. A Case Study for Emerging Trends in Farmers Markets and Sustainable Food Systems,” Appetite 56(2):517-549.
Allen, A.W., and M.W. Vandever. 2003. A National Survey of Conservation Reserve Program (CRO) Participants on Environmental Effects, Wildlife Issues, and Vegetation Management on Program Lands. Biological Science Report (USGS/BRD/BSR-2003-000), Washington, DC: U.S. Geological Survey.
Anderson, M.D. 2007. “The Case for Local and Regional Food Marketing,” Farm and Food Policy Project issue brief. Washington, DC: Northeast- Midwest Institute. http://www.farmlandinfo.org/documents/37278/The_Case_for_Local_Food.pdf (accessed June 2014).
Avendaño, B., and L. Calvin. 2006. “Impact of U.S. Good Agricultural Practices on the Mexican Fruit and Vegetable Industry,” Selected presentation at New Food Safety Incentives and Regulatory, Technological, and Organizational Innovations, AAEA Pre-conference Workshop, Long Beach, CA, July 22. http://ageconsearch.umn.edu/bitstream/20435/1/pc06av01.pdf (accessed June 2014).
Avetisyan, M., T. Hertel, and G. Sampson. 2013. “Is Local Food More Environmentally Friendly? The GHG Emissions Impacts of Consuming Imported versus Domestically Produced Food,” Environmental & Resource Economics 58(3):415-462.
Barham, J., D. Tropp, K. Enterline, J. Farbman, J. Fisk, and S. Kiraly. 2012. Regional Food Hub Resource Guide. U.S. Dept. of Agriculture, Agricultural Marketing Service.
Bean, M., and J.S. Sharp. 2011. “Profiling alternative food system supporters: The personal and social basis of local and organic food support,” Renewable Agriculture and Food Systems 26(3):243-254.
Becot, F., V. Nickerson, D. Conner, and J. Kolodinsky. 2012. “Costs of Food Safety Certification on Fresh Produce Farms in Vermont,” HortTechnology 22(5):705-714.
Biermacher, J., S. Upson, D. Miller, and D. Pittman. 2007. “Economic Challenges of Small-Scale Vegetable Production and Retailing in Rural Communities: An Example from Rural Oklahoma,” Journal of Food Distribution Research 38(3):1-13.

65 Trends in U.S. Local and Regional Food Systems: A Report to Congress, AP-068
Economic Research Service/USDA
Bingen, J., J. Sage, and L. Sirieix. 2010. “Consumer coping strategies of eating local,” Proceedings of Innovation and Sustainable Development in Agriculture and Food, Montpellier, France, June 28-July 1.
Bingen, J., J. Sage, and L. Sirieix. 2011. “Consumer coping strategies: a study of consumers committed to eating local,” International Journal of Consumer Studies 35(4):410-419.
Blanck, H.M., O.M. Thompson, L. Nebeling, and A.L. Yaroch. 2011. “Improving fruit and vegetable consumption: Use of farm-to-consumer venues among US adults,” Preventing Chronic Disease 8(2).
Bovey, J. and D.A. Sumner. 2013. “How does the Food Safety Modernization Act Affect Farms and Food Marketing Firms?” OreCal Issues Brief, 007. March.
Boys, K. A., 2013. “Food Product Liability Insurance: Implications for the Marketing of Specialty Crops,” Choices 28(4).
Boys, K.A. and D.W. Hughes. 2013. “A Regional Economics-Based Research Agenda for Local Food Systems,” Journal of Agriculture, Food Systems, and Community Development 3(4):145-150.
Briggs, S., A. Fisher, M. Lott, S. Miller, & N. Tessman. 2010. Real Food, Real Choice: Connecting SNAP Recipients with Farmers Markets. Community Food Security Coalition & Farmers Market Coalition. Available at: http://cclhdn.org/wp-content/uploads/2013/02/RealFoodRealChoice_SNAP_FarmersMarkets.pdf (accessed June 2014).
Brown, A., 2002. “Farmers’ market research 1940–2000: an inventory and review,” American Journal of Alternative Agriculture 17(4):167-176.
Brown, C. 2003. “Consumers’ Preferences for Locally Produced Food: A Study in Southeast Missouri,” American Journal of Alternative Agriculture 18(4):213-224.
Brown, C., Miller, S., Boone, D., Boone, H., Gartin, S., and McConnell, T. 2007. “The importance of farmers’ markets for West Virginia direct marketers,” Renewable Agriculture and Food Systems 22(1):20–29.
Brown, D. and Reeder, R. 2007. Farm-Based Recreation: A Statistical Profile, ERR-53, U.S. Department of Agriculture, Economic Research Service, December 2007.
Brown, J.P., S.J. Goetz, M.C. Ahearn, and C. Liang. Forthcoming. “Linkages Between Community-Focused Agriculture, Farm-Sales, and Regional Growth,” Economic Development Quarterly.
Burnett, P., T.H. Kuethe, C. Price. 2011. “Consumer preference for locally grown produce: an analysis of willingness-to-pay and geographic scale,” Journal of Agriculture, Food Systems and Community Development 2(1):269-278.
Buzby, J. C., Wells, H. F., & Hyman, J. 2014. The Estimated Amount, Value, and Calories of Postharvest Food Losses at the Retail and Consumer Levels in the United States, EIB-121, U.S. Department of Agriculture, Economic Research Service, February 2014.

66 Trends in U.S. Local and Regional Food Systems: A Report to Congress, AP-068
Economic Research Service/USDA
Calvin, L. 2007. “Outbreak Linked to Spinach Forces Reassessment of Food Safety Practices,” Amber Waves, U.S. Department of Agriculture, Economic Research Service, June 2007. http://www.ers.usda.gov/AmberWaves/June07/Features/Spinach.htm (accessed June 2014).
Calvin, L. 2013. The Food Safety Modernization Act and the Produce Rule, VGS-353-SA2, U.S. Department of Agriculture, Economic Research Service, March 2013. Available at: http://usda.mannlib.cornell.edu/usda/ers/VGS//2010s/2013/VGS-03-29-2013.pdf (accessed April 2013).
Calvin, L., B. Avendaño, and R. Schwentesius. 2004. The Economics of Food Safety: The Case of Green Onions and Hepatitis A Outbreaks, VGS-305-01, U.S. Department of Agriculture, Economic Research Service, December 2004. Available at: http://www.publications/vgs/nov04/vgs30501/vgs30501.pdf (accessed June 2014).
Canning, P., Charles, A., Huang, S., Polenske, K. R., & Waters, A. 2010. Energy Use in the U.S. Food System, ERR-94, U.S. Department of Agriculture, Economic Research Service, March 2010.
Chambers, S., A. Lobb, L. Butler, K. Harvey, and W.B. Traill. 2007. “Local, National and Imported Foods: A Qualitative Study,” Appetite 49(1):208-213.
Chite, R.M. The 2014 Farm Bill (P.L. 113-79): Summary and Side-by-Side, R43076, Congressional Research Service, February 2014. Available at: http://www.farmland.org/programs/federal/docu-ments/2014_0213_CRS_FarmBillSummary.pdf (accessed June 2014).
Claro, J. January 2011. “Vermont Farmers’ Markets and Grocery Stores: A Price Comparison,” Northeast Organic Farming Association of Vermont.
Colasanti, K.J.A., D.S. Conner, and S.B. Smalley. 2010. “Understanding barriers to farmers’ market patronage in Michigan: Perspectives from marginalized populations,” Journal of Hunger and Environmental Nutrition 5(3):316-338.
Coley, D., Howard, M., & Winter, M. 2009. “Local Food, Food Miles and Carbon Emissions: A Comparison of Farm Shop and Mass Distribution Approaches,” Food Policy 34(2):150-155.
Conner, D., W. Knudson, M. Hamm, and H.C. Peterson. 2008. “The Food System as an Economic Driver: Strategies and Applications for Michigan,” Journal of Hunger & Environmental Nutrition 3(4):371-383.
Conner, D.S., S. B Smalley, K.J.A. Colasanti, and R.B. Ross. “Increasing Farmers’ Market Patronage: A Michigan Survey,” Journal of Food Distribution Research 41(2):26-45.
Costanigro, M., S. Kroll, D. Thilmany, and M. Bunning, M. 2014. “Is it love for local/organic or hate for conventional? Asymmetric effects of information and taste on label preferences in an experi-mental auction,” Food Quality and Preference 31:94-105.
Crandall, P.G., E.C. Friedly, M. Patton, C.A. O’Bryan, A. Gurubaramurugeshan, S. Seideman, S. C. Ricke, and R. Rainey. 2011. “Consumer awareness of and safety concerns about food safety at three Arkansas farmers’ markets,” Food Protection Trends 31(3):156-165.

67 Trends in U.S. Local and Regional Food Systems: A Report to Congress, AP-068
Economic Research Service/USDA
Curtis, K. and M. Cowee. 2009. “Direct Marketing Local Food to Chefs: Chef Preferences and Perceived Obstacles,” Journal of Food Distribution Research 40(2):26-36.
Dubrovsky, N.M., K.R. Burow, G.M. Clark, J.A.M. Gronberg, P.A. Hamilton, K.J. Hitt, D.K. Mueller, M.D. Munn, L.J. Puckett, B.T. Nolan, M.G. Rupert, T.M. Short, N.E. Spahr, L.A. Sprague, and W. G. Wilbur. 2010. The Quality of Our Nation’s Waters - Nutrients in the Nation’s Streams and Groundwater, 1992-2004, Circular-1350, U.S. Geological Survey.
Durham, C., J. Miller, H. Mannenbach, K. Anderson, and L. Eng. 2011. “Industry and Firm Strategies for Good Agricultural Practices,” Journal of Food Distribution Research 42(1):34-39.
Feather, P., D. Hellerstein and L. Hansen, Economic Valuation of Environmental Benefits and the Targeting of Conservation Programs: The Case of the CRP, AER-778, U.S. Department of Agriculture, Economic Research Service, May 1999
Feenstra, G.W., C.C. Lewis, C.C. Hinrichs, G.W. Gillespie, and D. Hilchey. 2003. “Entrepreneurial Outcomes and Enterprise Size in US Retail Farmers’ Markets,” American Journal of Alternative Agriculture 18(1):46-55.
Fischer, M., Hamm, M., Pirog, R., Fisk, J., Farbman, J., and Kiraly, S. 2013. Findings of the 2013 National Food Hub Survey. Michigan State University Center for Regional Food Systems and The Wallace Center at Winrock International. http://foodsystems.msu.edu/activities/food-hub-survey (accessed June 2014).
Harmon, A.H. and B.L. Gerald. “Food and Nutrition Professionals Can Implement Practices to Conserve Natural Resources and Support Ecological Sustainability,” Journal of the American Dietetic Association 107(6):1033-1043.
Food Marketing Institute. 2011. U.S. Grocery Shopper Trends, Food Marketing Institute: Arlington, VA.
Fotopoulos, G. and H. Louri, 2000, “Determinants of Hazard Confronting New Entry: Does Financial Structure Matter?” Review of Industrial Organization 17(3):285-300.
Gillespie, G.W., D. Hilchey, C.C. Hinrichs, and G.W. Feenstra. 2007. “Farmers’ Markets as Keystones in Rebuilding Local and Regional Food Systems,” in Remaking the North American Food System: Strategies for Sustainability, C.C. Hinrichs and T.A. Lyson, eds. Lincoln, NE: University of Nebraska Press.
Gimeno, J., T.B. Folta, A.C. Cooper, and C.Y. Woo. 1997. “Survival of the fittest? Entrepreneurial human capital and the persistence of underperforming firms,” Administrative Science Quarterly 42(4):750-783.
Greene, C., C. Dimtri, B.H. Lin, W. McBride, L. Oberholtzer, & T. Smith. 2009. Emerging Issues in the U.S. Organic Industry, ERR-55, U.S. Department of Agriculture, Economic Research Service, June 2009. Available at: http://www.ers.usda.gov/publications/eib-economic-informa-tion-bulletin/eib55.aspx#.U_YeHfldXxU (accessed June 2014).
Grubinger, V. 2010. “Ten Reasons to Buy Local Food,” http://www.uvm.edu/vtvegandberry/fact-sheets/buylocal.html (accessed June 26, 2014).

68 Trends in U.S. Local and Regional Food Systems: A Report to Congress, AP-068
Economic Research Service/USDA
Gu, M. 2009. High Tunnel or Greenhouse?, Information Sheet. Mississippi State University, MS, USA.
Gunter, A. and D. Thilmany. 2012. “Economic implications of farm to school for a rural Colorado community,” Rural Connections: A Publication of the Western Rural Development Center, 6(2):13-16.
Guptill, A. and J.L. Wilkins. 2002. “Buying into the food system: Trends in food retailing in the US and implications for local foods,” Agriculture and Human Values 19(1):39-51.
Gwin, L. and A. Thiboumery. 2013. “Local Meat Processing: Business Strategies and Policy Angles,” Vermont Law Review 37:987.
Gwin, L., A. Thibournery, and R. Stillman. 2013. Local Meat and Poultry Processing: The importance of Business Commitments for Long-Term Viability, ERR-150, U.S. Department of Agriculture, Economic Research Service, June 2013.
Hamilton, B.H. 2000. “Does Entrepreneurship Pay? An Empirical Analysis of the Returns to Self-employment,” Journal of Political Economy 108(3):604-631.
Hardesty, S. and Y. Kusunose. 2009. “Growers’ Compliance Costs for Leafy Greens Marketing Agreement and Other Food Safety Programs,” University of California Small Farm Program Research Brief. September 2009. Available at: http://sfp.ucdavis.edu/files/143911.pdf (accessed April 2014).
Hardesty, S.D., and P. Leff. 2010. “Determining Marketing Costs and Returns in Alternative Marketing Channels,” Renewable Agriculture and Food Systems 25(1):24-34.
Hellerstein, D., C. Nickerson, J. Cooper, P. Feather, D. Gadsby, D. Mullarkey, A. Tegene, C. Barnard. Farmland Protection: The Role of Public Preferences for Rural Amenities, AER-815, U.S. Department of Agriculture, Economic Research Service, October 2002.
Hendrickson, J. 2008. Energy Use in the U.S. Food System: A Summary of Existing Research and Analysis, Center for Integrated Agricultural Systems, University of Wisconsin – Madison, Madison, WI.
Henneberry, S.R., B. Whitacre, and H.N. Agustini. 2009. “An Evaluation of the Economic Impacts of Oklahoma Farmers Markets,” Journal of Food Distribution Research 40(3):64-78.
Hinrichs, C.C. and L. Charles. 2012. “Local Food Systems and Networks in the US and UK,” in Rural Transformations and Rural Policies in the US and UK, M. Shucksmith, D.L. Brown, S. Shortall, J. Vergunst, and M.E. Warner, eds. Routledge Studies in Development and Society. New York: Routledge.
Hinrichs, C.C., G.W. Gilespie, and G.W. Feenstra. 2004. “Social learning and innovation at retail farmers’ markets,” Rural Sociology 69(1):31-58.
Holcomb, R., M. Palma, and M. Velandia. 2013. “Food Safety Policies and Implications for Local Food Systems,” Choices 28(4):1-4.

69 Trends in U.S. Local and Regional Food Systems: A Report to Congress, AP-068
Economic Research Service/USDA
Holmes, T.J. and R.L. Yan. 2012. “Predicting consumers’ preferences for and likely buying of local and organic produce: results of a choice experiment,” Journal of Food Products Marketing 18(5):369-384.
Hood, C., A. Martinez-Donate, & A. Meinen. 2012. “Promoting Healthy Food Consumption: A Review of State-Level Policies to Improve Access to Fruits and Vegetables,” Wisconsin Medical Journal, 111(6):283-288.
Hoppe, R. and J. MacDonald. 2013. Updating the ERS Farm Typology, EIB-110, U.S. Department of Agriculture, Economic Research Service, April 2013.
Hu, W., M. Batte, T. Woods, and S. Ernst. 2012. “Consumer preferences for local production and other value-added label claims for a processed food product,” European Review of Agricultural Economics 39(3):489-510.
Huang, C.L., and B. Lin. 2007. “A Hedonic Analysis of Fresh Tomato Prices among Regional Markets,” Review of Agricultural Economics 29:783-800.
Huang, E., M.B. Gregoire, C. Tangney, and M.K. Stone. 2011. “Sustainability in Hospital Foodservice,” Journal of Foodservice Business Research 14(3):241-255.
Hughes, D.W., C. Brown, S. Miller, and T. McConnell. 2008. “Evaluating the Economic Impact of Farmers’ Markets Using an Opportunity Cost Framework,” Journal of Agricultural and Applied Economics 40(1):253-265
Hultberg, A., M. Schermann, and C. Tong. 2012. “Results from a Mail Survey to Assess Minnesota Vegetable Growers’ Adherence to Good Agricultural Practices,” HortTechnology 22(1):83-88. February 2012.
Jablonski, B.B.R. 2014. “Evaluating the Impact of Farmers’ Markets Using a Rural Wealth Creation Approach,” in J.L. Pender, T.G. Johnson, B. Weber, and J.M. Fannin, eds. Rural Wealth Creation. New York: Routledge.
Jablonski, B.B.R., J. Perez-Burgos, and M.I. Gómez. 2011. “Food Value Chain Development in Central New York: CNY Bounty,” Journal of Agriculture, Food Systems, and Community Development 1(4):129-141.
Jackson-Smith, D. and J. Sharp. 2008. “Farming in the Urban Shadow: Supporting Agriculture at the Rural-Urban Interface,” Rural Realities 2(4):1-12.
James, J., B. Rickard, and W. Rossman. 2009. “Product Differentiation and Market Segmentation in Applesauce: Using a Choice Experiment to Assess the Value of Organic, Local, and Nutrition Attributes,” Agricultural and Resource Economics Review (38)3:357-370.
Johns Hopkins Center for a Livable Future. “Food Policy Council (FPC) Directory,” Johns Hopkins School of Public Health, Baltimore, MD. http://www.jhsph.edu/research/centers-and-institutes/johns-hopkins-center-for-a-livable-future/projects/FPN/directory/index.html (accessed June 2014).

70 Trends in U.S. Local and Regional Food Systems: A Report to Congress, AP-068
Economic Research Service/USDA
Johnson, R. J., D.L. Marti, and L. Gwin. 2012. Slaughter and Processing Options and Issues for Locally Sourced Meat, LDP-M-216-01, U.S. Department of Agriculture, Economic Research Service, June 2014. Available at: http://ers.usda.gov/media/820188/ldpm216-01.pdf (accessed June 2014).
Karakus, M., K. MacAllum, R. Milfort, and H. Hao. 2014. Nutrition Assistance in Farmers Markets: Understanding the Shopping Patterns of SNAP Participants. Prepared by Westat for the U.S. Department of Agriculture, Food and Nutrition Service, September. Available at: www.fns.usda.gov/research-and-analysis (accessed October, 2014).
Key, N. and M.J. Roberts. 2009. “Nonpecuniary Benefits to Farming: Implications for Supply Response to Decoupled Payments,” American Journal of Agricultural Economics 91(1):1-18.
King, R., M. Hand, G. DiGiacomo, K. Clancy, M. Gomez, S. Hardesty, L. Lev, and E. McLaughlin. 2010. Comparing the Structure, Size, and Performance of Local and Mainstream Food Supply Chains, ERR-99, U.S. Department of Agriculture, Economic Research Service, June 2010. Available at: http://www.ers.usda.gov/publications/err-economic-research-report/err99.aspx#.U_YjsvldXxU (accessed June 2014).
Klavinski, R. 2013. “7 Benefits of Eating Local Foods.” http://msue.anr.msu.edu/news/7_benefits_of_eating_local_foods (accessed June 26, 2014).
Kremen, A., C. Greene, & J. Hanson. 2004. Organic Produce, Price Premiums, and Eco-labeling in U.S. Farmers’ Markets, VGS-301-01, U.S. Department of Agriculture, Economic Research Service, April 2004. Available at: http://www.ers.usda.gov/publications/vgs-vegetables-and-pulses-outlook/vgs-301-01.aspx#.U_YkbvldXxU (accessed June 2014).
Leafy Greens Marketing Agreement. “California Leafy Green Products Handler Marketing Agreement.” http://www.caleafygreens.ca.gov/ (accessed April 2014).
Leafy Greens Marketing Agreement. California Leafy Green Products Handler Marketing Agreement, 2011/12 Annual Report. http://www.lgma.ca.gov/sites/default/files/11.12%20CALGMA%20Annual%20Report%20sml_0.pdf (accessed June 2014).
LeRoux, M.N., T.M. Schmit, M. Roth, and D.H. Streeter. 2010. “Evaluating Marketing Channel Options for Small-Scale Fruit and Vegetable Producers,” Renewable Agriculture and Food Systems 25(1):16-23
Lev, L., Brewer, L. and Stephenson, G. 2003. How Do Farmers Markets Affect Neighboring Businesses? Corvallis, OR: Oregon State University Extension Service.
Lichter, D.T., and D.L. Brown. 2011. “Rural America in an Urban Society: Changing Spatial and Social Boundaries,” Annual Review of Sociology 37(1):565-592.
Lin, B., T.A. Smith, and C.L. Huang. 2008. “Organic Premiums of U.S. Fresh Produce,” Renewable Agriculture and Food Systems 23:208-216.
Lohr, L., A. Diamond, C. Dicken, and D. Marquardt. 2011. Mapping Competition Zones for Vendors and Customers in U.S. Farmers Markets. U.S. Department of Agriculture, Agricultural Marketing Service.

71 Trends in U.S. Local and Regional Food Systems: A Report to Congress, AP-068
Economic Research Service/USDA
Low, S.A., and S. Vogel. 2011. Direct and Intermediated Marketing of Local Foods in the United States, ERR-128, U.S. Department of Agriculture, Economic Research Service, November 2011. Available at: http://www.ers.usda.gov/publications/err-economic-research-report/err128.aspx#.U_YljfldXxU (accessed June 2014).
Malone, T., and B. Whitacre. 2012. “How Rural Is Our Local Food Policy,” The Daily Yonder. http://www.dailyyonder.com/local-food-policy-it-it-truly-focussed-rural/2012/08/24/4364 (accessed October 23, 2012).
Mansury, Y. and T. Hara. 2007. “Impacts of Organic Food Agritourism on a Small Rural Economy: A Social Accounting Matrix Approach,” The Journal of Regional Analysis and Policy 37(3):213-222.
Maples, M., K.L. Morgan, M.G. Interis, and A. Harri. 2013. “Who Buys Food Directly from Producers in the Southeastern United States?” Journal of Agricultural and Applied Economics 45(3).
Marsh, K., and B. Bugusu. 2007. “Food Packaging—Roles, Materials, and Environmental Issues,” Journal of Food Science 72(3):R39-R55.
Martinez, M., M. Hand, M. Da Pra, S. Pollack, K. Ralston, T. Smith, S. Vogel, S. Clark, L. Lohr, S. Low, and C. Newman. May 2010. Local Food Systems: Concepts, Impacts, and Issues, ERR-97, U.S. Department of Agriculture, Economic Research Service, May 2010. Available at: http://www.ers.usda.gov/publications/err-economic-research-report/err97.aspx#.U5H7SHJdVyw (accessed April 2014).
Matteson, G. and A.R. Hunt. 2012. The Emergence of Retail Agriculture: Its Outlook, Capital Needs, and Role in Supporting Young, Beginning, and Small Farmers, Report to the Farm Credit Council prepared by Local Food Strategies LLC, Farm Credit Council, Washington, DC. Available at: http://fccouncil.com/wp-content/uploads/2012/10/Emergence_of_Retail_Ag_-_2012_Revisions_for__web.pdf (accessed May 2014).
Mayes, L.M. 2013. “Nutrition knowledge and dietary habits of farmers’ market patrons,” World Applied Sciences Journal, Vol. 23, Issue 2, pp. 267-271.
McCormack, L.A., M.N. Laska, N.I. Larson, and M. Story. 2010. “Review of the Nutritional Implications of Farmers’ Markets and Community Gardens: A Call for Evaluation and Research Efforts,” Journal of the American Dietetic Association 110: 399-408.
McGuirt, J.T., S.B. Jilcott Pitts, R. Ward, T.W. Crawford, T.C. Keyserling, and A.S. Ammerman. 2014. “Examining the Influence of Price and Accessibility on Willingness to Shop at Farmers’ Markets among Low-income Eastern North Carolina Women,” Journal of Nutrition Education and Behavior 46(1):26-33.
McGuirt, J.T., S.B. Jilcott, H. Liu, and A.S. Ammerman. 2011. “Produce Price Savings for Consumers at Farmers’ Markets Compared to Supermarkets in North Carolina,” Journal of Hunger and Environmental Nutrition 6:86-98.
Morgan, T. K., and D. Alipoe. 2001. “Factors affecting the number and type of small-farm direct marketing outlets in Mississippi,” Journal of Food Distribution Research 32(1):125-132.

72 Trends in U.S. Local and Regional Food Systems: A Report to Congress, AP-068
Economic Research Service/USDA
Muth, M. K., Wohlgenant, M. K., & Karns, S. A. 2007. “Did the pathogen reduction and HACCP regulation cause slaughter plants to exit?” Review of Agricultural Economics 29(3):596-611.
National Conference of State Legislatures. 2014a. “Farmers’ Market,” National Conference of State Legislatures, Washington, DC, February 2014. http://www.ncsl.org/research/agriculture-and-rural-development/farmers-market.aspx (accessed June 2014).
National Conference of State Legislatures. 2014b. “Urban Agriculture State Legislation,” National Conference of State Legislatures, Washington, DC, February 2014. http://www.ncsl.org/research/agriculture-and-rural-development/urban-agriculture-state-legislation.aspx (accessed June 2014).
National Conference of State Legislatures. 2014c. “State Statutes and Programs Concerning Community Gardens,” National Conference of State Legislatures, Washington, DC, March 2014. http://www.ncsl.org/research/agriculture-and-rural-development/community-gardens-state-stat-utes-and-programs.aspx (accessed June 2014).
National Farm to School Network and Vermont Law School Center for Agriculture and Food Systems. 2014. State Farm to School Legislative Survey: 2002-2013. Available at: http://www.farmtoschool.org/resources-main/statelegisativesurvey
National Sustainable Agriculture Coalition. 2014. “2014 Farm Bill Drilldown: Local and Regional Food Systems, Healthy Food Access, and Rural Development,” National Sustainable Agriculture Coalition, Washington, DC, February 2014. http://sustainableagriculture.net/blog/2014-farm-bill-local-rd-organic/ (accessed June 2014).
Neuner, K., S. Kelly, and S. Raja. 2011. Planning to Eat? Innovative Local Government Plans and Policies to Build Healthy Food Systems in the United States, Food Systems and Healthy Communities Lab at the University at Buffalo, The State University of New York, Buffalo, NY. Available at: http://foodsystemsplanning.ap.buffalo.edu/wp-content/uploads/2012/08/planning-toeat5.pdf (accessed June 2014).
Nickerson, C., R. Ebel, A. Borchers, and F. Carriazo. 2011. Major Uses of Land in the United States, 2007, EIB-89, U.S. Department of Agriculture, Economic Research Service, December 2011. Available at: http://www.ers.usda.gov/publications/eib-economic-information-bulletin/eib89.aspx#.U_YpGPldXxU (accessed May 2014).
Nielsen. 2009. Personal communication, New York, NY, February 19.
Natural Resources Conservation Service. 2014. “High Tunnel Initiative,” U.S. Department of Agriculture, Natural Resources Conservation Service, Washington, DC. http://www.nrcs.usda.gov/wps/portal/nrcs/detail/ma/home/?cid=nrcs144p2_013946 (accessed May 15, 2014).
O’Hara, J., and R. Pirog. 2013. “Economic impacts of local food systems: Future research priorities,” Journal of Agriculture, Food Systems, and Community Development 3(4):35-42.
Onozaka, Y.; Nurse, G.; Thilmany, D.D. 2010 “Local Food Consumers: How Motivations and Perceptions Translate to Buying Behavior,” Choices 25(1).

73 Trends in U.S. Local and Regional Food Systems: A Report to Congress, AP-068
Economic Research Service/USDA
Onozaka, Y. and D. Thilmany-McFadden. 2012. “Does Local Labeling Complement or Compete With Other Sustainable Labels? A Conjoint Analysis of Direct and Joint Values for Fresh Produce Claims,” American Journal of Agricultural Economics 93(3):693-706.
Otto, D. 2010. Consumers, vendors, and the economic importance of Iowa farmers’ markets: An economic impact survey analysis, Strategic Economics Group, Ames, Iowa. Available at: www.agriculture.state.ia.us/Horticulture_and_FarmersMarkets/pdfs/FarmersMarketsEIS2009.pdf (accessed January 2014).
Paggi, M., F. Yamazaki, L. Ribera, R. Knutson, J. Anciso, M. Palma, and J. Noel. 2010. “Comparative Producer Costs of GAP and GHP Standards: Can the Playing Field Be Made Level?” selected paper, 1st Joint Seminar of the Economics of Food, Food Choice and Health/Agricultural and Applies Economics, Freising, Germany, September 2010.
Palma, M., L. Ribera, M. Paggi, and R. Knutson. 2010. “Food Safety Standards for the U.S. Fresh Produce Industry,” Policy Issues (8):1-6.
Parker, J., R. Wilson, J. Lejeune, and D. Doohan. 2012.“Including growers in the “food safety” conversation: enhancing the design and implementation of food safety programming based on farm and marketing needs of fresh fruit and vegetable producers,” Agriculture and Human Values 29(3):303-319.
Parker, J., R. Wilson, J. Lejeune, L. Rivers III, and D. Doohan. 2012. “An expert guide to under-standing grower decisions related to fresh fruit and vegetable contamination and control,” Food Control 26(1):107-116.
Prenguber, B. and A. Gilroy. 2013. A First Look at Produce Safety Costs on Oregon’s Small and Medium Fresh Fruit and Vegetable Farms, Oregon Public Health Institute. Available at: http://www.ophi.org/download/PDF/producesafety_paper_final_OPHI.pdf (accessed April 2014).
Produce Safety Alliance. 2014. “Product Safety Alliance Cooperative Agreement,” Cornell University, Ithaca, NY. http://producesafetyalliance.cornell.edu/about.html (accessed June 2014).
Racine, E.F., E.A. Mumford, S.B. Laditka, and A.E. Lowe. 2013. “Understanding characteristics of families who buy local produce,” Journal of Nutrition Education and Behavior 45(2).
Rainey, R., P.G. Crandall, C.A. O’Bryan, S.C. Ricke, S. Pendleton, and S. Seideman. 2011. “Marketing locally produced organic foods in three metropolitan Arkansas farmers’ markets: Consumer opinions and food safety concerns,” Journal of Agricultural and Food Information 12(2):141-153.
Reynolds-Allie, K. and D. Fields, 2012. “A Comparative Analysis of Alabama Restaurants: Local vs. Non-local Food Purchase,” Journal of Food Distribution Research 43(1).
Ribera, L. A. and R. D. Knutson (2011). “The FDA’s food safety modernization act and its economic implications,” Choices 26(4):16-21.
Ruth-McSwain, A. 2012. “Eating Green: Coverage of the Locavore Movement,” Journal of Extension 50(5).

74 Trends in U.S. Local and Regional Food Systems: A Report to Congress, AP-068
Economic Research Service/USDA
Sadler, R.C., M.A.R. Clark, J.A. Gilliland. 2013. “An economic impact comparative analysis of farmers’ markets in Michigan and Ontario,” Journal of Agriculture, Food Systems, and Community Development. Advance online publication: http://dx.doi.org/10.5304/jafscd.2013.033.009
Schmidt, T. and S. Hadcock. 2012. “Assessing Barriers to Expansion of Farm-to-Chef Sales: A Case Study from Upstate New York,” Journal of Food Research 1(1):117-125.
Schmit, T.M., B.B.R. Jablonski, and Y. Mansury. 2013. “Impacts of Local Food System Activities by Small Direct-to-Consumer Producers in a Regional Economy: a Case Study from Upstate NY,” Working Paper 13-16, Dyson School of Applied Economics and Management, Cornell University.
Schmit, T.M., and M.I. Gómez. 2011. “Developing Viable Farmers Markets in Rural Communities: An Investigation of Vendor Performance Using Objective and Subjective Valuations,” Food Policy 36(2):119-127.
Sommer, R., M. Wing, and S. Aitkens. 1980. “Price Savings to Consumers at Farmers’ Markets,” The Journal of Consumer Affairs 14(2):452-462.
Strotmann, H. 2007. “Entrepreneurial Survival,” Small Business Economics 28:87-104.
Swenson, D. 2008. Estimating the Production and Market-Value Based Impacts of Nutritional Goals in NE Iowa, Leopold Center for Sustainable Agriculture, Ames, Iowa.
Swenson, D. 2009. Investigating the Potential Economic Impacts of Local Foods for Southeast Iowa, Leopold Center for Sustainable Agriculture, Ames, Iowa.
Swenson, D. 2010. “The Economic Impact of Fruit and Vegetable Production in Southwest Iowa Considering Local and Nearby Metropolitan Markets,” Iowa State University.
Swenson, D. 2011. Measuring the Economic Impacts of Increasing Fresh Fruit and Vegetable Production in Iowa Considering Metropolitan Demand, Leopold Center for Sustainable Agriculture, Ames, Iowa.
Thilmany, D. 2004. “Colorado Crop to Cuisine,” Applied Economic Perspectives and Policy 26(3):404-416.
Trivette, S.A. 2012. Farm-to-Fork: Understanding Locally-Oriented Farm-to-Vendor Food Systems: Access, Boundaries, and Power-Relations, University of Massachusetts-Amherst, Amherst, MA.
Tuck, B., M. Haynes, R. King, and R. Pesch. 2010. The economic impact of farm-to-school lunch programs: A Central Minnesota example, The University of Minnesota. Available at: http://www.extension.umn.edu/food/farm-to-school/research/farm-to-school/docs/cfans_asset_289518-1.pdf. (accessed May 2014).
Tveteras, R. and G. E. Eide. 2000. “Survival of New Plants in Different Industry Environments in Norwegian Manufacturing: A Semi-Proportional Cox Model Approach,” Small Business Economics 14(1):65-82.

75 Trends in U.S. Local and Regional Food Systems: A Report to Congress, AP-068
Economic Research Service/USDA
U.S. Department of Agriculture. 2012. U.S. Census of Agriculture, National Agricultural Statistics Service. Available at: http://www.agcensus.usda.gov/Publications/ (accessed May 2014).
U.S. Department of Agriculture. 2014. “Local Food Promotion Program (LFPP),” Agricultural Marketing Service, May 2014. http://www.ams.usda.gov/AMSv1.0/LFPP (accessed June 2014).
U.S. Department of Agriculture. Fresh Fruit and Vegetable Audit Programs, Agricultural Marketing Service. Available at: http://www.ams.usda.gov/AMSv1.0/ams.fetchTemplateData.do?template=TemplateN&page=GAPGHPAuditVerificationProgram (accessed April 2014).
U.S. Department of Agriculture. National Organic Program; Final Rule, 7 CFR Part 205, Federal Register, Agricultural Marketing Service, December 21, 2000. Available at: http://www.ecfr.gov/cgi-bin/text-idx?SID=fa22079b82cae59bb7eaaea541f21c02&node=7:3.1.1.9.32&rgn=div5
U.S. Department of Agriculture. 2014. “Agricultural Act of 2014: Highlights and Implications,” Economic Research Service, April 2014. http://www.ers.usda.gov/agricultural-act-of-2014-high-lights-and-implications.aspx (accessed June 2014).
U.S. Department of Agriculture. 2014. Livestock Dairy and Poultry Outlook May 2014, Economic Research Service, May 2014. Available at: http://www.ers.usda.gov/ersDownloadHandler.ashx?file=/media/1423413/ldp239.pdf (accessed on June 11, 2014).
U.S. Department of Agriculture. 2014. Environmental Benefits of the Conservation Reserve Program, Farm Service Agency. Available at: http://www.fsa.usda.gov/Internet/FSA_File/us_benefits_2013.pdf
U.S. Department of Agriculture. “USDA Enhances Farm Storage Facility Loan Program,” Release No. 0042.14, Farm Service Agency, March 2014. Available at: http://www.fsa.usda.gov/FSA/newsReleases?area=newsroom&subject=landing&topic=ner&newstype=newsrel&type=detail&item=nr_20140310_rel_0042.html (accessed June 2014).
U.S. Department of Agriculture. 2014. Farm to School Census, Food and Nutrition Service. Available at: http://www.fns.usda.gov/farmtoschool/census/#/, accessed May 30, 2014.
U.S. Department of Agriculture. SNAP Retailer Management 2013 Annual Report, Food and Nutrition Service. Available at: http://www.fns.usda.gov/pd/supplemental-nutrition-assistance-program-snap (accessed June 2014).
U.S. Department of Agriculture. 2013. Livestock Slaughter 2013 Summary, National Agricultural Statistics Service. Available at: http://usda.mannlib.cornell.edu/usda/current/PoulSlauSu/PoulSlauSu-02-25-2014.pdf (accessed on June 11, 2014).
U.S. Department of Agriculture. 2014. Poultry Slaughter 2013 Summary, National Agricultural Statistics Service. Available at: http://usda.mannlib.cornell.edu/usda/current/LiveSlauSu/LiveSlauSu-04-21-2014.pdf (accessed on June 11, 2014).
U.S. Department of Agriculture. 2013. “Agriculture Secretary Tom Vilsack Highlights Economic Opportunity and Job Creation of Regional Food Hubs: Discusses USDA’s efforts to build strong local and regional food systems,” News Release No. 0107.13, Office of Communications. http://
76 Trends in U.S. Local and Regional Food Systems: A Report to Congress, AP-068
Economic Research Service/USDA
www.usda.gov/wps/portal/usda/usdamediafb?contentid=2013/05/0107.xml&printable=true&contentidonly=true (accessed May 20, 2013).
U.S. Department of Agriculture. 2006. Guidance for Determining Whether a Poultry Slaughter or Processing Operation is Exempt from Inspection Requirements of the Poultry Products Inspection Act, Food Safety Inspection Service. Available at: http://www.fsis.usda.gov/wps/wcm/connect/0c410cbe-9f0c-4981-86a3-a0e3e3229959/Poultry_Slaughter_Exemption_0406.pdf?MOD=AJPERES (accessed May 2014)
U.S. Department of Agriculture. 2012. HACCP Seven Principles, Food Safety Inspection Service. Available at: http://www.fsis.usda.gov/wps/wcm/connect/9bef6a34-d7ef-441e-8478-f431aee441cf/16_IM_HACCP_Principles.pdf?MOD=AJPERES (accessed May 2014)
U.S. Department of Agriculture. 2012. Know Your Farmer, Know Your Food, U.S. Department of Agriculture. Available at: http://www.usda.gov/documents/KYFCompass.pdf (accessed May 2014).
U.S. Department of Agriculture. 2014. World Agricultural Supply and Demand Estimates, World Agricultural Outlook Board. Available at: http://www.usda.gov/oce/commodity/wasde/latest.pdf (accessed on June 11, 2014).
U.S. Environmental Protection Agency. 2012. “Pasture, Rangeland, and Grazing Operations - Best Management Practices (BMPs),” U.S. Environmental Protection Agency. http://www.epa.gov/oecaagct/anprgbmp.html (accessed May 9, 2014).
U.S. Environmental Protection Agency. 2014. “Reducing Food Waste for Businesses,” U.S. Environmental Protection Agency. http://www.epa.gov/foodrecovery/ (accessed May 12, 2014).
U.S. Geological Survey. 2007. Investigating the Environmental Effects of Agriculture Practices on Natural Resources Fact Sheet (Vol. 2007), U.S. Geological Survey, Reston, VA.
University of Florida IFAS Extension. 2014. “Local Food in Sarasota County,” IFAS Extension, Florida. http://sarasota.ifas.ufl.edu/AG/localfood.shtml (accessed June 26, 2014).
Volpe, R.J., and N. Lavoie. 2008. “The Effect of Wal-Mart Supercenters on Grocery Prices in New England,” Applied Economic Perspectives and Policy 30(1):4-26.
Wallace Center Winrock International. 2012. USDA/Good Natured Family Farms Group GAP Pilot Project Report and Assessment, Wallace Center Winrock International. Available at: http://www.ngfn.org/resources/ngfn-database/knowledge/Wallace%20Center%20Group%20GAP%20Report%20December%202012%20with%20Appendices.pdf/view (accessed May 2014).
Wasserman, W. 2009. Services, Structures, and Self-Identified Needs of State Farmers Market Associations/Organizations, Farmers Market Coalition, Kimberton, PA. Available at: http://farmersmarketcoalition.org/resource/services-structures-and-self-identified-needs-of-state-farmers-market-associations/ (accessed June 2014).
Weber, C. L., and H.S. Matthews. 2008. “Food-Miles and the Relative Climate Impacts of Food Choices in the United States,” Environmental Science & Technology 42(10):3508-3513.

77 Trends in U.S. Local and Regional Food Systems: A Report to Congress, AP-068
Economic Research Service/USDA
Winterfeld, A., D. Shinkle, and L. Morandi. 2012. State Actions to Promote Healthy Communities and Prevent Childhood Obesity: Summary and Analysis of Trends in Legislation, National Conference of State Legislatures, Washington, DC.
Wolf, M.M., A. Spittler, and J. Ahern. 2005. “A Profile of Farmers’ Market Consumers and the Perceived Advantages of Produce Sold at Farmers’ Markets,” Journal of Food Distribution Research 36:192-201.
Woods, M., S. Thornsbury, and K. C. Raper. 2012. “Beyond Market Access: Value from Food Safety Certification of Fresh Strawberries,” Agribusiness: An International Journal 28(4):469-482.
Woods, M. and S. Thornsbury. 2005. Costs of Adopting Good Agricultural Practices (GAPs) to Ensure Food Safety in Fresh Strawberries, Agricultural Economics Report No. 624, Department of Agricultural Economics, Michigan State University.
Woods, Tim. 2013. “Market Demand for Local Meat,” Economic and Policy Update 13(5). http://www2.ca.uky.edu/cmspubsclass/files/bluesheet/Economic_and_Policy_Update_May2013.pdf (Accessed May 2014)
Yapp, C. and R. Fairman. 2006. “Factors Affecting Food Safety Compliance Within Small and Medium-Sized Enterprises: Implications for Regulatory and Compliance Strategies,” Food Control 17(1):42-51.
Zepeda, L. and C. Nie. 2012. “What are the odds of being an organic or local food shopper? Multivariate analysis of US food shopper lifestyle segments,” Agriculture and Human Values 29(4):467-480.

78 Trends in U.S. Local and Regional Food Systems: A Report to Congress, AP-068
Economic Research Service/USDA
Appendix: Variability in the 2008-11 ARMS Data and Developing Synthetic Estimates of Total Local Food Sales
The problem in estimating the total value of local food sales in the U.S. is twofold. First, although ARMS has generated annual estimates of the value of total local food sales since 2008, the annual estimates exhibit significant year-to-year variation. The ARMS estimates of the number of farms selling local foods through intermediated marketing channels are lower than the Census counts. Second, the 2012 Census of Agriculture benchmarks the number of local food farms using DTC and intermediated marketing channels, but only the value of sales through DTC marketing channels and not the value of local food sales through intermediated marketing channels.
To address this problem, we develop a synthetic estimate of the total value of sales, drawing on the strengths of both ARMS and the Census. The 2012 Census data provide geographically representa-tive benchmark counts of local food farms. The ARMS estimates provide more detail on the farm and farm operator, as well as the value of total local food sales.
This appendix is divided into two sections. The first section discusses sources of variation in the annual ARMS estimates and compares these estimates to the 2012 Census count of the number of local food farmers. The second section discusses the method for deriving our synthetic estimate and provides the synthetic estimates of total local food sales by farm size and marketing channel options, and by marketing channel options and farm production type.
Variation in the Annual ARMS Estimates, 2008-11
Beginning in 2008, the Agricultural Resource Management Survey (ARMS) has been surveying annually farmers who report producing and selling food commodities for human consumption through DTC and through intermediated marketing channels. For the 2008-11 period, ARMS esti-mated that, on average, 146,200 farmers marketed food locally, but annual estimates of local food farmers range from 107,200 (2008) to 231,900 (2010) (appendix table 1). Over this same period, annual sales of local foods were estimated to be almost $4.0 billion, on average, but annual esti-mates of local food sales ranged from $4.8 billion (2008) to $2.8 billion (2011).
This variation is likely due to: (i) growth and innovation in local food marketing channels have moved faster than the lead-time needed to adapt the ARMS questionnaire; and (ii) its mission and sample design are not geared to collecting data on small, niche sectors. ARMS surveys used two different methods to estimate local food sales, one in 2008 and 2009 and another in 2010 and 2011. In the 2008 and 2009 ARMS questionnaire, farmers were asked to identify specific market chan-nels they used, but report only total local food sales as a share total gross farm sales. Consequently, in 2008 and 2009, separate totals for DTC sales and intermediated sales could not be estimated, forcing us to report local food sales using the three discrete categories: sales through DTC channels only, through intermediated marketing channels only, or through both types of marketing channels. In the 2010 and 2011 ARMS, respondents were asked to report the value of local food sales linked to specific marketing channels. Differences between the 2008 and 2009 estimates and the 2010 and 2011 estimates suggest farmers may have overstated their local food sales when reporting sales as shares of total gross farm sales.

79 Trends in U.S. Local and Regional Food Systems: A Report to Congress, AP-068
Economic Research Service/USDA
The mission of ARMS is to provide an annual national-level quantitative snapshot of the financial condition, production practices, and resource use of America’s farm businesses and the economic well-being of America’s farm households. Although the ARMS multiframe, stratified design is a geographically representative sample of about 30,000 farms, its scope requires it to oversample the larger farms and farms in the 15 core States.54 Consequently, the sample may contain relatively few farms doing certain activities, and estimates of those activities may be subject to considerable error. Thus, if a region contains a large number of local food farms but ARMS obtains data only on a small number of them, then the estimate of the number of local food farms and local food sales could vary from the actual totals. A more refined survey targeting local food farms is the appro-priate data collection instrument.
A recent marketing channel innovation illustrates the difficulty of using ARMS as a blunt instrument to collect farm level data on local foods. For the first time, the 2011 ARMS asked farmers to report separately food sales to institutions such as schools, hospitals, and universities. ARMS results show no locally marketed food sold through these marketing channels. Yet, the USDA Farm to School Census of public school district food authorities recorded $385 million in farm to school sales for the 2011-12 school year (see pp. 39-42 for more results from the Farm to School Census).55 This discrepancy may have arisen because, according to the Farm to School Census, 75 percent of farm to school sales occurred in the Northeastern States, a region from which the 2011 ARMS sampled very few farms.56
Except for the 2008 ARMS, the estimates of marketing channels use by local food farmers in the ARMS estimates differ relative to the 2012 Census of Agriculture. The 2009-11 ARMS shares of local food farms using exclusively DTC marketing channels are 8-11 percentage points higher than the 70 percent share of these local food farms in the 2012 Census. The 2009-11 ARMS shares of local food farmers using intermediated marketing channels exclusively are 5-9 percentage points lower than the 14 percent share of these local food farms in the 2012 Census (appendix table 1). Since local food farms using DTC marketing channels exclusively have the lowest value of local food sales per farm relative to other marketing channels, the apparent over representation of these farmers and under representation of farmers using intermediated marketing channels imply that ARMS estimates of total local food sales may be too low.
Developing the Synthetic Estimates of Total Local Food Sales
We develop a synthetic estimate of the value of local food sales by accepting the 2012 Census local food farm counts and multiplying that number of farms by the ARMS estimates of local food sales
54The core agricultural States sampled by ARMS are Arkansas, California, Florida, Georgia, Illinois, Indiana, Iowa, Kansas, Minnesota, Missouri, Nebraska, North Carolina, Texas, Washington, and Wisconsin. Each farm in the ARMS is given a calibrated weight based on farm size, production specialty, region, and other criteria. For a particular year, the sum of the number of ARMS farms times their population weights equals the total number of farms benchmarked by the National Agricultural Statistics Service (NASS). NASS benchmarks annual ARMS totals based on Census. The ARMS population weights are currently being recalibrated to the 2012 Census figures.
55Note that this figure includes locally manufactured food and locally produced food marketed through conventional distributors, neither of which would have been captured by ARMS. But three quarters of farm to school districts reported buying local fruits and vegetables, and 4 in 10 reported buying directly from producers, suggesting that a different sam-pling design might have been more likely to capture some of these sales.
56Beginning 2013, ARMS survey design was changed to increase sample coverage among very small farms and ex-pand somewhat its geographic representativeness. Hence, it is anticipated that these improvements will reduce variation in future ARMS estimates of farmer participation in local and regional food systems. These data are not yet available.

80 Trends in U.S. Local and Regional Food Systems: A Report to Congress, AP-068
Economic Research Service/USDA
per farm by marketing channel type, in which the sales per farm are averages of the pooled 2008-11 ARMS data (table 4). This approach relies on the assumption that ARMS estimates of farm struc-ture expressed as shares or averages per unit are good estimates; that they do not exhibit the wide variation estimates of farm counts do. The synthetic estimates represent an alternative approxima-tion of the value of the local foods sector, an alternative that is likely more accurate than ARMS estimates.57 The synthetic estimates for each market channel option, when expressed as shares of total local food sales, are very close to the original shares of local food sales reported in Low and Vogel (2011), which used 2008 ARMS data (appendix table 1).
Census data on the number of farms by farm size, type of marketing channel employed, and produc-tion type allows us to generate two-way estimates of local food sales. The Hadamard product of the 2012 Census farm counts by farm size and marketing channel and the ARMS average estimates of local food sales per farm by farm size and market channel yields synthetic estimates of total local food sales for small, midsized, and large local food farmers using specific market channel options.58 These estimates are converted to shares of total local food sales by farm size and used in figure 5 (appendix table 2). The Hadamard product of the 2012 Census farm counts by farm size and farm production type and the ARMS average estimates of local food sales per farm by farm size and farm production type yields synthetic estimates of local food sales by farm size and farm production type. These estimates are also converted to shares of total local food sales by farm size and used in figure 6 (appendix table 3).
More disaggregated synthetic estimates of local food sales introduce measurement error such that the sum total of local foods sales in one two-way disaggregation does not equal the other. Instead, these two estimated totals, $5.8 billion in local food sales when disaggregated by market channel option and farm production type and $6.6 billion when disaggregated by farm size and market channel option, bookend the initial 2012 estimate of $6.1 billion in table 4 (appendix tables 3). Therefore, for the figures 5-6, the $6.1 billion estimate is used to scale the disaggregated totals, while retaining the information on farm structure as expressed as shares of local food farmers by farm size, market channel option, and farm production type.
57Developing trend measures of local and regional foods sales using data currently collected at the farm gate is still not possible.
58The Hadamard product is the matrix multiplication analog of basic multiplication: a∙b = c. It is a binary operation that takes two matrices of the same dimensions, and produces another matrix where each element ij is the product of ele-ments ij of the original two matrices: (A º B)i,j = (A)i,j ∙ (B)i,j = Ci,j. The two-way disaggregation of the number of local food farms and the local food sales per farm are 3×3 matrices for which element by element multiplication equals total local food sales for each ijth element in C in appendix tables 3 and 4.

81 Trends in U.S. Local and Regional Food Systems: A Report to Congress, AP-068
Economic Research Service/USDA
Appendix table 1
Number of local food farms and value of direct sales by marketing channel type, 2008-2011 ARMS and 2012 Census of Agriculture
Item
Year2008-11 average
2012 Census of
Agriculture*2008 2009 2010 2011
Number of farms
All farms reporting the value of their direct marketing sales 107,229 130,574 231,946 115,201 146,238 163,675
Direct to consumer sales only 71,248 104,150 186,915 93,691 114,001 115,304
Direct to consumer and intermediated market channel sales 22,603 14,707 34,003 13,490 21,201
25,756
Intermediated marketing channel sales only 13,378 11,717 11,028 8,020 11,036 22,615
Percent
All farms reporting the value of their direct sales 100 100 100 100 100 100
Direct to consumer sales only 66 80 81 81 78 70
Direct to consumer and intermediated market channel sales 21 11 15 12 14 16
Intermediated marketing channel sales only 12 9 5 7 8 14
$ millions
Value of direct marketing sales: 4,806 4,448 3,744 2,819 3,954 6,113
Direct to consumer sales only 887 1,456 1,241 647 1,058 1,152
Direct to consumer and intermediated market channel sales 1,199 1,787 1,195 1,107 1,322 1,612
Intermediated marketing channel sales only 2,720 1,205 1,307 1,065 1,575 3,349
Percent
Value of direct marketing sales: 100 100 100 100 100 100
Direct to consumer sales only 18 33 33 23 27 19
Direct to consumer and intermediated market channel sales 25 40 32 39 33 26
Intermediated marketing channel sales only 57 27 35 38 40 55
*Synthetic 2012 estimates (italics) of the total value of local food sold through each marketing channel type (see calculations in Table 4).Source: USDA, Economic Research Service/National Agricultural Statistics Service, Agricultural Resource Management Surveys (ARMS), 2008-2011; Economic Research Service analysis of USDA, National Agricultural Statistics Service, 2012 Census of Agriculture data.

82 Trends in U.S. Local and Regional Food Systems: A Report to Congress, AP-068
Economic Research Service/USDA
Appendix table 2
Developing synthetic 2012 estimates of local food sales by market channel option and farm size
Farm size class:
Item
GCFI under
$75,000
GCFI - $75,000 to $349,999
GCFI - $350,000 or more All
2012 Census - local food farms using: Number of farms
Direct-to-consumer channels only 102,826 8,743 3,735 115,304
Direct-to-consumer and intermediated marketing channels 19,503 4,401 1,852 25,756
Intermediated marketing channels only 16,269 3,466 2,880 22,615
All local food farms 138,598 16,610 8,467 163,675
multiplied by dollars
2008-11 ARMS - local food sales per farm using:
Direct-to-consumer channels only 4,338 45,635 112,661 –
Direct-to-consumer and intermediated marketing channels 12,542 85,831 456,965 –
Intermediated marketing channels only 8,979 150,857 1,100,977 –
/106 = millions of dollars
Synthetic 2012 estimate of local food sales by market channel:
Direct-to-consumer channels only 446 399 421 1,266
Direct-to-consumer and intermediated marketing channels 245 378 846 1,469
Intermediated marketing channels only 146 523 3,171 3,840
Total local food sales 837 1,300 4,438 6,574
Share statistics for figure 5: percent
All local food farms 84.7 10.1 5.2 100.0
Total local food sales 12.7 19.8 67.5 100.0
Share statistics for figure 5:
2012 Census - local food farms using: percent
Direct-to-consumer channels only 74.2 52.6 44.1 –
Direct-to-consumer and intermediated marketing channels 14.1 26.5 21.9 –
Intermediated marketing channels only 11.7 20.9 34.0 –
All local food farms 100.0 100.0 100.0
Synthetic 2012 estimate of local food sales by market channel: percent
Direct-to-consumer channels only 53.3 30.7 9.5 –
Direct-to-consumer and intermediated marketing channels 29.2 29.1 19.1 –
Intermediated marketing channels only 17.5 40.2 71.4 –
Total local food sales 100.0 100.0 100.0
GCFI = gross cash farm income. Source: USDA, Economic Research Service/National Agricultural Statistics Service, Agricultural Resource Management Surveys (ARMS), 2008-2011; Economic Research Service analysis of USDA, National Agricultural Statistics Service, 2012 Census of Agriculture data.

83 Trends in U.S. Local and Regional Food Systems: A Report to Congress, AP-068
Economic Research Service/USDA
Appendix table 3
Developing the synthetic estimates of local food sales by market channel option and farm production type
Farm production type:
ItemField and
other crops Vegetables, fruit, & nuts
Livestock & livestock products All
2012 Census - local food farms using: Number of farms
Direct-to-consumer channels only 20,536 29,611 65,157 115,304
Direct-to-consumer and intermediated marketing channels 5,231 12,685 7,826 25,742
Intermediated marketing channels only 10,135 5,645 6,835 22,615
All local food farms 35,902 47,941 79,818 163,661
multiplied by dollars
2008-11 ARMS - local food sales per farm using:
Direct-to-consumer channels only 11,576 17,530 6,150 –
Direct-to-consumer and intermediated marketing channels
27,352 74,961 49,923 –
Intermediated marketing channels only 84,572 257,030 122,256 –
/106 = millions of dollars
Synthetic 2012 estimate of local food sales by market channel:
Direct-to-consumer channels only 238 519 401 1,158
Direct-to-consumer and intermediated marketing channels 143 951 391 1,485
Intermediated marketing channels only 857 1,451 836 3,144
Total local food sales 1,238 2,921 1,627 5,786
Share statistics for figure 6: percent
All local food farms 21.9 29.3 48.8 100.0
Total local food sales 21.4 50.5 28.1 100.0
Share statistics for figure 6:
2012 Census - local food farms using: percent
Direct-to-consumer channels only 17.8 25.7 56.5 100.0
Direct-to-consumer and intermediated marketing channels 20.3 49.3 30.4 100.0
Intermediated marketing channels only 44.8 25.0 30.2 100.0
Synthetic 2012 estimate of local food sales by market channel: percent
Direct-to-consumer channels only 20.5 44.8 34.6 100.0
Direct-to-consumer and intermediated marketing channels 9.6 64.0 26.3 100.0
Intermediated marketing channels only 27.3 46.2 26.6 100.0
GCFI = gross cash farm income. Source: USDA, Economic Research Service/National Agricultural Statistics Service, Agricultural Resource Management Surveys (ARMS), 2008-2011; Economic Research Service analysis of USDA, National Agricultural Statistics Service, 2012 Census of Agriculture data.

84 Trends in U.S. Local and Regional Food Systems: A Report to Congress, AP-068
Economic Research Service/USDA

85 Trends in U.S. Local and Regional Food Systems: A Report to Congress, AP-068
Economic Research Service/USDA

86 Trends in U.S. Local and Regional Food Systems: A Report to Congress, AP-068
Economic Research Service/USDA