Embed Size (px)
Citation preview

8/20/2019 Serial Bus Debug
http://slidepdf.com/reader/full/serial-bus-debug 1/64
Hands-on Class: Switched Mode
Power Supply Measurements

8/20/2019 Serial Bus Debug
http://slidepdf.com/reader/full/serial-bus-debug 2/64

8/20/2019 Serial Bus Debug
http://slidepdf.com/reader/full/serial-bus-debug 3/64
Agenda
In this workshop we’ll be learningı SMPS background and basics
ı Non-ideal behavior in switching components (switches, inductors, capacitors)
ı Key SMPS measurements
ı Measurement Accuracy (averaging, decimation and filtering)
ı
Hands On Example: averaging, decimation and filteringı Hands On Example: measuring switching voltage and inductor current
ı Hands On Example: input and output current and voltage ripple
3/3/2014 FAST: Advanced Triggering 3

8/20/2019 Serial Bus Debug
http://slidepdf.com/reader/full/serial-bus-debug 4/64
Power Systems: Everywhere, in Every Size
ı MicroWatts to MegaWatts
03.03.2014 4
3 MW Wind Power Controller
2.56 mm2 500 mW LED Driver
Small Off-Line Power Supply

8/20/2019 Serial Bus Debug
http://slidepdf.com/reader/full/serial-bus-debug 5/64
SMPS Applicationsı AC/DC Power Supplies for Industry – DC Drives/Welding/Motion Control
ı AC/AC Power Supplies for Industry – Synchronous Drives
ı
DC/DC Power Supplies Internal to Industrial Equipment
ı DC/AC for Automotive & Aircraft – AC drives / AC Power
ı DC/DC Low-voltage for Automotive & Aircraft – Numerous Systems Applications
ı DC/DC High-voltage for Automotive & Aircraft – Lighting, DC drives
ı AC/DC Power Supplies for Consumer Household Equipment
ı DC/DC Power Supplies Internal to Consumer Household Equipment
ı DC/AC Power Supplies Internal to Consumer Household Equipment
ı Power Tools
ı AC/DC Power Supplies for Consumer Electronics
ı DC/DC Supplies internal to Consumer Electronics
ı AC/DC Power supplies for Portable Electronics
ı DC/DC Power Supplies Internal to Portable Electronics
03.03.2014 5
8/20/2019 Serial Bus Debug
http://slidepdf.com/reader/full/serial-bus-debug 6/64
Modern Power Supplies:
Inductors, Capacitors and Fast Switches
ı Use ‘Lossless’ Components, In ‘Switching’ Operation Inductors store energy, and can deliver the energy at arbitrary voltage
Capacitors store energy between ‘pumping’ operations of inductors
ı Replace Linear Series Pass And Shunt Regulators Linear regulators turn excess voltage into thermal energy
ı Effectively ‘Variable Transformer’ Operation Able To Provide Increase/Decrease, Or Both, In Voltage
Able To Operate Over Wide Ranges Of Input Voltage
03.03.2014 6
8/20/2019 Serial Bus Debug
http://slidepdf.com/reader/full/serial-bus-debug 7/64
Modern Power Supplies:
Inductors, Capacitors and Fast Switches
ı The Conflicting Drivers For Efficient Power Conversion
Minimize Losses In Active And Passive Components
Minimize Cost
Minimize Size
Maximize Reliability
Minimize Adverse Effects On Other Systems
03.03.2014 7

8/20/2019 Serial Bus Debug
http://slidepdf.com/reader/full/serial-bus-debug 8/64
SMPS | 3
Switched mode power supply basics
l Basic DC-DC converter
l Switches A and B alternately charge and discharge inductor through
load
l Switches are realized using power MOSFET, IGBT and d iodes
Vs(t)
8/20/2019 Serial Bus Debug
http://slidepdf.com/reader/full/serial-bus-debug 9/64
SMPS | 4
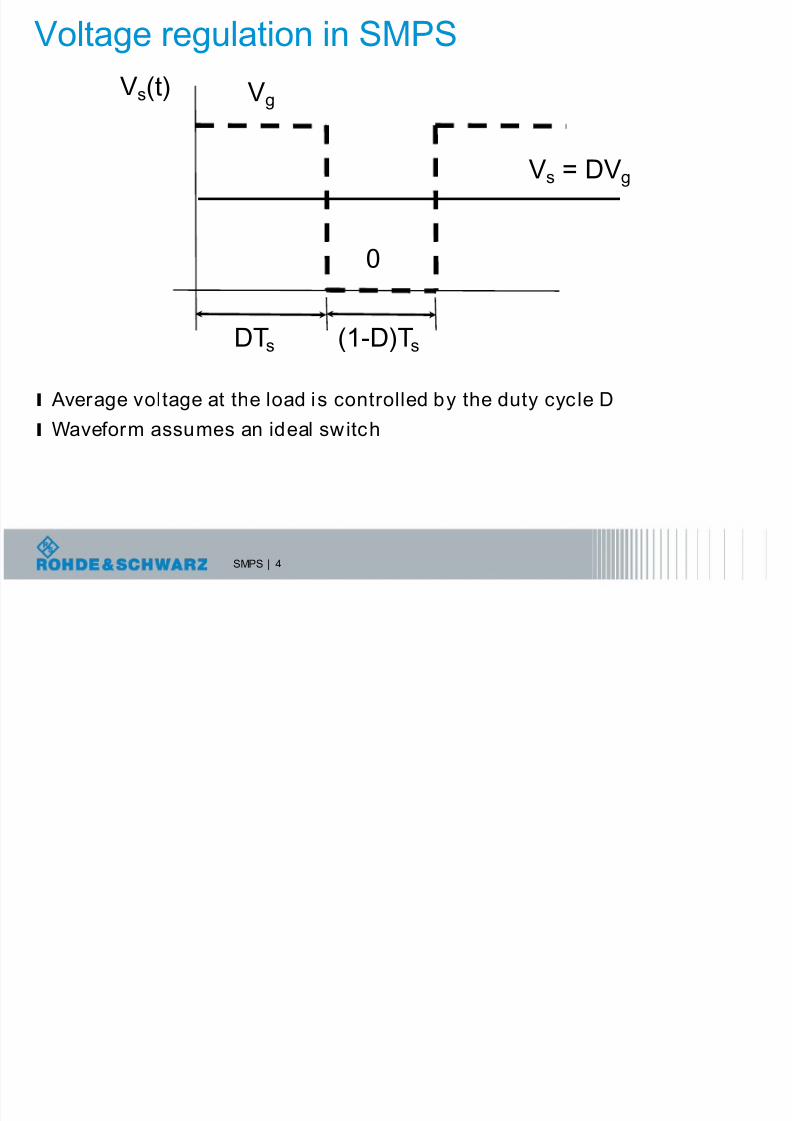
Voltage regulation in SMPS
l Average voltage at the load is controlled by the duty cycle D
l Waveform assumes an ideal switch
DTs (1-D)Ts
Vs(t) Vg
0
Vs = DVg
8/20/2019 Serial Bus Debug
http://slidepdf.com/reader/full/serial-bus-debug 10/64
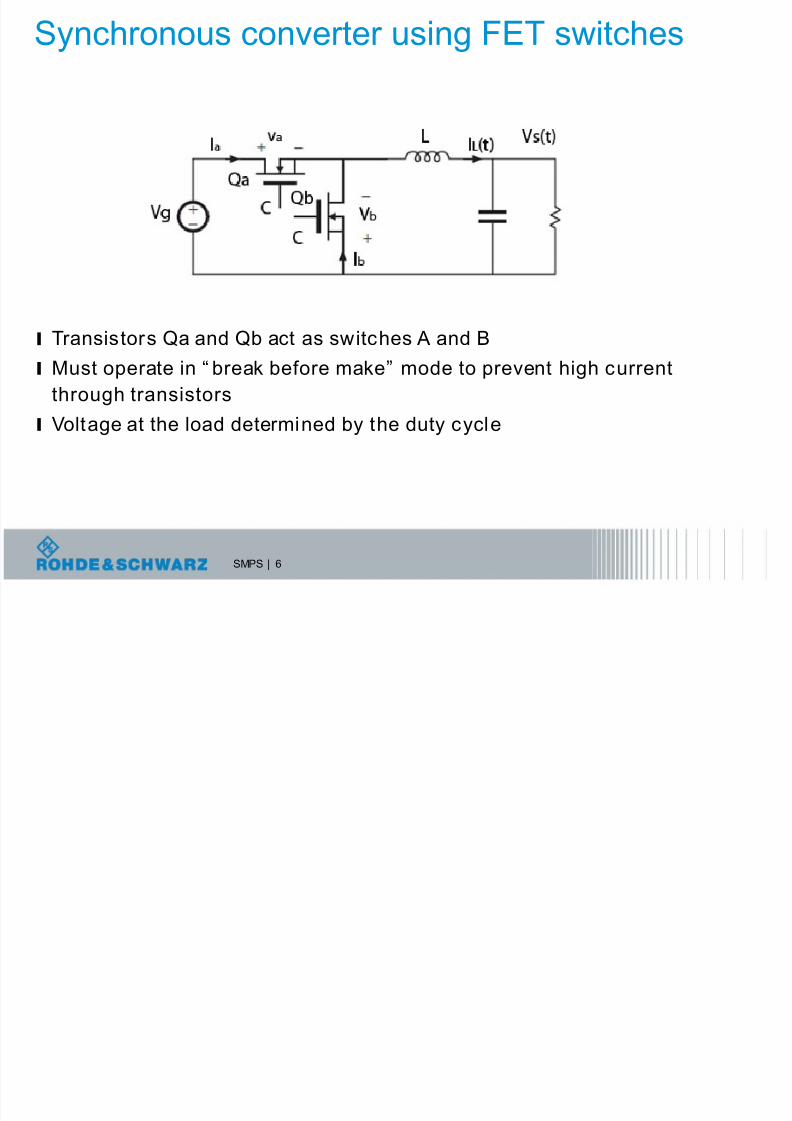
SMPS | 6
Synchronous converter using FET switches
l Transistors Qa and Qb act as switches A and B
l Must operate in “ break before make” mode to prevent high current
through transistors
l Voltage at the load determined by the duty cycle

8/20/2019 Serial Bus Debug
http://slidepdf.com/reader/full/serial-bus-debug 11/64
Agenda
In this workshop we’ll be learningı SMPS background and basics
ı Non-ideal behavior in switching components (switches, inductors, capacitors)
ı Key SMPS measurements
ı Measurement Accuracy (averaging, decimation and filtering)
ı Hands On Example: averaging, decimation and filtering
ı Hands On Example: measuring switching voltage and inductor current
ı Hands On Example: input and output current and voltage ripple
3/3/2014 FAST: Advanced Triggering 11

8/20/2019 Serial Bus Debug
http://slidepdf.com/reader/full/serial-bus-debug 12/64
The Conflicting Drivers For Efficient Power Conversion:Minimize Losses In Active And Passive Components
What Are These, Why Are They Important, And What Are The Trade-offs In SMPS
Technology For The Following Goals?
ı Switching Faster Transitions, Higher Frequencies
Lower Rds(on)
Lower Gate Drive Integrate
03.03.2014 12

8/20/2019 Serial Bus Debug
http://slidepdf.com/reader/full/serial-bus-debug 13/64
The Conflicting Drivers For Efficient Power Conversion:Minimize Losses In Active And Passive Components
Why Are These Important, And What Are The Trade-offs In SMPS Technology For
The Following Goals?
ı Inductors Lower DCR
Lower ACR
Reduced Parasitic Capacitance Reduced Size
Reduced Magnetic Leakage
03.03.2014 13

8/20/2019 Serial Bus Debug
http://slidepdf.com/reader/full/serial-bus-debug 14/64
The Conflicting Drivers For Efficient Power Conversion:Minimize Losses In Active And Passive Components
Why Are These Important, And What Are The Trade-offs In SMPS Technology For
The Following Goals?
ı Capacitors Smaller
Lower ESR
Lower Cost
03.03.2014 14

8/20/2019 Serial Bus Debug
http://slidepdf.com/reader/full/serial-bus-debug 15/64
SMPS Passive Components Issues
ı Non-Ideal Behavior Parasitic R/C of Inductors
Inductor Saturation
Inductor Core Losses
Inductor Copper Losses
ESR and ESL of Capacitors
Dielectric and Aging in Electrolytic Capacitors
Heat sensitivity of Electrolytic Capacitors
Aging and Voltage Effects in Ceramic Capacitors
Piezoelectric Effects in Ceramic Capacitors
Impedance vs. Frequency in Ceramic Capacitors
03.03.2014 15
8/20/2019 Serial Bus Debug
http://slidepdf.com/reader/full/serial-bus-debug 16/64
Agenda
In this workshop we’ll be learningı SMPS background and basics
ı Non-ideal behavior in switching components (switches, inductors, capacitors)
ı Key SMPS measurements
ı Measurement Accuracy (averaging, decimation and filtering)
ı Hands On Example: averaging, decimation and filtering
ı Hands On Example: measuring switching voltage and inductor current
ı Hands On Example: input and output current and voltage ripple
3/3/2014 FAST: Advanced Triggering 16
8/20/2019 Serial Bus Debug
http://slidepdf.com/reader/full/serial-bus-debug 17/64
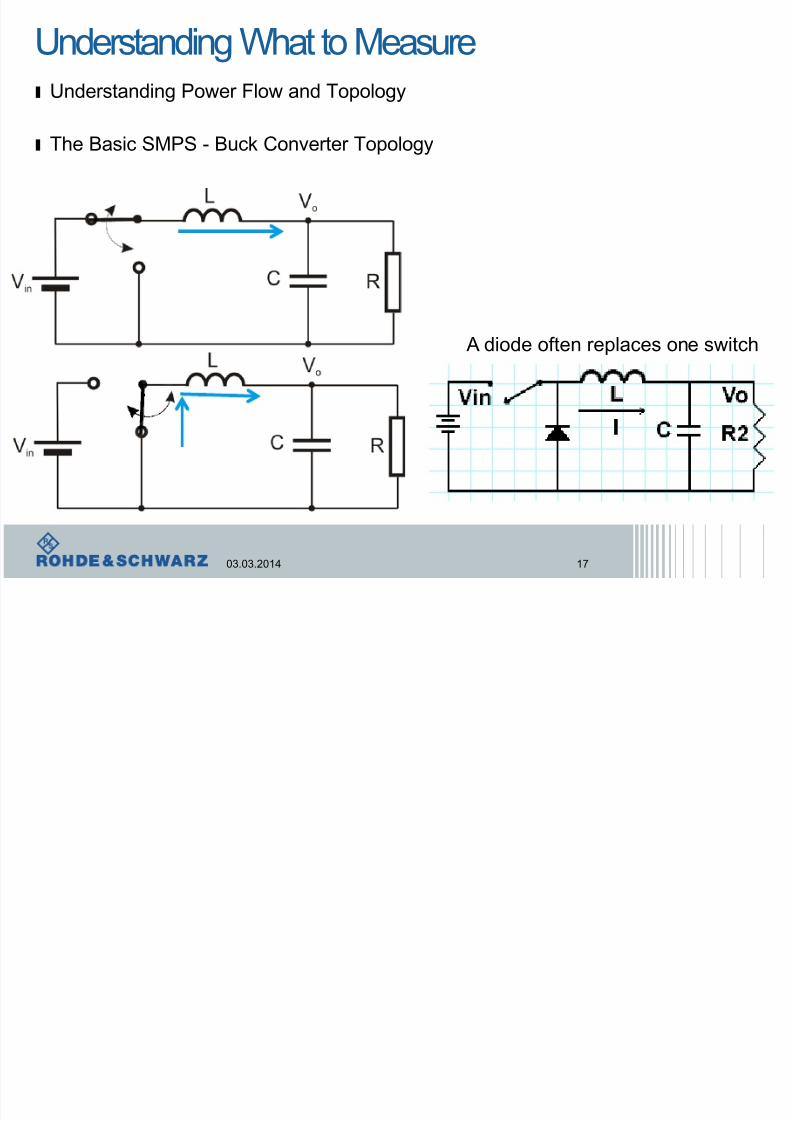
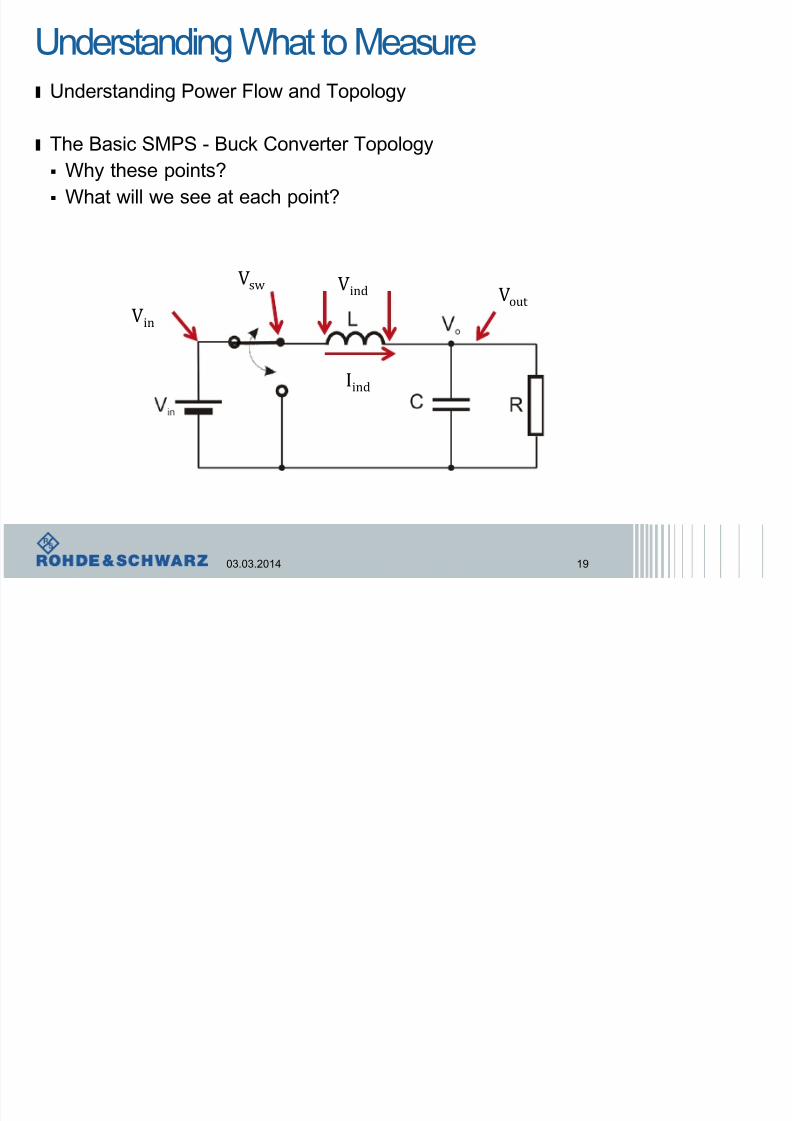
Understanding What to Measureı Understanding Power Flow and Topology
ı The Basic SMPS - Buck Converter Topology
03.03.2014 17
A diode often replaces one switch

8/20/2019 Serial Bus Debug
http://slidepdf.com/reader/full/serial-bus-debug 18/64
Understanding What to Measureı Understanding Power Flow and Topology
ı The Basic SMPS - Buck Converter Topology Measurement Points
03.03.2014 18
Vin
Vsw Vind
Iind
Vout
8/20/2019 Serial Bus Debug
http://slidepdf.com/reader/full/serial-bus-debug 19/64
Understanding What to Measureı Understanding Power Flow and Topology
ı The Basic SMPS - Buck Converter Topology Why these points?
What will we see at each point?
03.03.2014 19
Vin
Vsw Vind
Iind
Vout
8/20/2019 Serial Bus Debug
http://slidepdf.com/reader/full/serial-bus-debug 20/64
Understanding What to Measureı Understanding Power Flow and Topology
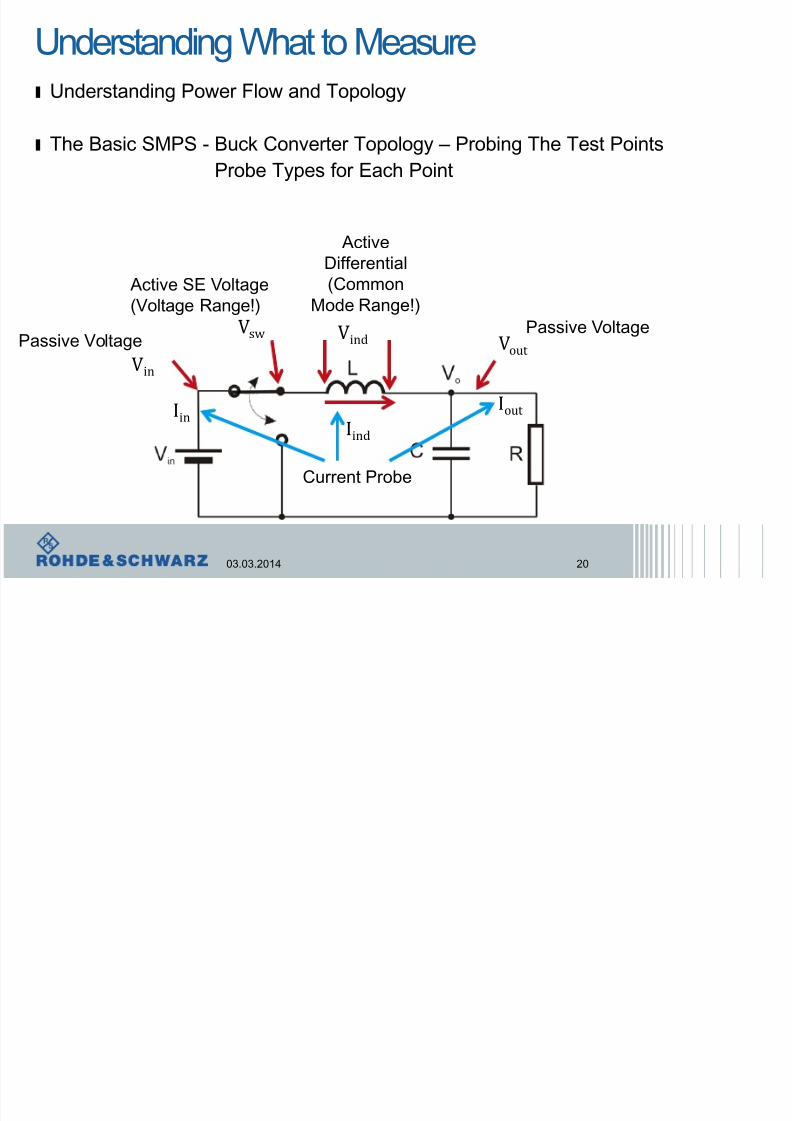
ı The Basic SMPS - Buck Converter Topology – Probing The Test PointsProbe Types for Each Point
03.03.2014 20
Vin
Vsw Vind
Iind
VoutPassive Voltage
Active SE Voltage(Voltage Range!)
ActiveDifferential
(CommonMode Range!)
Passive Voltage
Current Probe
IoutIin
8/20/2019 Serial Bus Debug
http://slidepdf.com/reader/full/serial-bus-debug 21/64
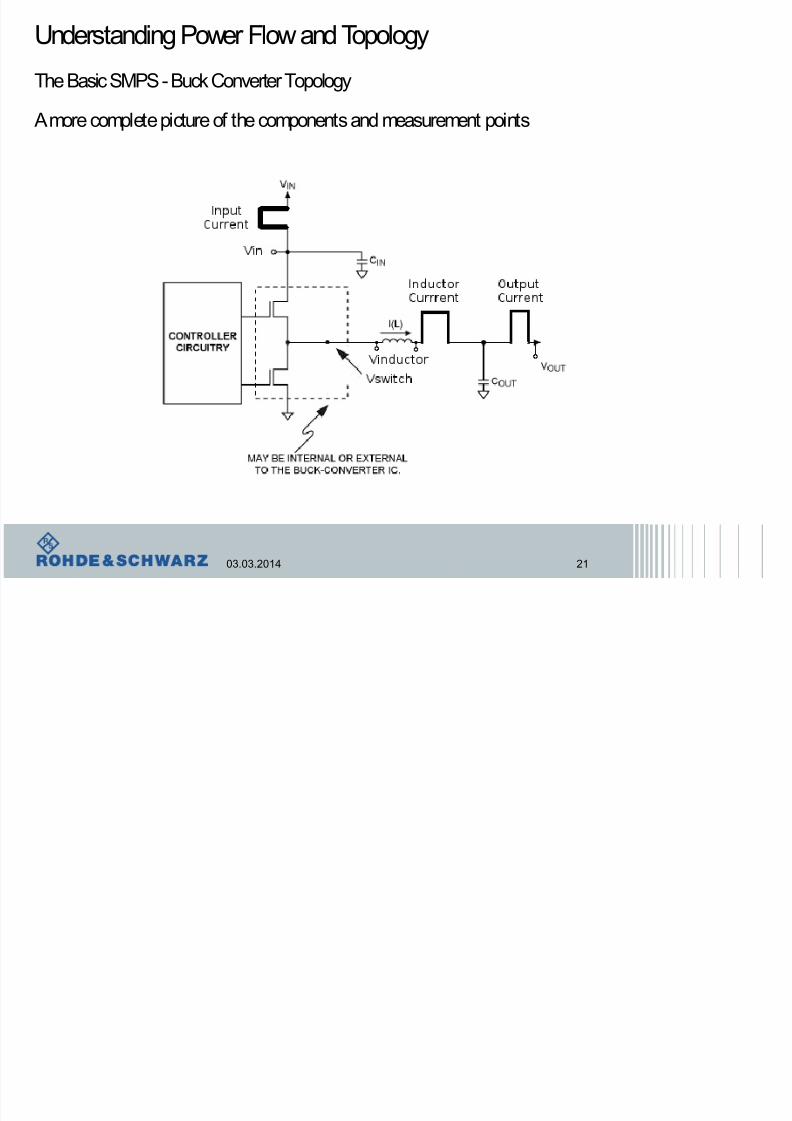
Understanding Power Flow and Topology
The Basic SMPS - Buck Converter Topology
A more complete picture of the components and measurement points
03.03.2014 21
8/20/2019 Serial Bus Debug
http://slidepdf.com/reader/full/serial-bus-debug 22/64
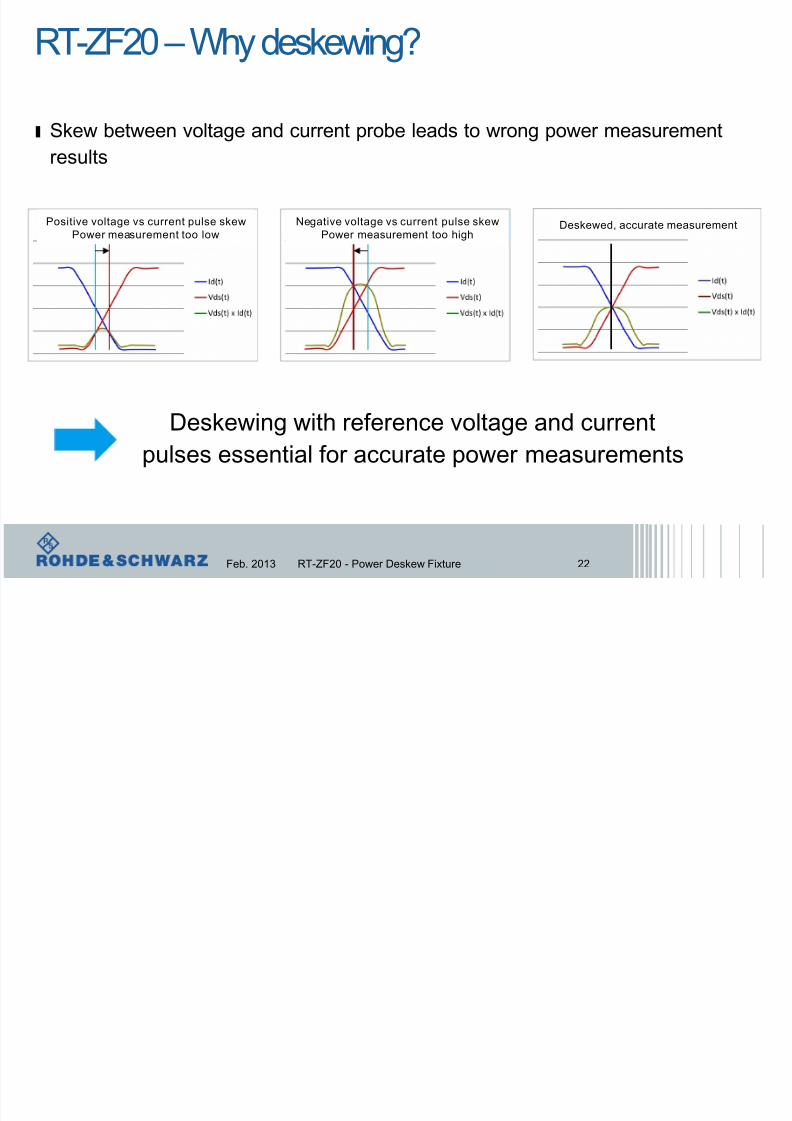
RT-ZF20 – Why deskewing?
ı
Skew between voltage and current probe leads to wrong power measurementresults
Feb. 2013 RT-ZF20 - Power Deskew Fixture 22
Deskewing with reference voltage and currentpulses essential for accurate power measurements
Positive voltage vs current pulse skew
Power measurement too low
Negative voltage vs current pulse skew
Power measurement too high
Positive voltage vs current pulse skew
Power measurement too lowDeskewed, accurate measurement
8/20/2019 Serial Bus Debug
http://slidepdf.com/reader/full/serial-bus-debug 23/64
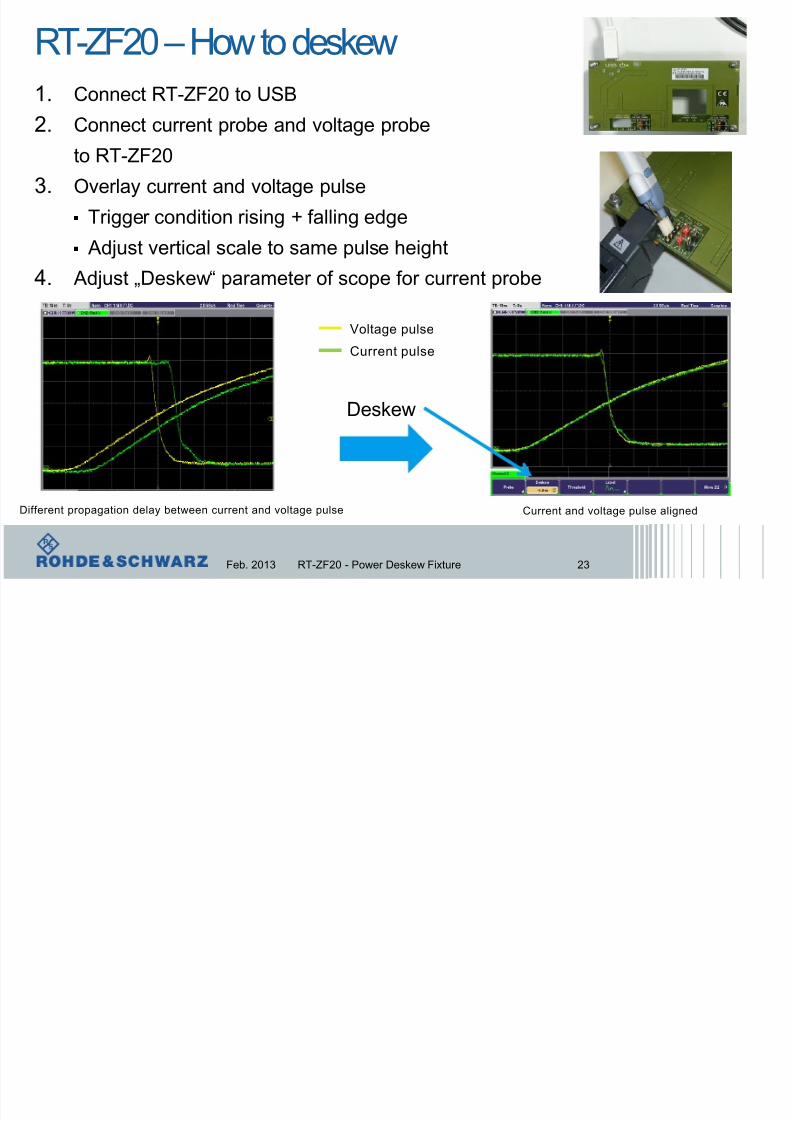
RT-ZF20 – How to deskew
1. Connect RT-ZF20 to USB
2. Connect current probe and voltage probe
to RT-ZF20
3. Overlay current and voltage pulse
Trigger condition rising + falling edge
Adjust vertical scale to same pulse height
4. Adjust „Deskew“ parameter of scope for current probe
Feb. 2013 RT-ZF20 - Power Deskew Fixture 23
Deskew
Voltage pulse
Current pulse
Different propagation delay between current and voltage pulse Current and voltage pulse aligned
8/20/2019 Serial Bus Debug
http://slidepdf.com/reader/full/serial-bus-debug 24/64
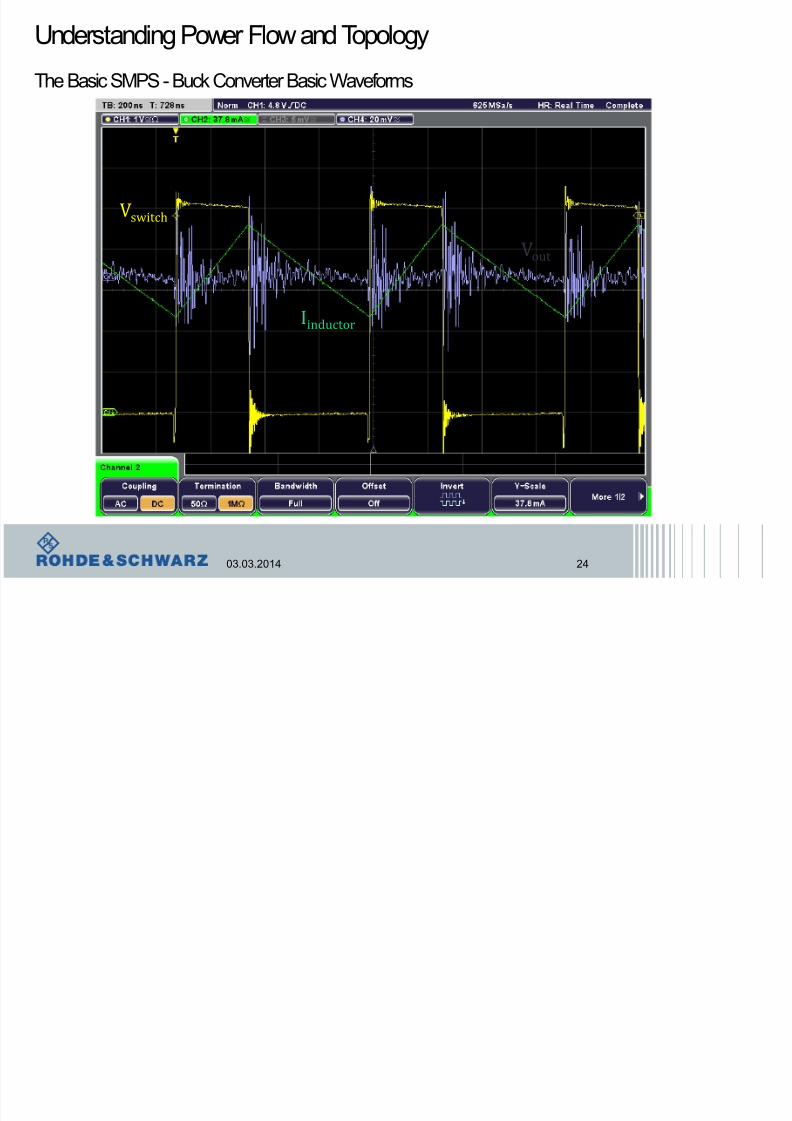
Understanding Power Flow and Topology
The Basic SMPS - Buck Converter Basic Waveforms
03.03.2014 24
Vswitch
Iinductor
Vout
8/20/2019 Serial Bus Debug
http://slidepdf.com/reader/full/serial-bus-debug 25/64
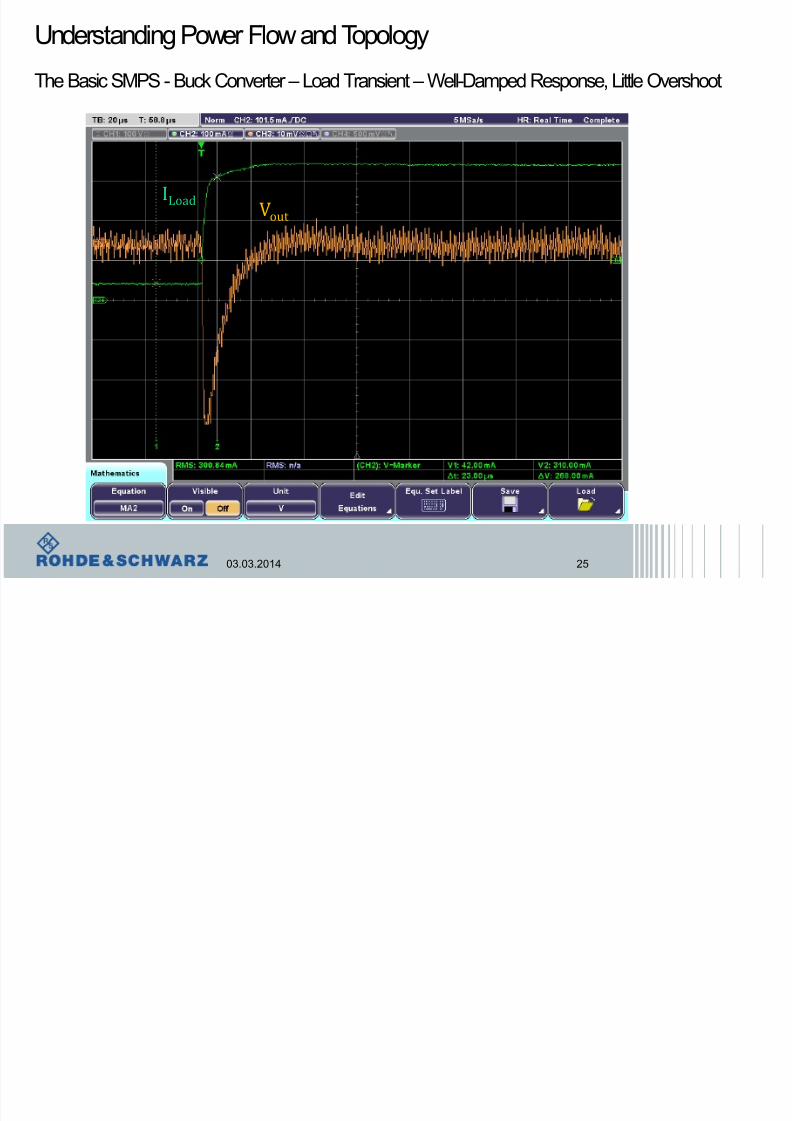
Understanding Power Flow and Topology
The Basic SMPS - Buck Converter – Load Transient – Well-Damped Response, Little Overshoot
03.03.2014 25
ILoadVout
8/20/2019 Serial Bus Debug
http://slidepdf.com/reader/full/serial-bus-debug 26/64
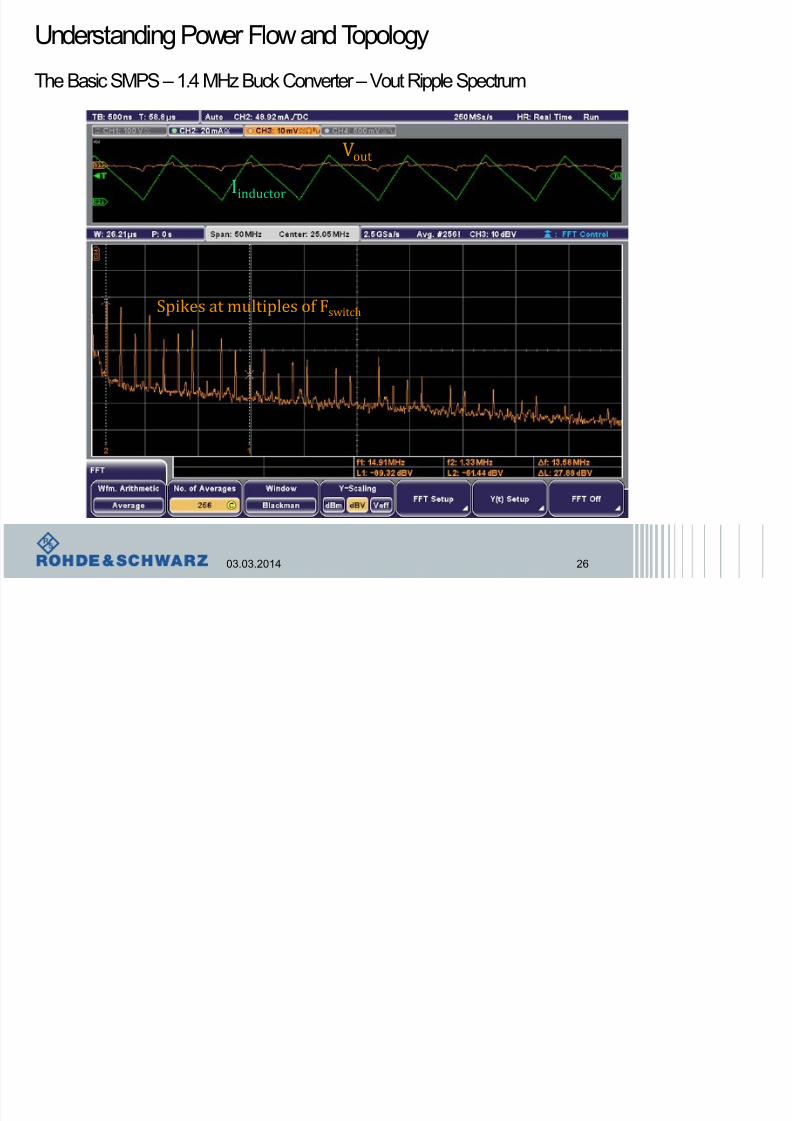
Understanding Power Flow and Topology
The Basic SMPS – 1.4 MHz Buck Converter – Vout Ripple Spectrum
03.03.2014 26
Iinductor
Vout
Spikes at multiples of Fswitch

8/20/2019 Serial Bus Debug
http://slidepdf.com/reader/full/serial-bus-debug 27/64
Agenda
In this workshop we’ll be learningı SMPS background and basics
ı Non-ideal behavior in switching components (switches, inductors, capacitors)
ı Key SMPS measurements
ı Measurement Accuracy (averaging, decimation and filtering)
ı Hands On Example: averaging, decimation and filtering
ı Hands On Example: measuring switching voltage and inductor current
ı Hands On Example: input and output current and voltage ripple
3/3/2014 FAST: Advanced Triggering 27
8/20/2019 Serial Bus Debug
http://slidepdf.com/reader/full/serial-bus-debug 28/64
Maximizing measurement accuracy
ı Large dynamic range required for accurately measuring switching loss
On state is tens to hundreds (even thousands) of volts
Off state is often only several mV to a few volts
Typical 8-bit A/D provides only 6 to 7 effective bits (43 dB S/N)
This is equivalent to 39 - 78 mV out of 5 V
ı Three possibilities to improve signal to noise
Use waveform averaging
High resolution decimation (trade off sample rate and bandwidth for S/N)
Overdrive instrument front end
8/20/2019 Serial Bus Debug
http://slidepdf.com/reader/full/serial-bus-debug 29/64
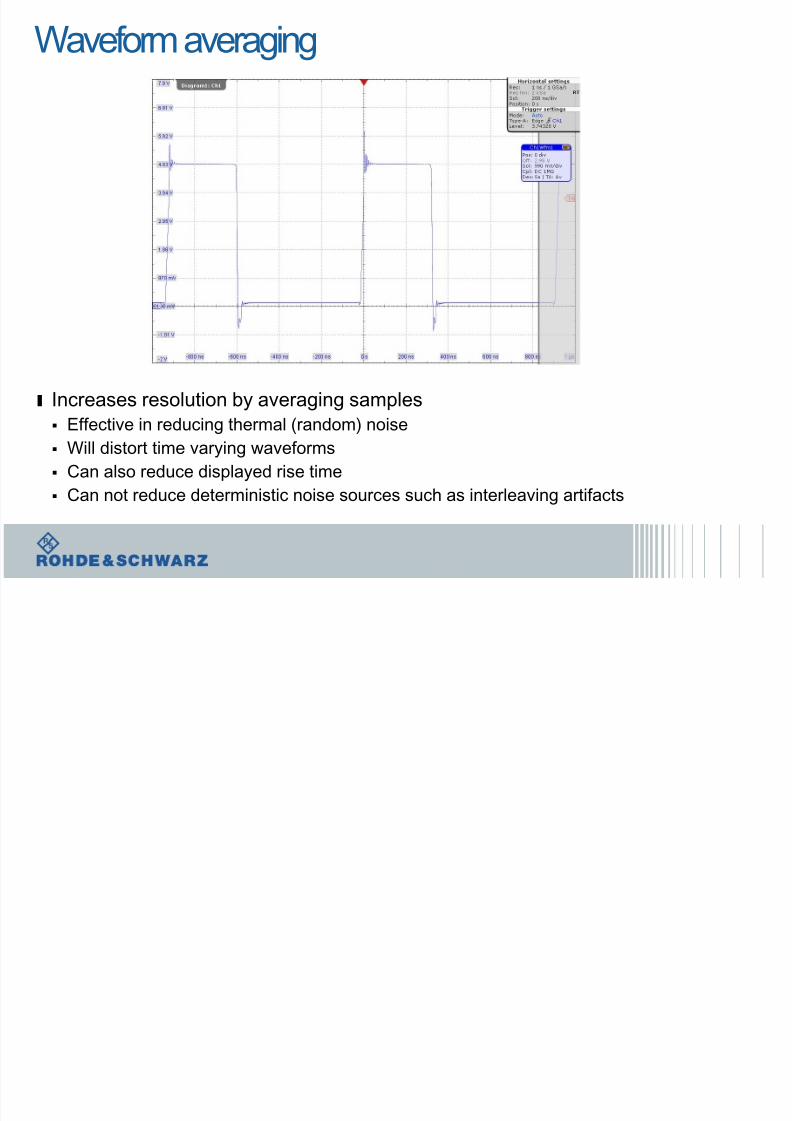
Waveform averaging
ı Increases resolution by averaging samples Effective in reducing thermal (random) noise
Will distort time varying waveforms
Can also reduce displayed rise time
Can not reduce deterministic noise sources such as interleaving artifacts
8/20/2019 Serial Bus Debug
http://slidepdf.com/reader/full/serial-bus-debug 30/64
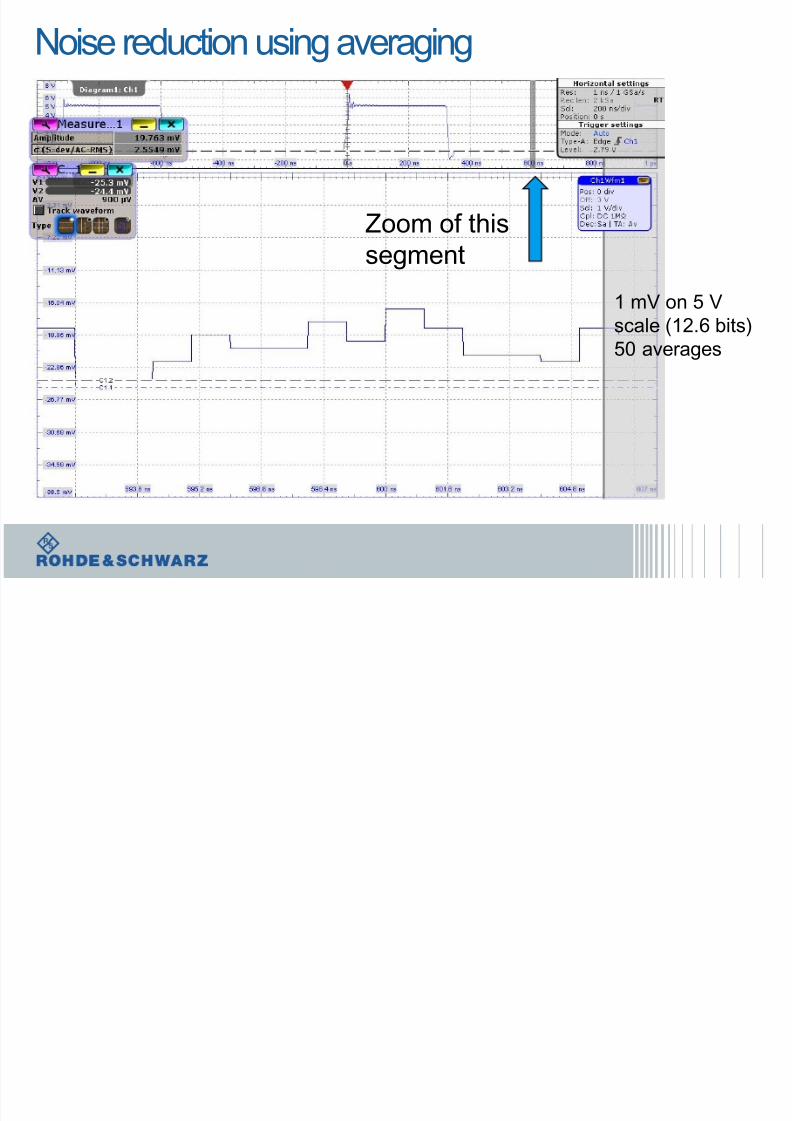
Noise reduction using averaging
1 mV on 5 Vscale (12.6 bits)50 averages
Zoom of thissegment

8/20/2019 Serial Bus Debug
http://slidepdf.com/reader/full/serial-bus-debug 31/64
High Resolution Mode
ı
Combine consecutivesamples from A/D
converter with weighting
ı Preserves real time
sampling – no smearing
of dynamic signals
ı Reduces bandwidth
based on decimated
sampling rate
ı Compatible with
segmented memory so
that each cycle can beanalyzed
Combinesamples foreach point

8/20/2019 Serial Bus Debug
http://slidepdf.com/reader/full/serial-bus-debug 32/64
High Resolution Decimation Mode
Decimate 10Gs/s to 1 Gs/s
~ 500 MHz BW
4.6 mV on 5 Vscale (10.4 bits)
8/20/2019 Serial Bus Debug
http://slidepdf.com/reader/full/serial-bus-debug 33/64
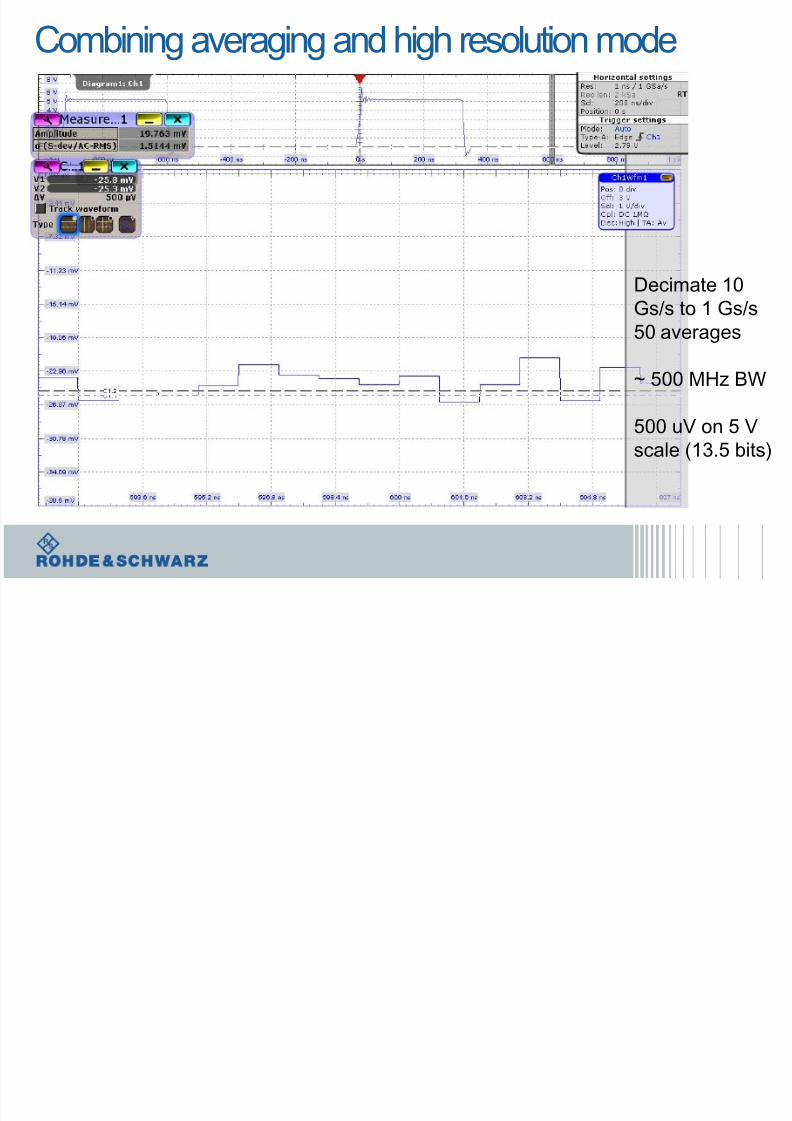
Combining averaging and high resolution mode
Decimate 10Gs/s to 1 Gs/s50 averages
~ 500 MHz BW
500 uV on 5 Vscale (13.5 bits)
8/20/2019 Serial Bus Debug
http://slidepdf.com/reader/full/serial-bus-debug 34/64
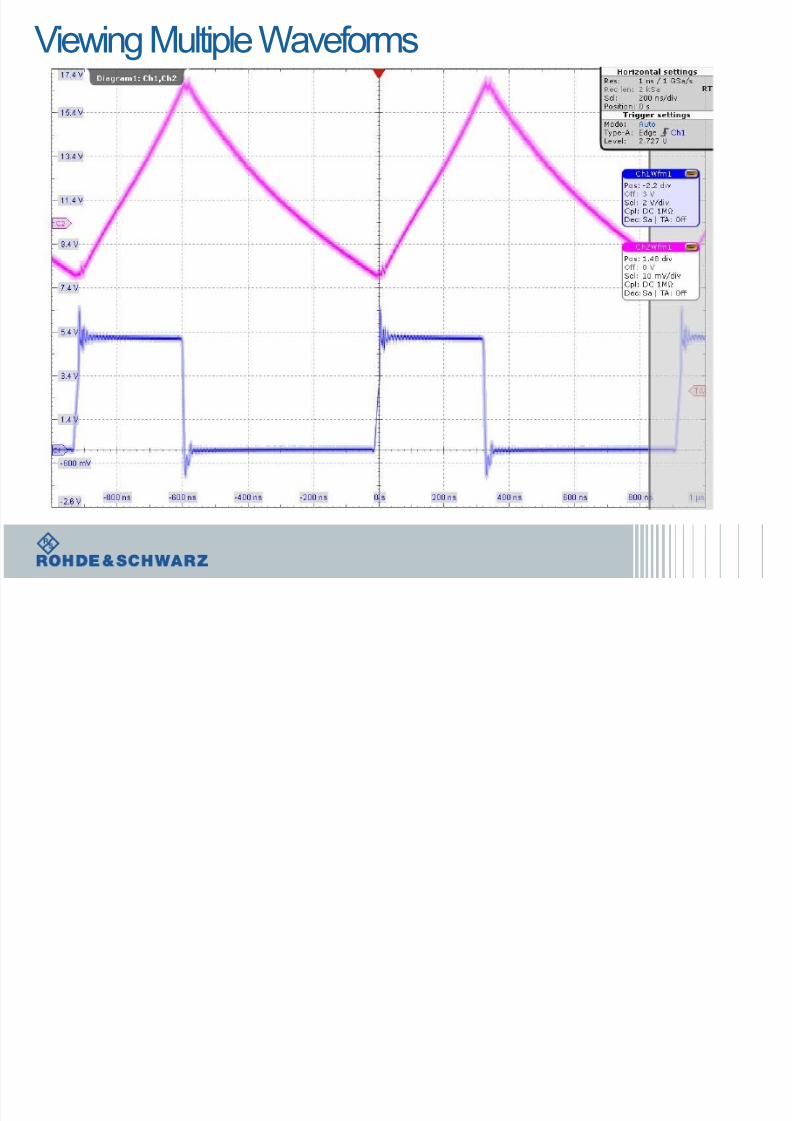
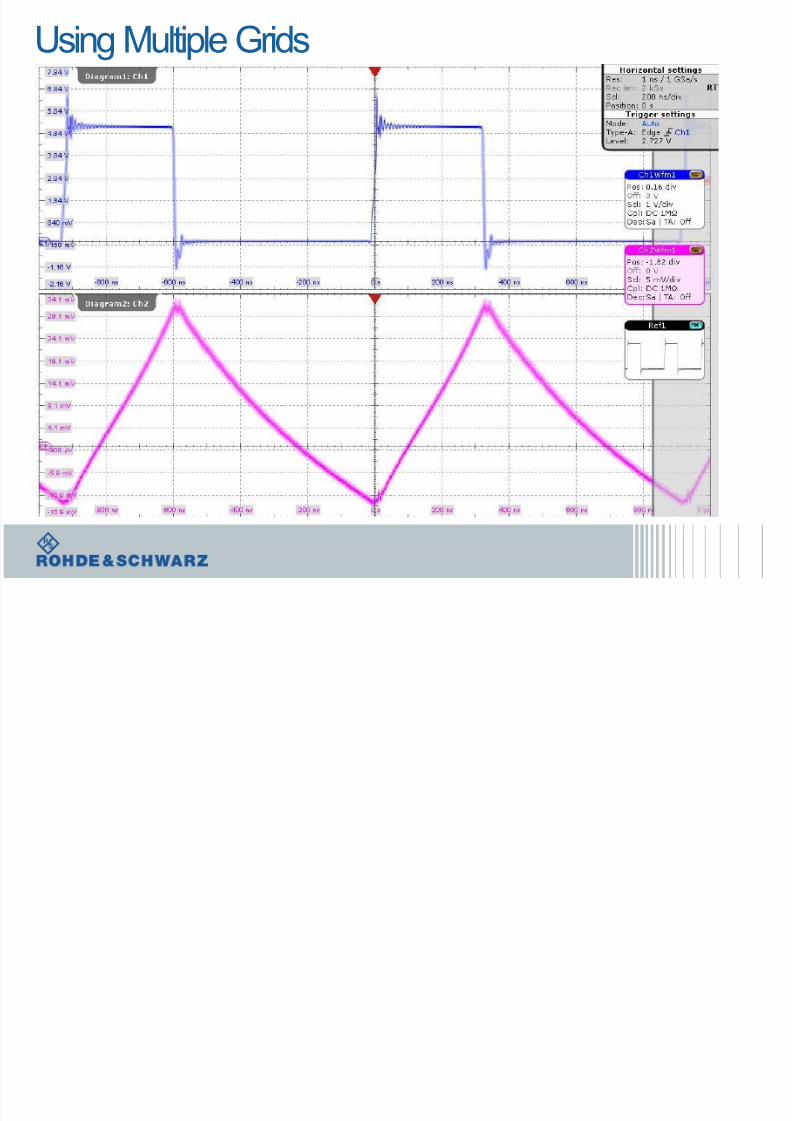
Viewing Multiple Waveforms
8/20/2019 Serial Bus Debug
http://slidepdf.com/reader/full/serial-bus-debug 35/64
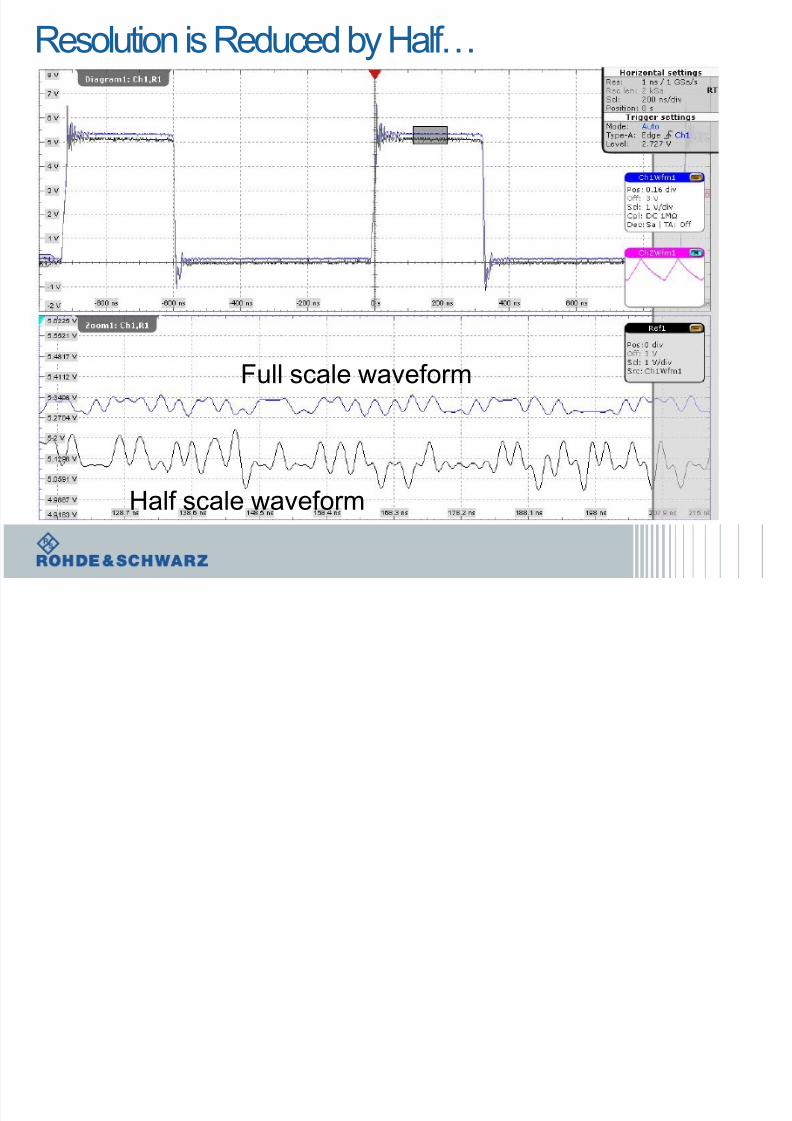
Resolution is Reduced by Half…
Full scale waveform
Half scale waveform
8/20/2019 Serial Bus Debug
http://slidepdf.com/reader/full/serial-bus-debug 36/64
Using Multiple Grids
8/20/2019 Serial Bus Debug
http://slidepdf.com/reader/full/serial-bus-debug 37/64
Agenda
In this workshop we’ll be learningı SMPS background and basics
ı Non-ideal behavior in switching components (switches, inductors, capacitors)
ı Key SMPS measurements
ı Measurement Accuracy (averaging, decimation and filtering)
ı Hands On Example: averaging, decimation and filtering
ı Hands On Example: measuring switching voltage and inductor current
ı Hands On Example: input and output current and voltage ripple
3/3/2014 FAST: Advanced Triggering 37

8/20/2019 Serial Bus Debug
http://slidepdf.com/reader/full/serial-bus-debug 38/64
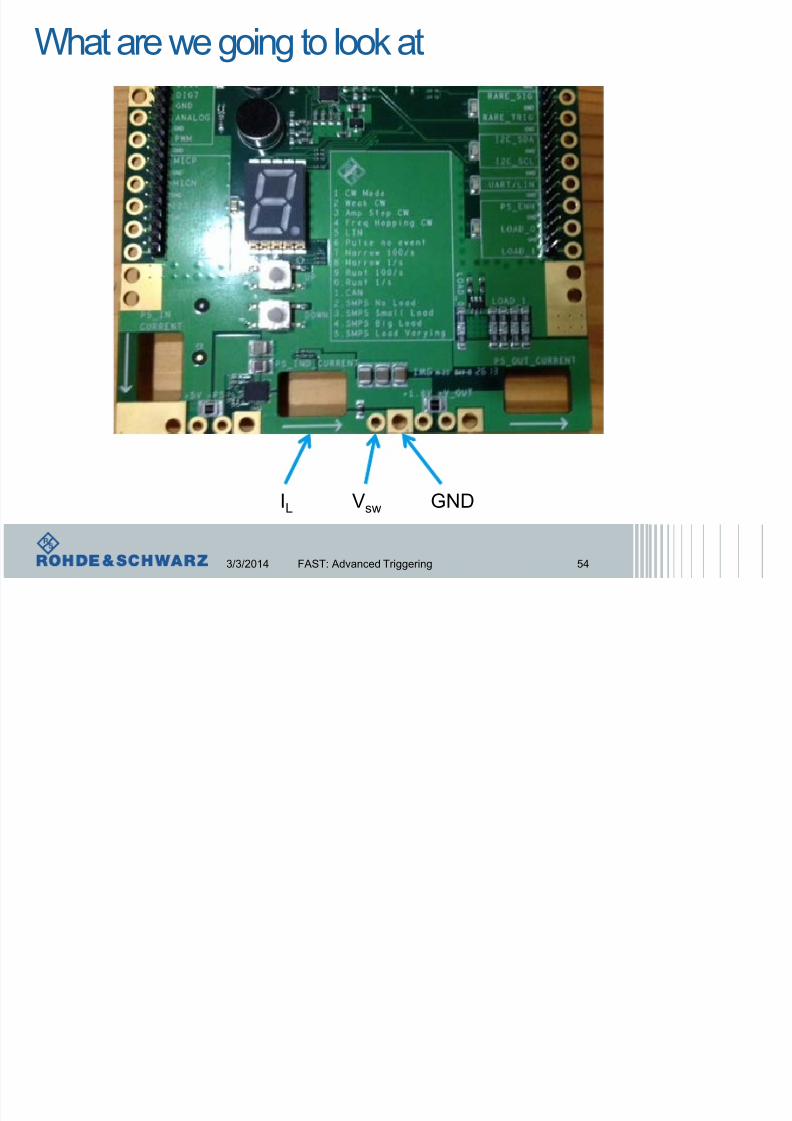
What are we going to look at
ı The output voltage of the power supply
3/3/2014 FAST: Advanced Triggering 38
Measure
Vout
0.1Ω
5 Ω or20 Ω
2.2 µH
100 µF x3
Vsw
0.1Ω

8/20/2019 Serial Bus Debug
http://slidepdf.com/reader/full/serial-bus-debug 39/64
Hands on Lab
ı Averaging, High Resolution and Filtering

8/20/2019 Serial Bus Debug
http://slidepdf.com/reader/full/serial-bus-debug 40/64
What are we going to look at
3/3/2014 FAST: Advanced Triggering 40
VSW GND
W f A i
8/20/2019 Serial Bus Debug
http://slidepdf.com/reader/full/serial-bus-debug 41/64
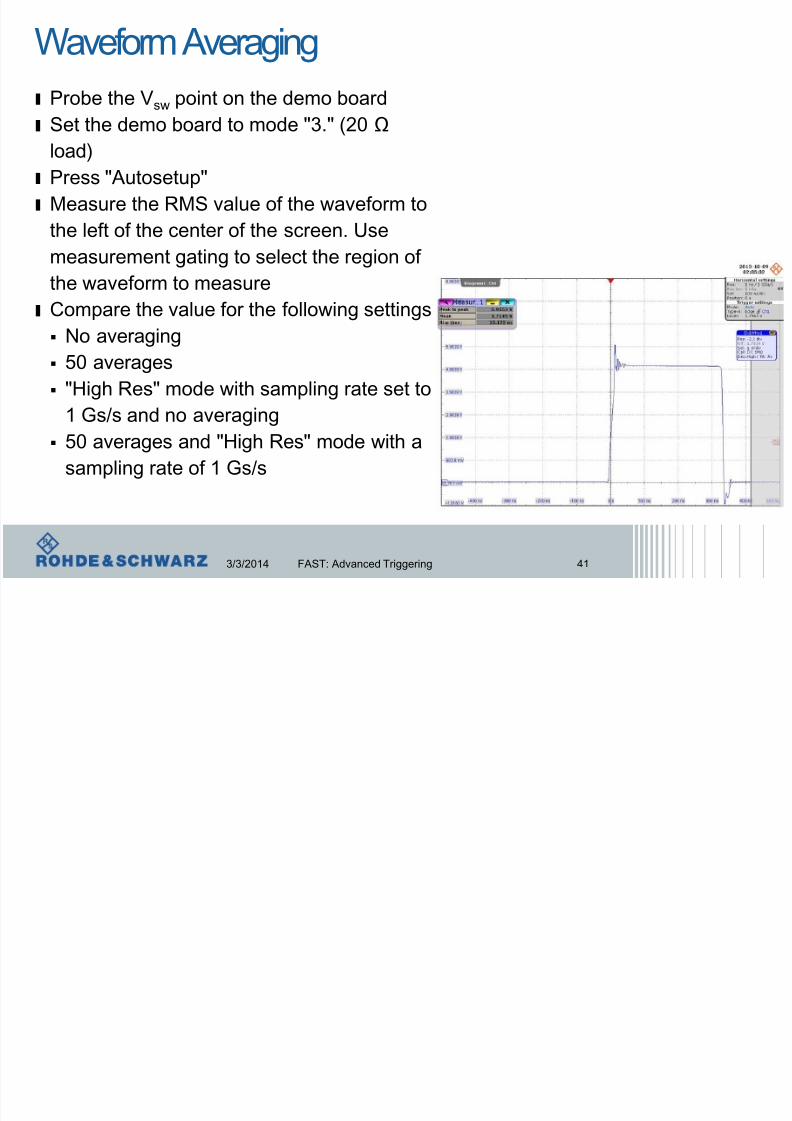
Waveform Averaging
3/3/2014 FAST: Advanced Triggering 41
ı Probe the Vsw point on the demo board
ı Set the demo board to mode "3." (20 Ω
load)
ı Press "Autosetup"
ı Measure the RMS value of the waveform to
the left of the center of the screen. Use
measurement gating to select the region of
the waveform to measureı Compare the value for the following settings
No averaging
50 averages
"High Res" mode with sampling rate set to
1 Gs/s and no averaging 50 averages and "High Res" mode with a
sampling rate of 1 Gs/s
W f A i dD i ti

8/20/2019 Serial Bus Debug
http://slidepdf.com/reader/full/serial-bus-debug 42/64
Waveform Averaging and Decimation
3/3/2014 FAST: Advanced Triggering 42
High Res Average
H d L b
8/20/2019 Serial Bus Debug
http://slidepdf.com/reader/full/serial-bus-debug 43/64
Hands on Lab
ı Hands On Example: Measure SMPS Output
and Input voltage and Current Ripple
Wh t i t l k t

8/20/2019 Serial Bus Debug
http://slidepdf.com/reader/full/serial-bus-debug 44/64
What are we going to look at
3/3/2014 FAST: Advanced Triggering 44
Vout IoutGND
M t t lt ( ll l d)
8/20/2019 Serial Bus Debug
http://slidepdf.com/reader/full/serial-bus-debug 45/64
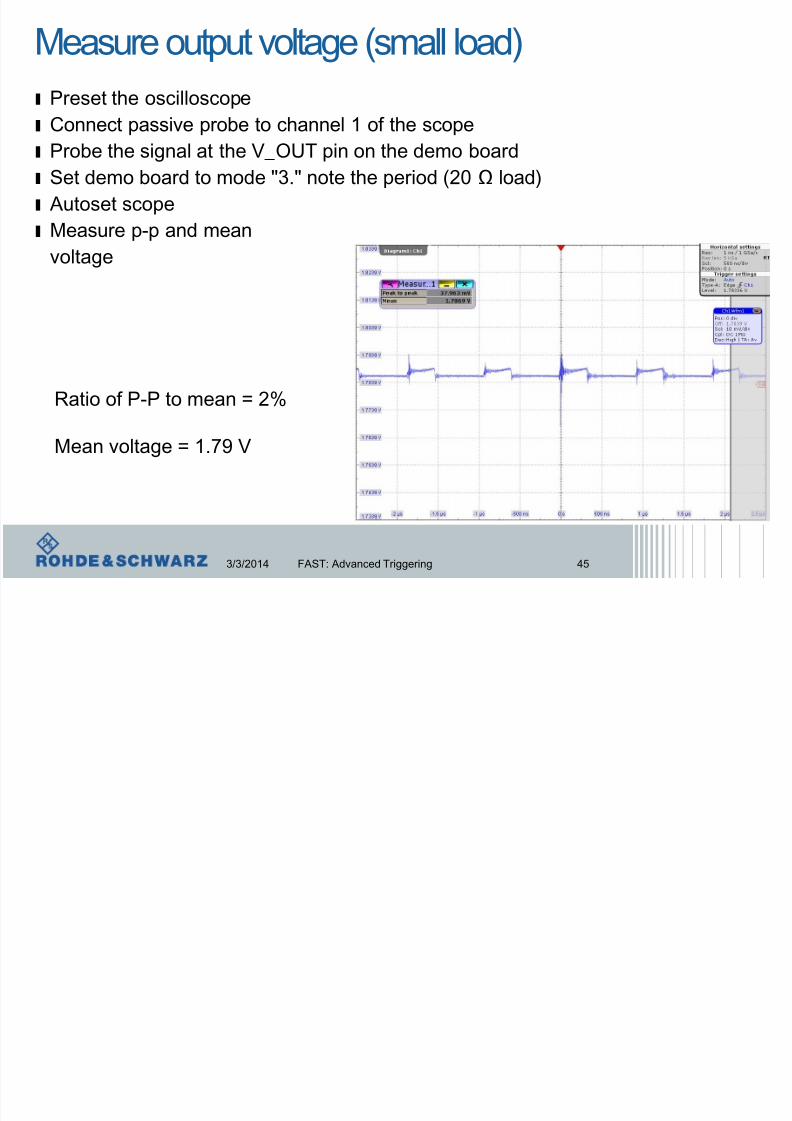
Measure output voltage (small load)
3/3/2014 FAST: Advanced Triggering 45
ı Preset the oscilloscope
ı Connect passive probe to channel 1 of the scope
ı Probe the signal at the V_OUT pin on the demo boardı Set demo board to mode "3." note the period (20 Ω load)
ı Autoset scope
ı Measure p-p and mean
voltage
Ratio of P-P to mean = 2%
Mean voltage = 1.79 V
M t t lt (l l d)
8/20/2019 Serial Bus Debug
http://slidepdf.com/reader/full/serial-bus-debug 46/64
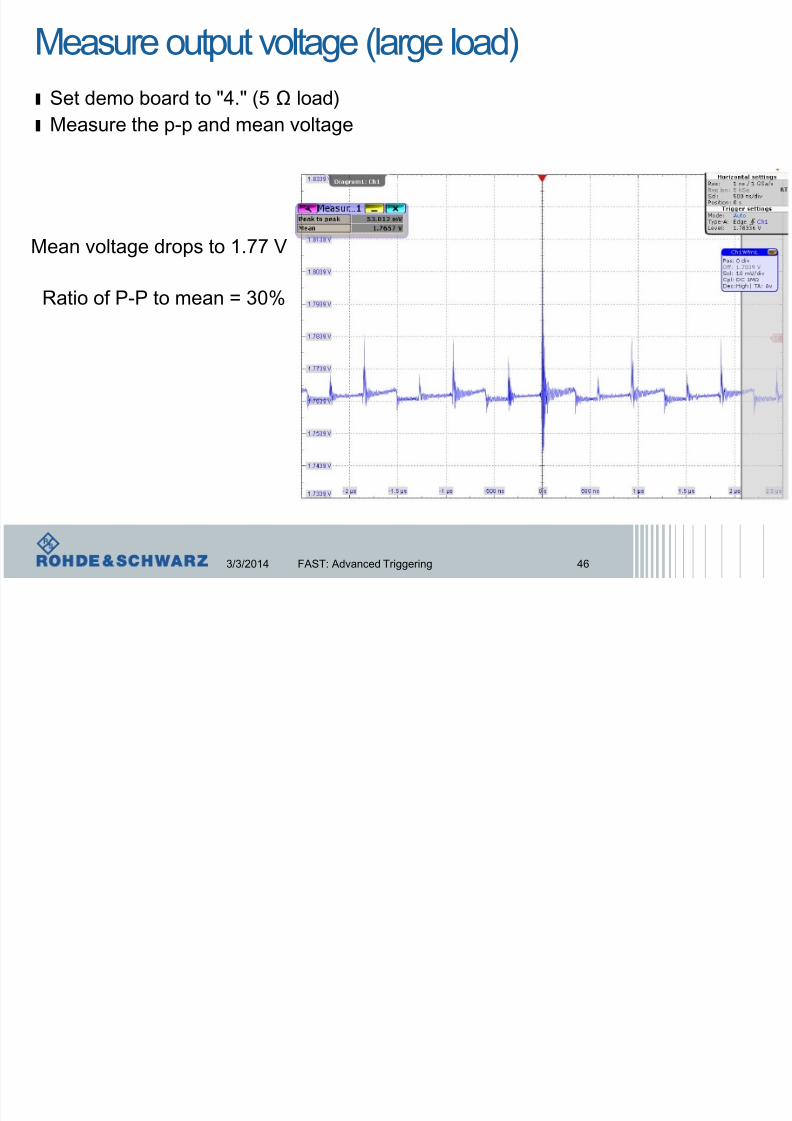
Measure output voltage (large load)
3/3/2014 FAST: Advanced Triggering 46
ı Set demo board to "4." (5 Ω load)
ı Measure the p-p and mean voltage
Ratio of P-P to mean = 30%
Mean voltage drops to 1.77 V
M t t lt t
8/20/2019 Serial Bus Debug
http://slidepdf.com/reader/full/serial-bus-debug 47/64
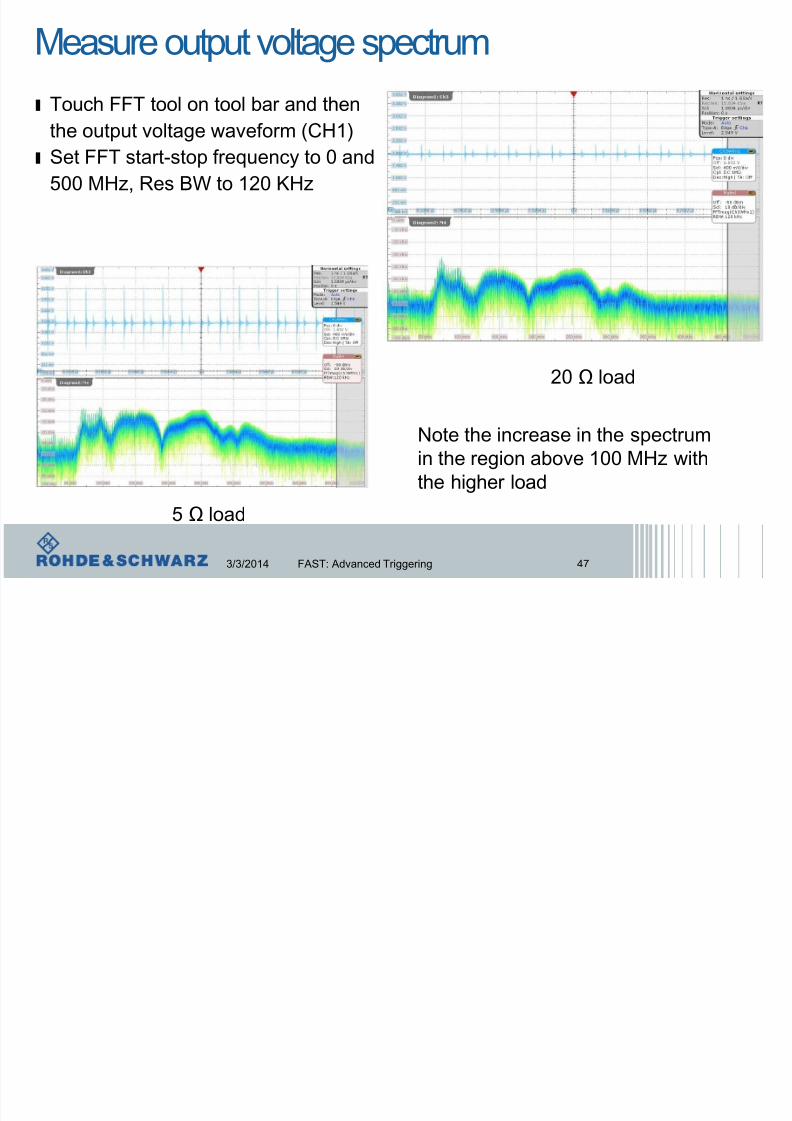
Measure output voltage spectrum
ı Touch FFT tool on tool bar and then
the output voltage waveform (CH1)
ı Set FFT start-stop frequency to 0 and
500 MHz, Res BW to 120 KHz
3/3/2014 FAST: Advanced Triggering 47
20 Ω load
5 Ω load
Note the increase in the spectrumin the region above 100 MHz withthe higher load
H d L b

8/20/2019 Serial Bus Debug
http://slidepdf.com/reader/full/serial-bus-debug 48/64
Hands on Lab
ı Hands On Example: Measure Switch Node
Voltage and Inductor Voltage and Current
InductorCurrentWaveform
8/20/2019 Serial Bus Debug
http://slidepdf.com/reader/full/serial-bus-debug 49/64
SMPS | 4
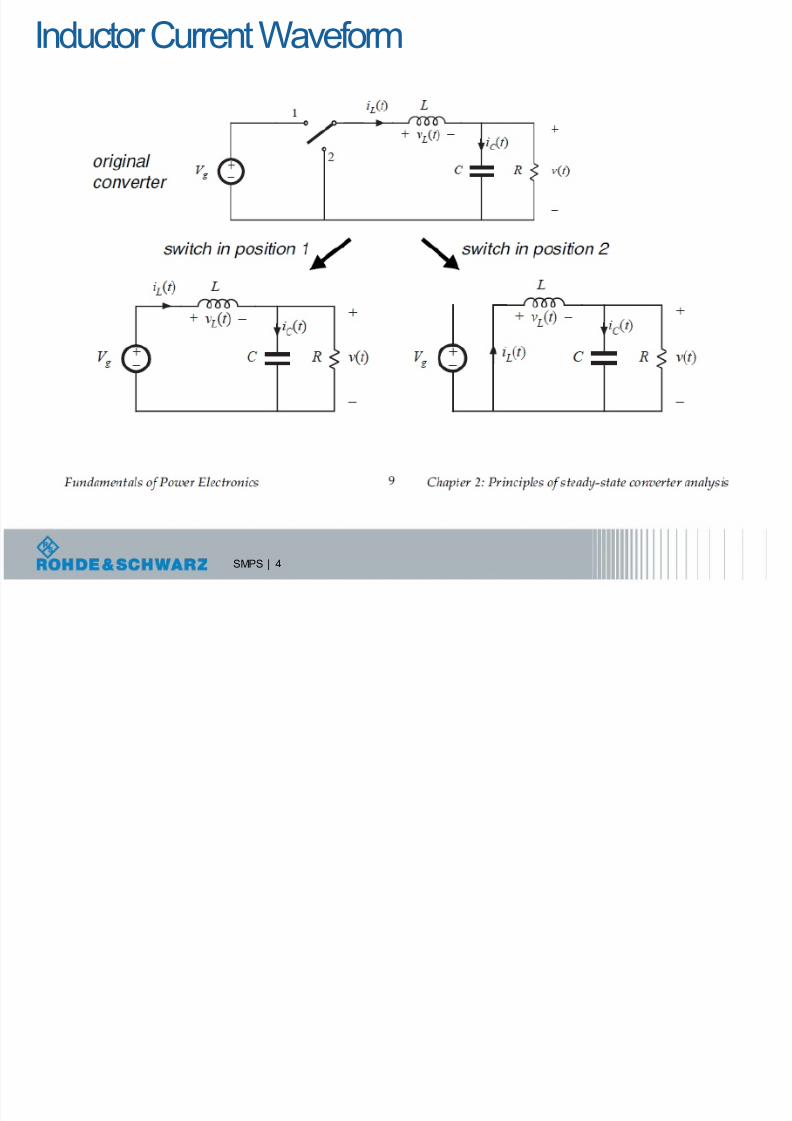
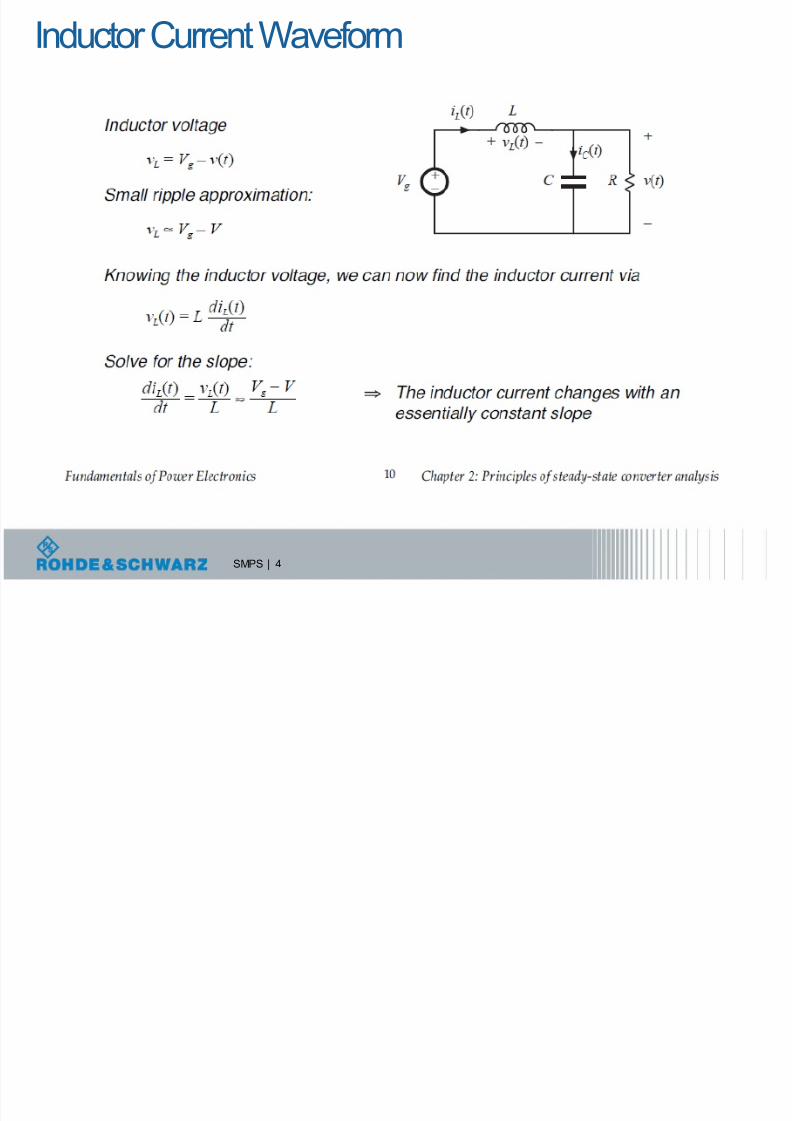
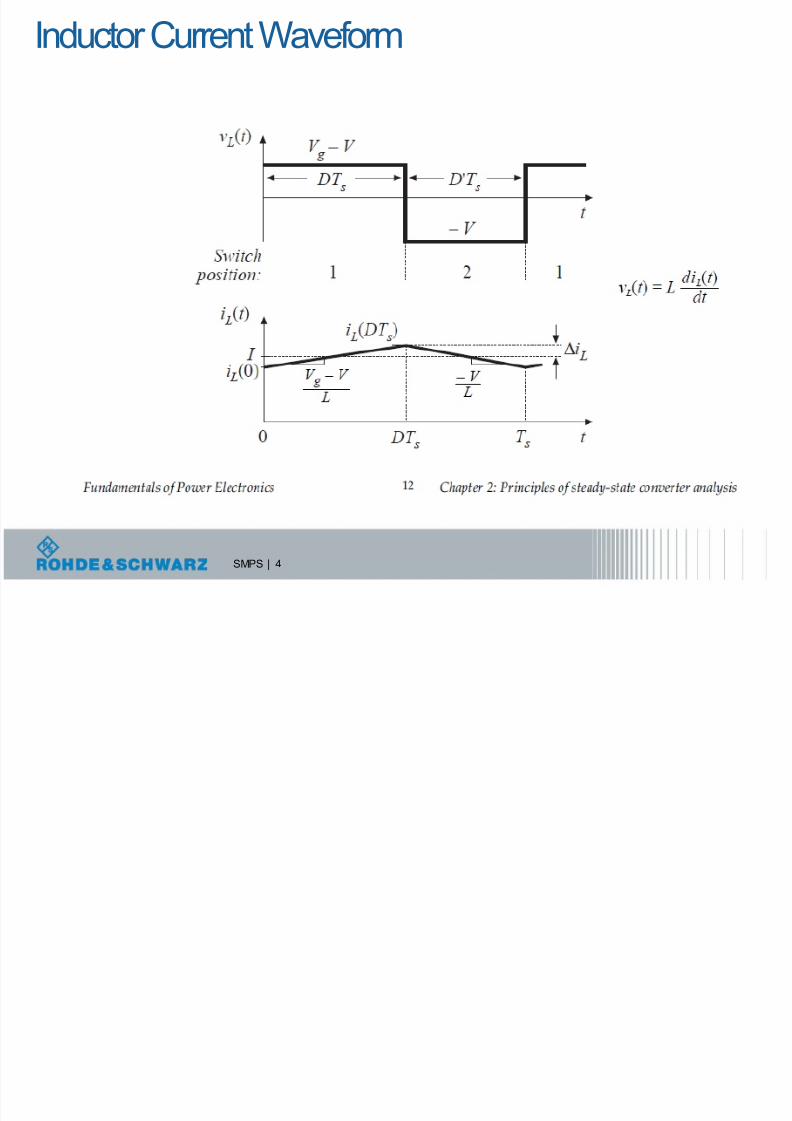
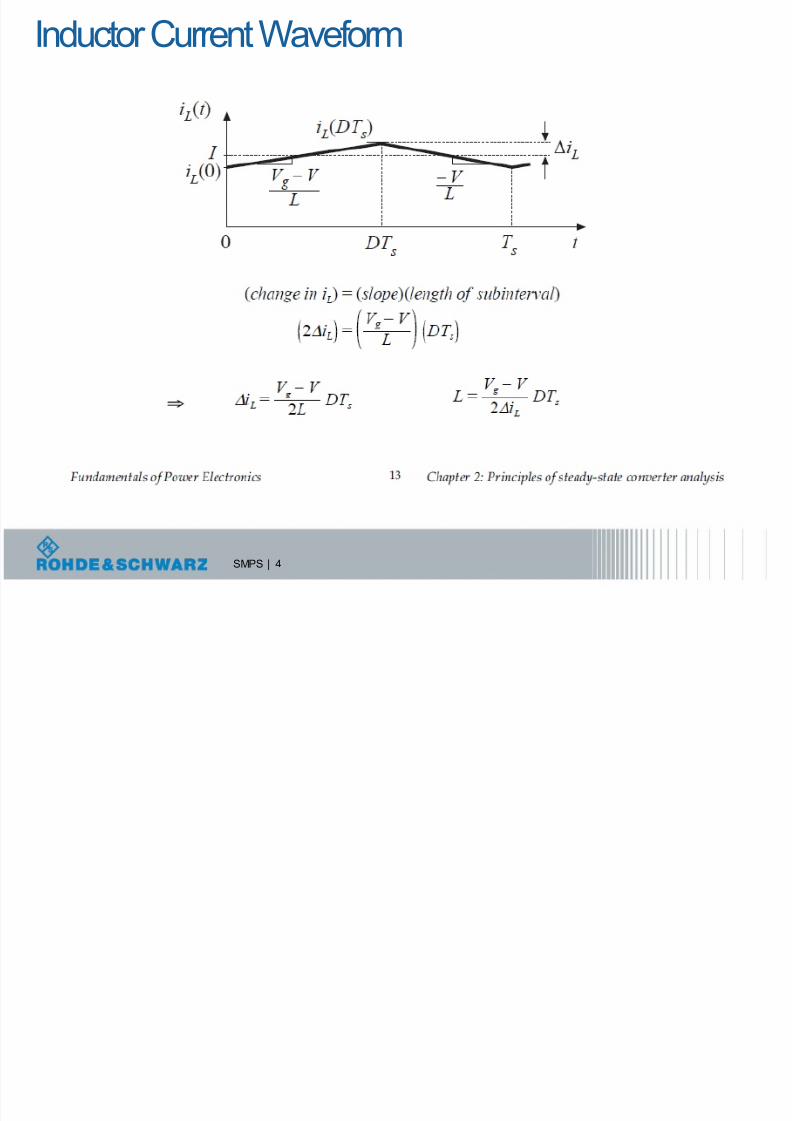
Inductor Current Waveform
InductorCurrentWaveform
8/20/2019 Serial Bus Debug
http://slidepdf.com/reader/full/serial-bus-debug 50/64
SMPS | 4
Inductor Current Waveform
InductorCurrentWaveform

8/20/2019 Serial Bus Debug
http://slidepdf.com/reader/full/serial-bus-debug 51/64
SMPS | 4
Inductor Current Waveform
InductorCurrentWaveform
8/20/2019 Serial Bus Debug
http://slidepdf.com/reader/full/serial-bus-debug 52/64
SMPS | 4
Inductor Current Waveform
InductorCurrentWaveform
8/20/2019 Serial Bus Debug
http://slidepdf.com/reader/full/serial-bus-debug 53/64
SMPS | 4
Inductor Current Waveform
What are we going to look at
8/20/2019 Serial Bus Debug
http://slidepdf.com/reader/full/serial-bus-debug 54/64
What are we going to look at
3/3/2014 FAST: Advanced Triggering 54
VswIL GND
MeasureSwitchNodeVoltage
8/20/2019 Serial Bus Debug
http://slidepdf.com/reader/full/serial-bus-debug 55/64
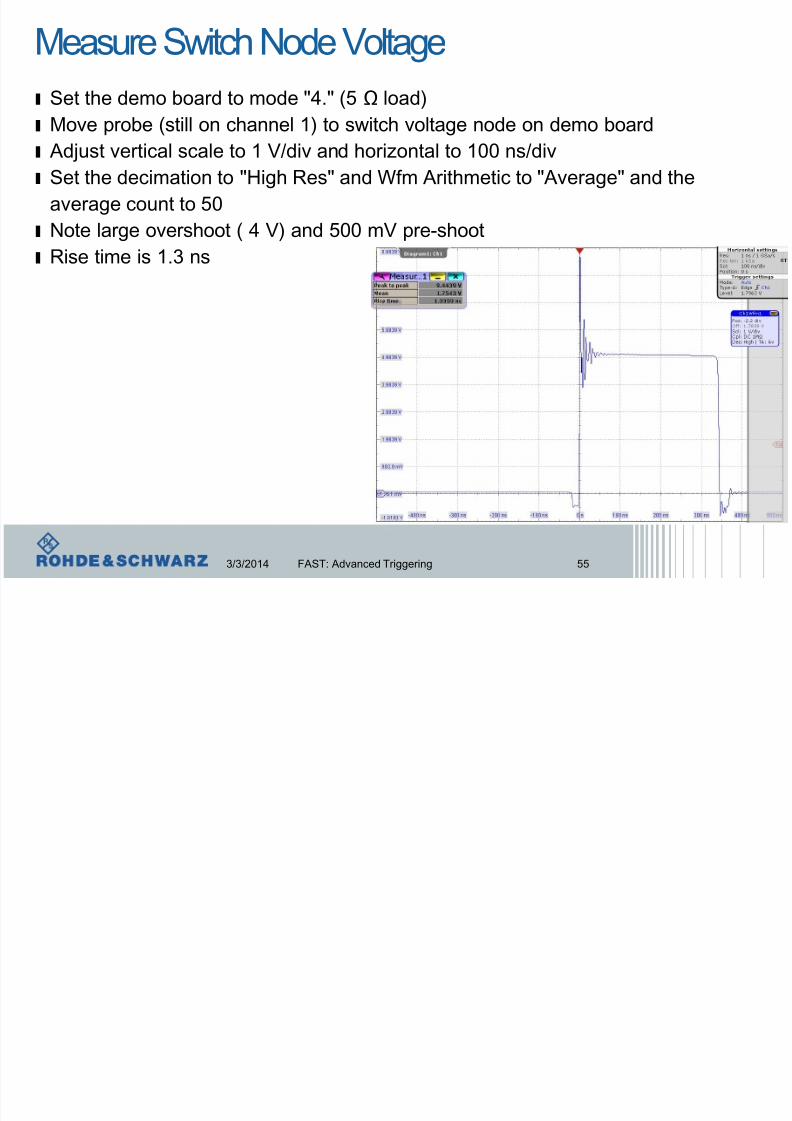
Measure Switch Node Voltage
3/3/2014 FAST: Advanced Triggering 55
ı Set the demo board to mode "4." (5 Ω load)
ı Move probe (still on channel 1) to switch voltage node on demo board
ı Adjust vertical scale to 1 V/div and horizontal to 100 ns/divı Set the decimation to "High Res" and Wfm Arithmetic to "Average" and the
average count to 50
ı Note large overshoot ( 4 V) and 500 mV pre-shoot
ı Rise time is 1.3 ns
MeasureSwitchNodeVoltage
8/20/2019 Serial Bus Debug
http://slidepdf.com/reader/full/serial-bus-debug 56/64
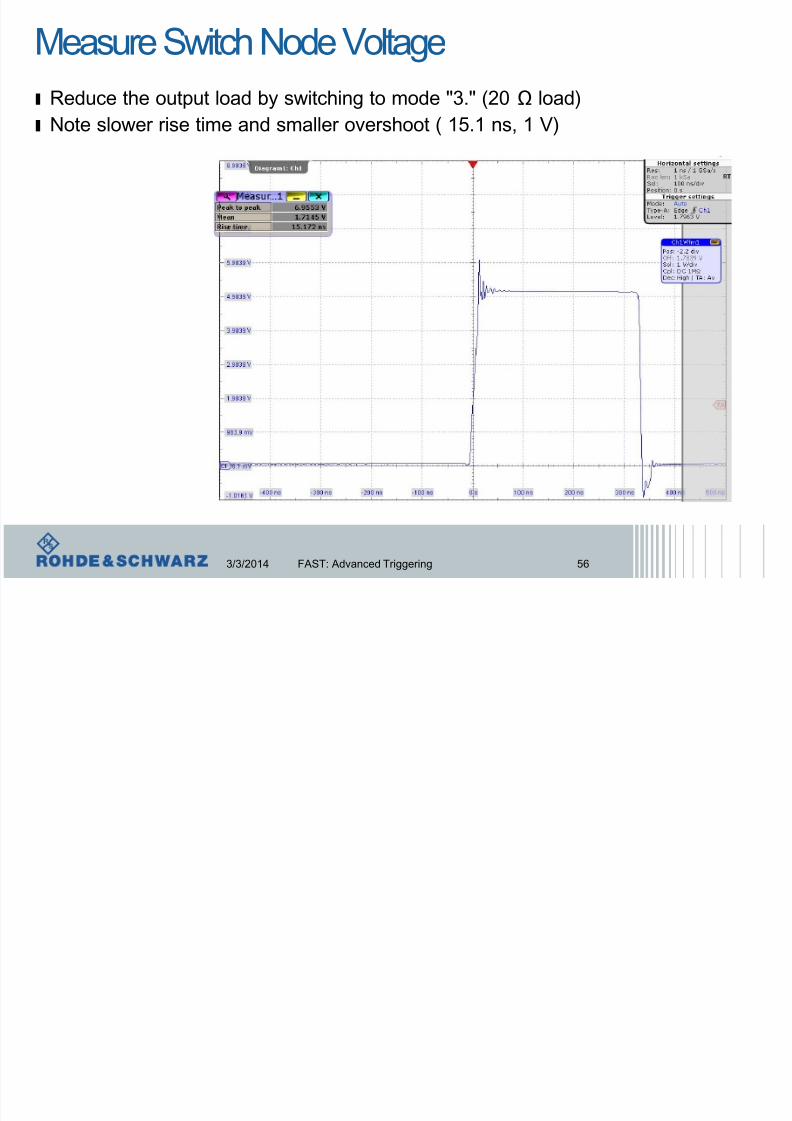
Measure Switch Node Voltage
3/3/2014 FAST: Advanced Triggering 56
ı Reduce the output load by switching to mode "3." (20 Ω load)
ı Note slower rise time and smaller overshoot ( 15.1 ns, 1 V)
MeasureSwitchNodeVoltageandCurrent
8/20/2019 Serial Bus Debug
http://slidepdf.com/reader/full/serial-bus-debug 57/64
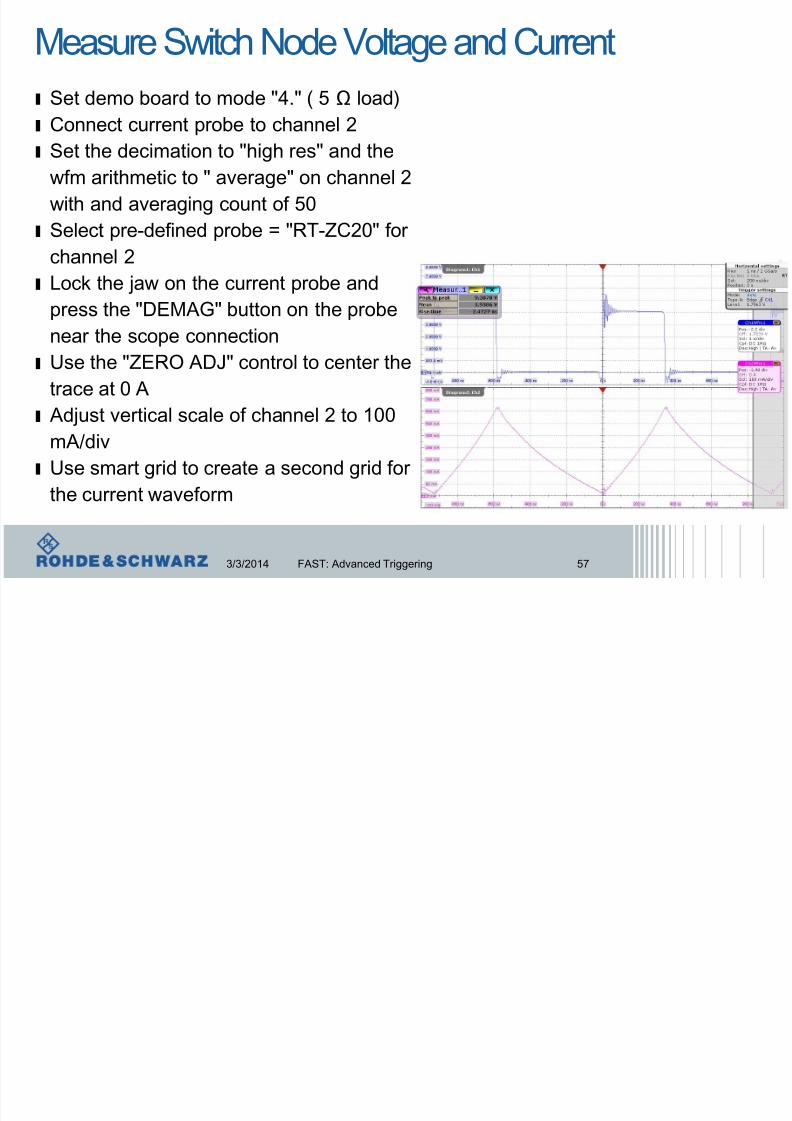
Measure Switch Node Voltage and Current
3/3/2014 FAST: Advanced Triggering 57
ı Set demo board to mode "4." ( 5 Ω load)
ı Connect current probe to channel 2
ı Set the decimation to "high res" and thewfm arithmetic to " average" on channel 2
with and averaging count of 50
ı Select pre-defined probe = "RT-ZC20" for
channel 2
ı Lock the jaw on the current probe andpress the "DEMAG" button on the probe
near the scope connection
ı Use the "ZERO ADJ" control to center the
trace at 0 A
ı
Adjust vertical scale of channel 2 to 100mA/div
ı Use smart grid to create a second grid for
the current waveform
Settingup theCurrentProbe

8/20/2019 Serial Bus Debug
http://slidepdf.com/reader/full/serial-bus-debug 58/64
Setting up the Current Probe
3/3/2014 FAST: Advanced Triggering 58
MeasureSwitchNodeVoltage

8/20/2019 Serial Bus Debug
http://slidepdf.com/reader/full/serial-bus-debug 59/64
Measure Switch Node Voltage
3/3/2014 FAST: Advanced Triggering 59
ı Set demo board to mode "3." (20 Ω load)
Measure InductorVoltageandCurrent
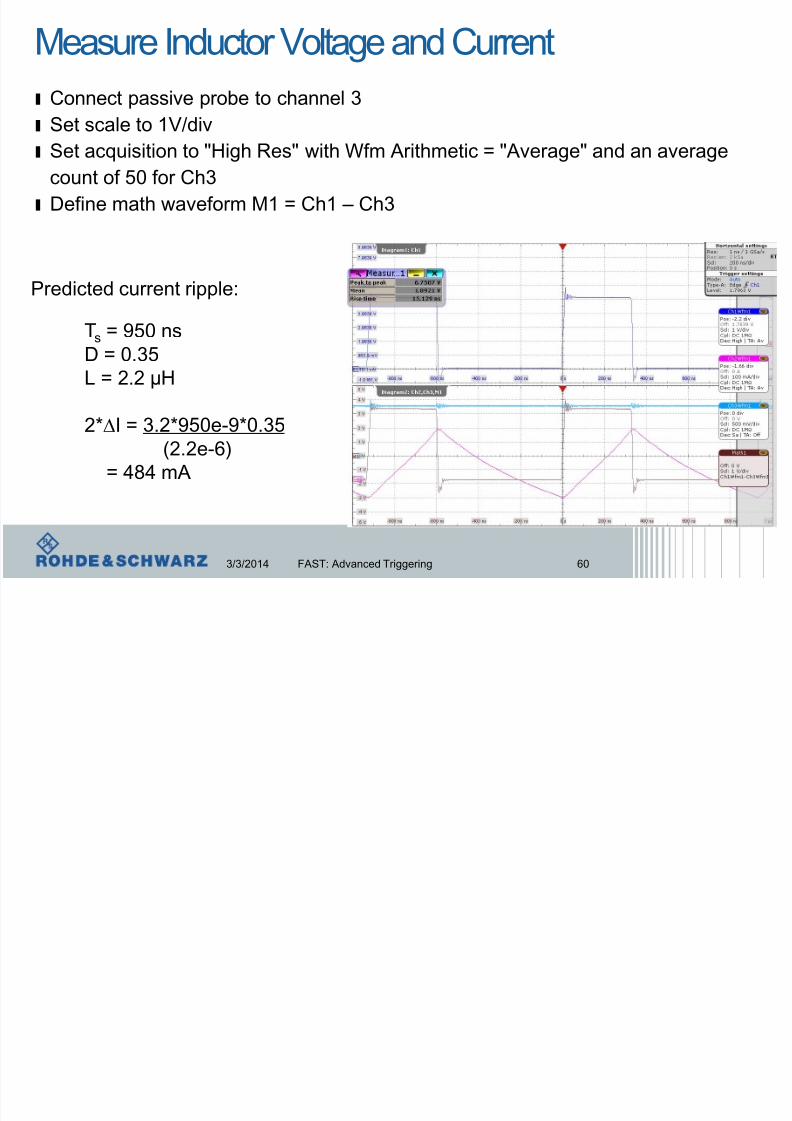
8/20/2019 Serial Bus Debug
http://slidepdf.com/reader/full/serial-bus-debug 60/64
Measure Inductor Voltage and Current
3/3/2014 FAST: Advanced Triggering 60
ı Connect passive probe to channel 3
ı Set scale to 1V/div
ı Set acquisition to "High Res" with Wfm Arithmetic = "Average" and an averagecount of 50 for Ch3
ı Define math waveform M1 = Ch1 – Ch3
Ts = 950 nsD = 0.35L = 2.2 µH
2*∆I = 3.2*950e-9*0.35(2.2e-6)
= 484 mA
Predicted current ripple:
MeasureSwitchNodeVoltage

8/20/2019 Serial Bus Debug
http://slidepdf.com/reader/full/serial-bus-debug 61/64
Measure Switch Node Voltage
3/3/2014 FAST: Advanced Triggering 61
ı Set demo board mode to "4." (5 Ω load)
ı Set the vertical scale for channels 1 and 3 to 2 V/div
ı Measure p-p current ( ~ 700 mA)ı Use inductor current equation to compute L based on p-p current
ı Note the onset of saturation in the inductor
Measured current ripple:
2*∆I = 720 mA Equivalent Inductance:
L = 950e-9*.35*3/0.721
= 1.39 µH
"Extra Credit"
8/20/2019 Serial Bus Debug
http://slidepdf.com/reader/full/serial-bus-debug 62/64
Extra Credit
3/3/2014 FAST: Advanced Triggering 62
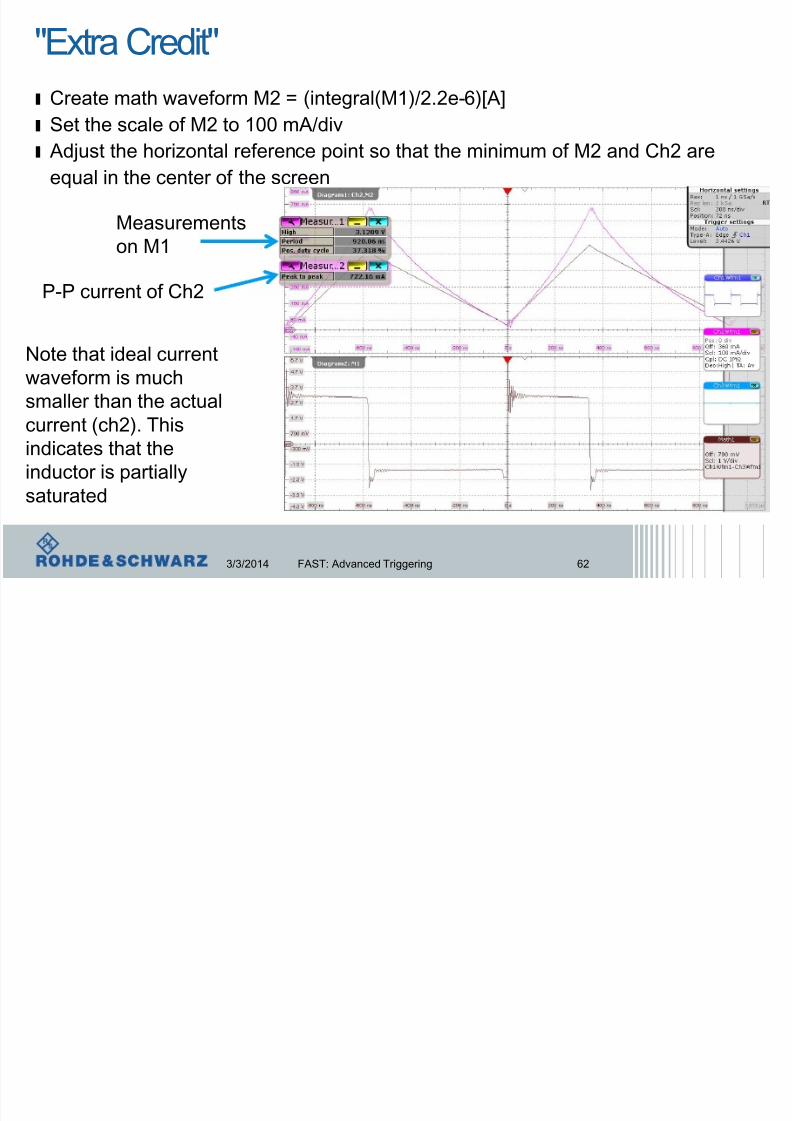
ı Create math waveform M2 = (integral(M1)/2.2e-6)[A]
ı Set the scale of M2 to 100 mA/div
ı Adjust the horizontal reference point so that the minimum of M2 and Ch2 areequal in the center of the screen
Measurementson M1
P-P current of Ch2
Note that ideal currentwaveform is muchsmaller than the actual
current (ch2). Thisindicates that theinductor is partiallysaturated
"Extra Credit 2"
8/20/2019 Serial Bus Debug
http://slidepdf.com/reader/full/serial-bus-debug 63/64
Extra Credit 2
3/3/2014 FAST: Advanced Triggering 63
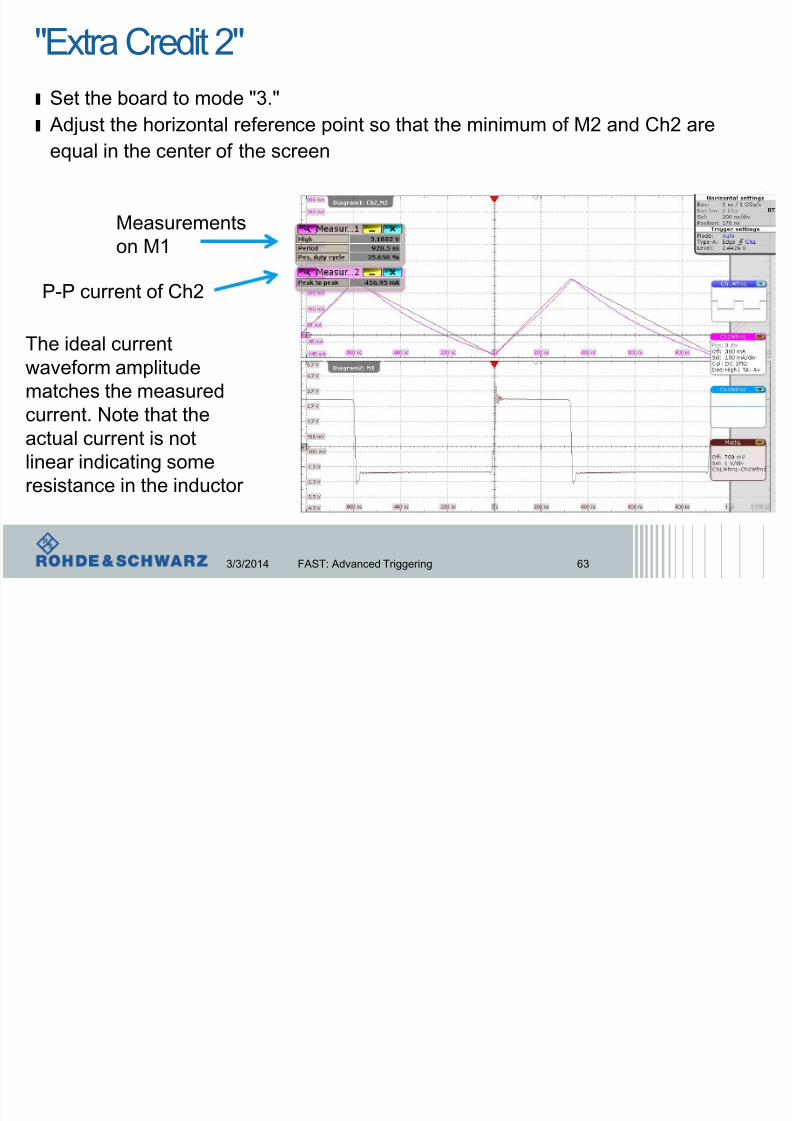
ı Set the board to mode "3."
ı Adjust the horizontal reference point so that the minimum of M2 and Ch2 are
equal in the center of the screen
Measurementson M1
P-P current of Ch2
The ideal currentwaveform amplitudematches the measured
current. Note that theactual current is notlinear indicating someresistance in the inductor
Conclusion
8/20/2019 Serial Bus Debug
http://slidepdf.com/reader/full/serial-bus-debug 64/64
Conclusion
ı Increasing the load to 5 Ω results in reduced voltage (by approximately 200 mV)
and increased voltage ripple
Increased spectral power at 200 MHz
3% ripple voltage
ı Examining the switching node revealed that the inductor appears to be the root
cause
Non-linear IL with 5 Ω load Higher IL over predicted value for rated inductor value
Decreased rise time of Vsw with increased load
Very high inductor current ripple with increased load
ı Comparing measured to ideal waveforms using math
Measured values do not agree with expected values Results indicate that inductor is undersized ( core saturation, copper loss)