Embed Size (px)
Citation preview
Fixed Income MarketsThen and Now
September 8, 2014
Gilbert Andrew Garcia, CFAManaging Partner

2
Table of Contents
I. Market Quiz
II. Evolution of the Fixed Income Market
III. Fixed Income Excess Returns
IV. Valuation
V. Market Developments
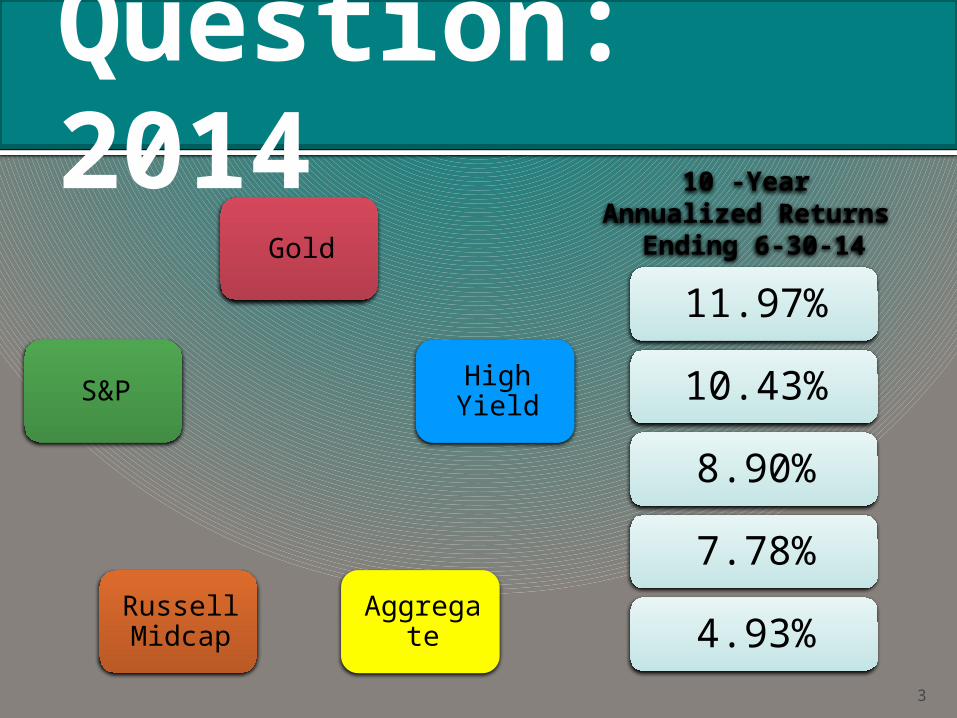
Question: 2014
Gold
High Yield
AggregateRussell Midcap
S&P
3
11.97%
10.43%
8.90%
7.78%
4.93%
10 -Year Annualized Returns
Ending 6-30-14

Answer: 2014
Gold
High Yield
Aggregate
Russell Midcap
S&P
4
11.97%
8.90%
4.93%
10.43%
7.78%
10 -Year Annualized Returns
Ending 6-30-14INDEX

Why is Return not enough?
Return doesn’t account for the risk.
Investors must be compensated for risk.
We should measure returns on a risk adjusted basis.
5
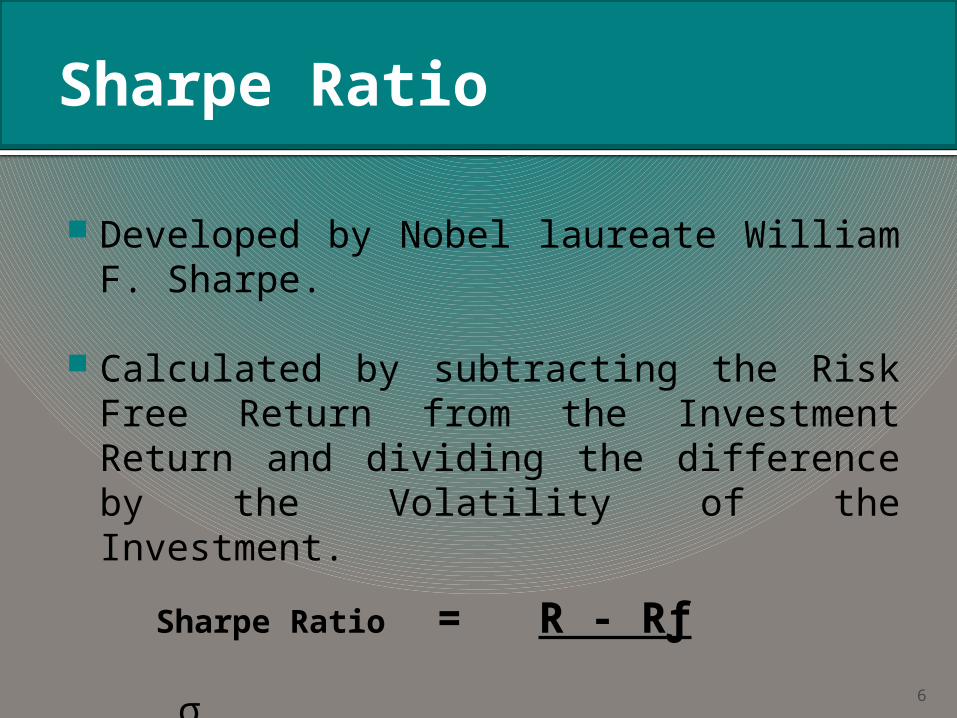
Sharpe Ratio
6
Developed by Nobel laureate William F. Sharpe.
Calculated by subtracting the Risk Free Return from the Investment Return and dividing the difference by the Volatility of the Investment.
Sharpe Ratio = R - Rƒ σ
A higher Sharpe ratio equates to better risk-adjusted performance.

Reality: 2014
Gold
High Yield
Aggregate
Russell Midcap
S&P
7
11.97%
8.90%
4.93%
10.43%
7.78%
10 -Year Annualized Returns
Ending 6-30-14INDEX
10 -Year Sharpe Ratio
Ending 6-30-14
1.04
0.54
0.71
0.50
0.42
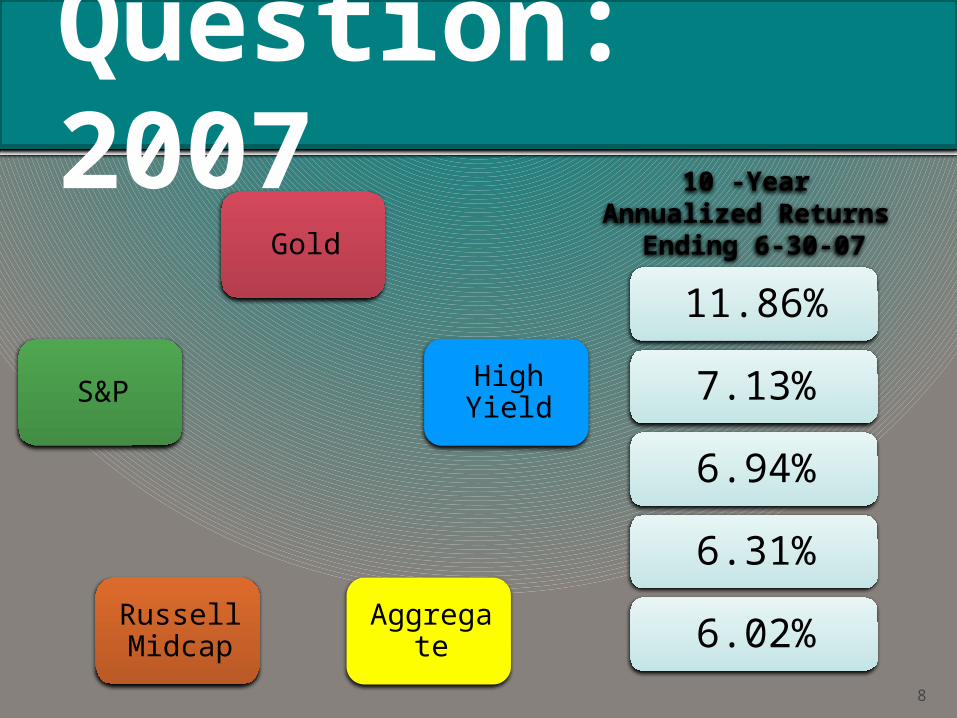
Question: 2007
Gold
High Yield
AggregateRussell Midcap
S&P
8
11.86%
7.13%
6.94%
6.31%
6.02%
10 -Year Annualized Returns
Ending 6-30-07
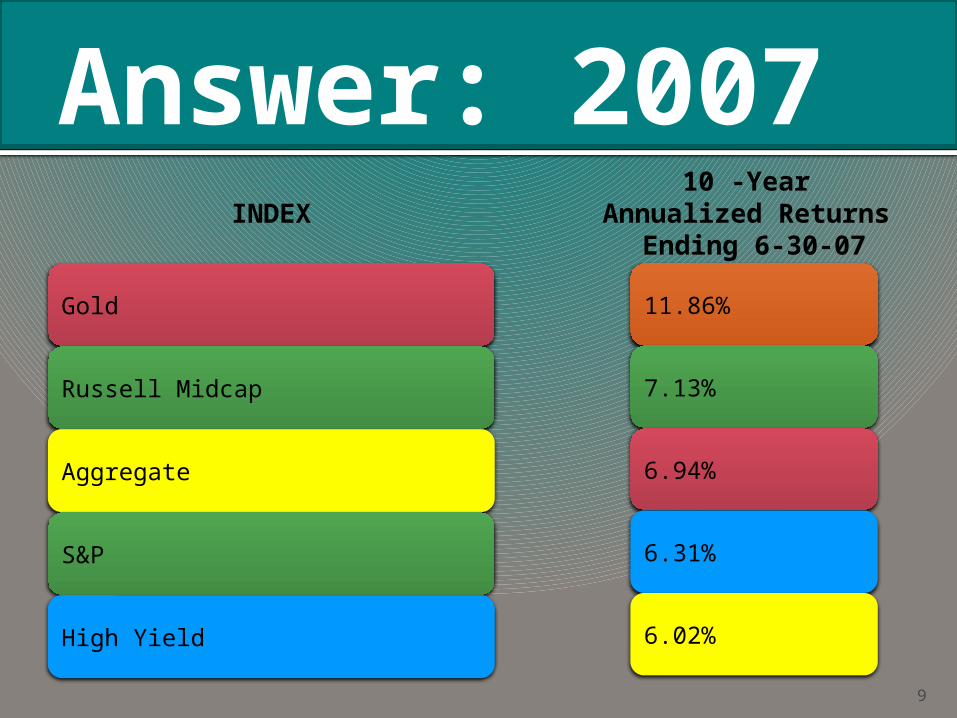
Answer: 2007
Gold
Russell Midcap
Aggregate
S&P
High Yield
9
11.86%
7.13%
6.94%
6.31%
6.02%
10 -Year Annualized Returns
Ending 6-30-07INDEX

Reality: 2007
Gold
Russell Midcap
Aggregate
S&P
High Yield
10
10 -Year Annualized Returns
Ending 6-30-07INDEX
10 -Year Sharpe Ratio
Ending 6-30-07
0.66
0.51
0.37
0.23
0.23
11.86%
7.13%
6.94%
6.31%
6.02%

Sharpe Ratio 2014 - vs- 2007
11
INDEX10 -Year
Sharpe RatioEnding 6-30-14
10 -Year Sharpe Ratio
Ending 6-30-07
Gold
High Yield
Aggregate
Russell Midcap
S&P
1.04
0.54
0.71
0.50
0.42
0.66
0.51
0.37
0.23
0.23
12
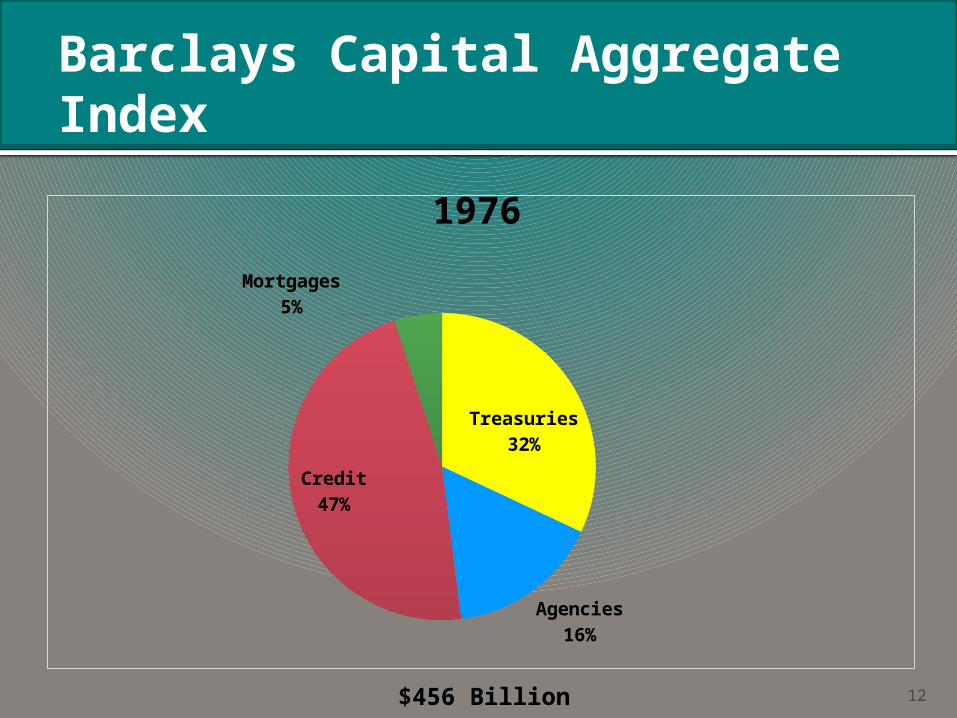
Barclays Capital Aggregate Index
Treasuries32%
Agencies16%
Credit47%
Mortgages5%
1976
$456 Billion
13
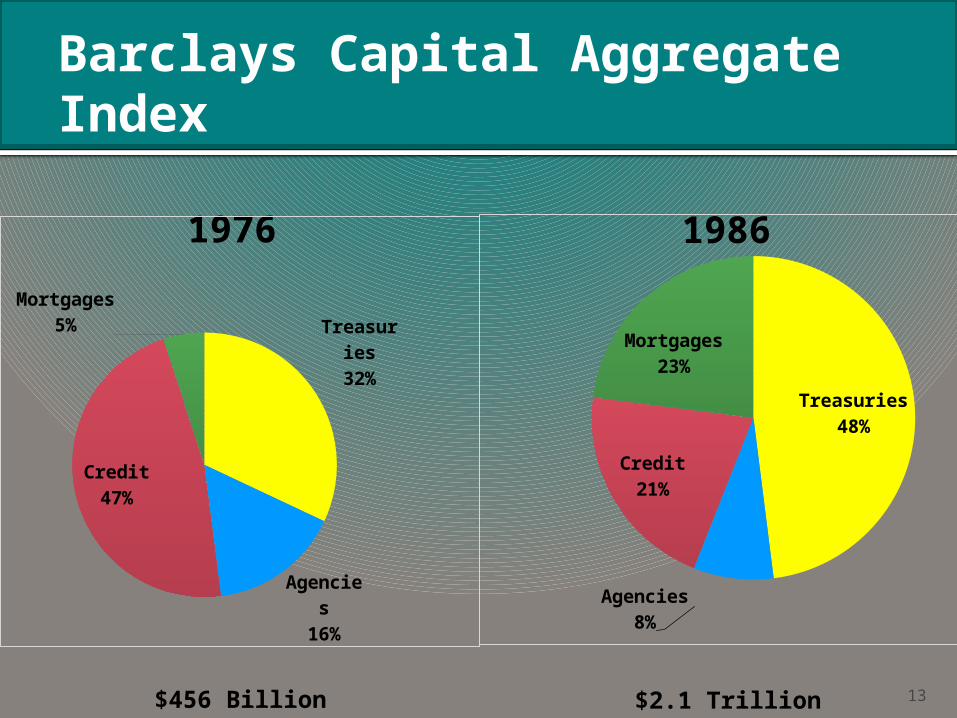
Barclays Capital Aggregate Index
Treasuries48%
Agencies8%
Credit21%
Mortgages23%
1976 1986
$2.1 Trillion
Treasuries32%
Agencies16%
Credit47%
Mortgages5%
$456 Billion

14
Barclays Capital Aggregate Index
Treasuries48%
Agencies8%
Credit21%
Mortgages23% CMO’s invented
MBS along the yield curve
Floating rate traunches
PAC’s
1986
$2.1 Trillion 14
15
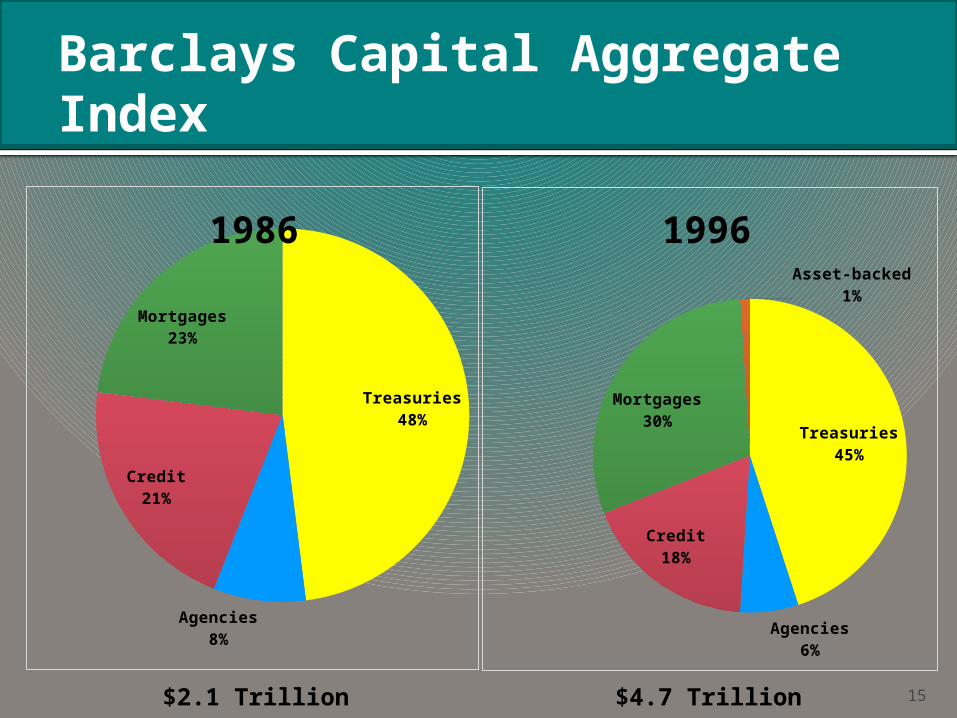
Barclays Capital Aggregate Index
Treasuries48%
Agencies8%
Credit21%
Mortgages23%
Treasuries45%
Agencies6%
Credit18%
Mortgages30%
Asset-backed1%
19961986
$2.1 Trillion $4.7 Trillion

16
Barclays Capital Aggregate Index
Treasuries35%
Agencies4%
Credit30%
Mortgages29%
Asset-Backed3%
NOW
$17.1 Trillion

17
Treasuries32%
Agencies16%
Credit47%
Mortgages5%
Barclays Capital Aggregate Index
Treasuries35%
Agencies4%
Credit30%
Mortgages29%
Asset-Backed3%
1976
$456 Billion
NOW
$17.1 Trillion

Question: 2014
Agency
ABS
Corporates
MBS
18
44.73%
30.38%
22.13%
16.81%
20 -Year Excess Return Ending 6-30-14

Answer: 2014
Agency
Corporates
ABS
MBS
19
44.73%
30.38%
22.13%
16.81%
20 -Year Excess Return Ending 6-30-14
INDEX
20
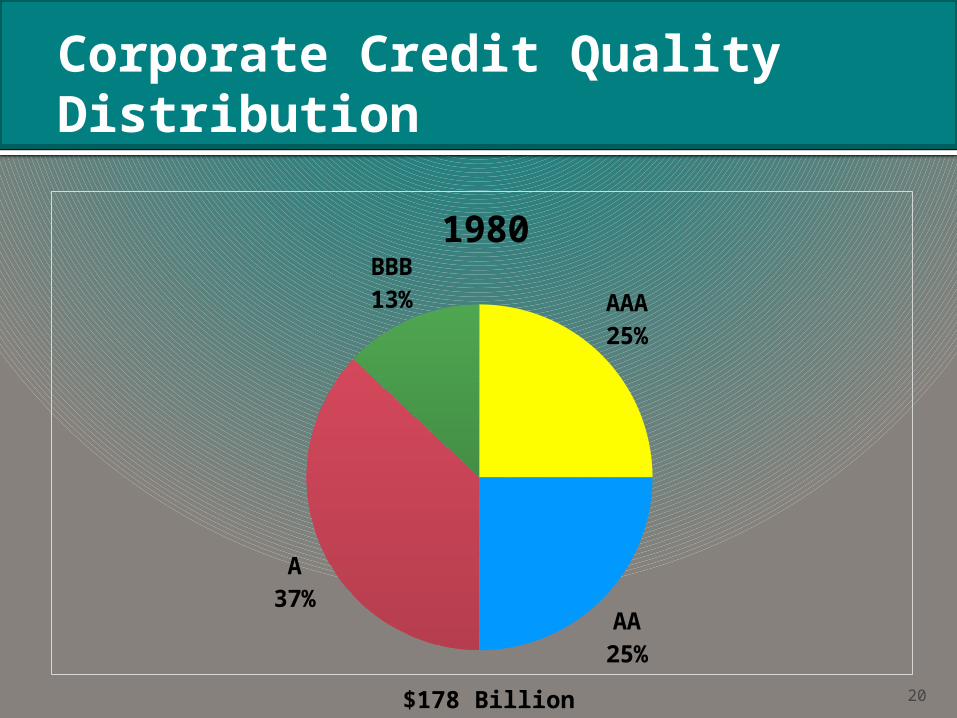
Corporate Credit Quality Distribution
AAA25%
AA25%
A37%
BBB13%
1980
$178 Billion
21
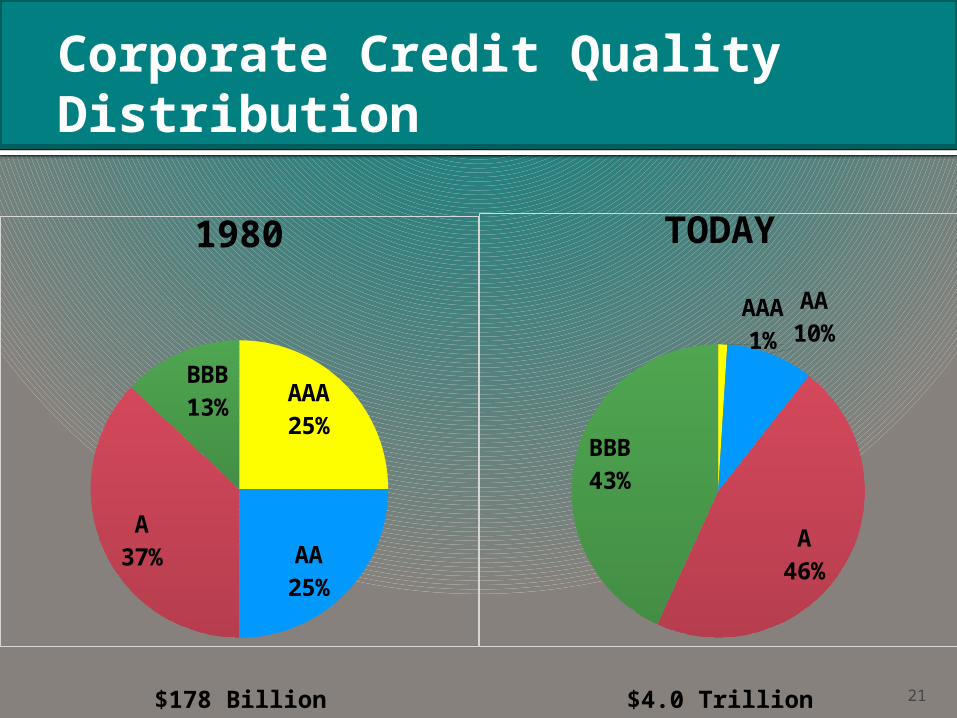
Corporate Credit Quality Distribution
AAA1%
AA10%
A46%
BBB43%
AAA25%
AA25%
A37%
BBB13%
1980 TODAY
$178 Billion $4.0 Trillion
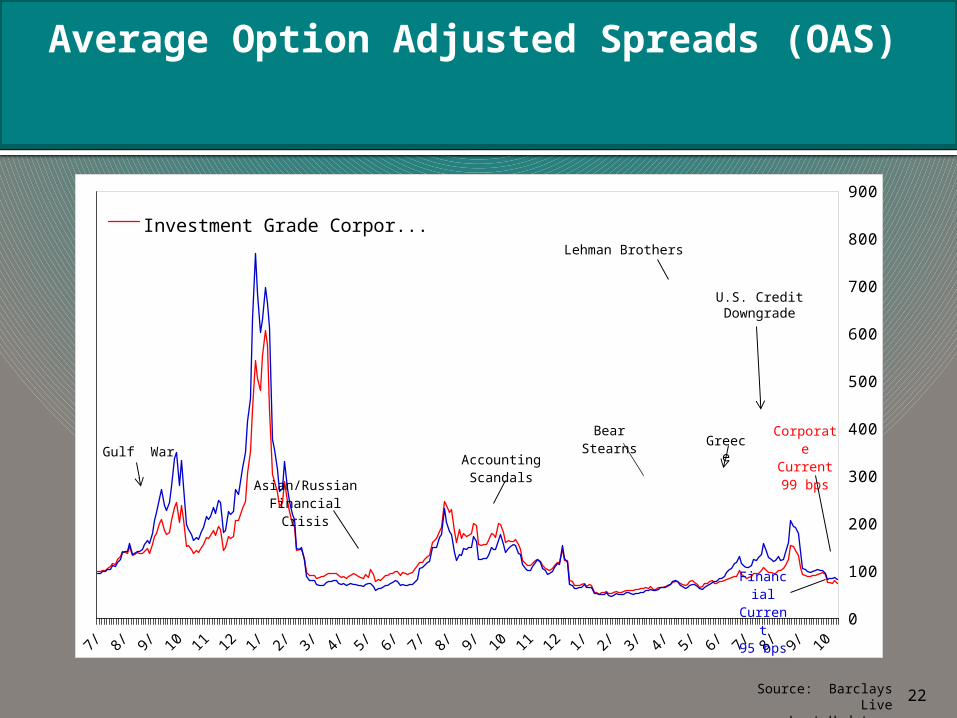
Average Option Adjusted Spreads (OAS)
22Source: Barclays Live
Last Update: 7/31/2014
'89 '90 '91 '92 '93 '94 '95 '96 '97 '98 '99 '00 '01 '02 '03 '04 '05 '06 '07 '08 '09 '10 '11 '12 '13 '140
100
200
300
400
500
600
700
800
900
Investment Grade Corporate...
Asian/RussianFinancial Crisis
Accounting Scandals
Bear Stearns CorporateCurrent99 bps
Finan-cial
Current95 bps
Lehman Brothers
Greece
U.S. Credit Downgrade
Gulf War
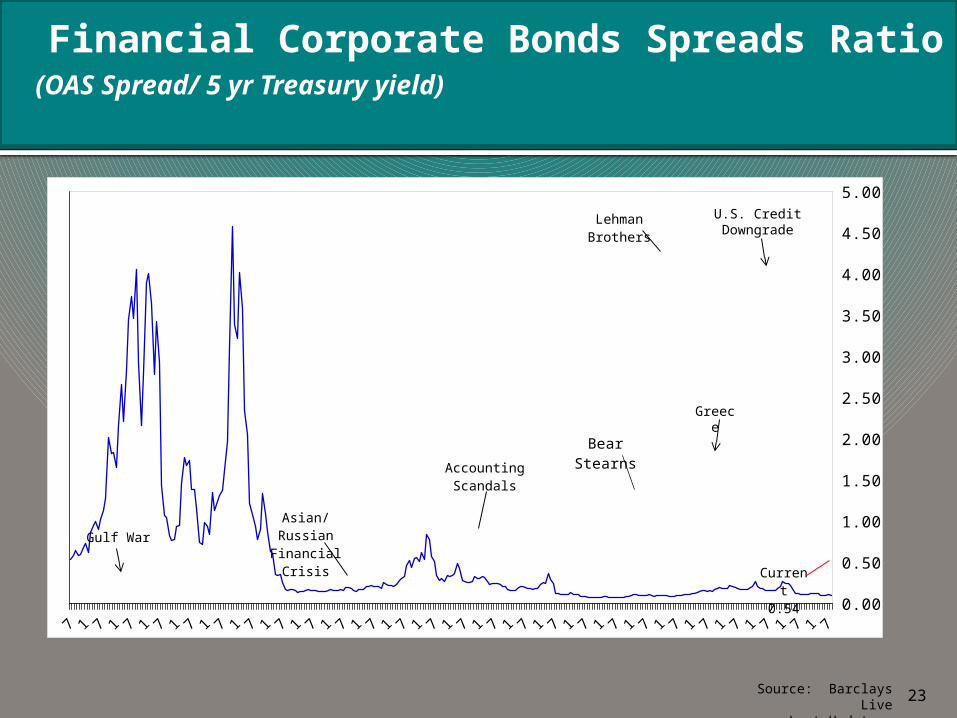
(OAS Spread/ 5 yr Treasury yield)
Financial Corporate Bonds Spreads Ratio
23Source: Barclays Live
Last Update: 7/31/2014
'89 '90 '91 '92 '93 '94 '95 '96 '97 '98 '99 '00 '01 '02 '03 '04 '05 '06 '07 '08 '09 '10 '11 '12 '13 '140.00
0.50
1.00
1.50
2.00
2.50
3.00
3.50
4.00
4.50
5.00
Asian/RussianFinancial Crisis
Accounting Scandals
Bear Stearns
Current0.54
Lehman Brothers
Greece
U.S. Credit Downgrade
Gulf War
24
Market Developments
Electronic Trading
TRACE Data

25
TRACE Example