Embed Size (px)
Citation preview

September 2008
The Evolving Media Economy

www.MagnaInsights.com2
Once Upon a Time, Marketing = Media + Creative
•Traditional media was primary (sole?) venue for communications objectives

www.MagnaInsights.com3
But Fragmentation Fractured That Proposition

www.MagnaInsights.com4
Music Was The Canary In The Coal Mine
Source: Magna, RIAA
•Digitization changed production, distribution and consumption
6,000
8,000
10,000
12,000
14,000
16,000
18,000
1991
1992
1993
1994
1995
1996
1997
1998
1999
2000
2001
2002
2003
2004
2005
2006
2007
Rev
enu
es (
$000
s)
TotalDigitalSales
RetailSales
Manufacturers'Shipments
Manufacturers' Shipments of Recorded Music
Napster Launched (June 1999)
BitTorrent, Kazaa, Grokster, etc. active
iTunes Launch (March 2003)

www.MagnaInsights.com5
And DVRs Were To Be The Last Nail In The Coffin

www.MagnaInsights.com6
With A Digital Revolution Blooming In The Aftermath
www.MagnaInsights.com7
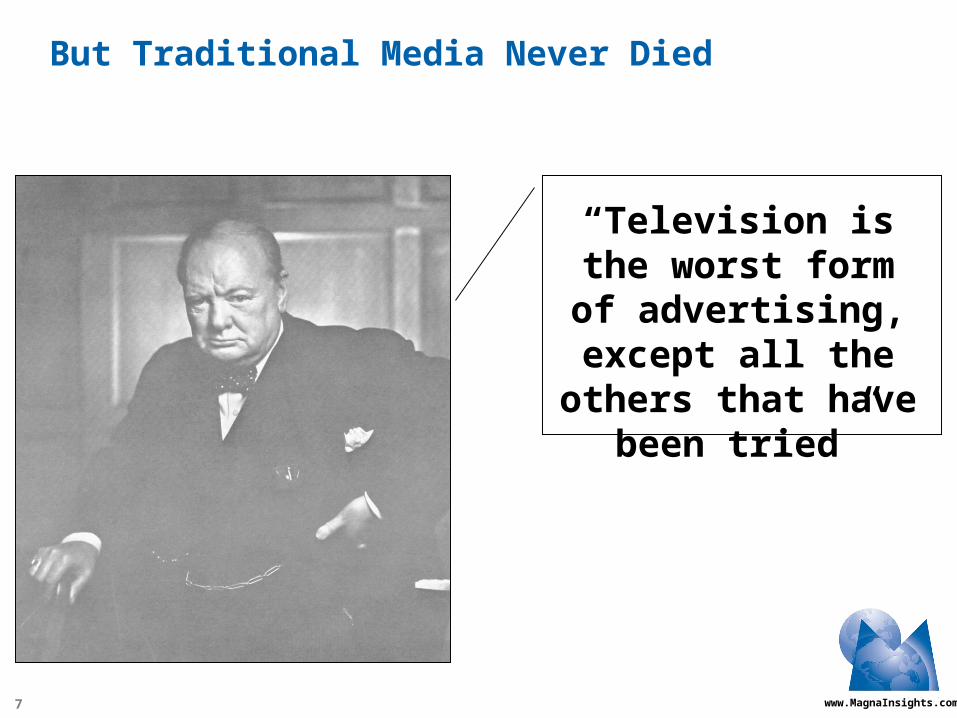
But Traditional Media Never Died
“Television is the worst form of
advertising, except all the others that have been tried”

www.MagnaInsights.com8
But Traditional Media Never Died
•New advertisers rely on it for mass branding effects
1 McDonald's 1 AT&T Wireless2 KFC 2 Verizon3 Burger King 3 Sprint4 Miller Lite 4 McDonald's5 Budweiser 5 Home Depot6 AT&T 6 T-Mobile7 Wendy's 7 Subway8 American Express 8 Toyota Tundra9 Miller High Life 9 Lowes
10 Advil 10 Wendy's
20071987
Top 10 Network TV Advertisers
Source: Magna analysis of TNS-CMR data

www.MagnaInsights.com9
But Traditional Media Never Died
•Large brand-based advertisers: focus on reach…
Network TV Prime Time Reach - Live Only Adults 18-49
96.17% 96.72%
0.0%
10.0%
20.0%
30.0%
40.0%
50.0%
60.0%
70.0%
80.0%
90.0%
100.0%
2002 2007
Source: Initiative Analysis of Nielsen Data
www.MagnaInsights.com10
Source: Magna, US Census, Veronis Suhler, OPA
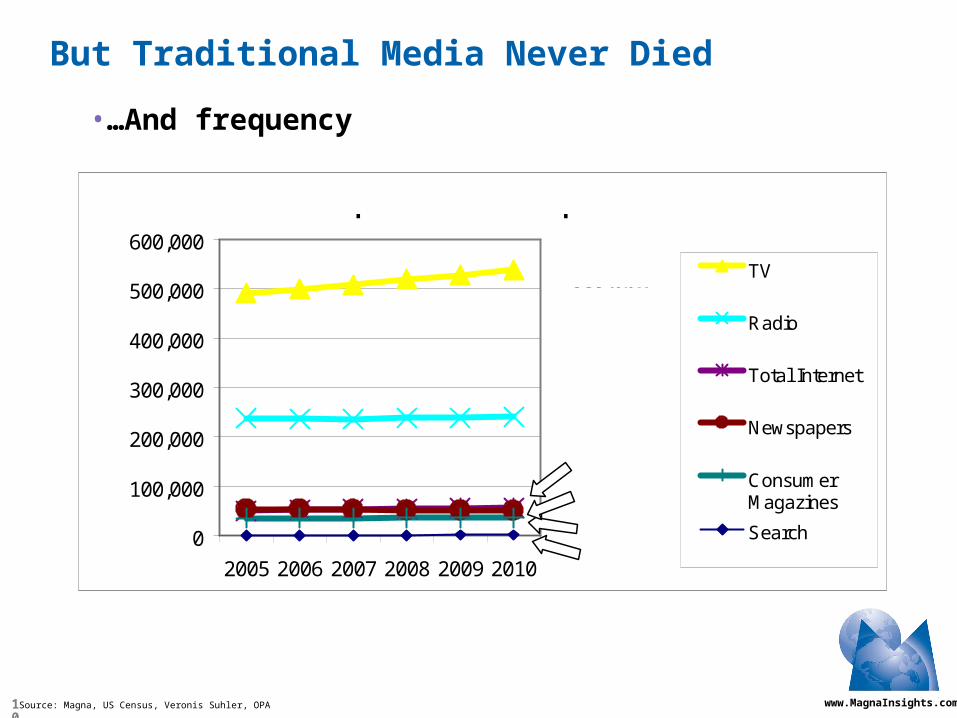
But Traditional Media Never Died
•…And frequency
0
100,000
200,000
300,000
400,000
500,000
600,000
2005 2006 2007 2008 2009 2010
TV
Radio
Total Internet
Newspapers
ConsumerMagazines
Search
1.8bn
37.0bn
51.3bn
56.9bn
241.3bn
539.0bn
Total US Population: Hours Spent With Media
Mil
lio
ns
of
Per
son
-Ho
urs
Per
Yea
r
www.MagnaInsights.com11
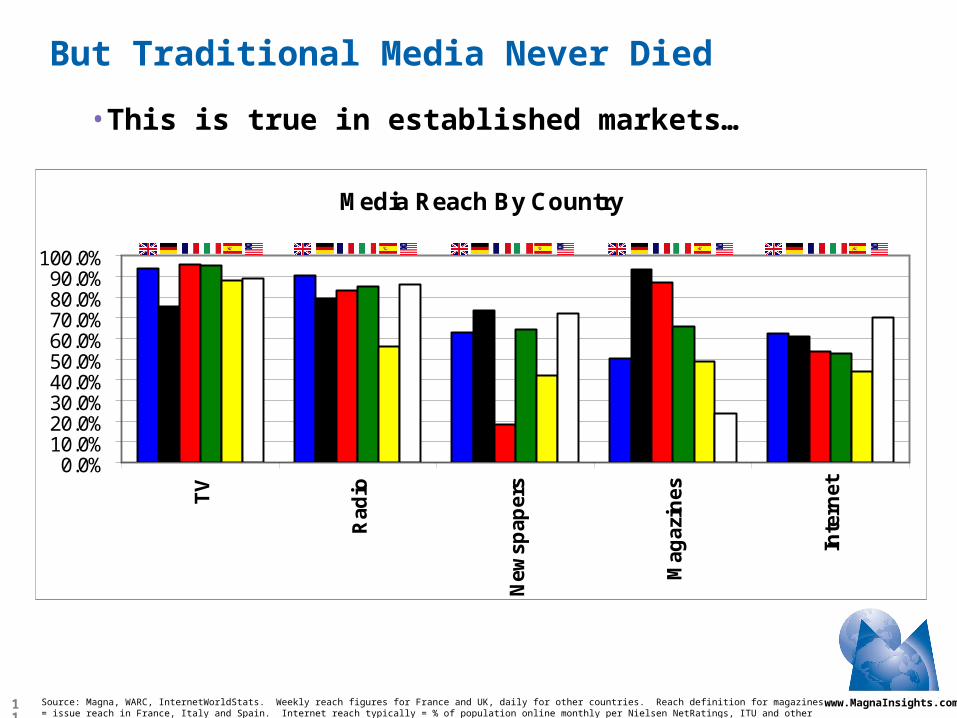
Source: Magna, WARC, InternetWorldStats. Weekly reach figures for France and UK, daily for other countries. Reach definition for magazines = issue reach in France, Italy and Spain. Internet reach typically = % of population online monthly per Nielsen NetRatings, ITU and other sources as of June 30 2007 (except for US = March 31, 2007)
But Traditional Media Never Died
•This is true in established markets…
Media Reach By Country
0.0%10.0%20.0%30.0%40.0%50.0%60.0%70.0%80.0%90.0%
100.0%
TV
Rad
io
New
spap
ers
Mag
azin
es
Inte
rnet

www.MagnaInsights.com12
But Traditional Media Never Died
•…And emerging ones
Source: Magna, WARC, InternetWorldStats. Weekly figures for Brazil and Russia. Russia, China and India magazines are issue reach figures. Indian TV and radio = daily, newspapers = issue. Chinese TV = weekly and radio = daily. Internet typically = % of population online monthly per Nielsen NetRatings, ITU and other sources as of June 30 2007
Media Reach By Country
0.0%10.0%20.0%30.0%40.0%50.0%60.0%70.0%80.0%90.0%
100.0%
TV
Rad
io
New
spap
ers
Mag
azin
es
Inte
rnet
www.MagnaInsights.com13
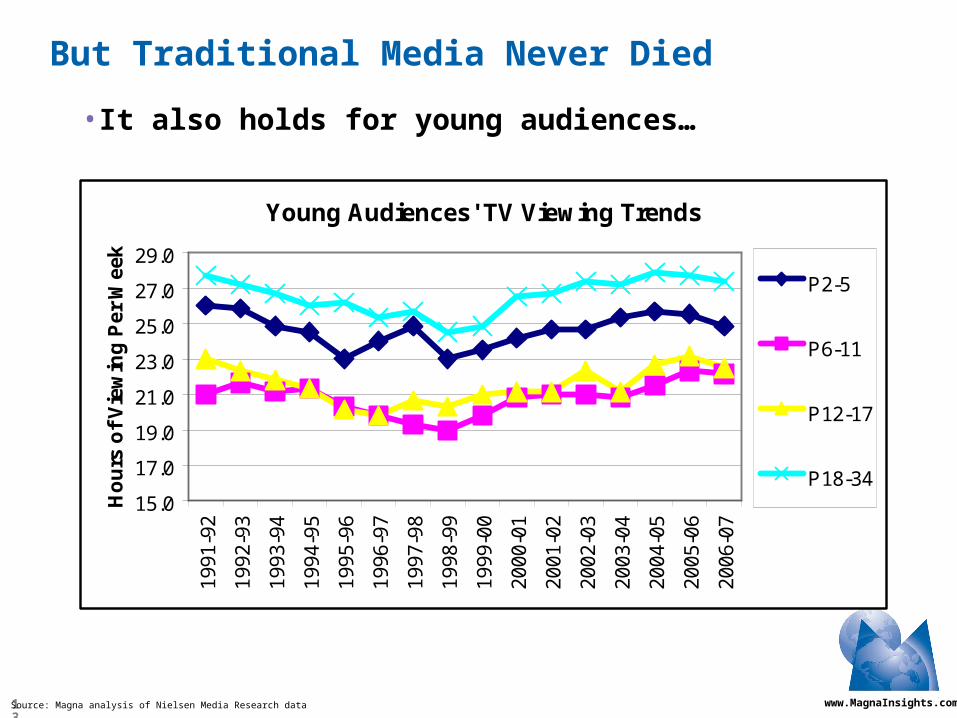
But Traditional Media Never Died
•It also holds for young audiences…
Young Audiences' TV Viewing Trends
15.0
17.0
19.0
21.0
23.0
25.0
27.0
29.0
1991
-92
1992
-93
1993
-94
1994
-95
1995
-96
1996
-97
1997
-98
1998
-99
1999
-00
2000
-01
2001
-02
2002
-03
2003
-04
2004
-05
2005
-06
2006
-07
Ho
urs
of
Vie
win
g P
er W
eek
P2-5
P6-11
P12-17
P18-34
Source: Magna analysis of Nielsen Media Research data
www.MagnaInsights.com14
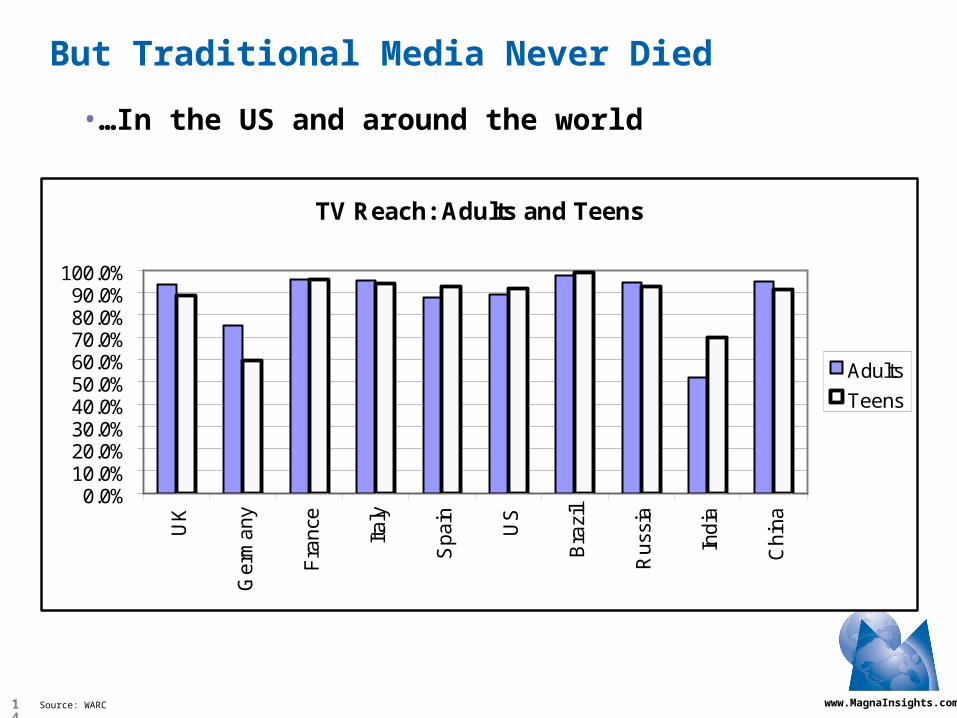
But Traditional Media Never Died
•…In the US and around the world
Source: WARC
TV Reach: Adults and Teens
0.0%10.0%20.0%30.0%40.0%50.0%60.0%70.0%80.0%90.0%
100.0%
UK
Ger
man
y
Fra
nce
Italy
Spa
in
US
Bra
zil
Rus
sia
Indi
a
Chi
na
Adults
Teens

www.MagnaInsights.com15
Consequences of Reach and Frequency Paradigm
20 YEARS AGO
•Models that were well-designed…

www.MagnaInsights.com16
Consequences of Reach and Frequency Paradigm
20 YEARS AGO
•…For an era of homogenous media platform access…

www.MagnaInsights.com17
Consequences of Reach and Frequency Paradigm
TODAY
•…May not be as well-suited for a world of Web 2.0%…
www.MagnaInsights.com18
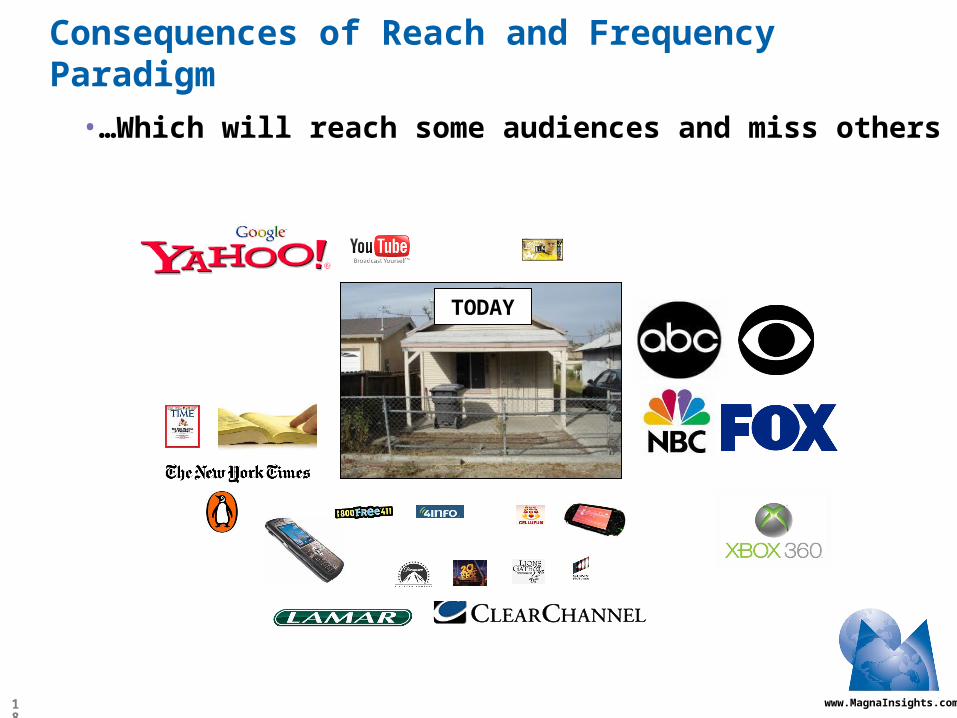
Consequences of Reach and Frequency Paradigm
TODAY
•…Which will reach some audiences and miss others
www.MagnaInsights.com19
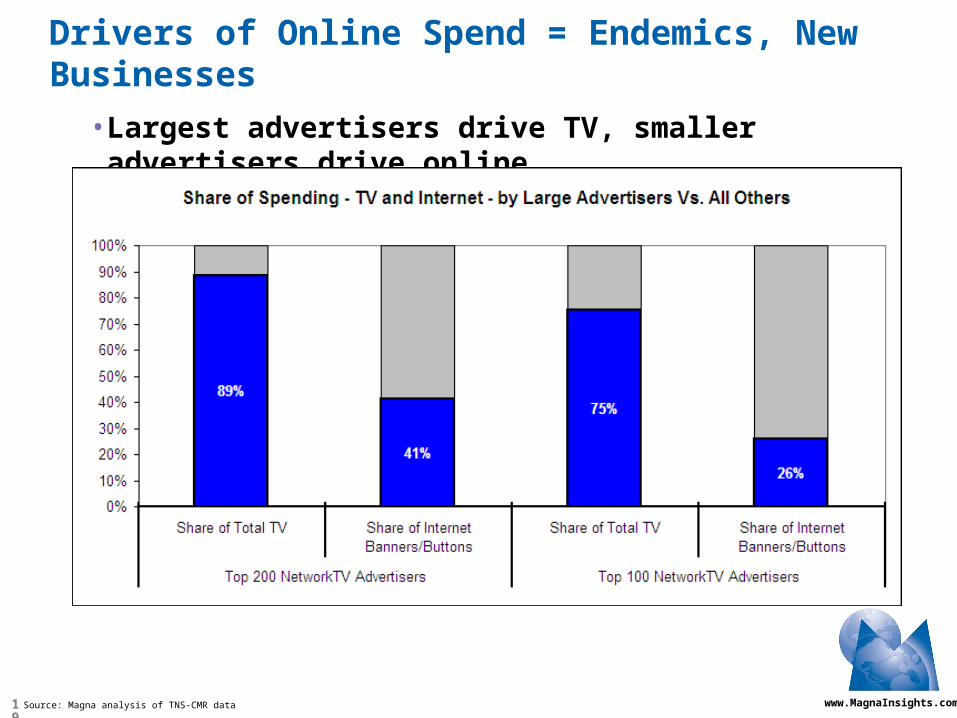
Drivers of Online Spend = Endemics, New Businesses
•Largest advertisers drive TV, smaller advertisers drive online
Source: Magna analysis of TNS-CMR data

www.MagnaInsights.com20
Source: Magna, US Census, Veronis Suhler
Drivers of Online Spend = Endemics, New Businesses
•Reflecting effectiveness for SMEs…
$0.00$1.00$2.00$3.00$4.00$5.00$6.00$7.00$8.00$9.00
$10.00
2005 2006 2007 2008 2009 2010
Search
Newspapers
Total Internet
ConsumerMagazinesTV
Radio
Advertising Dollars Spent Per Hour of Media Consumption
$9.39
$0.94
$0.08
$0.58
$0.10
$0.33

www.MagnaInsights.com21
Drivers of Online Spend = Endemics, New Businesses
•…Who benefit from a Democratization of Advertising
Source: Magna analylsis of IRS data
Ad Expenditures By Small Businesses
4.0
4.2
4.4
4.6
4.8
5.0
5.2
5.4
5.6
5.8
Mil
lio
ns
of
US
Co
rpo
rati
on
s W
ith
<$1
0mm
Ass
ets
(5.0)
5.0
15.0
25.0
35.0
45.0
55.0
Bil
lio
ns
of
Ad
Exp
end
itu
re $
by
Co
rpo
rati
on
s W
ith
<$1
0mm
A
sset
s
Expenditures
Small Businesses
www.MagnaInsights.com22
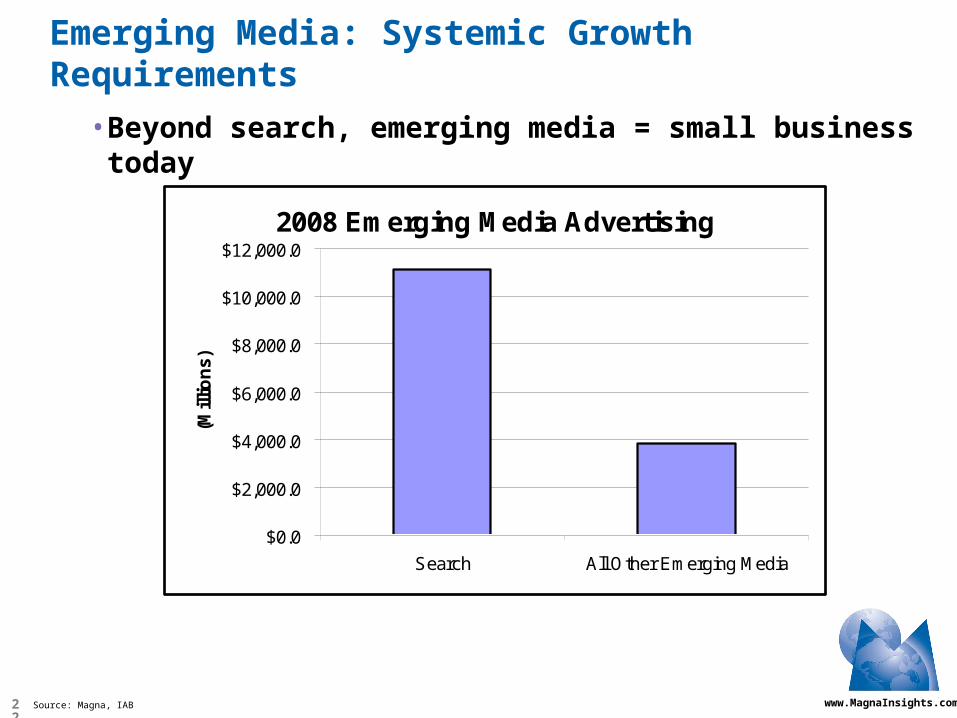
•Beyond search, emerging media = small business today
Emerging Media: Systemic Growth Requirements
Source: Magna, IAB
2008 Emerging Media Advertising
$0.0
$2,000.0
$4,000.0
$6,000.0
$8,000.0
$10,000.0
$12,000.0
Search All Other Emerging Media
(Mill
ion
s)

www.MagnaInsights.com23
Emerging Media: Systemic Growth Requirements
•Impacting “gut” decisions
= ?

www.MagnaInsights.com24
Emerging Media: Systemic Growth Requirements
•Establishing better infrastructure

www.MagnaInsights.com25
Emerging Media: Systemic Growth Requirements
•Re-aligning organizational structure
Operating Division
Retail Distribution
Product Development
Branding
CEO
Other Corporate Functions
COO
PR / Corporate Communications
Operating Division
Product Development
Branding
Operating Division
Product Development
Branding
CMO / Central Marketing
Creative OtherMedia
Marketing, PR, Retail, Sales
Marketing, PR, Retail, Sales
Marketing, PR, Retail, Sales
Source: Magna
Direct / Online Sales
www.MagnaInsights.com26
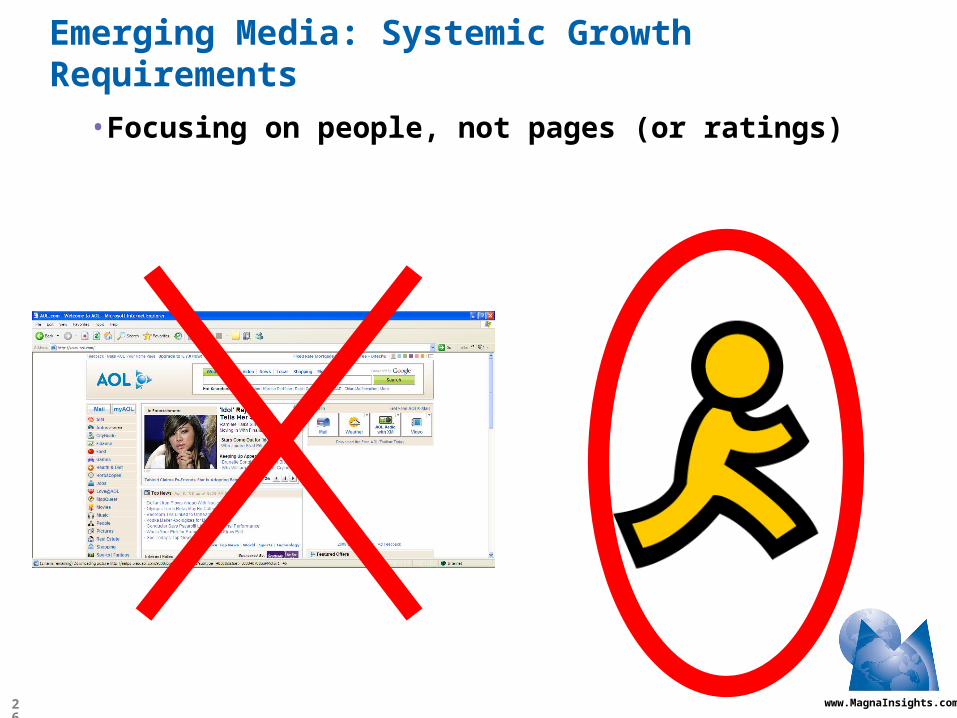
Emerging Media: Systemic Growth Requirements
•Focusing on people, not pages (or ratings)

www.MagnaInsights.com27
Emerging Media: Systemic Growth Requirements
•Assessing value, not cost
Top 10 DMAs
$>$National Network

www.MagnaInsights.com28
Emerging Media: Systemic Growth Requirements
•Transforming data into actionable insights
= + ?

www.MagnaInsights.com30
Discussion
•Roger Keating
SVP, Digital Media
Hearst-Argyle Television
•Steve McGowan
SVP, Insights and Client Research Initiatives
The Nielsen Company

www.MagnaInsights.com31
Issue #1
•Consumers in Control Vs. Controlled Consumers?
0%
20%
40%
60%
80%
100%
120%
2006 2007 2008 2009 2010 2011
TV
Co
nsu
mp
tio
n I
nd
ex
Increase Due toPopulation Growth
Increase Due toHousehold TVConsumptionGrowth
Baseline - Today'sTV ConsumptionLess DVR Usage
-2%
+5% +5%
+8%
Source: Magna
www.MagnaInsights.com32
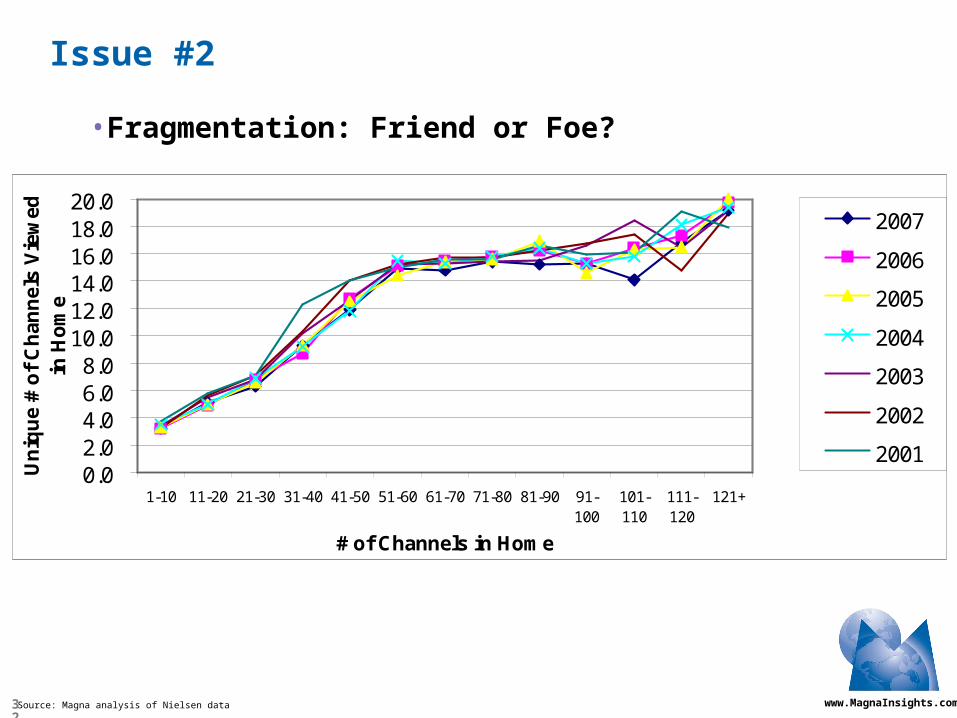
Issue #2
•Fragmentation: Friend or Foe?
0.02.04.06.08.0
10.012.014.016.018.020.0
1-10 11-20 21-30 31-40 41-50 51-60 61-70 71-80 81-90 91-100
101-110
111-120
121+
# of Channels in Home
Un
iqu
e #
of
Ch
ann
els
Vie
wed
in
Ho
me
2007
2006
2005
2004
2003
2002
2001
Source: Magna analysis of Nielsen data

www.MagnaInsights.com33
Issue #3
•Who Crosses Platforms?
Multichannel Homes
DVR Homes
VOD Homes
Broadband Homes
Satellite Radio Subscriptions
HD Subscriptions
Mobile Phone Subscriptions
0.0%
20.0%
40.0%
60.0%
80.0%
100.0%
120.0%
2000 2001 2002 2003 2004 2005 2006 2007 2008 2009 2010 2011
% o
f U
S H
ou
seh
old
s
Source: Magna