Embed Size (px)
Citation preview

Sensitivity : This Document is classified as "LNT General Business".

Sensitivity : This Document is classified as "LNT General Business".EPC Projects Hi- Tech Manufacturing ServicesEPC Projects Hi- Tech Manufacturing Services 22EPC Projects Hi- Tech Manufacturing Services
2
This presentation contains certain forward
looking statements concerning L&T’s future
business prospects and business profitability,
which are subject to a number of risks and
uncertainties and the actual results could
materially differ from those in such forward
looking statements.
The risks and uncertainties relating to these
statements include, but are not limited to, risks
and uncertainties regarding fluctuations in
earnings, our ability to manage growth,
competition (both domestic and international),
economic growth in India and the target
countries for exports, ability to attract and
retain highly skilled professionals, time and cost
over runs on contracts, our ability to manage our
international operations, government policies
and actions with respect to investments, fiscal
deficits, regulations, etc., interest and other
fiscal costs generally prevailing in the economy.
Past performance may not be indicative of future
performance.
The company does not undertake to make any
announcement in case any of these forward
looking statements become materially incorrect
in future or update any forward looking
statements made from time to time by or on
behalf of the company.
Disclaimer

Sensitivity : This Document is classified as "LNT General Business".EPC Projects Hi- Tech Manufacturing ServicesEPC Projects Hi- Tech Manufacturing Services 3

Sensitivity : This Document is classified as "LNT General Business".EPC Projects Hi- Tech Manufacturing Services
Order Inflows
Order Book at near
record high levels
Order Book
Revenues
Revenue momentum picks
up despite productivity challenges
Margin
EBIDTA margin improve
Liquidity
Robust operational free cash flow, NWC improves
Leverage
Improved Gross & Net Debt levels at Parent
E&A Divestment
E&A divestment concluded
Prestigious Order Wins
EPC Projects Hi- Tech Manufacturing Services
Noteworthy surprises in a Covid year…..
4

Sensitivity : This Document is classified as "LNT General Business".EPC Projects Hi- Tech Manufacturing ServicesEPC Projects Hi- Tech Manufacturing Services 5
Key Financial Indicators
Q4 FY20 Q3 FY21 Q4 FY21% Var
(y-o-y)
% Var
(q-o-q)Particulars FY20 FY21
% Var
(y-o-y)
578 732 507 -12% -31% Order Inflow 1864 1755 -6%
Order Book 3039 3274 8%
442 356 481 9% 35% Revenue 1455 1360 -7%
11.6% 12.0% 13.3% EBITDA (%) 11.2% 11.5%
31 23 34 12% 51% PAT (Continuing Operations) 89 70 -22%
32 25 33 3% 33% Overall PAT 95 116 21%
(Amount in ₹ bn)
*Includes gain on divestment of Discontinued (E&A) business
Particulars FY20 FY21
Net Working Capital 23.7% 22.3%
RONW (TTM) (%)* 14.8% 16.2%

Sensitivity : This Document is classified as "LNT General Business".EPC Projects Hi- Tech Manufacturing Services 6
02 Group Performance
Sensitivity : This Document is classified as "LNT General Business".EPC Projects Hi- Tech Manufacturing ServicesEPC Projects Hi- Tech Manufacturing Services 7
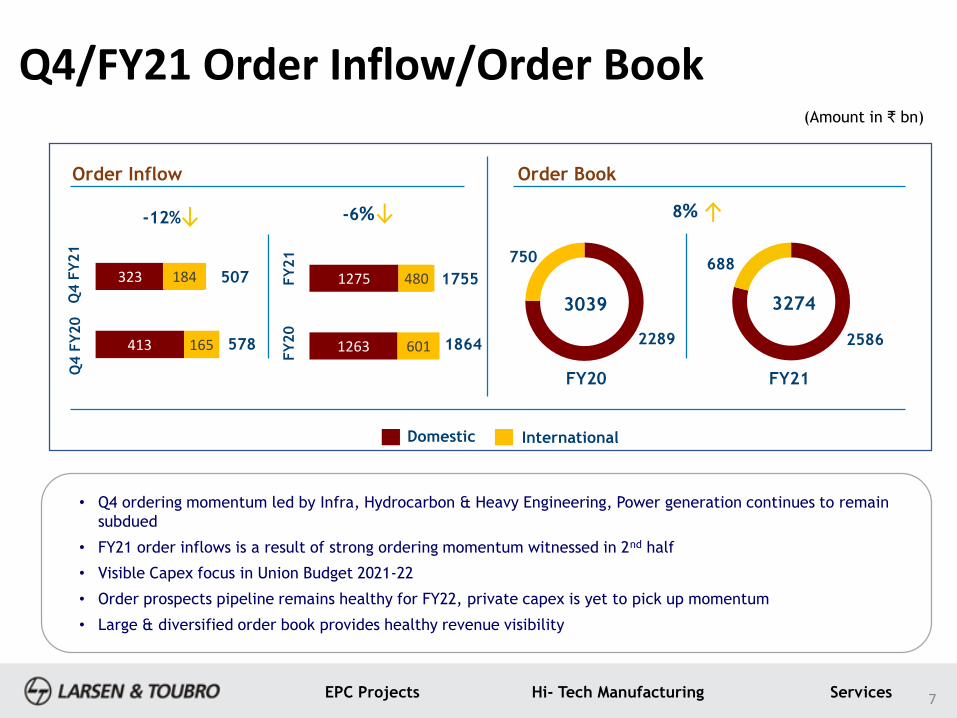
Q4/FY21 Order Inflow/Order Book
413
323
165
184
Order Inflow Order Book
-12%
578
1755
1864
Q4 F
Y21
Q4 F
Y20
FY
21
FY
20
-6%
FY20 FY21
8%
3039 3274
2289
750 688
2586
(Amount in ₹ bn)
507
• Q4 ordering momentum led by Infra, Hydrocarbon & Heavy Engineering, Power generation continues to remain
subdued
• FY21 order inflows is a result of strong ordering momentum witnessed in 2nd half
• Visible Capex focus in Union Budget 2021-22
• Order prospects pipeline remains healthy for FY22, private capex is yet to pick up momentum
• Large & diversified order book provides healthy revenue visibility
Domestic International
1263
1275
601
480

Sensitivity : This Document is classified as "LNT General Business".EPC Projects Hi- Tech Manufacturing ServicesEPC Projects Hi- Tech Manufacturing Services 8
Group Performance – Sales & Costs
Q4
FY20
Q4
FY21% Var Rs Billion FY20 FY21 % Var
442.5 480.9 9% Revenue 1454.5 1359.8 -7%
32% 33% International Rev. 33% 37%
286.7 311.8 9% MCO Exp.* 893.2 790.1 -12%
19.4 18.2 -6% Fin. Cost Opex** 80.4 76.9 -4%
62.9 63.5 1% Staff Costs 231.1 247.6 7%
22.3 23.4 5% Sales & Admin. exp 86.5 88.9 3%
391.3 417.0 7% Total Opex 1291.2 1203.5 -7%
51.2 63.9 25% EBITDA 163.3 156.2 -4%
• E&C revenues recover in Q4
amidst continuing pandemic
• MCO expense variation largely
reflective of job progress,
revenue mix and cost control
initiatives
• Reduction in Finance Charge
Opex is a function of lower
borrowing cost & average
liabilities in FS business
• Q4 Staff cost flat; resource
augmentation in service
businesses mitigated by expense
reduction in other businesses
• Q4 SG&A: Reflective of activity
levels* Manufacturing, Construction and Operating expenses
**Finance cost of financial services business and finance lease activity

Sensitivity : This Document is classified as "LNT General Business".EPC Projects Hi- Tech Manufacturing ServicesEPC Projects Hi- Tech Manufacturing Services 9
Group Performance – Profit Parameters
• Finance cost commensurate with
level of borrowings and full
commissioning of Hyd. Metro
• Depreciation charge includes impact
of Metro capitalisation
• Other income reflective of higher
level of treasury investments and
yields earned during the quarter
• Share of JV/Associate PAT largely
comprises results of IDPL and Power
JVs
• Q4 NCI variation largely due to
increase in Mindtree & LTI profits
partly offset by lower Fin.Serv.
profits
Q4
FY20
Q4
FY21% Var Rs Billion FY20 FY21 % Var
51.2 63.9 25% EBITDA 163.3 156.2 -4%
(8.2) (8.5) 4% Fin. Cost (28.0) (39.1) 40%
(7.1) (8.2) 15% Depreciation (24.6) (29.0) 18%
6.6 10.3 56% Other Income 23.6 34.3 45%
(9.7) (20.9) >100% Tax Expense (32.6) (40.1) 23%
1.5 1.6 9% JV/S&A PAT Share 0.7 0.1 -80%
(3.7) (4.0) 10% Non-controlling Int. (13.5) (12.7) -5%
30.7 34.1 12% Operational PAT 89.0 69.7 -22%
1.3 (1.2) Discontinued Operations 6.5 82.4
Exceptionals (net of tax
and NCI)(36.2)
32.0 32.9 3% Reported PAT 95.5 115.8 21%

Sensitivity : This Document is classified as "LNT General Business".EPC Projects Hi- Tech Manufacturing ServicesEPC Projects Hi- Tech Manufacturing Services 10

Sensitivity : This Document is classified as "LNT General Business".EPC Projects Hi- Tech Manufacturing ServicesEPC Projects Hi- Tech Manufacturing Services 11
Segment Composition
Infrastructure
Buildings & Factories (B&F)
Transportation Infra (TI)
Heavy Civil infra (HC)
Water & Effluent Treatment
(WET)
Power T&D (PT&D)
Metall. & Mat. Handling (MMH)
Power
EPC- Coal & Gas
Thermal Power Plant
Construction
Electrostatic
Precipitator
Power Equipment
Mfg. *
Heavy
Engineering
Process Plant Equipment
Nuclear Power Plant
Equipment
Piping Centre & Forgings *
Defence
Engineering
Defence
Aerospace
Shipbuilding
Hydrocarbon
Onshore
Offshore
Developmental
Projects
Roads / Trans. Line *
Metros
Power
IT & TS
Information Technology
Technology Services
Financial
Services
Rural Lending
Housing Finance
Wholesale Finance
Asset Management
Others
Realty
Industrial Products &
Machinery
Smart World &
Comm.(SW&C)
Electrical &
Automation
Electrical Standard
Products
Electrical Systems
& Equipment
Metering & Protection
Control & Automation
* Consolidated at PAT levelThe E&A segment divested during FY21 is classified under Discontinued Operations and
hence consolidated only at PAT level

Sensitivity : This Document is classified as "LNT General Business".EPC Projects Hi- Tech Manufacturing ServicesEPC Projects Hi- Tech Manufacturing Services 12
Order Inflow Composition
Q4 FY21 Rs 507 Bn
Domestic, 64%
Middle East, 17% USA &
Europe, 11%
ROW, 8%
Infrastructure,59%
Power , 1%
HE, 2%
Defence, 1% Hydrocarbon, 10%
Services, 24%
Others, 3%
FY21 Rs 1755 Bn
Domestic, 73%
Middle East, 9%
USA & Europe,
13%
ROW, 5%
Infrastructure, 62%
Power, 2%
HE, 3%
Defence, 1%Hydrocarbon,
7%
Services, 22%
Others, 3%

Sensitivity : This Document is classified as "LNT General Business".EPC Projects Hi- Tech Manufacturing ServicesEPC Projects Hi- Tech Manufacturing Services 13
Order Book Composition
Domestic, 79%
Middle East, 13%
ROW, 8%Infrastructure,
75%
Power, 4% HE, 1% Defence Engg., 2%
Hydrocarbon, 14%
Others, 4%
FY21 Rs 3274 Bn
Sensitivity : This Document is classified as "LNT General Business".EPC Projects Hi- Tech Manufacturing ServicesEPC Projects Hi- Tech Manufacturing Services 14
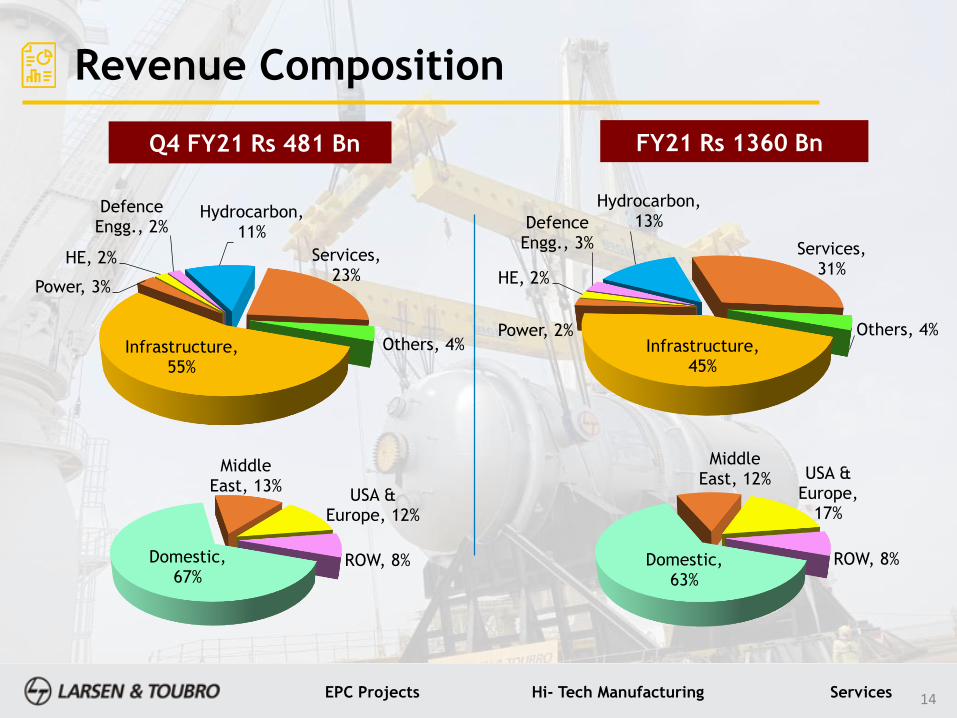
Revenue Composition
Q4 FY21 Rs 481 Bn
Domestic, 67%
Middle East, 13%
USA & Europe, 12%
ROW, 8%
Infrastructure, 55%
Power, 3%
HE, 2%
Defence Engg., 2%
Hydrocarbon, 11%
Services, 23%
Others, 4%
FY21 Rs 1360 Bn
Domestic, 63%
Middle East, 12% USA &
Europe, 17%
ROW, 8%
Infrastructure, 45%
Power, 2%
HE, 2%
Defence Engg., 3%
Hydrocarbon, 13%
Services, 31%
Others, 4%
Sensitivity : This Document is classified as "LNT General Business".EPC Projects Hi- Tech Manufacturing ServicesEPC Projects Hi- Tech Manufacturing Services 15
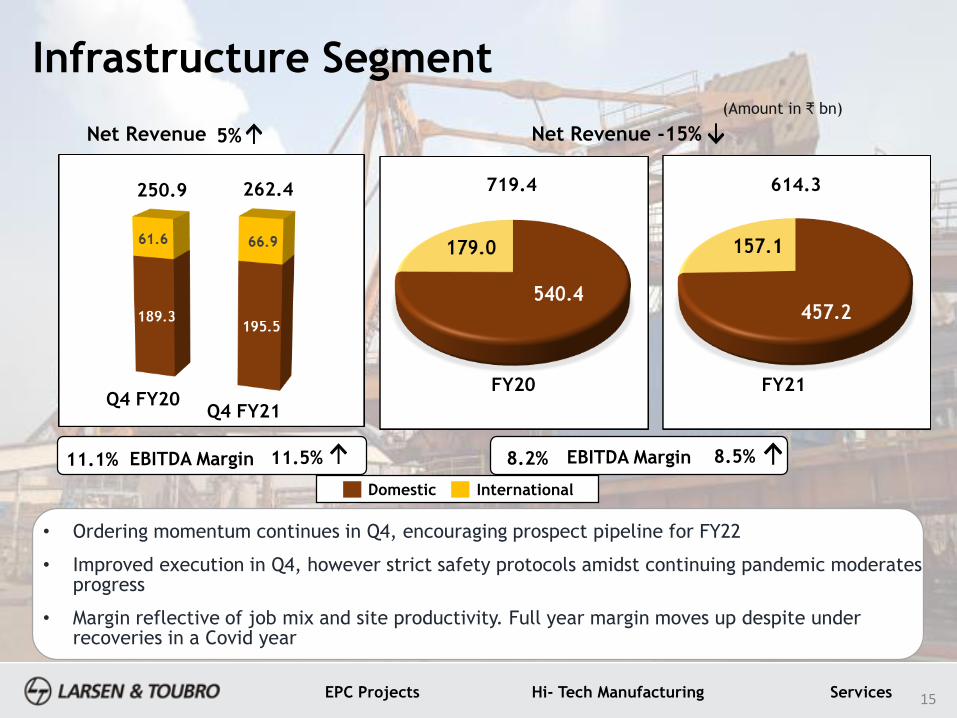
Infrastructure Segment
Domestic International
5%Net Revenue -15%Net Revenue
(Amount in ₹ bn)
EBITDA Margin8.2% 8.5%EBITDA Margin11.1% 11.5%
• Ordering momentum continues in Q4, encouraging prospect pipeline for FY22
• Improved execution in Q4, however strict safety protocols amidst continuing pandemic moderates progress
• Margin reflective of job mix and site productivity. Full year margin moves up despite under recoveries in a Covid year
614.3
FY21
250.9 262.4
Q4 FY20Q4 FY21
719.4
FY20

Sensitivity : This Document is classified as "LNT General Business".EPC Projects Hi- Tech Manufacturing ServicesEPC Projects Hi- Tech Manufacturing Services 16
Power Segment(Amount in ₹ bn)
>100%Net Revenue
EBITDA Margin
38%Net Revenue
12.0% 4.6%EBITDA Margin38.3% 8.5%
• Award deferments seen in current year, healthy order book on back of large wins in FY20
• Revenue increase driven by execution progress
• Major part of order book yet to cross margin recognition threshold, PY margin buoyed by claims
• Profits of Boiler, Turbine and other JV companies are consolidated at PAT level under equity method
Domestic International
22.9
FY20
31.7
FY21
5.2
12.1
0.4
0.1
12.2
5.6
Q4 FY20 Q4 FY21

Sensitivity : This Document is classified as "LNT General Business".EPC Projects Hi- Tech Manufacturing ServicesEPC Projects Hi- Tech Manufacturing Services 17
(Amount in ₹ bn)
57%Net Revenue -5%Net Revenue
EBITDA Margin21.5% 19.7%EBITDA Margin18.5% 29.3%
• Robust order wins in Nuclear Power business
• Pick up in execution across multiple jobs leads to strong revenue recovery in Q4
• Q4 Margin reflective of job mix and claims
Domestic International
Heavy Engineering Segment
6.4
10.0
Q4 FY20 Q4 FY21
28.5
FY20
27.1
FY21

Sensitivity : This Document is classified as "LNT General Business".EPC Projects Hi- Tech Manufacturing ServicesEPC Projects Hi- Tech Manufacturing Services 18
Defence Engineering Segment(Amount in ₹ bn)
43%Net Revenue -8%Net Revenue
EBITDA Margin18.6% 22.2%EBITDA Margin16.4% 29.3%
• Subdued ordering momentum in Q4
• Policy pronouncements around indigenization to drive order inflows in medium to long term
• Better job progress drives revenue in Q4
• Margin reflective of job mix and stage of execution, cost savings drive buoyancy
Domestic International
36.9
FY20
34.0
FY21
11.4
8.0
Q4 FY20Q4 FY21

Sensitivity : This Document is classified as "LNT General Business".EPC Projects Hi- Tech Manufacturing ServicesEPC Projects Hi- Tech Manufacturing Services 19
Hydrocarbon Segment(Amount in ₹ bn)
Net Revenue -3%Net Revenue
EBITDA Margin10.9% 10.3%EBITDA Margin11.0% 13.0%
9%
• Domestic order wins in Q4 replenishes order book
• Improved activity level aid revenues in Q4
• Margin contributed by efficient execution leading to cost savings and job mix
Domestic International
174.2
FY20
49.7 54.1
Q4 FY20Q4 FY21
169.2
FY21

Sensitivity : This Document is classified as "LNT General Business".EPC Projects Hi- Tech Manufacturing ServicesEPC Projects Hi- Tech Manufacturing Services 20
Developmental Projects Segment
Power Development Hyd Metro
(Amount in ₹ bn)
13%Net Revenue -25%Net Revenue
EBITDA Margin11.1% 5.4%EBITDA Margin6.1% 8.5%
• Segment includes Power Development business (Thermal and Hydro) and Hyderabad Metro
• Revenue largely contributed by Power Development Business. Strong Electricity demand drives revenue growth in Nabha
whereas Hyderabad Metro ridership is reflective of continuing pandemic
• Segment margin impacted by OPEX under recovery in Metro
• Roads & TL concessions (housed in IDPL) are consolidated at PAT level under the Equity method
48.5
FY20
9.811.1
Q4 FY20 Q4 FY21
36.2
FY21

Sensitivity : This Document is classified as "LNT General Business".EPC Projects Hi- Tech Manufacturing ServicesEPC Projects Hi- Tech Manufacturing Services 21
IT & Technology Services Segment
LTI LTTS
(Amount in ₹ bn)
7%Net Revenue 15%Net Revenue
Mindtree
EBITDA Margin20.9% 23.5%EBITDA Margin20.8% 24.5%
• LTI revenue growth led by BFS, High Tech Media and Entertainment, CPG, Retail & Pharma and Manufacturing
• LTTS revenue largely contributed by strong growth in Medical devices and Telecom & Hitech vertical
• Mindtree revenue growth led by Communications, Media & Technology and Retail, CPG & Manufacturing
• Margin improvement aided by improved utilization, onshore: offshore mix and operational efficiencies
221.4
FY20
254.6
FY21
67.663.5
Q4 FY20 Q4 FY21
Sensitivity : This Document is classified as "LNT General Business".EPC Projects Hi- Tech Manufacturing ServicesEPC Projects Hi- Tech Manufacturing Services 22
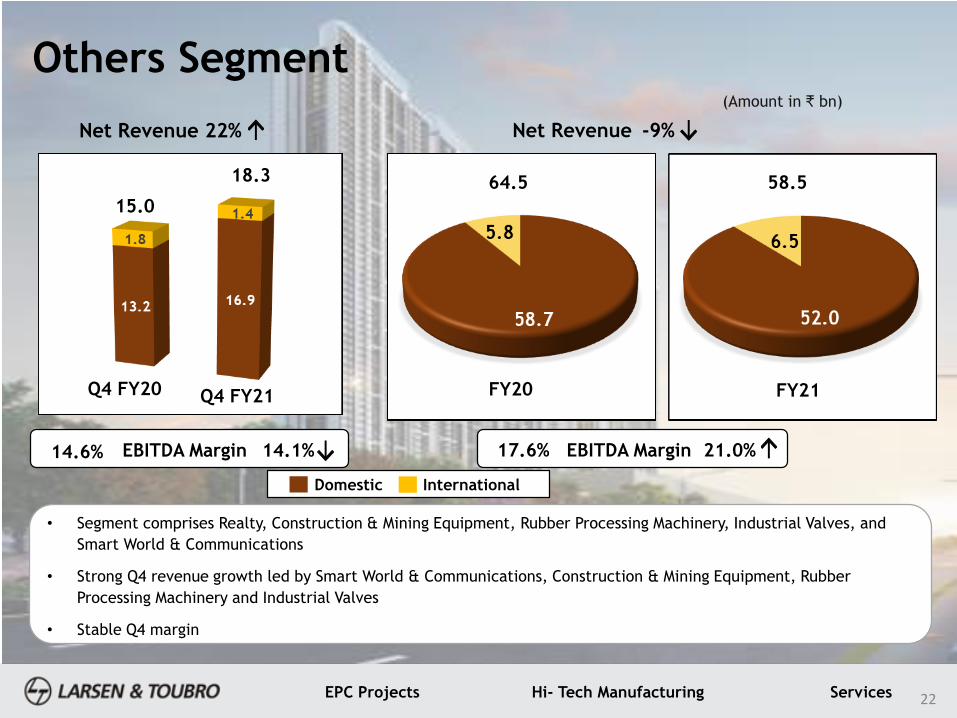
Others Segment
Domestic International
(Amount in ₹ bn)
22%Net Revenue -9%Net Revenue
EBITDA Margin17.6% 21.0%EBITDA Margin14.6% 14.1%
• Segment comprises Realty, Construction & Mining Equipment, Rubber Processing Machinery, Industrial Valves, and
Smart World & Communications
• Strong Q4 revenue growth led by Smart World & Communications, Construction & Mining Equipment, Rubber
Processing Machinery and Industrial Valves
• Stable Q4 margin
58.5
FY21
64.5
FY20
15.0
18.3
Q4 FY20 Q4 FY21

Sensitivity : This Document is classified as "LNT General Business".EPC Projects Hi- Tech Manufacturing ServicesEPC Projects Hi- Tech Manufacturing Services 23
Financial Services Segment
Note: Gross Stage 3 Assets include GNPA> 90 DPD + Impaired assets (S4A, SDR, 5:25, etc.) where regulatory forbearances are available + Identified standard assets which are under incipient stress
• The business continues to pursue the strategy of higher retailisation of its loan book, diversification
of liabilities, continued asset focus, maintaining prudent ALM and targeting sustainable NIMs
• Q4 revolved around strong pick up in rural disbursements, robust collections, improved NIMs + Fees,
and maintenance of adequate liquidity on Balance Sheet
• Post rights issue, the business has sufficient growth capital
Q4 FY20 Q4 FY21 % Var Rs Bn FY20 FY21 % Var
33.7 33.8 0% Income from Operations 138.2 134.0 -3%
3.8 2.7 -31% Reported PAT 17.0 9.7 -43%
2.4 1.8 -27% PAT (Net of NCI) accruing to the group 10.8 6.3 -42%
Mutual Fund Average AUM 710.6 727.3 2%
Book 983.8 940.1 -4%
Gross Stage 3 Assets 5.4% 5.0%
Net Stage 3 Assets 2.3% 1.6%
Net worth 146.9 187.7 28%
Sensitivity : This Document is classified as "LNT General Business".EPC Projects Hi- Tech Manufacturing ServicesEPC Projects Hi- Tech Manufacturing Services 24
04 Group ESG Disclosures
Sensitivity : This Document is classified as "LNT General Business".EPC Projects Hi- Tech Manufacturing ServicesEPC Projects Hi- Tech Manufacturing Services 25
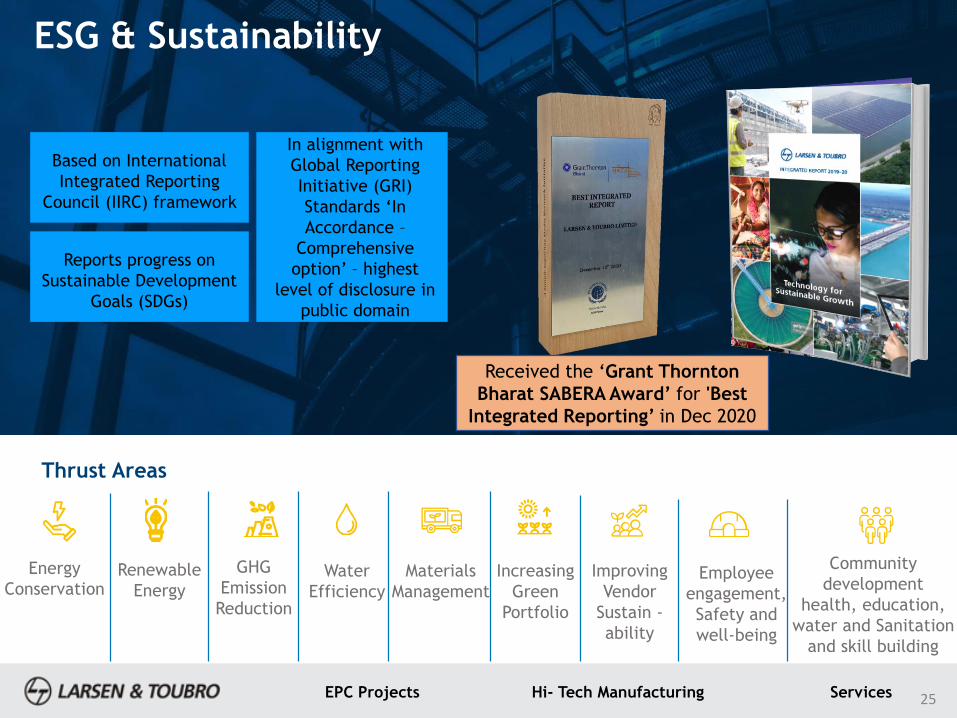
ESG & Sustainability
Thrust Areas
Energy
ConservationRenewable
Energy
GHG
Emission
Reduction
Water
Efficiency
Materials
Management
Increasing
Green
Portfolio
Improving
Vendor
Sustain -
ability
Employee
engagement,
Safety and
well-being
Community
development
health, education,
water and Sanitation
and skill building
Based on International
Integrated Reporting
Council (IIRC) framework
Reports progress on
Sustainable Development
Goals (SDGs)
In alignment with
Global Reporting
Initiative (GRI)
Standards ‘In
Accordance –
Comprehensive
option’ – highest
level of disclosure in
public domain
Received the ‘Grant Thornton
Bharat SABERA Award’ for 'Best
Integrated Reporting’ in Dec 2020

Sensitivity : This Document is classified as "LNT General Business".EPC Projects Hi- Tech Manufacturing Services
26
1 > 10 Mn kWh* Energy saved in FY21
2
3
4
5
6
Energy Conservation & Renewable Energy – FY21
> 4%Of total energy mix is Renewable
Energy
9Establishments generate onsite
solar energy for campus usage
4Campuses source wind or solar
electricity
26
` 64 Mn MT*CO2 emissions avoided in FY21
65.9 Mn kWh* Renewable energy used in our
campuses in FY21
*Audit in progressCumulatively (2008-2021) >128 Mn KWh energy saved which is equivalent to 4.2
Mn trees saved

Sensitivity : This Document is classified as "LNT General Business".EPC Projects Hi- Tech Manufacturing Services
27
Occupational Health and Safety
EHS Council est.in 2020 chaired by Board Member
Mission
ZERO HARM
Digitization initiatives to
enhance safety
International Safety Standard
ISO45001 across all ICs & BUs
Safety Culture and Management:• Senior management embraces top--down driven approach by demonstrating safety leadership at all levels. Site visits and
audits are conducted to maintain / improve EHS performance• Safety evaluated every quarter at Company Board levels (Non-Executive Directors) on performance and compliance• Comprehensive safety training programme at all levels of Supervisory Management & Supply Chain• Focus on high-risk activities • Hazard & risk identification prior to start of any activity• Positive incident reduction using Digital AI for identifying unsafe acts and conditions, early intervention taken• Safety committees at all L&T work locations
Statistics FY 2020-21
Severity rate* 27.7
Frequency rate** 0.02
Fatality 25
*Severity Rate: Number of man-days lost per million man-hours worked
** Frequency Rate: Number of reportable accidents per million man-hours worked

Sensitivity : This Document is classified as "LNT General Business".EPC Projects Hi- Tech Manufacturing Services
28
Green Portfolio
Water Management
• Water Efficient Irrigation Infrastructure;
• Reservoirs, Barrages & Water Balancing System;
• Water Treatment Plant;• Waste-Water Treatment
Plant;• Industrial Treatment
Plant;• Industrial Plant Water
System;• Solar Power System
Eco Friendly Fuel
• Setup of ethanol plant,• Natural gas by product
generation
Solar Power Plants
• Grid connected Solar power plant,
• Grid connected floating solar plant
Green Building
• Green buildings• Hospitals, • Airports, • Schools, • Residential buildings,• commercial buildings
Hydro Projects
• Hydro power projects
Metro & Monorail
• Metro • Mono rail projects
Transmission & Distribution
• Power Distribution Reforms & Power Quality Improvement Projects
• Gas Insulated Substations, Substations and Substations of 765kV
Sensitivity : This Document is classified as "LNT General Business".EPC Projects Hi- Tech Manufacturing ServicesEPC Projects Hi- Tech Manufacturing Services 29
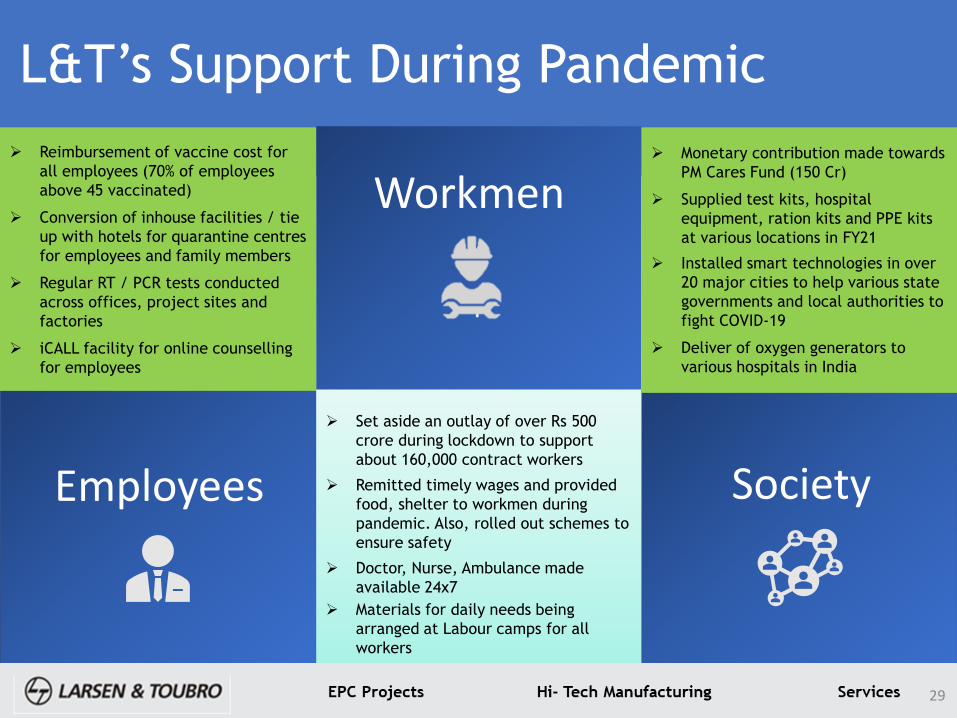
➢ Reimbursement of vaccine cost for
all employees (70% of employees
above 45 vaccinated)
➢ Conversion of inhouse facilities / tie
up with hotels for quarantine centres
for employees and family members
➢ Regular RT / PCR tests conducted
across offices, project sites and
factories
➢ iCALL facility for online counselling
for employees
➢ Set aside an outlay of over Rs 500
crore during lockdown to support
about 160,000 contract workers
➢ Remitted timely wages and provided
food, shelter to workmen during
pandemic. Also, rolled out schemes to
ensure safety
➢ Doctor, Nurse, Ambulance made
available 24x7
➢ Materials for daily needs being
arranged at Labour camps for all
workers
➢ Monetary contribution made towards
PM Cares Fund (150 Cr)
➢ Supplied test kits, hospital
equipment, ration kits and PPE kits
at various locations in FY21
➢ Installed smart technologies in over
20 major cities to help various state
governments and local authorities to
fight COVID-19
➢ Deliver of oxygen generators to
various hospitals in India
L&T’s Support During Pandemic
Employees Society
Workmen
29

Sensitivity : This Document is classified as "LNT General Business".EPC Projects Hi- Tech Manufacturing ServicesEPC Projects Hi- Tech Manufacturing Services 30
ESG – Defence matters
➢ L&T partners with the Indian Defence Research, Defence Research and Development Organisation (DRDO)
and the Indian Armed Forces in the development of defence products, systems and platforms across land,
sea and air operations, in line with its commitment to ‘Make in India’.
➢ With an integrated portfolio comprising technologies, products, systems, platforms and solutions, L&T
Defence today offers solutions across the project lifecycle.
The business does not manufacture any explosives nor ammunition of any kind, including cluster
munitions or anti-personnel landmines or nuclear weapons or components for such munitions. The
business also does not customise any delivery systems for such munitions.
Sensitivity : This Document is classified as "LNT General Business".EPC Projects Hi- Tech Manufacturing Services31EPC Projects Hi- Tech Manufacturing Services
The Environment & the Outlook
31

Sensitivity : This Document is classified as "LNT General Business".
The Environment & the Outlook
Key Determinants Ahead
EPC Projects Hi- Tech Manufacturing Services
Successful Vaccination
efforts
Sustained capex
ordering from Govt /
PSUs
Liquidity Flow
Private Capex Revival
Healthy Order Book
Strong Balance Sheet
Proven ability to execute
large projects
Growing services portfolio
Looking forward
➢ Limited restrictions as against
complete lockdown
➢ Vaccination announced covering a
larger population
➢ RBI continues to pursue
accommodative policy
➢ Recovery is “delayed” and not
“derailed”
➢ Expect domestic economic momentum
to rebuild from Q2FY22 onwards
➢ Improved prospects in GCC and Africa
➢ FY21 started with Covid spread /
lockdown
➢ Economic contraction in first half
➢ Strong monetary & fiscal response
from RBI & Govt
➢ Recovery in second half
➢ Govt thrust on infrastructure capex in
Union Budget 2021-22
➢ FY21 concludes with Covid second
wave
The year gone by
32
How L&T is currently positioned
Sensitivity : This Document is classified as "LNT General Business".EPC Projects Hi- Tech Manufacturing ServicesEPC Projects Hi- Tech Manufacturing Services 33Turn overleaf for AnnexuresEPC Projects Hi- Tech Manufacturing Services
Thank You
33

Sensitivity : This Document is classified as "LNT General Business".EPC Projects Hi- Tech Manufacturing ServicesEPC Projects Hi- Tech Manufacturing Services 34
Balance Sheet
Rs Billion Mar-21 Mar-20 Incr / (Decr)
Equity & Reserves 759 667 91
Non Controlling Interest 121 95 25
Borrowings - Financial Services 865 939 -74
Development Projects 206 202 3
Others 255 269 -14
Sources of Funds 2,205 2,173 33
Fixed Assets 138 156 -18
Intangible Assets & Investment Property 310 314 -4
Loans towards Financing Activities 861 909 -47
Finance lease receivable 70 89 -19
Net Non-Current Assets 150 151 0
Current Investments, Cash & Cash
Equivalents473 278 194
Net Current Assets 203 253 -50
Assets held for Sale (net) 0.0 24 -24
Application of Funds 2,205 2,173 33
Gross Debt / Equity Ratio 1.51 1.85
Net Debt / Equity Ratio 1.00 1.53
Sensitivity : This Document is classified as "LNT General Business".EPC Projects Hi- Tech Manufacturing ServicesEPC Projects Hi- Tech Manufacturing Services 35
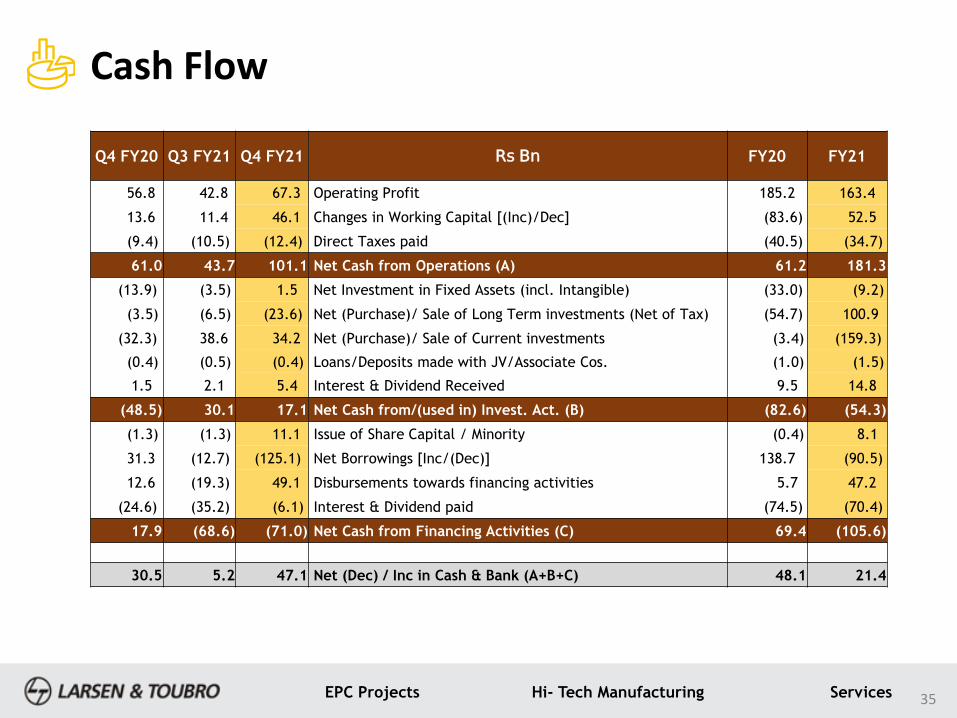
Cash Flow
Q4 FY20 Q3 FY21 Q4 FY21 Rs Bn FY20 FY21
56.8 42.8 67.3 Operating Profit 185.2 163.4
13.6 11.4 46.1 Changes in Working Capital [(Inc)/Dec] (83.6) 52.5
(9.4) (10.5) (12.4) Direct Taxes paid (40.5) (34.7)
61.0 43.7 101.1 Net Cash from Operations (A) 61.2 181.3
(13.9) (3.5) 1.5 Net Investment in Fixed Assets (incl. Intangible) (33.0) (9.2)
(3.5) (6.5) (23.6) Net (Purchase)/ Sale of Long Term investments (Net of Tax) (54.7) 100.9
(32.3) 38.6 34.2 Net (Purchase)/ Sale of Current investments (3.4) (159.3)
(0.4) (0.5) (0.4) Loans/Deposits made with JV/Associate Cos. (1.0) (1.5)
1.5 2.1 5.4 Interest & Dividend Received 9.5 14.8
(48.5) 30.1 17.1 Net Cash from/(used in) Invest. Act. (B) (82.6) (54.3)
(1.3) (1.3) 11.1 Issue of Share Capital / Minority (0.4) 8.1
31.3 (12.7) (125.1) Net Borrowings [Inc/(Dec)] 138.7 (90.5)
12.6 (19.3) 49.1 Disbursements towards financing activities 5.7 47.2
(24.6) (35.2) (6.1) Interest & Dividend paid (74.5) (70.4)
17.9 (68.6) (71.0) Net Cash from Financing Activities (C) 69.4 (105.6)
30.5 5.2 47.1 Net (Dec) / Inc in Cash & Bank (A+B+C) 48.1 21.4

Sensitivity : This Document is classified as "LNT General Business".EPC Projects Hi- Tech Manufacturing ServicesEPC Projects Hi- Tech Manufacturing Services 36
Segment Margin
* Note: Interest cost and tax provisions are reflected under Corporate
Net Revenue EBITDA EBITDA
% Net Revenue EBITDA
EBITDA
%
Ex-Services business:
Infrastructure Segment 71942 5873 8.2% 61431 5227 8.5%
Power Segment 2294 274 12.0% 3174 147 4.6%
Hydrocarbon Segment 17420 1898 10.9% 16925 1748 10.3%
Heavy Engineering Segment 2853 612 21.5% 2712 536 19.7%
Defence Engineering Segment 3690 685 18.6% 3396 754 22.2%
Other Segment 6445 1137 17.6% 5853 1227 21.0%
Total (ex-services) 104644 10479 10.0% 93491 9638 10.3%
Services Business:
IT, TS & Mindtree Segment 22135 4635 20.9% 25463 5986 23.5%
Financial Services Segment 13822 2757 19.9% 13404 1372 10.2%
Developmental Projects Segment 4850 539 11.1% 3621 194 5.4%
Total (Services) 40808 7931 19.4% 42488 7552 17.8%
Total 145452 18410 12.7% 135979 17190 12.6%
Particulars IT&TSFinancial
ServicesDev. Projects Ex-Services* Corporate Total
EBIDTA 5986 1372 194 9638 1862 19053
Depreciation (1163) (86) (391) (1209) (55) (2904)
Segment Result 4823 1286 (197) 8429 1807 16149
Finance Cost & Tax Expense (1345) (500) (1417) (925) (3738) (7924)
Non-controlling interest (1007) (335) - 8 (4) (1338)
Share in profit/(loss) of JV and associate (64) 43 35 14
Exceptional Items (net of tax) 176 (3732) (3556)
PAT from discontinued operations 8238 8238
PAT 2471 628 (1678) 7555 2607 11583
Segment (Rs Cr)
FY20 FY21
EBIDTA to PAT (FY21)

Sensitivity : This Document is classified as "LNT General Business".EPC Projects Hi- Tech Manufacturing ServicesEPC Projects Hi- Tech Manufacturing Services 37
Share in Profit/(Loss) of JVs/Associates
Q4 FY20 Q4 FY21 Rs Bn FY20 FY21
0.51 0.81 Boiler/Turbine JVs 1.86 1.71
1.13 0.81 IDPL & Subs. (0.05) (0.64)
(0.34) (0.00) Special Steels and Heavy Forgings (1.37) (0.73)
0.17 (0.02) Others 0.28 (0.20)
1.47 1.60 Total 0.72 0.14