Embed Size (px)
Citation preview
Sensitivity analysis:An introduction
Andrea Saltelli Centre for the Study of the Sciences and the
Humanities (SVT) - University of Bergen (UIB)
Institut de Ciència i Tecnologia Ambientals (ICTA) -Universitat Autonoma de Barcelona (UAB)
Summer School on Sensitivity Analysis –SAMO 2016, Villa Orlandi, Anacapri -
July 4-8, 2016
[email protected]@andreasaltelli

www.andreasaltelli.eu
Journals Presentations
Where to find materials

Welcome to the Ninth SAMO Summer school (previous schools in Venice, Florence and
Ranco between 1999 and 2014)
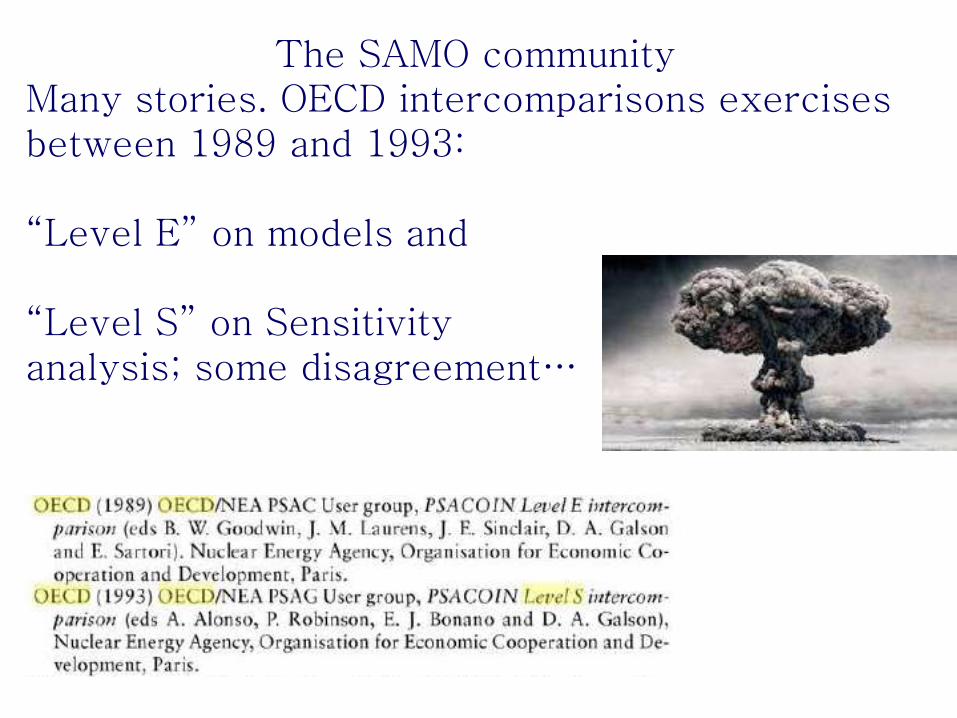
The SAMO communityMany stories. OECD intercomparisons exercises between 1989 and 1993:
“Level E” on models and
“Level S” on Sensitivity analysis; some disagreement…
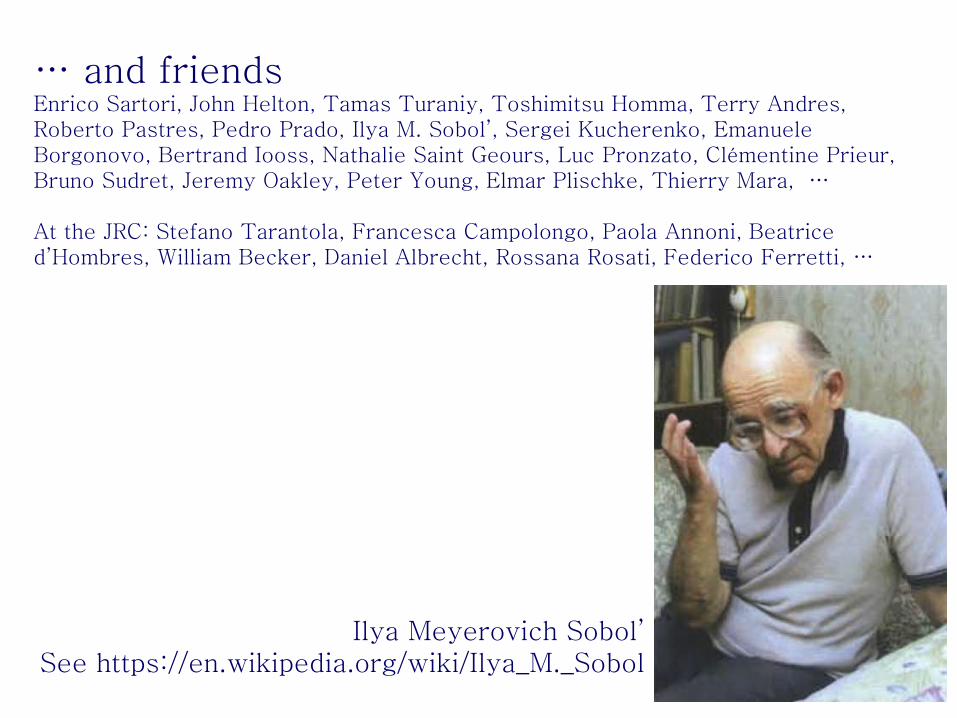
… and friends Enrico Sartori, John Helton, Tamas Turaniy, Toshimitsu Homma, Terry Andres, Roberto Pastres, Pedro Prado, Ilya M. Sobol’, Sergei Kucherenko, Emanuele Borgonovo, Bertrand Iooss, Nathalie Saint Geours, Luc Pronzato, Clémentine Prieur, Bruno Sudret, Jeremy Oakley, Peter Young, Elmar Plischke, Thierry Mara, …
At the JRC: Stefano Tarantola, Francesca Campolongo, Paola Annoni, Beatrice d’Hombres, William Becker, Daniel Albrecht, Rossana Rosati, Federico Ferretti, …
Ilya Meyerovich Sobol’ See https://en.wikipedia.org/wiki/Ilya_M._Sobol

The SA community; a conference every three years
SAMO 1995 (Belgirate, Italy)SAMO 1998 (Venice, Italy)SAMO 2001 (Madrid, Spain)SAMO 2004 (Santa Fe, USA)SAMO 2007 (Budapest, Hungary)SAMO 2010 (Milan, Italy)SAMO 2013 (Nice, France)SAMO 2016 (Reunion, France)
Reunion
Mauritius

Next?
SAMO 2019: Barcelona, Spain [proposal]
Hospital de la Santa Creu i Sant Pau Barcelona, Catalonia, Spain, designed by the Catalan modernist architect Lluís Domènech i Montaner, built between 1901 and 1930 (Source Wikipedia).
Why sensitivity analysis

http://ec.europa.eu/smart-regulation/

http://ec.europa.eu/smart-regulation/guidelines/docs/br_toolbox_en.pdf
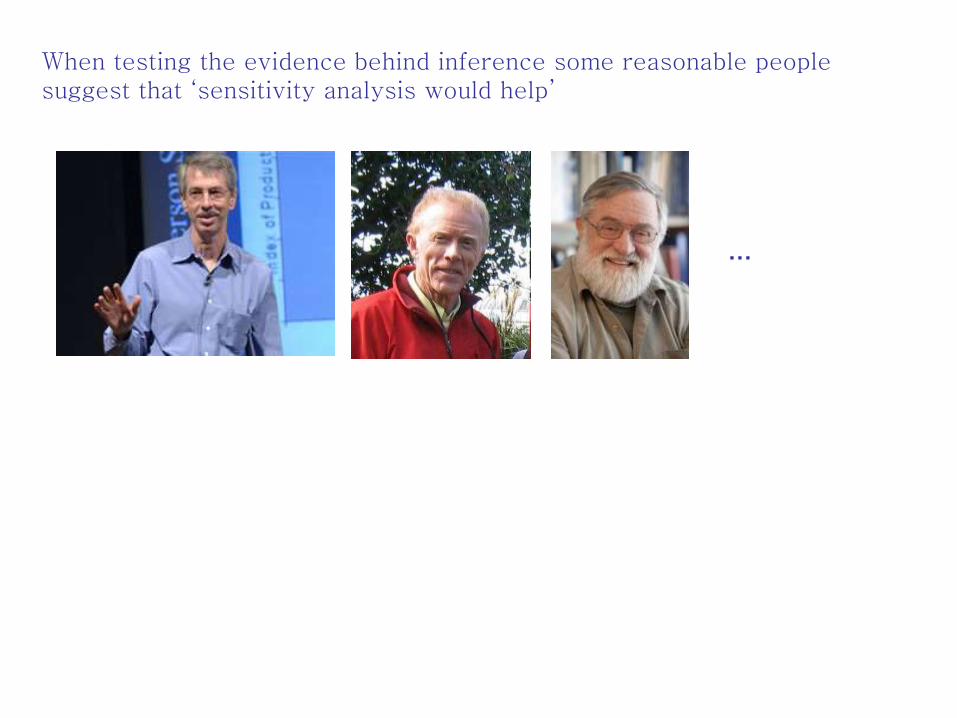
When testing the evidence behind inference some reasonable people suggest that ‘sensitivity analysis would help’
…
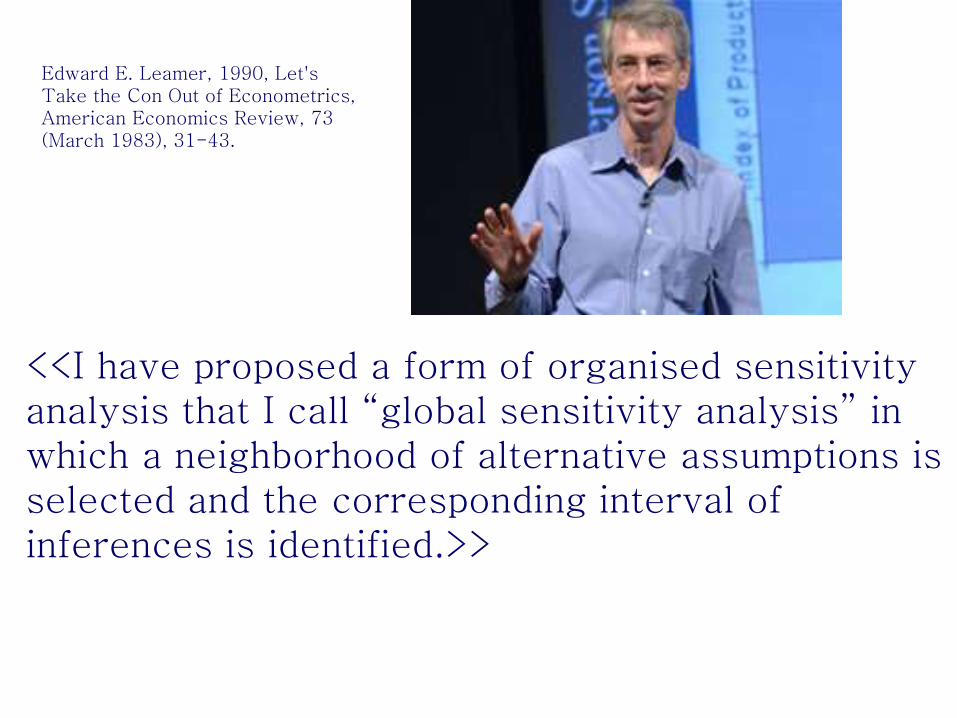
Edward E. Leamer, 1990, Let's Take the Con Out of Econometrics, American Economics Review, 73 (March 1983), 31-43.
<<I have proposed a form of organised sensitivity analysis that I call “global sensitivity analysis” in which a neighborhood of alternative assumptions is selected and the corresponding interval of inferences is identified.>>
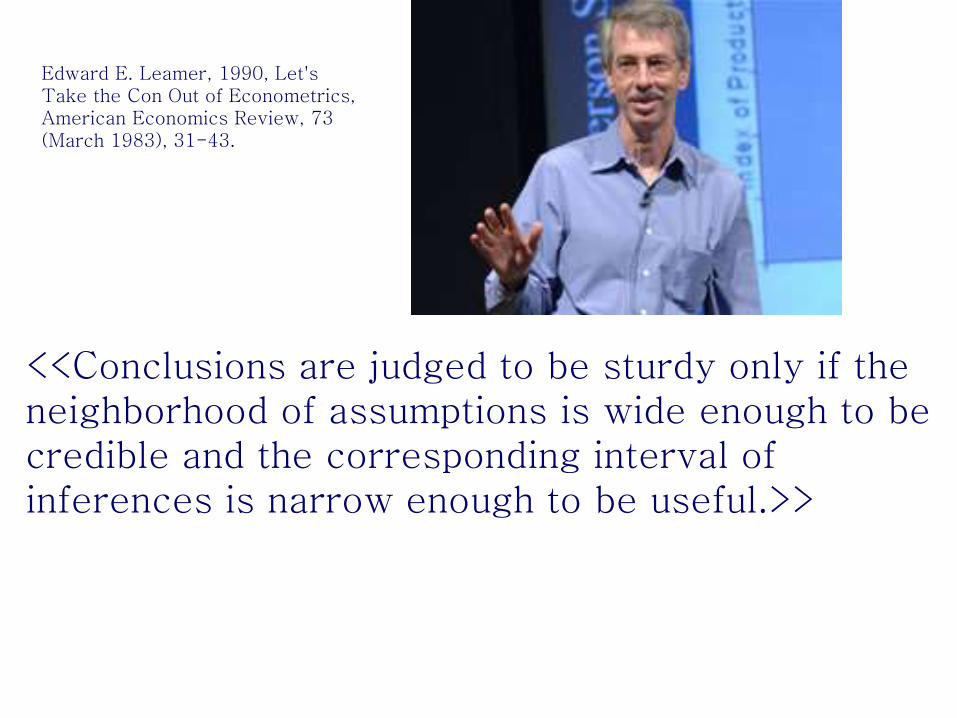
Edward E. Leamer, 1990, Let's Take the Con Out of Econometrics, American Economics Review, 73 (March 1983), 31-43.
<<Conclusions are judged to be sturdy only if the neighborhood of assumptions is wide enough to be credible and the corresponding interval of inferences is narrow enough to be useful.>>
From: Uncertainty
and Quality in
Science for Policy
by Silvio Funtowicz
and Jerry Ravetz,
Springer 1990.
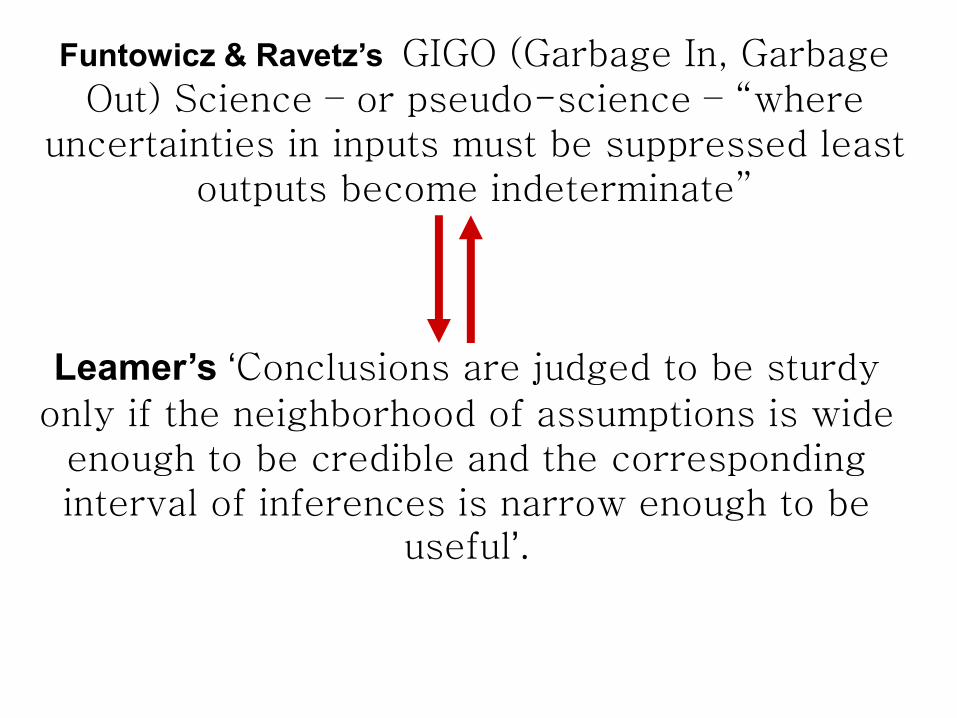
Funtowicz & Ravetz’s GIGO (Garbage In, Garbage Out) Science – or pseudo-science – “where
uncertainties in inputs must be suppressed least outputs become indeterminate”
Leamer’s ‘Conclusions are judged to be sturdy only if the neighborhood of assumptions is wide
enough to be credible and the corresponding interval of inferences is narrow enough to be
useful’.
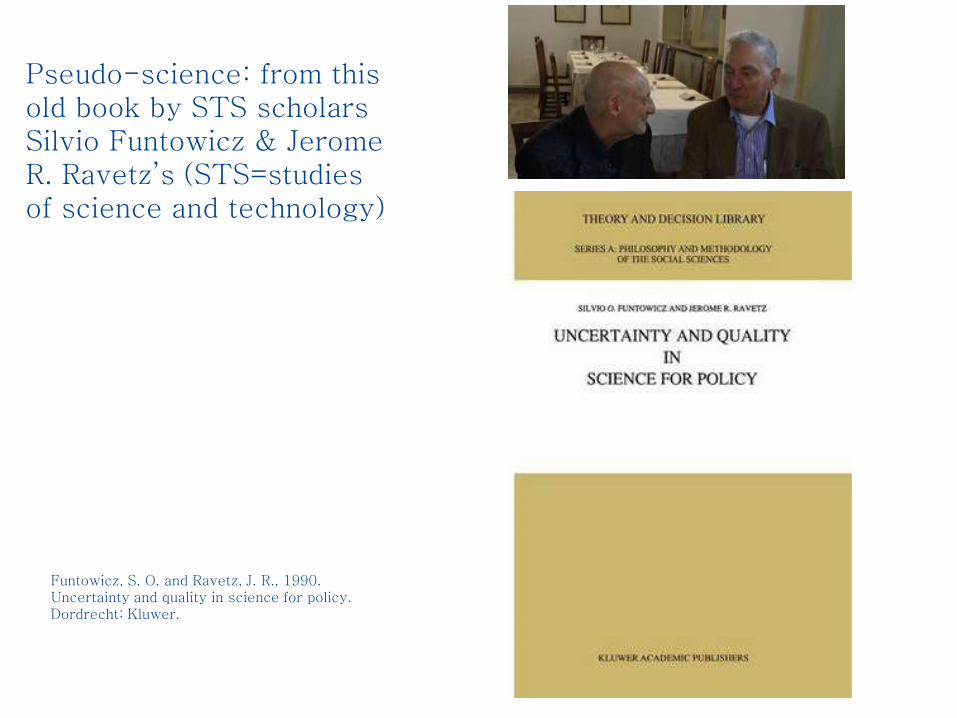
Funtowicz, S. O. and Ravetz, J. R., 1990. Uncertainty and quality in science for policy. Dordrecht: Kluwer.
Pseudo-science: from this old book by STS scholars Silvio Funtowicz & Jerome R. Ravetz’s (STS=studies of science and technology)
Back to Leamer:With the ashes of the mathematical models used to rate mortgage-backed securities still smoldering on Wall Street, now is an ideal time to revisit the sensitivity issues.
Tantalus on the Road to AsymptopiaEdward E. Leamer, 2010 Journal of Economic Perspectives, 24, (2), 31–46.
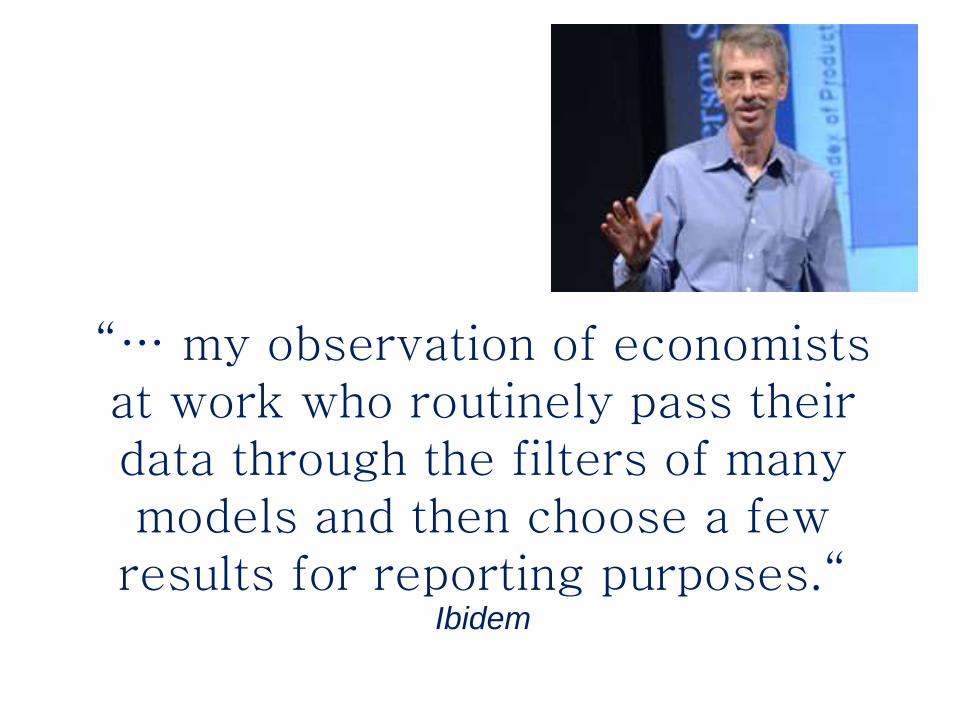
“… my observation of economists at work who routinely pass their data through the filters of many models and then choose a few
results for reporting purposes.“ Ibidem
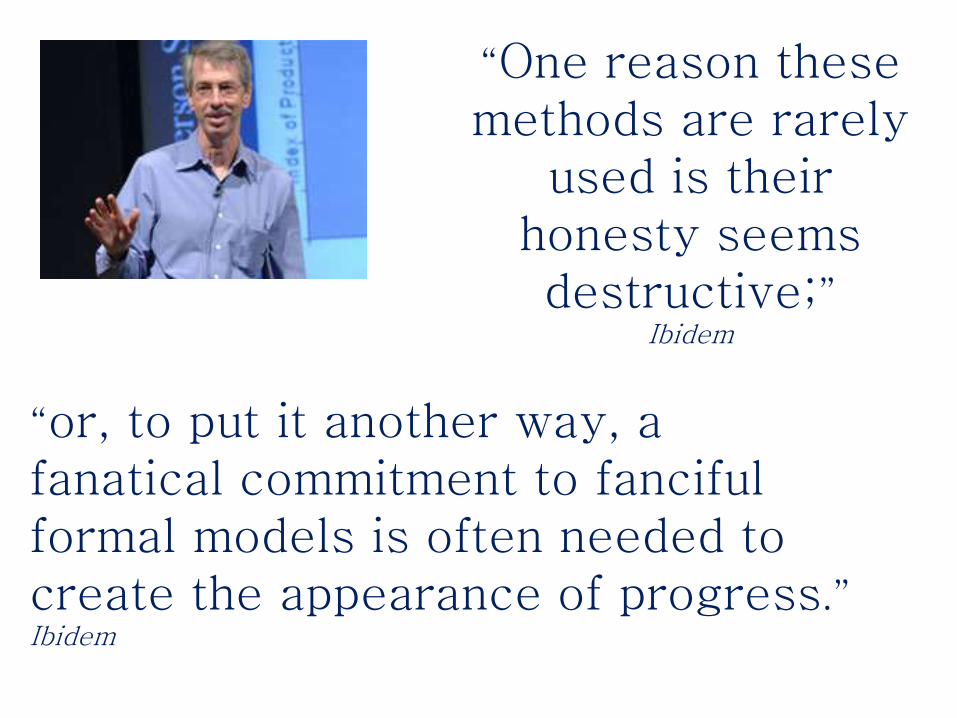
“One reason these methods are rarely
used is their honesty seems destructive;”
Ibidem
“or, to put it another way, a fanatical commitment to fanciful formal models is often needed to create the appearance of progress.” Ibidem
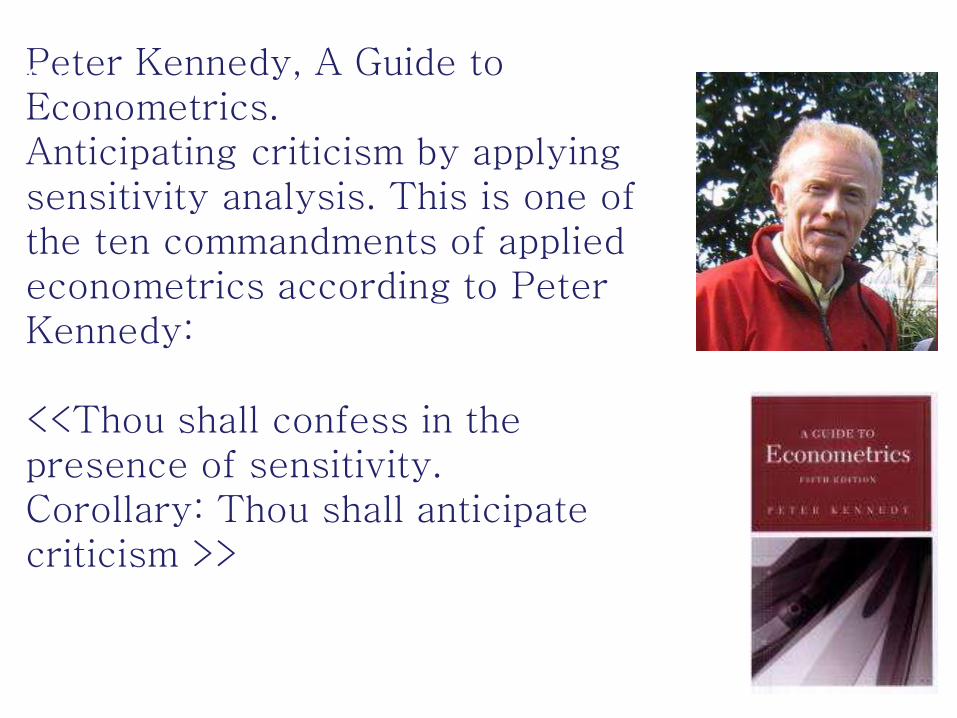
Peter Kennedy, A Guide to Econometrics.Anticipating criticism by applying sensitivity analysis. This is one of the ten commandments of applied econometrics according to Peter Kennedy:
<<Thou shall confess in the presence of sensitivity.Corollary: Thou shall anticipate criticism >>
RULE FOUR : find sensitivities before sensitivities find
you;
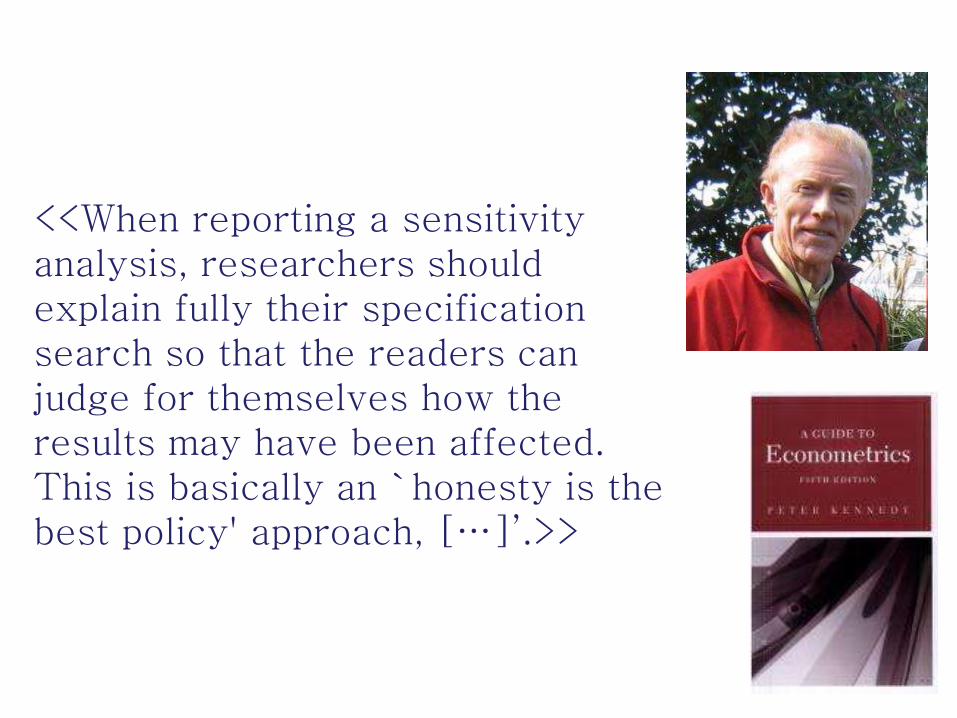
<<When reporting a sensitivity analysis, researchers should explain fully their specification search so that the readers can judge for themselves how the results may have been affected. This is basically an `honesty is the best policy' approach, […]’.>>
RULE FOUR : find sensitivities before sensitivities find
you;

Today: the ‘Mathiness’ discussion: blogs of Paul Romer, Judith Curry and Erik Reinert’s‘scholasticism’ paper.
See https://paulromer.net/mathiness/
https://judithcurry.com/2015/08/12/the-adversarial-method-versus-feynman-integrity-2/
http://www.andreasaltelli.eu/file/repository/Full_Circle_scholasticism_2.pdf
Paul Romer Judith Curry Erik Reinert
Limits of sensitivity analysis
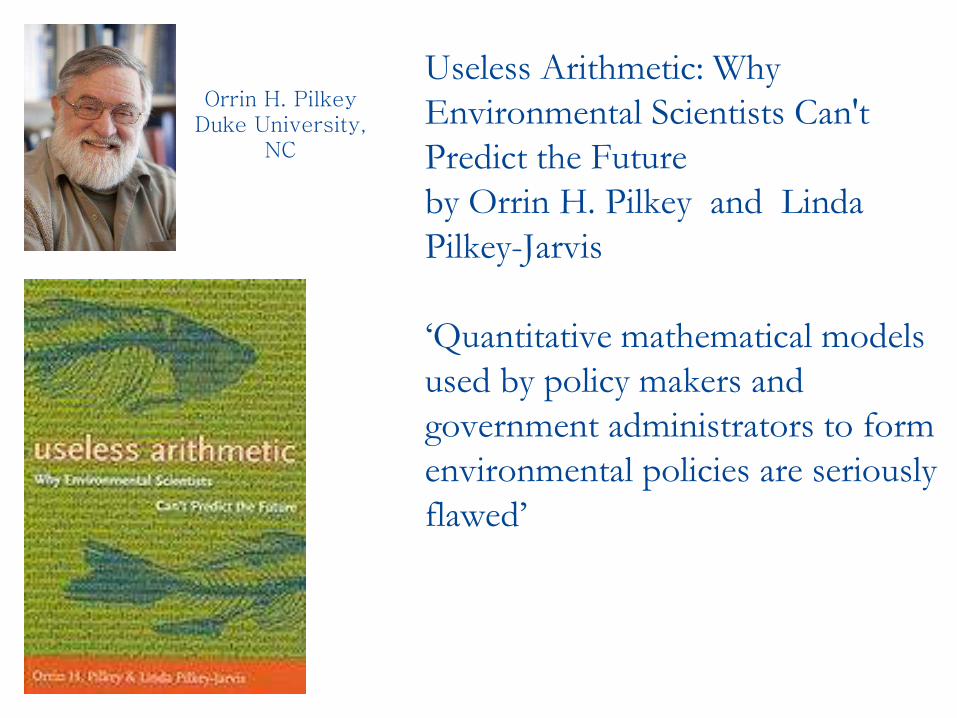
Useless Arithmetic: Why
Environmental Scientists Can't
Predict the Future
by Orrin H. Pilkey and Linda
Pilkey-Jarvis
‘Quantitative mathematical models
used by policy makers and
government administrators to form
environmental policies are seriously
flawed’
Orrin H. Pilkey Duke University,
NC
<<It is important, however, to recognize that the sensitivity of the parameter in the equation is what is being determined, not the sensitivity of the parameter in nature.
[…] If the model is wrong or if it is a poor representation of reality, determining the sensitivity of an individual parameter in the model is a meaningless pursuit.>>
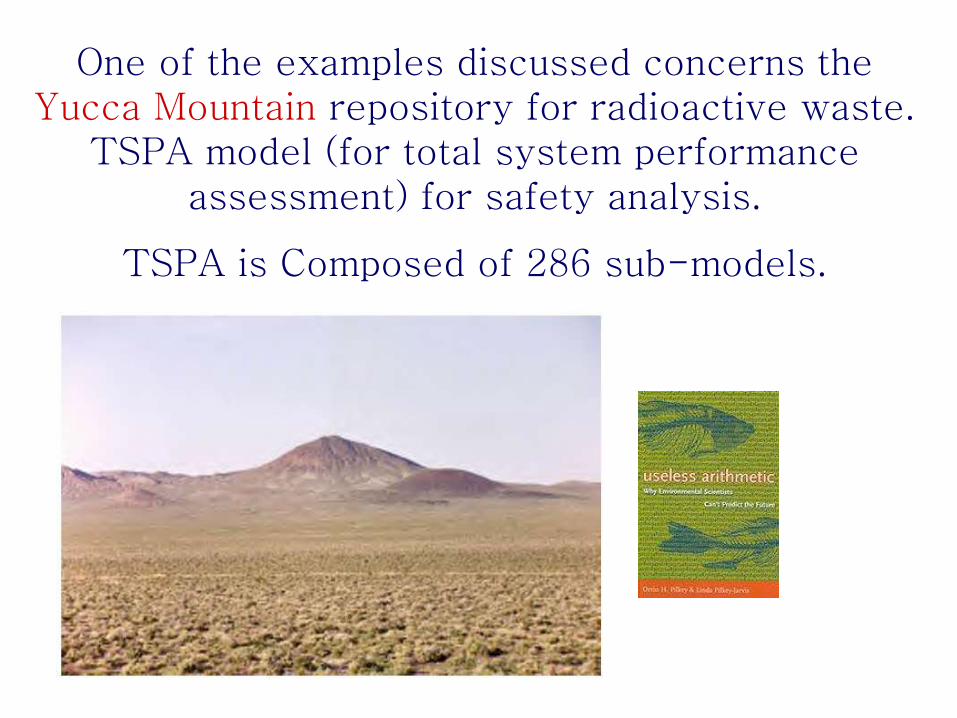
One of the examples discussed concerns the Yucca Mountain repository for radioactive waste.
TSPA model (for total system performance assessment) for safety analysis.
TSPA is Composed of 286 sub-models.
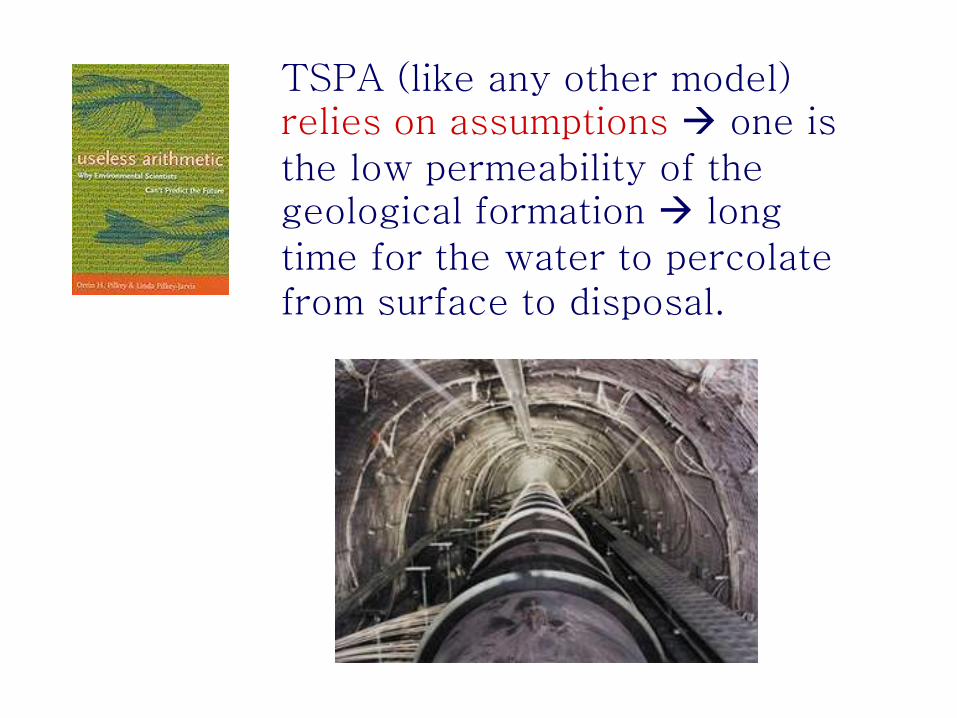
TSPA (like any other model) relies on assumptions one is the low permeability of the geological formation long time for the water to percolate from surface to disposal.

The confidence of the stakeholders in TSPA was not helped when evidence was produced which could lead to an upward revision of 4
orders of magnitude of this parameter (the 36Cl story)
Type III error in sensitivity: Examples:
In the case of TSPA (Yucca mountain) a range of 0.02 to 1 millimetre per year was used for
percolation of flux rate.
… SA useless if it is instead ~ 3,000 millimetres per year.
“Scientific mathematical modelling should involve constant efforts to
falsify the model”
Ref. Robert K. Merton’s ‘Organized skepticism ’
Communalism - the common ownership of scient40
ific discoveries, according to which scientists give up intellectual property rights in exchange for recognition and esteem (Merton actually used the term Communism, but had this notion of communalism in mind, not Marxism);
Universalism - according to which claims to truth are evaluated in terms of universal or impersonal criteria, and not on the basis of race, class, gender, religion, or nationality;
Disinterestedness - according to which scientists are rewarded for acting in ways that outwardly appear to be selfless;
Organized Skepticism - all ideas must be tested and are subject to rigorous, structured community scrutiny.
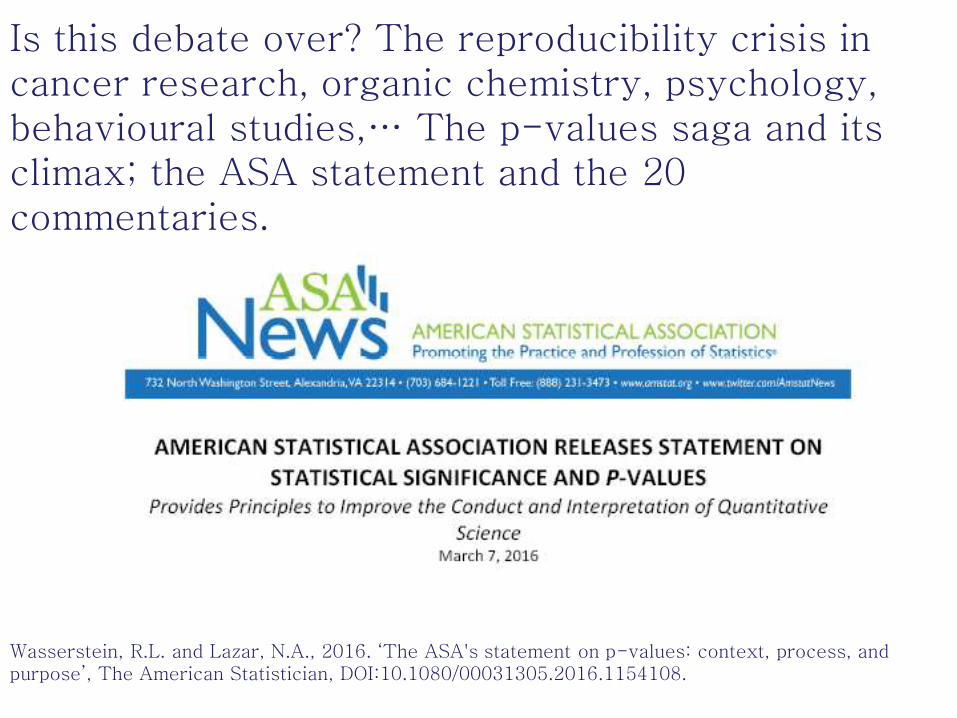
Is this debate over? The reproducibility crisis in cancer research, organic chemistry, psychology, behavioural studies,… The p-values saga and its climax; the ASA statement and the 20 commentaries.
Wasserstein, R.L. and Lazar, N.A., 2016. ‘The ASA's statement on p-values: context, process, and purpose’, The American Statistician, DOI:10.1080/00031305.2016.1154108.
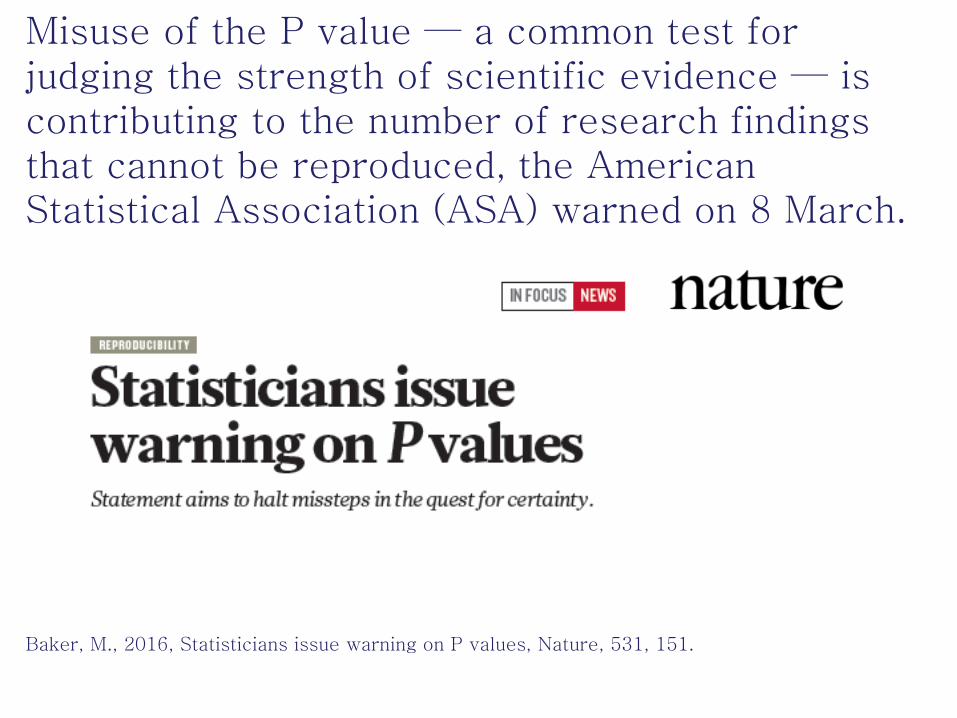
Misuse of the P value — a common test for judging the strength of scientific evidence — is contributing to the number of research findings that cannot be reproduced, the American Statistical Association (ASA) warned on 8 March.
Baker, M., 2016, Statisticians issue warning on P values, Nature, 531, 151.
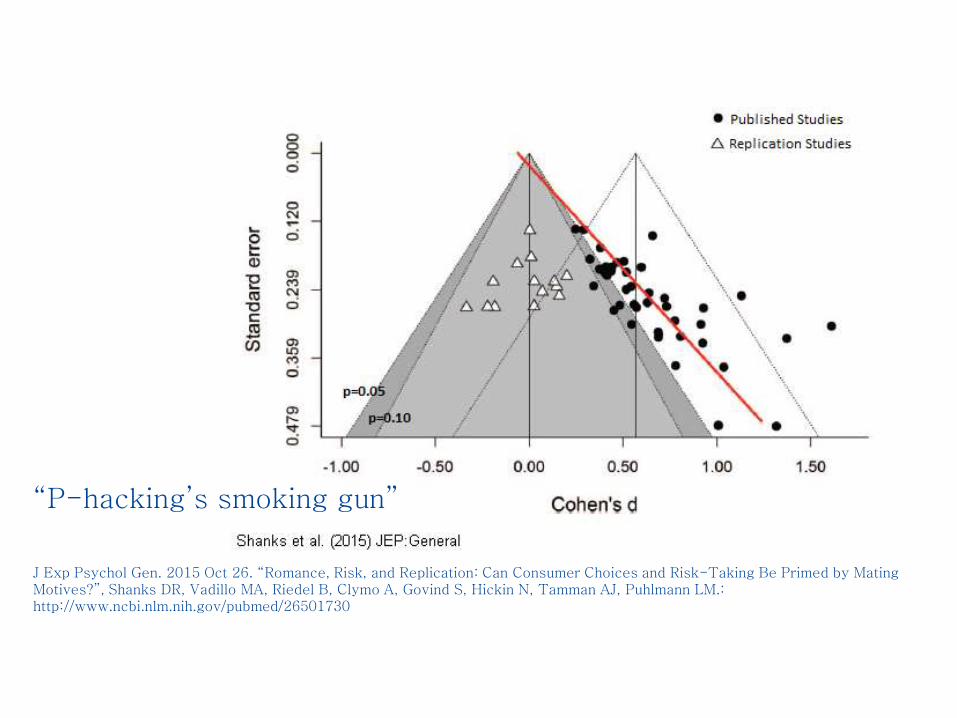
“P-hacking’s smoking gun”
J Exp Psychol Gen. 2015 Oct 26. “Romance, Risk, and Replication: Can Consumer Choices and Risk-Taking Be Primed by Mating Motives?”, Shanks DR, Vadillo MA, Riedel B, Clymo A, Govind S, Hickin N, Tamman AJ, Puhlmann LM.: http://www.ncbi.nlm.nih.gov/pubmed/26501730
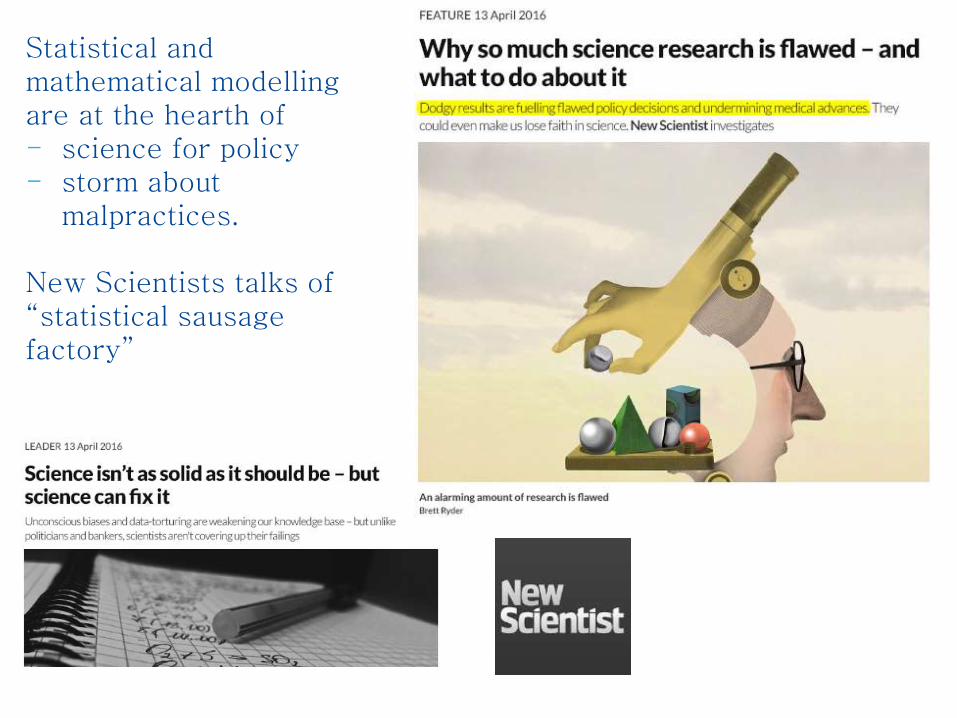
Statistical and mathematical modelling are at the hearth of - science for policy- storm about
malpractices.
New Scientists talks of “statistical sausage factory”

https://www.newscientist.com/letter/mg23030791-600-7-a-new-community-for-science/

http://www.amazon.com/Rightful-Place-Science-
Verge/dp/0692596380/ref=sr_1_1?s=books&ie=UTF8&qid=1456255907&sr=1-1&keywords=saltelli
http://www.andreasaltelli.eu/science-on-the-verge
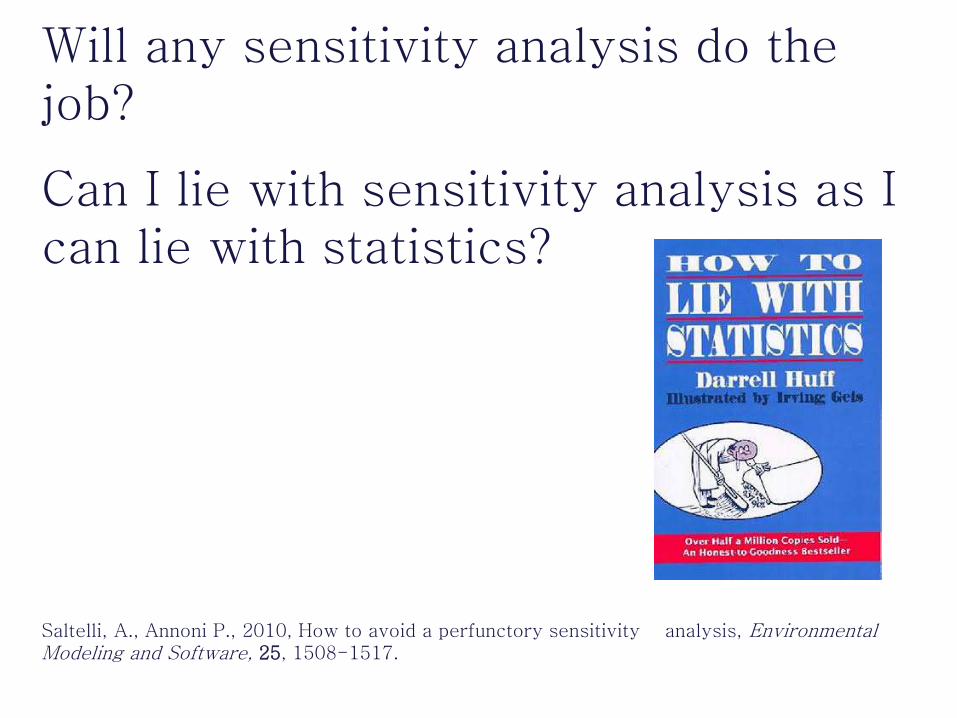
Will any sensitivity analysis do the job?
Can I lie with sensitivity analysis as I can lie with statistics?
Saltelli, A., Annoni P., 2010, How to avoid a perfunctory sensitivity analysis, Environmental Modeling and Software, 25, 1508-1517.
From: Saltelli, A., Annoni P., 2010 How to avoid a perfunctory sensitivity analysis,
Environmental Modeling and Software, 25, 1508-1517.
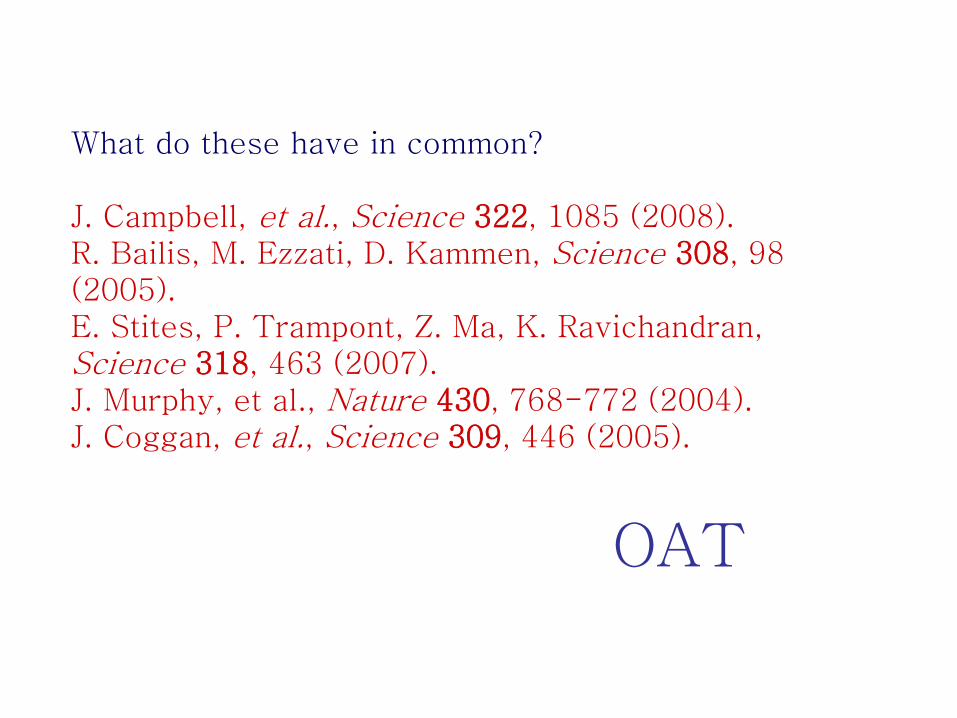
What do these have in common?
J. Campbell, et al., Science 322, 1085 (2008).R. Bailis, M. Ezzati, D. Kammen, Science 308, 98 (2005).E. Stites, P. Trampont, Z. Ma, K. Ravichandran, Science 318, 463 (2007).J. Murphy, et al., Nature 430, 768-772 (2004).J. Coggan, et al., Science 309, 446 (2005).
OAT
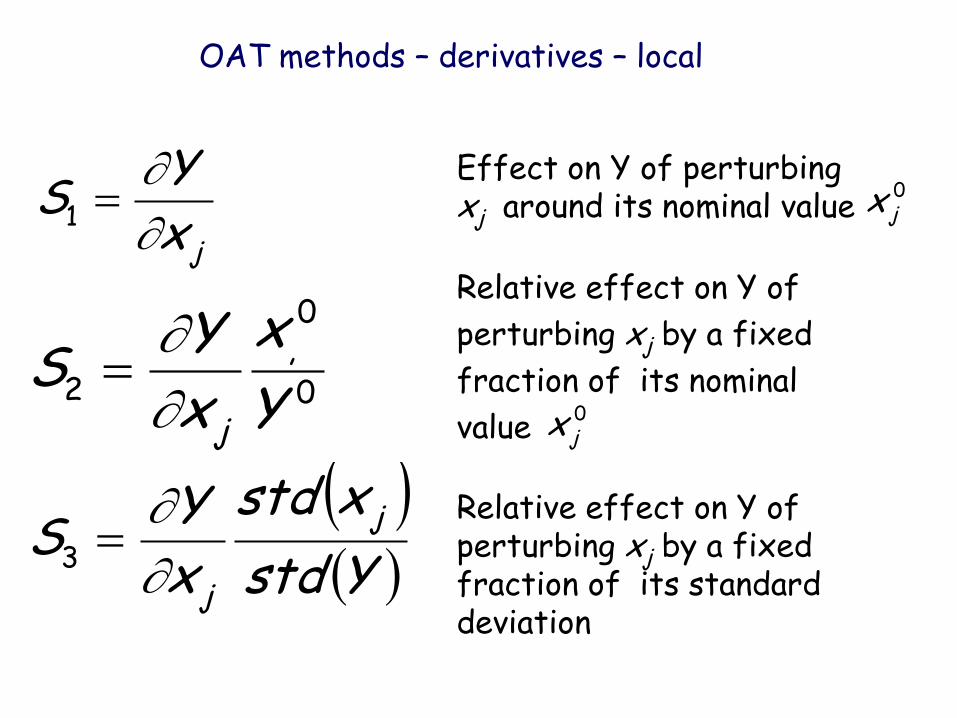
OAT methods – derivatives – local
jxY
S
1
0
0,
2 Y
x
xY
Sj
Ystd
xstd
xY
S j
j
3
Effect on Y of perturbing xj around its nominal value
Relative effect on Y of
perturbing xj by a fixed
fraction of its nominal
value
Relative effect on Y of perturbing xj by a fixed fraction of its standard deviation
0jx
0jx
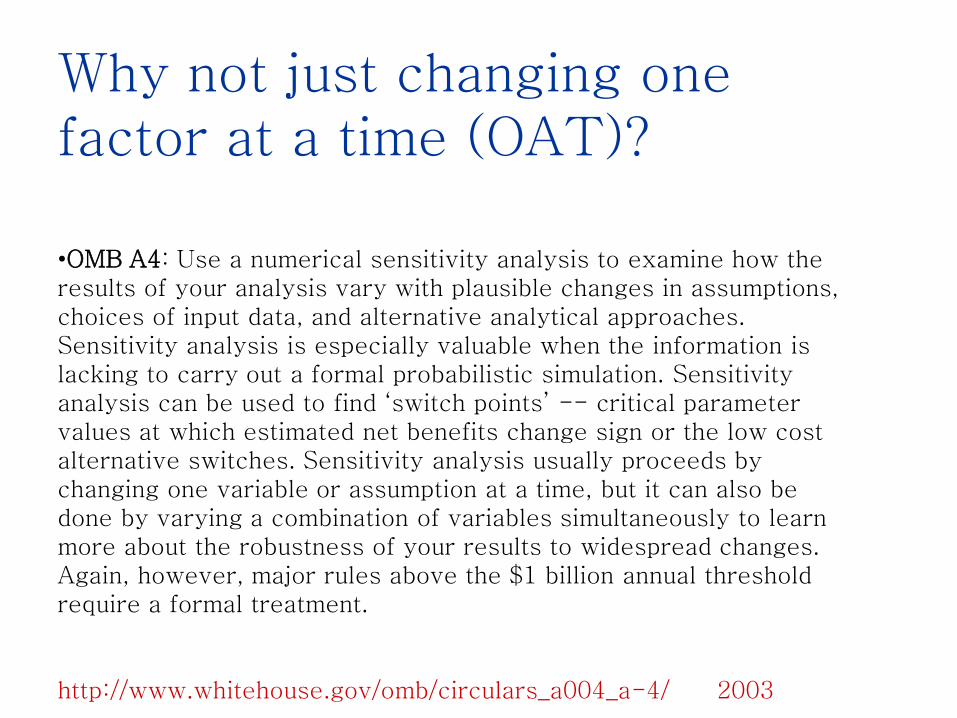
Why not just changing one factor at a time (OAT)?
•OMB A4: Use a numerical sensitivity analysis to examine how the results of your analysis vary with plausible changes in assumptions, choices of input data, and alternative analytical approaches. Sensitivity analysis is especially valuable when the information is lacking to carry out a formal probabilistic simulation. Sensitivity analysis can be used to find ‘switch points’ -- critical parameter values at which estimated net benefits change sign or the low cost alternative switches. Sensitivity analysis usually proceeds by changing one variable or assumption at a time, but it can also be done by varying a combination of variables simultaneously to learn more about the robustness of your results to widespread changes. Again, however, major rules above the $1 billion annual threshold require a formal treatment.
http://www.whitehouse.gov/omb/circulars_a004_a-4/ 2003
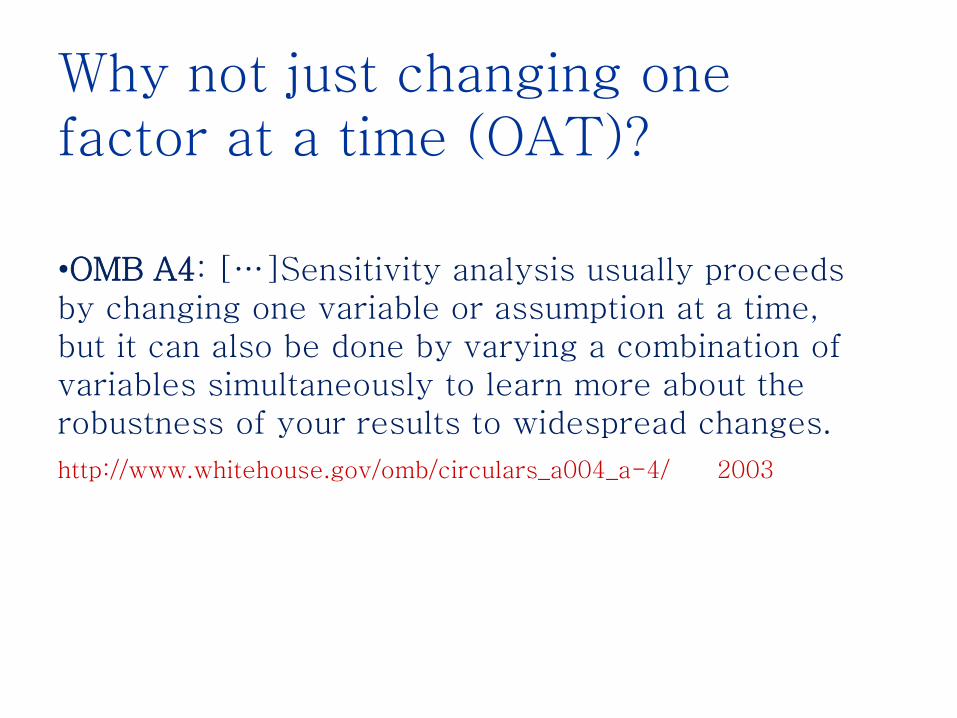
Why not just changing one factor at a time (OAT)?
•OMB A4: […]Sensitivity analysis usually proceeds by changing one variable or assumption at a time, but it can also be done by varying a combination of variables simultaneously to learn more about the robustness of your results to widespread changes.
http://www.whitehouse.gov/omb/circulars_a004_a-4/ 2003
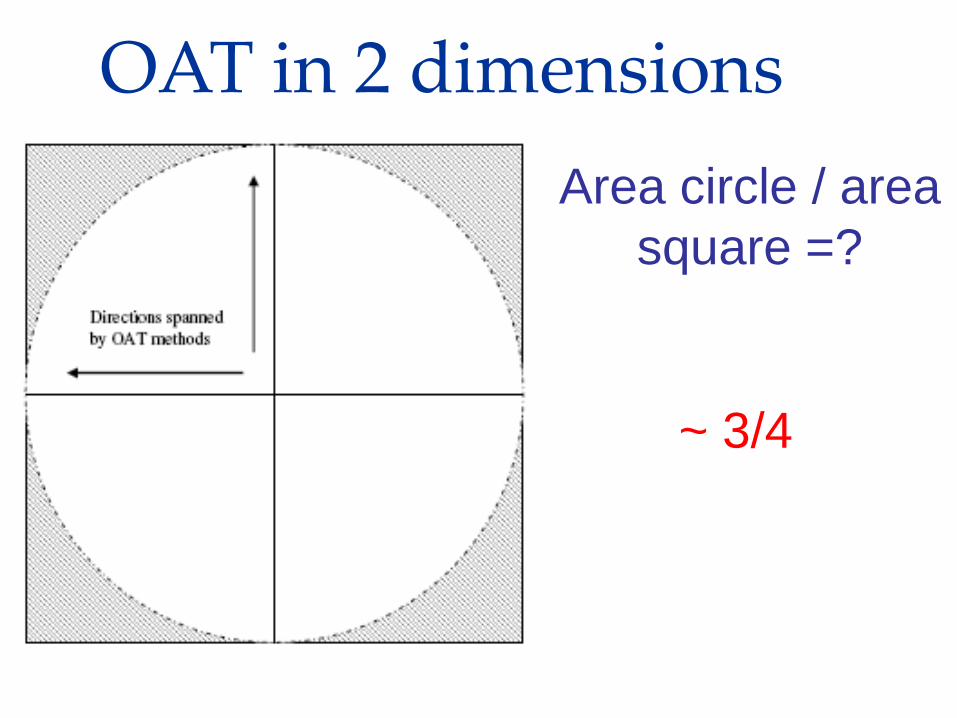
OAT in 2 dimensions
Area circle / area
square =?
~ 3/4
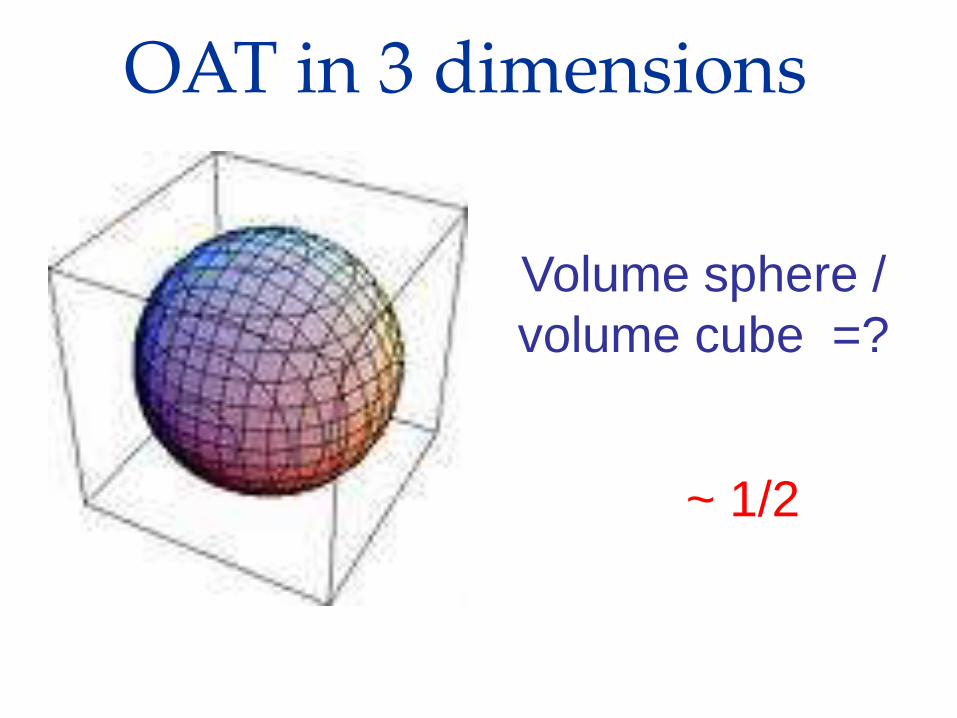
OAT in 3 dimensions
Volume sphere /
volume cube =?
~ 1/2
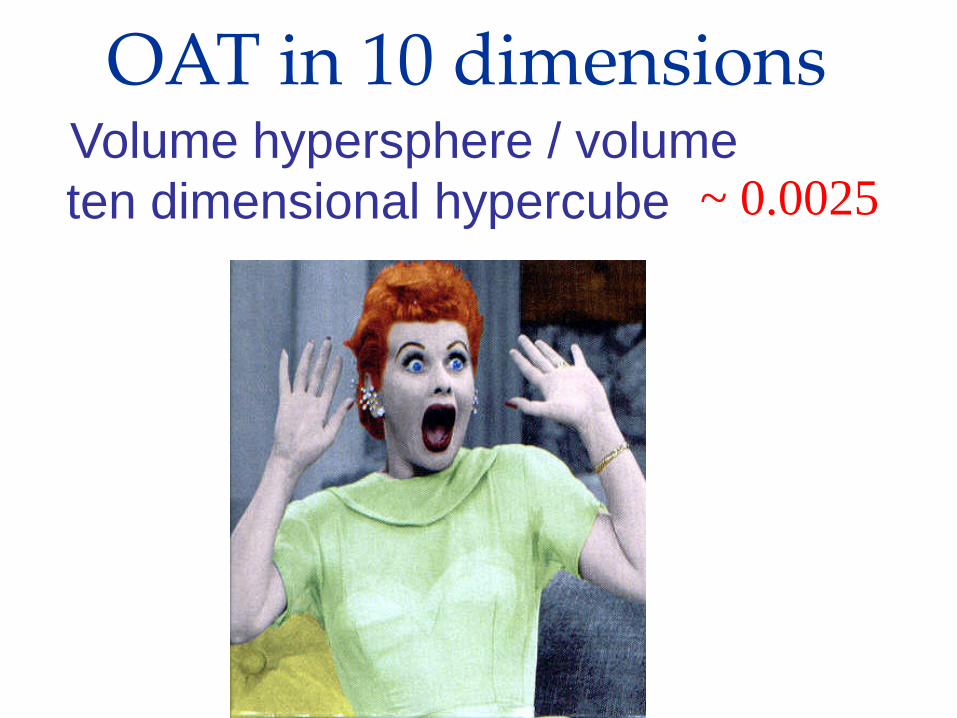
OAT in 10 dimensionsVolume hypersphere / volume
ten dimensional hypercube =?~ 0.0025
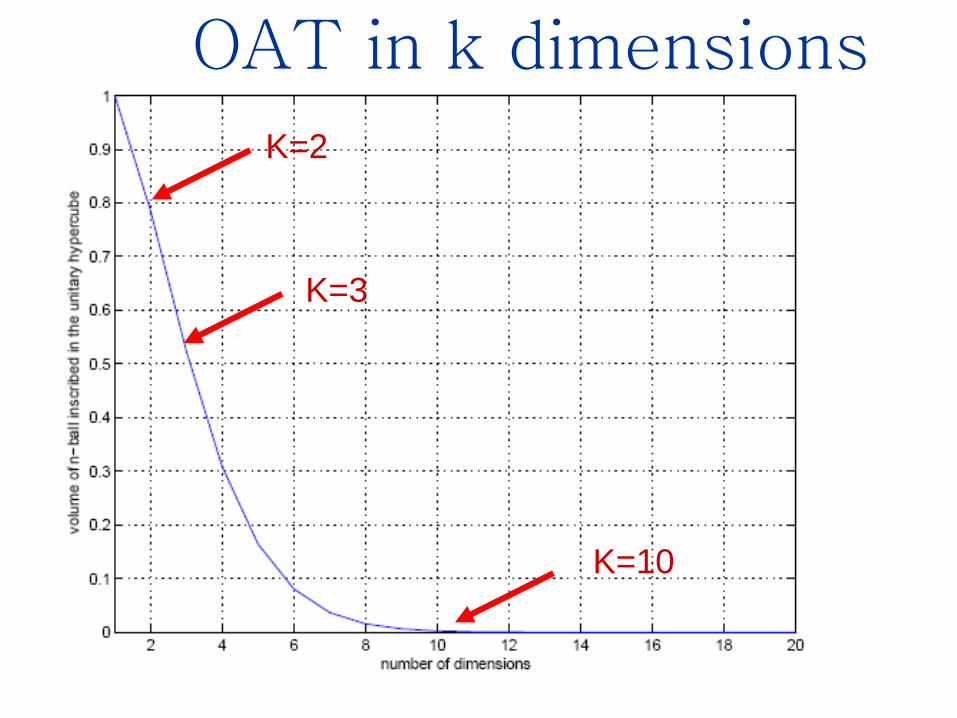
OAT in k dimensions
K=2
K=3
K=10
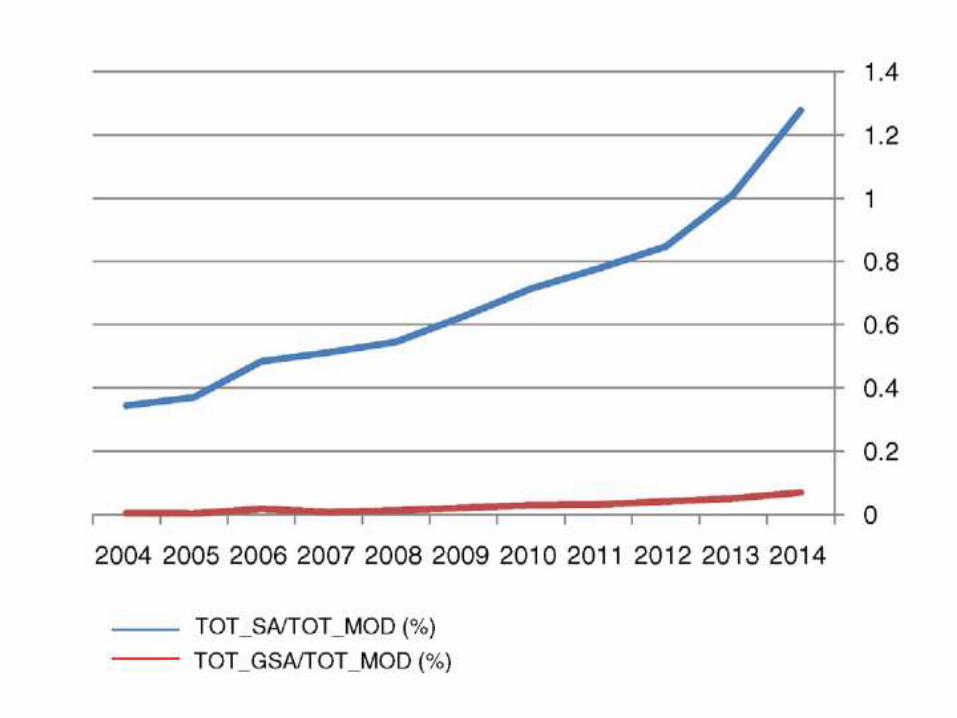
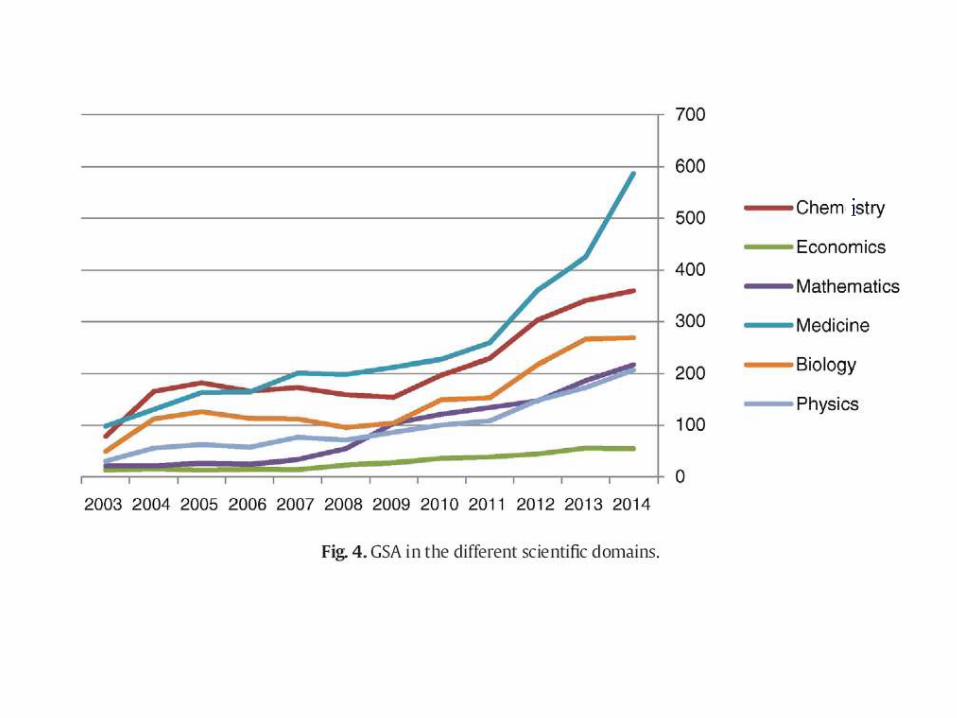
How are we doing in 2016?
…OAT is still the most largely used technique in SA, … clear increase in the use of GSA with preference for regression and variance-based techniques.
Ferretti, F., Saltelli A., Tarantola, S., 2016, Trends in Sensitivity Analysis practice in the last decade, Science of the Total Environment, http://dx.doi.org/10.1016/j.scitotenv.2016.02.133
i
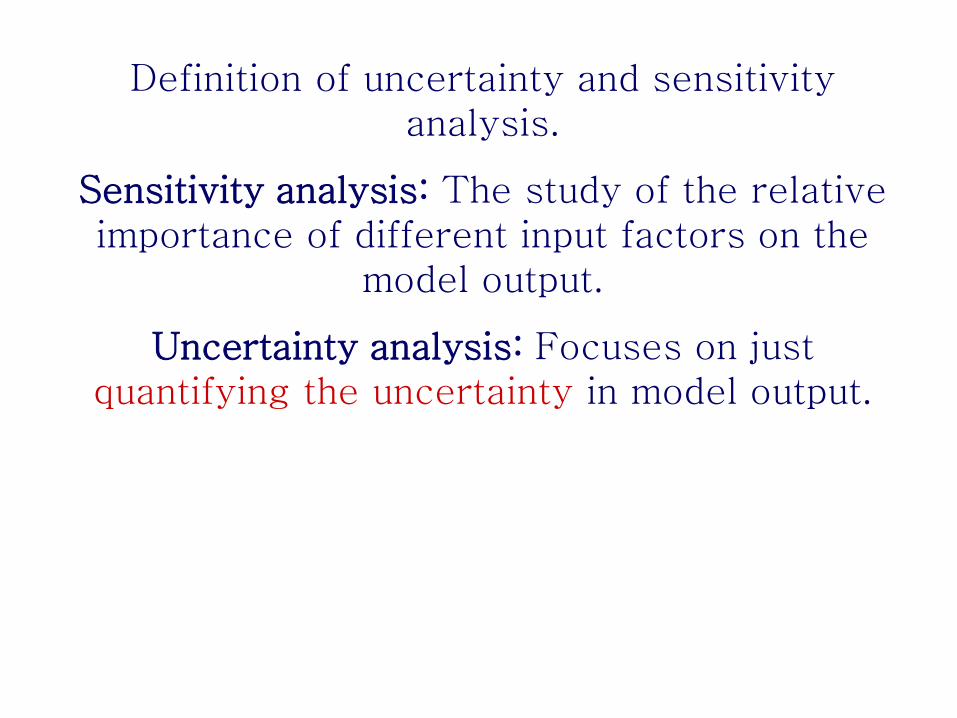
Definition of uncertainty and sensitivity analysis.
Sensitivity analysis: The study of the relative importance of different input factors on the
model output.
Uncertainty analysis: Focuses on just quantifying the uncertainty in model output.
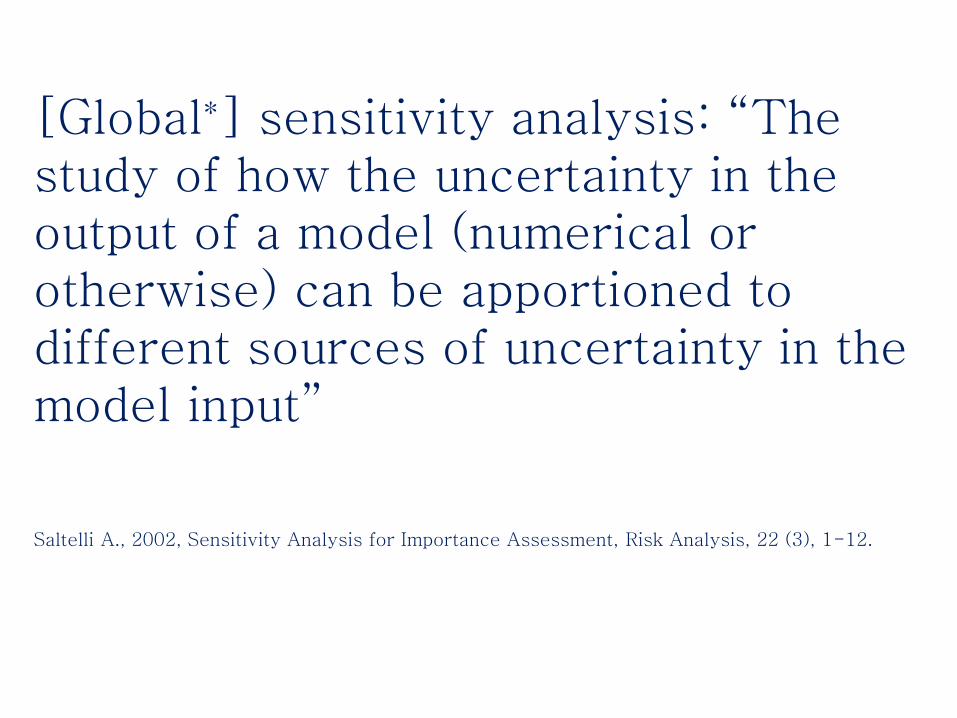
[Global*] sensitivity analysis: “The study of how the uncertainty in the output of a model (numerical or otherwise) can be apportioned to different sources of uncertainty in the model input”
Saltelli A., 2002, Sensitivity Analysis for Importance Assessment, Risk Analysis, 22 (3), 1-12.
•Modelling in a Monte Carlo framework using quasi MC-points •All uncertainties activated simultaneously; uncertainty and sensitivity together
52
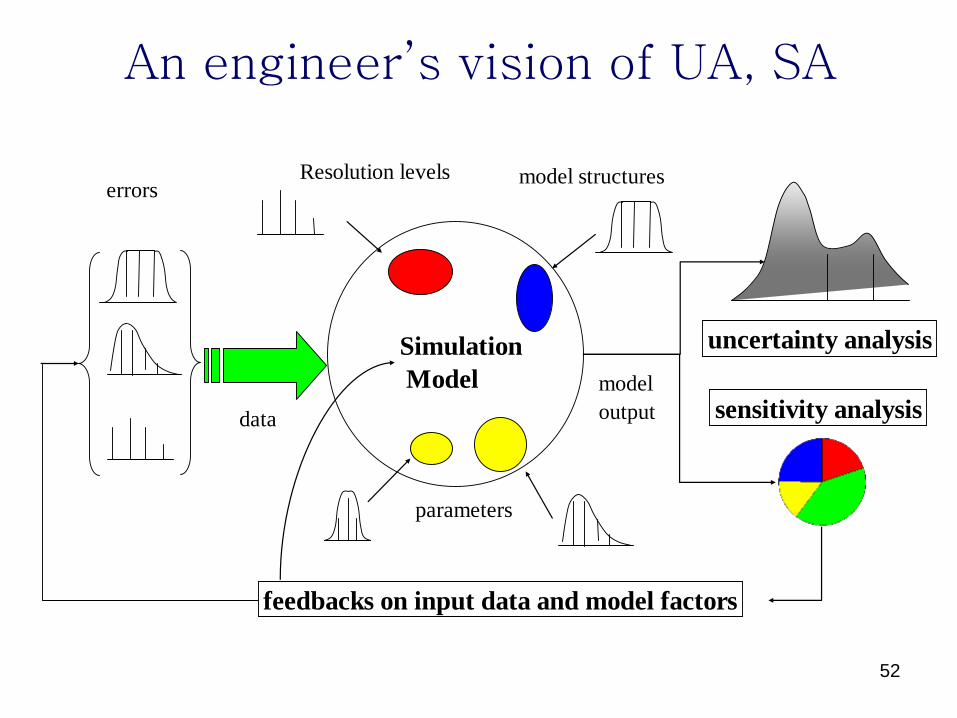
Simulation
Model
parameters
Resolution levels
data
errorsmodel structures
uncertainty analysis
sensitivity analysismodel
output
feedbacks on input data and model factors
An engineer’s vision of UA, SA
One can sample more than just factors …
Using triggers one can sample modelling assumptions …
Example: Y is a composite indicator
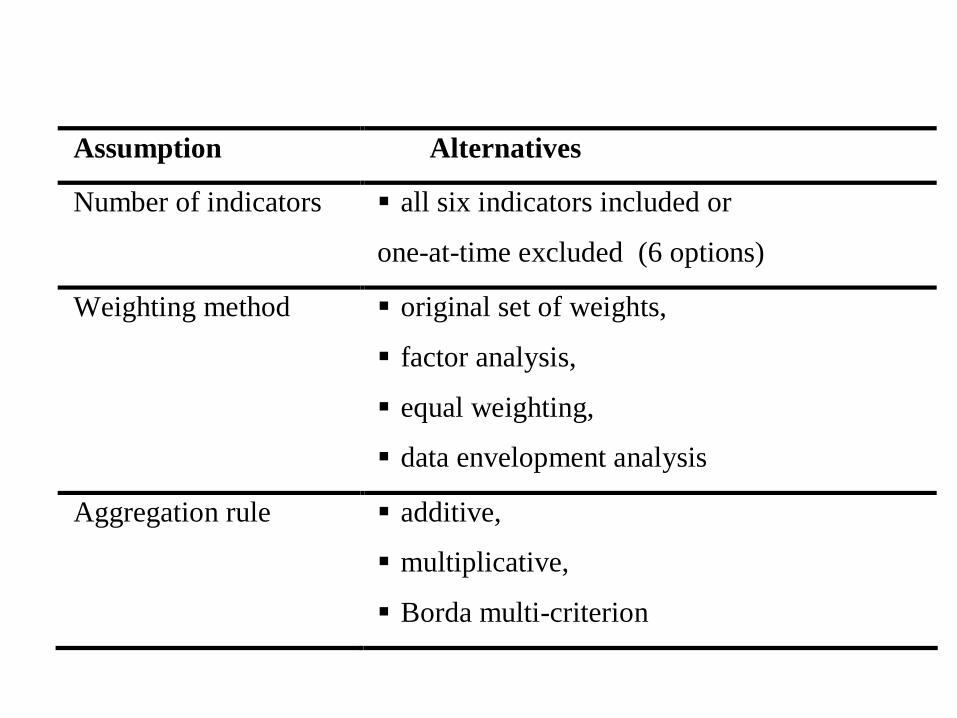
Assumption Alternatives
Number of indicators all six indicators included or
one-at-time excluded (6 options)
Weighting method original set of weights,
factor analysis,
equal weighting,
data envelopment analysis
Aggregation rule additive,
multiplicative,
Borda multi-criterion
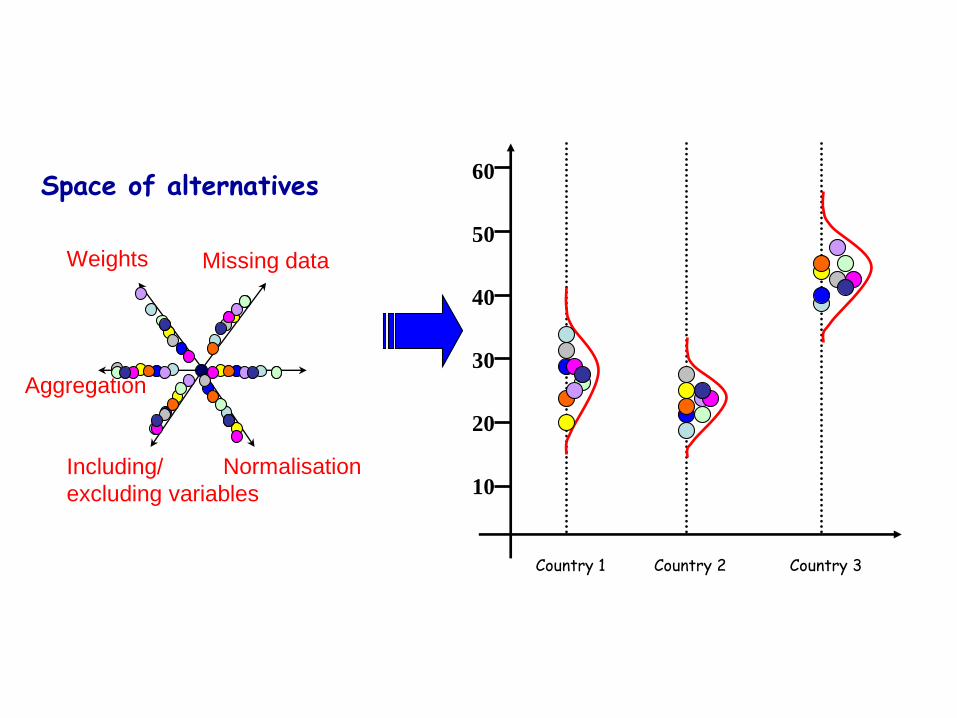
Space of alternatives
Including/
excluding variables
Normalisation
Missing dataWeights
Aggregation
Country 1
10
20
30
40
50
60
Country 2 Country 3
Sensitivity analysis
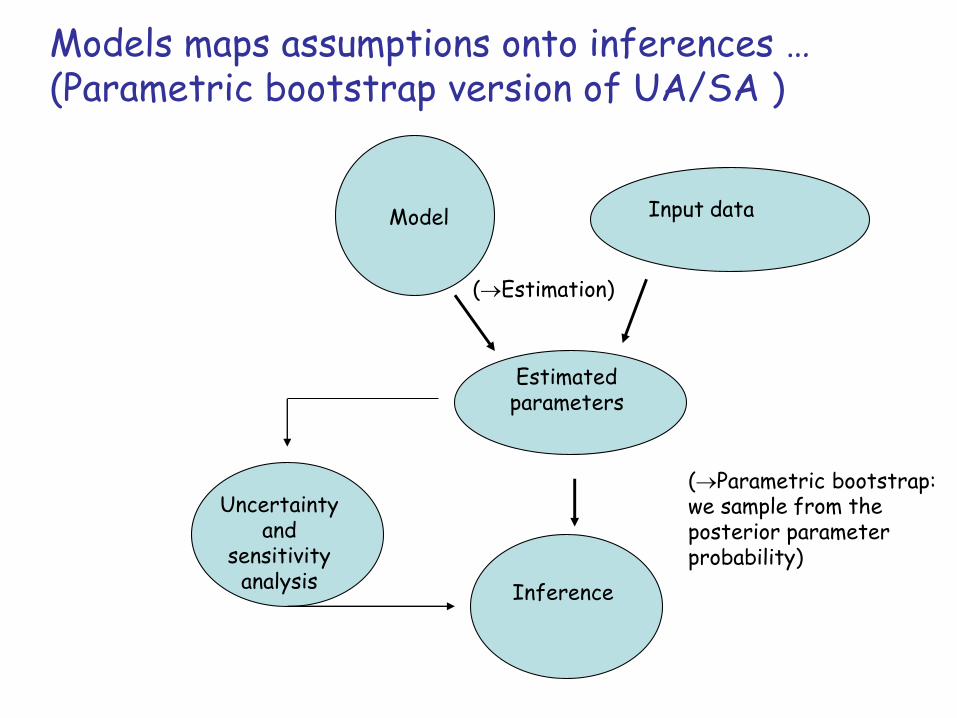
Estimated parameters
Input dataModel
Uncertainty and
sensitivity analysis
Models maps assumptions onto inferences … (Parametric bootstrap version of UA/SA )
Inference
(Parametric bootstrap: we sample from the posterior parameter probability)
(Estimation)
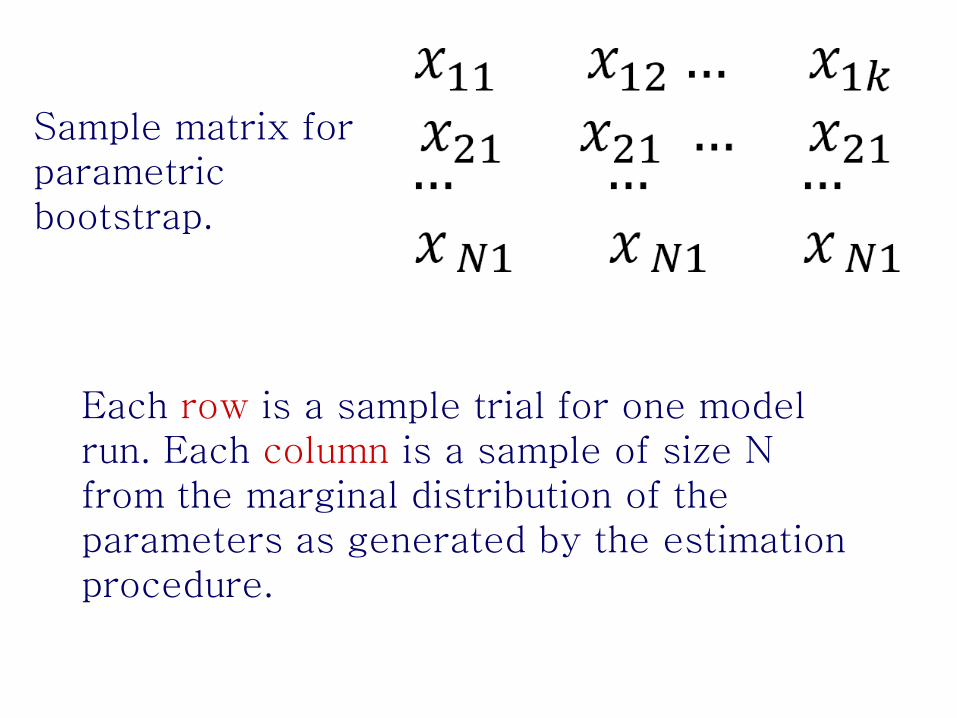
Sample matrix for parametric bootstrap.
Each row is a sample trial for one model run. Each column is a sample of size N from the marginal distribution of the parameters as generated by the estimation procedure.
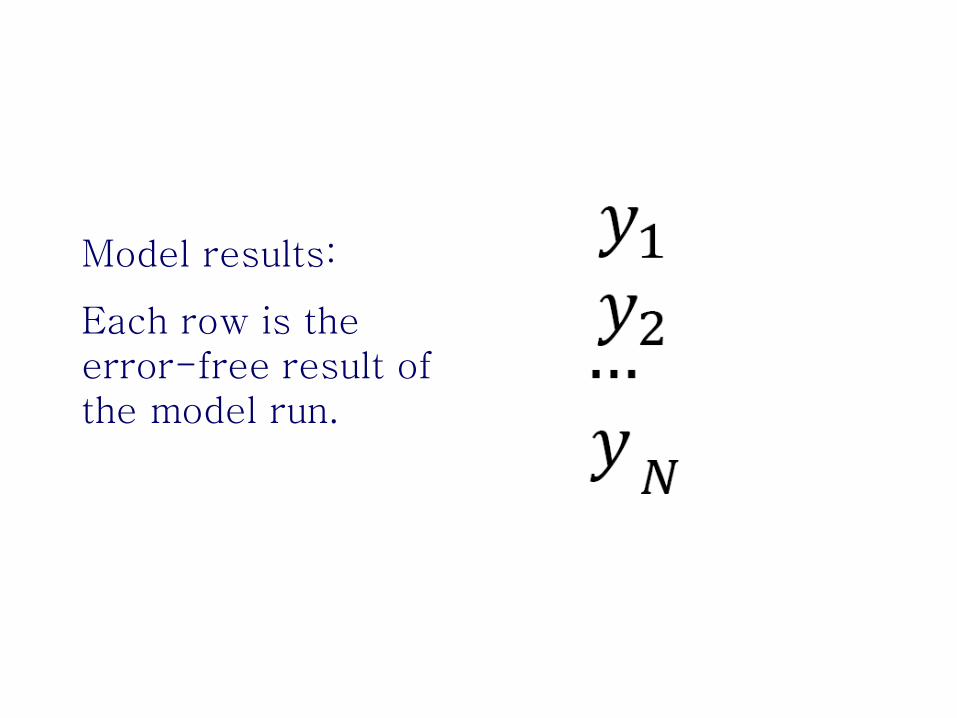
Model results:
Each row is the error-free result of the model run.
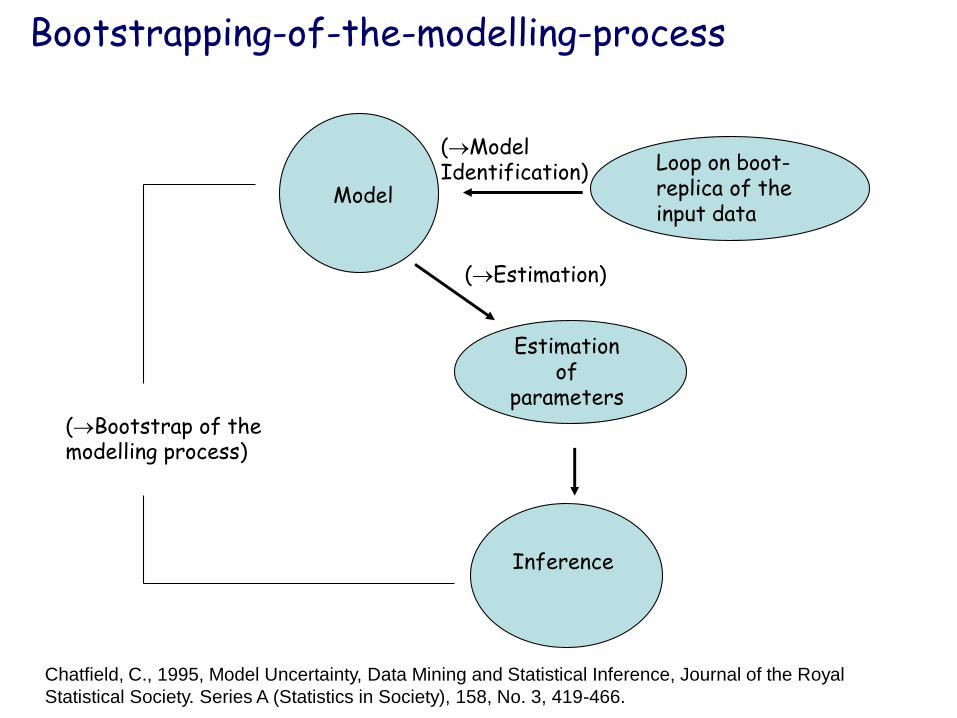
Bootstrapping-of-the-modelling-process
Estimation of
parameters
Loop on boot-replica of the input data
Model
Inference
(Bootstrap of the modelling process)
(Estimation)
(Model Identification)
Chatfield, C., 1995, Model Uncertainty, Data Mining and Statistical Inference, Journal of the Royal
Statistical Society. Series A (Statistics in Society), 158, No. 3, 419-466.
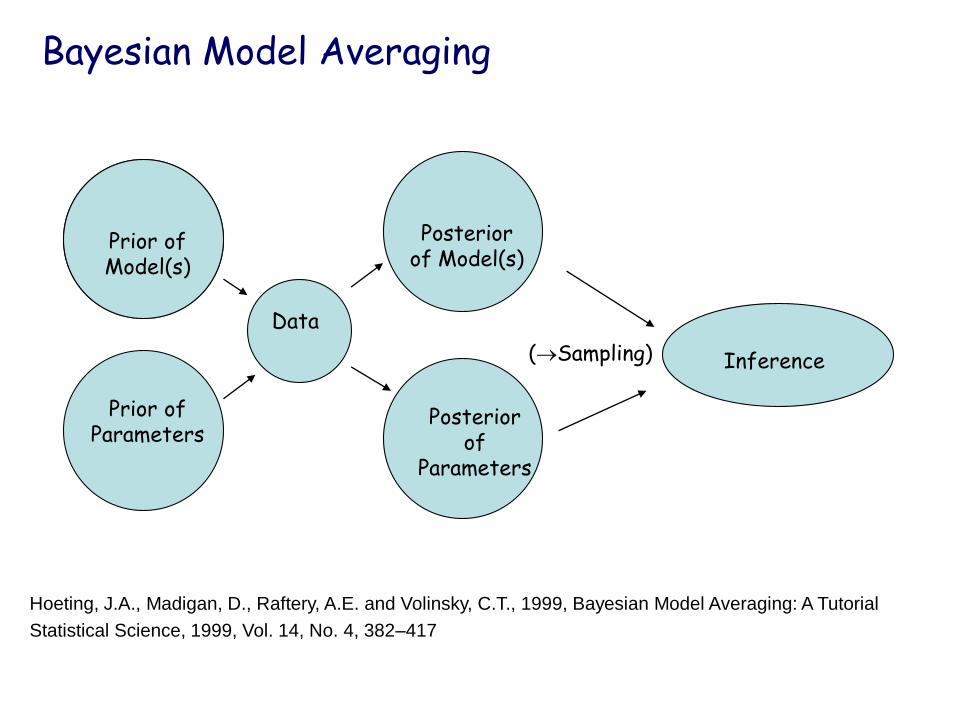
Inference
Data
Prior of Model
Bayesian Model Averaging
Prior of Parameters
Prior of Model(s)
Posterior of
Parameters
Posterior of Model(s)
(Sampling)
Hoeting, J.A., Madigan, D., Raftery, A.E. and Volinsky, C.T., 1999, Bayesian Model Averaging: A Tutorial
Statistical Science, 1999, Vol. 14, No. 4, 382–417
Our preferred methods for SA: variance based
Variance based methods’ best formalization is based on the work of Ilya M. Sobol’ (1990), who extended the work of R.I. Cukier (1973).
Total sensitivity indices by T. Homma and myself (1996).
Today a rich literature and many investigators on the topic.
An intuitive derivation of sensitivity indices
-60
-40
-20
0
20
40
60
-4 -3 -2 -1 0 1 2 3 4
-60
-40
-20
0
20
40
60
-4 -3 -2 -1 0 1 2 3 4
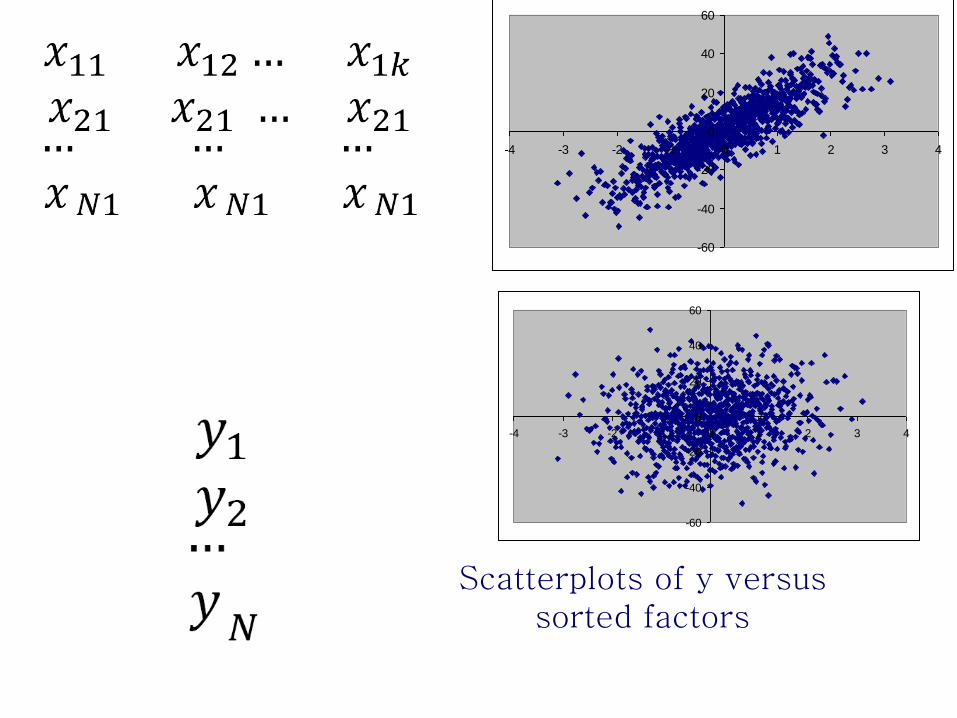
Scatterplots of y versus sorted factors
-60
-40
-20
0
20
40
60
-4 -3 -2 -1 0 1 2 3 4
-60
-40
-20
0
20
40
60
-4 -3 -2 -1 0 1 2 3 4
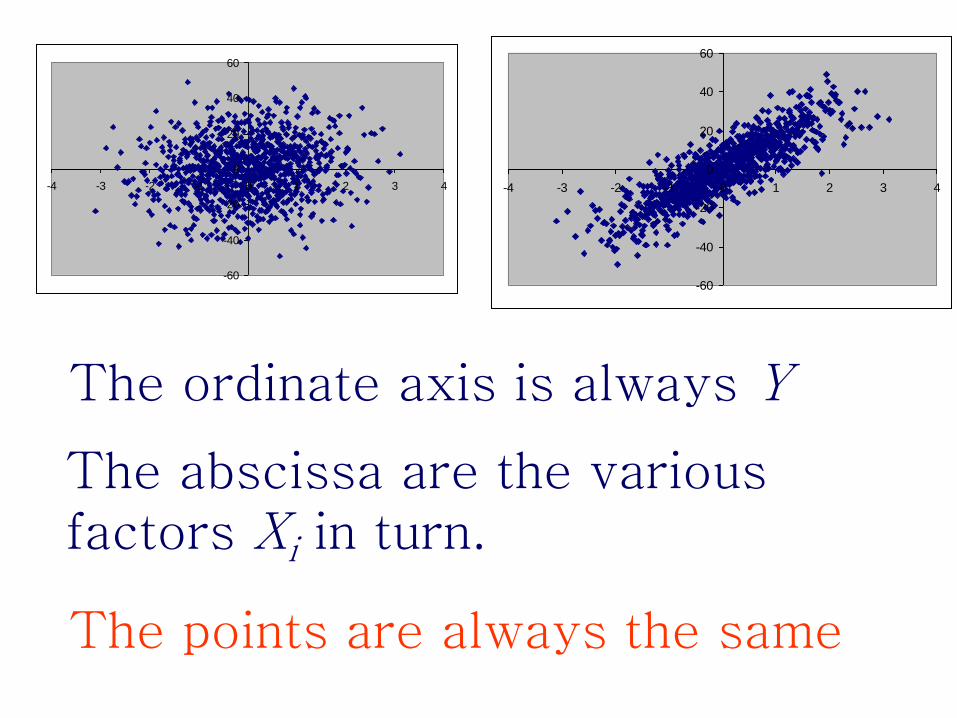
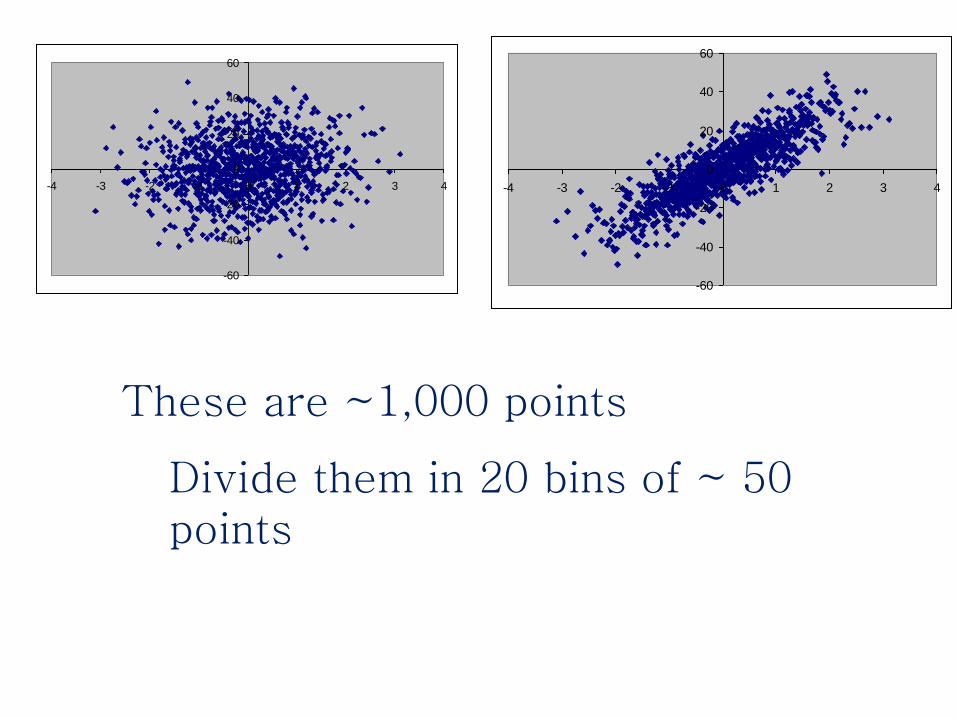
The ordinate axis is always Y
The abscissa are the various factors Xi in turn.
The points are always the same
-60
-40
-20
0
20
40
60
-4 -3 -2 -1 0 1 2 3 4
-60
-40
-20
0
20
40
60
-4 -3 -2 -1 0 1 2 3 4
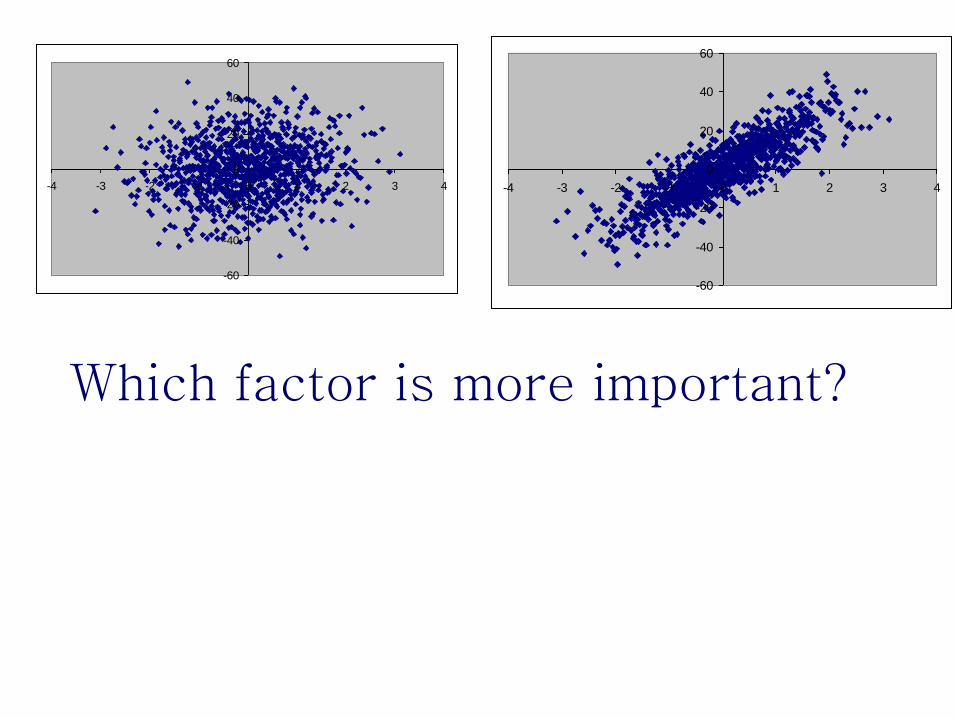
Which factor is more important?
-60
-40
-20
0
20
40
60
-4 -3 -2 -1 0 1 2 3 4
-60
-40
-20
0
20
40
60
-4 -3 -2 -1 0 1 2 3 4
These are ~1,000 points
Divide them in 20 bins of ~ 50 points
-60
-40
-20
0
20
40
60
-4 -3 -2 -1 0 1 2 3 4
-60
-40
-20
0
20
40
60
-4 -3 -2 -1 0 1 2 3 4
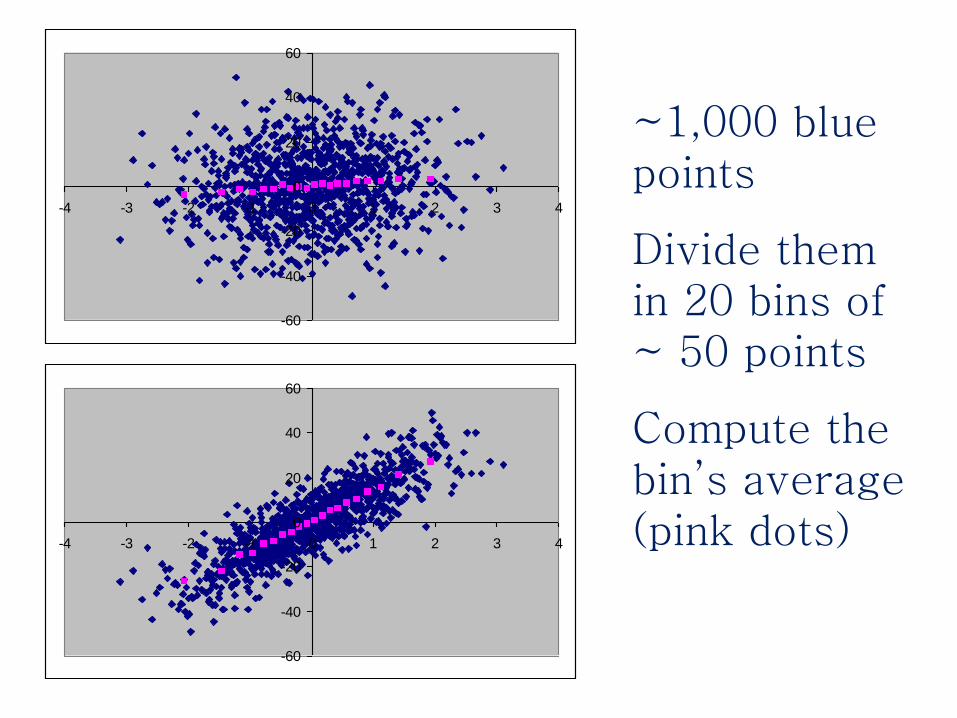
~1,000 blue points
Divide them in 20 bins of ~ 50 points
Compute the bin’s average (pink dots)
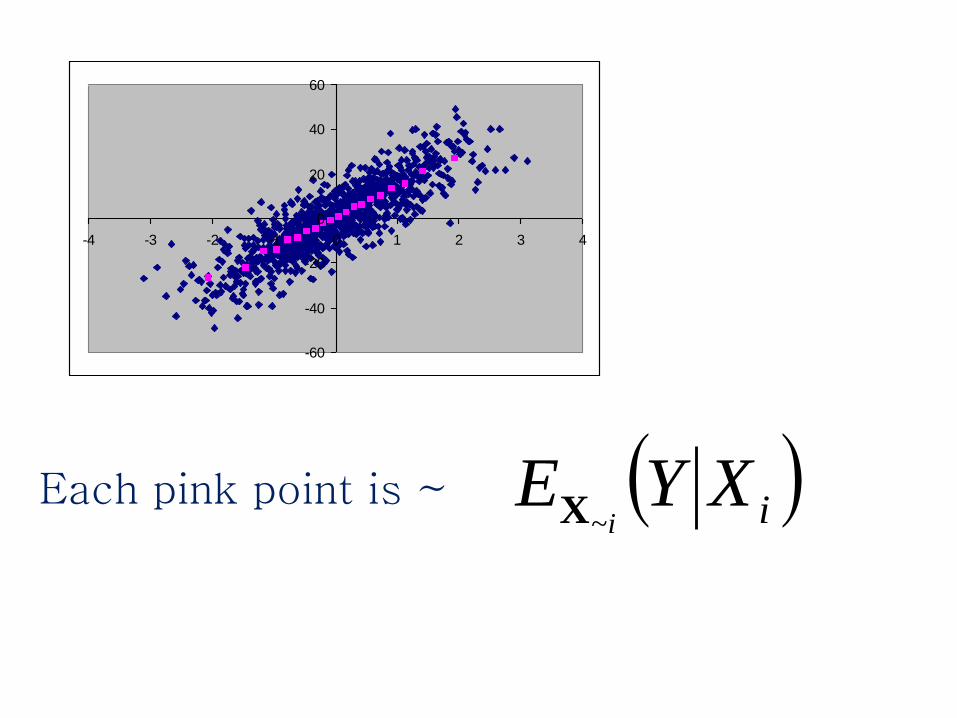
iXYEi~X
Each pink point is ~
-60
-40
-20
0
20
40
60
-4 -3 -2 -1 0 1 2 3 4
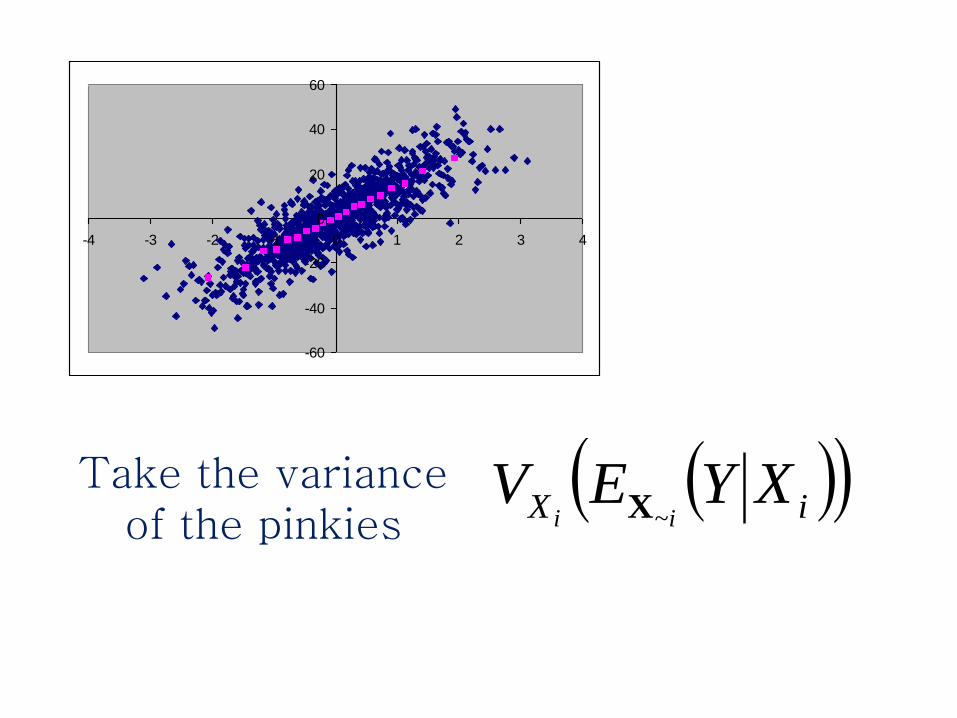
iX XYEVii ~X
Take the variance of the pinkies
-60
-40
-20
0
20
40
60
-4 -3 -2 -1 0 1 2 3 4
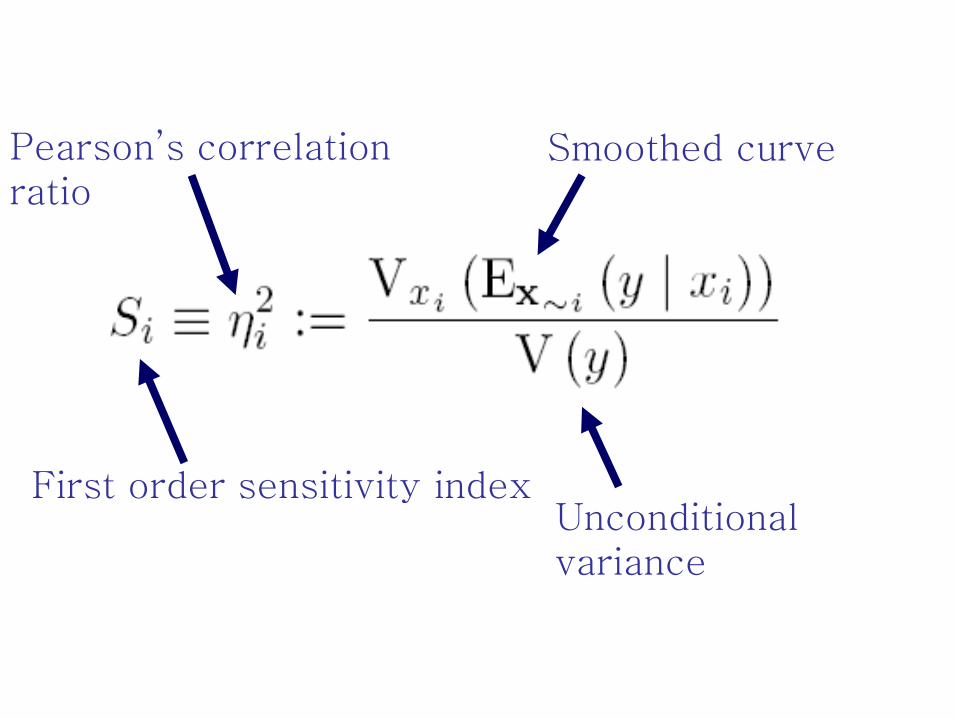
First order sensitivity index
Pearson’s correlation ratio
Smoothed curve
Unconditional variance
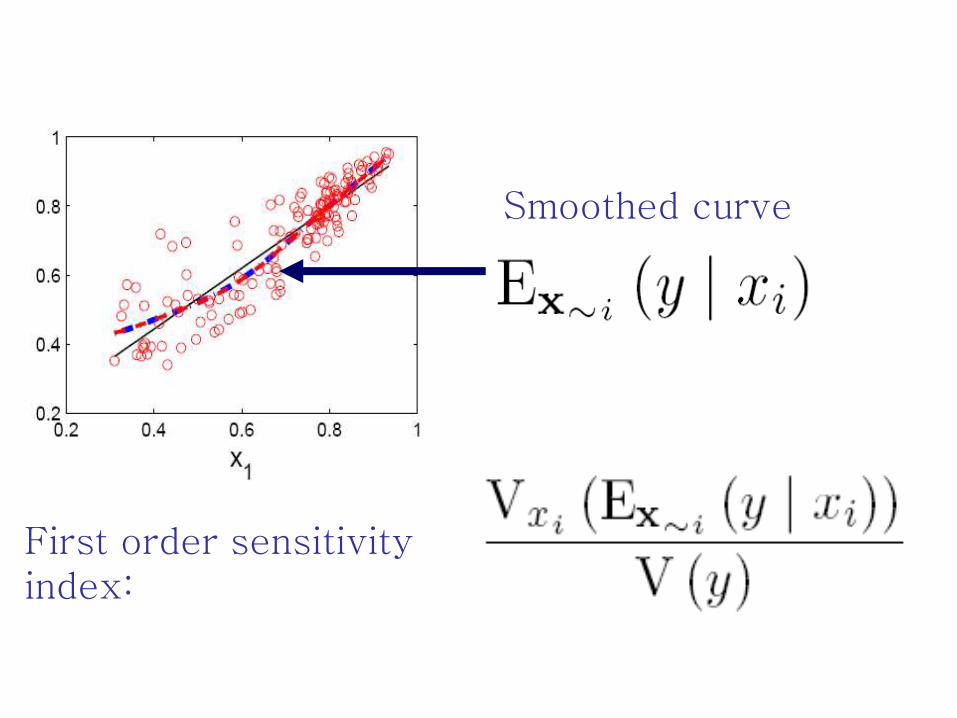
First order sensitivity index:
Smoothed curve
iX XYEVii ~X
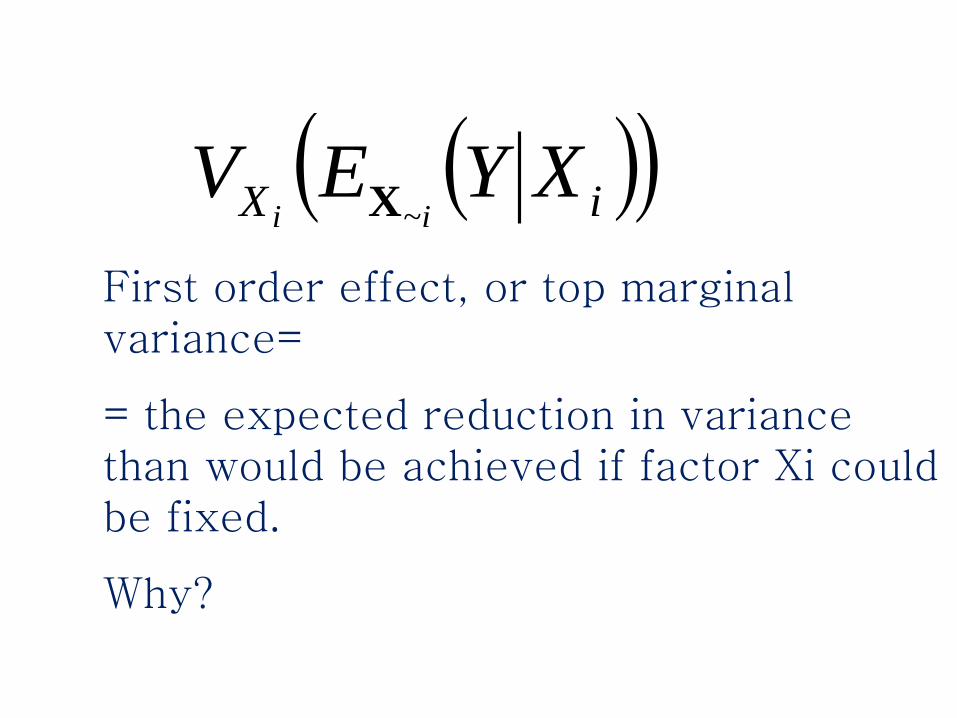
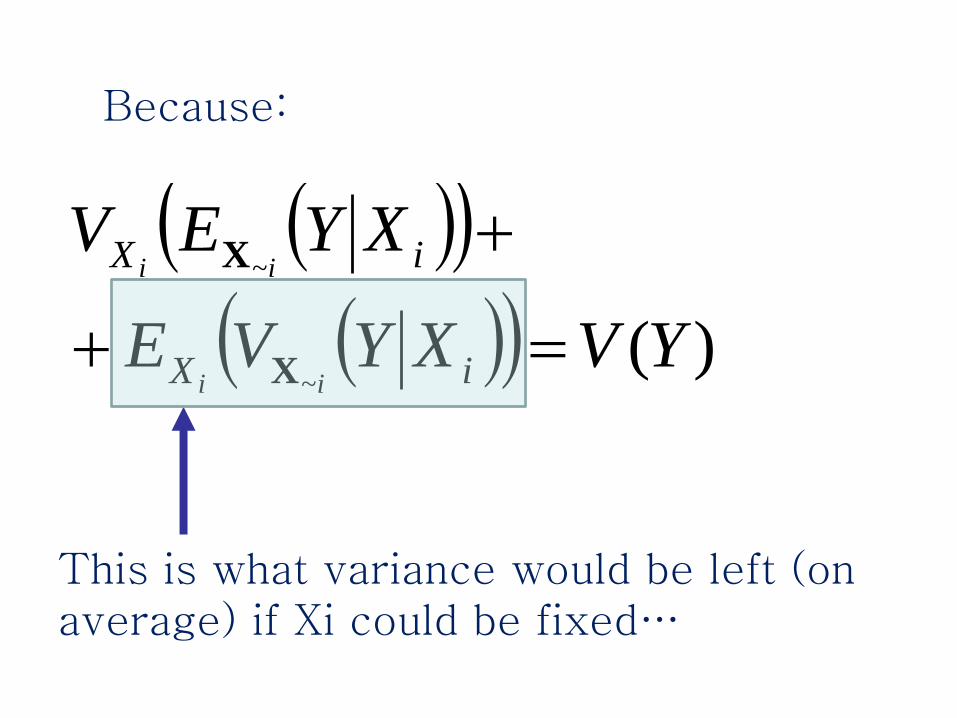
First order effect, or top marginal variance=
= the expected reduction in variance than would be achieved if factor Xi could be fixed.
Why?
)(
~
~
YVXYVE
XYEV
iX
iX
ii
ii
X
X
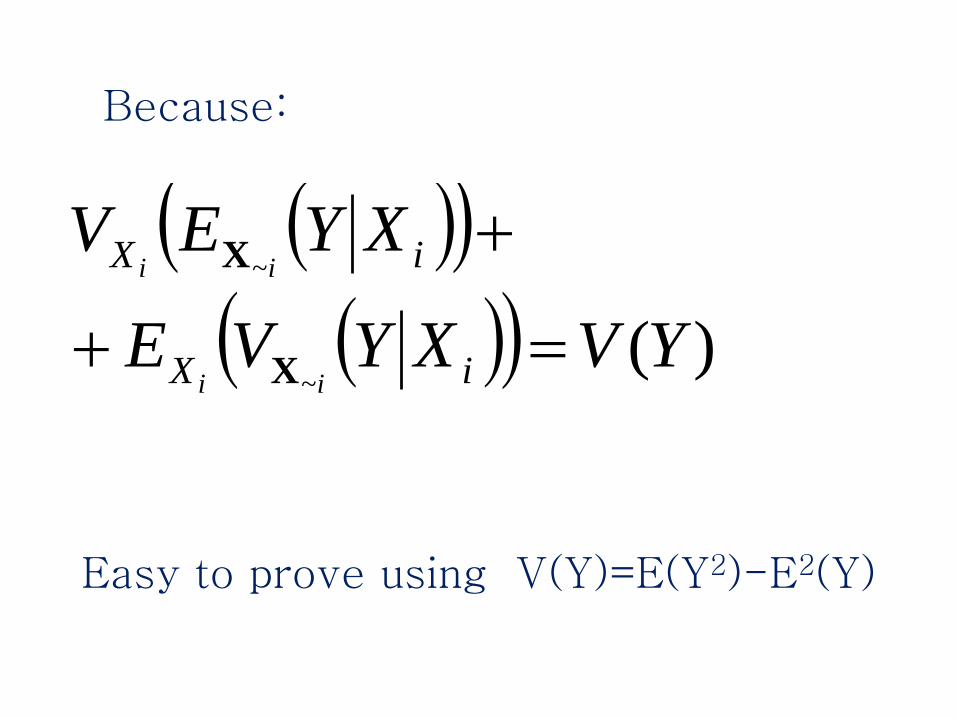
Because:
Easy to prove using V(Y)=E(Y2)-E2(Y)
)(
~
~
YVXYVE
XYEV
iX
iX
ii
ii
X
X
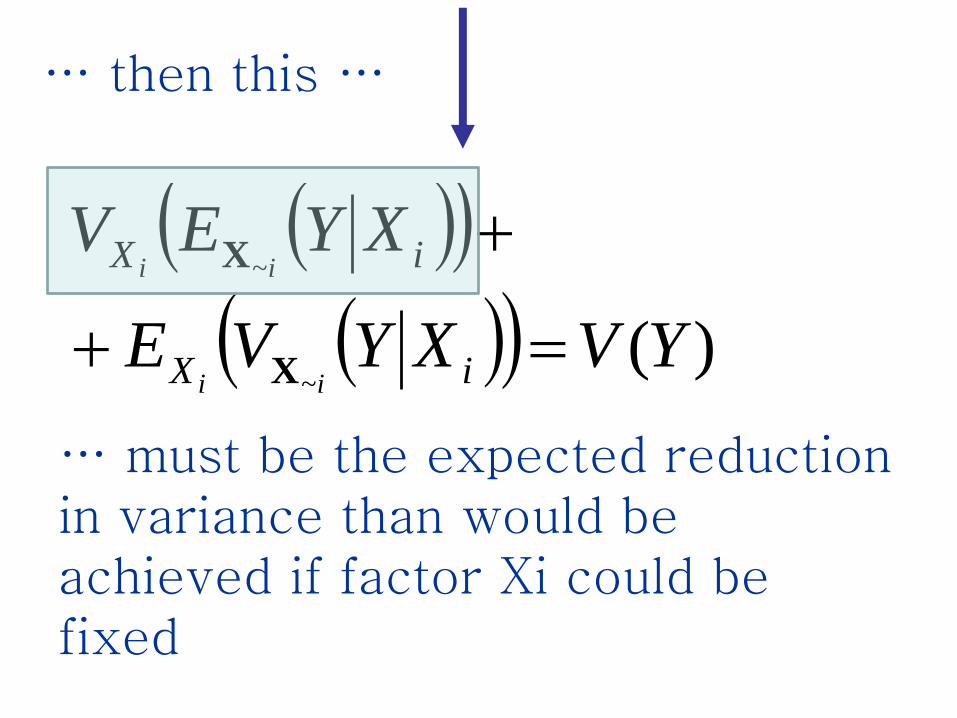
Because:
This is what variance would be left (on average) if Xi could be fixed…
)(
~
~
YVXYVE
XYEV
iX
iX
ii
ii
X
X
… must be the expected reduction in variance than would be achieved if factor Xi could be fixed
… then this …
)(~
YVXYEVi
iX ii X
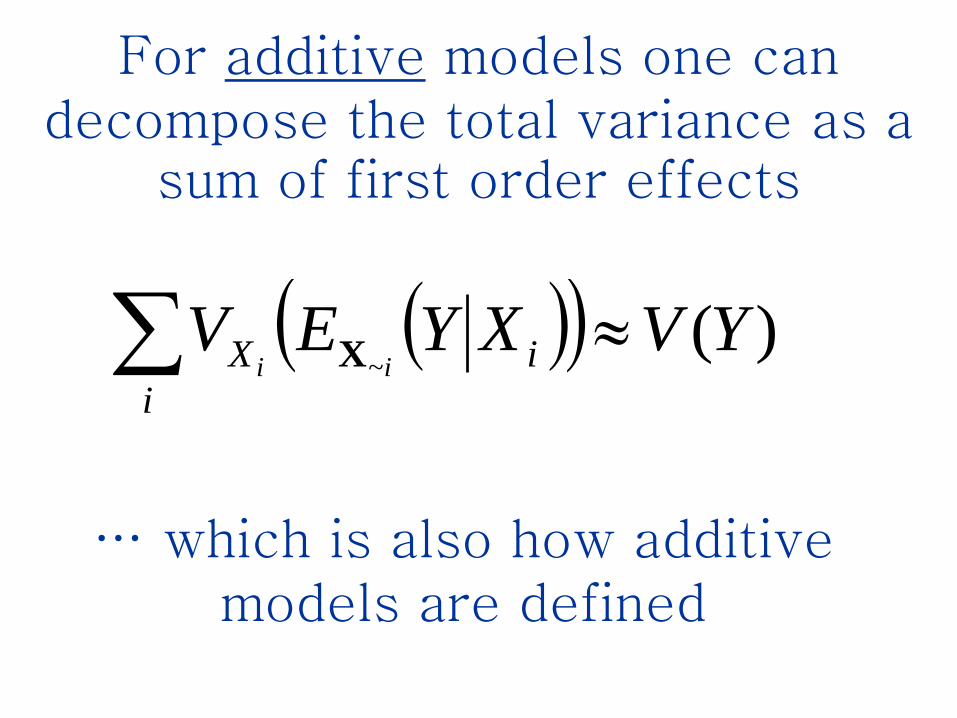
For additive models one can decompose the total variance as a
sum of first order effects
… which is also how additive models are defined
How about non additive models?
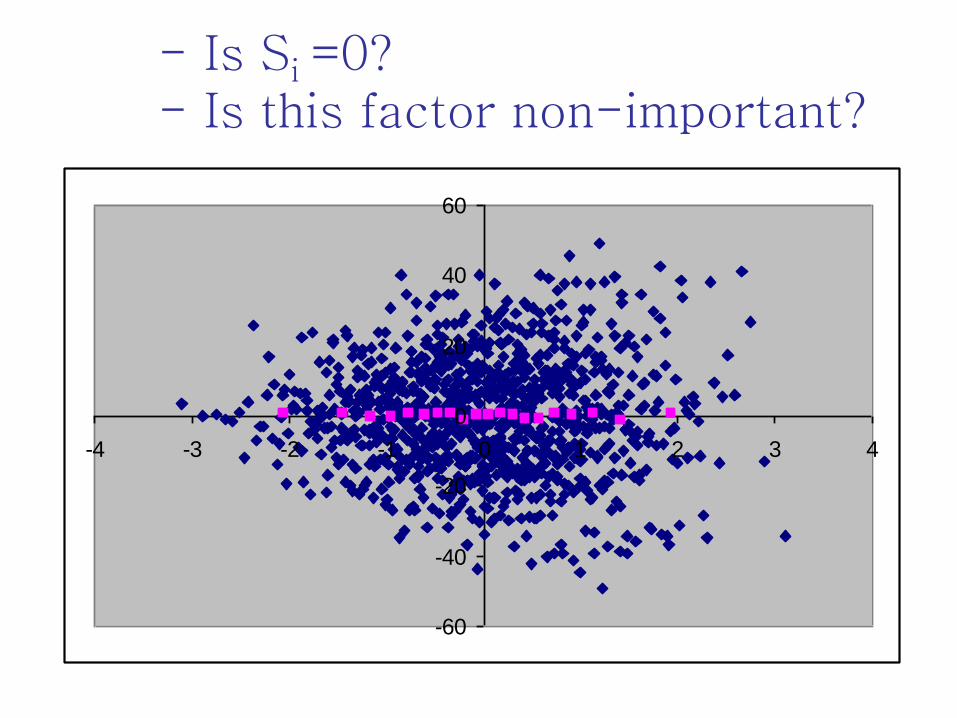
- Is Si =0? - Is this factor non-important?
-60
-40
-20
0
20
40
60
-4 -3 -2 -1 0 1 2 3 4
There are terms which capture two-way, three way, … interactions
among variables.
All these terms are linked by a formula
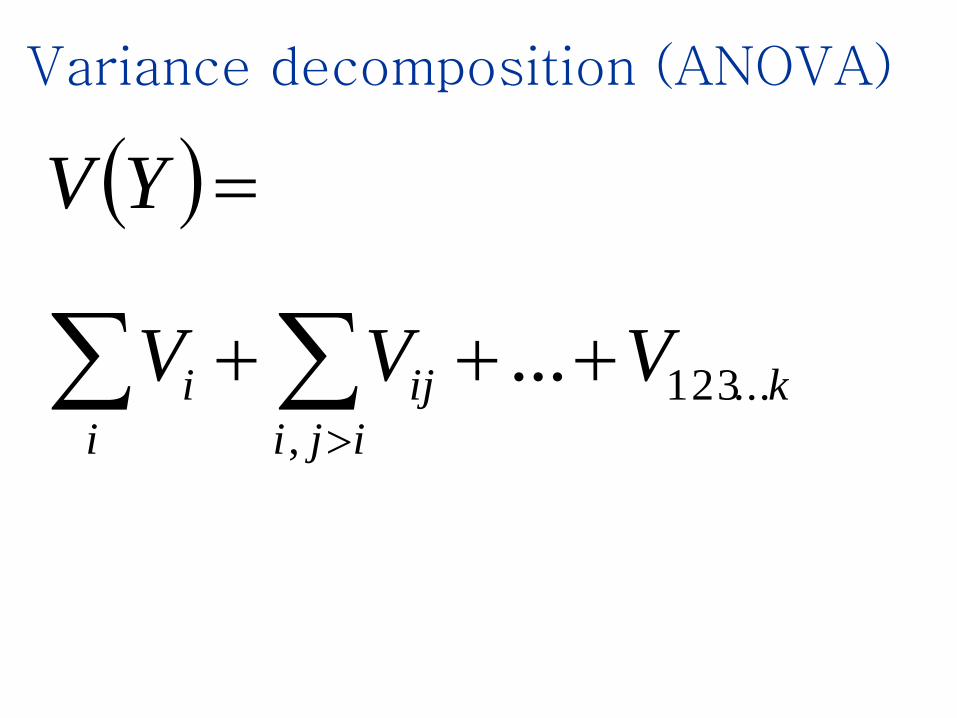
Variance decomposition (ANOVA)
k
iji
ij
i
i VVV
YV
...123
,
...
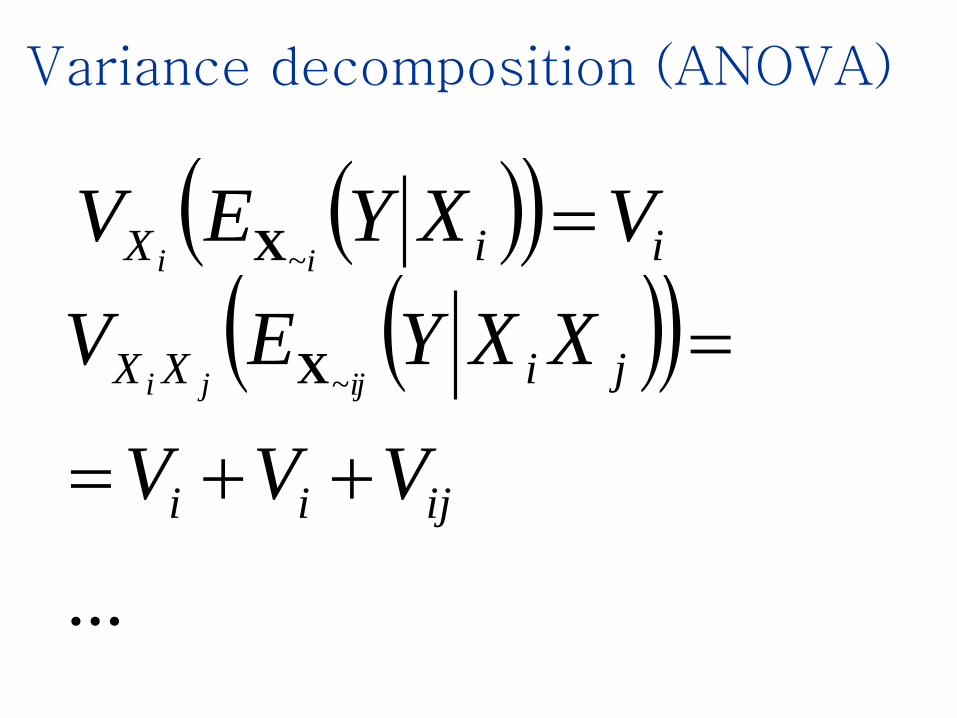
Variance decomposition (ANOVA)
iiX VXYEVii
~X
...
~
ijii
jiXX
VVV
XXYEVijji
X
Variance decomposition (ANOVA)
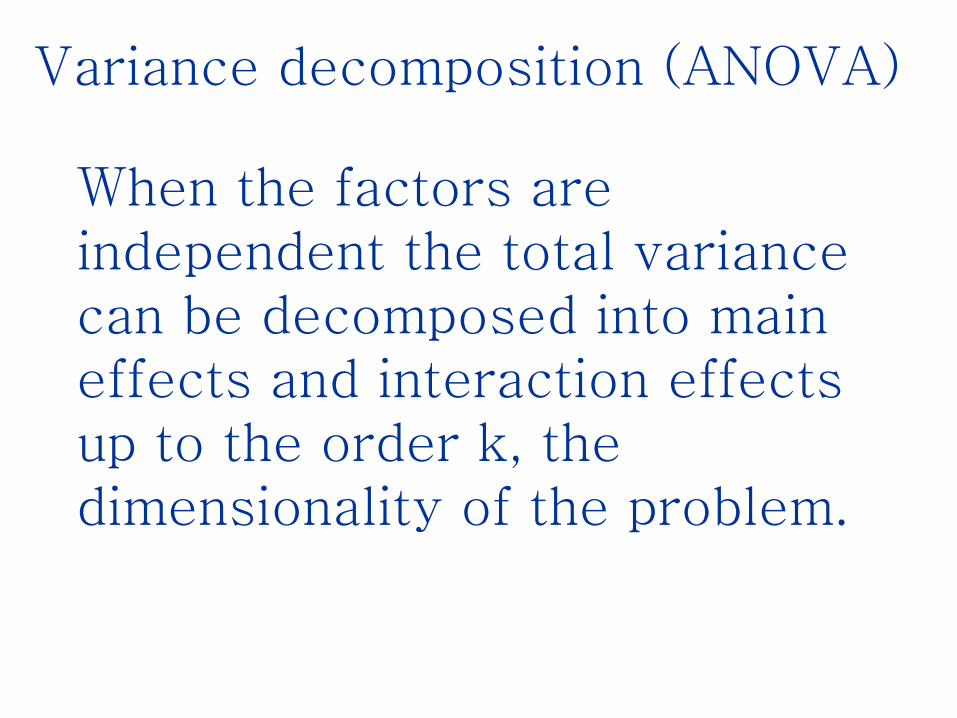
When the factors are independent the total variance can be decomposed into main effects and interaction effects up to the order k, the dimensionality of the problem.
Variance decomposition (ANOVA)
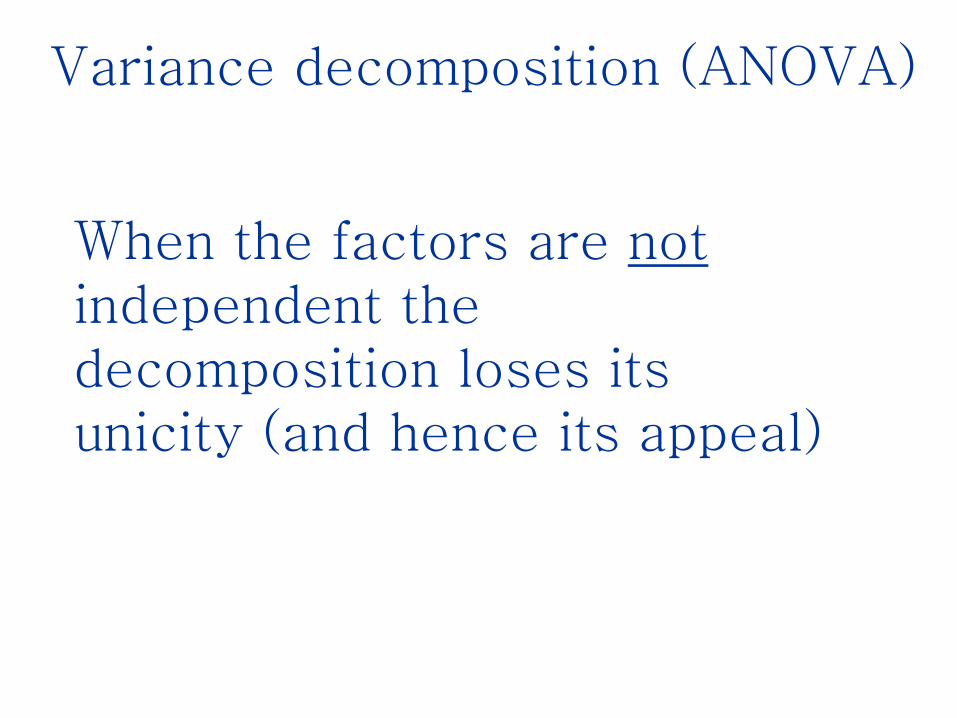
When the factors are notindependent the decomposition loses its unicity (and hence its appeal)
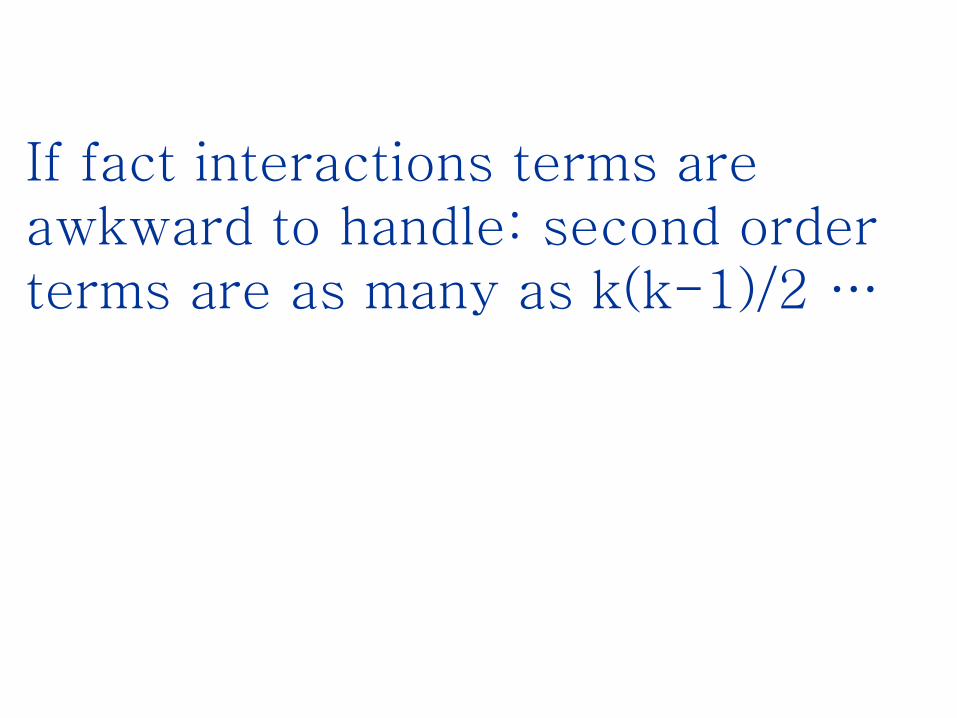
If fact interactions terms are awkward to handle: second order terms are as many as k(k-1)/2 …
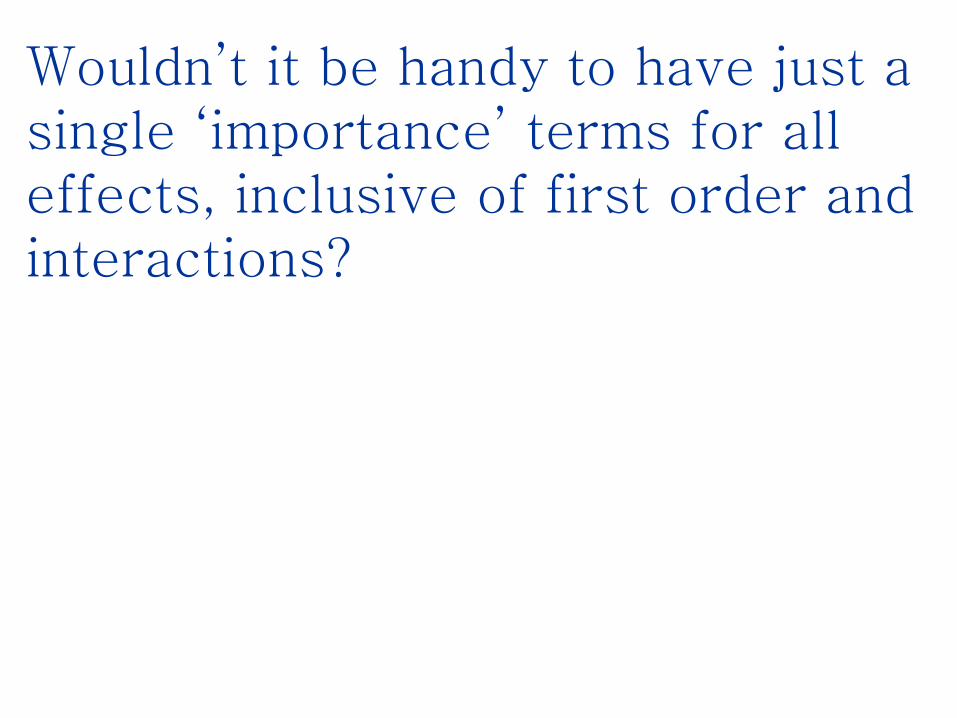
Wouldn’t it be handy to have just a single ‘importance’ terms for all effects, inclusive of first order and interactions?
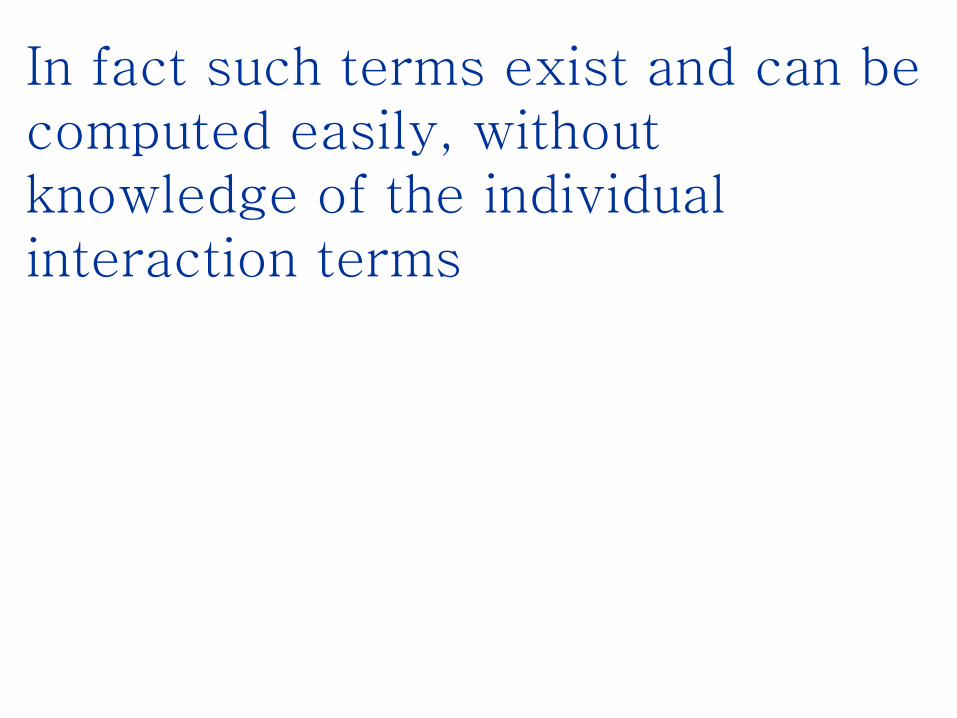
In fact such terms exist and can be computed easily, without knowledge of the individual interaction terms
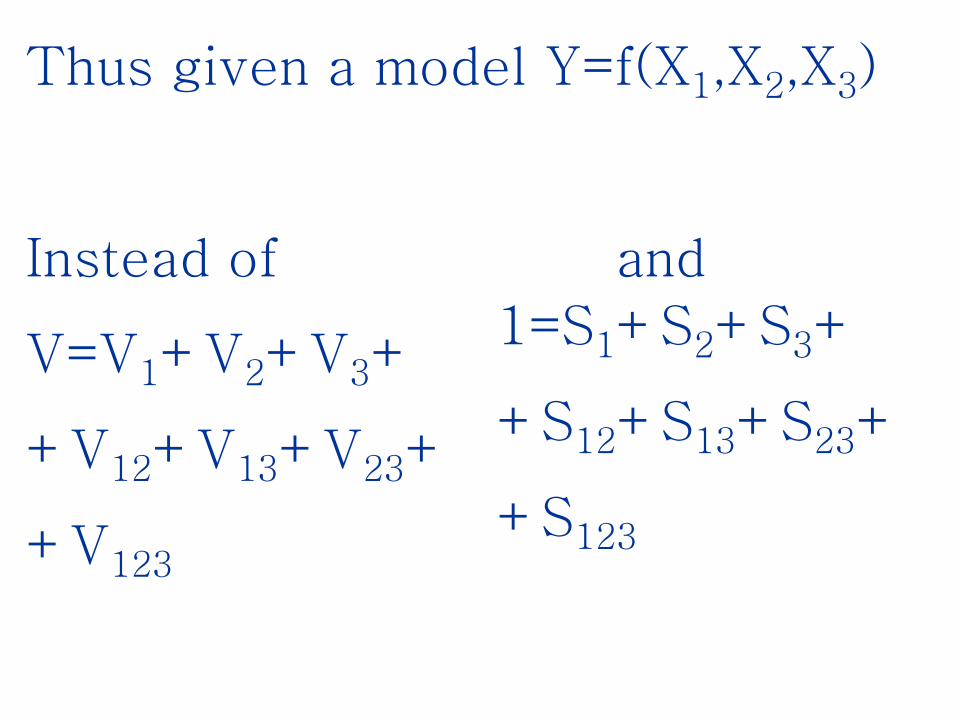
Thus given a model Y=f(X1,X2,X3)
Instead of and
V=V1+V2+V3+
+V12+V13+V23+
+V123
1=S1+S2+S3+
+S12+S13+S23+
+S123
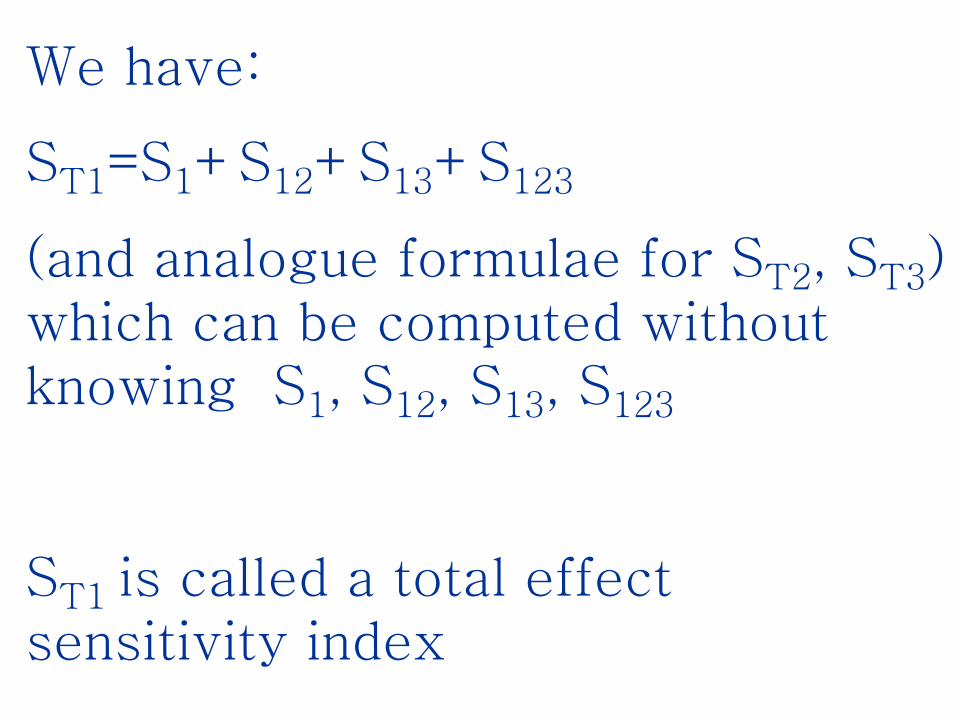
We have:
ST1=S1+S12+S13+S123
(and analogue formulae for ST2, ST3) which can be computed without knowing S1, S12, S13, S123
ST1 is called a total effect sensitivity index
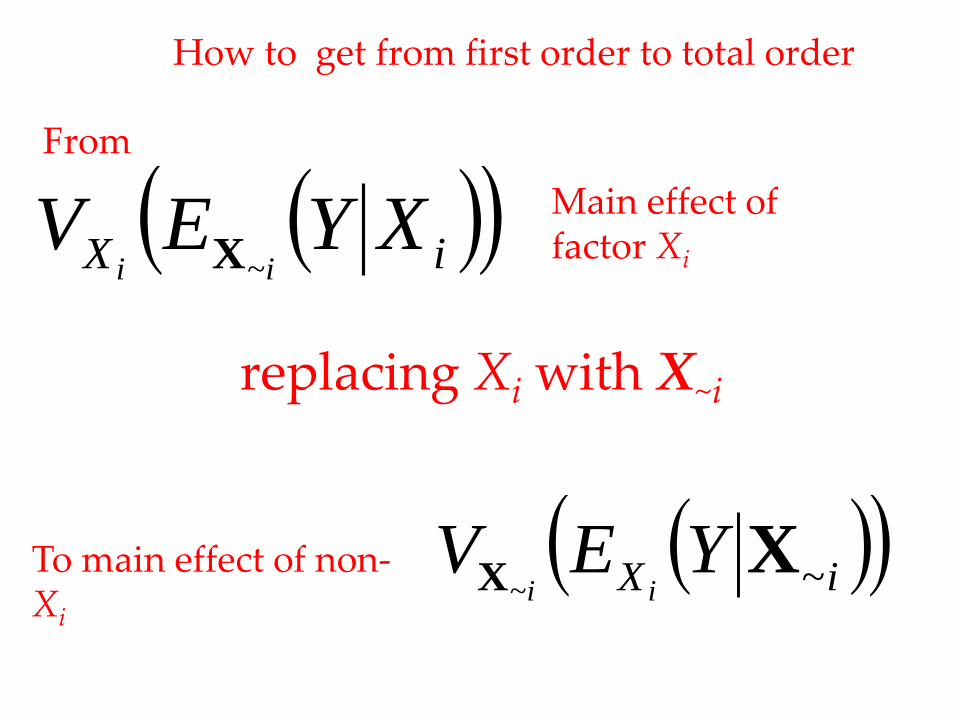
iX XYEVii ~X
To main effect of non-Xi
iX YEVii ~~
XX
Main effect of factor Xi
From
replacing Xi with X~i
How to get from first order to total order
YVYVE
YEV
iX
iX
ii
ii
~
~
~
~
X
X
X
X
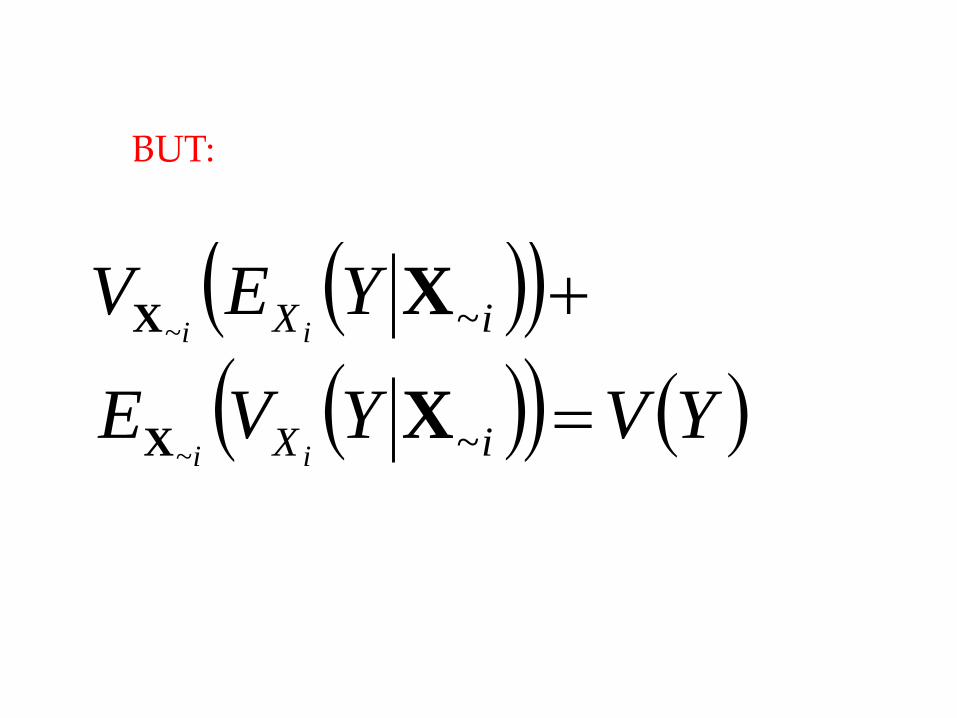
BUT:
iX YVEii ~~
XX
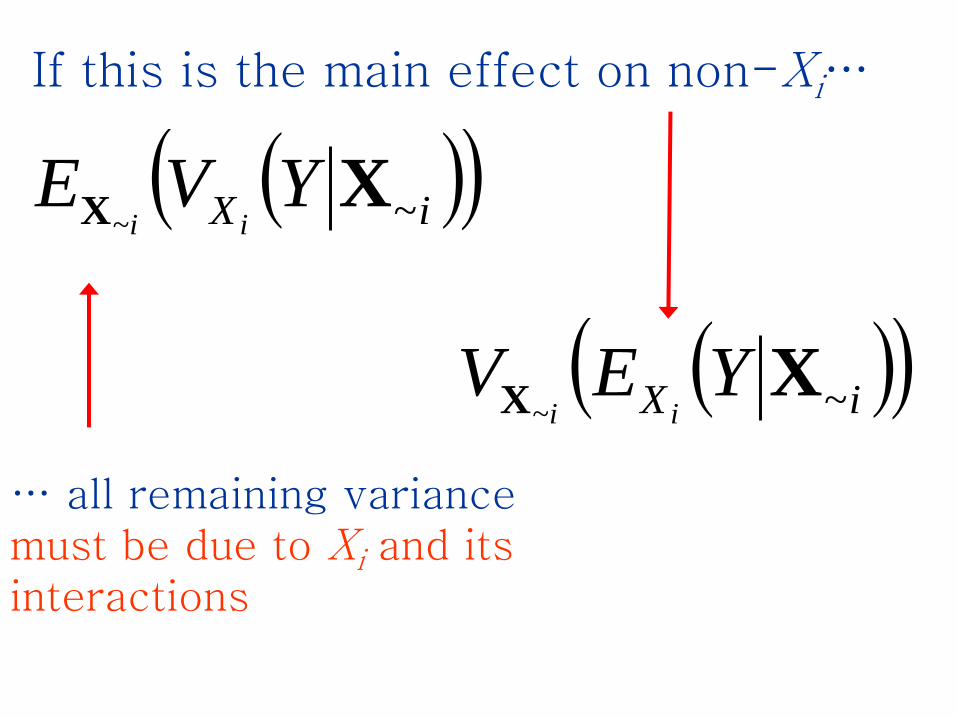
… all remaining variance must be due to Xi and its interactions
iX YEVii ~~
XX
If this is the main effect on non-Xi…
iX YVEii ~~
XX iX YEVii ~~
XX
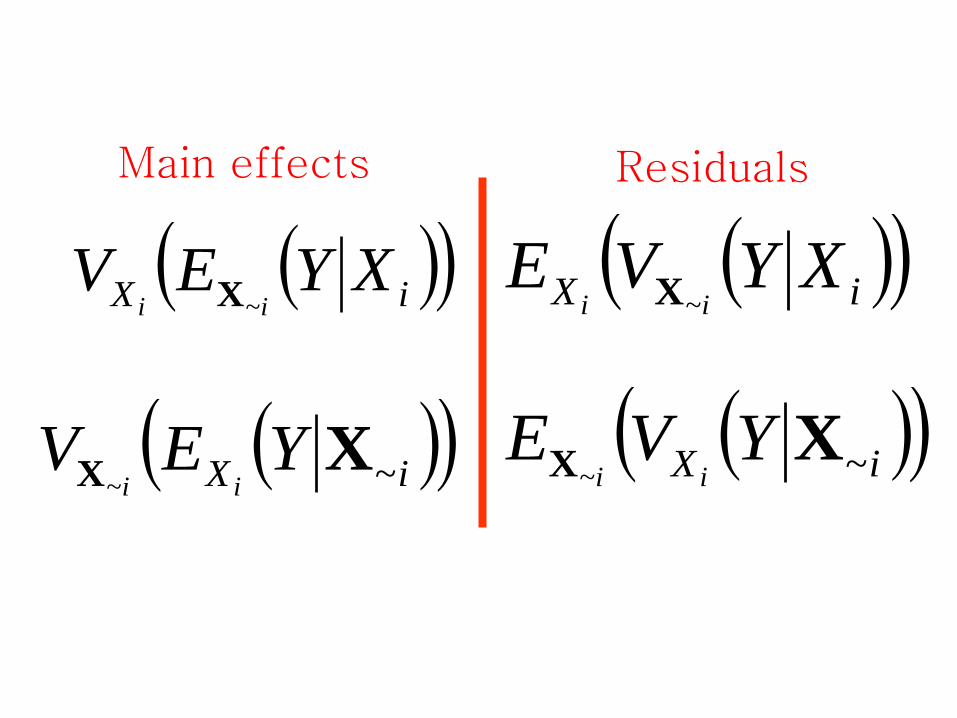
Main effects Residuals
iX XYEVii ~X
iX XYVEii ~X
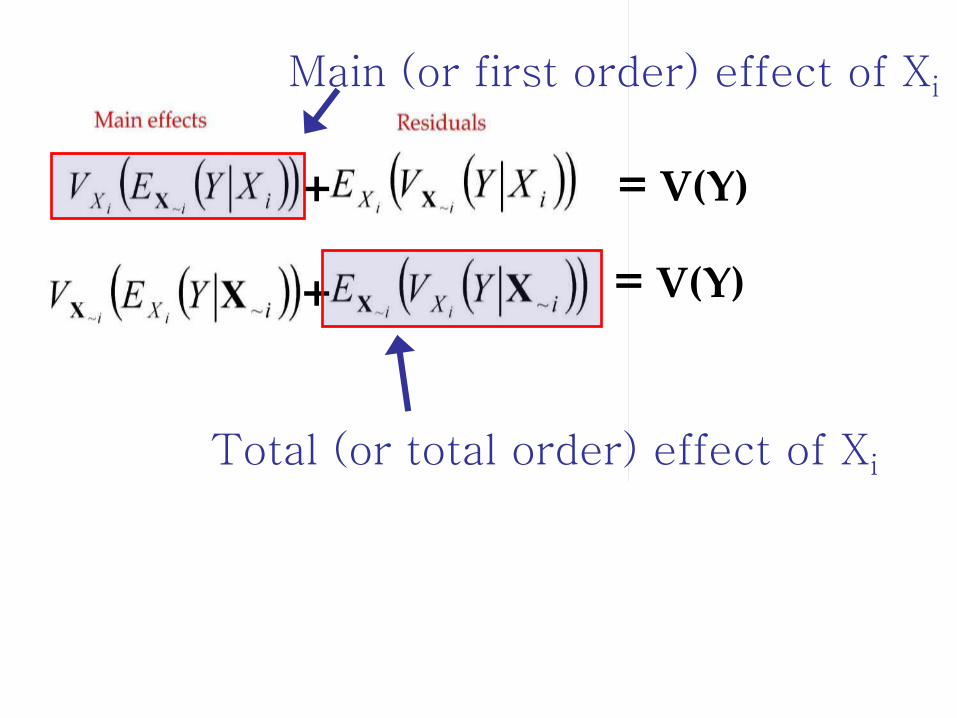
+ = V(Y)
+ = V(Y)
Main (or first order) effect of Xi
Total (or total order) effect of Xi
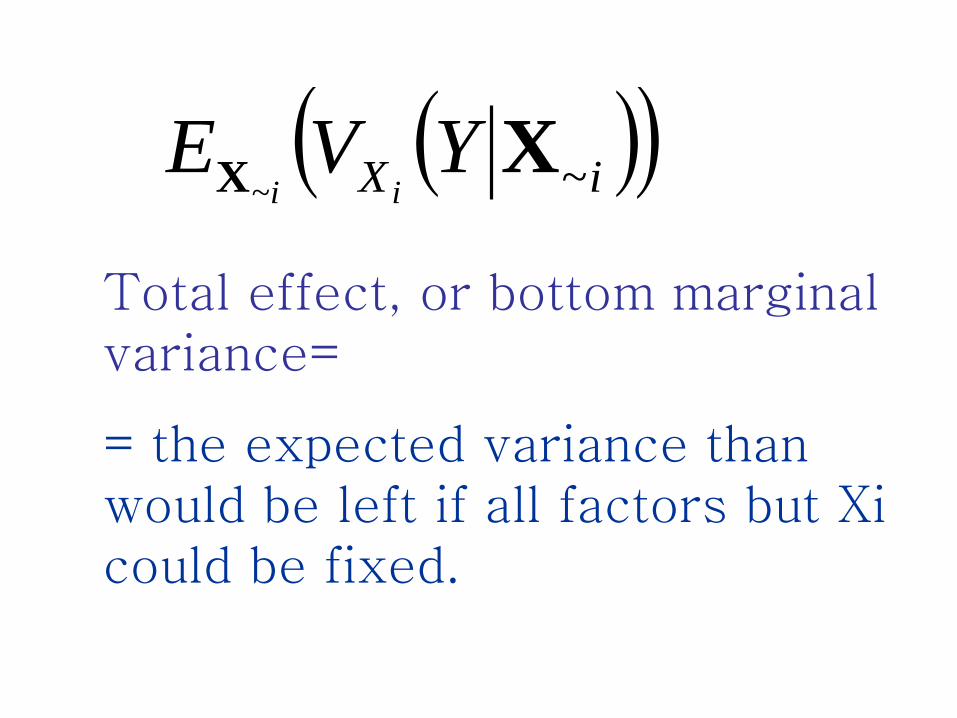
Total effect, or bottom marginal variance=
= the expected variance than would be left if all factors but Xi could be fixed.
iX YVEii ~~
XX
Ti
iXS
YV
YVEii
)(
~~XX
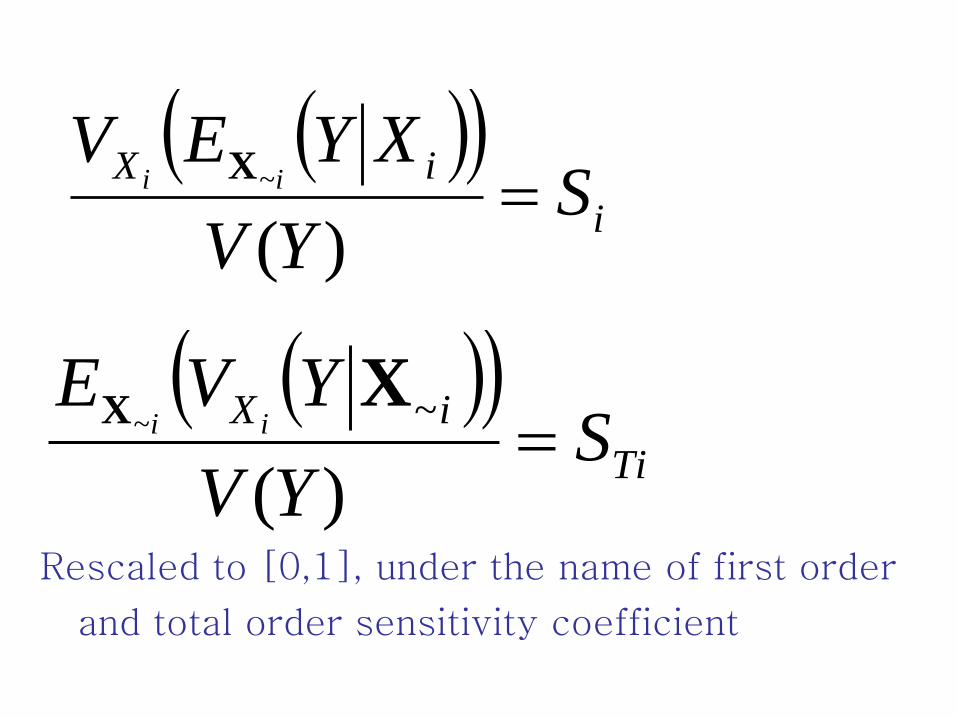
i
iXS
YV
XYEVii
)(
~X
Rescaled to [0,1], under the name of first order
and total order sensitivity coefficient
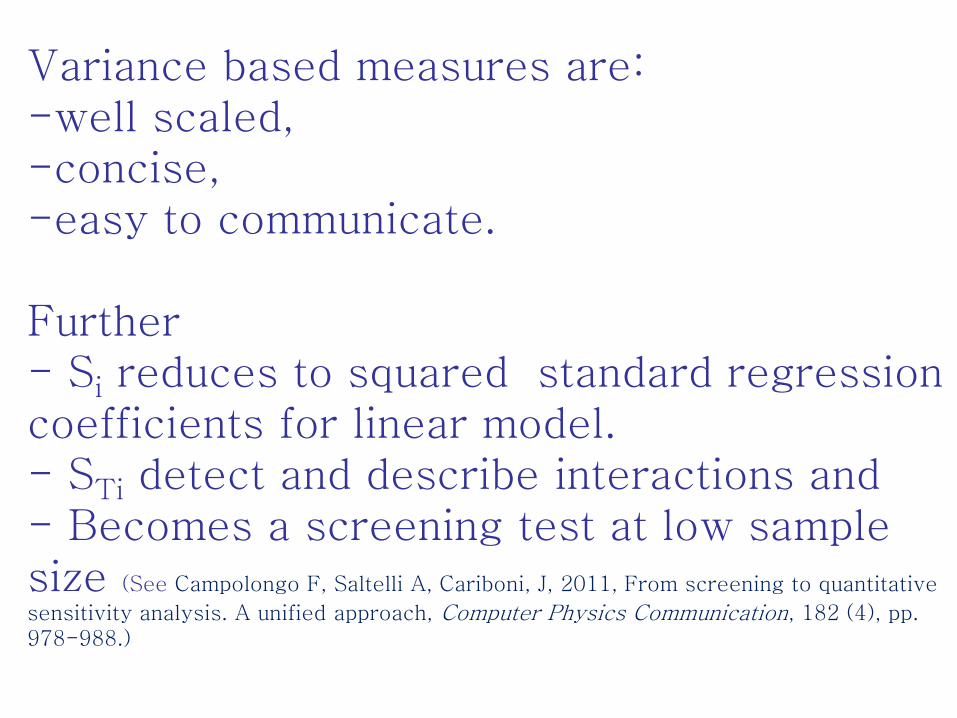
Variance based measures are: -well scaled,-concise, -easy to communicate.
Further - Si reduces to squared standard regression coefficients for linear model. - STi detect and describe interactions and - Becomes a screening test at low sample size (See Campolongo F, Saltelli A, Cariboni, J, 2011, From screening to quantitative
sensitivity analysis. A unified approach, Computer Physics Communication, 182 (4), pp. 978-988.)
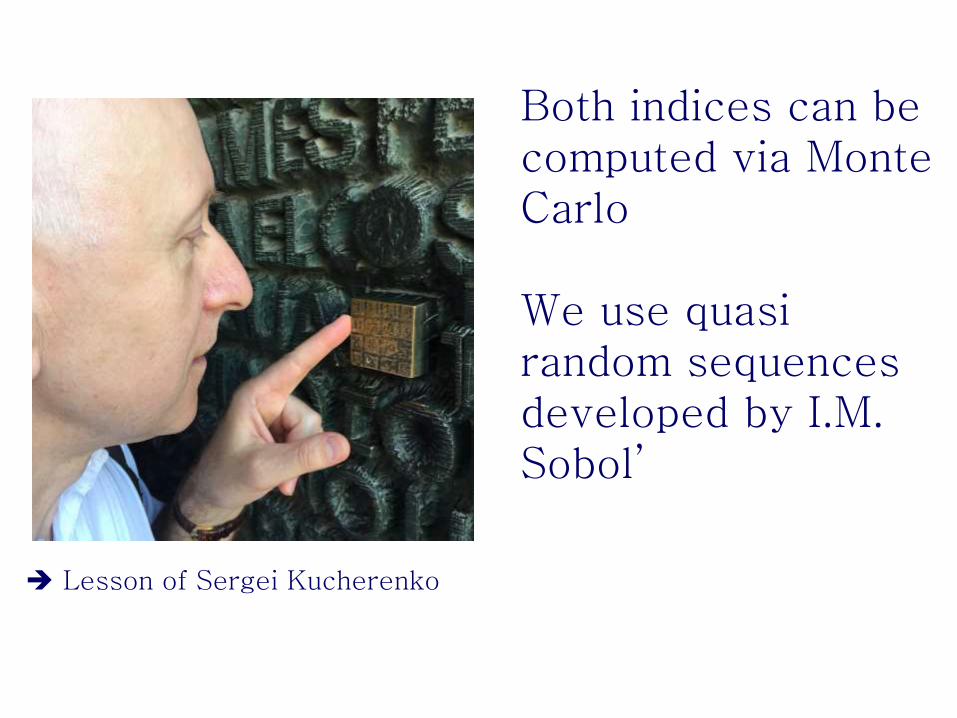
Both indices can be computed via Monte Carlo
We use quasi random sequences developed by I.M. Sobol’
Lesson of Sergei Kucherenko
Estimation procedures:
• No brute force. A double loop is not needed, though the measures are expresses as V(E(•)) and E(V(•)).
• For Si quick estimation procedures are available which are k-independent.
• For STi estimation procedures are mostly k-dependent (unless … active area of research…).
Lessons of William Becker
Lessons of Elmar Plischke
Lessons of Sergei Kucherenco …
iX YVEii ~~
XX
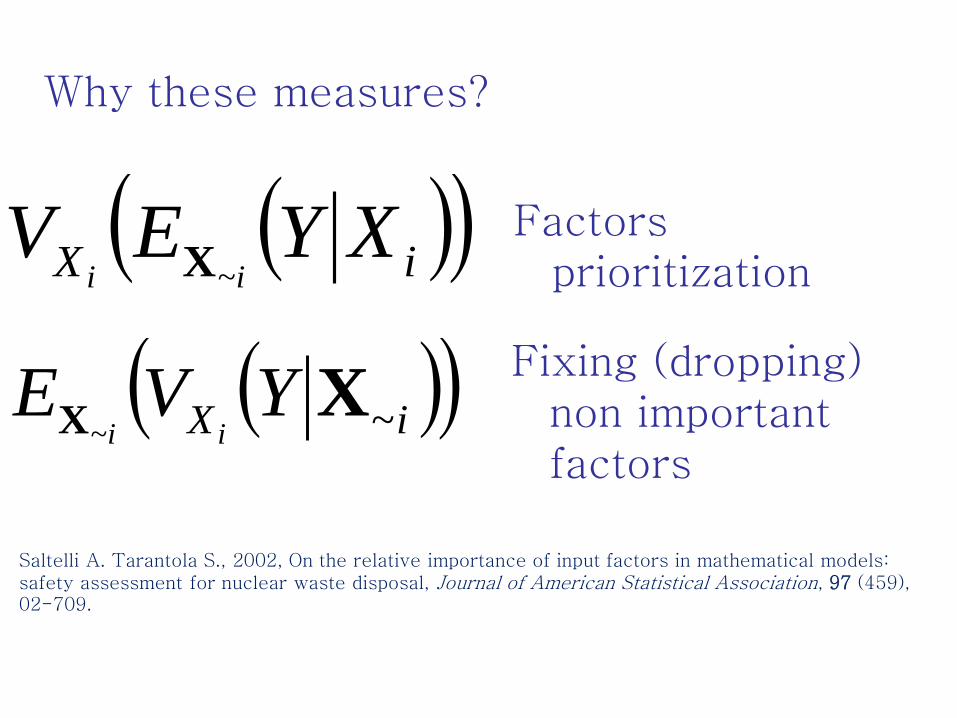
Why these measures?
Factors prioritization
iX XYEVii ~X
Fixing (dropping) non important factors
Saltelli A. Tarantola S., 2002, On the relative importance of input factors in mathematical models: safety assessment for nuclear waste disposal, Journal of American Statistical Association, 97 (459), 02-709.
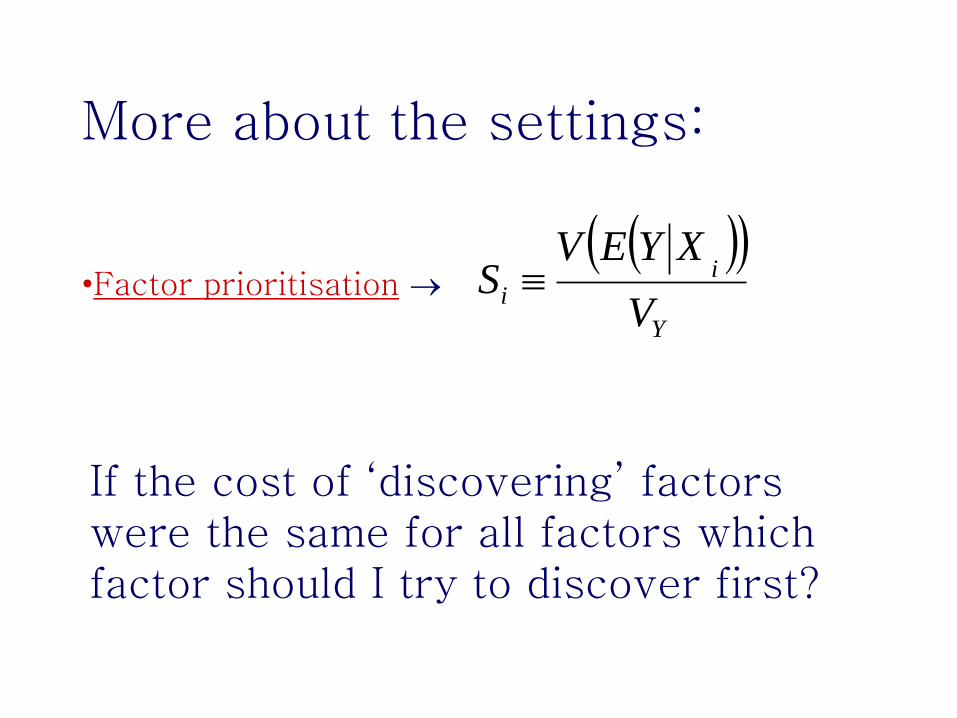
More about the settings:
•Factor prioritisation
Y
ii
V
XYEVS
If the cost of ‘discovering’ factors were the same for all factors which factor should I try to discover first?
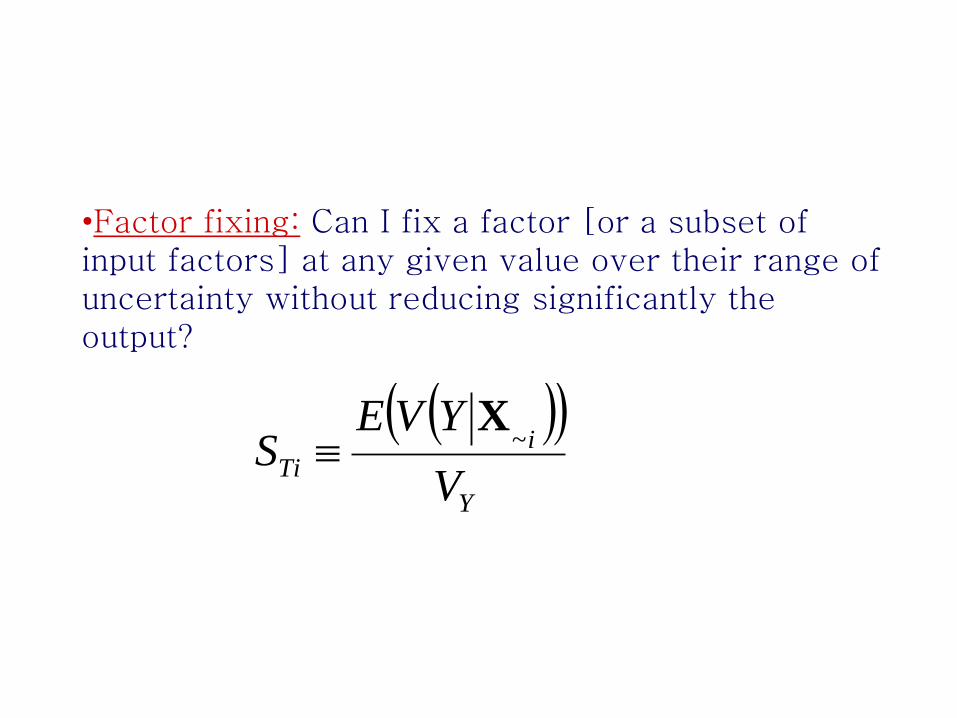
•Factor fixing: Can I fix a factor [or a subset of input factors] at any given value over their range of uncertainty without reducing significantly the output?
Y
iTi
V
YVES ~
X
Factor fixing is useful to achieve model simplification and ‘relevance’.
We cannot use Si to fix a factor; Si =0 is a necessary condition for Xi to be non-influential but not a sufficient one
Xi could be influent at the second order.
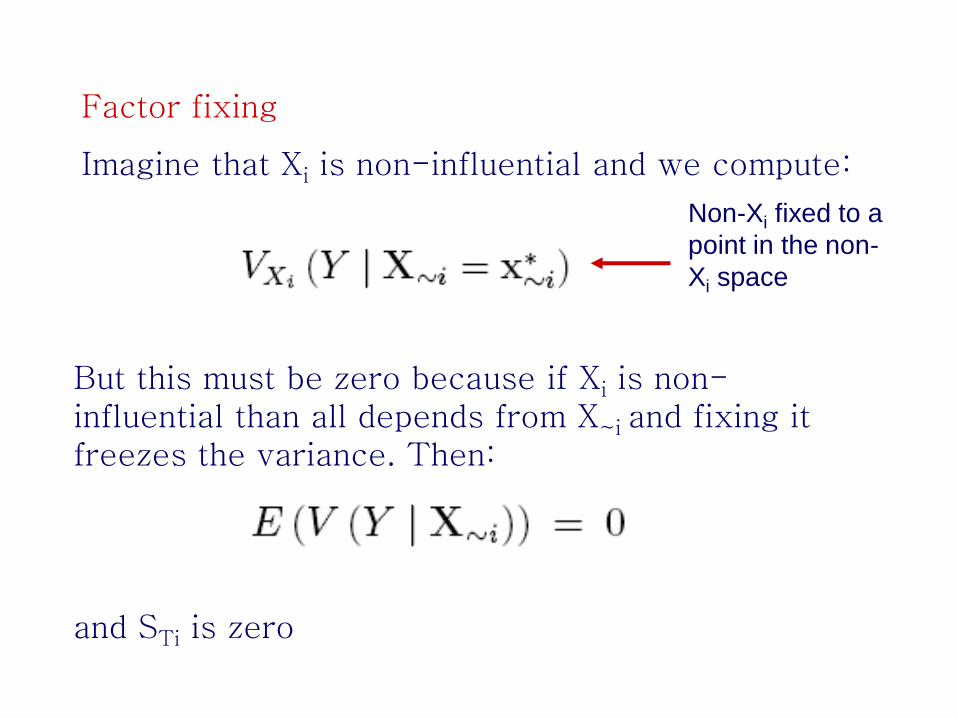
Factor fixing
Imagine that Xi is non-influential and we compute:
Non-Xi fixed to a
point in the non-
Xi space
But this must be zero because if Xi is non-influential than all depends from X~i and fixing it freezes the variance. Then:
and STi is zero
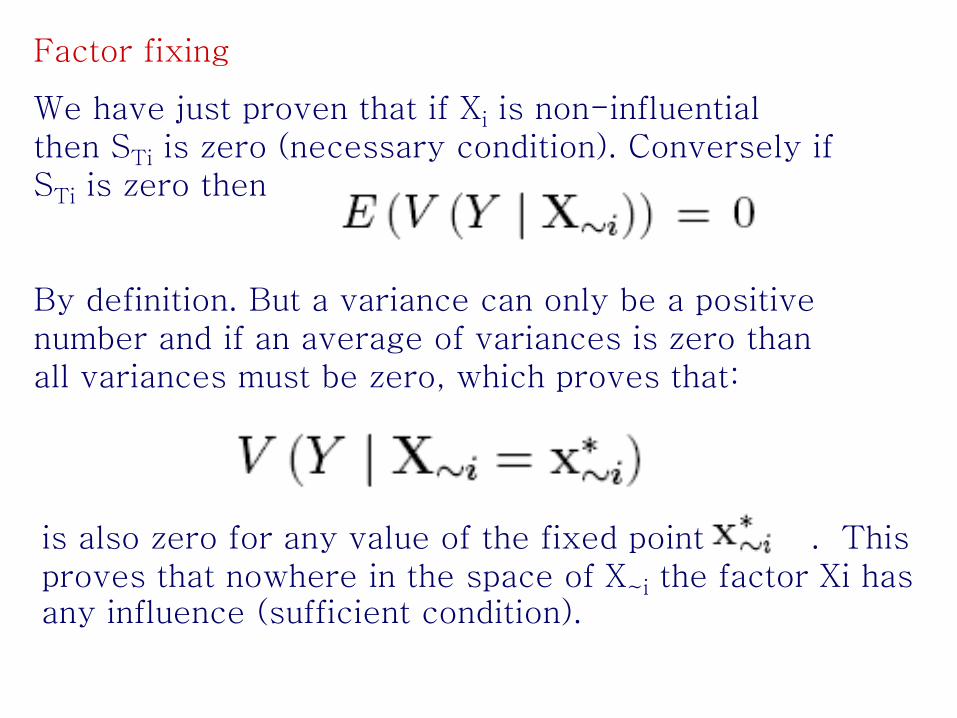
Factor fixing
We have just proven that if Xi is non-influential then STi is zero (necessary condition). Conversely if STi is zero then
By definition. But a variance can only be a positive number and if an average of variances is zero than all variances must be zero, which proves that:
is also zero for any value of the fixed point . This proves that nowhere in the space of X~i the factor Xi has any influence (sufficient condition).
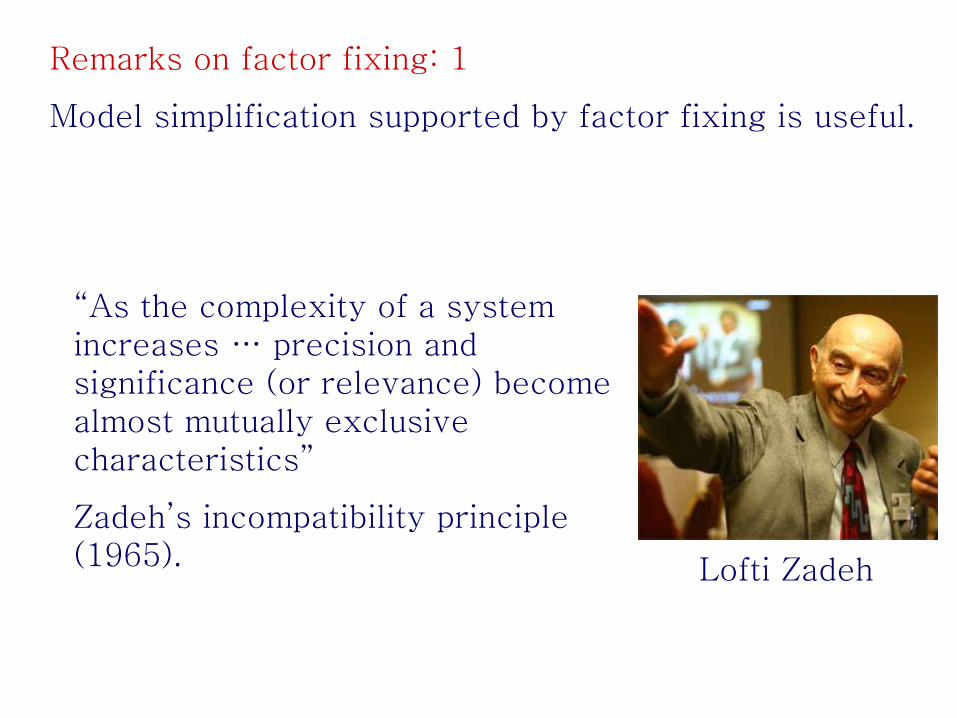
Remarks on factor fixing: 1
Model simplification supported by factor fixing is useful.
“As the complexity of a system increases … precision and significance (or relevance) become almost mutually exclusive characteristics”
Zadeh’s incompatibility principle (1965). Lofti Zadeh
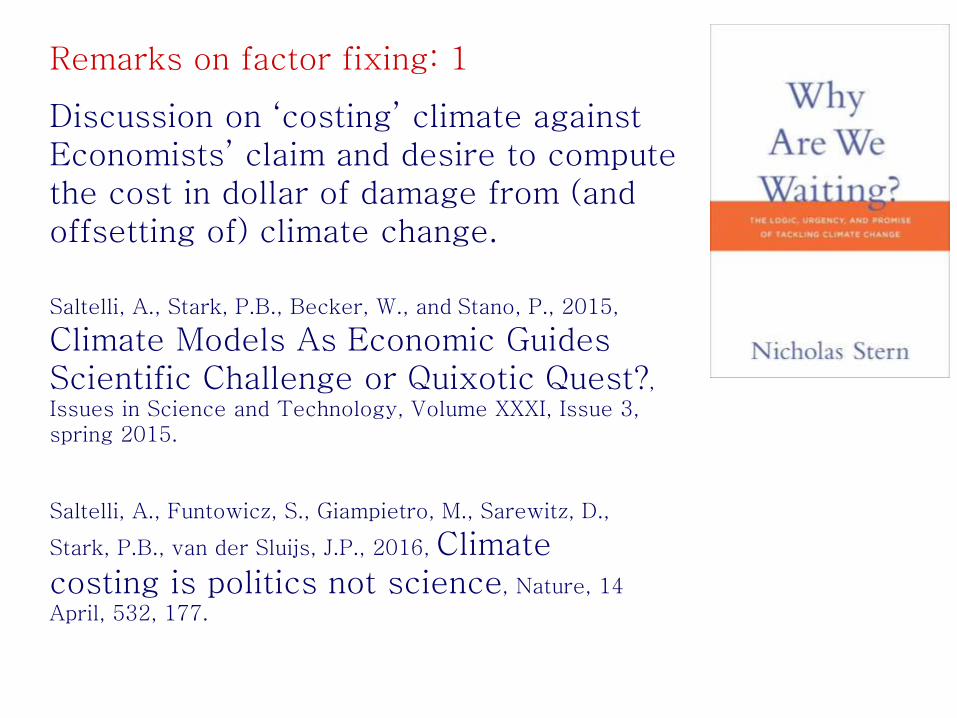
Remarks on factor fixing: 1
Discussion on ‘costing’ climate against Economists’ claim and desire to compute the cost in dollar of damage from (and offsetting of) climate change.
Saltelli, A., Stark, P.B., Becker, W., and Stano, P., 2015,
Climate Models As Economic Guides Scientific Challenge or Quixotic Quest?,
Issues in Science and Technology, Volume XXXI, Issue 3, spring 2015.
Saltelli, A., Funtowicz, S., Giampietro, M., Sarewitz, D.,
Stark, P.B., van der Sluijs, J.P., 2016, Climate costing is politics not science, Nature, 14
April, 532, 177.
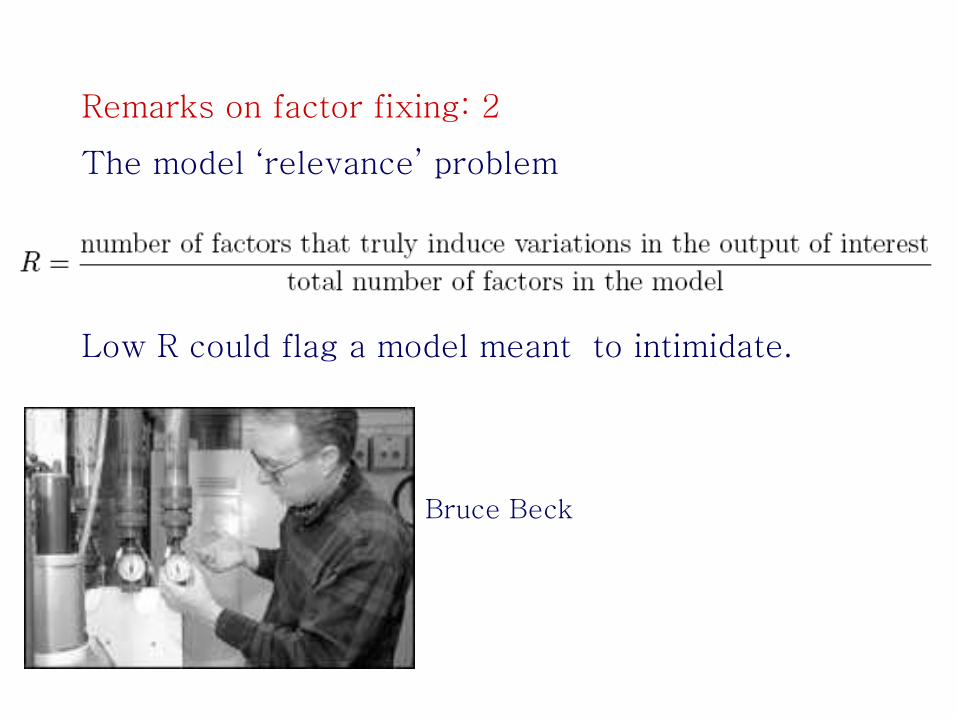
Remarks on factor fixing: 2
The model ‘relevance’ problem
Bruce Beck
Low R could flag a model meant to intimidate.
Summary for variance based measures:
1. Easy-to-code, Monte Carlo – better
on quasi-random points. Estimate of the error available.
2. The main effect can be made cheap; its computational cost does not depend upon k.
-60
-40
-20
0
20
40
60
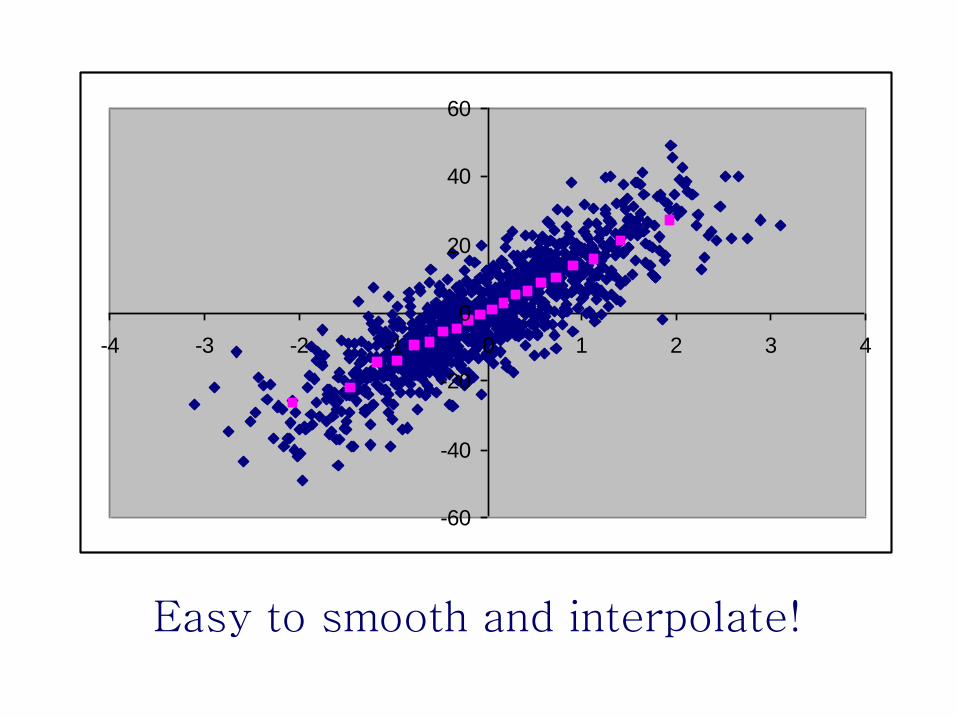
-4 -3 -2 -1 0 1 2 3 4
Easy to smooth and interpolate!
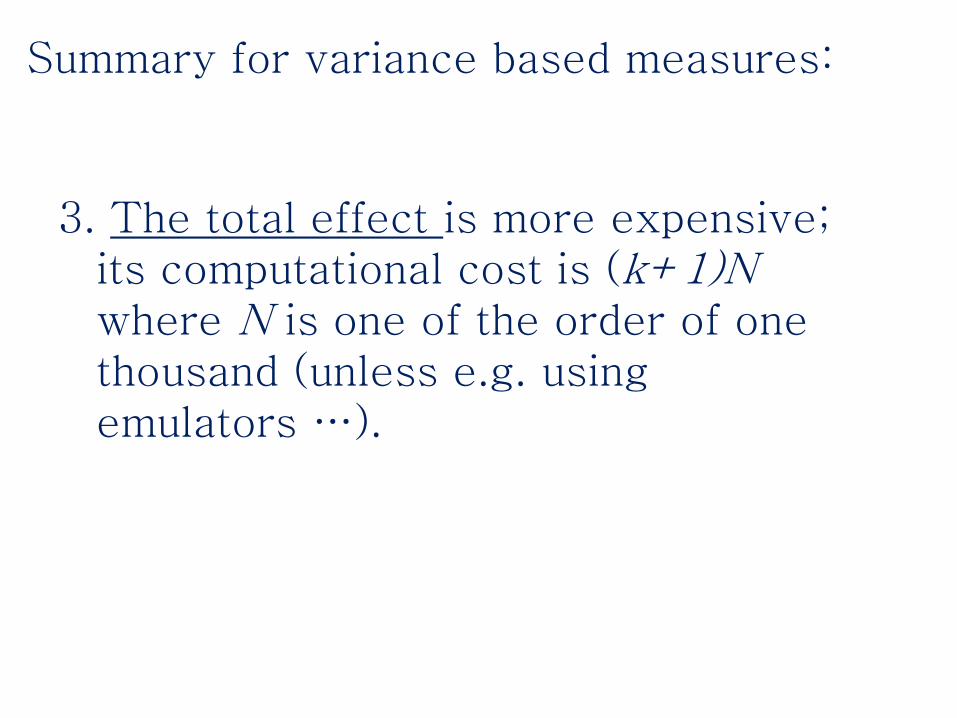
3. The total effect is more expensive; its computational cost is (k+1)N where N is one of the order of one thousand (unless e.g. using emulators …).
Summary for variance based measures:

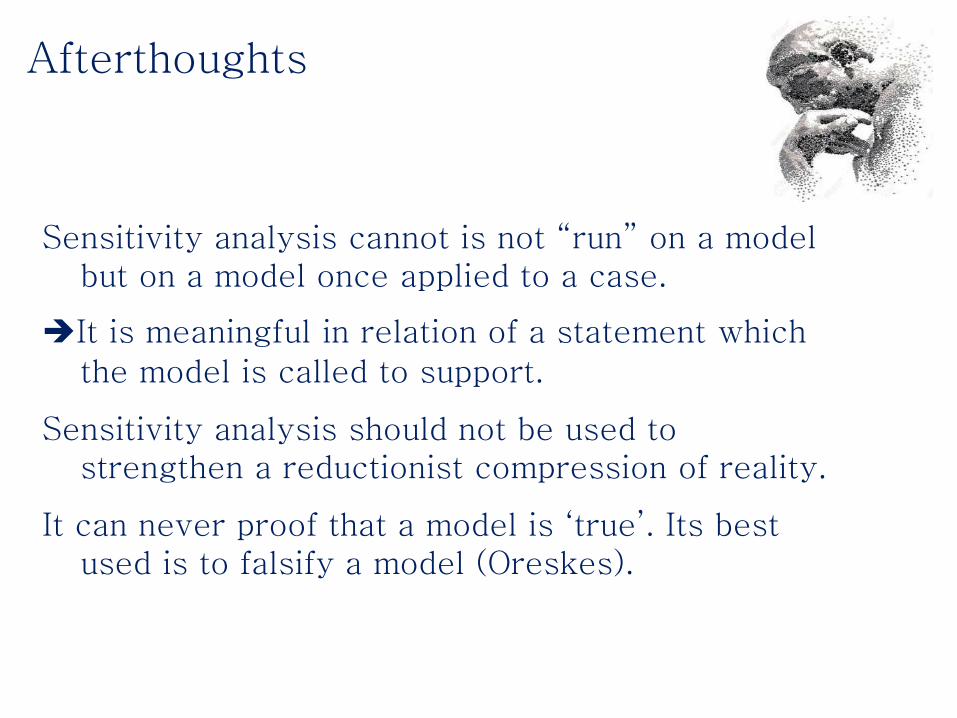
Sensitivity analysis cannot is not “run” on a model but on a model once applied to a case.
It is meaningful in relation of a statement which the model is called to support.
Sensitivity analysis should not be used to strengthen a reductionist compression of reality.
It can never proof that a model is ‘true’. Its best used is to falsify a model (Oreskes).
Afterthoughts
Discussion points
• Why doing a sensitivity analysis if it can undermine an laborious quantification exercise?
• What do I do if this happens to be the case?

END


![Sensitivity analysis: An introduction - andrea saltelli · [Global*] sensitivity analysis: “The study of how the uncertainty in the output of a model (numerical or otherwise) can](https://img.pdfslide.us/doc/110x75/5e8c7fc23a7b6461e12bbfff/sensitivity-analysis-an-introduction-andrea-global-sensitivity-analysis-aoethe.jpg)