Embed Size (px)
Citation preview

SELECTIVE FLOTATION OFDOLOMITIC LIMESTONE IMPURITIES
FROM FLORIDA PHOSPHATES
I Florida Institute ofPhosphate Research
Publication No. 02-066-089
Prepared By
Mineral Resources InstituteCollege of Engineering
The University of AlabamaUnder a Grant Sponsored by the
Florida Institute of Phosphate ResearchBartow, Florida
October 1990

The Florida Institute of Phosphate Research was created in 1978 bythe Florida Legislature (Chapter 378.101, Florida Statutes) andempowered to conduct research supportive to the responsibledevelopment of the state‘s phosphate resources. The Institute hastargeted areas of research responsibility. These are: reclamationalternatives in mining and processing, including wetlandsreclamation, phosphogypsum storage areas and phosphatic claycontainment areas; methods for more efficient, economical andenvironmentally balanced phosphate recovery and processing;disposal and utilization of phosphatic clay; and environmentaleffects involving the health and welfare of the people, includingthose effects related to radiation and water consumption.
FIPR is located in Polk County, in the heart of the central Floridaphosphate district. The Institute seeks to serve as an informationcenter on phosphate-related topics and welcomes informationrequests made in person, by mail, or by telephone.
Research Staff
Executive DirectorRichard F. McFarlin
Research Directors
G. Michael Lloyd Jr.Gordon D. NifongSteven G. RichardsonHassan El-ShallRobert S. Akins
-Chemical Processing-Environmental Services-Reclamation-Beneficiation-Mining
Florida Institute of Phosphate Research1855 West Main StreetBartow, Florida 33830
(863) 534-7160Fax:(863) 534-7165

FINAL REPORT
SELECTIVE FLOTATION OF DOLOMITIC LIMESTONEIMPURITIES FROM FLORIDA PHOSPHATES
FIPR Project #86-02-066
Submitted to
FLORIDA INSTITUTE OF PHOSPHATE RESEARCHBartow. Florida 33830
Dr. John HannaPrincipal Investigator
and Ibezim AnaziaCo-Investigator
Mineral Resources InstituteCollege of Engineering
The University of AlabamaP.O. Box 870204
Tuscaloosa, Alabama 35487-0204
May 15, 1990
DISCLAIMER
The contents of this report are reproduced herein as receivedfrom the contractor.
The opinions, findings and conclusions expressed herein are notnecessarily those of the Florida Institute of Phosphate Research,nor does mention of company names or products constitute endorse-ment by the Florida Institute of Phosphate Research.
ii
Perspective
Florida Institute of Phosphate ResearchHassan El-Shall, Dr. Eng. SC.
Generally, processing of phosphate resources containing dolomite byconventional technology yields pebble products and flotationconcentrates of high magnesium content. Because of the high MgO andcarbonate content, acidulation of such concentrates consumes excessivesulfuric acid and causes problems during phosphoric acid manufacture,such as increased acid viscosity, precipitation of insolubleMg-phosphates and difficulties in filtration and clarification of thefinal product. At present, the high MgO ores are bypassed or stockpiledfor future processing.
The bulk of the world's phosphate reserves is located in sedimentaryhorizons that also contain appreciable amounts of carbonate. Sincethese are also the most difficult type of deposits to treat, initialmining was confined to the limited number of deposits in which thecarbonate was so friable as to be largely rejectable, by sizing, in afines fraction. The increasing demand for phosphate and the depletionof the more amenable reserves, however, have steadily increased thepressure for treatment of these difficult sedimentary phosphate-carbonate deposits, and probably no other mineral processing topic hasattracted so much research in recent years.
Realizing the problem of dolomite presence in Southern Floridaphosphates, FIPR has been actively involved in research efforts toseparate this impurity for the purpose of increasing Florida's reservesof phosphate ores. In 1982, FIPR granted the University of Florida athree-year project (FIPR #82-02-023) and in 1985, Phase II of thisproject (FIPR #85-02-057) was also funded by the Institute. The resultsof the laboratory tests conducted in these projects have led to thedevelopment of two different processes to separate dolomite from SouthFlorida phosphate rock. The two processes are: (1) two-stage condition-ing process, and (2) salt-flotation process. The practicality andeconomic viability of these processes are yet to be determined.
Concurrently with these projects, FIPR has awarded ColumbiaUniversity a three-year project (FIPR #83-O2-037R) to study fundamentalaspects of dolomite/ apatite separation. Basic data generated in thisstudy are interesting and can be used to clarify some of the mechanismsinvolved in such a complex system.
Pursuing a different route to tackle the same problem, in 1987 FIPRawarded a two-year research contract (FIPR #86-02-066) to the MineralResources Institute (MRI) of the University of Alabama to investigatethe selective flotation of dolomitic limestone impurities from Floridaphosphates.
iii
The objectives of the investigation were: (1) to demonstrate theapplicability of the fatty acid flotation technique developed by MRI forprocessing the siliceous dolomitic Florida phosphate matrix, and (2) tooptimize the process with respect to removal of the carbonate (Ca,Mg)and siliceous gangue and recovery of the phosphate values. The MRIcarbonate-phosphate flotation process is unique in that the separationis carried out in a non-equilibrium condition. The success of theprocess is based on the fact that fatty acids adsorb more rapidly ontocarbonate surfaces than onto phosphate surfaces. Thus, in a slightlyacid circuit, carbonates are floated immediately upon addition of thecollector and frother. After collection of the carbonate froth the pulpis conditioned briefly with the residual collector which completes itsadsorption onto the phosphate mineral surfaces. Thereafter thephosphate is floated with, in most instances, no further addition ofcollector. It is believed that the differential rate of adsorption isenhanced by judicious pH control during the process.
The research completed included four major tasks involving samplepreparation and characterization, process development studies, processapplication studies and surface chemical studies. The research hasdemonstrated that the MRI "no conditioning process" is effective forselectively floating carbonate gangue minerals from high MgO phosphatematrix.
Phosphate flotation from the carbonate cell product at alkalinepH's of 8-10 was not selective and produced intermediate grade phosphateconcentrates high in acid insolubles.
Selective phosphate flotation was achieved at slightly acidic pH'sof 5.8 - 6.2, largely by the residual collector from the carbonate step,in the presence or absence of sodium silicate. The phosphate flotationstep produced high grade concentrates containing 29.5 - 30.6% P2O5, 0.7- 1.0% MgO, and 2.8 - 8% insol. The recoveries in the concentratesranged from 65 to 88%.
The grade and P2O5 recoveries in the concentrates were found todepend largely on the pulp pH. Other contributing factors were the typeof inorganic acid used during the carbonate flotation step, and theSiO2/Na2O ratio of the sodium silicate used during the phosphateflotation step.
The process application studies revealed that with slight modifi-cations, samples of high or low MgO siliceous phosphate matrices,representing major central Florida deposits, were amenable to thestandard procedure of the MRI carbonate/phosphate flotation process.The degree of modification depended on the mineralogic composition ofthe matrix with regard to MgO and insol contents. Limited testing withcommercial collectors indicated that commercial grade collectors may beeffectively substituted in place of the oleic acid. Grinding of thepebble fractions seems necessary to achieve adequate liberation andacceptable products from flotation.
iv

Surface chemical studies were conducted to complement thelaboratory flotation studies. The studies were aimed at examining theactual role of the critical process parameters and mechanisms involvedin carbonate/phosphate separation. Work completed involved oleic acidadsorption and electrokinetic (zeta potential) measurements on theprincipal constituents of the high MgO phosphate matrix, namely quartz,apatite/francolite and dolomite/calcite. The obtained data are used bythe investigators to explain some of the mechanisms involved in thetested process.
Because of the new concepts used in the MRI phosphate carbonateflotation process under slightly acidic conditions further studies arerecommended by the investigators in the following three major areas:
(1) Two-Step Carbonate/Phosphate Flotation Process. These arebench and pilot plant semi-continuous testing the following processparameters:
(a) flotation reagents scheme and method of application(b) pulp residence time during the carbonate flotation step(c) upper particle size limit on carbonate and phosphate flotation(d) process water recycling
(2) Direct Phosphate Flotation. Laboratory and bench scale studies todetermine the effect of the following flotation parameters on P2O5grade and recovery:
(a) type of collector/frother emulsion and its conditioning time(b) quality of process water(c) cleaning steps
(3) Process Fundamentals. The studies include the role of physicaladsorption mechanism during the carbonate and/or phosphateflotation process and other factors such as:
(a) interaction of acid-anionic species with carbonate andphosphate minerals
(b) kinetics of collector adsorption on carbonate and phosphateminerals
(c) clay-coating on phosphate particles(d) mechanism of activation/depression of sodium silicate
Also, to conduct pilot plant studies on various flotation plantfeeds to establish the process flowsheet and possible application oncurrent flotation plants and to compare the process economics of thedirect phosphate flotation approach and the currently used "crago"double flotation process.
However, FIPR's staff believes that an evaluation study is neededto compare this process and other processes developed by other researchgroups. The results of the recommended study may shed light on the mostpractical, economical and environmentally sound process(es) which maywarrant further pilot plant studies.
v


ACKNOWLEDGEMENTS
This investigation was funded by a research contract from the Florida Institute of
Phosphate Research (FIPR), under contract number FIPR 86-02-066. The authors express their
appreciation for their support of the study.
The authors also express their appreciation and gratitude to Professor Carl Rampacek,
Director Emeritus of the Mineral Resources Institute for his continuous encouragement,
unfailing advice and assistance. The cooperation and help provided by other staff,
particularly Dr. Cliff Schultz, and Mr. Ed Jackson, who conducted many of the flotation
experiments, are gratefully acknowledged. Special thanks are also due to Mrs. Toni D. Jones
for undertaking the considerable task of typing the rough and final drafts.
The authors also extend their appreciation to all graduate students and undergraduate
students from the College of Engineering for their assistance in conducting laboratory
experiments on a number of phases of the work. Also, the cooperation and help of Ms. Kim M.
Clary (Chemist) and Mr. Billy G. Rigsby and Mr. Gene D. Irvin of the MRI chemistry laboratory
are greatly appreciated.
xix
EXECUTIVE SUMMARY
Under a two-year research contract from the Florida Institute of Phosphate Research(FIPR) the Mineral Resources Institute (MRI) of The University of Alabama investigated theselective flotation of dolomitic limestone impurities from siliceous Florida phosphates. Theobjectives of the investigation were: (1) to demonstrate the applicability of the fatty acidflotation technique developed by MRI for processing the siliceous dolomitic Florida phosphatematrix, and (2) to optimize the process with respect to removal of the carbonate (Ca,Mg) andsiliceous gangue recovery of the phosphate values.
The MRI carbonate-phosphate flotation process is unique in that the separation is carriedout in a non-equilibrium condition. The success of the process is based on the fact that fattyacids adsorb more rapidly onto carbonate surfaces than onto phosphate surfaces. Thus, in aslightly acid circuit, carbonates are floated immediately upon addition of the collector andfrother. After collection of the carbonate froth the pulp is conditioned briefly while theresidual collector completes its adsorption onto the phosphate mineral surfaces. Thereafterthe phosphate is floated with, in most instances, no further addition of collector. It is believedthat the differential rate of adsorption is enhanced by judicious pH control during the process.
The research completed included four major tasks:
Five samples representing the siliceous dolomitic Florida phosphate matrix and tworepresenting current plant flotation feed were investigated. Attention was focused oncharacterization of the as-received matrix samples with regard to their size distribution,liberation, mineralogic and chemical composition.
Mineralogic and x-ray examination revealed that the principal phosphate mineral in thesamples tested was “francolite”. Quartz, clays, and some feldspars were the major siliceous
xxi
Sample Preparation and Characterization
Process Description
impurities. The MgO impurities were present as mixed dolomite/calcite particles. Two formsof dolomite were identified. One was “hard" crystalline dolomite particles or occurred ascementing material in the pebble fraction. The other was “soft” fine grained dolomiteaggregates which were the bulk of dolomitic impurities in the matrix. Attrition scrubbing anddesliming tests proved that a major portion of the dolomite (67-87% of the total MgO) can beremoved from the as-received matrices as minus 150-mesh slimes. Because of their low P2O5
content of 0.7 - 3.4% the slimes can be discarded.
Sizing and liberation studies on the deslimed material showed that the sizes finer than 35mesh were reasonably well liberated in most cases. Generally, the silica particles were moreliberated than the francolite or dolomite particles which were intimately associated. Unlessotherwise stated, the natural 35 x 150 mesh size fraction “primary” was used as flotation feed.
The plus 35 mesh pebble fraction was selectively roll-crushed to minus 35 mesh anddeslimed at 150 mesh. The “secondary” 35 x 150 mesh material was either used separately asflotation feed or combined with the primary 35 x 150 mesh fraction to comprise the bulkflotation feed. Heavy liquid separation of the prepared feeds gave sink 2.95 gravity fractionsanalyzing 32.3% P2O5, 0.6% MgO, and 2% insol. This grade represents the “upper limit” that
may be attained by beneficiation of these ores.
Process Development Studies
The process development studies were bench scale laboratory investigations aimed atdeveloping and optimizing the carbonate flotation and phosphate flotation aspects of the two-step MRI process. A sample from W.R. Grace’s Four Corners Mine was used to determine thevalues of appropriate flotation parameters such as reagent type and dosage, pH, pulp solids,etc., that would yield products with acceptable grades and recoveries. Thus, at the end of theprocess development studies, a base-line testing procedure was developed.
In the carbonate flotation step, four collectors using the MRI “no-conditioning” processwere tested. The fatty acid collectors, oleic acid and tall oil, proved to be superior to fatly acidsoaps in selectively floating the carbonate impurities under slightly acidic pH’s. Emulsions ofcollector/pine oil frother gave the best flotation results. Because of its known composition,oleic acid was selected as the reference collector for base-line studies of the carbonate flotationparameters. As expected, the pulp pH, collector dose and minimum collector conditioning arecritical factors in selective carbonate flotation.
xxii
The results obtained demonstrated the applicability of the MRI process to the high MgOFour Comers phosphate sample. Carbonate froth products analyzing 11 to 14% MgO with MgOrecoveries of up to 75% were achieved without collector conditioning and without, addition ofspecific phosphate depressant. Phosphate losses in the carbonate froth were usually below10%. The optimum carbonate flotation conditions recommended for this sample are:deslimed feed of 35 x 150 mesh, 16% solids, pulp pH 5.5 using about 0.4 kg/ton H2SO4 as pH
regulator, 3-step addition of 0.5 kg/ton oleic acid-0.1 kg/ton pine oil mixture for each step, nocollector conditioning, impeller peripheral speed of 4.12 M/S (13.5 Ft/S) and an air flow rate of2.5 SLPM.
Phosphate flotation from the siliceous carbonate-free cell underflow was first tried atalkaline pH’s of 8-10. The flotation was not selective and produced intermediate gradephosphate concentrates containing as much as 30% acid insolubles. Subsequent tests atslightly acidic pH’s of 5.8-6.2 lead to the discovery of a selective phosphate flotation techniquewhich utilizes the residual collector from the carbonate step, and sodium silicate as silicadepressant. A well mineralized froth was consistently obtained during phosphate flotation.The new phosphate flotation approach (patent applied for) produced high grade rougherconcentrates containing 29.5-30.6% P2O5, 0.7-1.0% MgO, and 2.8-8% insol. The P2O5
recoveries in the concentrates ranged form 65 to 88%.
The grade and P2O5 recoveries in the concentrates were found to depend largely on the pulp
pH and conditioning time of the pH modifier. Other contributing factors were the type ofinorganic acid used during the carbonate flotation step, and the SiO2/Na2O ratio of the sodium
silicate used during the phosphate flotation step.
Further improvement in P2O5 grade and recovery was achieved by reflotation of the
rougher concentrate once or twice at pH 6 without additional collector or frother. The cleanedphosphate concentrates analyzed 31.0-31.5% P205 , 0.7-0.8% MgO and about 3% acid insol
with P2O5 recoveries of about 84%.
Comparable results for the two-step process were obtained when commercial fatty acidcollectors, such as tall oil, were substituted for pure oleic acid.
xxiii

ess Application Studies
Based on the process development studies a standard two-step carbonate and phosphateprocess was established and used for process application studies. The first step or “carbonateflotation” was designed for maximum removal of the carbonate-rich particles in the frothproduct by stage addition of 1.5 kg/ton fatty acid 0.3 kg/ton pine oil collector emulsion at pH5.5 2 0.1. The second step or “phosphate flotation" was used to recover most of the phosphatevalues at pH 6 rl: 0.2 using a further addition of 0.25 kg/ton oleic acid and 0.5 kg/ton sodiumsilicate. The non-floated material (cell-product) was collected as finished “silica tailing”.
Seven samples representing high and low MgO siliceous phosphate deposits in Florida wereinvestigated. Four of the samples were high in MgO, i.e. with MgO/P2O5 ratio higher than
0.033. These samples responded well to the standard two-step carbonate/phosphate flotationprocess. Depending on the mineralogic composition and liberation size of each sample, slightmodifications in the process pH and/or reagent consumption were required to achieve the bestflotation results.
Rougher phosphate concentrates analyzing 27-30% P2O5, 0.7-1.0% MgO and 7-14% insolwere produced from flotation feeds containing 4-23% P2O5, 0.2-4.8% MgO and 10-85% insol.
The crushed pebble sample gave the highest MgO level in the concentrate because of itsincomplete liberation even at sizes finer than 150 mesh. Finer grinding or regrinding of therougher concentrate may be required in this case. Also, reflotation of the rougher phosphateconcentrate would produce higher grade concentrates as demonstrated in the processdevelopment studies.
The samples with MgO/P2O5 ratio lower than 0.033 were processed by direct flotation of
the phosphate values, i.e. bypassing the carbonate flotation step. Rougher phosphateconcentrates analyzing 29-31% P2O5 and 8-10% insol were produced by direct phosphate
flotation. The P2O5 recovery was in the range of 82-88%.
Limited testing with commercial fatty acid collectors, with and without fuel oil, gavecomparable flotation results to those obtained by using pure oleic acid. Thus, commercialgrade reagents such as the “fatty acid blend” supplied by IMC can be effectively used in bothcarbonate/phosphate and direct phosphate flotation process.
xxiv

The foregoing results have demonstrated the applicability of the MRI phosphate processingapproach to both high and low phosphate matrices. The distinct advantages of the processinclude: the use of current commercial reagents, high selectivity and flexibility to treat bothsiliceous and siliceous/carbonate phosphates without resorting to deoiling and cationicflotation steps (double flotation). Also, the simple process design would allow easy retrofittingof current phosphate flotation plants.
Surface Chemical Studies
The surface chemical studies involved a limited investigation of adsorption, zeta potentialand wetting properties of the major mineral constituents in the Four Corners sample. Allsurface chemical tests were conducted on handpicked individual mineral from the matrixunder simulated flotation conditions to better understand the process fundamentals and themechanisms involved. Generally, the results obtained have confirmed the basic concepts usedin the MRI selective fatty acid carbonate and phosphate flotation process. The selectivity incarbonate/phosphate separation may involve one or more of the following mechanisms: a)differential acidic dissolution of the carbonate and phosphate minerals, b) physicaladsorption of fatty acid collectors on the freshly generated mineral surfaces, c) fast collectoradsorption and hence fast flotation kinetics of the carbonate minerals due to precipitation ofCO2 microbubbles on the surface, and d) in-situ depression of apatite by phosphate ionic
species dissolved from the mineral surface.
The selectivity in phosphate/silica separation at pH 6 may involve one or more of thefollowing mechanisms: (a) removal of surface contamination from the silica surface andpossible formation of hydrosilicic acid species which act as silica depressant: (b) preferentialadsorption (physical) on apatite rather than silica surfaces: and (c) suppressed formation ofthe inactive Ca- and Mg- fatty acid precipitates in the acidic pulp, thereby increased collectoravailability to the system.
Because of the new concepts used in the MRI phosphate carbonate flotation process underslightly acidic conditions further studies are required in the following three major areas.
xxv
Recommendations
1) Two-Steo Carbonate/Phosohate Flotation Process: These are bench and pilot plant
semi-continuous testing of the following process parameters:
e flotation reagents scheme and method of application
o pulp residence time during the carbonate flotation step
0 upper particle size limit on carbonate and phosphate flotation
0 process water recycling
2) Direct Phosnhate Flotation: Laboratory and bench scale studies to determine the effect
of the following flotation parameters on P205 grade and recovery:
l type of collector/frother emulsion and its conditioning time
0 quality of process water
0 cleaning steps
3) Process Fundamentals: The studies include the role of physical adsorption mechanism
during the carbonate and/or phosphate flotation process and other factors such as:
l interaction of acid-anionic species with carbonate and phosphate minerals
l kinetics of collector adsorption on carbonate and phosphate minerals
l mechanism of m-situ apatite and silica depressants.
l clay-coating on phosphate particles
l mechanism of activation/depression of sodium silicate
Also to conduct pilot plant studies on various flotation plant feeds to establish the process
flowsheet and possible application on current flotation plants and to compare the process
economics of the the direct phosphate flotation approach and the currently used “crago” double
flotation process.
xxvi
INTRODUCTION
Problem Statement
The Florida Phosphate industry is faced with depletion of the reserves of pebble rock
matrix in Central Florida’s Polk County. The industry must either mine the deeper and leaner
deposits from the lower zones of current producing areas or develop the South Florida reserves
of the Hawthorn Formation in Hardee, Desoto, Manatee, and Sarasota counties.
The recoverable reserves in the southern region are about twice those of Central Florida,
but are generally lower in grade. These deposits also contain substantial amounts of the
undesirable MgO impurities in the form of dolomitic limestone in addition to the major
siliceous gangue minerals, quarts and clay.
Processing these ores by conventional technology yields pebble products analyzing 18 to
30% P2O5 and 3 to 11% MgO, and flotation concentrates analyzing 30 to 32% P2O5 and 0.7 to
2.5% MgO[1]. Because of their high dolomite content, acidulation of such concentrates
consumes excessive sulfuric acid and causes problems during phosphoric acid manufacture
such as increased acid viscosity, precipitation of insoluble Mg-phosphates and difficulties in
filtration and clarification of the final product. At present, MgO ores are bypassed or
stockpiled for future processing.
Research Approaches
The widely used “double float” froth flotation technique, developed for upgrading siliceous
phosphatic ores, has generally been ineffective for beneficiating high dolomite/limestone
phosphate ores. The fatty acid collectors used to float phosphate minerals also collect
carbonate minerals. Therefore, attention has been focused on the use of surface modifiers
and/or specific depressants such as diphosphonic or fluosilicic acids to achieve adequate
selectivity in the fatty acid flotation circuits [2-4] . Efforts have also been made to develop
selective carbonate or phosphate collectors such as phosphoric and polycarboxylic acid esters,
n-alkylamine-propionic acids, and n-substituted sarcosine[5] . However, many of the reagent
1
schemes developed are not attractive because they frequently require high dosage rates and are
more expensive than conventional reagents. Recent efforts have focused on developing less
expensive depressants such as sodium silicate[6] , or using pH modifiers instead of apatite
depressants as in the two-stage conditioning process[7] .
A new selective flotation technique for processing dolomitic and calcareous-siliceous
phosphate ores, without the use of a depressant, has been developed by the co-
investigators[8,9].. The process takes advantage of the fact that, under slightly acidic
conditions (pH 4-6) fatty acids adsorb very rapidly into carbonate surfaces and relatively
slowly onto apatite surfaces. Thus, a separation of dolomite from apatite can be effected by
collecting a dolomite froth immediately upon addition of reagent. After collection of the
dolomite (carbonate) froth, an apatite froth can be collected, usually with no further addition
of reagents. During the two froth collection periods, the pH of the system drifts toward a final
value of about 6.
In July 1987. the Florida Institute of Phosphate Research (FIPR) awarded a two-year
research contract to the Mineral Resources Institute (MRI) of The University of Alabama, to
investigate the merits of the new carbonate/phosphate separation approach.
Research Objectives
The primary objective of this investigation is to demonstrate the applicability of the new
fatty acid flotation technique for processing both low- (matrix or sand fraction) and high-
grade (pebble fraction) siliceous dolomitic Florida phosphate ores. The second objective is to
improve the process in order to achieve maximum removal of the carbonate (Ca, Mg) and
siliceous gangue while maintaining a high recovery of the phosphate values.
Research Plan and Report
The research plan mainly involved initial process development studies, followed by
process application studies, both of which were largely of an applied nature. In the course of
the process development studies, surface chemical studies, which were of a more fundamental
nature, were conducted as needed to complement, and to aid in understanding some of the
2

results obtained. As such, this report, in the main, has been segmented into three parts -
process development, process application and surface chemical studies - in consonance with
the research plan.
The process development portion deals with bench scale tests aimed at developing and
optimizing the carbonate flotation and phosphate flotation aspects of the new process being
tested. A sample from W.R. Grace’s Four Comers mine was used in initial tests to determine the
values of appropriate flotation parameters such as reagent type and dosage, pH, pulp solids,
etc., that would yield products with acceptable grades and recoveries. Thus, at the end of the
process development studies, a base-line testing procedure was developed.
The process application portion deals with applying the baseline procedure to various
south Florida phosphate samples. In doing so, it was possible to assess the impact of
variations in sample composition (or mineralogy) on the baseline procedure.
The surface chemical studies involved fundamental investigations regarding adsorption,
zeta potential and wetting properties of the major mineral constituents in the sample used
during process development. All surface chemical tests were conducted under simulated
flotation conditions with regard to pH, ionic strength and reagent combinations.
RESEARCH SAMPLES
Sample Selection
A preliminary study was made to identify the major high MgO phosphate matrix resources
in south Florida and to select phosphate samples for this project. The study included a
literature survey and direct contacts with major phosphate mining operators in Florida.
Based on the recommendations of Dr. Ronald Weigel, FIPR Board Member, and Dr. Hassan El-
Shall, FIPR’s Research Director-Beneficiation, a trip was made to Bartow, Florida to arrange
procurement of phosphate matrix samples, and to discuss some practical aspects of the project
with officials of three major Florida phosphate companies - IMC, W.R Grace, and Agrico. Both
W.R. Grace and Agrico companies agreed to provide MRI with about 500 pound samples from
their high MgO reserves.
3

On September 10, 1987, three drums of core drilled matrix samples (approximately 300
lbs/drum) were received from Agrico Mining Company. One sample represented core drilled in
the lower zone phosphate bed encountered in location “C-2”. This sample was designated MRI
sample #191. The other two samples represented the upper and lower zones of phosphate beds
encountered in location “C-6” and were designated MRI samples #189 and #190, respectively.
On October 12, 1987, a drum containing about 500 pounds of matrix from W.R Grace’s Four
Corners Mine was received and designated MRI sample #194. Another two drums of W.R.
Grace’s matrix were received in January 1988 and designated MRI sample #197.
During the second year of the study, four buckets of low and high magnesia samples were
received from Occidental Chemical Company, White Springs, Florida. The high MgO sample
was designated MRI #213. Also, two buckets of unsized plant feed were obtained from IMC’s
Noralyn operations and designated MRI sample #214.
The samples received and their designated MRI sample numbers are listed in table 1. The
free standing water in each drum of the Agrico and W.R. Grace samples was drained and the wet
ore thoroughly mixed. After mixing, each sample was cone and quartered several times to
obtain 50 lb. batches of working samples.
Chemical Analysis
Representative run-of-mine (ROM) samples of each ore were dried at 105°C then ground to
pass a 100 mesh screen. Representative samples of the ground material were then analyzed in
duplicate for P2O5, acid insoluble matter (insol), CaO and MgO. The P2O5 and insols were
determined gravimetrically while CaO and MgO were determined by atomic absorption
procedures. Details of the chemical analysis procedures used are given in the manual “Methods
Used and Adopted by the Association of Florida Phosphate Chemists” [10] .
Initial chemical analyses of the first four matrix samples revealed that the upper zone
Agrico matrix, #189 had the lowest MgO analysis of about 0.3%. The plus 35 mesh size fraction
of sample #189 analyzed 26% P O , 21% insol and 0.4% MgO while the 35 x 100 mesh fraction2 5
analyzed 4.5% P2O5, 86% insol and 0.1% MgO. Because of the relatively low MgO content of
4

Table 1. Sample Description and Identification
MRI Sample Number Source Description
139 Agrico, FL Upper Zone, Location “C-6”
190 A@-ico, FL
191 A@-ico, FL
Lower Zone, Location “C-6”
Lower Zone, Location “C-2”
194 W.R Grace Lower Zone, Four Comers Mine
197 W.R Grace Lower Zone, Four Comers Mine
213 Occidental As-mined and Deslimed High and Low “Mag” Material
214 I.M.C. Noralyn Plant Feed
5
sample #189 which reflects the general characteristics of the upper zone phosphates of the
region, the sample was not suitable for systematic carbonate/phosphate separation studies.
However the sample was included in the process application studies aimed at producing high
grade phosphate concentrates.
Results of the chemical analyses of the matrices received are given in table 2. As compared
to sample # 189, the two lower zone Agrico samples # 190 and 191 showed higher MgO analysis
of 2.7 and 3.3%. respectively. The W.R. Grace samples #194 and 197 showed the highest MgO
content of about 9% and contained about 12% P2O5.
The IMC material sample #214 analyzed 8.98% P2O5 72.81% insol and 0.12% MgO. The
Occidental material, sample #213, were “as mined” and deslimed samples of high MgO and low
MgO varieties, as designated by the source company. MRI was interested only in the “as mined"
high MgO sample, which, according to the company, analyzed 9.54% P2O5 and 0.23% MgO. No
insol analysis was given for the sample.
The high MgO, WRG Grace samples (#194 and 197) and two Agrico samples (#190 and 191)
were selected for the two step carbonate/phosphate/silica flotation tests and for detailed
characterization studies to determine their liberation properties. The low MgO samples #189,
213 and 214 were sized and/or deslimed at 150 mesh and stored for process application studies.
Furthermore, the chemical analysis of sample #197 was practically the same as #194.
Since they were obtained from the same location, they were deemed to be very similar. Sample
#197 was therefore stored for future anticipated work under process application also.
Size and Granulometric Analysis
Fifty pound batches of samples #190, 191 and 194 were each slurried with tap water and
scrubbed for 15 minutes prior to screening at 4 mesh to remove the coarsest, non-phosphatic
particles. The minus 4 mesh slurry (about 35% solids) was circulated through a pump for about
30 minutes, then split to obtain representative head samples for size analysis.
6

Table 2. Chemical Analysis of the Lower Zone Phosphate Matrix
MRl Sample Number
190
191
‘2O5
3.6
8.5
Analysis, % (Dry Basis)
Ins01
73.2 2.7
59.3 3.3
CaO
6.3
10.5
194 12.1 8.9
197 12.3 28.4 9.1 22.9
7

About 300-400 grams of each matrix was wet screened on 14, 35, 48, 100, and 150-mesh
sieves. The sized fractions separated were dried and analyzed for P2O5 , insol, and MgO. Figure
1 shows the cumulative weight percent of each fraction versus the particle size diameter in
microns for the lower zone phosphate samples. Results of chemical analyses and size
distributions of the major constituents of the various size fractions are given in tables 3
through 5 for samples #190, 191, and 194, respectively.
The size distribution curves illustrated in figure 1 show the general characteristics of
Florida pebble phosphates. The lower zone Agrico sample #190 (from C-6 location) was finer
than the other sample #191 (from C-2 location) as well as the W.R. Grace sample #194. As
expected, the size fractions coarser than 35 mesh were much higher in P2O5 and lower in insol
than the sand 35 x 150 or the slime 150 x 0 fractions. The P2O5 content of the 35 x 150 mesh
fraction ranged from 4.2 to 7.9% while the P2O5 in the slimes ranged from 0.7 to 3.4%. The
MgO content of the sand fractions of samples #190, 191 and 194 ranged from 0.3% to 1.63%
while the slimes ranged from about 7% to 16.6% MgO.
The MgO data presented in tables 3 to 5 show that the dolomite impurities were partially
concentrated in the coarse sizes (plus 35 mesh) while the majority reported in the finest (slime)
fractions. The slimes generated from Agrico samples #190 and 191 contained, respectively,
7.00% and 9.42% MgO compared with the 2.78% and 3.2% MgO for the respective matrices.
This means that about 72-89% of the original MgO content of the matrix can be rejected in the
slime fraction. The W.R. Grace sample #194, having the highest MgO content of 8.68%. gave
similar results with 67% MgO rejection in the slimes. The unusually high MgO content of the
slime fractions indicate the predominance of soft or friable dolomite impurities in the matrix,
as will be discussed in later sections.
Heavy Liquid Separation Studies
Heavy liquid separation tests were conducted on the sized fractions of the three lower zone
samples #190, 191 and 194 to determine the liberation size of each. The heavy liquid,
tetrabromo ethane (TBE), was used for separation at specific gravity (S.G.) of 2.95 and a mixture
of TBE and perchloro ethylene (PCE) was used for tests at 2.72 S.G. Sink/float tests were made
on each size fraction to produce three gravity products (i.e. sink 2.95, float 2.95/sink 2.72 and
8

9
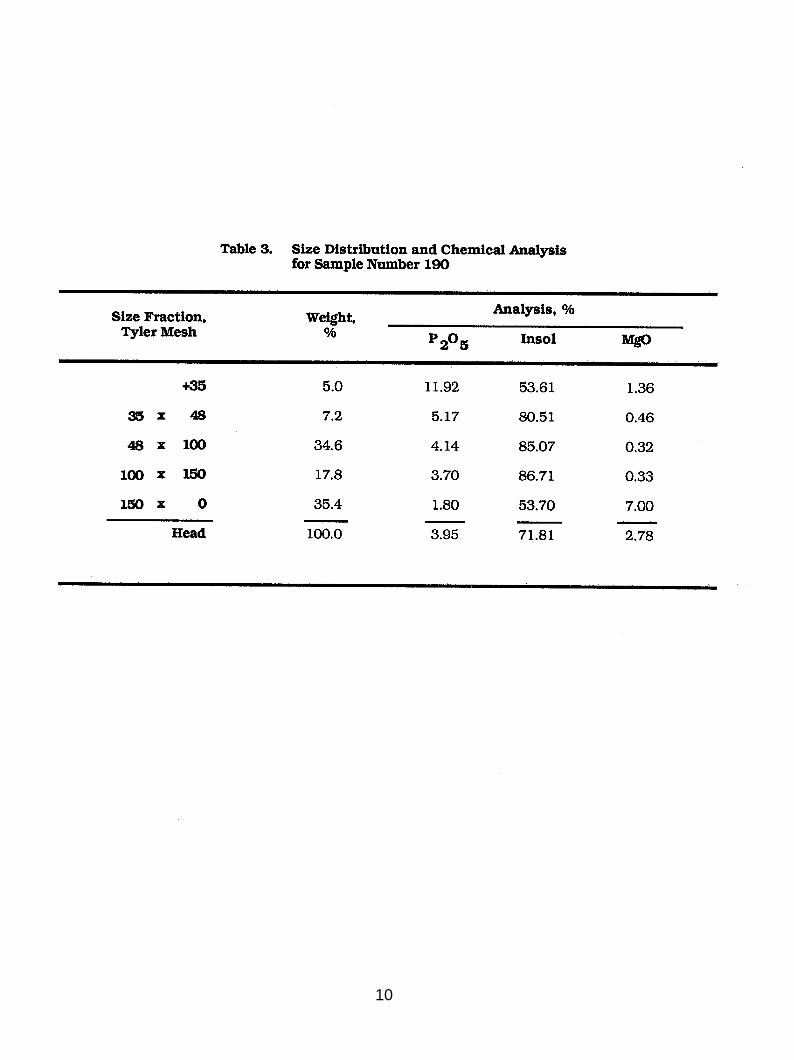
Table 3. Size Distribution and Chemical Analysis for Sample Number 190
Size Fraction, Tyler Mesh
Weight, %
Analysis, %
P2°a Ins01
+35 5.0 11.92 53.61 1.36
35x 4s 7.2 5.17 80.51 0.46
48 x loo 34.6 4.14 85.07 0.32
loo x 150 17.8 3.70 86.71 0.33
150x 0 35.4 1.80 53.70 7.00
Head 100.0 3.95 71.81 2.78
10
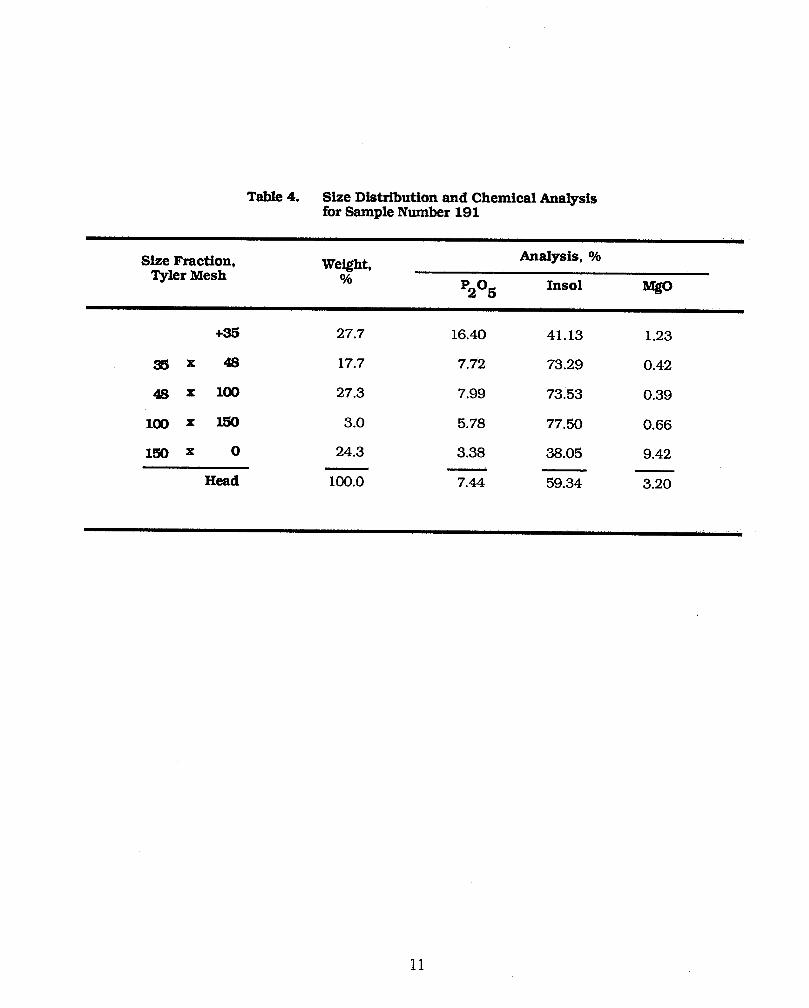
Table 4. Size Distribution and Chemical Analysis for Sample Number 191
Size Fraction, Tyler Mesh
Weight, %
Analysis, %
p2°s Ins01
35
4s
100
150
+35 27.7 16.40 41.13 1.23
x 48 17.7 7.72 73.29 0.42
X 100 27.3 7.99 73.53 0.39
x 150 3.0 5.78 77.50 0.66
X 0 24.3 3.38 38.05 9.42
Head 100.0 7.44 59.34 3.20
11
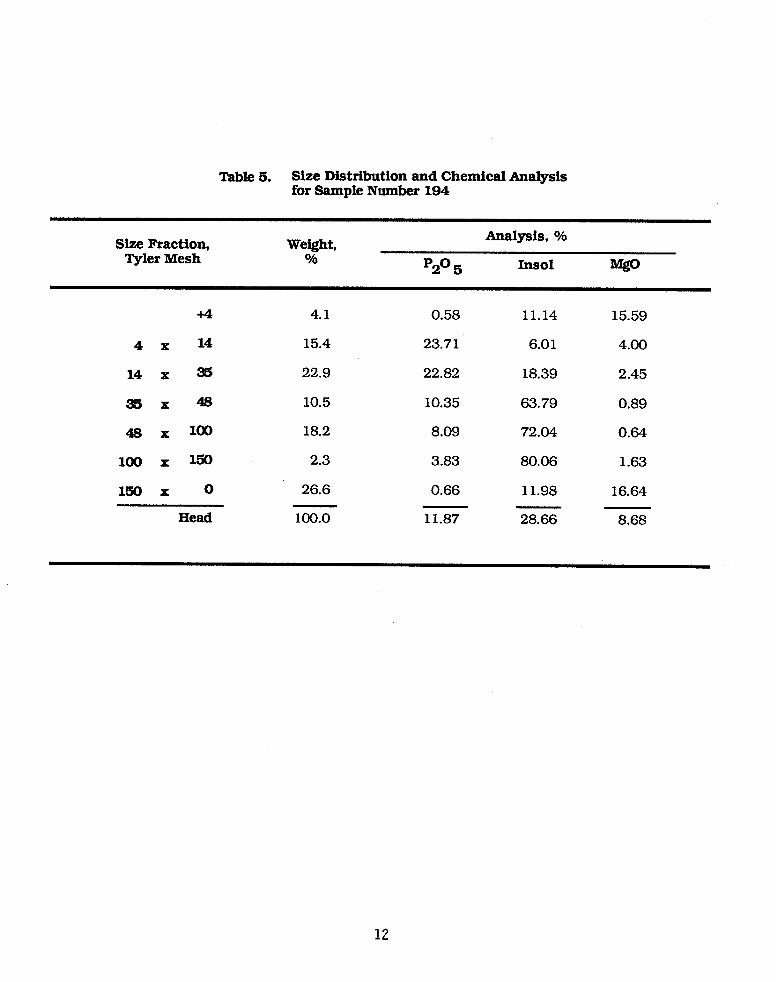
Table 5. Size Distribution and Chemical Analysis for Sample Number 194
Size Fraction, Tyler Mesh
Wei@, %
Analysis, %
p2° 5 Ins01
+4 4.1 0.58 11.14 15.59
4 x 14 15.4
14 x 35 22.9
35x 4s 10.5
4s x 100 18.2
loo x 150 2.3
150x 0 26.6
Head 100.0
23.71
22.82
10.35
8.09
3.83
0.66
11.87
6.01 4.00
18.39 2.45
63.79 0.89
72.04 0.64
80.06 1.63
11.98 16.64
28.66 8.68
12
float 2.72) representing the free apatite, locked apatite/carbonate or apatite/silica and free
quartz particles, respectively. The gravity fractions, after washing and drying, were analyzed
for P2O5, MgO and insol. Results of these tests are given in tables 6 through 8. These data
revealed that the apatite in the three samples was poorly liberated at sizes coarser than 35
mesh as indicated by the weight percent and the P2O5 analysis of the intermediate gravity
fractions (F2.95/S2.72). Reasonable liberation was observed at sizes finer than 35 mesh. The
siliceous impurities appeared to be liberated at coarser sizes. The unliberated high-MgO
particles that concentrated in the F2.95/S2.72 gravity fractions were essentially apatite
dolomite mixed particles with a low silica content.
Except for the finest 100 x 150 mesh fractions, the liberated apatite particles (sink 2.95)
separated from the three samples were similar and analyzed 31.8 - 32.3% P2O5, 0.5 - 0.65%
MgO and 0.6 - 4.0% insol. The analysis of this product represents the upper practical limit of
concentration that may be achieved by most beneficiation techniques.
Mineralogic Characterization Studies
The objectives of this part of the investigation were to determine the actual mineralogic
composition of the three matrix samples, the inter-particle relationship between the mineral
constituents, and their degree of liberation. The characterization studies were conducted by
the Tennessee Valley Authority (TVA) - National Fertilizer Development Center (NFDC). The
samples tested included two samples, #190 and 191, from the lower zone Agrico reserves, and
the W.R. Grace’s Four Corners Mine, sample #194.
The three samples were examined by x-ray diffraction (XRD) and polarized light
microscopy (PLM) techniques. In addition to PLM, a microcomp planar morphology analysis
system (PMAS) was used to examine and point count polished sections of selected size fractions
of sample #194, to determine the free and locked mineral constituents or phases in each size
fraction.
Cross sections of sample #194 were also examined with the scanning electron microscope
(SEM) used in the backscattered electron (BSE) imaging mode. An energy-dispersive x-ray
(EDX) spectrometer was used to analyze the mineral inclusions. Since gray levels vary with
13

Table 6. Size Distribution and Sink-Float Analysis of Sample #190
Sk?42 specfic Fraction, Gravity
Tyler mesh Product We&W
Analysis % Distribution Oh
% p2°5
Ins01 - ‘Z”5
Ins01 Mgo
+3!3
35x 48
48 x loo
loo x 150
l5ox 0
s/2.95 0.16 S/2.72 1.77 F/2.72 Composite
3.07 5.00
30.87 26.17
2.68 11.92
6.59 6.39
83.37 53.61
0.22 1.57 1.97 14.2 1
0.01 0.03 0.13 2.61 2.96 2.46 3.10 5.10
1.07 2.52 1.36 18.30
s/2.95 0.19 S/2.72 0.97 F/2.72 Composite
6.04 7.20
31.66 27.46
0.76 5.17
3.76 5.50
94.97 80.51
0.2 1 1.57 1.07 6.85
0.01 0.07 8.12 8.20
0.01 0.03
0.37 1.18 0.46 9.60
0.06 1.00
32.31 3.50 0.37 8.23 28.23 3.94 1.19 19.78
0.04 0.17
41.59 41.80
0.13 1.18
s/2.95 1.11 S/2.72 3.01 F/2.72 Composite
30.48 34.60
2.29 3.60
0.75 96.03 0.23 5.29 4.14 85.07 0.32 33.30
s/2.95 0.52 30.75 8.07 S/2.72 1.48 28.76 3.69 F/2.72 Composite
15.80 0.45 97.10 17.80 3.70 86.71
0.50 1.06
5.52 14.73
0.06 0.08
20.46 20.60
0.06 0.37
0.26 2.45 0.33 22.70
0.97 1.40
---- 35.40 1.80 53.70 7.00 16.10 26.30 88.90
Head Composite 100.00 3.95 71.81 2.78 100.0 100.0 100.0
14
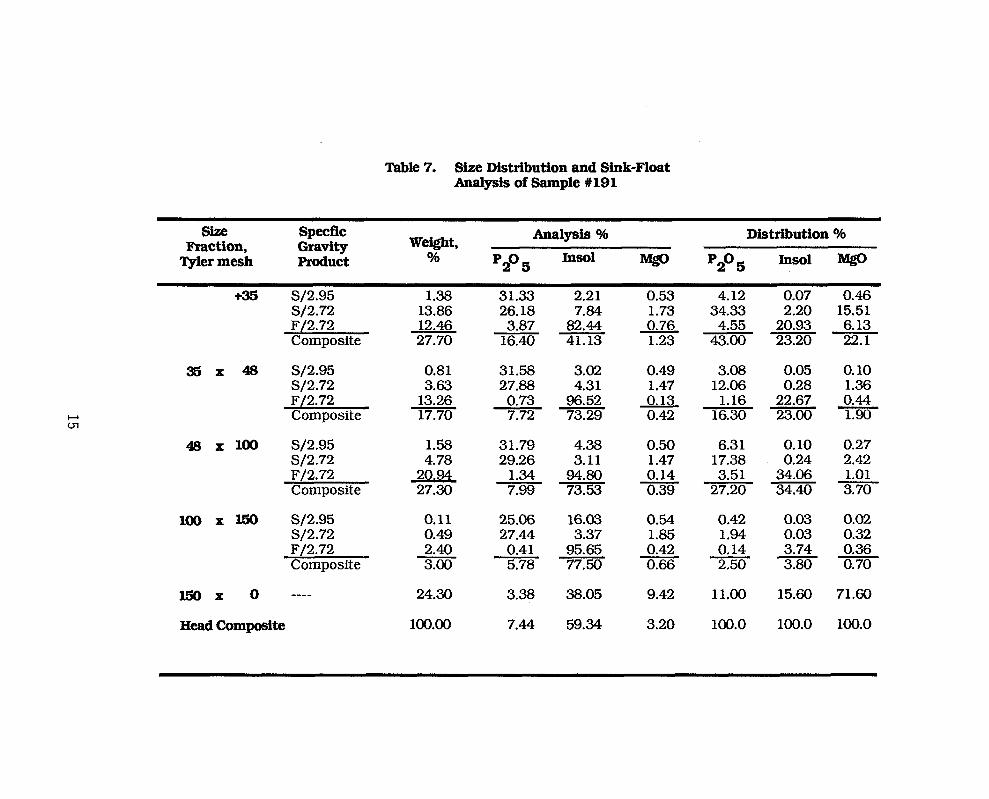
Table 7. Size Distribution and Sink-Float Analysis of Sample #191
Size specfic Fraction, Gravity
Tyler mesh Product Weight,
%
Analysis O/
‘Z”5 lnsO1
Distribution O/6
‘2’5 Insol n&o
+35 s/2.95 S/2.72 F/2.72 Composite
35x 48 s/2.95 S/2.72 F/2.72 Composite
4s x loo s/2.95 1.58 31.79 4.38 0.50 6.31 0.10 0.27 S/2.72 4.78 29.26 3.11 1.47 17.38 0.24 2.42 F/2.72 Composite
loo x I50 s/2.95 S/2.72 F/2.72 Composite
150 x 0 ---- 24.30 3.38 38.05 9.42 11.00 15.60 71.60
Head Composite 100.00 7.44 59.34 3.20 100.0 100.0 100.0
1.38 31.33 2.21 0.53 4.12 0.07 0.46 13.86 26.18 7.84 1.73 34.33 2.20 15.51 12.46 3.87 82.44 076 4.55 20.93 6.13 27.70 16.40 41.13 1.23 43.00 23.20 22.1
0.81 31.58 3.02 0.49 3.08 0.05 0.10 3.63 27.88 4.31 1.47 12.06 0.28 1.36
13.26 0.73 96.52 0.13 1.16 0.44 22.67 17.70 7.72 73.29 0.42 16.30 23.00 1.90
20.94 94.80 1.34 0.14 3.51 34.06 1.01 -- 27.30 7.99 73.53 0.39 27.20 34.40 3.70
0.11 25.06 16.03 0.54 0.42 0.03 0.02 0.49 27.44 3.37 1.85 1.94 0.03 0.32 2.40 0.41 95.65 0.42 0.14 3.74 0.36 3.00 5.78 77.50 0.66 2.50 3.80 0.70
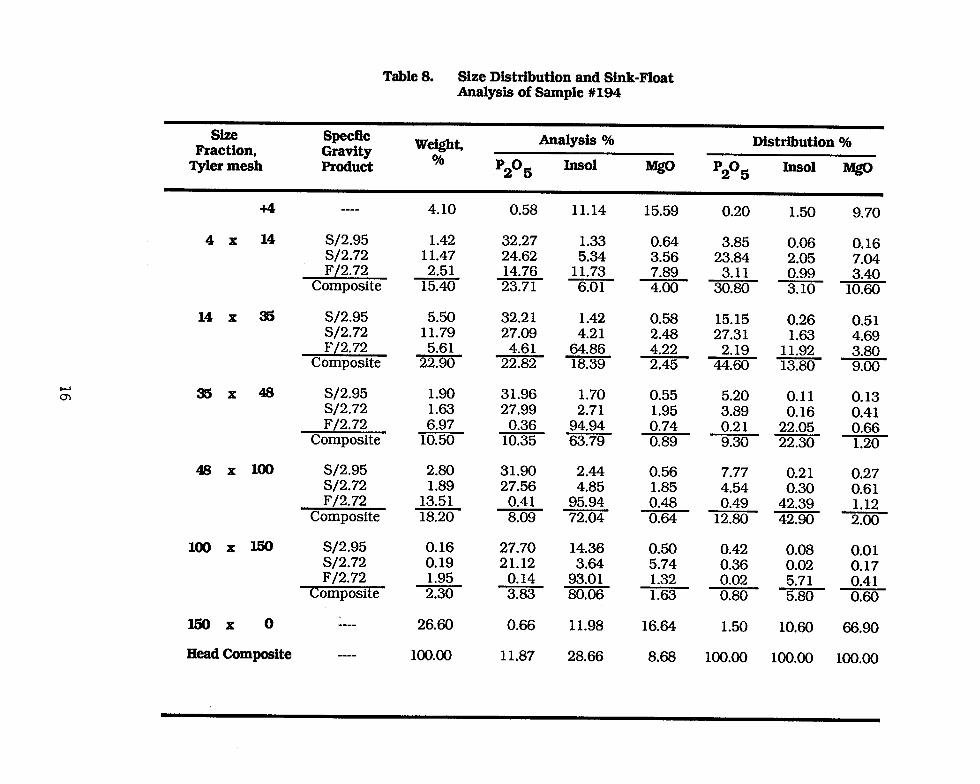
Table 8. Size Distribution and Sink-Float Analysis of Sample #194
Size specfic &action, Gravity
Tyler mesh Product
We&$& %
Analysis % Distribution %
‘2’5 Ins01
‘Z”5 Ins01 Mgo
+4
4 x 14
14 x 35
35x 48
48 x loo
loo x 150
l5ox 0
---- 4.10 0.58 11.14 15.59 0.20 1.50 9.70
s/2.95 1.42 32.27 1.33 S/2.72 11.47 24.62 5.34 F/2.72
Composite 2.51
15.40 14.76 23.71
11.73 6.01
0.64 3.85 0.06 0.16 3.56 23.84 2.05 7.04 7.89 3.11 4.00 30.80
0.99 3.40 3.10 10.60
s/2.95 5.50 S/2.72 11.79 F/2.72
Composite 5.61
22.90
32.21 1.42 27.09 4.21
4.61 22.82
64.86 18.39
0.58 15.15 0.26 0.51 2.48 27.31 1.63 4.69 4.22 2.19 2.45 44.60
11.92 3.80 13.80 9.00
s/2.95 S/2.72 F/2.72
Composite
1.90 1.63 6.97
10.50
31.96 1.70 0.55 5.20 0.11 0.13 27.99 2.71 1.95 3.89 0.16 0.41
0.36 0.74 0.21 22.05 10.35
94.94 63.79 0.89 9.30 22.30
0.66 1.20
s/2.95 S/2.72 F/2.72
Composite
2.80 31.90 2.44 1.89 27.56 4.85
13.51 0.41 18.20
95.94 8.09 72.04
0.56 7.77 0.21 0.27 1.85 4.54 0.30 0.61 0.48 0.49 42.39 0.64 12.80
1.12 42.90 2.00
s/2.95 0.16 S/2.72 0.19 F/2.72 1.95
Composite 2.30
27.70 14.36 0.50 0.42 0.08 0.01 21.12 3.64 5.74 0.36 0.02 0.17
0.14 93.01 1.32 0.02 5.71 0.41 3.83 80.06 1.63 0.80 5.80 0.60
-m-w 26.60 0.66 11.98 16.64 1.50 10.60 66.90
11.87 28.66 8.68 100.00 100.00 100.00 Head Composite ---- 100.00
composition in BSE images and with texture in secondary electron images, photomicrographs
were taken in the BSE mode to illustrate the distribution of the various mineral phases within
the cross-sectioned samples.
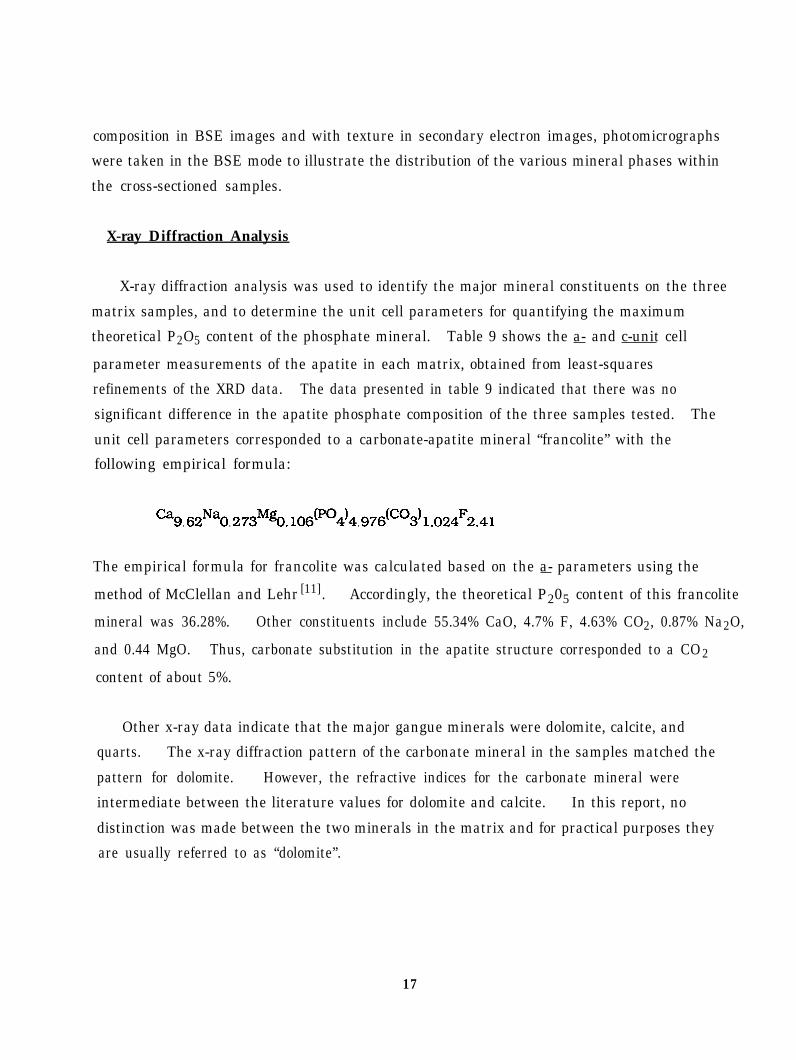
X-ray Diffraction Analysis
X-ray diffraction analysis was used to identify the major mineral constituents on the three
matrix samples, and to determine the unit cell parameters for quantifying the maximum
theoretical P2O5 content of the phosphate mineral. Table 9 shows the a- and c-unit cell
parameter measurements of the apatite in each matrix, obtained from least-squares
refinements of the XRD data. The data presented in table 9 indicated that there was no
significant difference in the apatite phosphate composition of the three samples tested. The
unit cell parameters corresponded to a carbonate-apatite mineral “francolite” with the
following empirical formula:
Ca9 . 6zNa0 . 273Mg0. 106’po4)4 .976(co311 .024F2.41
The empirical formula for francolite was calculated based on the a- parameters using the
method of McClellan and Lehr [11]. Accordingly, the theoretical P205 content of this francolite
mineral was 36.28%. Other constituents include 55.34% CaO, 4.7% F, 4.63% CO2, 0.87% Na2O,
and 0.44 MgO. Thus, carbonate substitution in the apatite structure corresponded to a CO2
content of about 5%.
Other x-ray data indicate that the major gangue minerals were dolomite, calcite, and
quarts. The x-ray diffraction pattern of the carbonate mineral in the samples matched the
pattern for dolomite. However, the refractive indices for the carbonate mineral were
intermediate between the literature values for dolomite and calcite. In this report, no
distinction was made between the two minerals in the matrix and for practical purposes they
are usually referred to as “dolomite”.
17
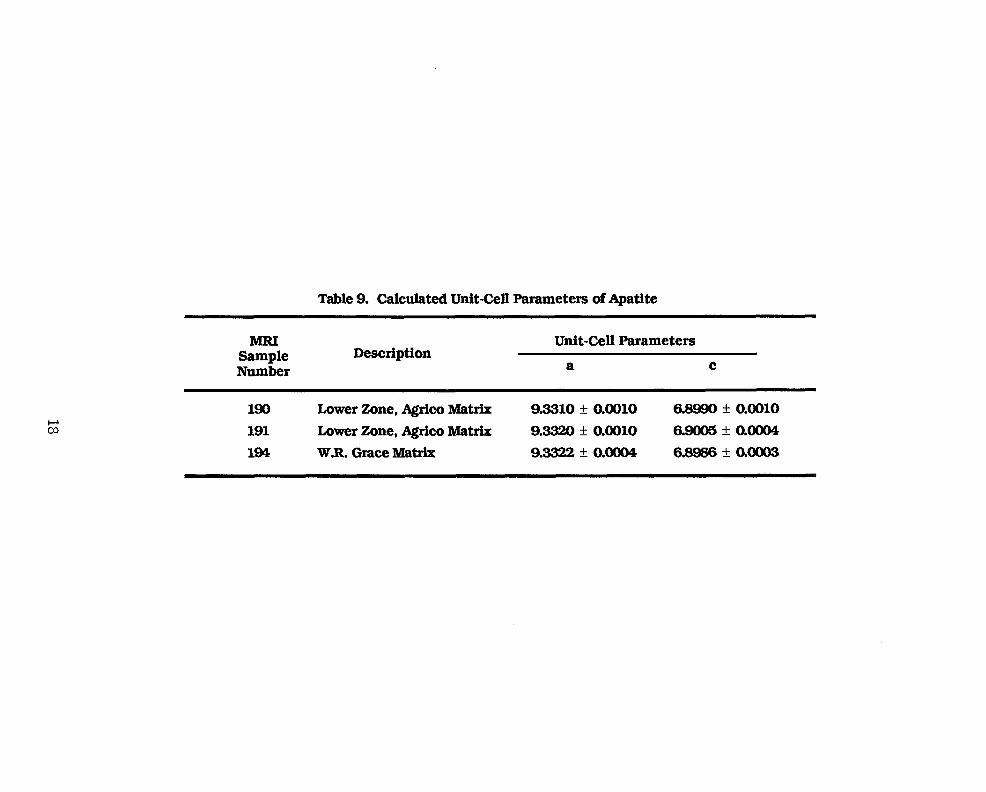
Table 9. Calculated Unit-Cell Parameters of Apatite
Sample Number
Description Unit-Cell Parameters
a C
190 Lower Zone, Agrico Matrix 9.3310 + 0.0010 6.8990 rf: 0.0010
191 Lower Zone, Agrico Matrix 9.3320 AZ 0.0010 6900550.0004
194 W.R. Grace Matrix 9.3322 + o.ooo4 68986 f o.ooo3

Mineralogic and Textural Description
The lower zone Agrico matrix, sample #190, consisted of apatite, dolomite, quarts, and an
unidentified iron oxide. The apatite was light gray to black and occurred as matrix material
and as smooth pebbles. As matrix material, the apatite cemented particles of quartz and
dolomite into larger pebble agglomerates. The dolomite occurred as soft fine-grained
aggregates and hard particles without obvious inclusions; as fine-grained, hard particles with
phosphate pebble or quartz inclusions: and as carbonate rims on phosphate particles within
pebble agglomerates. The quartz occurred as rounded particles and as inclusions in the
agglomerates.
The other Agrico matrix, sample #191. consisted of apatite, dolomite, and quartz. The
apatite occurred as smooth pebbles colored black, gray, and occasionally brown: as pebbles
with inclusions of quartz and carbonate: and as fossil shark teeth. The dolomite occurred as
particles with large quartz inclusions up to 500 x 650 microns, as particles with no obvious
inclusions, and as carbonate rims on phosphate particles within pebble agglomerates. The
quartz occurred as rounded particles and as inclusions in apatite or dolomite. Based on XRD
peak heights, the sample contained less dolomite and more quartz than sample #190.
The W.R. Grace matrix, sample #194, consisted of apatite. dolomite, quartz, and feldspar.
The apatite was brown to black and occurred as smooth pebbles, as pebbles with inclusions of
large quartz and dolomite, as pebbles with partial rims or depressions filled with carbonate, as
phosphate cementing dolomite and quartz, and as fossil shark teeth. The dolomite occurred as
soft agglomerates of rhombohedral grams (typically <30 microns) with quarts and apatite
pebble inclusions: as hard, fine-grained particles with few inclusions: and as carbonate rims
(described above). The quarts occurred as rounded particles and as inclusions in apatite or
dolomite agglomerates.
Detailed studies were made on the W.R. Grace sample #194 matrix pebble fraction (4 x 14
mesh) to determine the mineralogic composition and physical characteristics of its major
constituents. Results of XRD analysis and mineralogic analyses indicated that these pebbles
consisted of 30-40% apatite (francolite), 20-30% dolomite, 20-30% quartz, and <5% feldspar.
The apatite was brown to black pebble, with a refractive index which varied from 1.600 to
19

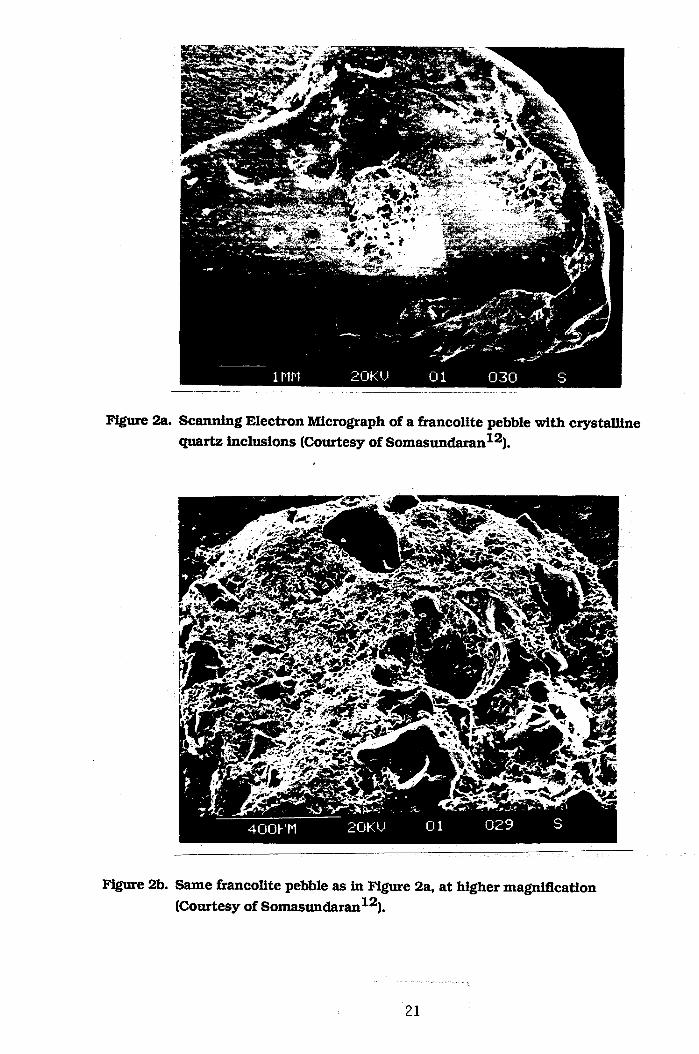
1.615. The apatite occurred as pebbles with no obvious inclusions; as pebbles with inclusions
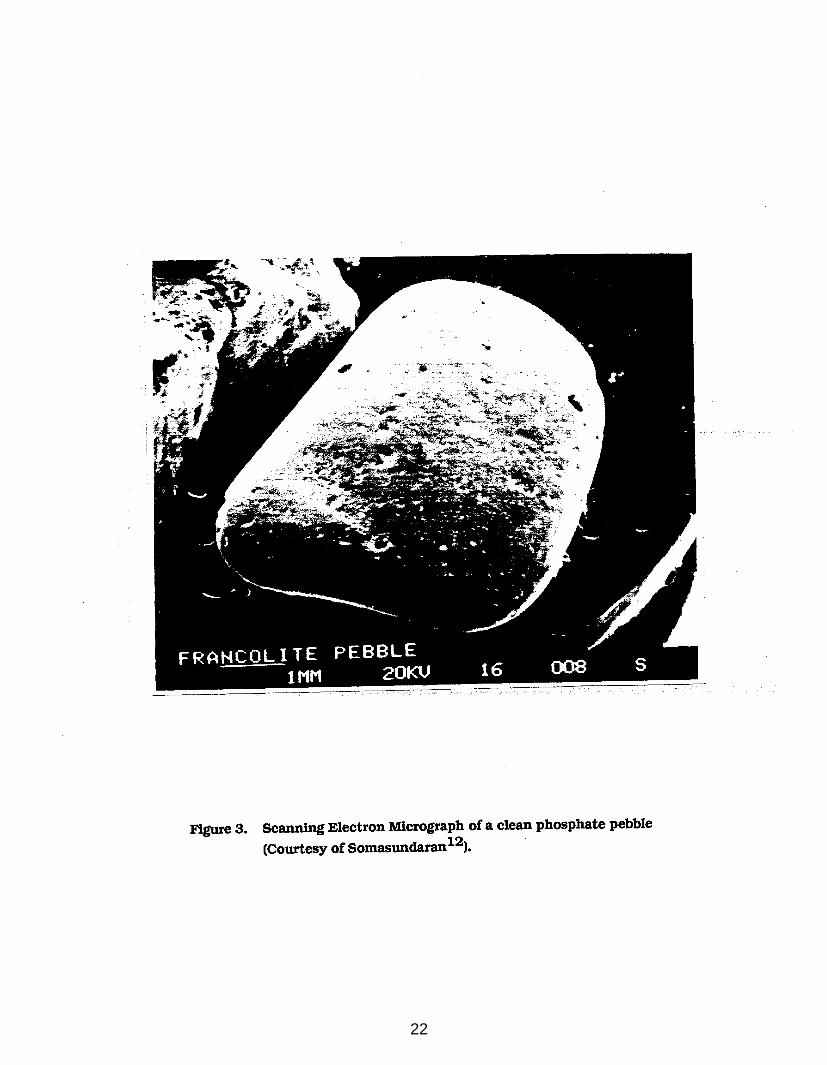
of large, discrete dolomite and quartz grams up to 400 x 500 microns. Figures 2 and 3 are SEM
micrographs reported by Somasundaran[12]’ for a typical phosphate pebble with and without
quartz inclusion, respectively. These figures also show the highly porous nature of the apatite
surface. The dolomite in sample #194, similarly occurred as soft agglomerates with apatite
pebble and quartz inclusions and as hard particles without obvious inclusions. The soft
agglomerates readily crumbled to fragments as fine as <30-microns. The small carbonate
crystals varied in refractive index from 1.660 to 1.675, with the majority being toward the
lower index. These grams readily reacted with dilute HCl, which is a typical behavior of
calcite. As these agglomerates were broken or abraded, the relative amounts of carbonate in
the smaller size fractions increased. The quartz occurred as rounded particles (several had
patches of apatite on the quarts surface) and as particles which varied from angular to rounded
grams in agglomerates or the apatite pebbles. The feldspar occurred as free particles and as
inclusions in apatite pebbles.
The mineralogic and x-ray results of the pebble fraction (4 x 14 mesh) of sample # 194 were
consistent with the heavy liquid separation results given in table 8. These data indicate that
despite the presence of some free apatite particles in this size range, the majority of the apatite
particles were locked with or hosted finer inclusions of quarts and dolomite. Therefore, size
reduction of the pebble fraction is a prerequisite for successful beneficiation in achieving high
grade concentrates and good recoveries of the phosphate.
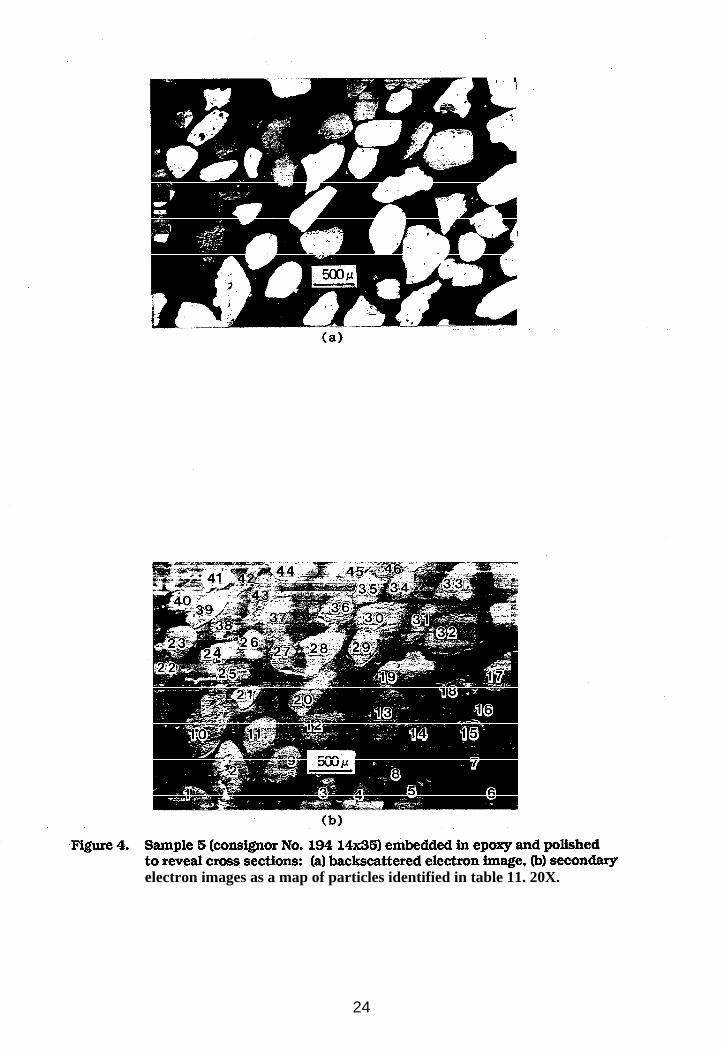
Point counts of the mineral species in sample #194 were made on a 14 x 35 mesh size
fraction and on a 1:1 mixture of 35 x 48 and 48 x 150 mesh size fractions. The results are shown
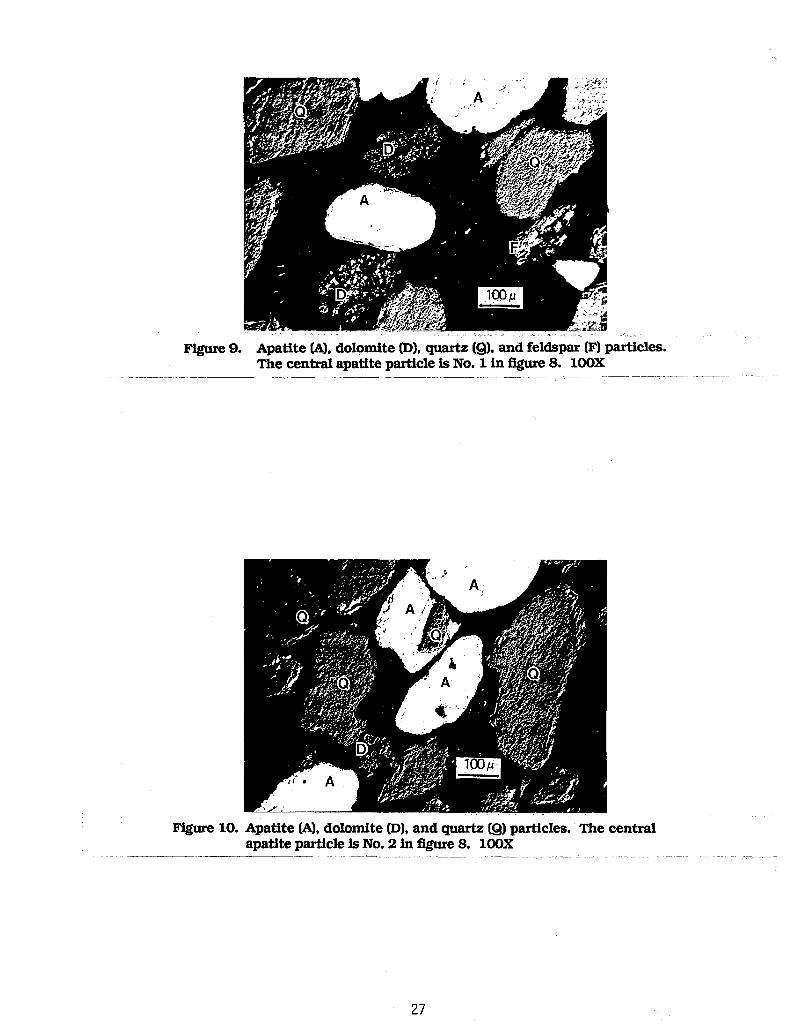
in table 10. Figures 4-11 are photomicrographs taken in the BSE mode to illustrate the
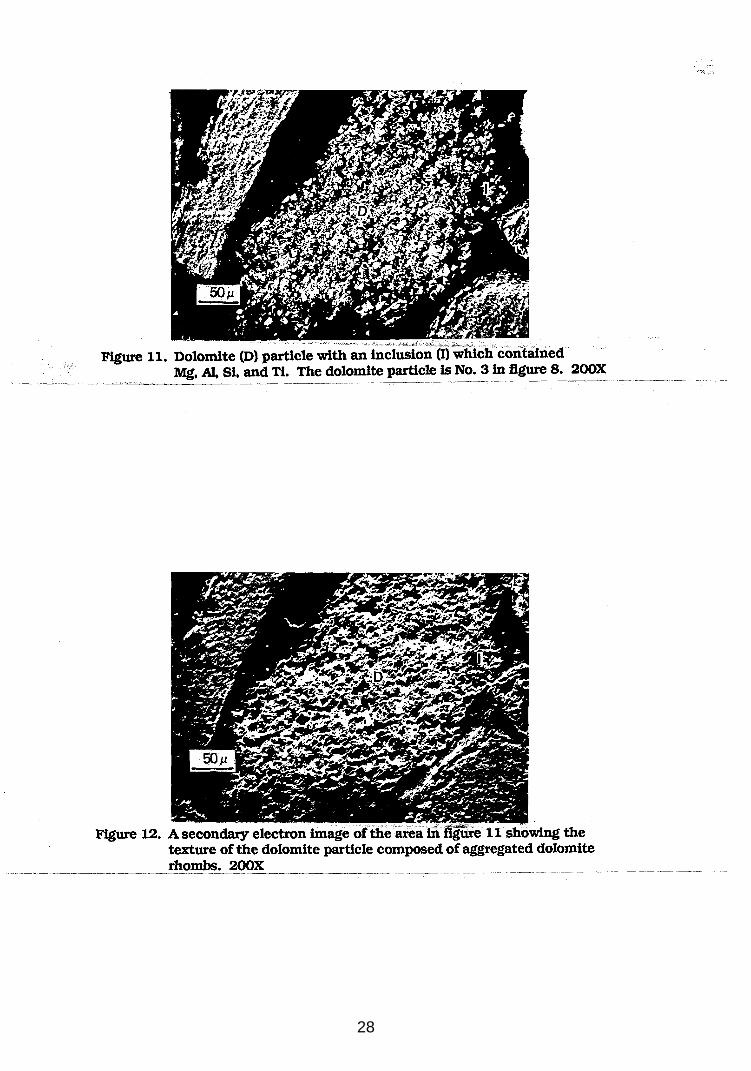
distribution of the mineral phases in the samples. Figure 12 is a photomicrograph which was
taken in the secondary electron mode to show the texture within a cross-sectioned dolomite
particle. Table 11 lists the minerals in figure 4 identified on the basis of EDX analysis. All
other EDX results are given in figure captions.
20
22

Table 10. Point Counts of Mineral species in ore #194
Mineral Species (14 x 35 mesh)
Number of Percent of Particles Total
Apatite pebbles, total Apatite pebbles with large inclusions @Elrtza Dolomiteb
Apatite pebbles, total Apatite pebbles with large inclusions Quartza Dolomiteb
479 45.4 (85) ---- 392 37.2 184
1055 17.4
100.0
377 28.2 (40) ---- 767 57.3
a Feldspar was included with quarts for this counting procedure.
b Due to the friable nature of part of the dolomite in these samples, this material tended to break apart and pluck from the epoxy during polishing. Therefore, the values for the dolomite particles are not truly representative of the samples.
electron images as a map of particles identified in table 11. 20X.
24

25

26
28

Table 11. Mineral Particles in Cross Section Shown in Figure 4
Number Mineral a Number Min&al a
1 Apatite 2 Apatite 3 Apatite with quartz inclusions 4 Apatite with quartz inclusions 5 Apatite and dolomite with feldspar 6 Apatite
7 8 9
10
8:Z Apatite Dolomite
11 Apatite
12 GW- I.3 Apatite 14 Clue 15 Apatite 16 Qu-
17 18 I.9
20 21 22 23
Apatite 40 !JlJ* 41 Apatite 42
Apatite Apatite Apatite Apatite
ii 26 27
43
2 46
Apatite GM- Apatite Quartz
Apatite Apatite with quartz
inclusions Apatite QUA QU=-tZ Apatite with quartz
inclusions Apatite with holes b
EC%
Qu* Apatite withe
inclusions Apatite Apatite Quartz with
inclusionsd Dolomite Apatite
a Mineral identification was based on the EDX spectra for the particles shown in Figure 1.
b Holes were left when minerals were plucked out during polishing. c Inclusions contained Mg, Si, P, Ca and Ti. d Inclusions contained Mg, Si and Ti.

PROCESS DEVELOPMENT STUDIES
Based on heavy liquid separation and mineralogic characterization results, as well as the
high MgO content of sample #194, this sample (#194) was selected for systematic process
development studies involving carbonate-phosphate flotation.
Flotation Feed Preparation
The W.R. Grace sample # 194 was prepared by wet screening at 35 mesh and desliming at 150
mesh. The original 35 x 150 size fraction in the sample was intended to be used as flotation
feed, but the quantity present was not sufficient to perform all the planned tests. Therefore, the
plus 35-mesh pebble and coarse fraction were combined and stage crushed in a roll crusher to
minus 35 mesh and deslimed at 150 mesh. The resulting 35 x 150 mesh fraction was mixed
with the original 35 x 150 mesh fraction of the matrix to prepare about 200 pounds of flotation
feed. The feed preparation flowsheet is shown in figure 13.
Chemical analysis of the mixed 35 x 150 mesh material, as prepared above, gave
approximately 10% P2O5, 1% MgO, 11% CaO, and 65% insol. Heavy liquid separation of
representative sample of the flotation feed material, at specific gravities of 2.95 and 2.75,
indicated that the apatite particles were not completely liberated from the dolomite and
quartz. The heavy fraction (sink 2.95 Sp. Gr.) analyzed 31.4% P 2O5, 0.6% MgO, and 3% insol,
with attendant P2O5 recovery of about 56%. The intermediate fraction (float 2.95 sink 2.72)
analyzed 21.4% P205, 5.4% MgO, and 4.7% insol representing about 40% of the total P2O5 in
the sample. The balance of the P2O5 reported to the light fraction (float 2.72) which gave 0.5%
P2O5, 0.2% MgO and 97.7% insol. The sink/float results suggest that about 56% of the
phosphate particles were completely liberated and up to 40% were locked carbonate/phosphate
particles. The siliceous impurities were about 92% free. The data also suggest that the
maximum phosphate concentrate grade to be produced from the prepared flotation feed would
be about 32% P2 O5 and 0.6% MgO at about 66% P2O5 recovery. Higher phosphate recovery
would result in a decrease in the P2 O5 grade and an increase in the MgO content (above 0.6%) of
the concentrate.
30

Run-of-Mine [ROM)
Ir Cone and Quartering
I I
+4mesh
95 mesh 4
*
* Stage Crushing in Roll Crusher
Attrith and Wet &reen@150mesh
t t 150x0 35x150 3sx1!io 150x0
Primary Slimes Flotation Feed Flotation Feed secondary slimes
Figure 13. Sample Preparation Flowsheet
31

The tests in this part of the investigation were aimed at determining the most critical
flotation parameters and developing a standard flotation procedure. In most cases, test series
were statistically designed to limit the number of tests required.
Experimental Design
In all statistically designed test series, the experimental design selected was the full
factorial design. This ensured that adequate data were taken to provide an unbiased estimate
of all linear factor and cross-factor responses. Starpoints, which are needed to estimate non-
linear factor responses were included in the optimization test series and in some reagent
screening tests. The mainframe packages - Statistical Analysis Software (SAS) and Statistical
Package for Social Sciences (SPSS) - were used for analysis of data from statistically designed
tests.
[13]The notation used for the full factorial designs follows the standard "Yates" notation
The label for each factorial experiment is composed of combinations of the letters “A”, “B”, or
“C”. The presence of any letter indicates that the factor is held at its high value, while the
absence of any particular letter indicates that the factor is held at its low value. For example,
in table 14, “AC” implies that the collector is 2.25 kg/ton, the pH is 4.5 and the pulp solids is
24%. The symbol “(1)” is used to represent the experiment in which all factor levels are low.
The same symbols are used to represent the factor responses; the symbol “AB” indicates a factor
response based on the joint response of collector level and the pH. The symbol for the
independent response of pH would be “B".
modification to “M" with the addition of the symbol for the factor levels being modified and a
“+” or “-” to indicate whether the modified factor level is high or low. The symbol “MB+”
indicates that the pH level is high while all other factors are at midpoint level.
32
The notation for mid-point experiments is "M". The notation for "star" points is a
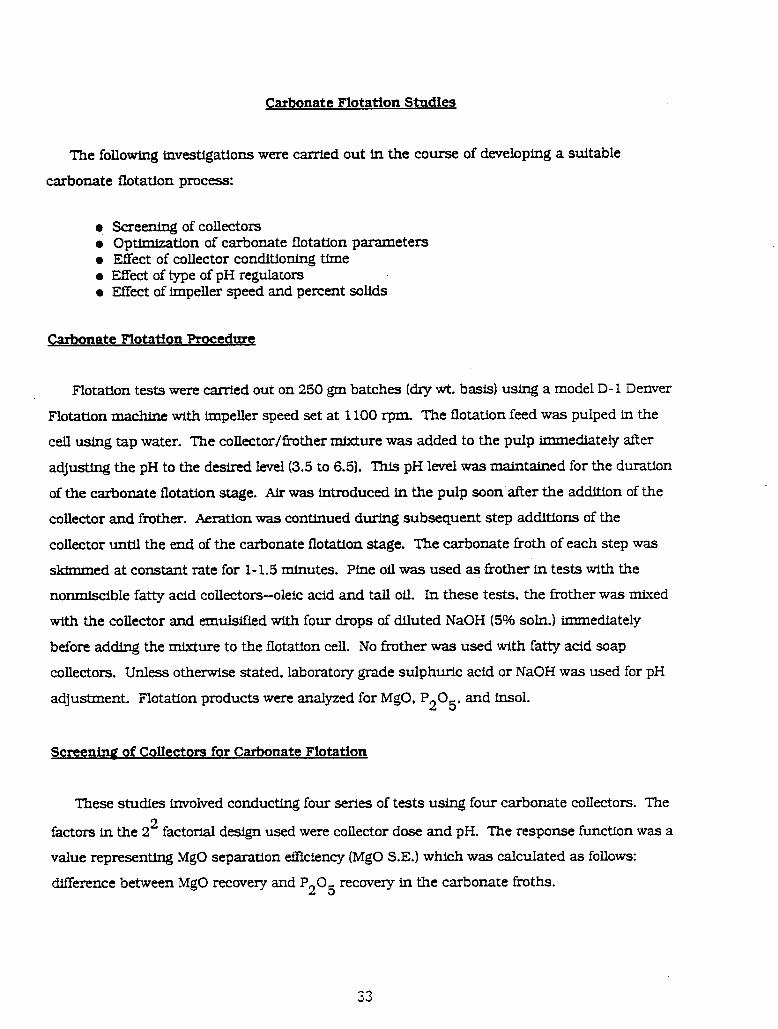
Carbonate FIotation Studies
The following investigations were carried out in the course of developing a suitable
carbonate flotation process:
0 Screening of collectors a Optimization of carbonate flotation parameters 0 EEect of collector conditioning time l EIkct of type of pH regulators l Effect of impeller speed and percent sohds
Cahmate Flotation Procedure
Flotation tests were carried out on 250 gm batches (dry wt. basis) using a model D-l Denver
Flotation machine with impeller speed set at 1100 rpm. The flotation feed was pulped in the
cell using tap water. The collector/frother mixture was added to the pulp immediately after
adjustlng the pH to the desired level (3.5 to 6.5). This pH level was maintained for the duration
of the carbonate flotation stage. Air was introduced in the pulp soon after the addition of the
collector and frother. Aeration was continued during subsequent step additions of the
collector until the end of the carbonate flotation stage. The carbonate froth of each step was
skimmed at constant rate for l-l.5 minutes. Pine oil was used as fkother in tests with the
nonmlscible fatty acid collectors--oleic acid and tall oil. In these tests, the frother was mixed
with the collector and emulsified with four drops of diluted NaOH (5Oh soln.) immediately
before adding the mixture to the flotation cell. No frother was used with fatty acid soap
collectors. Unless otherwise stated. laboratory grade sulphurlc acid or NaOH was used for pH
adjustment. Flotation products were analyzed for MgO, P205, and insol.
ScreeninP of Collectors for Carbonate Flotation
These studies involved conducting four series of tests using four carbonate collectors. The
factors in the 2z factorial design used were collector dose and pH. The response function was a
value representing MgO separation &iciency (MgO S.E.) which was calculated as follows:
difference between MgO recovery and P205 recovery in the carbonate froths.
33

MgO S.E. = RCf - RPf
where: RC f and RPf are the MgO recovery and P2O5 recovery in the carbonate froth. A high
MgO separation efficiency implies high recovery with good discrimination between carbonate
gangue minerals and phosphate minerals.
This calculation is based on Gaudin’s coefficient of separation equation as detailed by
Schulz[14]. The four collectors tested were reagent grade oleic acid, tall oil, OA-5 (a sodium salt
of sulfonated oleic acid) and a fatty acid soap from W.R. Grace, which will be designated "WRG".
For the fatty acids, the two collector levels tested were 0.75 kg/t and 2.25 kg/t with 1.5 kg/t
as center point. For the fatty acid salts, the two levels were 0.26 kg/t and 0.78 kg/t with 0.52
kg/t as replicate center point. Generally, the required amount of collector was added in three
equal steps. The pH levels were maintained at 4.5 and 6.5, with 5.5 as center-point for the fatty
acid tests, while for the fatty acid salts, the pH levels were 3.5 and 5.5, with 4.5 replicate
centerpoint. The test designs are shown in table 12 along with the response for each test. All
linear least squares analyses of data sets were done with MgO separation efficiency in the froth
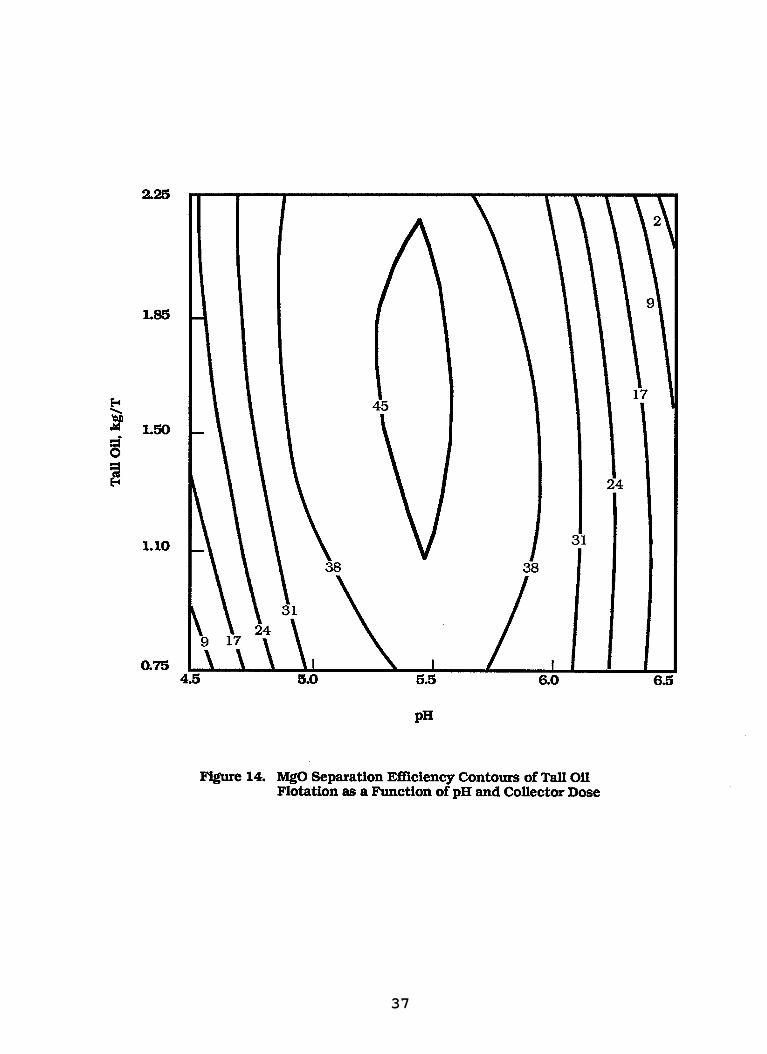
product as the dependent variable. The coefficients shown in table 13 were obtained from the
least squares analyses of the response data set and were used to generate the response surfaces
shown in figures 14-16 for tall oil, oleic acid and OA-5, respectively. Spot testing with WRG
soap collector showed no selectivity for carbonate flotation and was therefore not tested in a
factorial design.
The results shown in figures 14 and 15 indicate that the two fatty acid collectors gave
similar responses. However, the oleic acid was the better of the two, with an optimum MgO
separation efficiency of more than 54% at pH 5.5 and collector dose of 1.5 kg/t. It is worth
noting that the tall oil system is much more pH sensitive than the oleic acid system. As
compared to fatty acid collectors, the results of tests with OA-5 (figure 16) were not as good and
they indicated more data, at star-points, were needed to delineate regions of curvature.
However, selective carbonate flotation required highly acidic pH’s in the range of 3-3.5. It was
difficult to maintain the pulp pH at this undesirable low level without using excessive pH
regulator. Therefore, it was decided that the oleic acid was preferable and testing with OA-5
was discontinued.
34

Table 12. Experimental Design for Screening of Carbonate Flotation Collectors
Collector Experiment * Notation
IAl Collector Dose,kg/T
Tall Oil (1) 0.75 A 2.25 B 0.75
AB 2.25 M 1.50 M 1.50 M 1.50
MA- 0.75 MB- 1.50
Oleic Acid (1) A B
AB M M
MA- MB-
0.75 2.25 0.75 2.25 1.50
OA-6 (1) 0.26 A 0.78 B 0.26
AB 0.78 M 0.52 M 0.52
4.5
t-2 6:5 5.5
E 4:5
3.5 3.5
Ei 4:5 4.5
3.1 20.0 11.2 -0.1 39.9 40.8 60.6 40.1 14.7
10.1 16.4 30.3 27.6 58.2 54.9 40.1 26.6
19.3 45.0 34.8 17.0 24.3 26.7
* Listed in Standard Yates Order (Davies 1954)
35
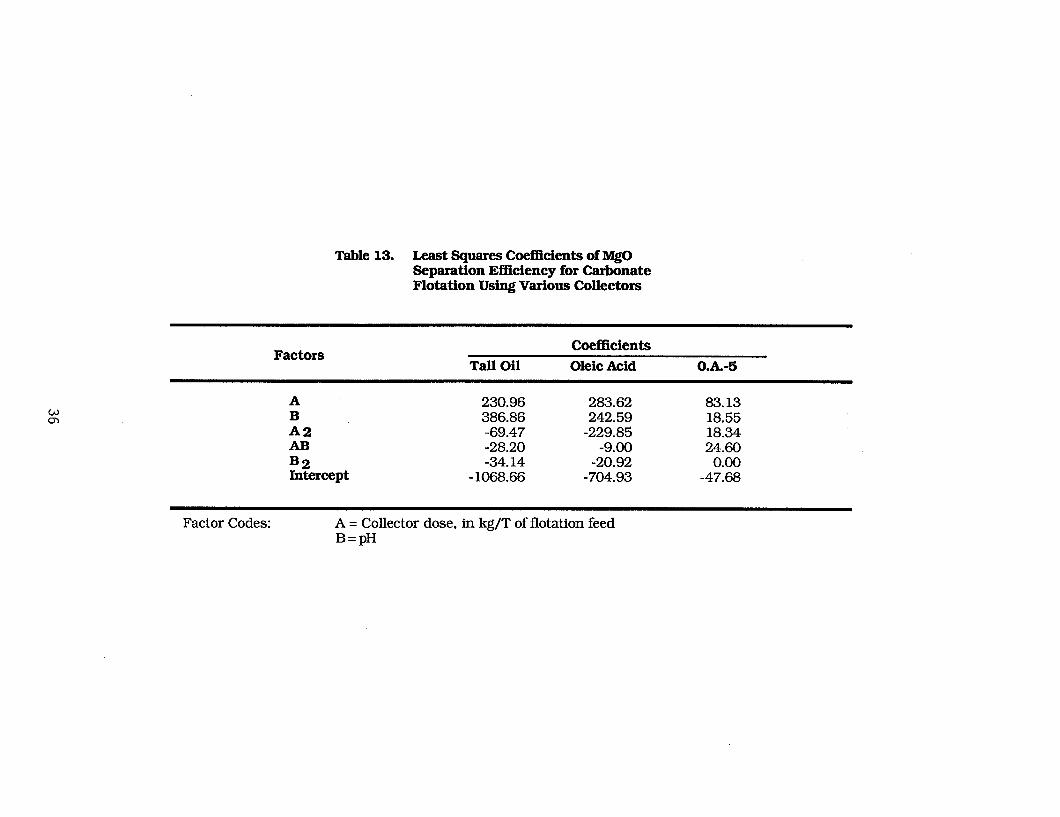
Table 13. Least Squares Coefficients of MgO Separation Efficiency for Carbonate Flotation Using Various Collectors
Factors Tall Oil
Coefficients
Oleic Acid O.k-5
A 230.96 263.62 63.13 B 386.86 242.59 18.55 A2 -69.47 -229.85 18.34 AB -28.20 -9.00 24.60 B2 -34.14 -20.92 0.00 Intercept - 1068.66 -704.93 -47.68
Factor Codes: A = Collector dose, in kg/T of flotation feed B=pH
37


39
Based on the above results (and the fact that oleic acid has a simple chemical composition)
oleic acid was selected for further test work, involving the optimization of carbonate flotation
parameters and effect of type of pH regulator.
Optimization of Carbonate Flotation Parameters
The carbonate flotation parameters pH, collector dose and pulp density were optimized in a
23 factorial design with five replicate centerpoints and six starpoints. The design is shown in
table 14.
The response variables used in the statistical evaluation of test data were MgO grade of the
froth and the MgO recovery. In addition, as was done in the reagent screening study above, MgO
separation efficiency (MgO S.E.) was used as a response function.
Factorial Analysis: Table 15 summarizes the factorial analysis results for the subset of data
representing the full-factorial design. The response column is the MgO separation efficiency,
MgO grade or recovery for the experiment listed in the column under “Expt”. The values under
“Effect” represent the change in response as factors change from low to high levels. The largest
effect for separation efficiency is minus 19.52 as the pH rises from pH 4.5 to 6.5 and as the
collector dose increases from 0.75 kg/t to 2.25 kg/t.
The midpoint replicates provide an estimate of the experimental variance associated with
the observed responses. An implicit assumption is made that all effects are linear responses to
linear changes in factor levels. A test of this assumption is provided by the comparison
between the response average and the average of the midpoint replicates. If the assumption is
true, these averages should be the same within experimental error. In the present case the
averages are substantially different, which implies that large nonlinear responses exist. This
is consistent with previous experience with these phosphatic materials, which shows that pH
effects especially are non-linear. In the columns for MgO grade and MgO recovery, one can see
that pH effects are quite dominant. This dominance may be masking other factor effects, thus
making the data difficult to analyze. Unfortunately, there is no way to analyze the data
without such interference from pH effects.
40

Table 14. Experimental Design for Optimization of Carbonate Flotation Parameters
*Expy [Al
Collector Dose, kg/T
[Bl ICI
PH Solids, % ii!!? %*’
Grade, %
(1) 0.75 4.5 A 2.25 4.5 B 0.75 6.5
AB 2.25 6.5 C 0.75 4.5
AC 2.25 4.5 Bc 0.75 6.5
ABC 2.25 6.5
8 8
: 24 24 24 24
21.4 16.90 21.7 31.9 15.80 32.3 38.6 2.72 72.1
5.7 1.60 88.5 17.7 15.85 17.9 48.5 16.89 49.8
1.9 2.12 78.1 -2.0 1.20 95.4
M 1.50 5.5 16 58.2 11.88 63.0 M 1.50 Z:i: 16 65.3 12.34 70.9 M 1.50 16 60.6 11.55 66.9 M 1.50 16 58.5 12.15 62.6 M 1.50 16 58.3 13.46 61.1
MA+ 2.25 E 16 27.0 4.01 83.0 MA- 0.75 MB+ 1.50 6:5
16 40.9 7.69 48.8 16 14.1 2.39 66.9
MB- 1.50 4.5 16 15.6 14.50 15.9 MC+ 1.50 24 55.5 9.49 66.7 MC- 1.50 8 58.6 13.60 61.1
* Listed in Standard Yates Order (Davies 1954)
41
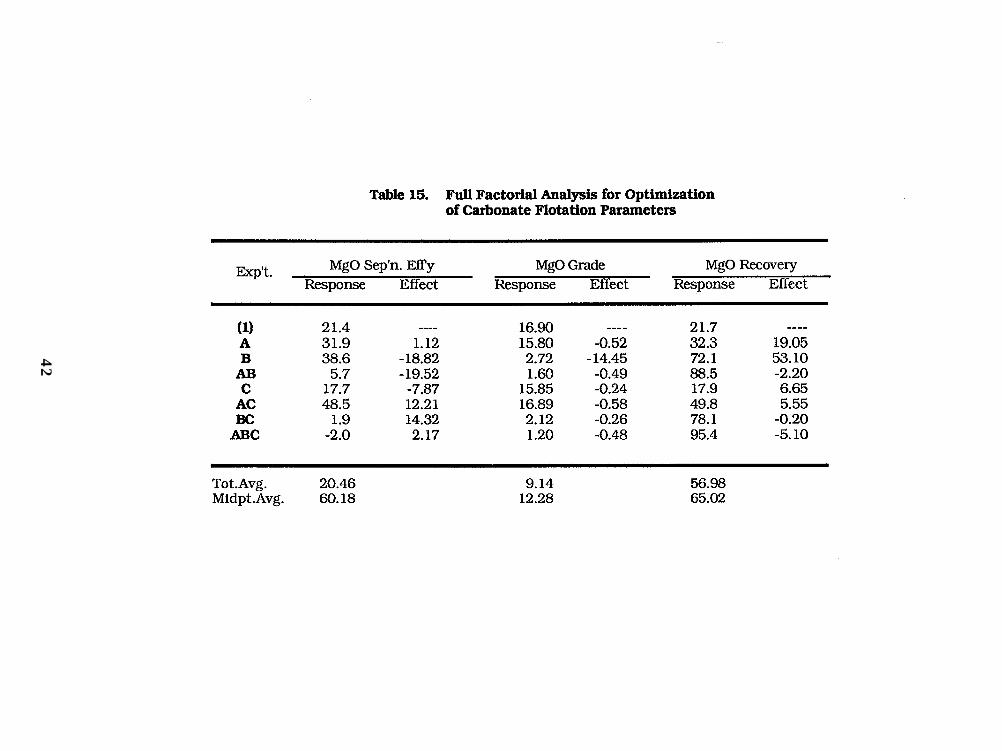
Table 15. Full Factorial Analysis for Optimization of Carbonate Flotation Parameters
ExpT. MgO Sep’n. Efi’y MgO Grade
Response Effect Response Effect
MgO Recovery
Response Effect
(1) 21.4 --__ 16.90 ---- 21.7 ---- A 31.9 1.12 15.80 -0.52 32.3 19.05 B 38.6 -18.82 2.72 - .14.45 72.1 53.10
AB 5.7 -19.52 1.60 -0.49 88.5 -2.20 C 17.7 -7.87 15.85 -0.24 17.9 6.65
AC 48.5 12.21 16.89 -0.58 49.8 5.55 Bc 1.9 14.32 2.12 -0.26 78.1 -0.20
ABC -2.0 2.17 1.20 -0.48 95.4 -5.10
Tot.Avg. 20.46 9.14 56.98 Midpt.Avg. 60.18 12.28 65.02
42

Separation Efficiencv Modeling: Response surfaces were generated with MgO separation
efficiency as the dependent variable, and the pH, pulp percent solids and oleic acid dose as
independent variables. The response model for MgO S.E. used for generating the contours is
shown in table 16. It was not possible to graphically show a dependent variable from three
predictors (i.e. a four dimensional representation) so response surfaces at 8, 16, and 24% solids
are shown in figures 17, 18, and 19, respectively.
The contours show that the region of best response shifts toward lower pH and higher
collector dose, as the pulp percent solids is increased. In addition to a higher collector dose, a
lower pH implies higher pH regulator consumption. However, because dilute slurries are
usually uneconomical, a pulp percent solids higher than 8% was preferable. Hence, 16% was
considered to be the optimum percent solids. From the response surface figure for 16% solids, a
pH of 5.5 and a collector dose of 1.5 kg/t oleic acid was considered optimum conditions.
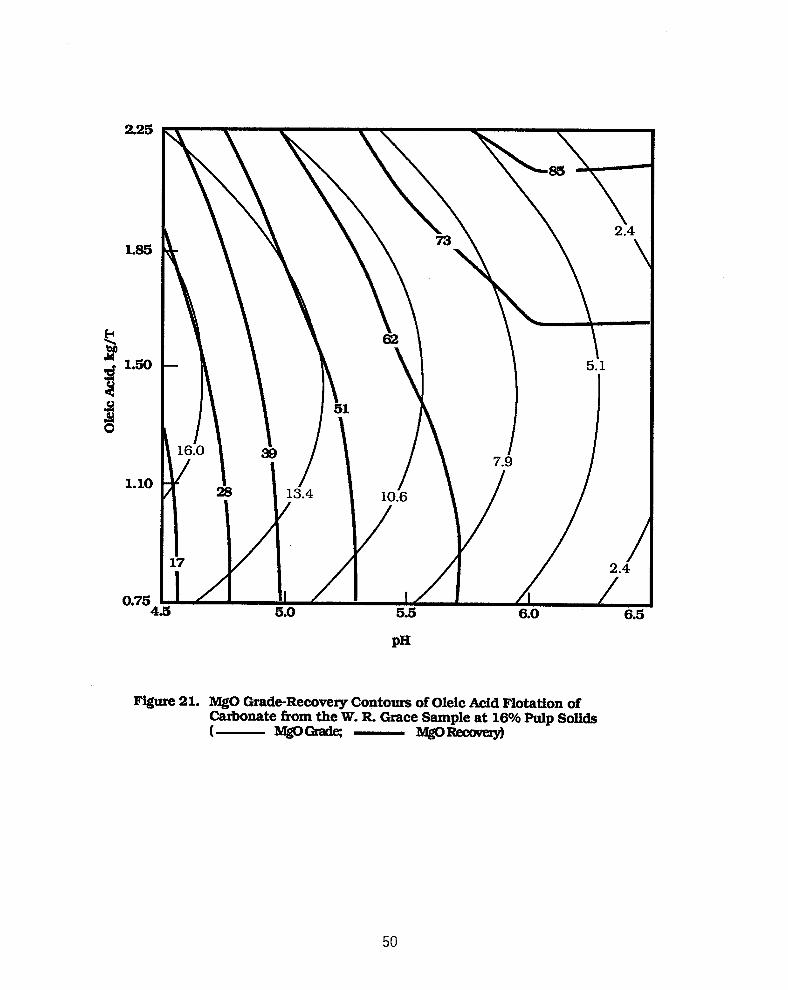
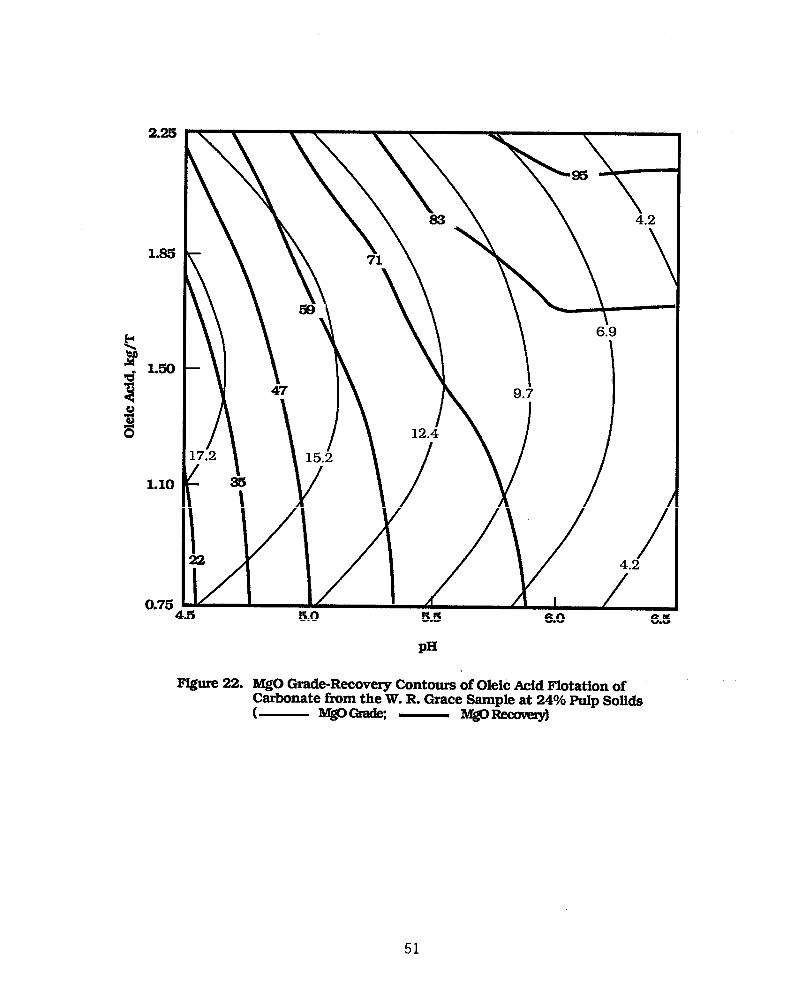
Grade-Recovery Models
MgO grade and recovery response surface contours of carbonate flotation, as a function of
pH and oleic acid dose, were plotted using the response model in table 17 and are shown in
figures 20 to 22. The grade and recovery figures confirm earlier conclusions, based on MgO
separation efficiency, that the optimum conditions for carbonate flotation are at around pH
5.5, 1.5 kg/t oleic acid and 16% pulp solids.
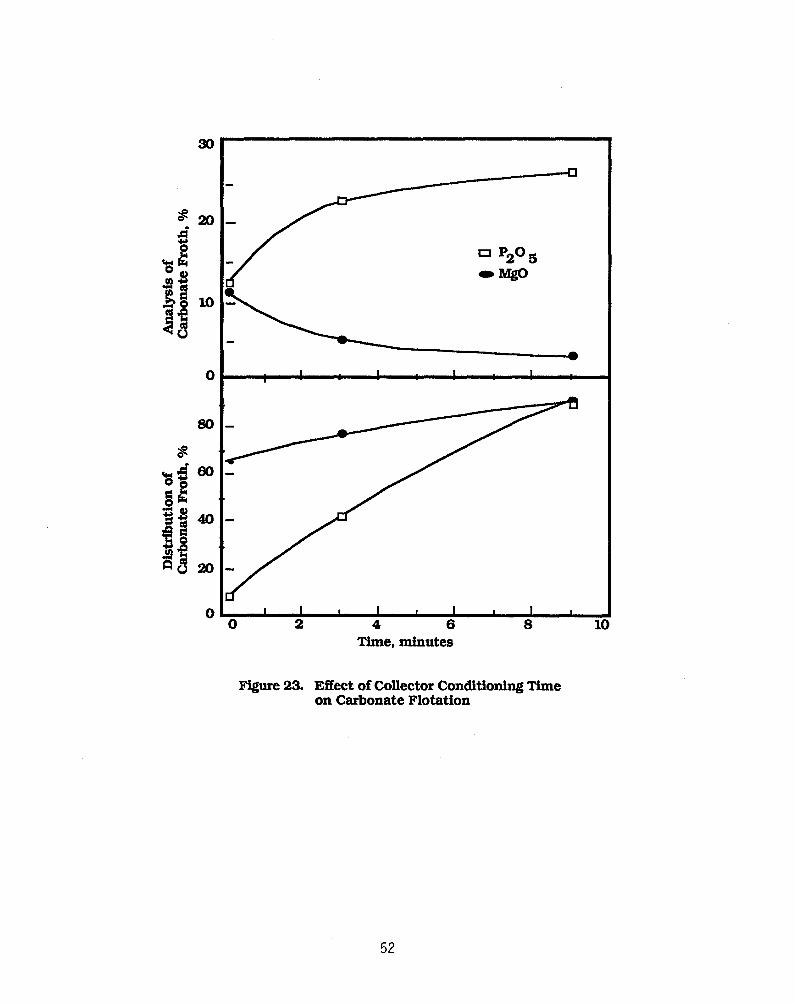
Effect of Collector Conditioning
The effect of conditioning the pulp with the oleic acid collector prior to aeration was
studied under conditions stated above - pH 5.5, 1.5 kg/t oleic acid and 16% pulp solids. The
results are shown in figure 23. The conditioning times shown are the totals for the 3-stage
collector additions, i.e. 3 minute conditioning time means 1 minute for each addition,
The results show that conditioning the pulp with the oleic acid collector prior to carbonate
flotation had a deleterious effect on the selectivity of the carbonate/phosphate separation, as
the amounts of phosphate material reporting to the carbonate froth increased substantially
with conditioning time. Figure 24 shows the point count mineralogic analysis of the three
43
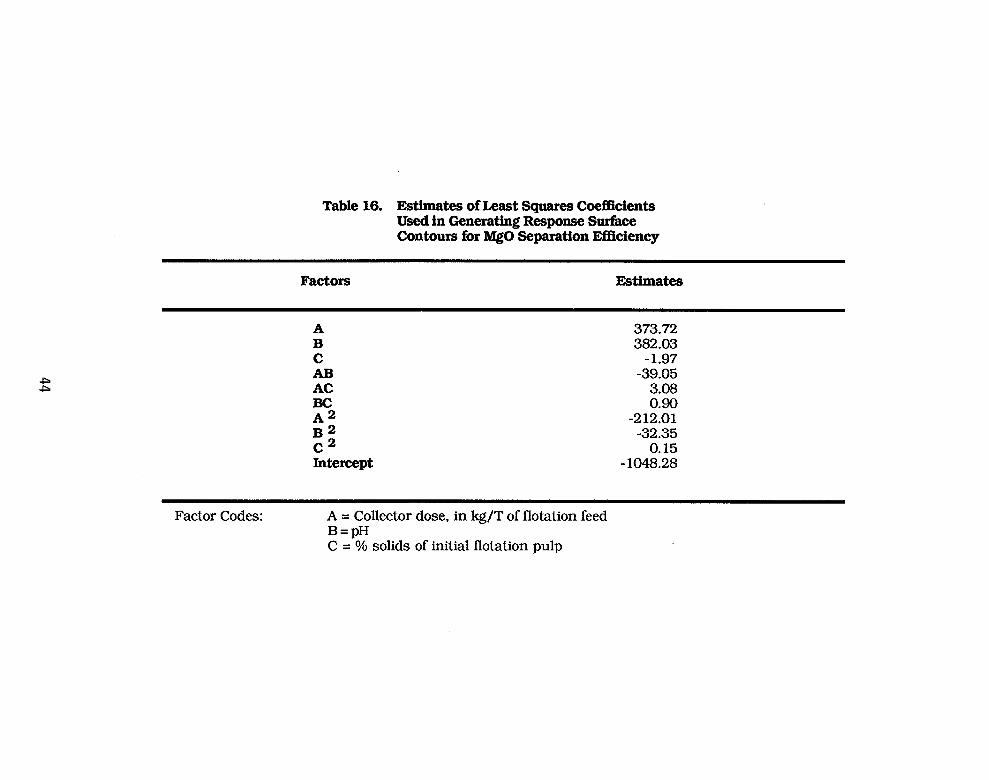
Table 16. Estimates of Least Squares Coefficients Used in Generating Response Surface Contours for MgO Separation Efficiency
Factors Estimates
A B c AB AC Bc A2
$
Intercept
373.72 382.03
-1.97 -39.05
3.08 0.90
-2 12.01 -32.35
0.15 - 1048.28
Factor Codes: A = Collector dose, in kg/T of flotation feed B=pH C = % solids of initial flotation pulp


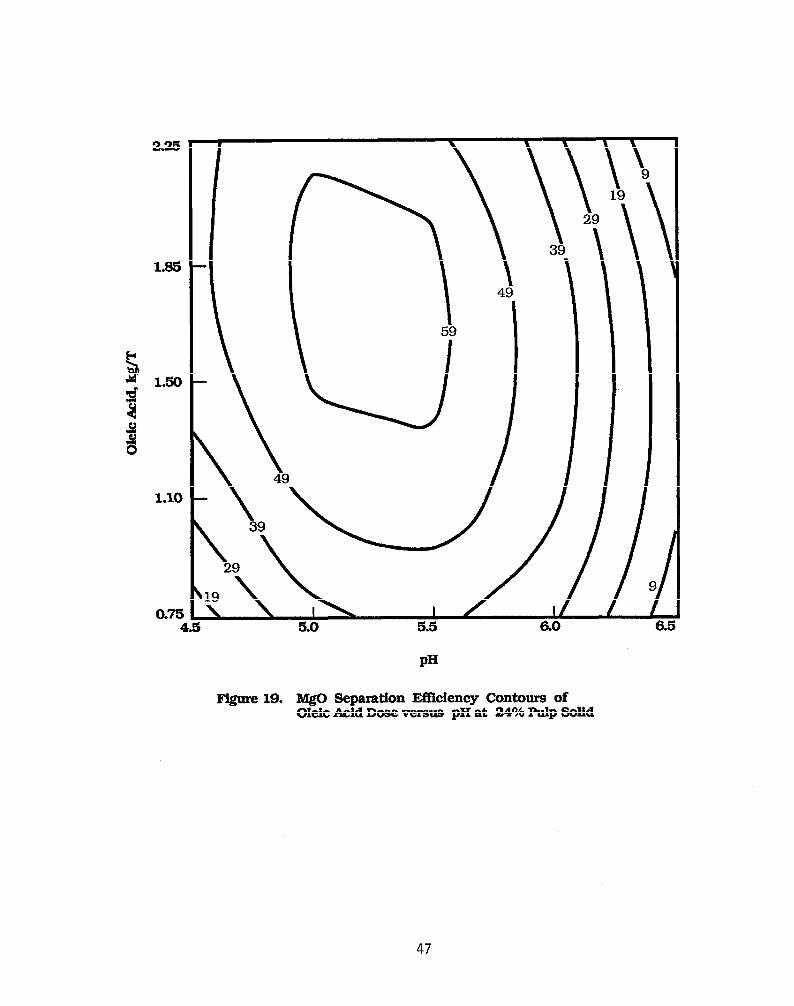
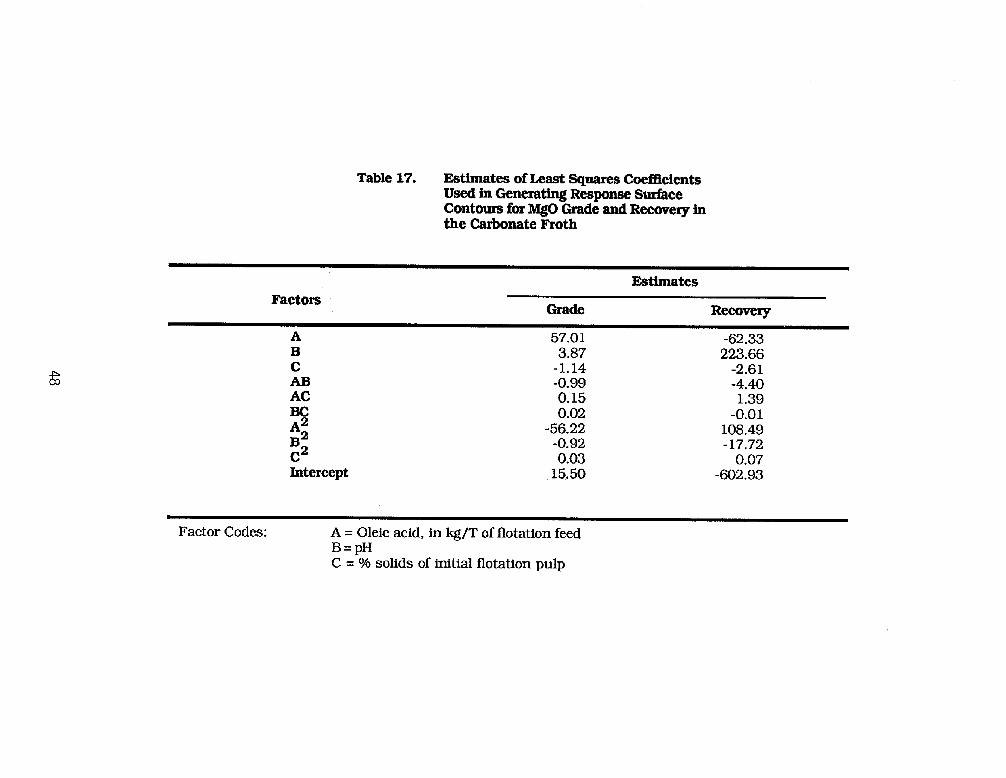
Table 17. Estimates of Least Squares Coefficients Used in Generating Response Surface Contours for MgO Grade and Recovery in the Carbonate Froth
Factors EMhates
Grade Recovery
A 57.01 -62.33 I3 3.87 223.66 C -1.14 -2.61
-0.99 -4.40 AC 0.15 1.39 Bc ii; 0.02 -56.22 -0.92 0.03 108.49 -17.72 -0.01
0.07 Intercept 15.50 -602.93
Factor Codes: A = Oleic acid, in kg/T of flotation feed B=pH C = % solids of initial flotation pulp

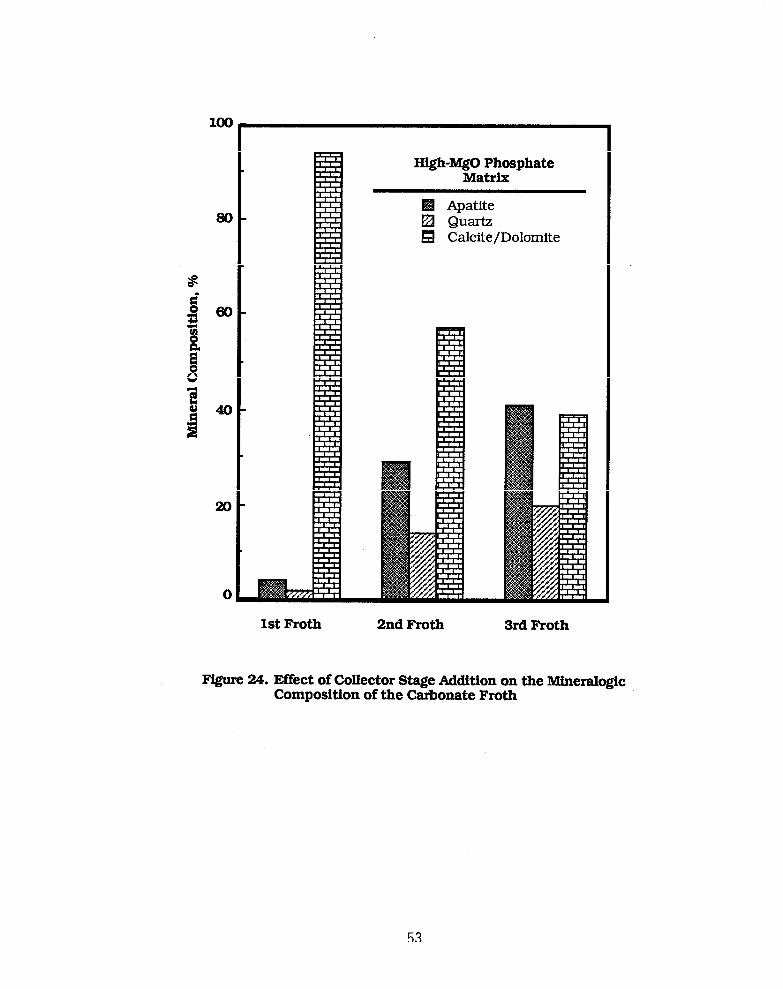

carbonate froth products obtained at “instant” or “zero” collector conditioning time. The first
froth recovered was essentially composed of calcite and dolomite. With each stage of collector
addition, the carbonate froth products recovered became more and more contaminated with
apatite and quartz minerals. Thus, most of the carbonate gangue minerals were removed at the
earliest stages of carbonate flotation. The phosphate losses in the froth were mainly due to the
longer pulp mixing during the later stages of flotation and possible apatite activation under
slightly acidic conditions of pH 5.5. This confirmed the merit of “no conditioning”, or fast
flotation kinetics in selective carbonate/phosphate separation by fatty acid collectors under
slightly acidic conditions. The mechanism by which selectivity was achieved is discussed
under the surface chemical studies section.
Effect of Mode of Collector Addition
Tests were made to study the effect of mode of collector addition on carbonate flotation
results. Collector addition, in one step, resulted in poor dolomite rejection as compared to
starvation addition of the collector in two or three steps. As shown in table 18, addition of 1.5
kg/ton oleic acid in one step removed about 40% of the dolomite in the carbonate froth. On the
other hand, addition of the same collector dose in two or three equal steps, i.e., doses of 0.75
kg/ton or 0.5 kg/ton, respectively, resulted in substantially higher MgO rejections of about
60% and 66%. As shown in figure 24, starvation addition of the collector in three steps
enhanced the selectivity of carbonate/phosphate separation during the early stages of
flotation and maximized dolomite removal in the froth. The technique was used to determine
the optimum collector dose required to complete dolomite flotation and avoid excessive P2O5
losses. The importance of this factor in the phosphate recovery step will be discussed under the
section on phosphate flotation.
Effect of Amount of Frother
Tests were conducted to study the effect of increasing additions of pine oil as frother in
carbonate flotation. Results of these tests (table 19) indicated that pine oil frother additions of
0.25 kg/ton or more substantially improved carbonate flotation and provided better froth
stability. However, as shown in table 19, flotation without a frother was also possible
indicating that the collector had considerable frothing properties under slightly acidic
conditions of pH 5.5.
54
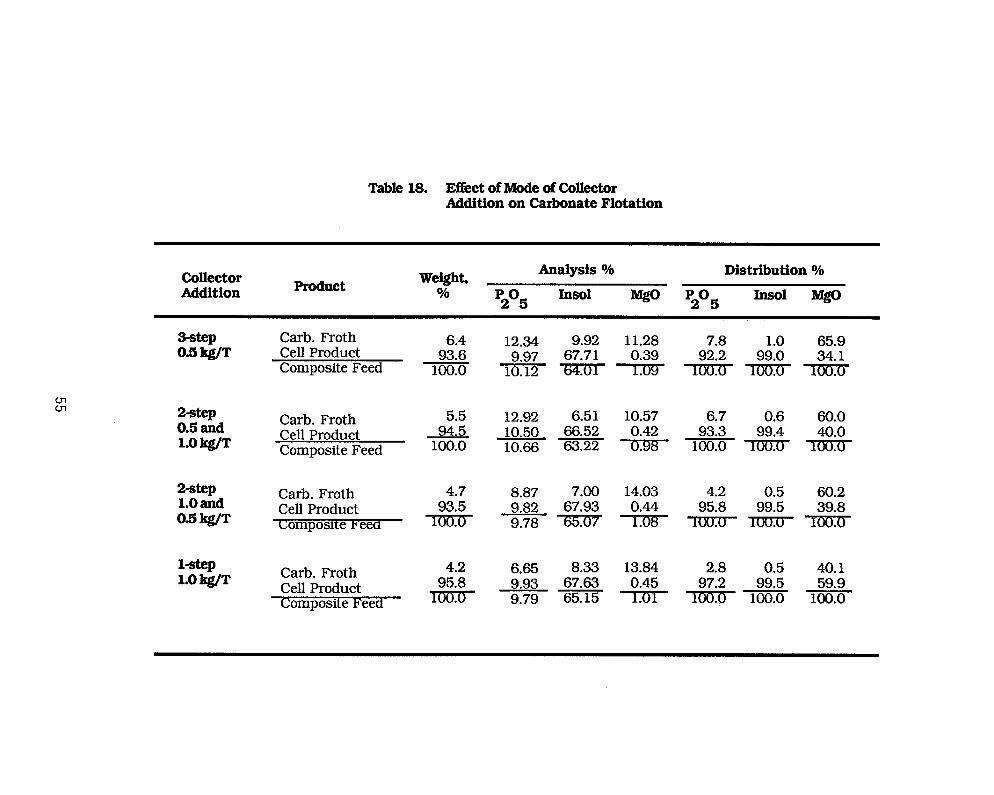
Table 18. Effect of Mode of Collector Addition on Carbonate Flotation
collector Addition Fwduct Weight, Analysis % Distribution %
% Go5
Ins01 lMgo so5
Ins01 Mgo
3-steP 0.5 kg/T
Carb. Froth 6.4 Cell Product 93.6 Composite Feed 100.0
%teP 0.5 and 1.0 kg/T
Carb. Froth Cell Product Composite Feed
5.5 6.51 10.57 6.7 0.6 60.0 12.92 945 1oo.o 10.50 66.52 0.42
10.66 63.22 0.98
2-step 1.0 and 0.5 kg/T
Carb. Froth Cell Product composite reecl
4.7 8.87 7.00 14.03 4.2 0.5 60.2 93.5
1oo.o
&Stttp 1.0 kg/T Carb. Froth Cell Product Composite Feed
4.2 6.65 8.33 13.84 2.8 0.5 40.1 95.8 9.93 67.63 0.45 97.2
1oo.o 9.79 65.15 1.01 1oo.o 99.5 59.9
100.0 100.0
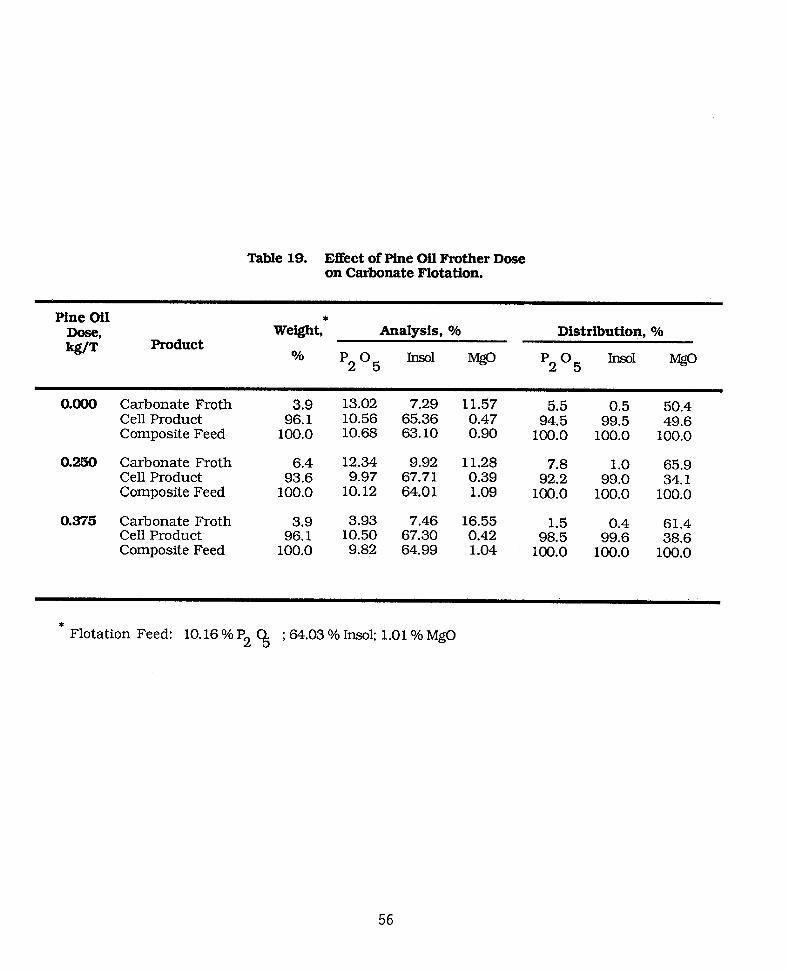
Table 19. Effect of Pine Oil Frother Dose on Carbonate Flotation.
Pine Oil
Product Weight,* Analysis, % Distribution, %
% ‘2’5 Ir-Eol w PO Insol MgO
2 5
0.000 Carbonate Froth 3.9 13.02 7.29 1157 5.5 0.5 50.4 Cell Product 96.1 10.56 65.36 0.47 94.5 99.5 49.6 Composite Feed 100.0 10.68 63.10 0.90 100.0 100.0 100.0
0.250 Carbonate Froth 6.4 12.34 9.92 11.28 7.8 1.0 65.9 Cell Product 93.6 9.97 67.71 0.39 92.2 99.0 34.1 Composite Feed 100.0 10.12 64.01 1.09 100.0 100.0 100.0
0.375 Carbonate Froth 3.9 3.93 7.46 16.55 1.5 0.4 61.4 Cell Product 96.1 10.50 67.30 0.42 98.5 99.6 38.6 Composite Feed 100.0 9.82 64.99 1.04 100.0 100.0 100.0
* Flotation Feed: 10.16 % P2 C& ; 64.03%lnso~ 1.01 %MgO
56

Effect of Type of pH Regulator
Because of their reactivity with carbonate and phosphate minerals, various inorganic
acids were tested as pH modifiers. Table 20 shows the results of carbonate flotation using 1.5
kg/t oleic acid collector, and different amounts of the inorganic acids, HNO3 , HCl, HF, H2SO4 ,
and H3PO4 , to achieve constant pH of 5.5. The data indicate that the type of pH modifier played
a significant role in determining the grade and recovery of MgO in the carbonate froth. For
example, the use of the monovalent acids HNO3, HCl, and HF yielded froths which contained
about 76% of the MgO in the raw feed. The di- and trivalent acids H2SO4 and H3PO4 gave
slightly lower MgO recoveries: 73 and 68%. respectively. However, use of the H2SO4 and H3PO4
produced relatively clean carbonate froths as shown in table 20 (see products 1 and 2). Based on
selectivity and cost effectiveness. H2SO4 appears to be the best choice of pH modifier for
carbonate flotation.
Effect of Impeller Speed and Percent Solids on Carbonate Flotation
As a prelude to establishing a standard flotation procedure for testing various samples of
high MgO phosphates, it was decided that the effect of pulp solids and impeller speed on the
carbonate flotation step required further study. The two factors were then tested in a 22 central
composite design using sample #194.
As was done during initial carbonate flotation studies, the MgO grade and recovery in the
carbonate froth product, as well as MgO separation efficiency, were each used as a measure of
test response. The test conditions are shown in table 21 along with the three responses for each
test. The response model surface contours obtained are shown in figures 25-27.
Although the test conditions were different from those of previous tests with regard to
duration of froth skimming (1 minute each) and air flow rate (2.5 SLPM), the results indicate
that low impeller speeds and low percent solids favor higher MgO separation efficiencies, as
shown in figure 25. Examination of figures 26 and 27 showed that the higher MgO separation
efficiencies, in the low solids/low impeller speed region, were due to the higher carbonate
grades of the carbonate froth obtained in that region. It, therefore, appeared that for process
57
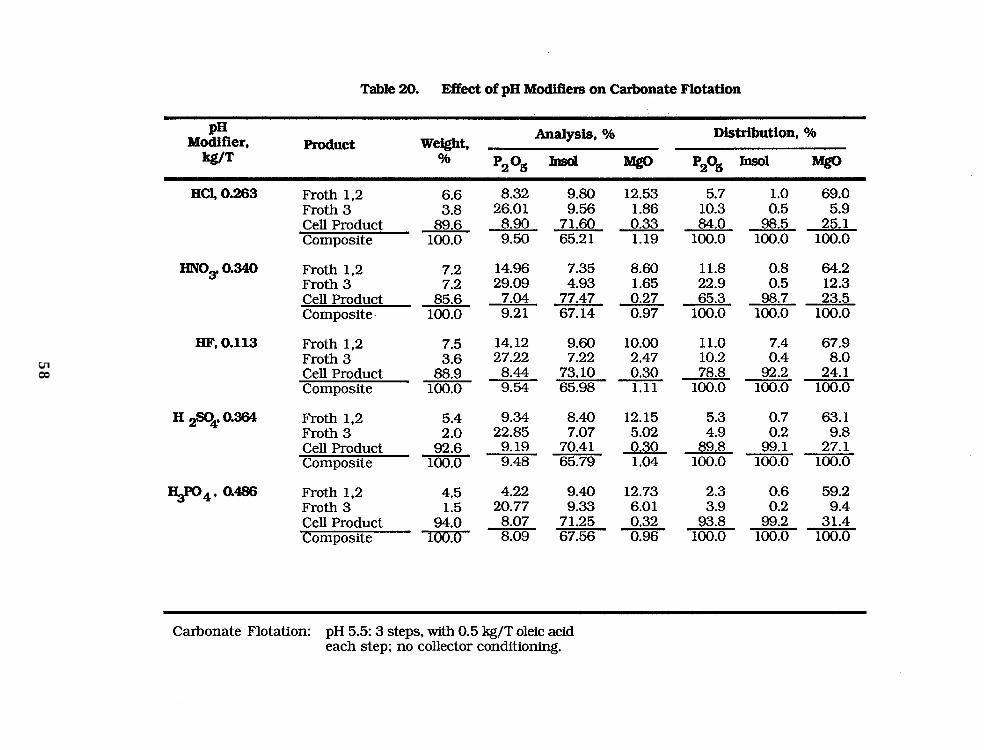
58

Table 21. Experimental Design for the Effect of Impeller Speed and Pulp % Solids on Flotation of Sample #194
Exp’t
Factors
A B Grade, %
Carbonate Froth Products
Nlgo Wfn Recovery, % Efficiency, %
(1) 16 1000 14.35 46.4 44.8
A 32 1000 10.27 36.7 35.5
B 16 1600 8.63 51.4 44.9
AB 32 1600 10.72 49.9 45.4
M 24 1300 7.68 59.8 49.7
MA+ 32 1300 2.63 51.1 10.1
MA- 16 1300 5.77 58.2 41.0
MB+ 24 1600 6.76 47.8 38.9
MB- 24 1000 8.68 48.0 40.1
Carbonate Flotation :
pH adjusted to 5.5; 1.5 kg/T Oleic acid added in stepsof 0.5 kg/T. No phosphate depressant.
No conditioning, Froth skimmed for 1 minute each step.
Factors: A= Pulp Solids, %; B = Impeller Speed, RPM
Phosphate Flotation :
pH adjusted to 6.0; 0.5 kg/T Na Silicate added + 3 minutesconditioning, then 0.25 kg/T Oleic acid added + 2 minutes conditioning. Froth skimmed for 2 minutes. RPM = 1100.
59
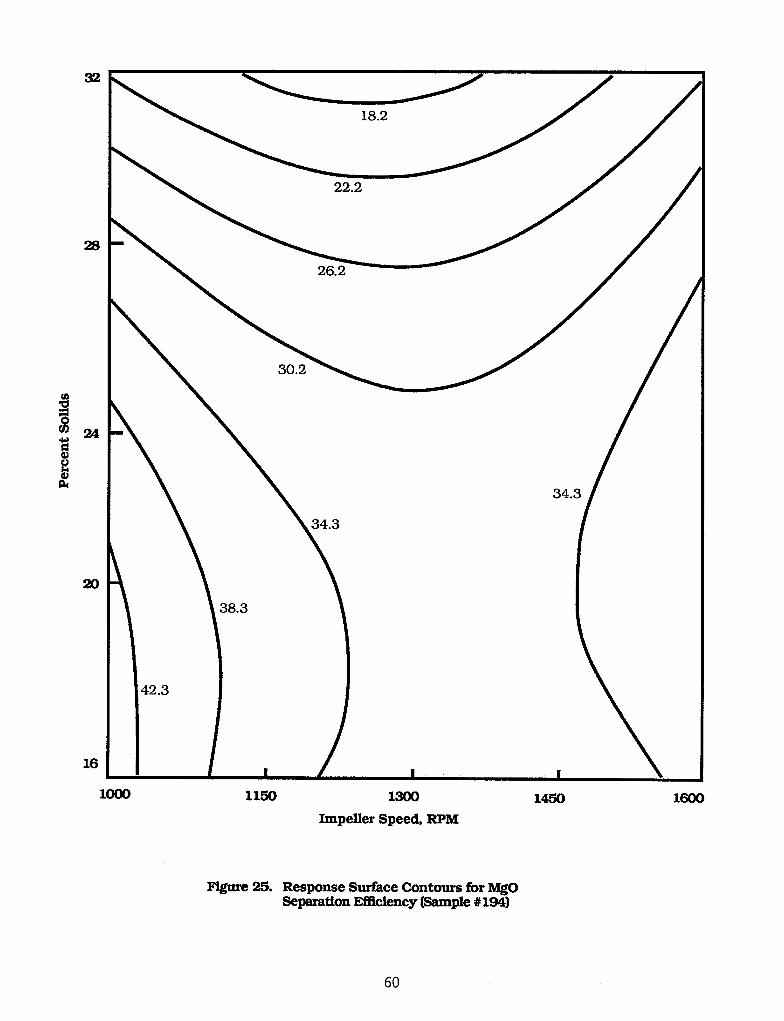


application studies, the pulp solids and impeller speed should be kept at about 16% and 1100
rpm, respectively.
Carbonate Flotation Conclusions
The research has demonstrated that the MRI “no conditioning process” is effective for
selectively floating carbonate gangue minerals from high MgO phosphate matrix obtained
from the Four Corners Mine.
Carbonate froths produced analyzed 10%-14% MgO with MgO rejections up to 75%,
although no specific phosphate depressant was used, and the pulp was not conditioned with the
fatty acid collector prior to flotation.
Pulp pH was observed to be the dominant factor in determining carbonate/phosphate
separation efficiency. The best pH for such separation, using fatty acids, was pH 5.5 for the
Four Corners matrix. Various inorganic acids such as HF, HCl, HNO3, H2SO4 or H3PO4 can be
used as pH modifiers. .Based on selectivity and cost effectiveness, H2SO4 was the preferred pH
modifier.
Fatty acid collectors, such as oleic acid and tall oil, proved to be superior to fatty acid soaps
for carbonate/phosphate separation in acidic pH ranges.
An emulsion of collector/pine oil frother mixture gave the best flotation results.
Starvation addition of the collector/frother mixture in three steps enhanced the selectivity of
separation.
Although the dominant effect of pH may be interpreted to be masking other factor effects,
collector dose was judged to play an important role in carbonate/phosphate separation. Pulp
solids and impeller speed had only marginal effects.
The optimum carbonate flotation conditions recommended for the Four Comers matrix
are : deslimed feed of 35 x 150 mesh, 16% solids, pulp pH 5.5 using about 0.4 kg/t H2SO4 as pH
regulator, 3-step addition of 0.5 kg/ton oleic acid and 0.1 kg/t pine oil mixture for each step, no
collector conditioning, impeller speed 1100 rpm and an air flow rate of 2.5 SLPM.

Phosphate Flotation Studies
The objective of the phosphate flotation part of the investigation was to recover a high
grade marketable phosphate product of 30-31% P2O5. 0.7-1.0% MgO and 8-10% acid insoluble
matter, from the carbonate flotation cell product. For this purpose, bench scale flotation tests
were conducted on the W.R. Grace sample # 194 flotation feed to investigate a number of
phosphate flotation parameters.
Based on previous experience with other Florida ores, and the well established Florida
phosphate flotation practice, exploratory tests were performed under alkaline conditions
(about pH 8.5) using oleic acid as collector and sodium silicate as silica depressant. The test
procedure included preliminary carbonate flotation at the previously defined standard
conditions. The resulting carbonate-free pulp of pH about 5.5 was adjusted to a pH of about 8.5
by using NaOH or NH4OH and followed by conditioning with sodium silicate and oleic acid for
3 minutes each.
The results of phosphate flotation at constant pH of 8.5 and variable collector and
depressant levels are given in table 22. The data indicate that at 0.25 kg/t sodium silicate level,
increasing the addition of collector from 0.1 to 0.5 kg/t improved both the grade and recovery
of the phosphate in the concentrate. This was not the case with the 0.75 kg/t sodium silicate
level which gave lower P2O5 grades and/or recoveries, indicating a depressing effect of the
sodium silicate on flotation of both the siliceous gangue and the phosphate particles. The best
results were obtained at 0.5 kg/t sodium silicate and 0.3 kg/t oleic acid. However, the
phosphate concentrate produced under this condition contained only 21.34% P2O5 and 31.53%
insol. Raising the pH of the pulps to 9-10 by use of either NaOH or NH4OH as pH regulators
failed to improve this flotation result. This indicated that the selectivity of phosphate
flotation separation from the siliceous gangue was poor in the alkaline pH range of 8.5-10. The
lack of selectivity in fatty acid phosphate/silica separation under alkaline conditions may be
due to slime coating or surface contamination of the silica particles by the precipitated Ca-
/Mg- fatty acid salt complexes formed in the pulp.
64

Table 22. Results of Preliminary Tests on the Phosphate Recovery Step
Reagent Dosage, kg/T
Naz so3 Oleic Acid
Product We&W, Analysis % Distribution % %
p2°5 Ins01 p2° s Ins01 MgO
0.25
0.26
0.75
0.75
0.50
0.1
0.5
0.1
0.5
0.3
Carbonate 6.0 11.89 7.83 10.29 7.2 0.7 57.5 Phosphate 43.4 16.04 46.82 0.73 70.4 32.0 29.4 TaiaM~f;~s~ 50.6 4.38 84.37 0.28 22.4 67.3
--mm~W~~~~ Carbonate Phosphate Tailings Composite
Carbonate 6.6 9.51 7.54 Phosphate 29.4 21.11 32.32 Tailirws 64.0 4.67 84.04 Composite 100.0 9.82 63.83
Carbonate Phosphate Tailings Composite
5.0 8.09 8.83 46.4 16.67 46.24 48.6 339 87 15
100.0 AA
9.78 64.28
Carbonate PhosDhate Tail&$ Composite
6.1 8.74 9.30 12.34 5.6 70.9 44.2 19.16 38.00 0.60 89.7 2::: 24.9 49.7 0.90 96.05 0.09 4.7 733 42 -v
100.0 9.45 65.07 1.06 100.0 100.0 100.0
4.9 9.89 8.20 37.7 21.34 31.53
11.55 6.3 0.8 66.9 0.62 63.2 14.9 16.1 0.30 30.5 843 17 0 1.13 100.0
LA 100.0 100.0
12.15 4.1 0.7 62.5 0.56 79.0 33.3 26.9
** 66.0 10.6 . . 100.0 100.0
11.88 4.8 0.6 63.0 0.61 79.6 18.1 24.7 7.;: 1I5$.; 8&.; 100.0 12.3
Carbonate Flotation: pH 5.5; 3 steps, with 0.5 kg/T oleic acid for each step. No collector conditioning.
Phosphate Flotation: pH 8.5: 1 step, with Na silicate and 3 minutes conditioning, then oleic acid and 3 minutes conditioning.
.
65
Based on the above results, it was concluded that phosphate flotation in the alkaline pH
range will only produce a rougher phosphate concentrate with high silica content. Such a
product must be further cleaned and/or subjected to cationic flotation of the silica (double
flotation) to produce a marketable grade product of 30-31% P2O5, 0.7-1.0% MgO and 8-10%
insol. A combination of these steps with carbonate flotation would result in a multi-stage
flotation process when beneficiating a high MgO phosphate matrix. Attention was therefore
focused on exploring other flotation techniques to improve the selectivity of phosphate
separation from the siliceous gangue and directly recover low silica phosphate concentrate
without resorting to cationic flotation.
Initial studies were made to take advantage of the differences in the flotation kinetics of
carbonate and phosphate minerals when fatty acid collectors were used under slightly acidic
conditions of pH 5-6.8. As shown previously in figures 23 and 24, prolonged conditioning of
the pulp activated the flotation of phosphate particles in the carbonate froth even at the “zero”
conditioning time (not counting the 2-3 minutes pulp mixing during carbonate flotation). The
activated flotation of the phosphate minerals was therefore tested under these conditions. In
one test the carbonate minerals were first floated and the residual cell product of pH 5.5 was
conditioned for three minutes allowing the pulp pH to increase to about 5.8. When air was
introduced a highly mineralized phosphate froth was produced leaving most of the silica in the
cell product. As confirmed by this and other tests with little or no collector addition, the
phosphate concentrate produced was high in P2O5 (28-31%) and low in silica (4-8% insol),
indicating the high selectivity in phosphate/silica separation using fatty acids under slightly
acidic conditions. This phenomena was investigated to determine the effect of various
flotation parameters on the grade and recovery of phosphate concentrates.
Based on the above results and the observations made during the carbonate flotation stage,
a new phosphate flotation procedure was developed. The new phosphate flotation technique
involves simple rougher and cleaner steps with little or no collector additions after carbonate
flotation.
66

Phosphate Flotation Procedure
After carbonate flotation (at pH 5.5, 16% solids, and 1.5 kg/t oleic acid), the cell product
obtained was conditioned for three minutes with sodium silicate, followed by a three minute
conditioning with the desired collector. Phosphate flotation time ranged between 1 and 2
minutes. The quantities of collector and depressant used were based on the original flotation
feed dry weight of 250 grams.
Screening of Phosphate Collectors
Because most carbonate collectors are also good collectors for phosphate, the most
promising reagent combinations used in earlier flotation tests were adopted for this part of the
study. The reagents tested included two fatty acid collectors, oleic acid and tall oil, and the
sulfonated fatty acid soap, OA-5.
Results of tests conducted with the three collectors are given in table 23. The data indicate
that the fatty acid collectors gave better flotation of the phosphate than were obtained with the
fatty acid soap, OA-5. The latter collector was less selective for carbonate and phosphate
flotation from the siliceous gangue as indicated by the high MgO/P2O5 ratio of 0.073 and the
high insol content and low P2O5 grade of the concentrate. On the other hand, tall oil gave a
better concentrate assaying 28% P2O5 and 1.08% MgO (MgO/P2O5 ratio of 0.038) with a
phosphate recovery of about 91%. Oleic acid gave a concentrate assaying about 30% P 2O5 and
0.9% MgO with a phosphate recovery of about 75%. The MgO/P205 ratio in the concentrate was
about 0.03. The test results suggest that both oleic acid and tall oil are suitable collectors for
phosphate flotation. Because of its purity and simple chemical composition and to ensure the
reproducibility of results, oleic acid was selected as “reference” collector for
carbonate/phosphate flotation.
Screening of pH Modifiers
It was observed in the previous tests that good grade phosphate concentrates were obtained
at about pH 6 without the use of a silica depressant and without pH control of the pulp after
67
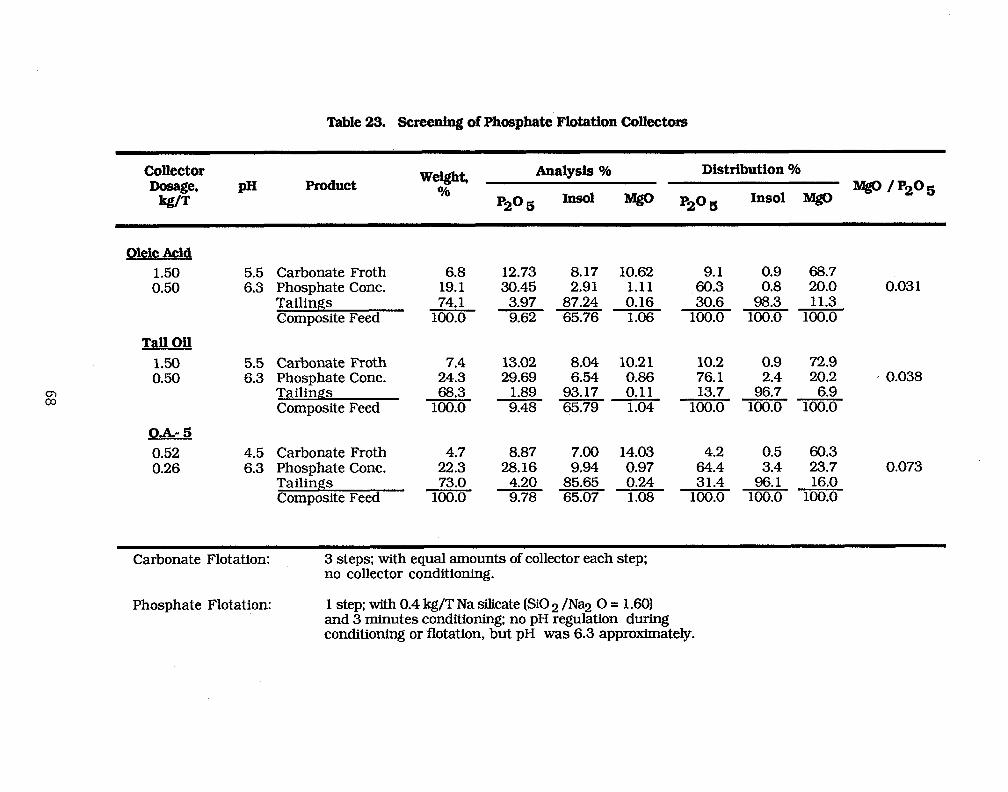
Table 23. Screening of Phosphate Flotation Collectors
Collector product weight,
Analysis % Distribution %
Oh P205 Ins01 - p2°5 Ins01 MgO
MS /P205
Oleic Acid
1.50 0.50
TallOil
1.50 0.50
oh.- 5 0.52 0.26
5.5 Carbonate Froth 6.8 12.73 8.17 10.62 9.1 0.9 6.3 Phosphate Cont. 19.1 30.45 2.91 1.11 60.3 0.8
Tailings 74.1 3.97 87.24 0.16 30.6 98.3 Composite Feed 100.0 9.62 65.76 1.06 100.0 100.0
5.5 Carbonate Froth 7.4 6.3 Phosphate Cont. 24.3
Tailings 68.3 Composite Feed 100.0
4.5 Carbonate Froth 4.7 6.3 Phosphate Cont. 22.3
Tailings 73.0 Composite Feed 100.0
13.02 8.04 10.21 10.2 0.9 72.9 29.69 6.54 0.86 76.1 2.4 20.2 jl 0.038
68.7 20.0 0.03 1 11.3
100.0
1.89 93.17 0.11 13.7 96 7 69 LA 9.48 65.79 1.04 100.0 100.0 100.0
8.87 7.00 14.03 4.2 0.5 60.3 28.16 9.94 0.97 64.4 3.4 23.7 0.073
4.20 85.65 0.24 31.4 96.1 160 . 9.78 65.07 1.08 100.0 100.0 100.0
Carbonate Flotation: 3 steps: with equal amounts of collector each step: no collector conditioning.
Phosphate Flotation: 1 step; with 0.4 kg/T Na silicate (SO 2 /Na2 0 = 1.60) and 3 minutes conditioning; no pH regulation during conditioning or flotation, but pH was 6.3 approximately.

carbonate flotation. Tests were then conducted using the alkaline reagents NaOH, NH4 OH and
Na2SiO3 to better understand their specific effects as pH modifiers during the phosphate
flotation step.
In the tests shown in table 24, the flotation was conducted without using specific silica
depressant or additional fatty acid collector after carbonate flotation (at pH 5.5. with 1.5 kg/t
oleic acid). Instead, the phosphate concentrates shown were floated after 3 minutes
conditioning of each reagent with the slightly acidic pulp containing the residual fatty acid
collector from the carbonate flotation step. In the first test recorded in table 24, no pH
modifier was added but the pulp was conditioned for 3 minutes prior to phosphate flotation. As
a result, the pH of the pulp increased from 5.5 to about 6.0 because of the reaction of the
carbonate minerals with the acidic pulp during conditioning. In the other tests shown in the
table, the pH during conditioning was maintained at pH 6, with the indicated modifier.
In the test conducted without pulp pH modifier, over 60% of the phosphate value was floated
by the residual collector remaining in the pulp from the carbonate flotation step. The
phosphate concentrate recovered was high in grade (about 30.5% P2O5 and low in silica (about
2.9% insol). Thus, conditioning of the pulp to reach about pH 6, effectively activated the
flotation of the phosphate minerals while the siliceous gangue remained depressed in the pulp.
The high selectivity in phosphate/silica separation, at pH of about 6, may be due to the lack of
collector precipitation on the silica particles despite the presence of substantial amounts of
dissolved Ca++ and Mg++ under acidic conditions.
Conditioning the carbonate free pulp with various pH modifiers to maintain a constant pH
of about 6, improved phosphate flotation recovery but the grade of products depended on the
type of reagent used. For example, the use of NH4OH produced higher grade concentrates than
did the use of NaOH. Control of pH with the strongly alkaline sodium silicate produced a good
phosphate concentrate containing about 30% P2O5, 6.5% insol and 0.86% MgO and also
increased the P2O5 recovery to about 76%. The MgO/P205 ratio in this product was as low as
0.029. The outstanding results obtained with sodium silicate may be attributed to its
compound effect as pH modifier, as a silica depressant and/or as activator for phosphate
flotation.
69
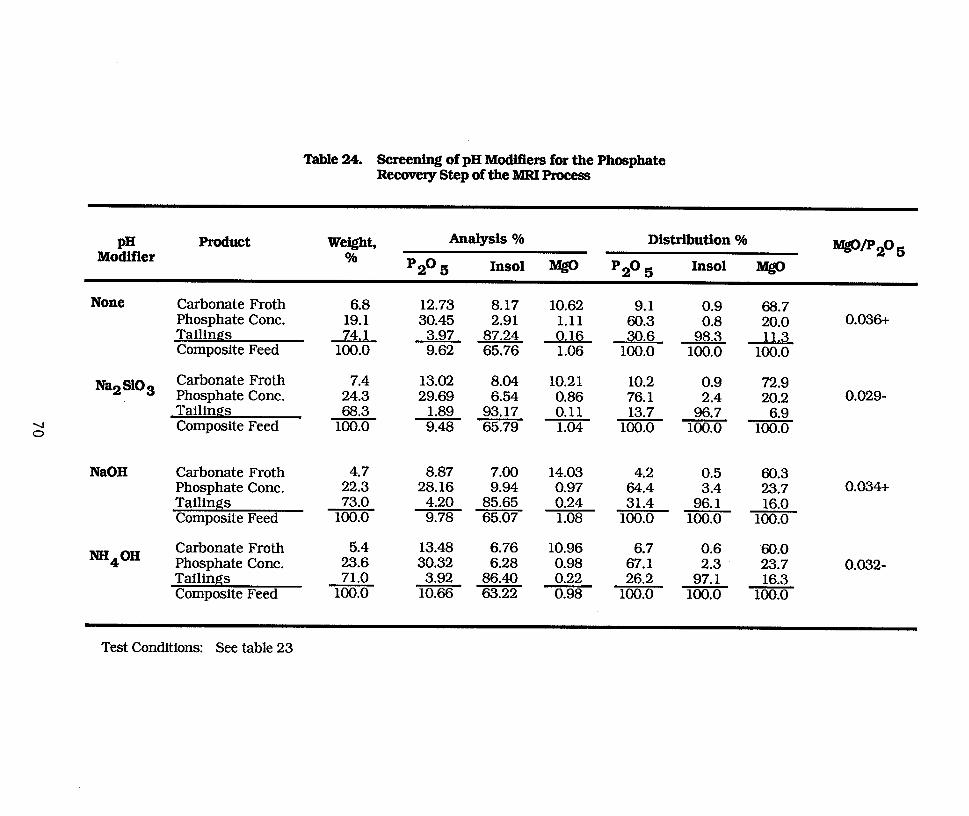
Table 24. Screening of pH Modifiers for the Phosphate Recovery Step of the MRI Process
PH Modifier
Product Weight, Analysis % Distribution %
% wDZo5
p2°5 Ins01 l&O ‘2’5 Ins01 MgO
None Carbonate Froth Phosphate Cont. Tailinfls Composite Feed
Na2Si03 Carbonate Froth Phosphate Cont. Tailings
2 Composite Feed
NaOH Carbonate Froth PhosDhate Cont. Taili& Composite Feed
NHQOH Carbonate Froth Phosphate Cont. Tailings Composite Feed
6.8 12.73 8.17 10.62 9.1 0.9 68.7 19.1 30.45 2.91 1.11 60.3 0.8 20.0 0.036+ 74.1 3.97 87.24 0.16 30.6 98.3 11.3
100.0 9.62 65.76 1.06 100.0 100.0 100.0
7.4 13.02 8.04 10.2 1 10.2 0.9 72.9 24.3 29.69 6.54 0.86 76.1 2.4 20.2 0.029- 68.3 1.89 93.17
100.0 0.11
9.48 65.79 13.7 96.7
1.04 100.0 6.9
100.0 100.0
4.7 8.87 7.00 14.03 4.2 0.5 60.3 22.3 28.16 9.94 0.97 64.4 3.4 23.7 0.034+ 73.0 4.20 0.24 31.4 16.0
100.0 85.65
9.78 65.07 1.08 96.1
100.0 100.0 100.0
5.4 13.48 6.76 10.96 6.7 0.6 60.0 23.6 30.32 6.28 0.98 67.1 2.3 23.7 0.032- 71.0 3.92 86.40 0.22 26.2 97.1 i6.3
100.0 10.66 63.22 0.98 100.0 100.0 100.0
Test Conditions: See table 23

Effect of pH on Phosphate Flotation
Tests were conducted to study the effect of pH control of the pulp on flotation of the
phosphate at constant addition of 0.5 kg/t sodium silicate. Table 25 shows the grades of the
phosphate concentrates produced, and the phosphate recoveries obtained without addition of
collector (“Phos. Conc. 1”) and after addition of 0.25 kg/t collector (“Phos. Conc. 2”). The test
conducted at about pH 6 (achieved by addition of sodium silicate only) gave the best flotation
results. The high P O2 5 grade of 30% and low silica content of 6.5% insol in the concentrate
obtained at pH 6 indicates a high degree of selectivity in the phosphate/silica separation. At
neutral and alkaline pulp pH’s of 7 and 9, selectivity in the phosphate/silica separation was
reduced, as evidenced by the high insol and low P2O5 analyses of phosphate concentrates
obtained under those conditions. For example, the phosphate concentrates recovered at pH 7
analyzed about 23% P2O5 and 27% insol. At pH 9, most of the silica floated indiscriminately
with the phosphate values. The loss in selectivity in the alkaline pH range, despite the
presence of sodium silicate, indicated that the silica particles were highly contaminated or
activated by fatty acid salt complexes formed in the pulp. Such compounds may not exist in
slightly acidic pulps as indicated by the high selectivity of the phosphate/silica separation at
about pH 6.
Effect of Acid Modifiers Used During Carbonate Flotation
Results of carbonate/phosphate flotation tests using oleic acid as collector and five
inorganic acids: HNO3, HCl, HF, H2SO4. and H3PO4, as pH modifiers (in the carbonate step) are
given in table 26. The data indicate that the type of acid modifier plays a significant role in
determining the grade and recovery of MgO in the carbonate froth. Also, the data in table 26
indicate that the type of pH modifier used during the carbonate step has a pronounced effect on
phosphate flotation. For example, the use of HF gave phosphate concentrates analyzing 30.7%
P2O5, 0.85% MgO and 5.93 insol with a P2O5 recovery of 71.4%. Higher P2O5 recoveries (76-
79%) were observed when using H2SO4 and HCl but the grade of the phosphate concentrate
slightly decreased to 29.5-29.7% P2O5 and 082-086% MgO. The MgO/P2O5 ratio in the
concentrates produced was about 0.028. The other pH modifiers HNO3 and H3PO4 gave
relatively poor flotation results.
71
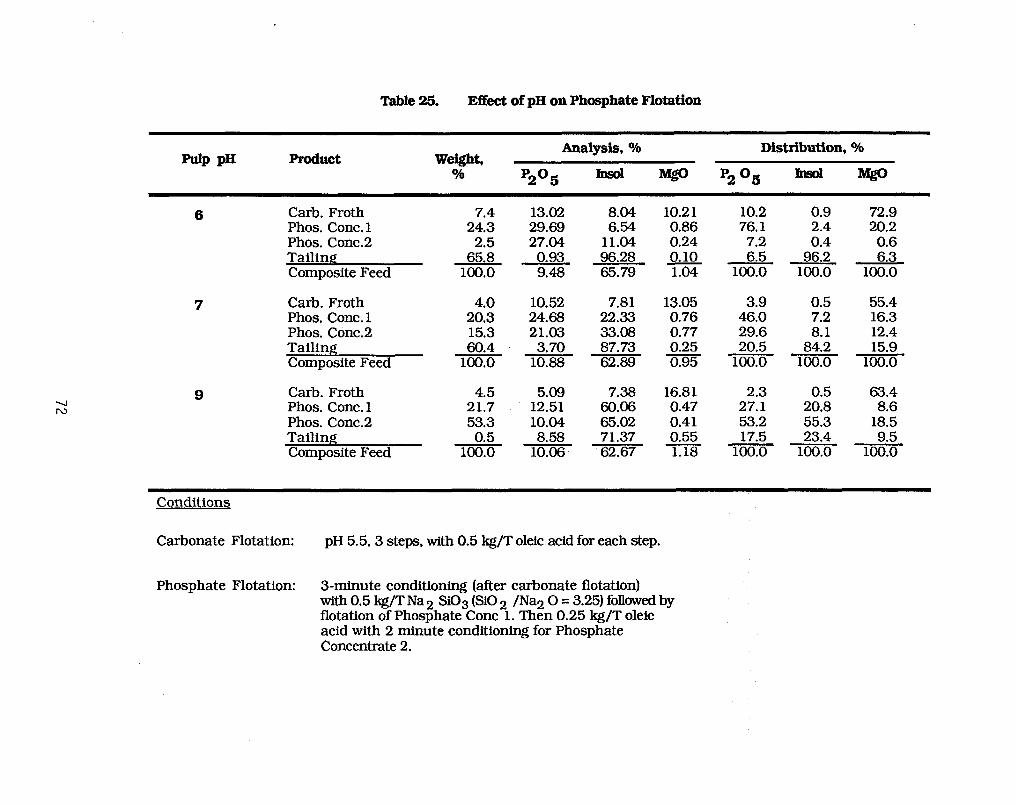
Table 25. E&ct of pH on Phosphate Flotation
MP PH Product We&W 036
Analysis, % Distribution, %
y+j Iosol YP pp+j hml Mm
6 Carb. Froth 7.4 Phos. Cone. 1 24.3 Phos. Conc.2 2.5 Tailing 65.8 Composite Feed 100.0
7 Carb. Froth Phos. Cont. 1 Phos. Conc.2 Tailing Composite Feed
4.0 10.52 20.3 24.68 15.3 21.03 60.4 3.70
100.0 10.88
9 Carb. Froth Phos. Cont. 1 Phos. Cone.2 Tailing Composite Feed
13.02 29.69 27.04 0.93 9.48
4.5 5.09 7.38 21.7 12.51 80.08 53.3 10.04 65.02
8.04 10.2 1 10.2 0.9 72.9 6.54 0.86 76.1 2.4 20.2
11.04 0.24 7.2 0.4 0.6 96.28 0.10 6.5 96.2 6.3 65.79 1.04 100.0 100.0 100.0
7.81 13.05 22.33 0.76 33.08 0.77 87.73 0.25 62.89 0.95
0.5 8.58 71.37 100.0 10.06 62.67
16.8 1 0.47 0.41 0.55 1.18
3.9 0.5 55.4 46.0 7.2 16.3 29.6 8.1 12.4
84.2 20.5 15.9 100.0 100.0 100.0
2.3 0.5 63.4 27.1 20.8 8.6 53.2 55.3 18.5 17.5 23.4 9.5
100.0 100.0 100.0
Conditions
Carbonate Flotation: pH 5.5,3 steps, with 0.5 kg/T oleic acid for each step.
Phosphate Flotation: 3minute conditioning (after carbonate flotation) with 0.5 kg/T Na 2 SiOs (SiO 2 /Na2 0 = 3.25) followed by flotation of Phosphate Cone 1. Then 0.25 kg/T oleic acid with 2 minute conditioning for Phosphate Concentrate 2.
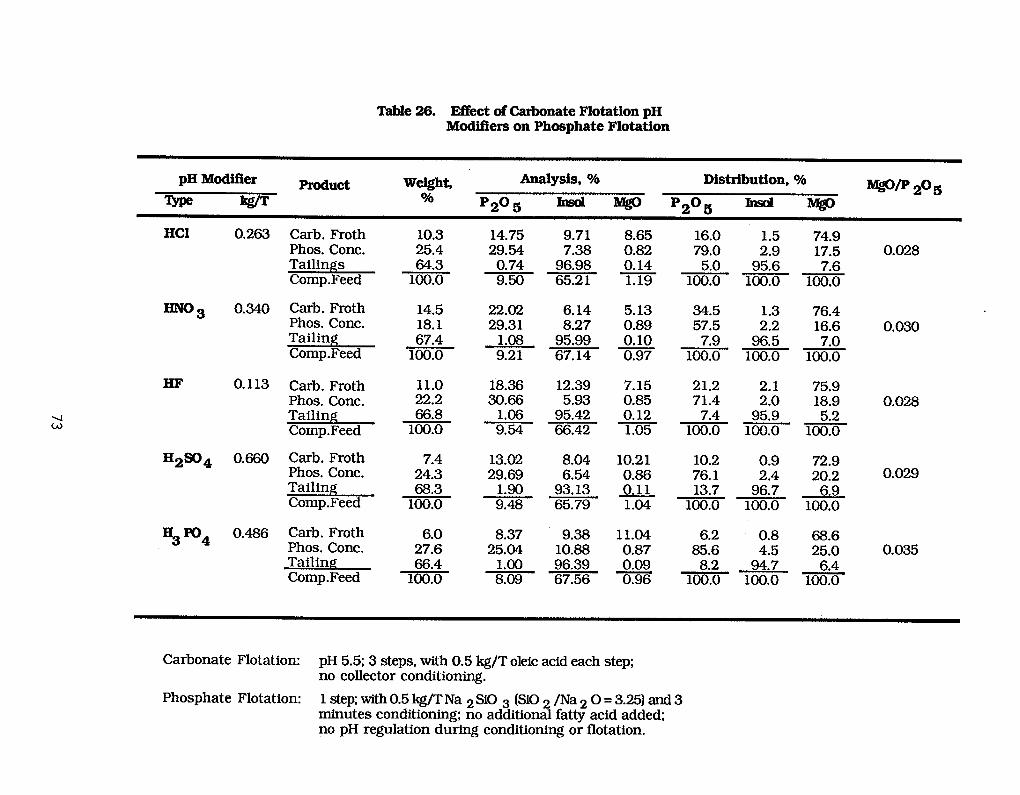
Table 26. Effect of Carbonate Flotation pH Modifiers on Phosphate Flotation
pH Modifier Product We&W Analysis, % Distribution, %
kg/T % lQwP 2%
5&j Jnsd WP 505 Insol Mgo
HCl 0.263 Garb. Froth Phos. Cont. Tailings Comp.Feed
0.340 Carb. Froth Phos. Cone. Tailing Comp.Feed
HF 0.113 Car-b. Froth Phos. Cont. Tailing Comp.Feed
H2S04 0.660 Carb. Froth Phos. Cone. Tailing Comp.Feed
fspo4 0.486 Carb. Froth
Phos. Cont. Tailing Comp.Feed
10.3 14.75 9.71 8.65 16.0 1.5 74.9 25.4 29.54 7.38 0.82 79.0 2.9 17.5 0.028 64.3 0.74 96.98 5.0 7.6
100.0 0.14
9.50 65.2 1 1.19 100.0 95.6
100.0 100.0
14.5 22.02 6.14 5.13 34.5 76.4 18.1 29.31 8.27 0.89 57.5
t:: 16.6 0.030
67.4 1.08 95.99 0.10 7.9 100.0
-- 9.21 67.14 0.97 100.0
96.5 7.0 100.0 100.0
11.0 18.36 12.39 7.15 21.2 2.1 75.9 22.2 30.66 5.93 0.85 71.4 2.0 18.9 0.028 66.8 95.42 0.12 7.4
100.0 i:E 66.42 1.05 95.9
100.0 100.0 5.2
100.0
7.4 13.02 8.04 10.21 10.2 0.9 72.9 24.3 29.69 6.54 0.86 76.1 20.2 0.029 68.3 1.99 93.13 0.11 9% 69
100.0 9.48 65.79 13.7
1.04 100.0 1OO:o 1oo.o
2% 8.37 9.38 11.04 6.2 0.8 68.6
66:4 25.04 10.88 0.87 85.6 4.5 25.0 0.035
1.00 96.39 100.0 8.09 67.56
0.09 8.2 94.7 0.96 100.0 100.0
6.4 100.0
Carbonate Flotation: pH 5.5; 3 steps, with 0.5 kg/T oleic acid each step; no collector conditioning.
Phosphate Flotation: 1 step: with 0.5 kg/T Na 2 SiO 3 (SiO 2 /Na 2 0 = 3.25) and 3 minutes conditioning; no additional fatty acid added; no pH regulation during conditioning or flotation.

The effect of inorganic acids on phosphate flotation may be attributed to the residual acid
concentration in the carbonate flotation cell product at pH 5.5. Generally, phosphate flotation
was carried out at about pH 6.0 which was reached by conditioning the acidic pulp with 0.5 kg/t
sodium silicate, i.e. no additional pH regulator was used for pH control. Therefore, the specific
effects of certain acid modifiers during phosphate flotation would be related to surface
reactions occurring during carbonate flotation. The inorganic acids used are known to react
with both carbonate and phosphate mineral surfaces producing various soluble or insoluble
compounds in the system. This may result in preferential dissolution or precipitation of
certain surface compounds and alteration of the composition of the mineral surface. The exact
mechanism is not fully understood but substantial changes in the surface chemical properties
of apatite and carbonate minerals are expected.
Effect of Sodium Silicate SiO2/Na2O Ratios
Tests on the effect of type of sodium silicate on phosphate flotation were conducted using
SiO2/Na2O ratios of 1.69, 2.40, 3.22, and 3.25. As stated earlier, the tests were conducted on the
carbonate cell products after 3-minutes conditioning of the pulp with 0.5 kg/ton sodium
silicate to reach pulp pH of 6.0 + 0.2. Flotation was conducted using the residual oleic acid
collector from carbonate flotation. Table 27 shows the results obtained in the presence and
absence of sodium silicate reagents. Generally, the data indicate that addition of sodium
silicate greatly enhanced phosphate flotation and produced finished siliceous tailings
containing as low as about 1% P2O5. More important, high grade phosphate concentrates
analyzing 29.5-30.1% P2O5, about 1.0% MgO and 4.6-7.0% insol were produced. Also, the
addition of sodium silicate increased the P2O5 recovery in the concentrate substantially,
particularly those with high SiO2/Na2O ratios, from 60% to as much as 88%. The sodium
silicate with the 3.22 ratio gave the highest P2O5 recovery of 88% followed by the reagent with
the 2.40 ratio. The concentrates recovered analyzed 30.1% P2O5, 1.0% MgO and 5% insol. For
the reagent with a higher SiO2/Na2O ratio of 3.25, or a lower ratio of 1.6, the grade and
recovery of P2O5 decreased slightly but the MgO analysis of the concentrate was improved to
about 0.9%. The MgO/P2O5 ratios in the concentrates obtained were acceptable and ranged
from 0.029 - 0.034.
74
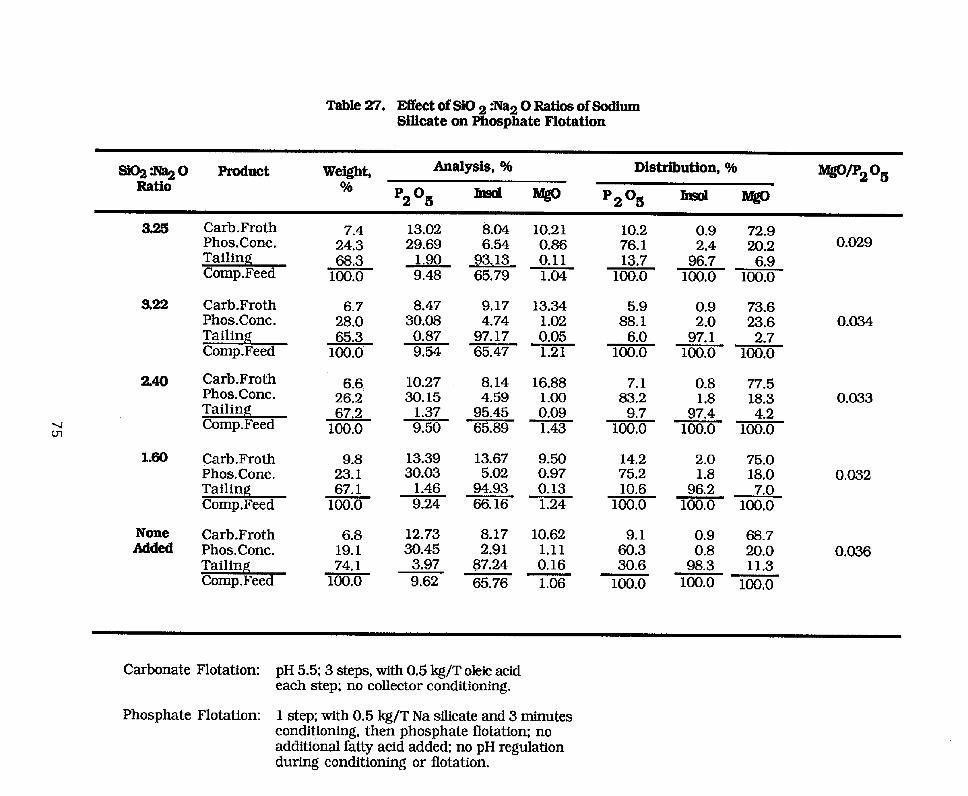
Table 27. Effect of SiO 2 ma2 0 Ratios of Sodium Silicate on Phosphate Flotation
stqt*o Product Weight, Analysis, % Distribution, *16
Ratio % “go/pz%
p2°5 hlsd WP qpg - WP
240
2:
1.60
None Added
Carb.Froth 7.4 Phos.Conc. 24.3 Tailing Comp.Feed
68.3 100.0
Carb.Froth 6.7 Phos.Conc. 28.0 Tailing 65.3 Comp.Feed 100.0
Carb.Froth Phos.Conc. Tailing Comp.Feed
6.6. 26.2 67.2
100.0
Carb.Froth 9.8 Phos.Conc. 23.1 Tailing Comp.Feed
67.1 100.0
Carb.Froth Phos.Conc. Tailing Comp.Feed
6.8 19.1 74.1
100.0
13.02 8.04 10.21 10.2 29.69 6.54 0.86 76.1
1.90 93.13 0.11 13.7 9.48 65.79 1.04 100.0
8.47 9.17 13.34 30.08 4.74 1.02
0.87 97.17 9.54 65.47
0.05 1.21
5.9 88.1
6.0 100.0
10.27 8.14 16.88 7.1 30.15 4.59 1.00 83.2
1.37 95.45 0.09 9.7 9.50 65.89 1.43 100.0
13.39 13.67 9.50 30.03 5.02 0.97
1.46 94.93 0.13 - - 9.24 66.16 1.24
12.73 8.17 10.62 30.45 2.91 1.11
3.97 87.24 0.16 9.62
-- 65.76 1.06
14.2 2.0 75.0 75.2 1.8 18.0 0.032 10.6 96.2 7.0
100.0 100.0 100.0
9.1 60.3 30.6
100,o
0.9 2.4
96.7 100.0
72.9 20.2
6.9 100.0
0.029
0.9 73.6 2.0 23.6 0.034
97.1 2.7 100.0 100.0
0.8 77.5 1.8 18.3 0.033
97.4 4.2 100.0 100.0
0.9 68.7 0.8 20.0 0.036
98.3 11.3 100.0 100.0
Carbonate Flotation: pH 5.5: 3 steps, with 0.5 kg/T oleic acid each step; no collector conditioning.
Phosphate Flotation: 1 step; with 0.5 kg/T Na silicate and 3 minutes conditioning, then phosphate flotation: no additional fatty acid added: no pH regulation during conditioning or flotation.

It should be noted that although no collector or frother was required in the above tests with
sodium silicate, well mineralized phosphate froths were obtained, and in all cases, flotation
was completed in less than two minutes. In the absence of sodium silicate, phosphate flotation
also was good but addition of 0.25-0.5 kg/ton oleic acid was required to achieve the maximum
phosphate recovery. Apparently, in the tests made with sodium silicate, the residual oleic acid
from the carbonate flotation step was sufficient to float most of the phosphate in the pulp.
The exact mechanism by which sodium silicate operated either to activate phosphate
flotation or depress the silica particles and achieve the remarkable flotation selectivity
observed under slightly acidic conditions (pH 5.8-6.2) is not fully understood. However, it
appears that sodium silicate at pH’s 5-6 may have been converted to colloidal hydrosilicic acid
species which promoted selective phosphate flotation under slightly acidic conditions. Some
investigators[15] suggested that activation of apatite (francolite) may be due to enhanced
adsorption of oleic acid in the presence of colloidal hydrosilicic acid species prevailing under
acidic pH’s. Other investigators suggested that the polyvalent cations which can interfere with
flotation may interact with the soluble silicates species, forming insoluble compounds, and
thereby reducing interference by those cations[16,17] . It has been widely reported that
phosphate flotation by fatty acids is only feasible from alkaline pulps of pH 8-10. Further
studies are needed to explain this phenomenon involving the use of acidified sodium silicate or
hydrosilicic acid in selective phosphate flotation by fatty acids.
Optimization of the Phosphate Recovery Step
Based on the above single factor test results, the critical phosphate flotation parameters,
pH, collector dose and depressant dose were identified and optimized in a 3-factor, 2-level full-
factorial design (23) test series with five replicate center-points and six star-points. The design,
shown in table 28, ensured that adequate data were taken to provide an unbiased estimate of all
linear factor and cross-factor responses.
The response variables used in the statistical evaluation of test data were P2O5 grade and
recovery in the phosphate froth. In addition, a one parameter objective function, P O2 5
separation efficiency (P2O5 S.E.) was used as a response function that quantified the degree of
phosphate/silica separation.
76
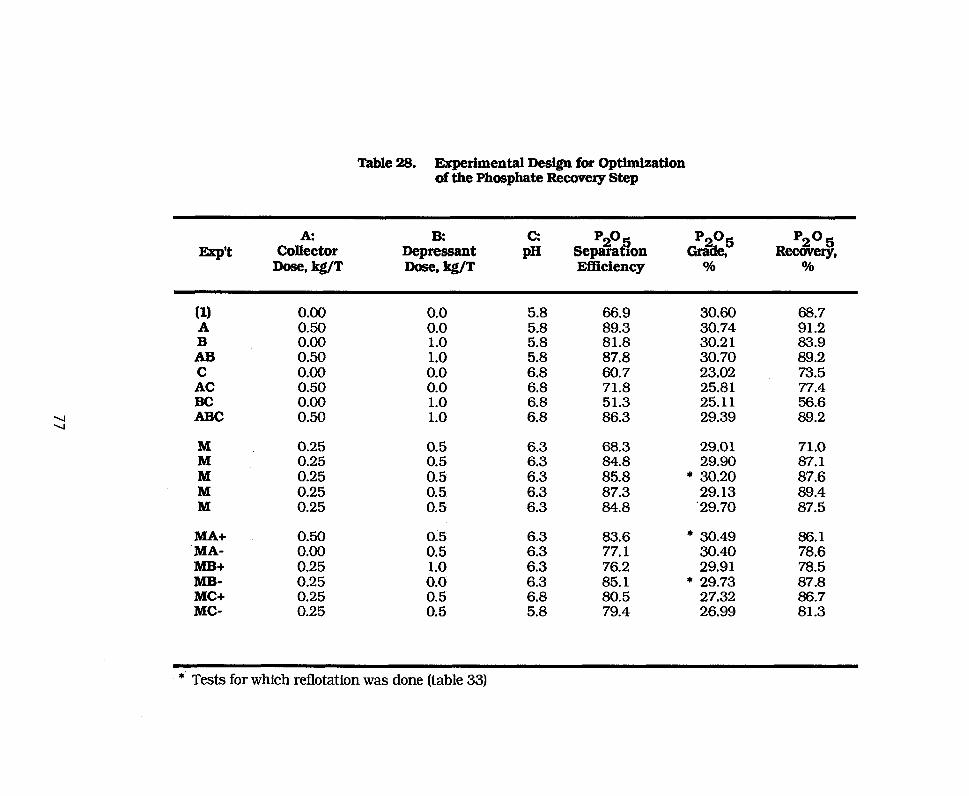
Table 28. Experimental Design for Optimization of the Phosphate Recovexy Step
A: B: Collector Depressant
-, kg/T -. Q/T
c2 PH
p2° Separa on 8 GX5
‘Z”5 * Recovery,
Efficiency % %
(1) 0.00 0.0 A 0.50 0.0 B 0.00 1.0 AB 0.50 1.0 C 0.00 0.0 AC 0.50 0.0 Bc 0.00 1.0 ABC 0.50 1.0
M 0.25 M 0.25 M 0.25 M 0.25 M 0.25
MA+ ‘MA- MB+ MB- MC+
0.50 0.00 0.25 0.25 0.25 0.25
0.5 0.5 0.5 0.5 0.5
0.5 0.5
liz 0:5 0.5
5.8
2 5:s 6.8 6.8 6.8 6.8
6.3
iEi 6:3 6.3
6.3 83.6 * 30.49 86.1 6.3 77.1 30.40 78.6 6.3 76.2 29.91 78.5 6.3 85.1 * 29.73 87.8 6.8 80.5 27.32 86.7 5.8 79.4 26.99 81.3
66.9 30.60 68.7 89.3 30.74 91.2 81.8 30.2 1 83.9 87.8 30.70 89.2 60.7 23.02 73.5 71.8 25.81 77.4 51.3 25.11 56.6 86.3 29.39 89.2
68.3 29.01 71.0 84.8 29.90 87.1 85.8 * 30.20 87.6 87.3 29.13 89.4 84.8 ‘29.70 87.5
* Tests for which reflotation was done (table 33)
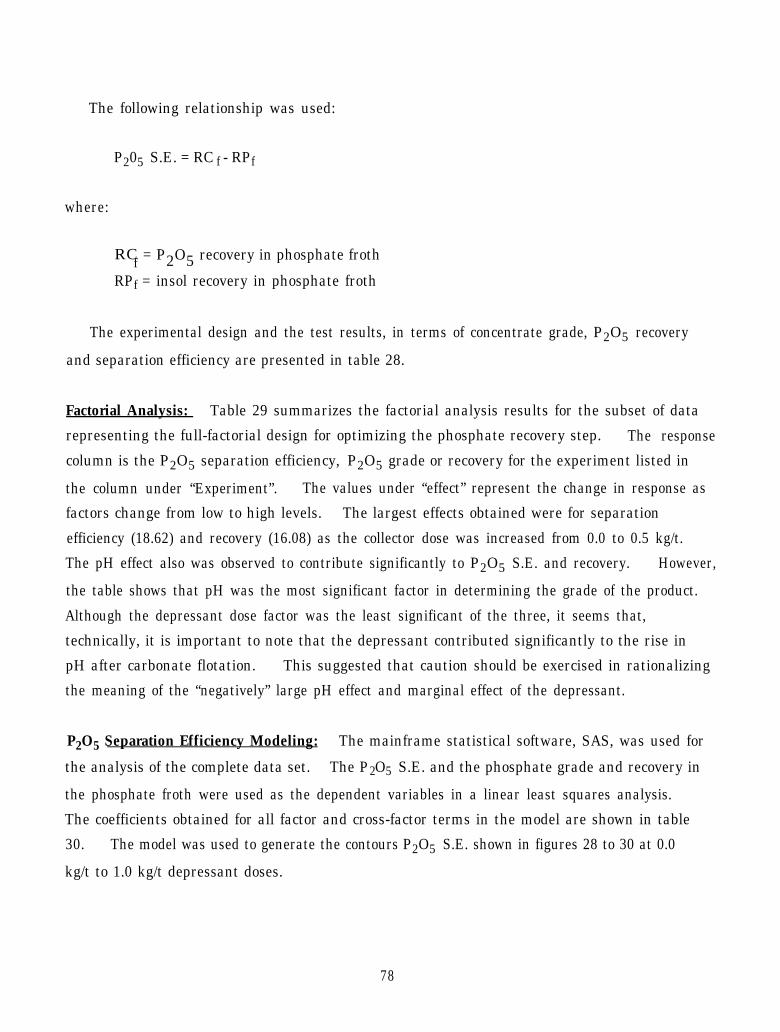
The following relationship was used:
P205 S.E. = RC f - RPf
where:
RCf = P2O5 recovery in phosphate froth
RPf = insol recovery in phosphate froth
The experimental design and the test results, in terms of concentrate grade, P2O5 recovery
and separation efficiency are presented in table 28.
Factorial Analysis: Table 29 summarizes the factorial analysis results for the subset of data
representing the full-factorial design for optimizing the phosphate recovery step. The response
column is the P2O5 separation efficiency, P2O5 grade or recovery for the experiment listed in
the column under “Experiment”. The values under “effect” represent the change in response as
factors change from low to high levels. The largest effects obtained were for separation
efficiency (18.62) and recovery (16.08) as the collector dose was increased from 0.0 to 0.5 kg/t.
The pH effect also was observed to contribute significantly to P2O5 S.E. and recovery. However,
the table shows that pH was the most significant factor in determining the grade of the product.
Although the depressant dose factor was the least significant of the three, it seems that,
technically, it is important to note that the depressant contributed significantly to the rise in
pH after carbonate flotation. This suggested that caution should be exercised in rationalizing
the meaning of the “negatively” large pH effect and marginal effect of the depressant.
P2O5 Separation Efficiency Modeling: The mainframe statistical software, SAS, was used for
the analysis of the complete data set. The P2O5 S.E. and the phosphate grade and recovery in
the phosphate froth were used as the dependent variables in a linear least squares analysis.
The coefficients obtained for all factor and cross-factor terms in the model are shown in table
30. The model was used to generate the contours P2O5 S.E. shown in figures 28 to 30 at 0.0
kg/t to 1.0 kg/t depressant doses.
78

79
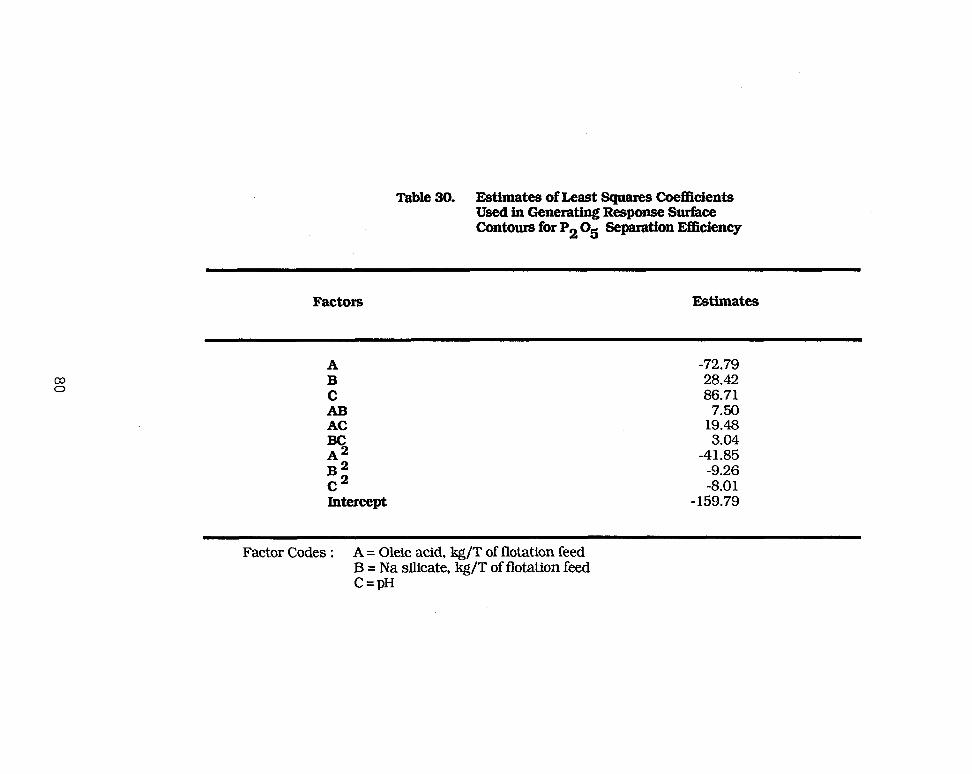
Table 30. Estimates of Least Squares Coefficients Used in Generating Response Surface Contours for P2 O5 Separation J3fficiency
Factors Estimates
A B C AB AC Bc
$ c2 Intercept
-72.79 28.42 86.71
7.50 19.48 3.04
-41.85 -9.26 -8.01
,159.79
Factor Codes : A = Oleic acid, kg/T of flotation feed B = Na silicate, kg/T of flotation feed C=pH
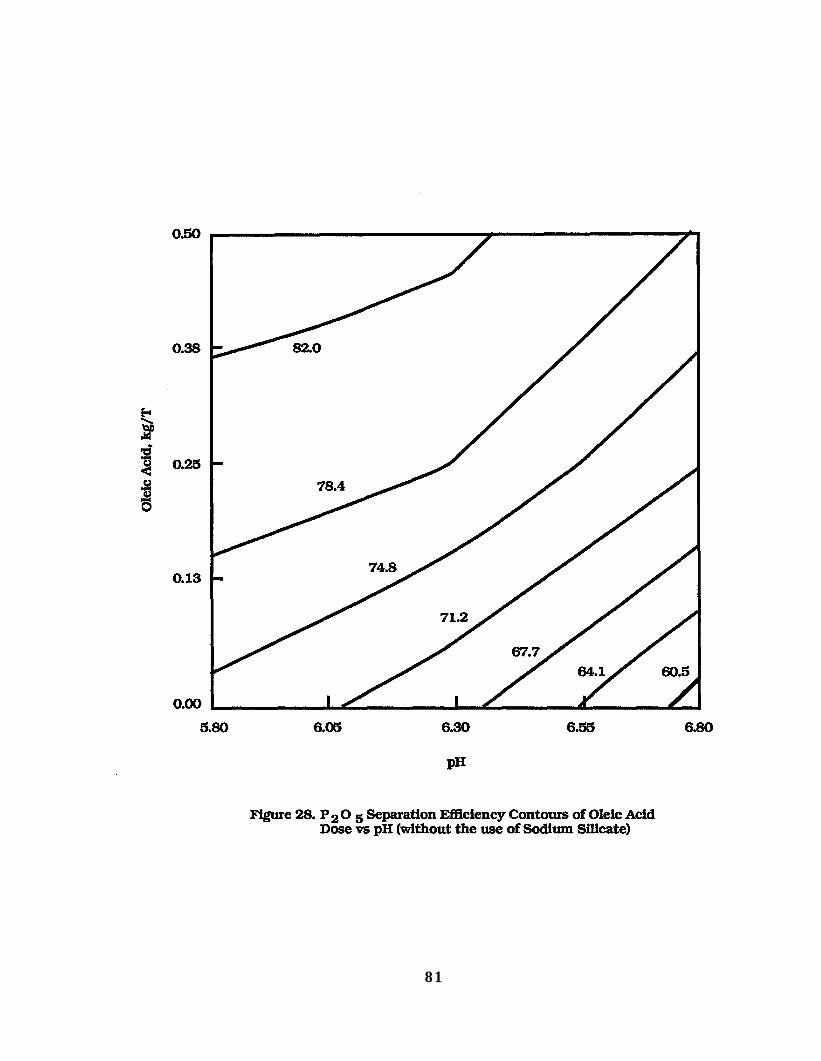
81


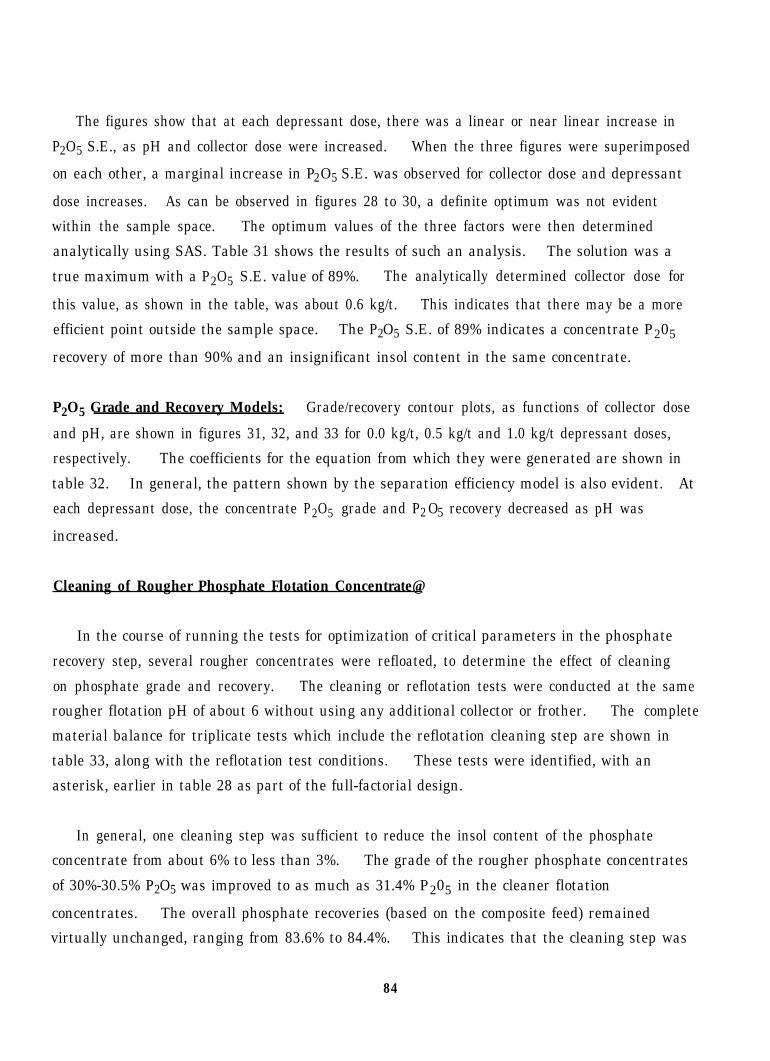
The figures show that at each depressant dose, there was a linear or near linear increase in
P2O5 S.E., as pH and collector dose were increased. When the three figures were superimposed
on each other, a marginal increase in P2O5 S.E. was observed for collector dose and depressant
dose increases. As can be observed in figures 28 to 30, a definite optimum was not evident
within the sample space. The optimum values of the three factors were then determined
analytically using SAS. Table 31 shows the results of such an analysis. The solution was a
true maximum with a P2O5 S.E. value of 89%. The analytically determined collector dose for
this value, as shown in the table, was about 0.6 kg/t. This indicates that there may be a more
efficient point outside the sample space. The P2O5 S.E. of 89% indicates a concentrate P205
recovery of more than 90% and an insignificant insol content in the same concentrate.
P2O5 Grade and Recovery Models: Grade/recovery contour plots, as functions of collector dose
and pH, are shown in figures 31, 32, and 33 for 0.0 kg/t, 0.5 kg/t and 1.0 kg/t depressant doses,
respectively. The coefficients for the equation from which they were generated are shown in
table 32. In general, the pattern shown by the separation efficiency model is also evident. At
each depressant dose, the concentrate P2O5 grade and P2O5 recovery decreased as pH was
increased.
Cleaning of Rougher Phosphate Flotation Concentrate@
In the course of running the tests for optimization of critical parameters in the phosphate
recovery step, several rougher concentrates were refloated, to determine the effect of cleaning
on phosphate grade and recovery. The cleaning or reflotation tests were conducted at the same
rougher flotation pH of about 6 without using any additional collector or frother. The complete
material balance for triplicate tests which include the reflotation cleaning step are shown in
table 33, along with the reflotation test conditions. These tests were identified, with an
asterisk, earlier in table 28 as part of the full-factorial design.
In general, one cleaning step was sufficient to reduce the insol content of the phosphate
concentrate from about 6% to less than 3%. The grade of the rougher phosphate concentrates
of 30%-30.5% P2O5 was improved to as much as 31.4% P205 in the cleaner flotation
concentrates. The overall phosphate recoveries (based on the composite feed) remained
virtually unchanged, ranging from 83.6% to 84.4%. This indicates that the cleaning step was
84
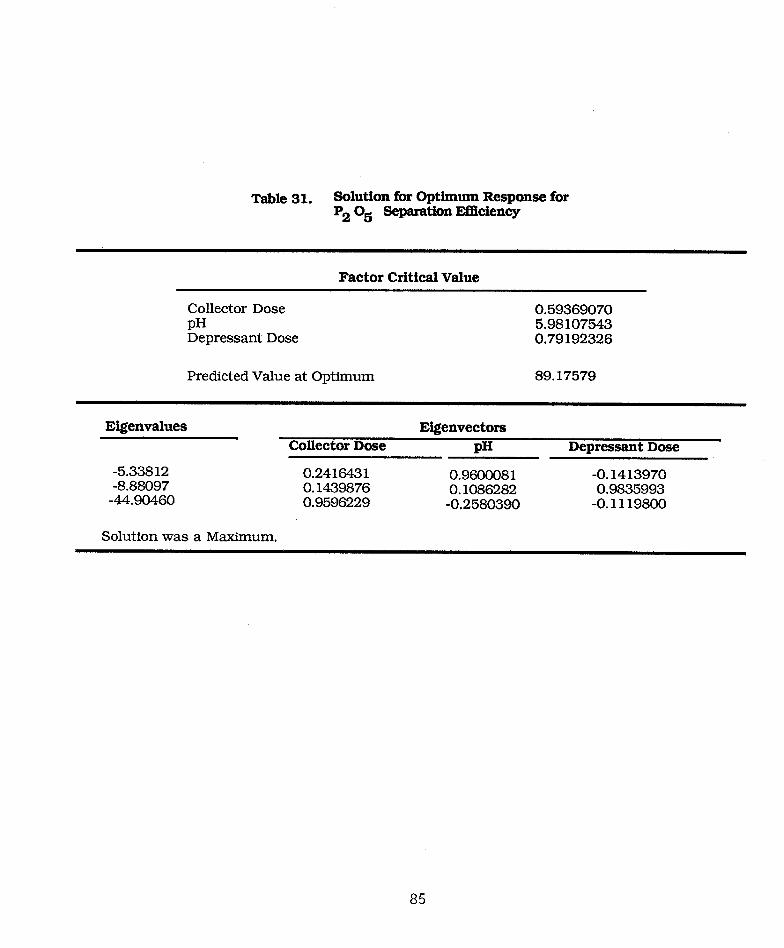
Table 31. Solution for Optimum Response for Pz OS Separation Efficiency
Factor Critical Value
Collector Dose 0.59369070 PH 5.98 107543 Depressant Dose 0.79 192326
Predicted Value at Optinmm 89.17579
Eigenvalues
-5.338 12 -8.88097
-44.90460
Collector Dose
0.2416431 0.1439876 0.9596229
Eigenvectors PH
0.9600081 0.1086282 -0.2580390
Depressant Dose
-0.1413970 0.9835993
-0.1119800
Solution was a Maximum.
85
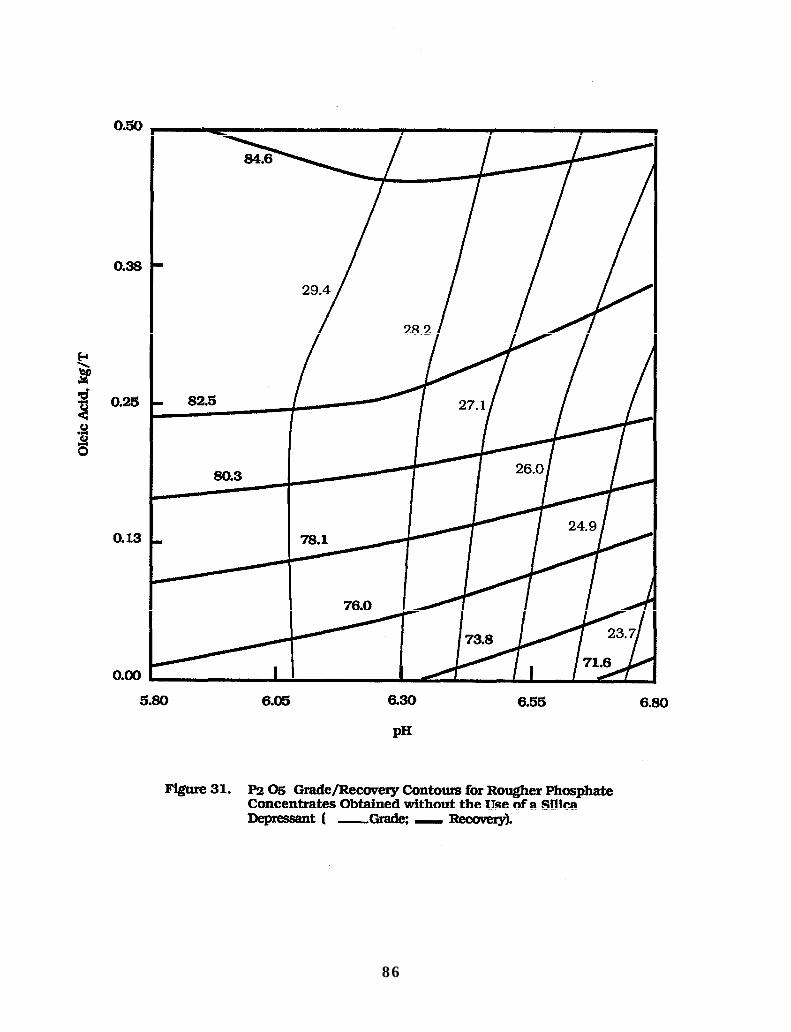
86
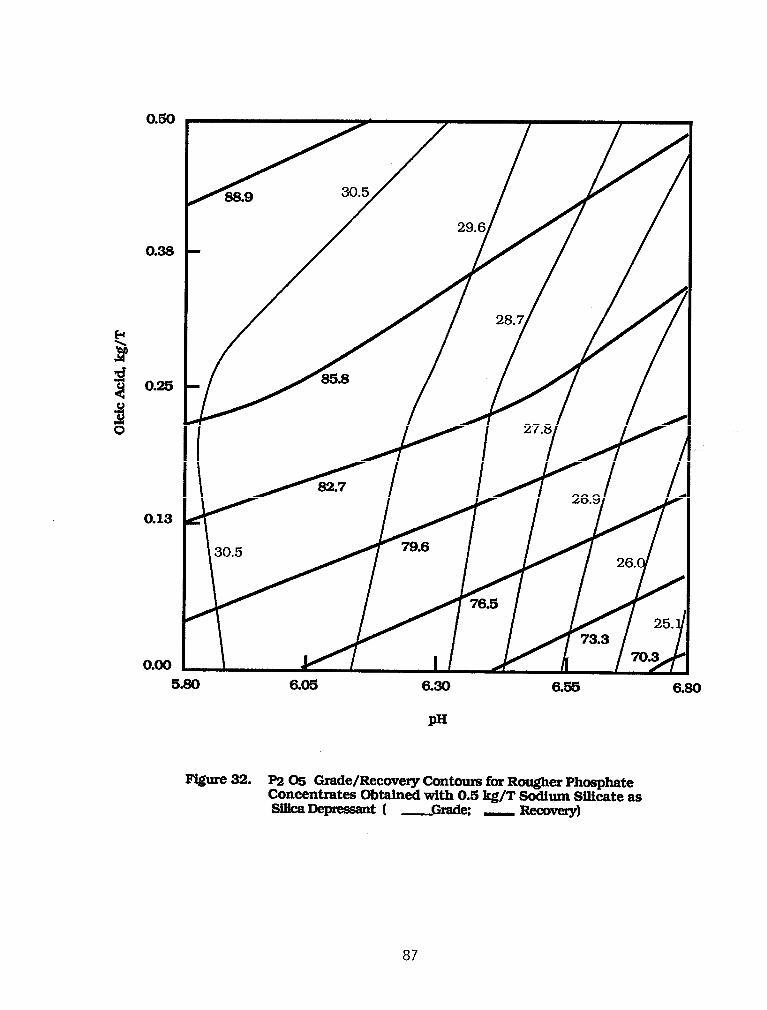


89

Table 33. Effect of RefIotation on the Rougher Phosphate Concentrate
Test No.
Product We&M, Analysis, Oh Distribution, %
056 ‘Z”5 -, lvrgo P205 IOSOl W
1 Cleaner Phos. Cont. Cleaner Refloat Tafi Rougher Phos. Cont. Carb. Froth Rougher Tail Composite Feed
2 Carb. Froth Rougher Phos.Conc. Cleaner Phos.Conc. Cleaner Refloat Tail Rougher Tail Composite Feed
3 Carb. Froth Rougher Phos.Conc. Cleaner Phos.Conc. Cleaner Refloat Tail Rougher Tail Composite Feed
27.3
2t.i 6:4
64.7 100.0
5.6 10.81 30.0 29.73 27.9 30.68
2.1 16.80 0.98
10.15 64.4
100.0
6.7 26.7 25.0
6:': 1oo.o
31.41 14.66 30.49 11.55
1.05 10.22
9.06 30.20 30.76 21.83 0.80 9.20
2.92 0.70 51.59 1.54
5.58 0.75 10.81 12.53 92.98 0.05 63.11 1.05
7.39 12.57 5.69 0.74 2.80 0.75
45.02 0.59 96.58 0.06 64.33 0.97
10.79 13.11 4.56 0.88 2.89 0.88
29.30 0.81 97.24 0.06 66.68 1.16
83.8 2.3
86.1
8 loo.0
8t.z 84:4 3.4
1.2 18.2 1.3 2.3 2.5 20.5 1.2 76.4
96.3 3.1 100.0 100.0
0.7 73.1 2.7 22.9 1.2 21.6 1.4 1.3
6.2 4.0 96.7 100.0 100.0 100.0
8;‘: 83:6
4.0
1.1 76.3 1.8 20.2 1.1 19.0 0.7 1.2
5.8 3.5 97.1 100.0 100.0 100.0
Carbonate Flotation: pH 5.5; 3 steps. with 0.5 kg/T oleic acid each step; no collector conditioning.
Phosphate Flotation: Tests1,2and3arethesameasMA+,MH- and M in table 28.
Reflotation of Phosphate Concentrate: Tests 1 and 2 at pH 6.2; 3 minute conditioning at
approx. 20% solids with additional 0.5 kg/T Na silicate before reflotation at lower pulp solidswithout additional collector or frother.
Test 3: Same as above, except that no Na silicate was used.
90

effective in removing the mechanically entrapped silica particles in rougher flotation
concentrate is not entirely clear because of the inconsistency of MgO content observed in the
in the range of 0.7-0.8%.
Phosphate Flotation Conclusions
Based on the test results discussed in this part of the investigation, the following
conclusions were reached:
Phosphate flotation from the carbonate cell product at alkaline pH’s of 8-10 was not
selective and produced intermediate grade phosphate concentrates high in acid insolubles.
Selective phosphate flotation was achieved at slightly acidic pH’s of 5.8-6.2. largely by the
phosphate flotation step produced high grade concentrates containing 29.5-30.6% P2O5, 0.7-
1.0% MgO, and 2.8-8% in sol. The P2O5 recoveries in the concentrates ranged from 65 to 88%.
The grade and P2O5 recoveries in the concentrates were found to depend largely on the pulp
pH. Other contributing factors were the type of inorganic acid used during the carbonate
flotation step, and he SiO2/Na2O ratio of the sodium silicate used during the phosphate
flotation step.
Flotation of phosphate under slightly acidic conditions required little or no additional
flotation.
Further improvement in P2O5 grade and recovery was achieved by reflotation of the
0.7-0.8% MgO and about 3% acid insol with P2O5 recoveries in the mid eighties.
91
concentrate. However, the role of reflotation on the MgO grade of the final phosphate
cleaner tailings. Nevertheless, all the cleaned flotation concentrates showed low MgO content
residual collector from the carbonate step, in the presence or absence of sodium silicate. The
collector or frother. A well mineralized froth was consistently obtained during phosphate
rougher concentrate. The cleaned flotation concentrates produced analyzed 31.0-31.5% P2O5.

Reasgent Quality in Carbonate/Phosphate Flotation
Tests were conducted to determine the effect of using commercial flotation reagent
combinations as replacement for the chemically pure oleic acid/NaOH/pine oil emulsion
collector mixture, and H2SO4 as the acid pH regulator. The reagent combinations tested are
selected from among the commercial reagents used by the Florida phosphate industry. These
include commercial grade tall oil, pine oil and other frothers and pH modifiers. The tests were
performed by the following carbonate/phosphate flotation technique.
Carbonate flotation was first conducted at the optimum of pH 5.5, 16% pulp solids and at a
flotation cell impeller speed of 1100 rpm. The collector and frother mixture used was
emulsified with a few drops of dilute NaOH before use in carbonate flotation. During the
carbonate flotation step, the emulsified collector and frother were added to the pulp in three
equal portions to achieve the final dosage.
The carbonate flotation cell product was conditioned for 3 minutes at pH 6 with 0.5 kg/t of
sodium silicate, followed by conditioning with 0.25 kg/t fatty acid collector for an additional 2
minutes, after which aeration of the pulp resulted in removal of the phosphate minerals in the
froth, while acid insoluble matter remained in the cell underflow.
Comparison of Tall Oil and Oleic Acid Flotation
Several parallel tests were conducted using equal amounts of the “reference” pure oleic acid
collector in the carbonate flotation and phosphate recovery steps. Table 34 shows the average
results of these tests. Generally. the performance of the two collectors is very similar and
confirmed the conclusions reached in earlier investigations on carbonate and phosphate
flotation. The data shows that tall oil was as effective as oleic acid in the recovery of about
87% of the phosphate, but the MgO rejection was slightly lower than the 76% achieved by oleic
acid. The grades and the MgO/P2O5 ratio of the phosphate concentrate produced by both
collectors were about the same. It analyzed about 30% P2O5, 4.32% insol, and 0.87% MgO.
92

Table 34. Results of Flotation of Sample #194, Using Tall Oil or Oleic Acid as Carbonate/Phosphate Collector.
Product Analysis % Distribution % -Opzo5 PO
2 6 Ills01
- p2° 5 Insol MgO
TallOil Carbonate Phosphate Tailings Composite
Oleic Acid Carbonate Phosphate
6.2 14.60 6.85 11.23 9.0 0.6 71.0 28.9 29.97 4.32 0.87 86.3 2.0 25.7 0.029 64.9 0.74 97.43 0.05 4.7 97.4 3.3
100.0 10.04 64.94 0.98 100.0 100.0 100.0
6.7 9.06 10.79 13.11 6.6 1.1 76.3 26.7 30.20 4.56 0.88 87.6 1.8 20.2 0.029
Tailkgs 66.6 0.80 97.24 0.06 5.8 97.1 3.5 Composite 100.0 9.20 66.68 1.16 100.0 100.0 100.0
Test Conditions: See text.
Effect of Acid pH Modifiers
The effect of various inorganic acids on the grade and the recovery of the phosphate
products from tall oil flotation was investigated. Table 35 shows that HCl and HF acids may be
substituted in place of H2SO4 for pH adjustment during flotation with tall oil. The grade of the
phosphate concentrates produced decreased in the order HF>H2SO4> HCl, however, using
H2SO4 gave the highest P2O5 recovery of 85% and the lowest MgO/P205 ratio of 0.029. For
practical and environmental reasons, such as lower costs and less hazardous solubilization
products, technical grade H2SO4 continued to be the preferred pH modifier during flotation.
Tests were conducted to compare the performance of tall oil in combination with three
commercial frothers as froth stabilizers. As in previous tests, the tall oil and frother mixture
emulsified with dilute NaOH was used during the two step flotation process.
Table 36 compares the results obtained with each of the three frothers, pine oil, Dowfroth
250 and Aerofroth 77A. The results of the tests show that pine oil was superior to Dowfroth 250
and Aerofroth 77A in producing a larger weight percent of the carbonate in the froth obtained.
The other frothers gave phosphate concentrates lower in P2O5 grade and higher in MgO
compared to pine oil. Thus, the tall oil/pine oil collector mixture proved to be the best of the
three combinations.
Effect of Collector/Frother Emulsifiers
Because of the poor solubility and dispersion of oily fatty acid collectors in acidic pulps,
excessive amounts are required particularly for the instant (non-conditioning) carbonate
flotation step. Therefore, tests were made using emulsions of tall oil/pine oil collector
mixtures using dilute NaOH or methyl alcohol as emulsifying agents. The results of carbonate
flotation made with fresh collector emulsions prepared with different amounts of dilute NaOH
solutions are shown graphically in figure 34. The data show that using small amounts of NaOH
for emulsification increased the MgO recovery, but high doses were proven to be detrimental.
Optimum flotation was achieved when using 0.034 kg/t technical grade NaOH. The carbonate
94
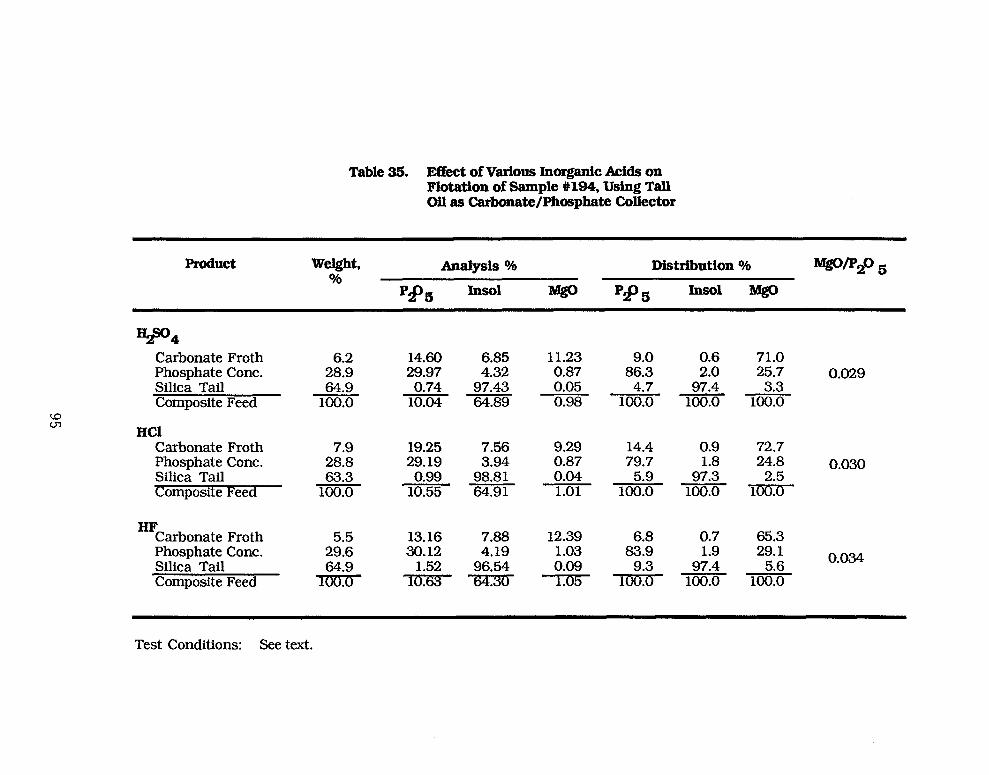
Table 35. Effkct of Various Inorganic Acids on Flotation of Sample #MM, Using Tall Oil as Carbonate/Phosphate Collector
Product Weight, %
Distribution % Analysis % -EP 5
Pdb Ins01 psP5 Insol Mgo
-4 Carbonate Froth Phosphate Cont. Silica Tail Composite Feed
HCl Carbonate Froth Phosphate Cont. Silica Tail composite Feed
HF Carbonate Froth Phosphate Cont. Silica Tail Composite Feed
6.2 14.60 6.85 11.23 28.9 29.97 4.32 0.87 64.9 0.74 97.43 0.05
100.0 10.04 64.89 0.98
2;*:
1oo.o 63’3
29.19 19.25 3.94 7.56
10.55 0.99 64.91 98.81
5.5 13.16 7.88 12.39 29.6 30.12 4.19 1.03
9.29 0.87 0.04 1.01
8::: 0.6 71.0 2.0 25.7 0.029
4.7 97.4 3.3 -- 100.0 100.0 100.0
14.4 0.9 72.7 79.7 1.8 24.8 0.030
5.9 97.3 2.5 100.0 100.0 XXID-
6.8 0.7 65.3 83.9 1.9 29.1
Tr&i- 1E 100.0 5.6 0.034
Test Conditions: See text.
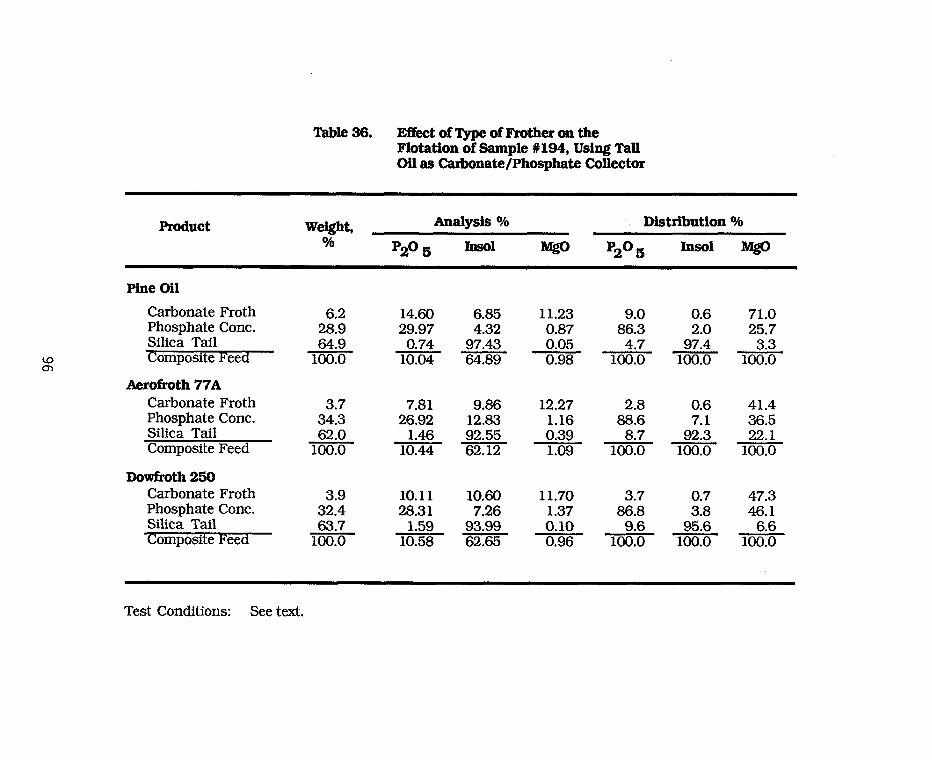
Table 36. Effkct of Type of Frother on the Flotation of Sample #194, Using Tall Oil as Carbonate/Phosphate Collector
Product Weight, Analysis % % PsOs JufEol
Distribution I
‘Z”5 Iusol Mgo
Pine Oil
Carbonate Froth Phosphate Cont. Silica Tail Composite Feed
Aerofroth 77A Carbonate Froth Phosphate Cont. Silica Tail Composite Feed
Dowfroth 250 Carbonate Froth Phosphate Cont. Silica Tail Composite Feed
6.2 14.60 6.85 11.23 9.0 0.6 71.0 28.9 29.97 4.32 0.87 86.3 2.0 25.7 64.9 0.74 97.43 0.05 4.7 97.4
100.0 3.3
10.04 64.89 0.98 100.0 100.0 100.0
3.7 34.3 62.0
100.0
3.9 32.4 63.7
100.0
7.81 9.86 12.27 2.8 0.6 41.4 26.92 12.83 1.16 88.6 7.1 36.5
1.46 92.55 0.39 8.7 92.3 22.1 10.44 62.12 1.09 100.0 100.0 100.0
10.11 10.60 11.70 3.7 iii:;
473 28.3 1 7.26 1.37 86.8 46:1
1.59 93.99 0.10 9.6 95.6 6.6 10.58 62.65 0.96 100.0 100.0 100.0
Test Conditions: See text.

froth analyzed 12% P2O5 and 12% MgO. The MgO rejection was 71%. Also, good phosphate
flotation was achieved under this condition. In the absence of NaOH, the MgO rejection was
about 42%. The emulsifying effect of NaOH may be attributed to the in situ formation of a fatty
acid soap, which acts as emulsifying agent. The observed drop in the MgO recovery at 1.2
kg/ton NaOH may be due to the fatty acid conversion to sodium soaps which became inactive
after precipitation by the dissolved Ca++ and Mg++ ions in the pulp.
The use of methyl alcohol as the disperser for tall oil/pine oil mixtures is based on its
complete solubility in both the oil and water phase. Figure 35 shows that this reagent did not
give as good a result as was obtained with the NaOH emulsified collectors. Therefore, dilute
NaOH continued to be used as emulsifying agent.
Water Qualitv and Carbonate Flotation Time
Tests were conducted on sample #194 to compare the use of plant process water (obtained
from IMC) with Tuscaloosa tap water. The test conditions used were those established as giving
the best response for carbonate and phosphate flotation, i.e., 1.5 kg/t oleic acid added in three
steps, 16% pulp solids, etc. However, in order to ascertain the effect of flotation time also, the
carbonate froth was collected for one minute instead of the usual three minutes.
Typical results are shown in table 37. The first two tests in the table (tables 37a & b) show
that IMC process water compares favorably with Tuscaloosa tap water. During the tests,
however, H2SO4 consumption for pH regulation was observed to be slightly higher for the test
with process water. In a third test (shown in table 37c) the carbonate froth was collected in
three one-minute increments. Note that the MgO grade of the phosphate concentrates in tables
37 a & b are higher than that in table 37c. This indicates that 1 minute flotation time was not
enough to remove sufficient carbonate gangue, to ensure a phosphate concentrate analyzing
less than 1% MgO.
Examination of the carbonate froths (of table 37C) by point counting (figures 36 to 38)
showed that the carbonate gangue content of the product is affected by flotation time, and by
unavoidable conditioning resulting from pulp agitation during flotation. With each successive
froth, the cumulative proportion of the calcite/dolomite decreased while the proportions of
98

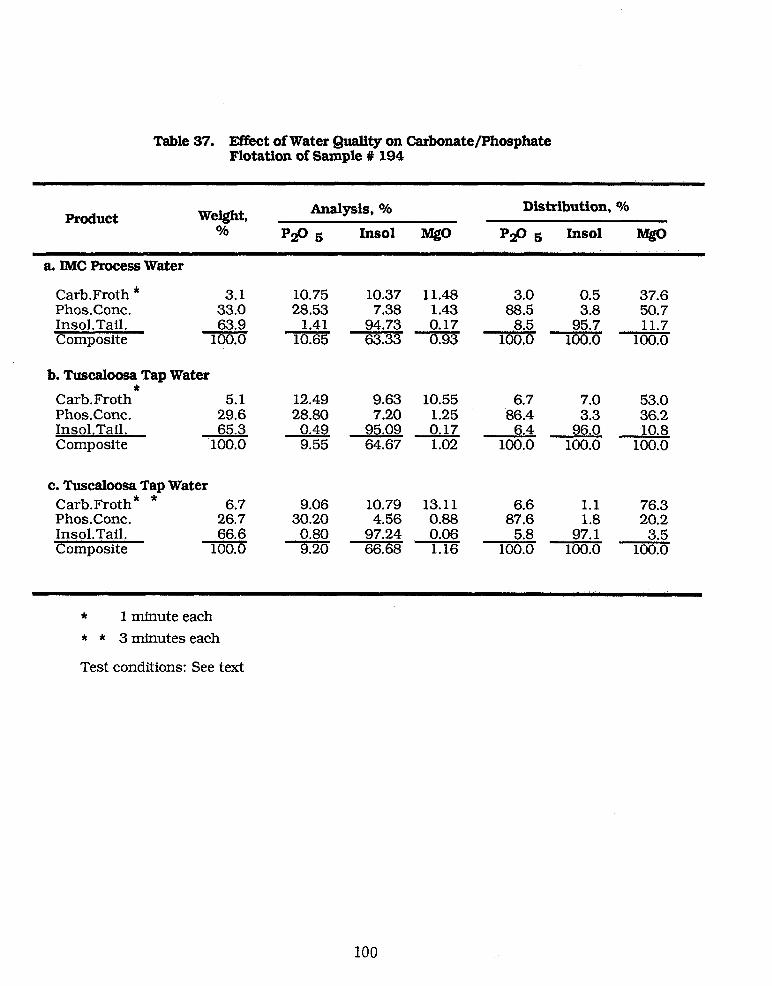
Table 37. E%ect of Water @mlity on Carbonate/Phosphate Flotation of Sample # 194
Product We&$& %
Analysis, 96 Distribution, %
Pfl6 Ins01 MgO w 6 Ins01 MgO
8. IMC Process Water
Carb.Froth * Phos.Conc. Insol.Tail. Composite
3.1 33.0 63.9
100.0
b. Tuscaloosa Tap Water
Carb.Froth* 5.1 Phos.Conc. 29.6 InsoLTail. 65.3 Composite 100.0
c. Tuscaloosa Tap Water
Carb.Froth* * 6.7 Phos.Conc. 26.7 Insol.Tail. Composite
66.6 100.0
10.75 10.37 11.48 3.0 0.5 28.53 7.38 1.43 88.5 3.8
1.41 94.73 8.5 95.7 10.65 63.33
0.17 0.93 100.0 100.0
12.49 9.63 10.55 28.80 7.20 1.25
0.49 95.09 0.17 9.55 64.67 1.02
9.06 30.20
0.80 9.20
10.79 13.11 4.56 0.88
97.24 66.68
0.06 1.16
6.7 7.0 86.4
6.4 100.0
6.6 1.1 76.3 87.6 1.8 20.2
5.8 97.1 3.5 100.0 100.0 100.0
37.6 50.7 11.7
100.0
53.0 36.2 10.8
100.0
* 1 minute each
* * 3 minutes each
Test conditions: See text
100

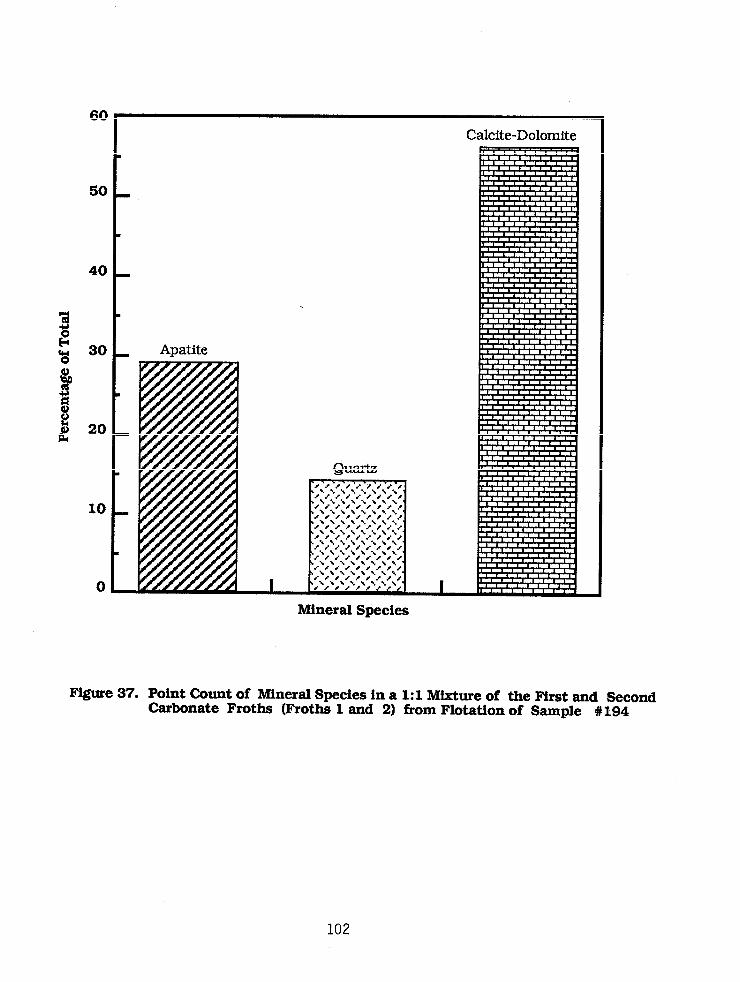
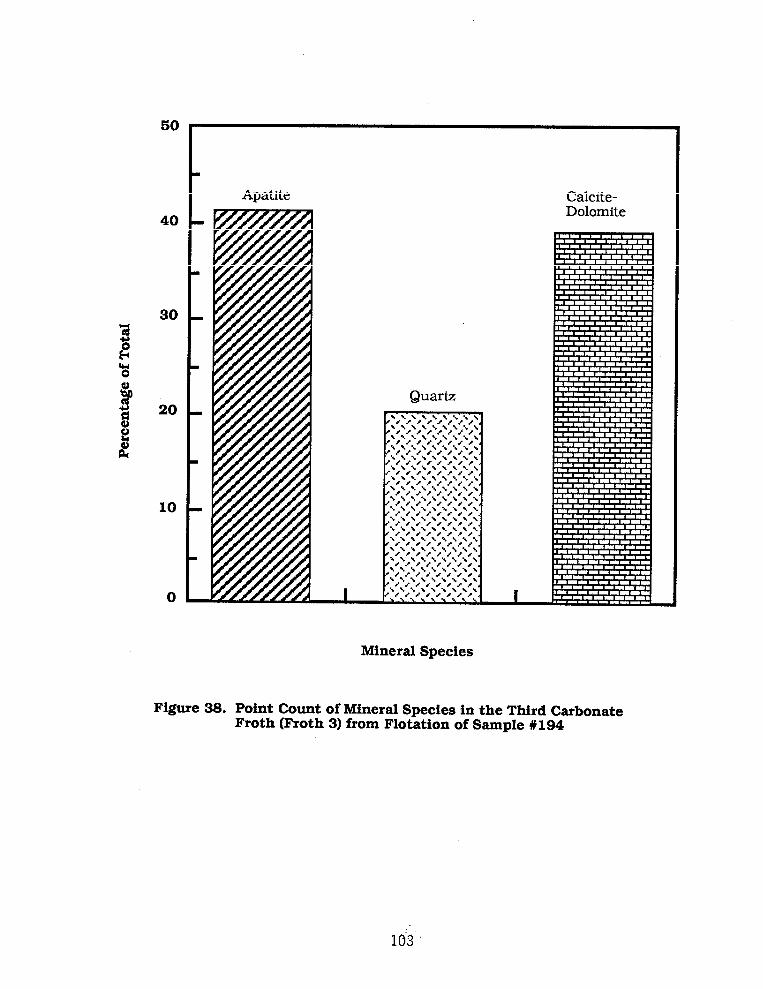

quartz and apatite increased. Thus, most of the carbonate gangue minerals were removed at
the earliest stage of carbonate flotation.
The point counts of the phosphate concentrate and the insoluble tails are shown in figures
39 and 40, respectively. Both show a clean separation, thereby validating the effectiveness of
the phosphate recovery step. However, as the analyses of the phosphate concentrates in table
37 show, carbonate gangue material not removed during the first step (carbonate flotation step)
will be removed along with the phosphates during the second step (phosphate flotation step).
104

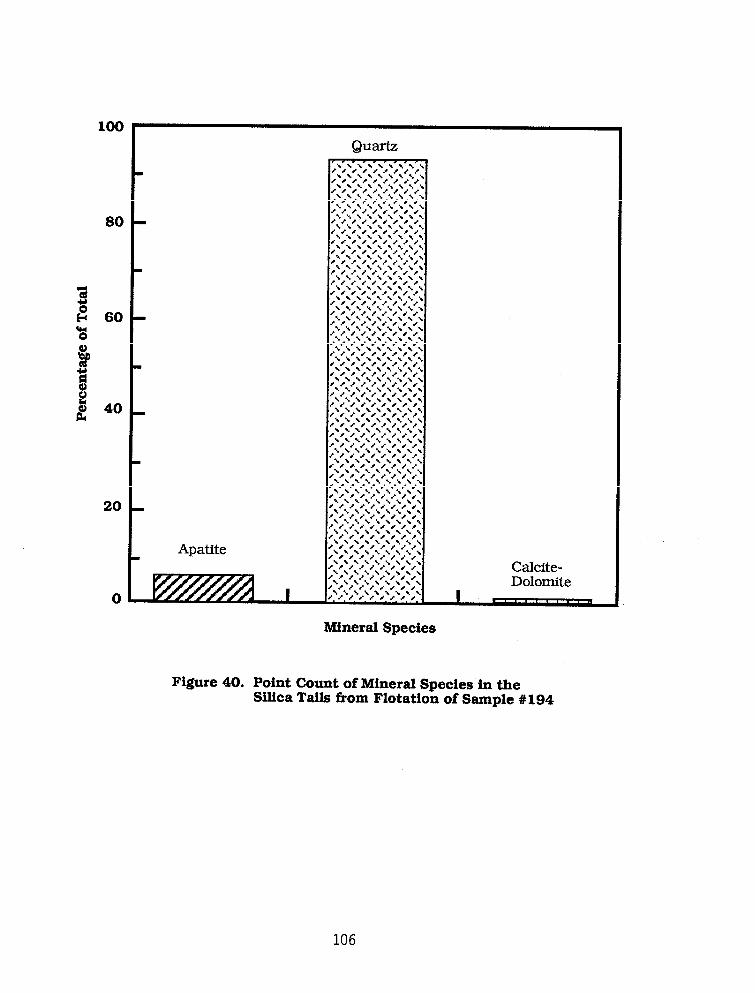

PROCESS APPLICATION STUDIES
The objectives of this part of the investigation were to evaluate the performance of the
process in treating various dolomitic Florida phosphate matrices and to modify the process for
use in current phosphate flotation circuits.
For this purpose, six (siliceous-dolomitic-limestone- and siliceous) phosphate samples
representing major phosphate reserves in south and central Florida, were beneficiated using
the MRI carbonate phosphate flotation process. On the basis of their MgO analysis, the
samples selected were classified as high in MgO (i.e., insol free MgO is greater than 1 percent),
or, low in MgO (i.e., insol free MgO is less than 1 percent). The two-step carbonate and
phosphate flotation process was applied to the high MgO samples. However, a direct phosphate
flotation procedure for selective phosphate/silica separation was applied to the low MgO
samples.
The flotation tests were made using the optimum conditions and reagent combinations
used in the process development study. Oleic acid was used as collector during the initial stages
of process application to develop base-line data and to identify possible process modification.
Final testing was made using a number of commercial grade collectors supplied by the
phosphate industry as substitutes for pure oleic acid.
Samples Tested
The test samples were obtained from the following companies: W.R. Grace (WRG) Company,
Agrico Mining Company (AMC), International Minerals and Chemicals Corporation (IMC) and
Occidental Chemicals Company (OCC). The WRG and AMC samples were run-of-mine
materials, and were received during the first year of this study. The IMC and OCC samples were
received during the second year and were, respectively, plant feed and as-mined material.
Mineralogic and chemical characterization of the AMC samples, designated # 189, # 190
and # 191 and their liberation properties were presented earlier. The characterization studies
of the WRG sample, designated # 197, revealed that it is very similar to sample #194. The TVA
characterization report on sample #197 is appended to this report.
107
Flotation Feed Preparation
The Agrico (AMC) samples #189, #190 and #191 were prepared as detailed earlier in figure
13. The procedure, however, excluded any crushing or grinding of the plus 35 mesh material.
Thus, the flotation feeds of the three AMC samples represented only the natural 35 x 150 mesh
primary material obtained by mild attrition scrubbing, wet screening and desliming. The
deslimed material was split to 500g batches and stored wet.
Sample # 197 was also prepared mainly by attrition scrubbing, wet screening and
desliming, but involved some selective crushing, as detailed in figure 41. Because of the
difference in the P2O5 and MgO contents of the coarse (4 x 35 mesh) and fine (35 x 150 mesh)
fractions, two flotation feeds were prepared from this sample and tested separately. The
naturally occurring 35 x 150 mesh material in the sample was designated the primary 35 x 150
mesh feed and was obtained by attrition scrubbing and wet screening. Another 35 x 150 mesh
material was obtained by roll crushing and wet screening and designated secondary 35 x 150
mesh feed (thus, the term primary indicates the size fraction is naturally occurring while the
term secondary indicates it was obtained by crushing or grinding a coarser material).
The size distribution and chemical analysis of the “primary” and “secondary” size
fractions obtained from sample #197 are shown in table 38.
Heavy liquid separation at S.G. 2.95 and S.G. 2.72 were made to determine the liberation
properties of the primary and secondary 35 x 150 mesh fractions of sample #197. The
sink/float results are shown in table 39. The data indicate that silica liberation in the
secondary material was only 62% compared to about 99% in the primary flotation feed. Most
of the free carbonate minerals and carbonate/phosphate locked particles reported to the S
2.72/F 2.95 gravity fraction. The fraction of locked particles in the secondary material (about
36% by weight) is nearly three times as much as in the primary material; moreover, the locked
portion of the secondary fraction also analyzed about 4.6% MgO while that of the primary
portion was about 2% MgO.
The other samples obtained from IMC (sample #214), and the deslimed “high mag” material
(sample #213) obtained from OCC, were prepared by wet screening at 35 and 150 mesh to obtain
108

Run-of-Mine (ROM)
I Cone and Quartering I
25% by weight
Slurry through 4 mesh screen
MixinPump Q 4oYo solids
+4 mesh
Attrition and Wet Screen 8 35 mesh
Wet Screen Q24mesh
+
4x24mesh
+ Roll Crusher
35xOmesh
1
Z4x35mesh Primary
Wet Screen + Q 20 mesh
Attrition and Wet Screen @ 150 mesh
Attrition and Wet Screen Q 24 mesh
+
1
I- 15Oxpme@l
Primary Slimes
+
35 x 150 mesh Primary Flot .Feed
Secondary Secondary
I Attrition and Wet Screen @ 15Omesh
I
150xOmesh 35x 15Omesh
Secondary Slimes Secondary Flot.Feed
Figure 41. Flowsheet of Sample #197 Preparation of Primary and Secondary Flotation Feeds
109
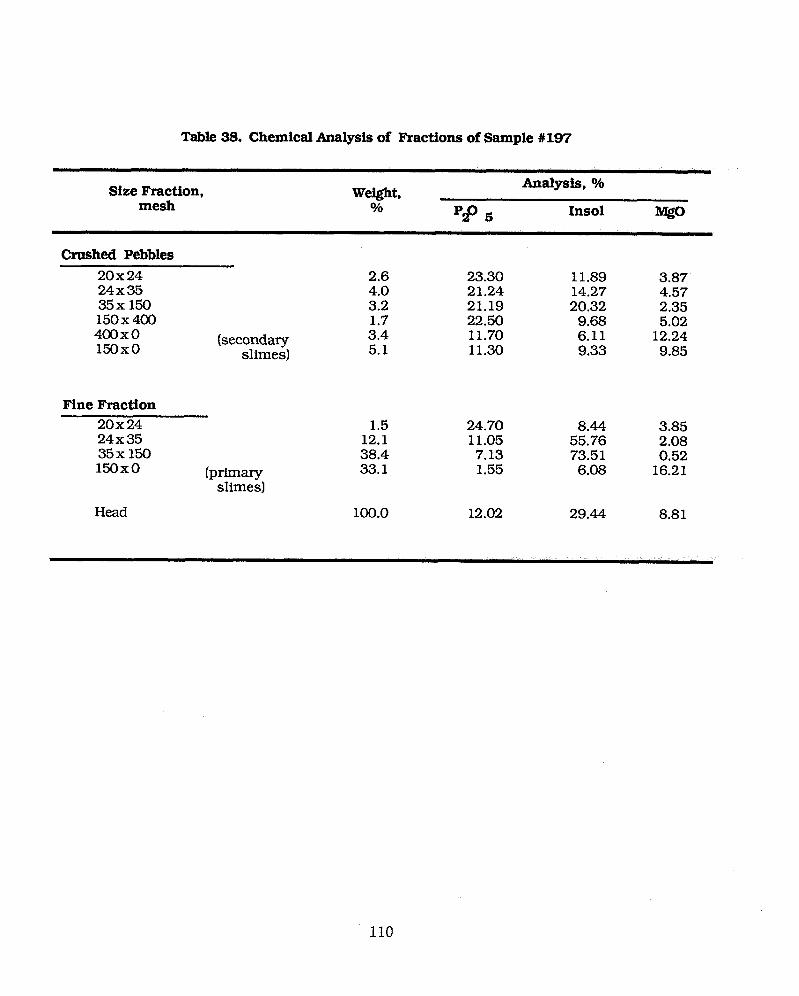
Table 3S. Chemical Analysis of Pkactions of Sample #197
Size Fraction, mesh
Weight, %
p2° 5
Analysis, %
Ins01
Crushed Pebbles 20x24 24x35 35 x 150 150x400 400x0 150x0
(secondary slimes)
Fine Fraction 20x24 24x35 35x 150 150x0 (primuy
slimes)
1.5 24.70 12.1 11.05 38.4 7.13 33.1 1.55
Head 100.0
2.6 23.30 11.89 3.87 4.0 21.24 14.27 4.57 3.2 21.19 20.32 2.35 1.7 22.50 9.68 5.02 3.4 11.70 6.11 12.24 5.1 11.30 9.33 9.85
5:.% 73:51
6.08
3.85 2.08 0.52
16.21
12.02 29.44 8.81
110
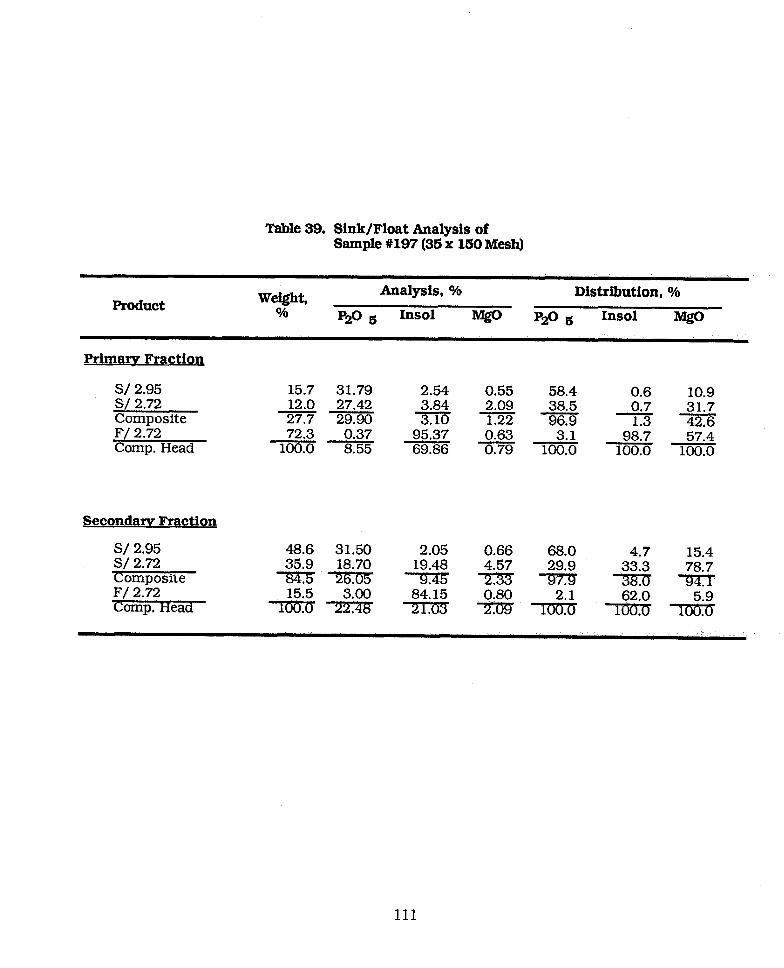
Table 39. Sink/Float Analysis of Sample #197 (36 x 150 Mesh)
Product Weight, %
Analysis, %
pi@ 5 Ins01
Distribution, O/o
?20 5 Ins01 Mg0
Primarv Fraction
s/ 2.95 S/ 2.72 Composite
F/ 2.72 Comp. Head
15.7 31.79 2.54 0.55 58.4 0.6 10.9 12.0 27.42 3.84 2.09 38.5 3.10 0.7 27.7 29.90 1.22 31.7 96.9 1.3 42.6
72.3 0.37 95.37 100.0 0.63 3.1 98.7 57.4 8.55 69.86 0.79 100.0 100.0 100.0
Secondarv Fraction
s/ 2.95 Si 2.72 Qomposite F/ 2.72 Camp.
48.6 31.50 2.05 0.66 68.0 4.7 15.4 35.9 18.70 19.48 4.57 29.9
-FrK5”z(TTosmmm~,~~ 15.5
-rwczra
111

the 35 x 150 mesh standard flotation feed. No liberation studies were made on these samples.
Table 40 shows the chemical analyses of all the flotation feeds prepared for the process
application studies.
Flotation of High MgO Phosphates
Samples with an “insol free” analysis greater than 1% MgO were considered high in MgO
(table 40) and were subjected to the standard two-step carbonate and phosphate flotation
process. A summary of the standard operating conditions used in studying the application of
the process to the phosphate matrices were as follows:
Initial Pulp Solids, % 16%
Impeller Speed, RPM 1100
Cell Volume, cc 1500
Flotation Feed Size, mesh 35x150
Weight of Feed, gm, dry basis 250
Air Flow Rate, SLPM 2.1
The first step or “the carbonate flotation step” was designed for maximum removal of the
carbonate-rich particles in a “carbonate froth”. The second step, phosphate flotation, was used
to recover most of the phosphate rich particles in the froth leaving a finished “silica tailing” as
cell-product. The samples tested were samples #190, #191 and #197. To avoid surface
contamination and aging effects, flotation feed was scrubbed for 5 minutes (in the flotation)
cell and deslimed by decantation prior to flotation.
Flotation Procedure
For carbonate flotation, unless otherwise stated, 250 gram batches (dry basis) of the 35 x
150 mesh flotation feed were pulped with Tuscaloosa tap water to about 16% solids and mixed
for about 1 minute at 1100 rpm. The mixed pulp was adjusted to pH 5.5 + 0.1 with dilute sulfuric
acid (10%), then a freshly prepared collector (usually 1.5 kg/t fatty acid) and frother (0.1 kg/t
pine oil) mixture, emulsified with 5 drops of 5% NaOH, were added in three equal doses to the
pulp. Aeration commenced immediately after each collector addition, and the froth collected
for 2-3 minutes at a constant pulp pH of 5.5.
112

Table 40. Process Application Test Samples
Sample No.
Analysis, % Source Test Feed Size,
mesh Total Insol-Free wp205
P20s Ins01 Mgo p2°5
189
190
191 c-l G 197
197
197
197
213
214 IMC
AMC
AMC
AMC
WRG
35x150 * 6.51 79.92 0.12 32.5 0.60 0.018
35x150* 4.25 85.61 0.20 29.5 1.40 0.047
35x150* 7.22 76.34 0.28 30.5 1.18 0.039
35x150 * 6.64 76.00 0.46 27.7 1.92 0.069
35x150 w 21.11 22.31 2.49 27.2 3.21 0.152
15Ox4cc 22.99 5.31 5.00 24.3 5.28 0.217
24x35 ** 23.19 11.21 4.72 26.1 5.32 0.204
35x150* 8.82 72.57 0.10 32.1 0.36 0.011
35x150* 8.98 72.81 0.12 33.0 0.44 0.013
* Primary size Fraction # Secondary Size Fraction
In tests of sample #197, carbonate flotation was usually carried out in three steps. In the
tests of samples #190 and 191, the carbonate flotation was conducted in one or two steps. In
each step 0.5 kg/t collector was added.
The cell product obtained after carbonate flotation was conditioned for about 3 minutes at
pH 6 with 0.5 kg/t sodium silicate to depress the siliceous gangue. This was followed by 2
minutes conditioning with 0.25 kg/t fatty acid, prior to flotation of the phosphate, at a
constant pH of 6.
Flotation of Sample #l90
Initial testing of the sample indicated poor flotation response to the standard
carbonate/phosphate process. After changing some of the tests conditions, satisfactory
flotation results were obtained as shown in table 41. In the first test, carbonate flotation was
conducted at pH 5.5 using the normal 3-step, 0.5 kg/t oleic acid collector addition, but
phosphate flotation was made with 0.5 kg/t oleic acid. The rougher phosphate concentrate
produced analyzed 25.73% P2O5, 17.53% insol and 0.81% MgO. The P2O5 recovery of 64.3%
was obtained at a ratio of concentration of about 6.
In the second test, carbonate flotation was made at pH 5.5 with one addition of 0.5 kg oleic
acid. This was followed by conditioning with sodium silicate, and phosphate flotation at pH 6
using 1.0 kg/t oleic acid. The rougher phosphate concentrate produced under these conditions
analyzed about 27% P205 14.3% insol, 0.8% MgO. The P2O5 recovery was 75.7% and the ratio
of concentration was about 7. The MgO rejection in the carbonate froth and silica tailings
amounted to about 54%.
The above results suggest that more collector was required for phosphate than for
carbonate flotation. The grade of the phosphate concentrates produced of 26-27% P2O5 and
about 0.8% MgO may be acceptable in terms of MgO/P2O5 ratio of about 0.03, but it does not
represent a finished marketable product. Higher grade phosphate concentrates may be
produced by reflotation of the rougher flotation concentrate to remove some of the
mechanically entrained silica impurities. The slightly lower selectivity in phosphate/silica
flotation separation may be attributed to the high clay content of this sample.
114

Table 41. Flotation of Sample X190
Prduct we&W, %
Analysis, % Distribution, %
p2° 5 Ins01 Mgo p2° 6 Ins01 MgO
a
Carb. Froth 1.6 13.78 44.91 2.10 4.9 0.8 16.5 Phos. Cont. 11.2 25.73 17.53 0.81 64.3 2.3 44.7 Tailings 87.2 1.58 93.99 0109 30.8 96.9 38.8 Composite 100.0 4.47 84.66 0.20 100.0 100.0 100.0
Carbonate Flotation: pH 5.5; 3 steps, with 0.5 kg/T oleic acid each.
Phosphate Flotation: pH 6.0; 3 minutes conditioning, with 0.5 kg/T Na silicate and 0.5 kg/T oleic acid.
b.
Carb. Froth 11.66 47.04 2.90 1.5 0.3 Phos.
7.6 Cont. 27.03 14.27 0.79 75.6 1.9 46.5
Carbonate Flotation: pH 5.5; 1 step, with 0.5 kg/T oleic acid.
Phosphate Flotation: pH 6.0; 3 minutes conditioning, with 0.5 kg/T Na silicate and 1.0 kg/T oleic acid.
115
Initial tests had shown that the flotation behavior of this sample is similar to sample
#190. The standard flotation procedure was modified to include two additions of 0.5 kg/t oleic
acid for carbonate flotation and 0.75 kg/t for phosphate flotation. Table 42 shows typical
results obtained under these conditions. The first test shown in table 42 produced a
concentrate analyzing 28.0% P205, 11.1% ins01 and 0.78 MgO with about 69% of P205
recovery. In this test the feed was prepared by the standard 5 minutes scrubbing and desliming
procedure. The second test, conducted on a 10 minute scrubbed and deskned flotation feed
produced higher grade flotation concentrates of about 29.0% P205. 8.7% ins01 and 0.89 MgO.
and the P205 recovery was improved to about 78O/6. Higher grade products can be achieved by
refloating (cleaning) the rougher concentrates to reject mechanically entrained silica. As in
the case of sample #190. more MgO was rejected in the silica tailings than the carbonate froth.
Flotation of SamDle 8197 Priman
The natural 35 x 150 mesh size fraction of sample #197 matrix was floated separately
because of its low P205 content and the nature of the carbonate impurities present. This
sample showed the best response to the optimized MRI process. Under standard conditions,
with 3-step collector additions of 0.5 kg/t carbonate flotation and one addition of 0.25 kg/t for
phosphate flotation, a phosphate concentrate analyzing 29.01% P205, 9.17% ins01 and 0.75%
MgO (MgO/P205 ratio of 0.026) was obtained (table 43). The P205 recovery was 80.3%. The MgO
rejection In the carbonate froth and t&g products was about 67%. The second test in table
43 shows that carbonate flotation can be completed with only two collector additions (i.e. total
of 1 kg/ton). The grade of the phosphate concentrate produced was 29.74O/6 P205, 7.73% insol
and 0.65% MgO (MgO/P205 ratio of 0.022) and the P205 recovery was 79.5%. It is anticipated
that reflotation of the rougher concentrate will produce a higher grade cleaner concentrate
with lower ins01 contents.
116

Table 42. Flotation of Sample #191
Product We&@& Analysis, % Distribution, %
% pP 6 Ins01 MgO p2° 5 Ins01 MgO
a Carb. Froth 1.0 15.53 18.30 3.63 2.3 0.2 14.6
Phos. Cont. 17.2 27.97 11.12 0.78 69.1 2.5 53.0
Tailings 81.8 2.43 92.09 0.10 28.6 97.3 32.4
Composite 100.0 6.95 77.42 0.25 100.0 100.0 100.0
Carbonate Flotation:
Phosphate Flotation:
10 minutes scrubbing followed by desliming; pH 5.5; 2 steps, with 0.5 kg/T oleic acid each. pH 6.0; 3 minutes conditioning, with 0.5 kg/T Na silicate; 3 steps, with 0.25 kg/T oleic acid and 2 minutes conditioning each step.
b. Carb. Froth 0.5 10.80 24.30 4.57 0.7 0.2 8.1
Phos. Cone. 20.0 28.88 8.>66 0.89 77.6 2.3 63.6
Tailings 79.5 2.04 93.00 0.10 21.7 97.5 28.3
Composite 100.0 7.46 75.77 0.28 100.0 100.0 100.0
Carbonate Flotation:
Phosphate Flotation:
10 minutes scrubbing followed by desliming; pH 5.5; 2 steps, with 0.5 kg/T oleic acid each. pH 6.0: 3 minutes conditioning, with 0.5 kg/T Na silicate; 3 steps, with 0.25 kg/T oleic acid and 2 minutes conditioning each step.
117
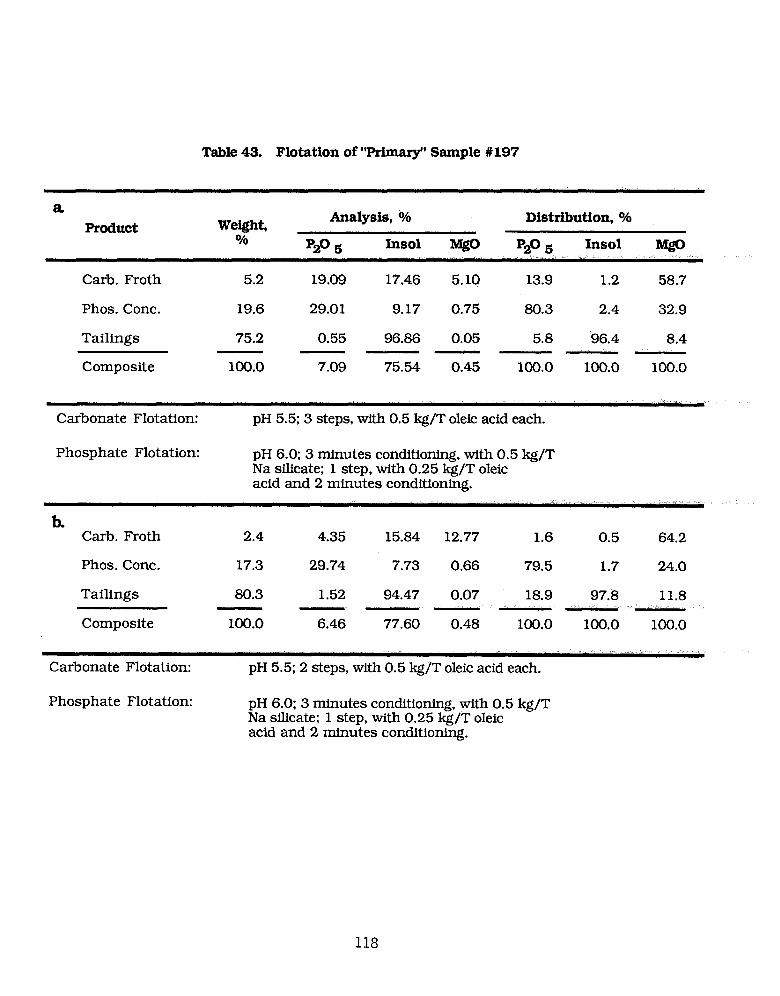
Tsble 43. Flotation of ‘Primary” Sample #197
a Product Weight,
Analysis, % Distribution, %
% *2o 5 Ins01 MgO *2o 5 Ins01 M@
Carb. Froth 5.2 19.09 17.46 5.1Q 13.9 1.2 58.7
Phos. Cont. 19.6 29.01 9.17 0.75 80.3 2.4 32.9
Tailings 75.2 0.55 96.86 0.05 5.8 96.4 8.4
Composite 100.0 7.09 75.54 0.45 100.0 100.0 100.0
Carbonate Flotation: pH 5.5: 3 steps, with 0.5 kg/T oleic acid each.
Phosphate Flotation: pH 6.0; 3 minutes conditioning, with 0.5 kg/T Na silicate; 1 step, with 0.25 kg/T oleic acid and 2 minutes conditioning.
b. Carb. Froth 2.4 4.35 15.84 12.77 1.6 0.5 64.2
Phos. Cont. 17.3 29.74 7.73 0.66 79.5 1.7 24.0
Tailings 80.3 1.52 94.47 0.07 18.9 97.8 11.8 ---
Composite 100.0 6.46 77.60 0.48 100.0 100.0 100.0
Carbonate Flotation: pH 5.5: 2 steps, with 0.5 kg/T oleic acid each.
Phosphate Flotation: pH 6.0; 3 minutes conditioning, with 0.5 kg/T Na silicate; 1 step, with 0.25 kg/T oleic acid and 2 minutes conditioning.
118

Flotation of Sample #197. (Secondary)
Several standard carbonate/phosphate flotation tests were made on the 35 x 150 mesh size
fraction of the secondary materials (crushed pebbles). Generally, more collector was needed to
complete the carbonate flotation, and the phosphate concentrates produced contained higher
than 1% MgO because of the high MgO content of the locked phosphate particles (table 39).
Typical test results obtained with 5 additions of 0.5 kg/t collector are shown in table 44. The
phosphate concentrates analyzed about 29% P2 O5, 4-8% insol. 1.47-1.52% MgO and the P2O5
recovery was 75%. The high collector consumption during the carbonate flotation step may be
related to variations in the mineralogic composition of carbonate mineral impurities and
their liberation characteristics in the crushed pebbles compared to the primary 35 x 150 mesh
size fraction.
As mentioned under the mineralogic studies section two types of dolomite were identified.
One was “soft” and the other “hard”. The soft dolomite aggregates were largely liberated and
selectively floated in the primary fraction while the hard dolomite particles were difficult to
liberate and therefore concentrated in the secondary 35 x 150 fraction. The sink/float data on
sample #197 shown earlier in table 39 confirms this conclusion. It clearly showed that the
primary feed contained only 12% of locked material (i.e., sink 2.72) while the secondary feed
contained about 36% of locked material. It appears, therefore, that locking between phosphate
and carbonate particles was one of the reasons for the inability to produce phosphate
concentrates lower than 1% MgO from the secondary feed. Another possibility is the difference
in the flotation behavior of the hard and soft dolomite particles.
In an attempt to improve the response of the secondary feeds, the 35 x 150 mesh material
was screened at 48 mesh and the 48 x 150 mesh portion tested under the same conditions as
indicated in table 44. The results obtained showed little improvement, in terms of P2O5 and
MgO analyses over those obtained by floating the 35 x 150 mesh secondary material.
Therefore. two other tests were conducted on the finer 150 x 400 mesh fraction of the
secondary feeds. The average results of these tests are given in table 45. The data show that the
150 x 400 mesh size fraction gave a good phosphate concentrate containing about 30% P2O5
with an MgO analysis of about 1%. This means that a better phosphate/carbonate separation
119
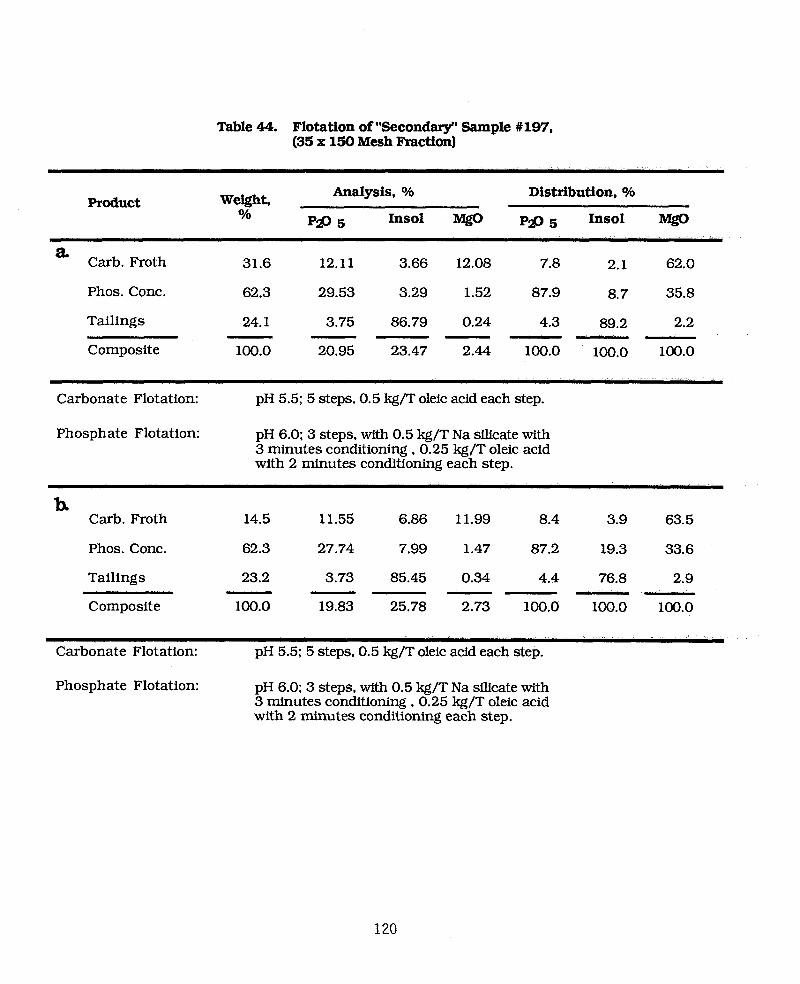
Table 44. Flotation of “Secondary” Sample #197, (35 x 150 Mesh Fraction)
Product JR&W, Analysis, % Distribution, %
% p1p 6 Ins01 MgO P!S5 Ins01 MgO
a Carb. Froth 31.6 12.11 3.66 12.08 7.8 2.1 62.0
Phos. Cont. 62.3 29.53 3.29 1.52 87.9 8.7 35.8
Tailings 24.1 3.75 86.79 0.24 4.3 89.2 2.2
Composite 100.0 20.95 23.47 2.44 100.0 100.0 100.0
Carbonate Flotation: pH 5.5; 5 steps, 0.5 kg/T oleic acid each step.
Phosphate Flotation: pH 6.0; 3 steps, with 0.5 kg/T Na silicate with 3 minutes conditioning , 0.25 kg/T oleic acid with 2 minutes conditioning each step.
b Carb. Froth 14.5 11.55 6.86 11.99 8.4 3.9 63.5
Phos. Cont. 62.3 27.74 7.99 1.47 87.2 19.3 33.6
Tailings 23.2 3.73 85.45 0.34 4.4 76.8 2.9
Composite 100.0 19.83 25.78 2.73 100.0 100.0 100.0
Carbonate Flotation: pH 5.5; 5 steps, 0.5 kg/T oleic acid each step.
Phosphate Flotation: pH 6.0; 3 steps, with 0.5 kg/T Na silicate with 3 minutes conditioning , 0.25 kg/T oleic acid with 2 minutes conditioning each step.
120

Table 45. Results of Cursory Flotation of the 150 x 400 Mesh Fraction of Sample #197
Product Weight %
Analysis, Oh Distribution, %
p2 05 hsd w p2 05 hlml WP
Carb. Froth 37.7 17.02 2.45 11.18 28.0 9.5 88.3 Phos. Cont. 45.1 29.99 8.81 1.04 59.1 41.1 9.8 Tailings 17.1 17.29 28.00 0.51 12.9 49.4 1.8 Composite 100.0 22.92 9.65 4.78 100.0 100.0 100.0
Test Conditions: Same as in Table 43.
121

can be achieved by using the more liberated finer sized flotation feed. Thus, fine grinding of the
phosphate-rich coarse and pebble fraction of sample #197 to sizes finer than 48 mesh would be
essential to recovering higher grade phosphate concentrates with lower than 1% MgO content.
Flotation of Low MgO Samples
This part of the study focused on samples with an insol free MgO less than 1%. Because of
the very low carbonate content of the samples, the standard carbonate/phosphate flotation
process being tested was modified to a direct phosphate flotation procedure. The samples tested
for direct phosphate flotation were samples #189, #213 and #214 from Agrico Mining
Company, Occidental Chemicals Company and International Minerals and Chemicals
Corporation, respectively.
Direct Phosphate Flotation Procedure
The 250 gram batches (dry basis) of 35 x 150 mesh deslimed feed were pulped in the flotation
cell to 16% solids and agitated at 1000 rpm. The pulp was then conditioned with 1-2 kg/ton
oleic acid collector for 3 minutes at pH 5.5-6.5. This may be followed by another 2 minutes of
conditioning with 0.2-0.5 kg/t of sodium silicate depressant at the same pH; phosphate
flotation was conducted for about 1-2 minutes. The rougher phosphate concentrate may be
cleaned by reflotation, at the same pH, and without the use of additional flotation reagents.
Flotation of Sample #l89
Initial tests indicated that direct phosphate flotation from sample #189 was very good at
pH 6.0, and using 1.5 kg/ton oleic acid and 0.5 kg/ton sodium silicate to optimize the reagent
consumption. Other tests were done at lower collector dosage in the presence and absence of
sodium silicate. Results of these tests are given in table 46. In the presence of 0.5 kg/ton
sodium silicate, the test made with 1.0 kg/t oleic acid produced a high grade phosphate product
analyzing 31.35% P2O5, 0.49% MgO and about 8% insol. The P2O5 recovery obtained was
about 88%. When the oleic acid dose was reduced to 0.5 kg/t the phosphate concentrate
produced was slightly lower in grade (30.0% P2O5, 12.36% insol and 0.5% MgO) and the P2O5
recovery decreased to 67.5%. Thus, the optimum oleic acid required to float sample #189 is
somewhere between 0.5 and 1.0 kg/t.
122

Table 46. Effect of Reagent Dmages on Flotation of Sample #189
Reagent Dose, kg/T Product Weight, Analysis, Oh Distribution, %
Oleic sodium % Acid Silicate p205 Ins01 - p2°5 Ins01 l&O
a. 1.0 0.5 Phos. Cont.
InsoLTail. Composite
b. 0.5 0.5 Phos. Cont.
Insol.Tail. Composite
cw E 0.0 0.0 Phos. Phos. Cont. Conc.2 1
Insol.Tail. Composite
18.7 31.35 7.94 0.49 88.3 1.9 82.4 81.3 0.96 96.35 0.02 11.7 98.1 17.6
100.0 6.65 79.78 0.11 100.0 100.0 100.0
15.0 30.02
** .
0.6 18.86 16.9 24.93
3.09 82.5 100.0 6.87
12.36 0.50 67.5
41.82 0.41 0.3 27.13 0.39 6:‘: 5.7 5E 90.65 0.07 37:1 94.0 45:9 79.65 0.13 100.0 100.0 100.0
Test Conditions: pH 6.0: 3minute conditioning. with 0.5 kg/T oleic acid and sodium silicate (as indicated) and flotation with 0.03 kg/T pine oil as frother.
123
The third test on sample #189, reported in table 46, was run at pH 6 without the use of
sodium silicate. Flotation was made in two steps after the addition of 0.5 kg/t of oleic acid
each. The first phosphate concentrate was insignificant and poor in grade. The phosphate
concentrate obtained with the second collector addition analyzed only about 25% P2O5 and
27% insol. The P2O5 recovery in the two steps was 63%.
The tests reported for sample #189 clearly demonstrated that at pH 6.0 sodium silicate
functioned as a depressant for the siliceous gangue and also as an activator for phosphatic
flotation. The dual effect of sodium silicate under slightly acidic conditions is an important
feature of the MRI direct phosphate flotation process. Further studies are required to
investigate this phenomena and its implication for current phosphate flotation practice.
Flotation of Sample #213
Table 47 shows the results of tests made with 1 kg/t oleic acid in the presence or absence of
0.5 kg/t sodium silicate. The test made with sodium silicate produced a rougher concentrate
analyzing 28.12% P2O5 and 11.84% insol. The P2O5 recovery was 82.2%. Higher grade
concentrates may be recovered by reflotation of the rougher product. The test made without the
use of sodium silicate gave a concentrate of slightly better quality but the P2O5 recovery fell by
nearly 20%. These tests confirm the beneficial effect of sodium silicate in direct phosphate
flotation.
Flotation of 8ample #214
The flotation response of this sample was similar to samples #189 and 213. Table 48 shows
that sample #214 yielded a concentrate analyzing about 30% P2O5 and 13% insol with a P205
recovery of 84.5% after flotation with 1 kg/t oleic acid and 0.5 kg/t sodium silicate (table 48).
Again higher grade concentrates can be recovered by product reflotation of this rougher
flotation product.
The above test results clearly demonstrate the technical feasibility of the new direct
phosphate flotation process. The process which involves fatty acid flotation of the phosphate
124
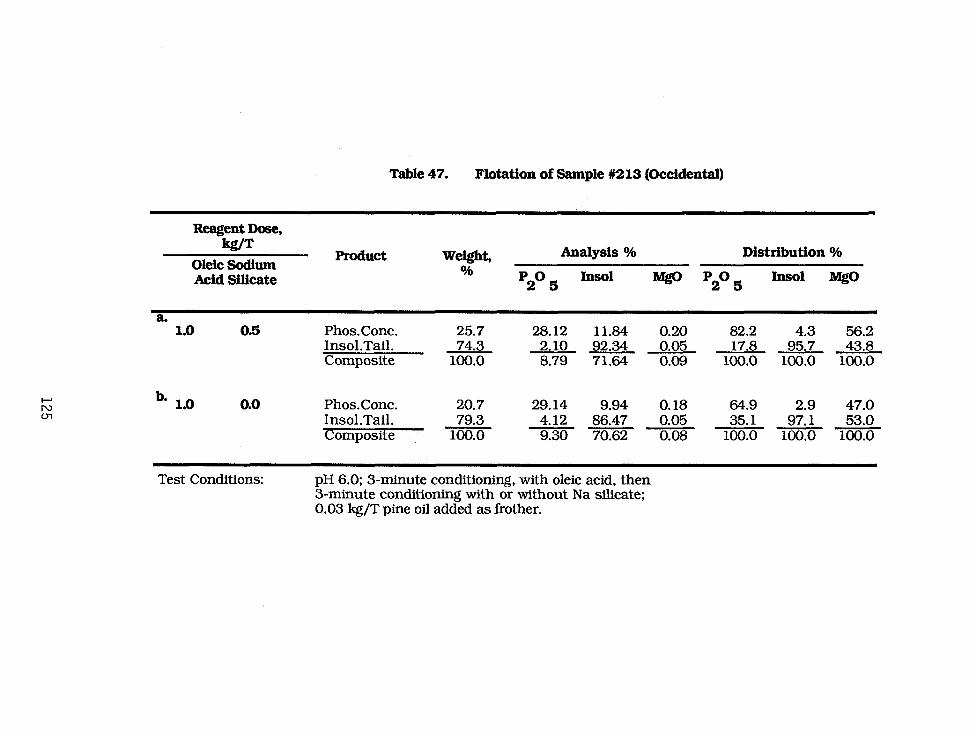
Table 47. Flotation of Sample #213 (Occidental)
Reagent Dose, hg/T
oleic !3odium Acid Silicate
Product We4W Analysis % Distribution %
% p2° 5
Ins01 l&Q p2°5
In!501 Mgo
a. 1.0 0.5 Phos.Conc. 25.7 28.12 11.84 0.20 82.2 4.3 56.2
Insol.Tail. 74.3 2.10 92.34 0.05 17.8 95.7 43.8 Composite 100.0 8.79 71.64 0.09 100.0 100.0 100.0
b* 10 . 0.0 Phos.Conc. 20.7 29.14 9.94 0.18 64.9 2.9 47.0 Insol.Tail. 79.3 4.12 86.47 0.05 35.1 97.1 53.0 Composite 100.0 9.30 70.62 0.08 100.0 100.0 100.0
Test Conditions: pH 6.0; 3-minute conditioning, with oleic acid, then 3-minute conditioning with or without Na silicate; 0.03 kg/T pine oil added as brother.

Table 48. Flotation of Sample Y214 (IMC)
Reagent Dose, kg/T
Olelc Sodium Acid Silicate
Product Weight, Analysis, Oh Distribution, Oh % Ins01 MgO pa0 6 so 6 Ins01 MgO
1.0 0.5 Phos.Conc. 25.9 29.64 12.80 0.42 84.5 4.6 77.6
Insol.Tall. 74.1 1.90 93.80 0.04 15.5 95.4 22.4 -- Composite 100.0 9.10 72.78 0.14 100.0 100.0 100.0
Test Condltlons : pH 6.0; 3-minute conditioning with 1 .O kg/T olelc acid. then 3 minutes conditioning wlth 0.5 kg/T Na stllcate; 0.03 kg/T pine oU added as brother.
at a pH of about 6 using moderate amounts of sodium silicate was applicable on all low MgO
samples. The rougher concentrates produced ranged from 28-31% P2O5 . Higher grade products
can be produced by refloating the rougher product.
Application of Commercial Collectors
Tests were made to investigate the performance of the 2-step carbonate/phosphate
flotation process using common commercial collectors such as “crude tall oil” (ITO) and a “fatty
acid blend" (IFA) as replacement for pure oleic acid. The commercial reagents tested were
supplied by IMC.
The two commercial collectors, IFA and ITO, were tested in combination with fuel oil to
evaluate their performance as replacement for oleic acid for the 2-step carbonate and
phosphate flotation. In each step the collectors were used as an emulsion of 0.5 kg/t collector
and equal amount of fuel oil #5. Fuel oil (FO) was included because of its function as collector
extender in commercial practice and to reduce collector consumption. Table 49 shows the
results of carbonate and phosphate flotation with two additions of the collector mixtures in
each step. The data show that the general performance of the fatty acid blend was superior to
that of the crude tall oil (ITO). Flotation with the IT0 collector was more selective in the
carbonate step than the phosphate step but higher reagent doses may be required. On the other
hand, flotation with IFA gave a combined phosphate concentrate analyzing 28.71% P2O5,
11.19% insol and 0.66% MgO with a P2O5 recovery of about 73%.
Results of other tests made to compare the performance of IFA, pure oleic acid and tall oil
are included in table 50. The three collectors tested produced comparable rougher phosphate
concentrates, but the P2O5 recovery appears to depend on the percent of active fatty acid
content of the collector. Further tests are needed to optimize the amount of collector and
cleaning steps required to achieve maximum P O2 5 grade and recovery. Nevertheless, the above
tests have demonstrated the applicability of commercial fatty acid collectors in the MRI
carbonate/phosphate flotation process under slightly acidic conditions.
127

Table 49. Flotation of Sample #197 (primary) with IFA or IT0 in a 1:l Combination with #6 Fuel Oil
Product We&W, O/b
Aualysis, % Distribution, %
w 5 Ins01 Mgo p!P 5 Ins01 MgO
a. IFA + F.O.
Carb.Froth 3.7 19.63 17.45 3.98 10.9 0.8 46.7 Phos.Conc. 16.9 28.71 11.19 0.66 72.9 2.5 35.6 Insol.Tail. 79.4 1.36 92.32 0.07 16.2 96.7 17.7 Composite 100.0 6.66 75.83 0.31 100.0 100.0 100.0
Carbonate Flotation: pH 5.5: 2 steps, with 0.5 kg/T IFA and 0.5 kg/T F.O. each: 0.03 kg/T pine oil as frother.
Phosphate Flotation: pH 6.0; 3-minute conditioning, with 0.5 kg/T Na silicate; 2 steps, with 0.5 kg/T IFA and 0.5 kg/T F.O. with 2-minute conditioning each step.
b. IT0 + F.O.
Carb. Froth 1.3 4.77 18.54 10.76 0.9 0.3 37.9 Phos.Conc. 11.1 26.80 14.73 1.06 44.1 2.1 31.6 Insol.Tail. Composite
87.6 4.24 86.26 55.0 97.6 30.5 100.0 6.75
0.13 77.42 0.37 100.0 100.0 100.0
Carbonate Flotation: pH 5.5: 2 steps, with 0.5 kg/T lT0 and O.fikg/T F.O. each; 0.03 kg/T pine oil as frother.
Phosphate Flotation: pH 6.0; 3-minute conditioning, with 0.5 kg/T Na silicate: 2 steps, with 0.5 kg/T IT0 and 0.5 kg/T F.O. with %-minute conditioning each step.
128
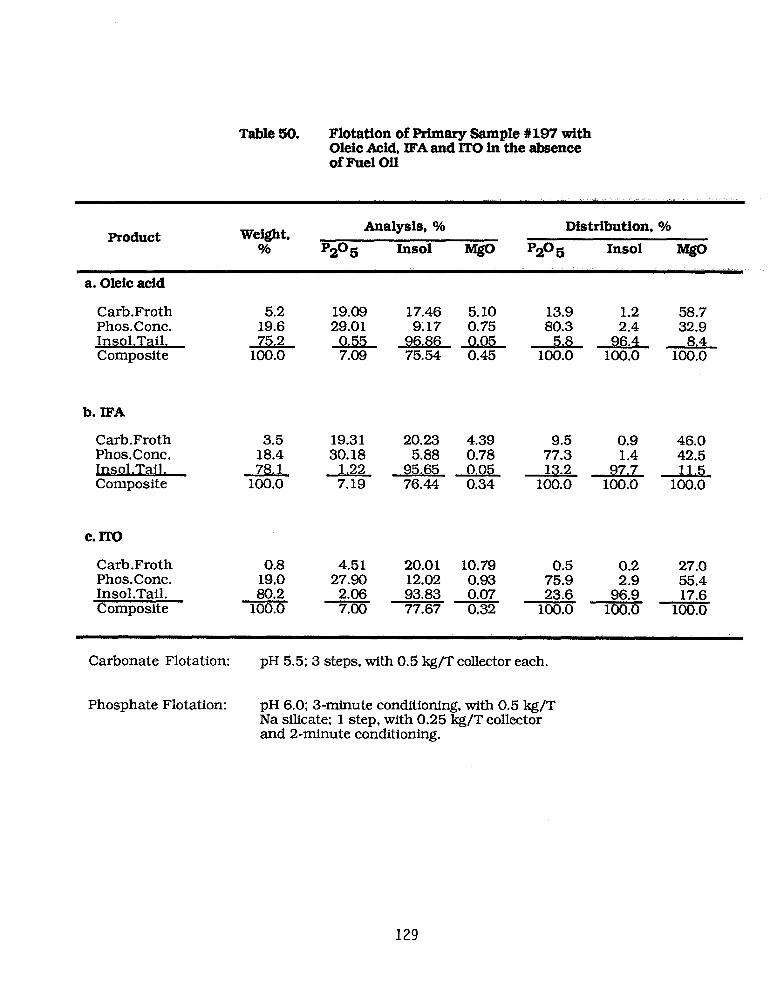
Table 50. Flotation of Primary Sample #197 with Oleic Acid, IFA and IT0 in the absence of Fuel Oil
Product We&W %
Analysis, % Distribution, %
pZ”5 Ins01 MgO p205 Ins01 MgO
a. Oleic acid
Carb.Froth 5.2 PhosConc. 19.6 Insol.Tail. 75.2 Composite 100.0
b. IFA
Carb.Froth 3.5 19.31 Phos.Conc. 18.4 30.18 Insol.Tail. 78.1 1.22 Composite 100.0 7.19
c. Im
Carb.Froth 0.8 4.51 20.01 10.79 Phos.Conc. 19.0 27.90 12.02 0.93 InsoLTail. 80.2 Composite
2.06 93.83 100.0
0.07 7.00 77.67 0.32
19.09 29.01
-?E .
17.46 5.10 13.9 1.2 58.7 9.17 0.75 80.3 2.4 32.9
20.23 4.39 5.88 0.78
--5%2-e
0.5 0.2 75.9 2.9 23.6 96.9
100.0 100.0
46.0 42.5
-ii%- .
27.0 55.4 17.6
100.0
Carbonate Flotation: pH 5.5; 3 steps, with 0.5 kg/T collector each.
Phosphate Flotation: pH 6.0; 3minute conditioning, with 0.5 kg/T Na silicate; 1 step, with 0.25 kg/T collector and a-minute conditioning.
129

Process Application Conclusions
The process application studies revealed that with slight modifications, samples of high or
low MgO siliceous phosphate matrices, representing major central Florida deposits, were
amenable to the standard procedure of the MRI carbonate/phosphate flotation process.
The degree of modification depended on the mineralogic composition of the matrix with
regard to MgO and insol contents.
Limited testing with commercial collectors indicated that a commercial grade collector
(fatty acid blend), supplied by IMC, may be effectively substituted in place of the oleic acid.
Grinding of the pebble fractions seems necessary to achieve adequate liberation and
acceptable products from flotation.
The phosphate flotation portion of the MRI process appears to be immediately applicable to
current plant practice in the Florida phosphate industry, and will obviate the need for deoiling
and cationic flotation to produce marketable products.
SURFACE CHEMICAL STUDIES
Surface chemical studies were conducted to complement the laboratory flotation studies.
The studies were aimed at examining the actual role of the critical process parameters and
mechanisms involved in carbonate/phosphate separation. Work completed involved oleic
acid adsorption and electrokinetic (zeta potential) measurements on the principal constituents
of the high MgO phosphate matrix, namely quartz, apatite/francolite and dolomite/calcite.
Materials and Methods
The individual mineral species studied were hand picked under a microscope, from the
liberated plus 14-mesh pebble fraction of the Four Corner’s sample #197. The selected ore
constituents were further purified by various physical separation techniques to increase
particle liberation and minimize slime coatings with other mineral impurities. The mineral
130

species prepared by these techniques may not be highly “pure” but they represent the "natural"
particles encountered in plant flotation conditions. Therefore, the terms “pure” or “natural”
mineral species were used interchangeably in the following sections.
Francolite
About 300 grams of the hand picked brown to dark brown apatite (francolite) particles were
first scrubbed with an equal amount of distilled water for 10 minutes, deslimed and washed
several times to ensure removal of surface contamination. The clean phosphate particles were
wet ground to minus 400 mesh, washed and filtered. The wet filter cake was stored in a plastic
container until used in adsorption and zeta potential measurements.
Dolomite
Hand picked yellowish brown dolomite/carbonate mixed particles consisted of fine
grained, soft aggregates of carbonate material and minor amounts of harder francolite
particles. The more friable dolomitic material was separated as slimes by strong attrition
scrubbing of the aggregates in distilled water at high percent solids followed by wet screening at
400 mesh to remove the hard impurities. About 300 grams of the minus 400 mesh slime
fraction representing the pure dolomite carbonate minerals was collected, filtered and stored
as moist filter cake until used for surface chemical studies.
About 20 grams of the hand picked quartz particles were leached with 1N HCl and
thoroughly washed prior to wet grinding to minus 400 mesh. The ground material was washed
and filtered. The wet filter cake was stored until used for zeta potential measurements.
Reagents
Analytical grade reagents, including supporting electrolytes, oleic acid, inorganic acids,
and alkalies were used in this study. Distilled water was used in all tests for solution and
suspension preparation.
131
The measurements were made on dilute suspensions of 0.1% solids in distilled water or in a
dilute solution of KNO3 as supporting electrolyte. About 100 ml portions of each mineral
suspension were adjusted to the required pH level by using HNO3 and KOH. The zeta potential
measurements of the mineral suspension were made within 2-5 minutes to conform with the
real time flotation conditions. A Model 501 Lazer Zee Meter with TV monitor and digital
readout of zeta potential was used to determine the zeta potential of the mineral particles.
Adsorption Measurements
The adsorption of oleic acid was conducted on 5-10 g (dry basis) mineral samples at
constant ionic strength of 2x10⁻³ M KNO3 and room temperature of 23 f 20C. Equilibration
was reached in less than 2 hours of mild shaking with oleic acid emulsions of predetermined
concentration. The oleic acid emulsion in methyl alcohol was used to overcome the limited
solubility of oleic acid in the slightly acidic pH’s of 4-6. Fresh emulsions were prepared by
dilution of a neutralized solution of 0.1M oleic acid in 10% methyl alcohol, with acidified
solutions of KNO3, to reach the required initial pH. The initial and final concentrations of
oleic acid were determined using the methylene blue dye-transfer method [18] with a standard
cationic surfactant to titrate the oleic acid emulsion. The method was accurate to + 3%. The
amount adsorbed per gram was calculated from the difference between the initial and final
concentrations of oleic acid.
FTIR Spectroscopy
Fourier Transformation Infrared Spectra (FTIR) were conducted on vacuum dried solids
before and after contact with oleic acid to determine the type of oleic acid species adsorbed on
the mineral surface and their relative concentration under various adsorption conditions.
Zeta Potential Studies
Tests were made to investigate the effect of critical flotation parameters such as pH, type of
pH modifier, time of conditioning and collector concentration on the surface chemical
132
properties of the major constituents of the matrix. Results obtained in absence of oleic acid
collector are discussed in the following sections:
Effect Of pH
The zeta potential measurements were made at various pH’s in distilled water and KNO3
electrolyte (2 x 10⁻³M) solutions for apatite, dolomite, and quartz. The results are shown
graphically in figures 42, 43 and 44. In the pH range, 2 to 11, the three minerals tested were
negatively charged. As expected, the zeta potential of three minerals became increasingly
negative in the alkaline pH range and less negative under acidic conditions, indicating the role
of H+ and OH- as potential determining ions.
Quartz gave a zero point of charge (ZPC) at a pH of about 2.5. This value is consistent with
published data for clean quartz. Apatite and dolomite, on the other hand, showed no charge
reversal up to pH 2.5. This may be attributed to surface contamination with compounds
containing silanol groups or slime coating of the surface with negatively charged clay
particles. Other contributing factors are the short conditioning time used prior to zeta
potential measurements and the reactivity of apatite and dolomite with the acid used in
controlling the pH. Moudgil[19]et al., reported equilibrium pH’s of about 8.2 for dolomite and
5.5 to 6.5 for sedimentary apatite (francolite) suspensions. They also showed that, within
acidic pH ranges, the solubility of dolomite was about ten times higher than apatite. The
solubility of quartz under these conditions was negligible. Therefore, attention was focused on
the effect of various acids on the zeta potentials of dolomite and apatite.
Effect of Inorganic Acids
Based on the flotation results reported earlier, four inorganic acids were selected to
investigate their effects on the zeta potential of dolomite and apatite. The acids used were HCl,
HNO3 , H2SO4 and H3PO4. Because of the strong reaction of these acids with the mineral
suspension, the zeta potential measurements were made within 3-5 minutes after preparation
of the suspension.
133

134

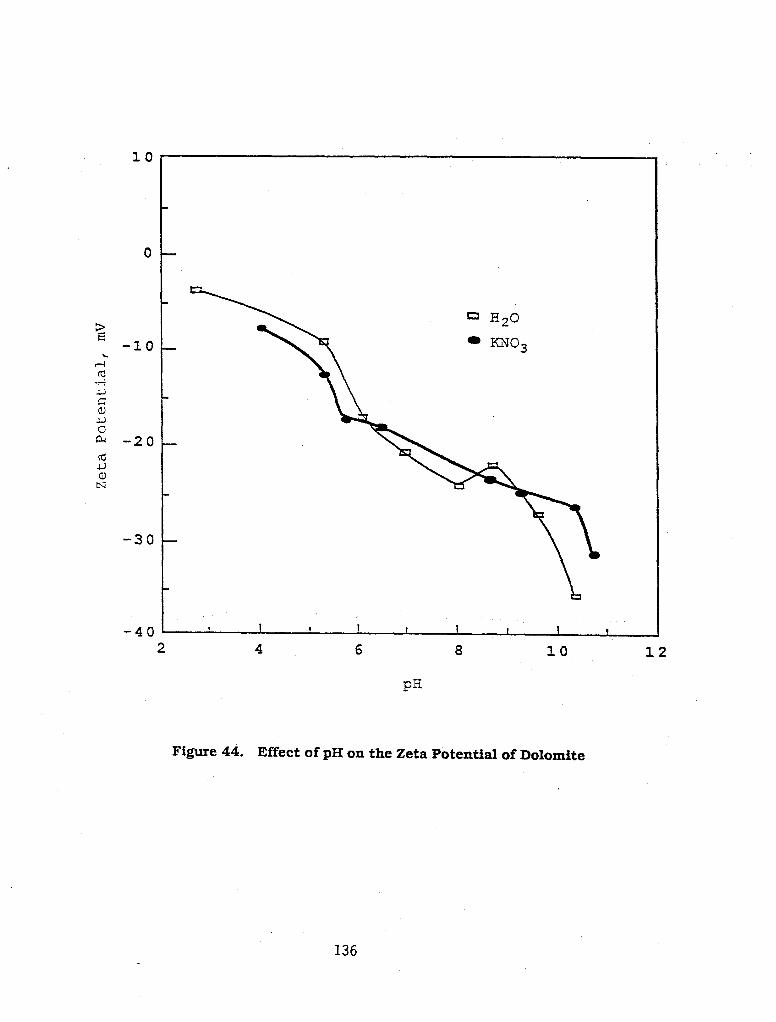

The zeta potentials of apatite and dolomite as a function of pH using the different acids are
shown in figures 45 and 46. The data indicate that the zeta potential of dolomite and apatite
particles depended not only on pH, but also on the type of acid used to control the pH, i.e., the
anionic species of the acid. The effects of the acids on zeta potential were most pronounced in
the pH range of 4 to 6 for dolomite, and pH 3 to 7 for apatite. In these pH ranges optimum
flotation of the carbonate and phosphate was achieved.
The specific effects of inorganic acids may be related to the reactivity and reaction products
of the acids with mineral surfaces. For example, the monovalent HCl and HNO 3 acids react
with carbonate and phosphate minerals and produce highly soluble Ca- and Mg- salts such as
CaCl 2 or Ca(NO3) compared to the reaction products of di- and trivalent H2SO4 and H3PO4
acids such as CaSO4 or Ca3(PO4) which are much less soluble and may precipitate on the
mineral surface. The exact mechanism by which these compounds modify the electrokinetic
properties of the minerals listed is not fully understood because of the complexity of the
solution chemistry of the systems. Other contributing factors may include the rate of
dissolution or formation of surface compounds, ionic strength and aging.
Oleic Acid Adsorption Studies
Adsorption and zeta potential measurements of the oleic acid collector, under slightly
acidic pH’s of 4-6, were made using freshly prepared micro-emulsions containing various
amounts of the collector. The micro-emulsions prepared were stable for more than 24 hours.
This allowed adsorption and zeta potential measurements at concentrations exceeding the
oleic acid solubility limit of 0.6 x 10⁻⁶ mole/liter[20].
The adsorption behavior of oleic acid on individual francolite and dolomite mineral
species was investigated at concentrations of 10-5 to 10-3M and at pH’s of 4 to 6. The amount of
collector adsorbed, in micromole/g of solid, was determined as the difference between the
initial and final (equilibrium) concentrations of the oleic acid micro-emulsions. About 20 ml
of the equilibrated suspension was taken for zeta potential measurements while the remainder
was centrifuged for 10 minutes to obtain a clear supernatant solution for titration.
137

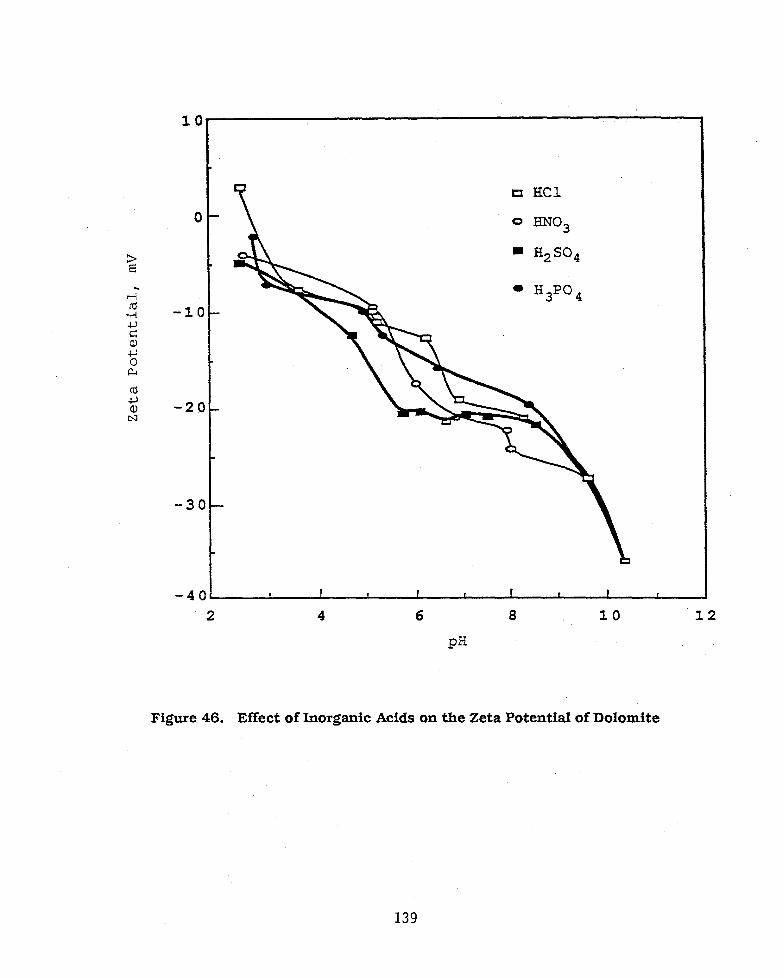
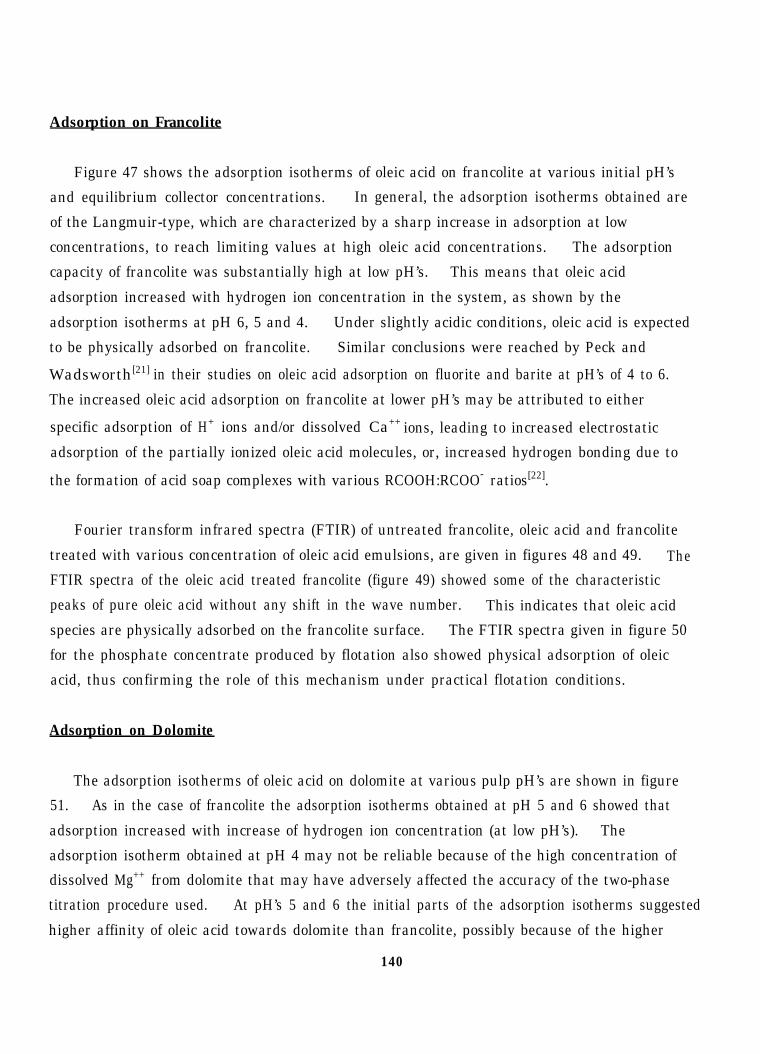
Adsorption on Francolite
Figure 47 shows the adsorption isotherms of oleic acid on francolite at various initial pH’s
and equilibrium collector concentrations. In general, the adsorption isotherms obtained are
of the Langmuir-type, which are characterized by a sharp increase in adsorption at low
concentrations, to reach limiting values at high oleic acid concentrations. The adsorption
capacity of francolite was substantially high at low pH’s. This means that oleic acid
adsorption increased with hydrogen ion concentration in the system, as shown by the
adsorption isotherms at pH 6, 5 and 4. Under slightly acidic conditions, oleic acid is expected
to be physically adsorbed on francolite. Similar conclusions were reached by Peck and
Wadsworth[21] in their studies on oleic acid adsorption on fluorite and barite at pH’s of 4 to 6.
The increased oleic acid adsorption on francolite at lower pH’s may be attributed to either
specific adsorption of H+ ions and/or dissolved Ca++ ions, leading to increased electrostatic
adsorption of the partially ionized oleic acid molecules, or, increased hydrogen bonding due to
the formation of acid soap complexes with various RCOOH:RCOO- ratios[22].
Fourier transform infrared spectra (FTIR) of untreated francolite, oleic acid and francolite
treated with various concentration of oleic acid emulsions, are given in figures 48 and 49. The
FTIR spectra of the oleic acid treated francolite (figure 49) showed some of the characteristic
peaks of pure oleic acid without any shift in the wave number. This indicates that oleic acid
species are physically adsorbed on the francolite surface. The FTIR spectra given in figure 50
for the phosphate concentrate produced by flotation also showed physical adsorption of oleic
acid, thus confirming the role of this mechanism under practical flotation conditions.
Adsorption on Dolomite
The adsorption isotherms of oleic acid on dolomite at various pulp pH’s are shown in figure
51. As in the case of francolite the adsorption isotherms obtained at pH 5 and 6 showed that
adsorption increased with increase of hydrogen ion concentration (at low pH’s). The
adsorption isotherm obtained at pH 4 may not be reliable because of the high concentration of
dissolved Mg++ from dolomite that may have adversely affected the accuracy of the two-phase
titration procedure used. At pH’s 5 and 6 the initial parts of the adsorption isotherms suggested
higher affinity of oleic acid towards dolomite than francolite, possibly because of the higher
140


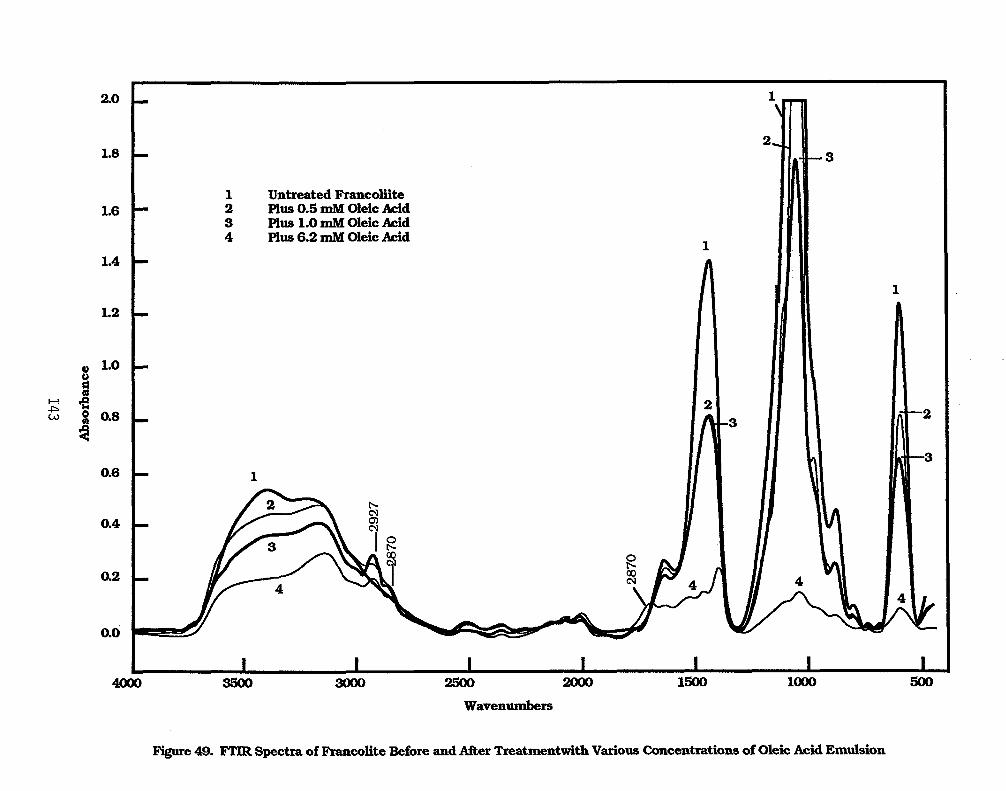
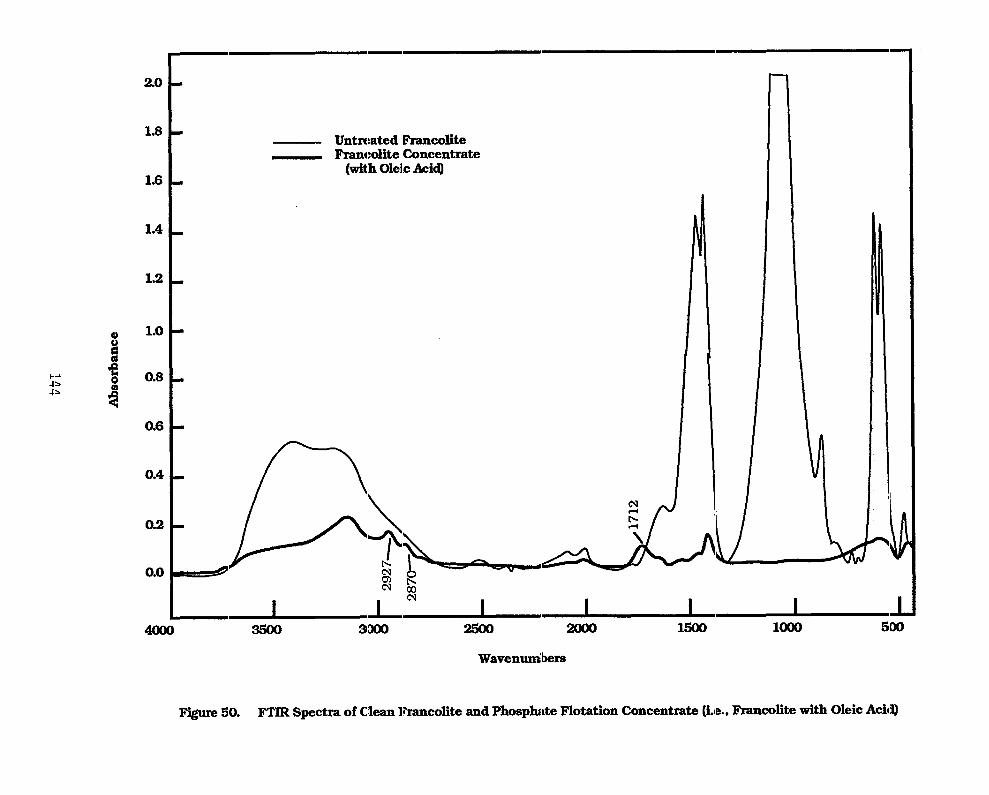
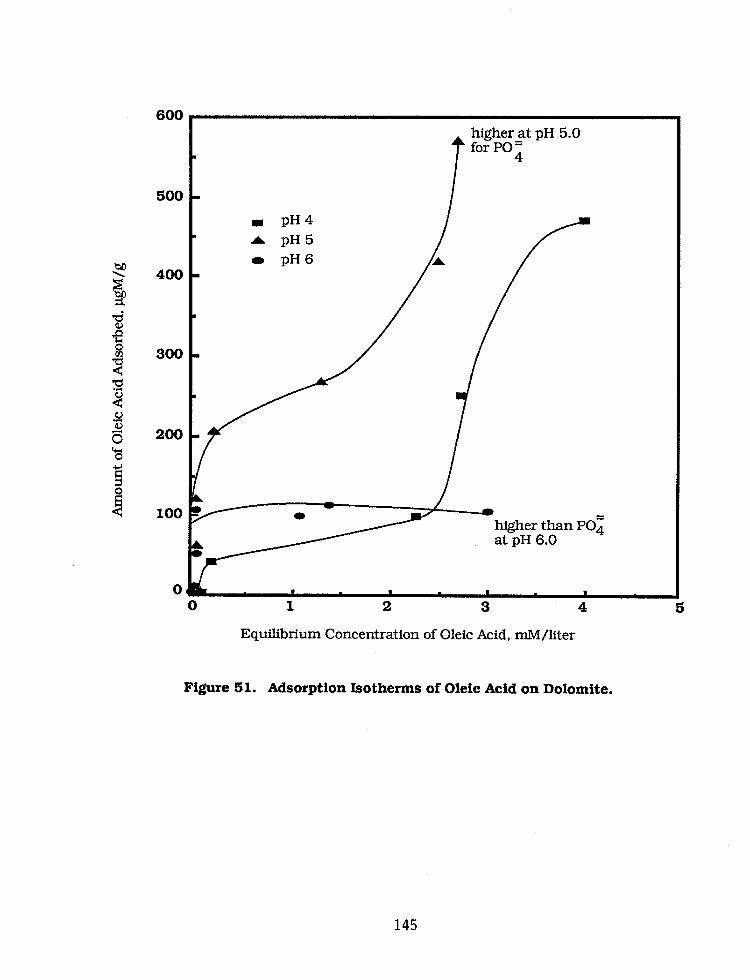

solubility of the dolomite under acidic conditions. Physical adsorption of oleic acid on
dolomite was confirmed by the FTIR spectra, shown in figures 52-54, obtained for pure oleic
acid, dolomite, dolomite treated with oleic acid and for a carbonate flotation concentrate.
Zeta-Potential of Mineral/Oleic Acid Systems
Equilibrium zeta potential measurements were routinely made on a portion of the same
mineral/oleic acid suspensions used in the adsorption measurements (after 2-3 hours
equilibration), to ensure comparison of these two measurements under the same conditions.
For kinetic zeta potential studies, the measurements were made at short time intervals after
contacting the mineral with oleic acid emulsions.
Figure 55 shows the results of zeta potential measurements of dolomite and francolite in
contact with 0.5 mM/l oleic acid at an initial pH of 5 and various equilibration times. The data
show that the negative charge of both minerals decreased as the time of contact with oleic acid
increased. Dolomite, however, showed a faster change in zeta potential than did francolite.
This may be related to the higher affinity of oleic acid for dolomite and/or the higher
reactivity (surface solubility) of dolomite under acidic conditions. At pH’s 4-5, the literature
value for the solubility of dolomite is reported to be about ten times higher than francolite.
Also, as a result of the generation of CO2 microbubbles on a dolomitic surface under the acidic
pH’s, the adsorption kinetics of oleic acid on this mineral is expected to be faster than on
francolite. This conclusion is in line with the actual froth flotation results which showed
instant carbonate flotation at very short conditioning times.
Figures 56 and 57 show the results of zeta potential measurements of francolite and
dolomite, respectively. The measurements were made at various pH’s and collector
concentrations under equilibration conditions (i.e., after 3 hours).
In the case of francolite, the negative zeta potential of the particles increased with collector
concentration to reach limiting values at 1 mM/l oleic acid (i.e. above the critical micelle
concentration). The negative zeta potential of the particles appears to depend on the amount of
oleic acid adsorbed and the pH of the system. The most negative zeta potential of about 58 mV
was observed at maximum oleic acid adsorption at pH 4 (figure 56).
146
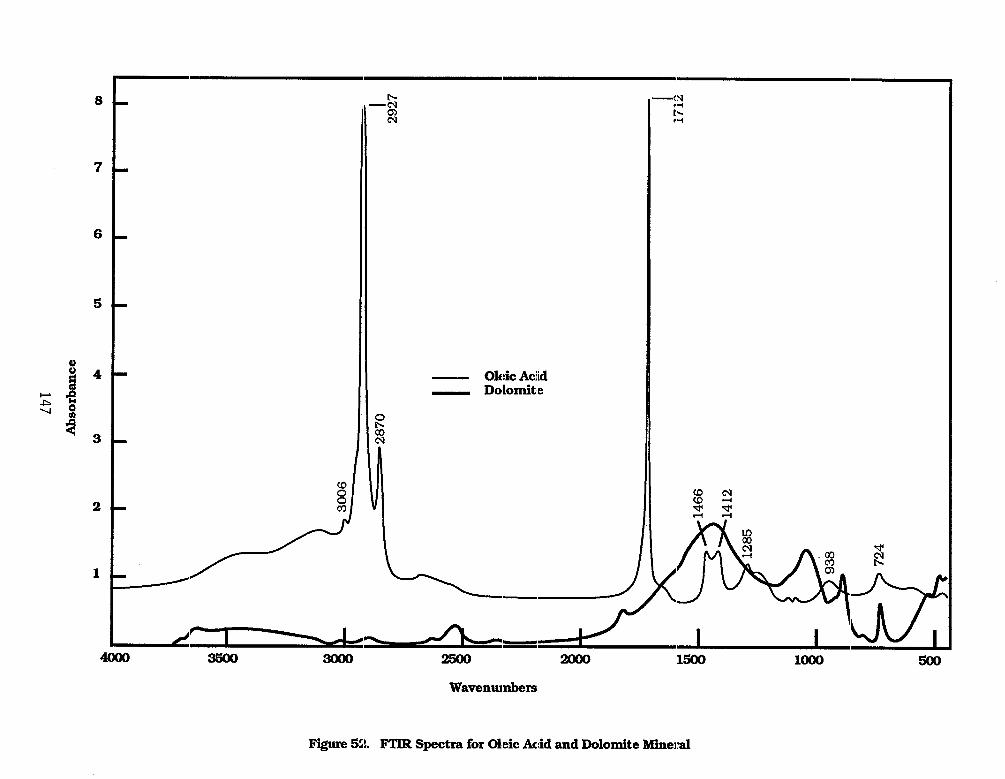
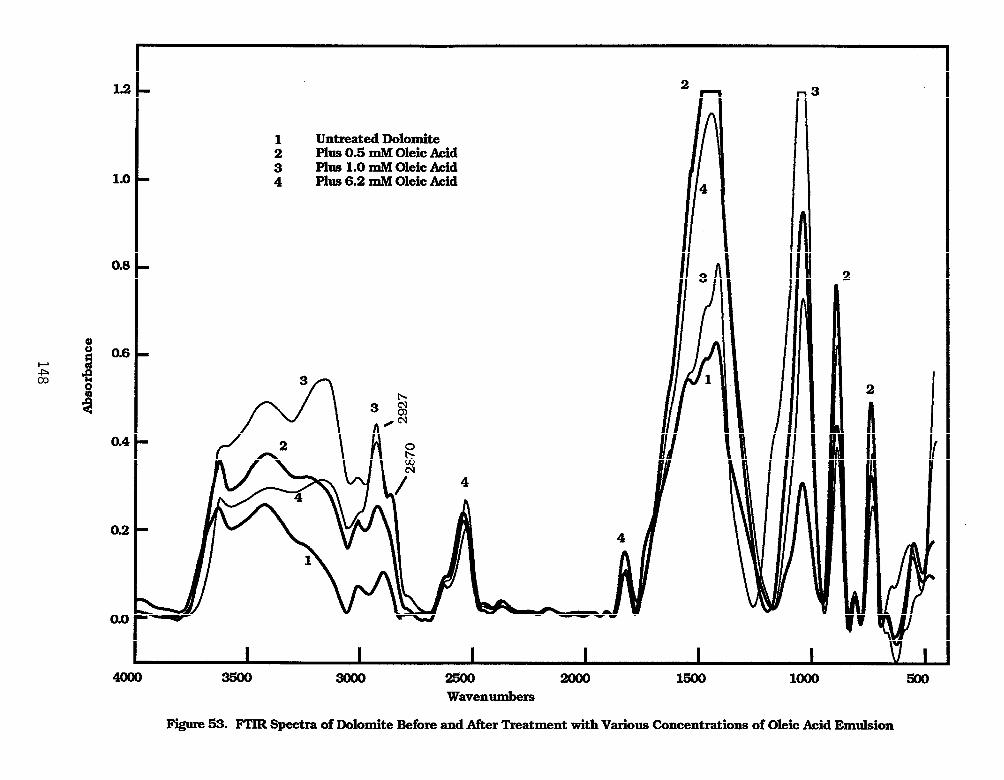


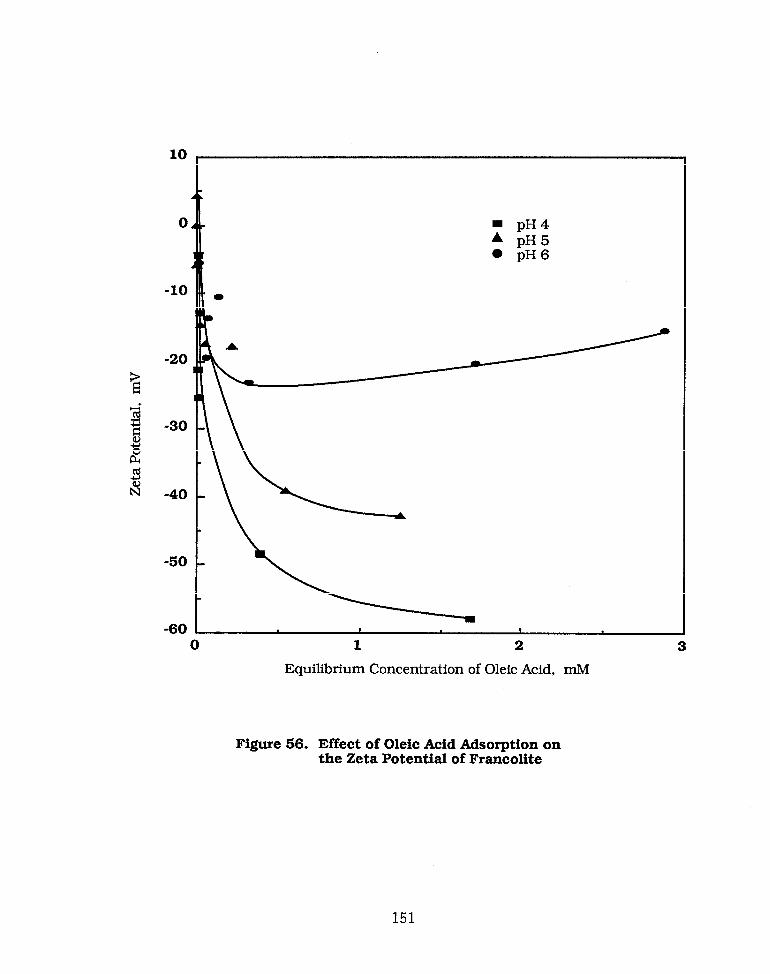


For dolomite, the zeta potential/oleic acid concentration curves shown in figure 57 are
more complicated, particularly at low pH’s. This may be due to the higher solubility of
dolomite surface layers under acidic conditions. At pH 4 excessive amounts of Ca++ and Mg++
ionic species are released in the system and reverse the negative charge of the particles. No
charge reversal was observed for the francolite/oleic acid system under the same experimental
conditions. The difference in the electrokinetic behavior of these two minerals may be directly
related to the difference in their reactivity with the acidic medium. This may also explain the
unusual behavior of oleic acid adsorption on dolomite at pH 4 (figure 51). The apparent
decrease in adsorption may be due to fast dissolution of the adsorbed oleic acid as shown by the
zeta potential results.
Summary and Conclusions
Surface chemical studies made on the major constituents of the high MgO-phosphate
matrix, namely francolite and dolomite, have confirmed the general concepts used in the
selective carbonate/phosphate flotation of the MRI no-conditioning process. These concepts
include the following: (a) the preferential acidic dissolution of the carbonate over phosphate
minerals at pH’s of 4-6, (b) the physical adsorption of oleic acid under slightly acidic
conditions and (c) the importance of adsorption kinetics in the separation process.
Under slightly acidic conditions, without the specific use of a phosphate depressant,
selective fatty acid flotation of carbonate gangue from francolite was achieved regardless of the
type of inorganic acid used for pH regulation. This suggests that the hydrogen ion
concentration is more important in determining collector adsorption than the anionic species
of the pH regulator. The adsorption of oleic acid was shown to increase with hydrogen ion
concentration. Generally the adsorption capacity of dolomite was higher than francolite.
Unlike phosphate minerals (apatite and francolite), the carbonate minerals (dolomite and
calcite) react readily with the inorganic acids. This results in preferential dissolution or
removal of surface contaminants on the carbonate particles, and exposure of fresh clean
surface sites suitable for fatty acid adsorption. Also as a result, CO2 microbubbles are
generated on the carbonate particle surfaces, leading to enhanced oleic acid adsorption at the
solid/liquid/gas interface. These are favorable conditions for particle/bubble attachment and
153

“instant” flotation of carbonate minerals. On the other hand, the reaction of the acids with the
apatite (francolite) particles may produce high concentrations of orthophosphate ionic species
and the formation of highly structured phosphate-rich water layers around the mineral
particles. The phosphate-rich water layer is reported to be strongly hydrogen bonded to apatite
and therefore depresses its flotation[23]. Prolonged conditioning of the pulp appears to remove
these depressant layers from the apatite surface and results in increased flotation, as shown in
figure 5. Under slightly acidic conditions, Johnston and Leja[24] reported that oleic acid can
adsorb much faster on dolomite than on apatite because of the evolution of CO2 microbubbles
on the carbonate surface and/or the presence of hydrogen-bonded phosphate ionic species on
the apatite surface. This mechanism finds support from our recent adsorption and zeta
potential studies on dolomite and francolite minerals at pH’s of 4 to 6. Results of FTIR spectra
have shown that oleic acid is physically adsorbed on both minerals. The adsorption kinetics
was faster for dolomite than francolite. Thus, the selectivity in carbonate/phosphate
separation, in slightly acidic media, may be attributed to preferential dissolution of the
mineral surface layers, which results in changes in adsorption kinetics and preferential
flotation of the carbonate minerals.
As experienced in commercial practice. the results in table 22 show that oleic acid flotation
in the alkaline pulp produced a rougher phosphate concentrate with a high silica content. In
practice, such a product is further processed by strong acid scrubbing (deoiling) to remove fatty
acid coatings, followed by cationic flotation of the siliceous gangue (double flotation) in order
to produce a marketable grade product of 30-31% P2O5, 0.7-1.0% MgO and about 5% insol.
The lack of selectivity in fatty acid phosphate/silica separation under alkaline conditions
may be due to slime coating or surface contamination of the silica particles by the precipitated
Ca-/Mg- fatty acid salt complexes formed in the pulp. Such complexes may not exist in slightly
acidic pulps as indicated by the high selectivity of phosphate/silica separation achieved at pH
6 in the absence of sodium silicate (table 25). The high grade phosphate concentrate with the
low silica content recovered indicates a strong depressing effect of acidic pH’s on the siliceous
material during fatty acid flotation of the phosphates. Addition of sodium silicate improved
the P2O5 recovery in the phosphate concentrate and increased the rejection of siliceous gangue
in the tailing product. The exact mechanism by which sodium silicate actually depressed silica
or activated phosphatic particles is not well understood. Some investigators suggested that
154

activation of apatite (francolite) may be due to enhanced adsorption of oleic acid in the
presence of colloidal hydrosilicic acid species prevailing under acidic pH’s[15]
. Other
investigators suggested that the polyvalent cations which can interfere with flotation may
interact with the soluble silicate species forming insoluble compounds, thereby reducing
interference by those cations[16,17]
.
155

1.
2.
3.
4.
5.
6.
7.
8.
9.
10.
11.
REFERENCES
Lawver, J.E. et al., “Beneficiation of Dolomitic Florida Phosphate Reserves,” Proceedings
XIVth IMPC, Toronto, Canada, 1982.
Lawver. J.E. et al., “New Techniques in Beneficiation of the Florida Phosphates of the
Future,” Minerals and Metallurgical Processing. Vol. 1, pp. 89-106.
Crago, A, (assigned to Phosphate Recovery Corp., N.Y., N.Y.), “Process of Concentrating
Phosphate Minerals,” U.S. Patent 2,293,640, October 8. 1940.
Hanna, H.S. and Somasundaran, P., “Flotation of Salt-Type Minerals,” A,M. Gaundin
Memorial Volume, Vol. 1 ed.. M.C. Fuerstenau, 1976, pp. 197-272.
Moudgil, B.M. and Somasundaran, P., “Advances in Phosphate Flotation,” Advances in
Mineral Processing, P. Somasundaran, Editor, AIME pub. Chapter 25, 1986, pp. 426-441.
Llewellyn, T.O., Davis, B.E., Sullivan, G.V., and Hansen, J.P., “Beneficiation of High-
Magnesium Phosphate from Southern Florida,” BuMines RI 8609, 1982, 16 pp., RI 8903,
1984, 14pp.
Moudgil, B.M. and Chanchani, R., “Beneficiation of Complex Phosphate Ores from South
Florida by Two Stage Conditioning Process,” Proceedings. XVth IMPC, Vol. 3, 1985, pp.
357-366.
Anazia, I.J. and Hanna, J., “A New Process for Selective Flotation of Dolomitic/SiliceousPhosphate Ores,” in publication.
Anazia, I.J. (International Fertilizer Development Center) Final Report, “A StatisticalAnalysis of Beneficiation of Jhamarkotra Phosphate Rock Using Experimental Design,”
IFDC, June 1985.
Association of Florida Phosphate Chemists, “Methods Used and Adopted,” 6th Edn., 1980.
McClellan, G.H. and Lehr. J.R., American Mineralogists. Vol. 54. 1969, pp. 1374-1391.
156

12. Somasundaran, P., “Beneficiation of Dolomitic Phosphates,” Annual Report on FIPR
Project 085-135 (83-02-037R). 1987.
13. Box, G.E.P., Hunter, W.G., and Hunter, J.S., in Statistics for Experimenters, Wiley, Pub.,
New York, 1978.
14. Schultz, N.S., “Separation Efficiency,” Trans. SME/AIME Vol. 247, 1970, pp. 81-87.
15. V.I. Klassen and VA. Mokrousov, “An Introduction to the Theory of Flotation,” J. Leja
and G.W. Poling eds., (London, Butterworths, 1963). pp. 321-335.
16. M.A. Eigeles, ‘Theoretical Basis of the Flotation of Non-Sulfide Minerals.”
Metallurgizdat, (1950).
17. N.A. Ianis, ‘The Effect of Alkali Regulators on the Adsorption of Sodium Silicate by
Calcium Minerals,” Proc. 2nd Sci. Tech. Sess, Metallurgizdat, 1952.
18. Barr et aI., J. Soc. Chem. Industry 67, 45, 1948.
19. Moudgil et al., “Separation of Dolomite from the South Florida Phosphate Rock,” Vols. 1
& 2. FIPR Report, 1987.
20. A.W. Ralston, “Fatty Acids and Their Derivatives,” Wiley, New York, 1948.
21. Peck and Wadsworth, USBM RI 6412.
22. Rosano et al., 1960, Journal of Colloid and Interf. Sci. 22.
23. M. Bertolucci, F. Jantzef, and D.L. Chamberlain, Interaction of Liquids at Solid
Substrates, R.F. Gould, ed. (ACS), Advances in Chemistry Series, Washington, D.C., 1968,
pp. 124-132.
24. D.J. Johnston and J. Leja, Trans., Canad. Inst. of Min. and Metall. 87. (1978), pp. 237-242.
157
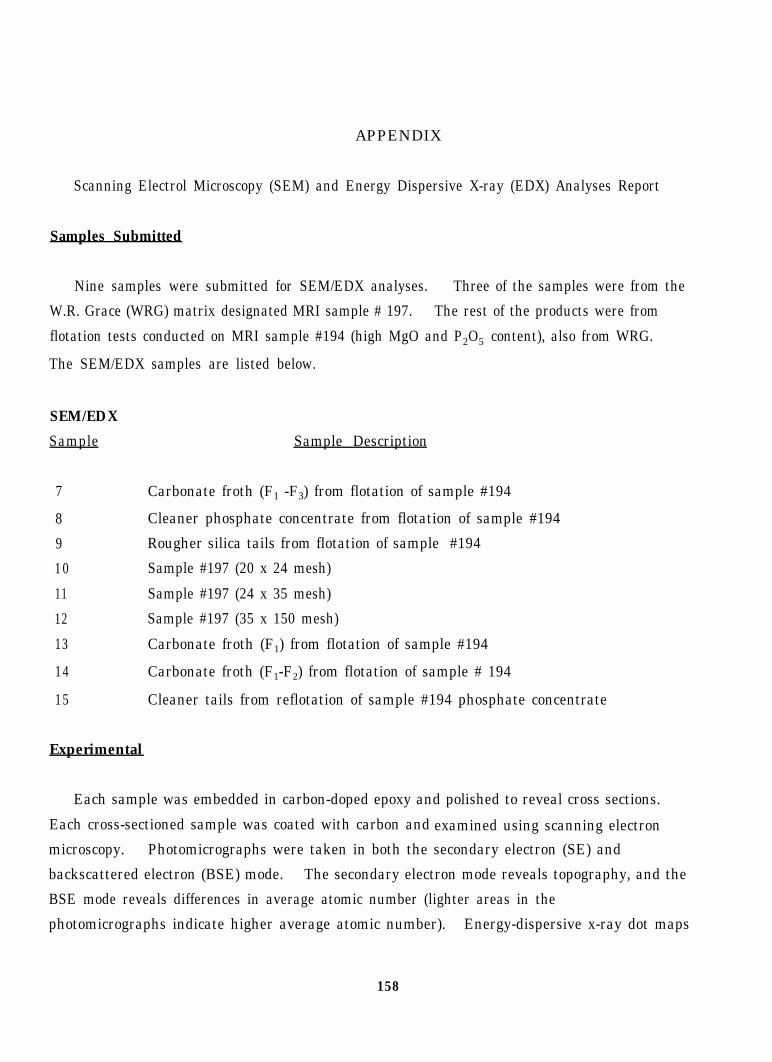
APPENDIX
Scanning Electrol Microscopy (SEM) and Energy Dispersive X-ray (EDX) Analyses Report
Samples Submitted
Nine samples were submitted for SEM/EDX analyses. Three of the samples were from the
W.R. Grace (WRG) matrix designated MRI sample # 197. The rest of the products were from
flotation tests conducted on MRI sample #194 (high MgO and P2O5 content), also from WRG.
The SEM/EDX samples are listed below.
SEM/EDX
Sample
7
8
9
10
11
12
13
14
15
Sample Description
Carbonate froth (F1 -F3) from flotation of sample #194
Cleaner phosphate concentrate from flotation of sample #194
Rougher silica tails from flotation of sample #194
Sample #197 (20 x 24 mesh)
Sample #197 (24 x 35 mesh)
Sample #197 (35 x 150 mesh)
Carbonate froth (F1) from flotation of sample #194
Carbonate froth (F1-F2) from flotation of sample # 194
Cleaner tails from reflotation of sample #194 phosphate concentrate
Experimental
Each sample was embedded in carbon-doped epoxy and polished to reveal cross sections.
Each cross-sectioned sample was coated with carbon and examined using scanning electron
microscopy. Photomicrographs were taken in both the secondary electron (SE) and
backscattered electron (BSE) mode. The secondary electron mode reveals topography, and the
BSE mode reveals differences in average atomic number (lighter areas in the
photomicrographs indicate higher average atomic number). Energy-dispersive x-ray dot maps
158

for Mg, P, Ca, and Si were obtained for the area shown in the SE and BSE image of each sample.
To maximize the x-ray counts, the samples were analyzed with the polished cross section
placed at a 45°C tilt and a -45° theta rotation.
Results and Discussion
Photomicrographs showing the SE and BSE images and associated x-ray dot maps for
samples 7-15 are shown in figures 1-9, respectively. All the images in these figures. except
figures 4 and 5, were taken at 100X magnification. Images in figures 4 and 5 were taken at 50X
magnification to obtain a broader field of view because the particles were larger. The results
are consistent with what would be expected from the point count analyses: the dot maps showed
areas of P, Mg, Ca, and Si concentration.
As would be expected from EDX theory, the areas of Mg concentration were less well defined
than other mapped elements because of problems associated with the low energy of Mg x-rays
and the relative roughness of the exposed dolomite surfaces. Most of the calcite-dolomite
agglomerates in these samples were quite friable. As a result, individual dolomite rhombs
were removed from the agglomerate cross sections during polishing, leaving a rough surface.
A few particles in some of the mapped areas deserve special comment. These comments are
given in the following paragraphs.
Sample 7: Particle A, marked in figure 1a, was anomalous and not fully explained by
interpreting the dot maps. An EDX spectrum of this particle showed that the outer material
contained Al, Si, and Fe, with small peaks of Mg and Ca; the EDX spectrum of the inclusion
contained only a Si peak. The spectra indicate that particle A was feldspar with a quartz
inclusion. Figure la also shows cross sections of holes resulting from air bubbles in the epoxy.
Samples 10-12: Figure 4a (sample 10) shows two types of dolomite; both are common inphosphate ores from south Florida. Particles A and B were the friable type discussed earlier
and had rougher exposed surfaces than particle C, which was a hard dolomite. The difference
in apparent Mg concentration among particles A, B, and C, as shown in the Mg map, probably
was the result of surface roughness rather than true differences in Mg concentration. The maps
159
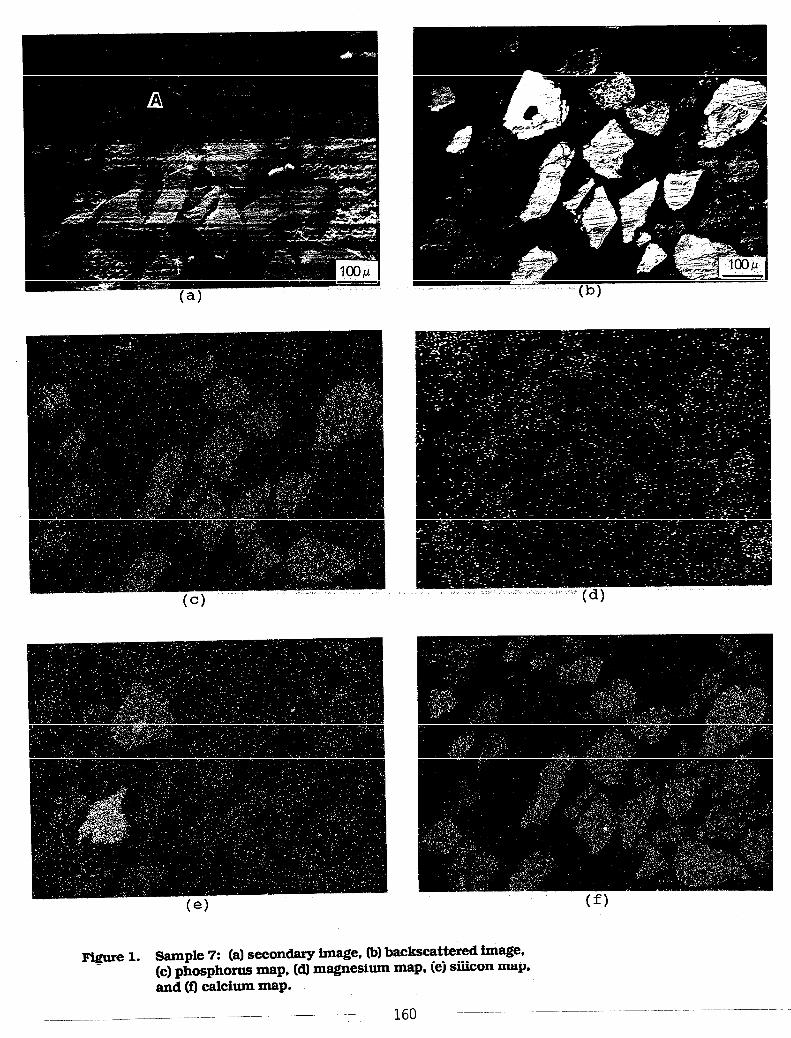
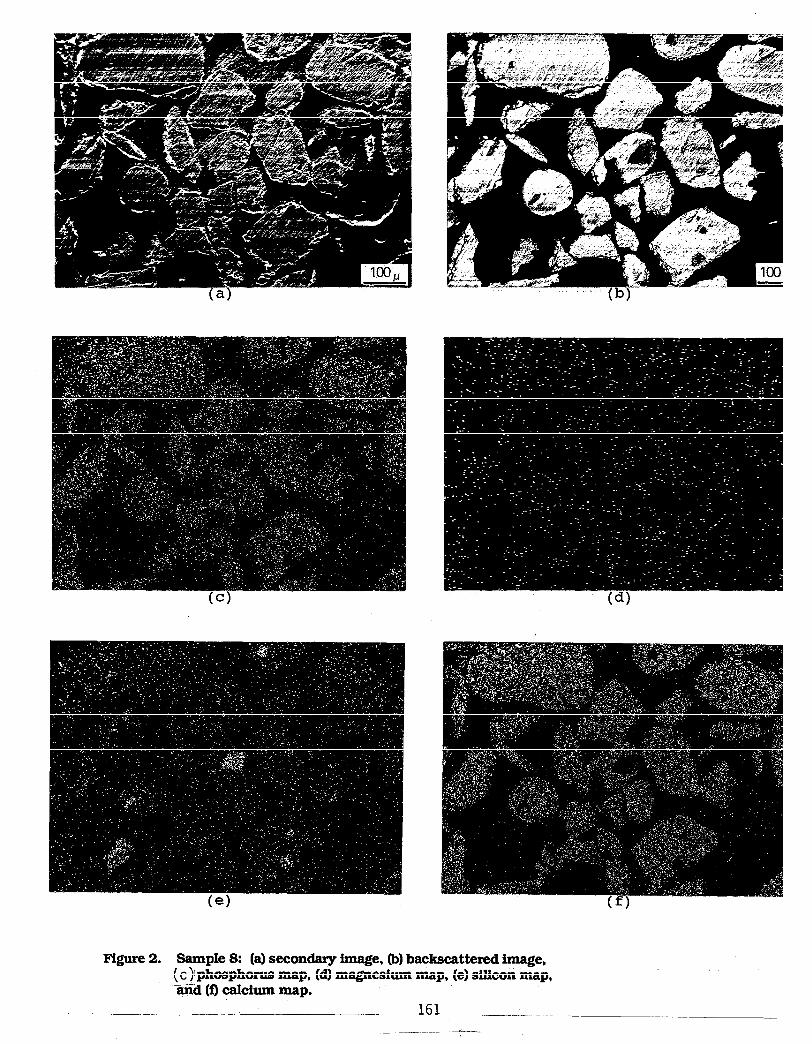

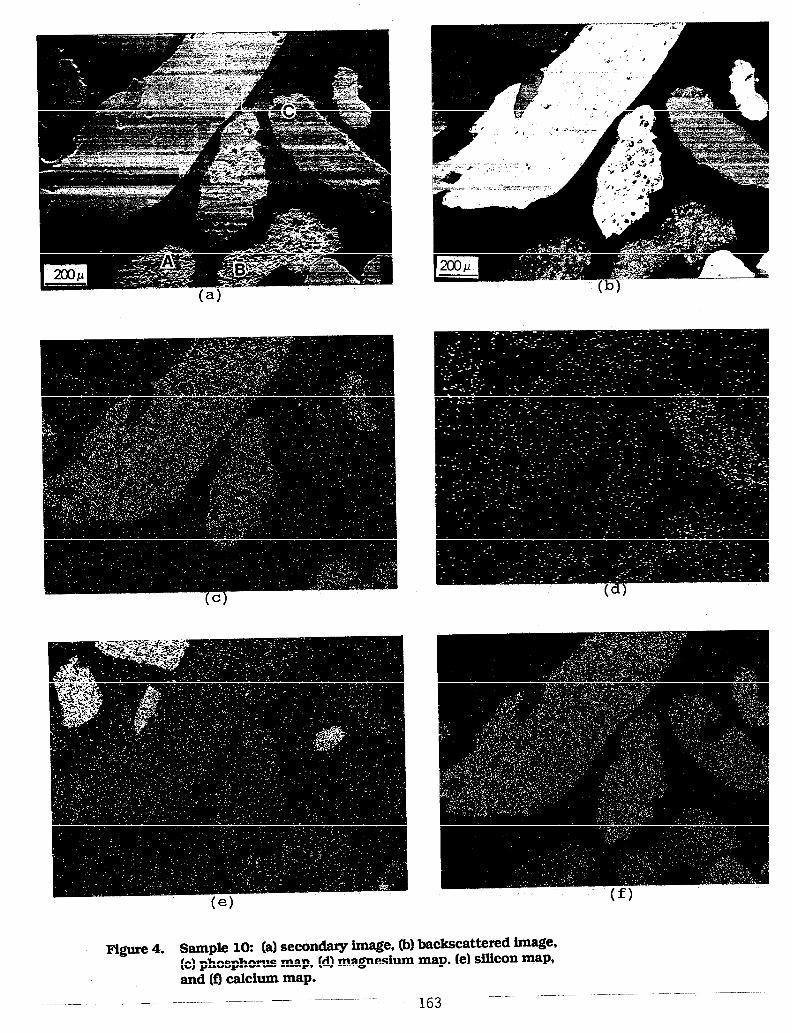
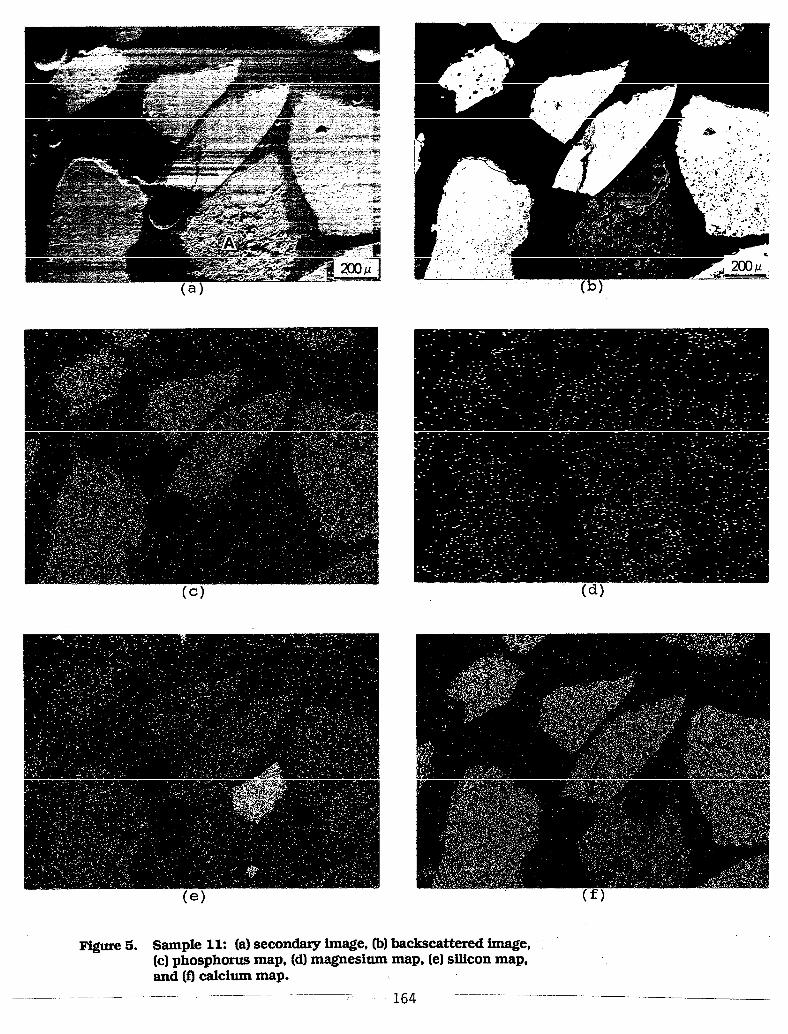
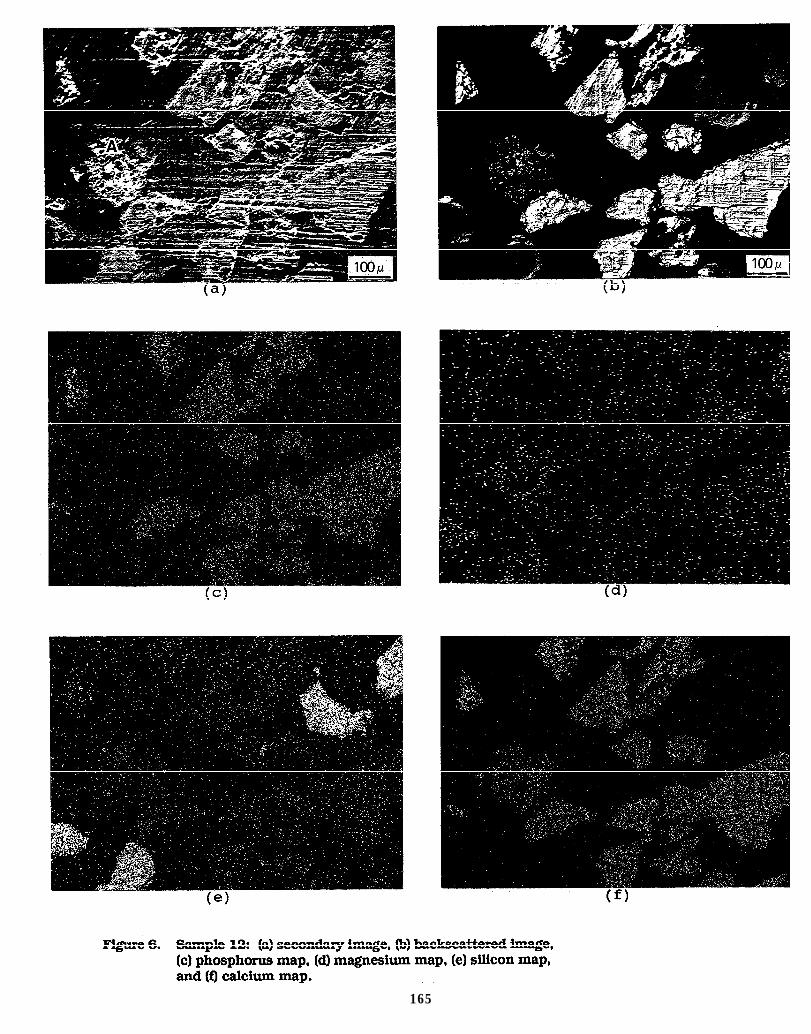
165


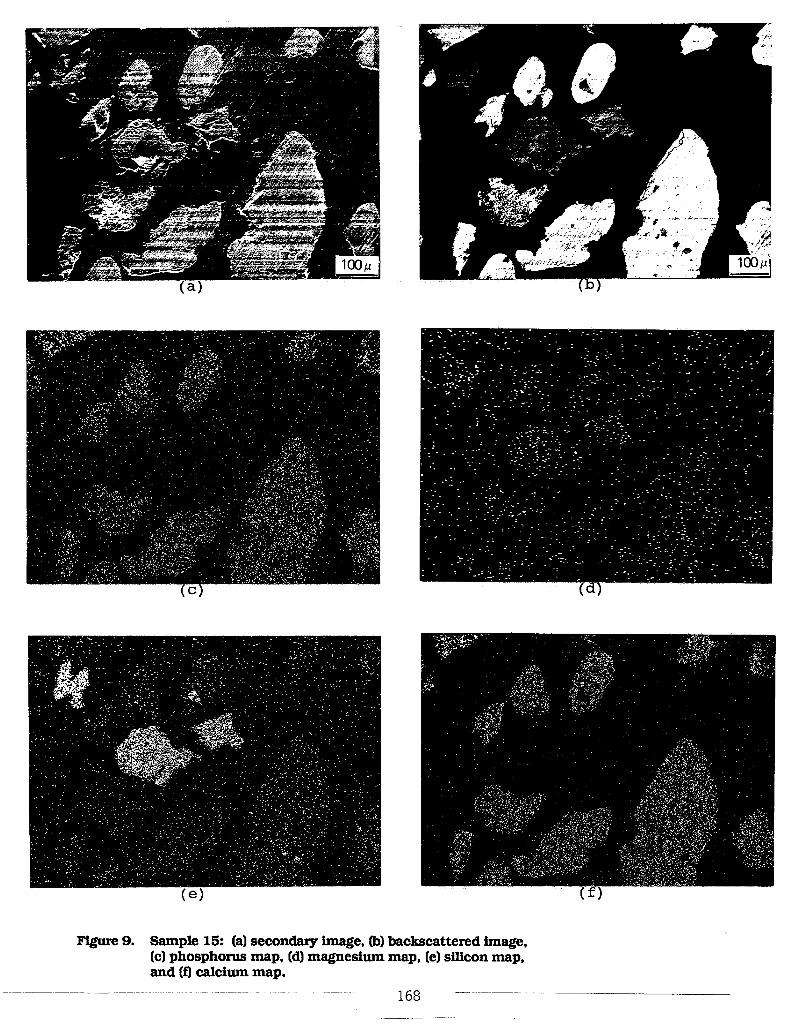
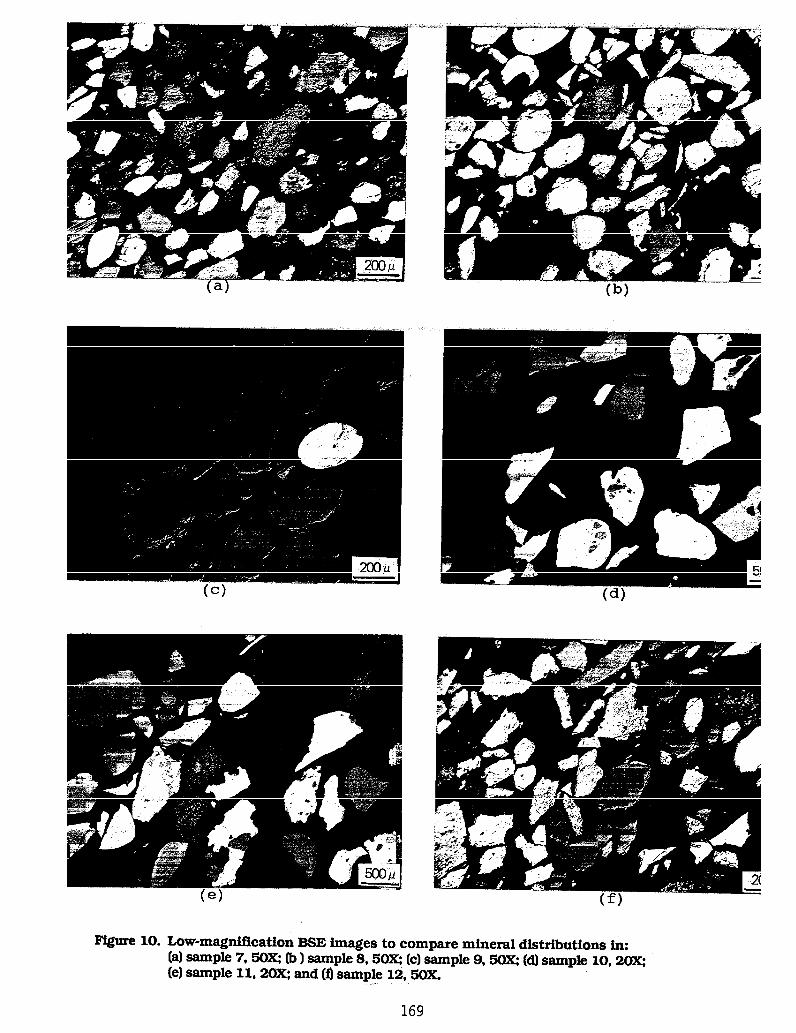

show a quartz inclusion in dolomite particle C. Particle A in figure 5a (sample 11) was friable
dolomite with a quartz inclusion, and particle A in figure 6a (sample 12) was friable dolomite
without a quartz inclusion.
Samples 13-14: Particles A, B, C, D, E, F, and G in figure 7a (sample 13) were mixtures of
both apatite and dolomite. Particles A and D in figure 8a (sample 14) were dolomite with
apatite inclusions: particles B and C were apatite with dolomite inclusions.
Conclusions
Examination of the sample particle cross sections revealed areas of P, Mg, Ca, and Si
concentration. In addition, quartz inclusions in apatite, dolomite. and feldspar particles and
particles which are mixtures of apatite and dolomite were observed. Figure 10 shows BSE
Images of each sample at low magnifications (20X for samples 10 and 11, 50X for the others) to
give a comparison of the mineral distributions among the samples.
170