Embed Size (px)
Citation preview
DOI: 10.5277/ppmp18186
Physicochem. Probl. Miner. Process., 54(4), 2018, 1282-1291 Physicochemical Problems of Mineral Processing
http://www.journalssystem.com/ppmp ISSN 1643-1049 © Wroclaw University of Science and Technology
Received October 13, 2018; reviewed; accepted November 6, 2018
Selective dispersion-flocculation and flotation studies on a siliceous copper ore
Levie Mweene, Sankaran Subramanian
Department of Materials Engineering, Indian Institute of Science, Bengaluru – 560012, India
Corresponding author: [email protected] (S. Subramanian)
Abstract: A low-grade copper ore from Mpanda Mineral Field (MMF), Tanzania containing 0.90% Cu, 10.40% Fe and 58.3% SiO2 was subjected to beneficiation adopting selective dispersion, flocculation and flotation techniques. Based on the mineralogical characterization of the sample chalcopyrite, pyrite and quartz were identified as the major minerals. The isoelectric point of MMF ore was observed to be at pH 2.7, signifying that the ore was highly siliceous. The addition of sodium trisilicate and xanthan gum shifted the zeta potential of ore to more electronegative values. Adsorption of xanthan gum on chalcopyrite and silica indicated that the maximum adsorption was at pH 2.3 for chalcopyrite and the adsorption isotherm exhibited L2 type of the Giles classification. On the contrary, no adsorption of xanthan gum on silica was observed. The ground ore was selectively dispersed and flocculated at pH 9.7 using 30 ppm of sodium trisilicate and 30 ppm of xanthan gum. The grade of CuFeS2 was improved to 19.8% after 3 desliming stages. Flotation of the flocculated portion was carried out at pH 10.30 using 30 g/t of potassium amyl xanthate and potassium ethyl xanthate (1:1) , 40 g/t of Na2S as a sulphidising agent and methyl iso-butyl carbinol (MIBC) as a frother yielding a rougher concentrate with silica and chalcopyrite grades of 8.4% and 23.5% respectively with corresponding recoveries of 4.8% and 92.8% respectively. Additionally, rougher concentrate was subjected to cleaner flotation yielding silica and chalcopyrite grades of 1.8% and 29.2 % respectively and with recoveries of 1.2% and 89.1% respectively.
Keywords: adsorption, zeta-potential, dispersion, flocculation, flotation, copper
1. Introduction
Mpanda Mineral Field (MMF) ore, consisting of a large proportion of quartz encapsulating pyrite and chalcopyrite is located in south west Tanzania. As reported in our previous work, MMF ore produces a lot of fines upon crushing which pose a lot of challenges in the flotation of chalcopyrite (Mweene and Subramanian, 2018). Therefore, this work was aimed at mitigating the problem of fines by subjecting the ground MMF ore to selective dispersion using sodium trislicate (STS) and flocculating chalcopyrite using xanthan gum (XG) prior to flotation. The use of XG is advantageous since it is readily available, cheap and benign to the environment (Qin et al., 2013).
Many workers have reported on the selective flocculation of the valuable minerals from their mixture with quartz (Friend and Kitchener, 1972; Saravanan and Subramanian, 2016; Kemppainen et al., 2016). Friend and Kitchener (1972) reported on the selective flocculation of alumina and calcite using anionic polyacrylamide from their mixtures with quartz while Saravanan and Subramanian (2016) reported on the selective flocculation of alumina from its mixture with silica using anionic XG. Furthermore, Kemppainen et al. (2016) reported on the selective flocculation of hematite from its mixture with quartz using anionic dicarboxylic acid and sulfonated cellulose nanofibers. However, the use of XG in chalcopyrite flocculation from suspended MMF ore after dispersion was preferred to other reported anionic polysaccharides since it has a high viscosity due to its high molecular weight (2 Х 106) at low concentrations, is stable over a wide pH range (1-11), temperature (up to 90 °C) and in the presence of divalent ions (Rosalam and England, 2006).
Physicochem. Probl. Miner. Process., 54(4), 2018, 1282-1291 1283
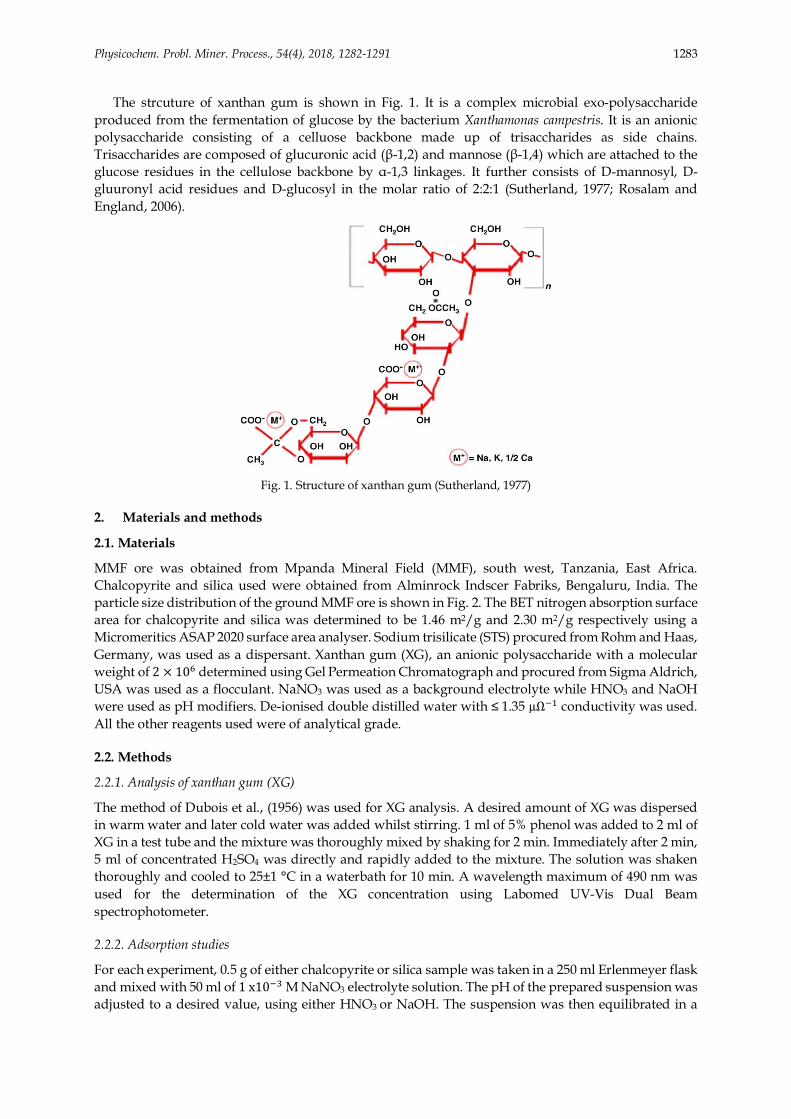
The strcuture of xanthan gum is shown in Fig. 1. It is a complex microbial exo-polysaccharide produced from the fermentation of glucose by the bacterium Xanthamonas campestris. It is an anionic polysaccharide consisting of a celluose backbone made up of trisaccharides as side chains. Trisaccharides are composed of glucuronic acid (β-1,2) and mannose (β-1,4) which are attached to the glucose residues in the cellulose backbone by α-1,3 linkages. It further consists of D-mannosyl, D-gluuronyl acid residues and D-glucosyl in the molar ratio of 2:2:1 (Sutherland, 1977; Rosalam and England, 2006).
Fig. 1. Structure of xanthan gum (Sutherland, 1977)
2. Materials and methods
2.1. Materials
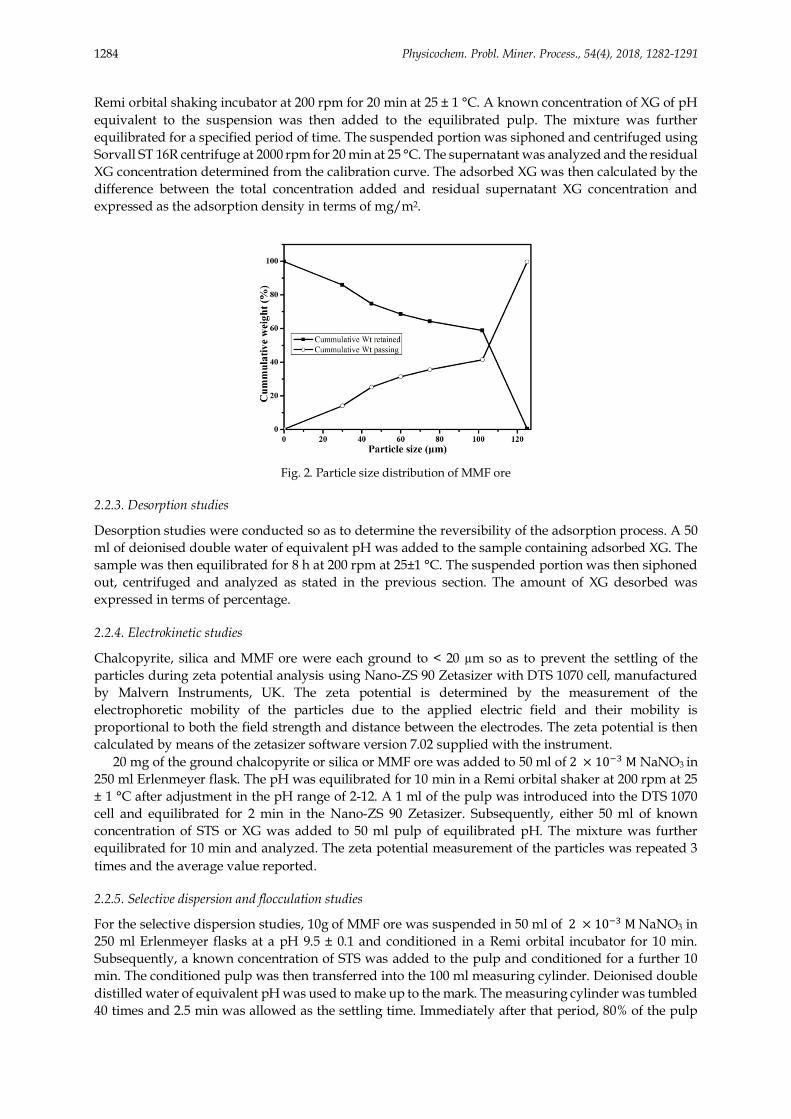
MMF ore was obtained from Mpanda Mineral Field (MMF), south west, Tanzania, East Africa. Chalcopyrite and silica used were obtained from Alminrock Indscer Fabriks, Bengaluru, India. The particle size distribution of the ground MMF ore is shown in Fig. 2. The BET nitrogen absorption surface area for chalcopyrite and silica was determined to be 1.46 m2/g and 2.30 m2/g respectively using a Micromeritics ASAP 2020 surface area analyser. Sodium trisilicate (STS) procured from Rohm and Haas, Germany, was used as a dispersant. Xanthan gum (XG), an anionic polysaccharide with a molecular weight of 2 × 10%determined using Gel Permeation Chromatograph and procured from Sigma Aldrich, USA was used as a flocculant. NaNO3 was used as a background electrolyte while HNO3 and NaOH were used as pH modifiers. De-ionised double distilled water with ≤ 1.35 µΩ() conductivity was used. All the other reagents used were of analytical grade.
2.2. Methods
2.2.1. Analysis of xanthan gum (XG)
The method of Dubois et al., (1956) was used for XG analysis. A desired amount of XG was dispersed in warm water and later cold water was added whilst stirring. 1 ml of 5% phenol was added to 2 ml of XG in a test tube and the mixture was thoroughly mixed by shaking for 2 min. Immediately after 2 min, 5 ml of concentrated H2SO4 was directly and rapidly added to the mixture. The solution was shaken thoroughly and cooled to 25±1 °C in a waterbath for 10 min. A wavelength maximum of 490 nm was used for the determination of the XG concentration using Labomed UV-Vis Dual Beam spectrophotometer.
2.2.2. Adsorption studies
For each experiment, 0.5 g of either chalcopyrite or silica sample was taken in a 250 ml Erlenmeyer flask and mixed with 50 ml of 1x10(+M NaNO3 electrolyte solution. The pH of the prepared suspension was adjusted to a desired value, using either HNO3 or NaOH. The suspension was then equilibrated in a
Physicochem. Probl. Miner. Process., 54(4), 2018, 1282-1291 1284
Remi orbital shaking incubator at 200 rpm for 20 min at 25 ± 1 °C. A known concentration of XG of pH equivalent to the suspension was then added to the equilibrated pulp. The mixture was further equilibrated for a specified period of time. The suspended portion was siphoned and centrifuged using Sorvall ST 16R centrifuge at 2000 rpm for 20 min at 25 °C. The supernatant was analyzed and the residual XG concentration determined from the calibration curve. The adsorbed XG was then calculated by the difference between the total concentration added and residual supernatant XG concentration and expressed as the adsorption density in terms of mg/m2.
Fig. 2. Particle size distribution of MMF ore
2.2.3. Desorption studies
Desorption studies were conducted so as to determine the reversibility of the adsorption process. A 50 ml of deionised double water of equivalent pH was added to the sample containing adsorbed XG. The sample was then equilibrated for 8 h at 200 rpm at 25±1 °C. The suspended portion was then siphoned out, centrifuged and analyzed as stated in the previous section. The amount of XG desorbed was expressed in terms of percentage.
2.2.4. Electrokinetic studies
Chalcopyrite, silica and MMF ore were each ground to < 20 µm so as to prevent the settling of the particles during zeta potential analysis using Nano-ZS 90 Zetasizer with DTS 1070 cell, manufactured by Malvern Instruments, UK. The zeta potential is determined by the measurement of the electrophoretic mobility of the particles due to the applied electric field and their mobility is proportional to both the field strength and distance between the electrodes. The zeta potential is then calculated by means of the zetasizer software version 7.02 supplied with the instrument.
20 mg of the ground chalcopyrite or silica or MMF ore was added to 50 ml of 2 × 10(+M NaNO3 in 250 ml Erlenmeyer flask. The pH was equilibrated for 10 min in a Remi orbital shaker at 200 rpm at 25 ± 1 °C after adjustment in the pH range of 2-12. A 1 ml of the pulp was introduced into the DTS 1070 cell and equilibrated for 2 min in the Nano-ZS 90 Zetasizer. Subsequently, either 50 ml of known concentration of STS or XG was added to 50 ml pulp of equilibrated pH. The mixture was further equilibrated for 10 min and analyzed. The zeta potential measurement of the particles was repeated 3 times and the average value reported.
2.2.5. Selective dispersion and flocculation studies
For the selective dispersion studies, 10g of MMF ore was suspended in 50 ml of 2 × 10(+MNaNO3 in 250 ml Erlenmeyer flasks at a pH 9.5 ± 0.1 and conditioned in a Remi orbital incubator for 10 min. Subsequently, a known concentration of STS was added to the pulp and conditioned for a further 10 min. The conditioned pulp was then transferred into the 100 ml measuring cylinder. Deionised double distilled water of equivalent pH was used to make up to the mark. The measuring cylinder was tumbled 40 times and 2.5 min was allowed as the settling time. Immediately after that period, 80% of the pulp
Physicochem. Probl. Miner. Process., 54(4), 2018, 1282-1291 1285
was siphoned out and centrifuged for 20 min at 2500 rpm and 25 °C. The supernatant was transferred back into the measuring cylinder and made up to the mark. The tumbling, siphoning and centrifuging process was continued until a clear supernatant was obtained. The number of siphoning times carried out is equivalent to the number of desliming stages. The degree of dispersion (D.D) was calculated as shown in equation 1, where m1 is the weight of the suspended portion while m2 is the weight of the settled portion.
𝐷𝑒𝑔𝑟𝑒𝑒𝑜𝑓𝑑𝑖𝑠𝑝𝑒𝑟𝑠𝑖𝑜𝑛𝐷.𝐷 = :;:;<:=
. (1)
In the case of selective flocculation studies, a known concentration of XG was added in the presence of STS. The tumbling, siphoning and centrifuging as stated in the dispersion process was carried out.
2.2.6. Flotation studies
Flotation of the selectively dispersed and flocculated MMF ore was carried out in a Denver flotation machine-model 5201-110 using a 250 g flotation cell at 900 rpm and pH 10±0.3. The particle size of the flotation feed is d90=102 µm. KAX+KEX (1:1) 30 g/t as a collector, Na2S 40 g/t as a sulphidiser, pH 10.30 and methyl iso-butyl carbinol (MIBC) as a frother were used in the rougher stage. Additionally, KAX+KEX (1:1)-30g/t was used in the cleaner stage at 15% pulp density, pH 9.80 and in the absence of a sulphidiser. The selectivity index (S.I) for both the rougher and cleaner stages was calculated using the Gaudin’s formula (Gaudin, 1939) as shown in equation 2 where Ra and Ta is the recovery of chalcopyrite and silica respectively to the concentrate, while Rb and Tb is the recovery of chalcopyrite and silica respectively to the tails:
𝑆. 𝐼 = @AB×CDAD×CB
. (2)
3. Results and discussion
3.1. Mineralogical characterisation
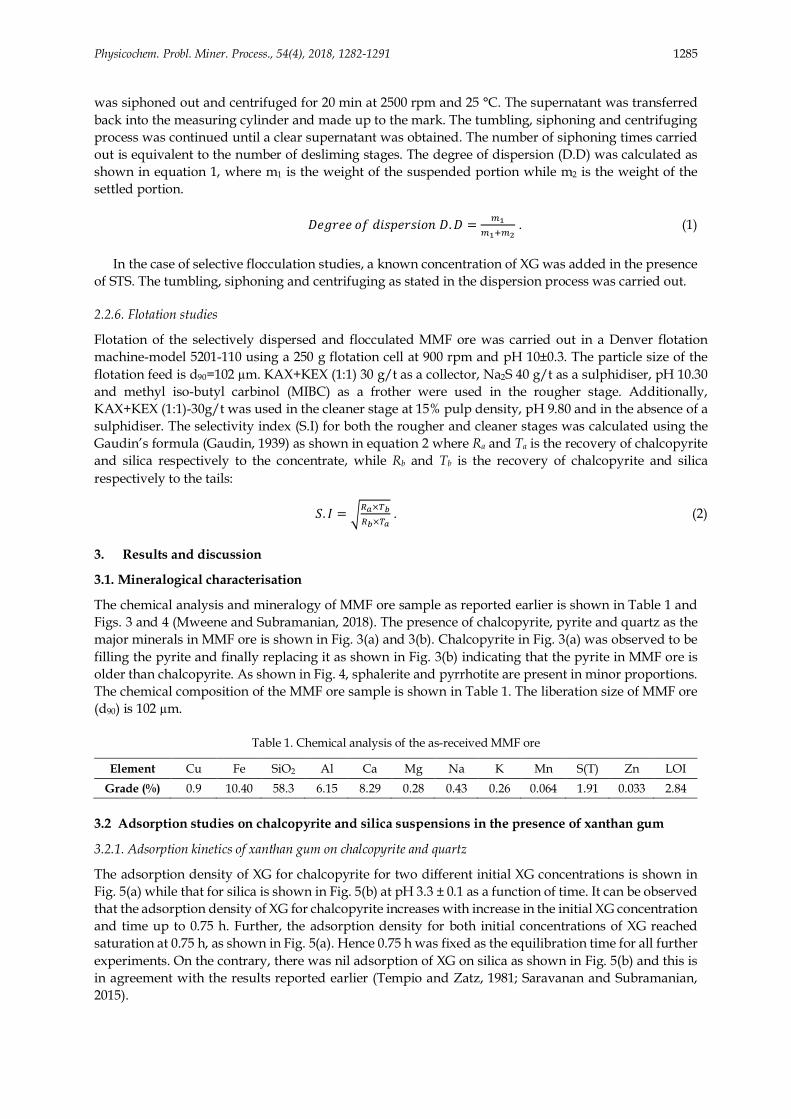
The chemical analysis and mineralogy of MMF ore sample as reported earlier is shown in Table 1 and Figs. 3 and 4 (Mweene and Subramanian, 2018). The presence of chalcopyrite, pyrite and quartz as the major minerals in MMF ore is shown in Fig. 3(a) and 3(b). Chalcopyrite in Fig. 3(a) was observed to be filling the pyrite and finally replacing it as shown in Fig. 3(b) indicating that the pyrite in MMF ore is older than chalcopyrite. As shown in Fig. 4, sphalerite and pyrrhotite are present in minor proportions. The chemical composition of the MMF ore sample is shown in Table 1. The liberation size of MMF ore (d90) is 102 µm.
Table 1. Chemical analysis of the as-received MMF ore
Element Cu Fe SiO2 Al Ca Mg Na K Mn S(T) Zn LOI Grade (%) 0.9 10.40 58.3 6.15 8.29 0.28 0.43 0.26 0.064 1.91 0.033 2.84
3.2 Adsorption studies on chalcopyrite and silica suspensions in the presence of xanthan gum
3.2.1. Adsorption kinetics of xanthan gum on chalcopyrite and quartz
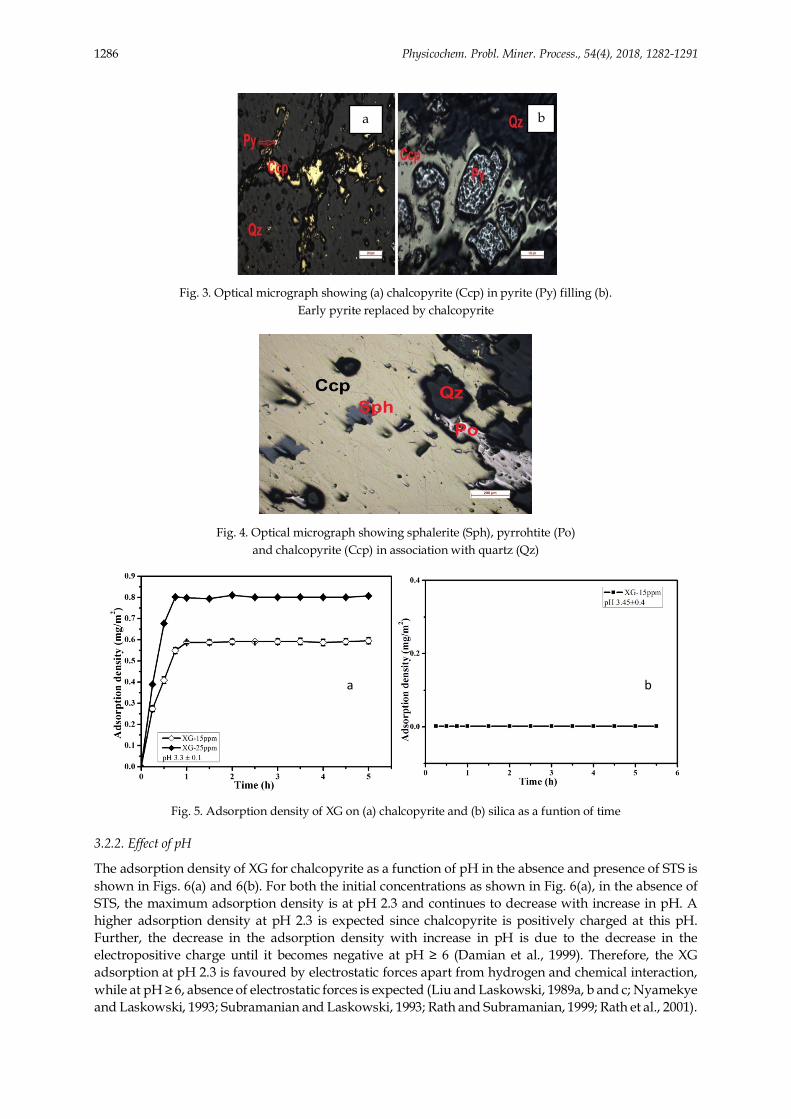
The adsorption density of XG for chalcopyrite for two different initial XG concentrations is shown in Fig. 5(a) while that for silica is shown in Fig. 5(b) at pH 3.3 ± 0.1 as a function of time. It can be observed that the adsorption density of XG for chalcopyrite increases with increase in the initial XG concentration and time up to 0.75 h. Further, the adsorption density for both initial concentrations of XG reached saturation at 0.75 h, as shown in Fig. 5(a). Hence 0.75 h was fixed as the equilibration time for all further experiments. On the contrary, there was nil adsorption of XG on silica as shown in Fig. 5(b) and this is in agreement with the results reported earlier (Tempio and Zatz, 1981; Saravanan and Subramanian, 2015).
Physicochem. Probl. Miner. Process., 54(4), 2018, 1282-1291 1286
Fig. 3. Optical micrograph showing (a) chalcopyrite (Ccp) in pyrite (Py) filling (b).
Early pyrite replaced by chalcopyrite
Fig. 4. Optical micrograph showing sphalerite (Sph), pyrrohtite (Po)
and chalcopyrite (Ccp) in association with quartz (Qz)
Fig. 5. Adsorption density of XG on (a) chalcopyrite and (b) silica as a funtion of time
3.2.2. Effect of pH
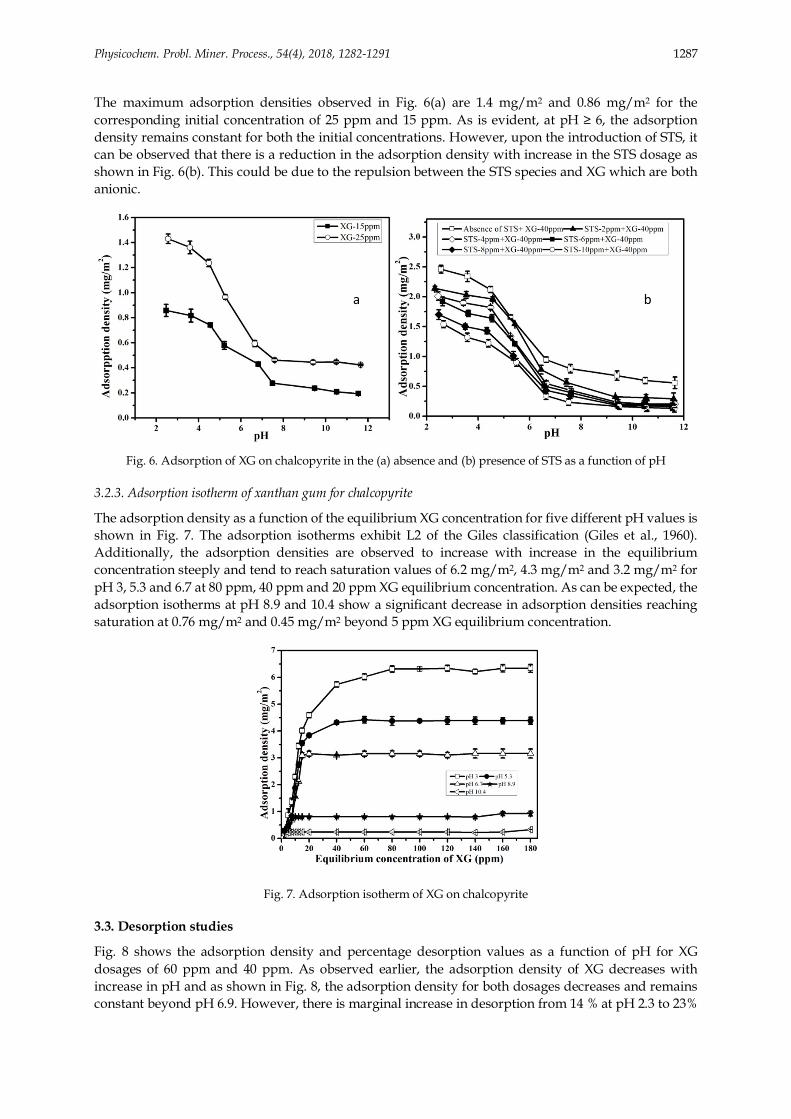
The adsorption density of XG for chalcopyrite as a function of pH in the absence and presence of STS is shown in Figs. 6(a) and 6(b). For both the initial concentrations as shown in Fig. 6(a), in the absence of STS, the maximum adsorption density is at pH 2.3 and continues to decrease with increase in pH. A higher adsorption density at pH 2.3 is expected since chalcopyrite is positively charged at this pH. Further, the decrease in the adsorption density with increase in pH is due to the decrease in the electropositive charge until it becomes negative at pH ≥ 6 (Damian et al., 1999). Therefore, the XG adsorption at pH 2.3 is favoured by electrostatic forces apart from hydrogen and chemical interaction, while at pH ≥ 6, absence of electrostatic forces is expected (Liu and Laskowski, 1989a, b and c; Nyamekye and Laskowski, 1993; Subramanian and Laskowski, 1993; Rath and Subramanian, 1999; Rath et al., 2001).
a b
a b
Physicochem. Probl. Miner. Process., 54(4), 2018, 1282-1291 1287
The maximum adsorption densities observed in Fig. 6(a) are 1.4 mg/m2 and 0.86 mg/m2 for the corresponding initial concentration of 25 ppm and 15 ppm. As is evident, at pH ≥ 6, the adsorption density remains constant for both the initial concentrations. However, upon the introduction of STS, it can be observed that there is a reduction in the adsorption density with increase in the STS dosage as shown in Fig. 6(b). This could be due to the repulsion between the STS species and XG which are both anionic.
Fig. 6. Adsorption of XG on chalcopyrite in the (a) absence and (b) presence of STS as a function of pH
3.2.3. Adsorption isotherm of xanthan gum for chalcopyrite
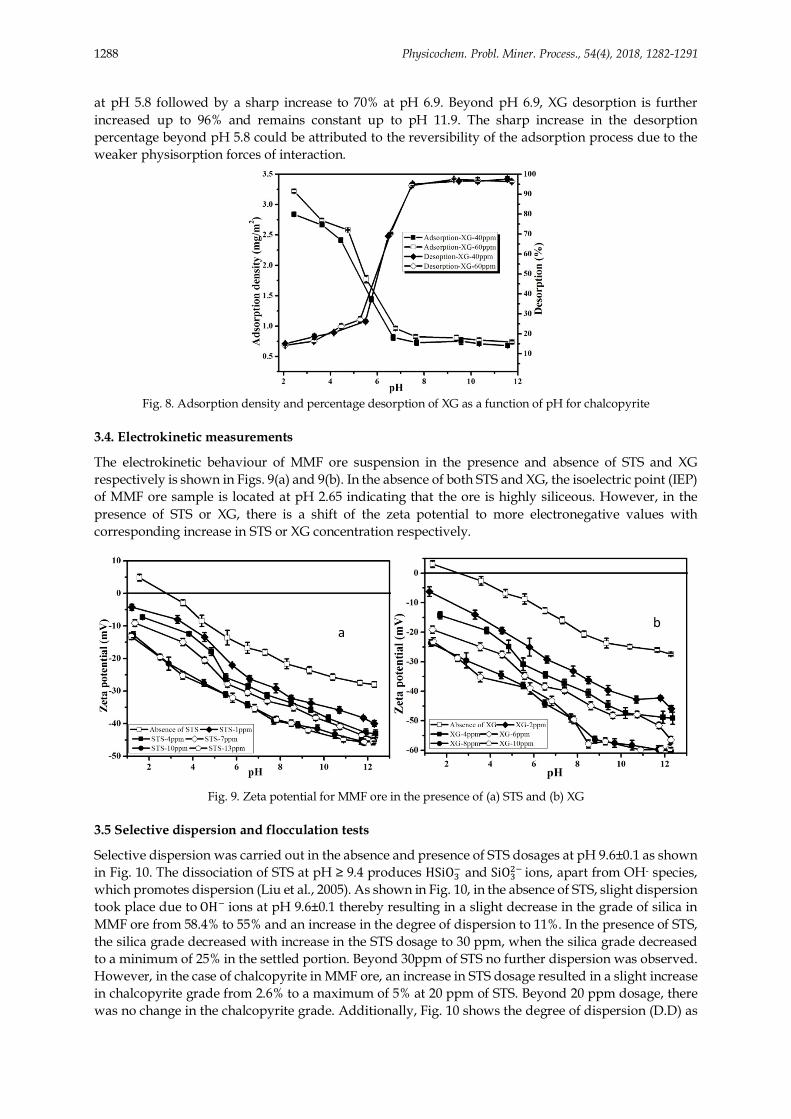
The adsorption density as a function of the equilibrium XG concentration for five different pH values is shown in Fig. 7. The adsorption isotherms exhibit L2 of the Giles classification (Giles et al., 1960). Additionally, the adsorption densities are observed to increase with increase in the equilibrium concentration steeply and tend to reach saturation values of 6.2 mg/m2, 4.3 mg/m2 and 3.2 mg/m2 for pH 3, 5.3 and 6.7 at 80 ppm, 40 ppm and 20 ppm XG equilibrium concentration. As can be expected, the adsorption isotherms at pH 8.9 and 10.4 show a significant decrease in adsorption densities reaching saturation at 0.76 mg/m2 and 0.45 mg/m2 beyond 5 ppm XG equilibrium concentration.
Fig. 7. Adsorption isotherm of XG on chalcopyrite
3.3. Desorption studies
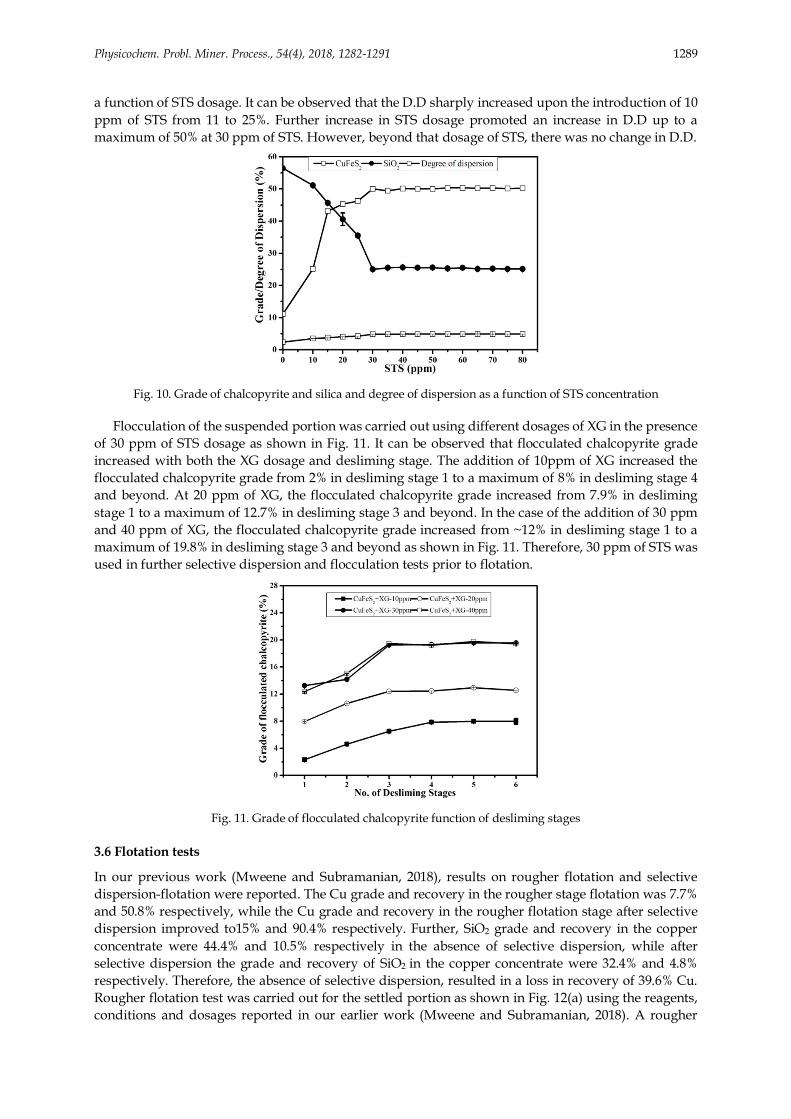
Fig. 8 shows the adsorption density and percentage desorption values as a function of pH for XG dosages of 60 ppm and 40 ppm. As observed earlier, the adsorption density of XG decreases with increase in pH and as shown in Fig. 8, the adsorption density for both dosages decreases and remains constant beyond pH 6.9. However, there is marginal increase in desorption from 14 % at pH 2.3 to 23%
a b
Physicochem. Probl. Miner. Process., 54(4), 2018, 1282-1291 1288
at pH 5.8 followed by a sharp increase to 70% at pH 6.9. Beyond pH 6.9, XG desorption is further increased up to 96% and remains constant up to pH 11.9. The sharp increase in the desorption percentage beyond pH 5.8 could be attributed to the reversibility of the adsorption process due to the weaker physisorption forces of interaction.
Fig. 8. Adsorption density and percentage desorption of XG as a function of pH for chalcopyrite
3.4. Electrokinetic measurements
The electrokinetic behaviour of MMF ore suspension in the presence and absence of STS and XG respectively is shown in Figs. 9(a) and 9(b). In the absence of both STS and XG, the isoelectric point (IEP) of MMF ore sample is located at pH 2.65 indicating that the ore is highly siliceous. However, in the presence of STS or XG, there is a shift of the zeta potential to more electronegative values with corresponding increase in STS or XG concentration respectively.
Fig. 9. Zeta potential for MMF ore in the presence of (a) STS and (b) XG
3.5 Selective dispersion and flocculation tests
Selective dispersion was carried out in the absence and presence of STS dosages at pH 9.6±0.1 as shown in Fig. 10. The dissociation of STS at pH ≥ 9.4 produces HSiO+( and SiO+I(ions, apart from OH- species, which promotes dispersion (Liu et al., 2005). As shown in Fig. 10, in the absence of STS, slight dispersion took place due toOH(ions at pH 9.6±0.1 thereby resulting in a slight decrease in the grade of silica in MMF ore from 58.4% to 55% and an increase in the degree of dispersion to 11%. In the presence of STS, the silica grade decreased with increase in the STS dosage to 30 ppm, when the silica grade decreased to a minimum of 25% in the settled portion. Beyond 30ppm of STS no further dispersion was observed. However, in the case of chalcopyrite in MMF ore, an increase in STS dosage resulted in a slight increase in chalcopyrite grade from 2.6% to a maximum of 5% at 20 ppm of STS. Beyond 20 ppm dosage, there was no change in the chalcopyrite grade. Additionally, Fig. 10 shows the degree of dispersion (D.D) as
a b
Physicochem. Probl. Miner. Process., 54(4), 2018, 1282-1291 1289
a function of STS dosage. It can be observed that the D.D sharply increased upon the introduction of 10 ppm of STS from 11 to 25%. Further increase in STS dosage promoted an increase in D.D up to a maximum of 50% at 30 ppm of STS. However, beyond that dosage of STS, there was no change in D.D.
Fig. 10. Grade of chalcopyrite and silica and degree of dispersion as a function of STS concentration
Flocculation of the suspended portion was carried out using different dosages of XG in the presence of 30 ppm of STS dosage as shown in Fig. 11. It can be observed that flocculated chalcopyrite grade increased with both the XG dosage and desliming stage. The addition of 10ppm of XG increased the flocculated chalcopyrite grade from 2% in desliming stage 1 to a maximum of 8% in desliming stage 4 and beyond. At 20 ppm of XG, the flocculated chalcopyrite grade increased from 7.9% in desliming stage 1 to a maximum of 12.7% in desliming stage 3 and beyond. In the case of the addition of 30 ppm and 40 ppm of XG, the flocculated chalcopyrite grade increased from ~12% in desliming stage 1 to a maximum of 19.8% in desliming stage 3 and beyond as shown in Fig. 11. Therefore, 30 ppm of STS was used in further selective dispersion and flocculation tests prior to flotation.
Fig. 11. Grade of flocculated chalcopyrite function of desliming stages
3.6 Flotation tests
In our previous work (Mweene and Subramanian, 2018), results on rougher flotation and selective dispersion-flotation were reported. The Cu grade and recovery in the rougher stage flotation was 7.7% and 50.8% respectively, while the Cu grade and recovery in the rougher flotation stage after selective dispersion improved to15% and 90.4% respectively. Further, SiO2 grade and recovery in the copper concentrate were 44.4% and 10.5% respectively in the absence of selective dispersion, while after selective dispersion the grade and recovery of SiO2 in the copper concentrate were 32.4% and 4.8% respectively. Therefore, the absence of selective dispersion, resulted in a loss in recovery of 39.6% Cu. Rougher flotation test was carried out for the settled portion as shown in Fig. 12(a) using the reagents, conditions and dosages reported in our earlier work (Mweene and Subramanian, 2018). A rougher
Physicochem. Probl. Miner. Process., 54(4), 2018, 1282-1291 1290
concentrate with copper and silica grade of 23.5% and 8.4% respectively and a recovery of 92.8% and 4.8% respectively was obtained as shown in Fig. 12(a). In the rougher flotation tests, a selectivity index (S.I.) of 13.2 was obtained. Further flotation of the rougher concentrate in the first cleaner stage yielded a concentrate with copper grade and recovery of 29.2% and 89.1% respectively, while that of SiO2 decreased to 1.8% and 1.2%, respectively as shown in Fig. 12(b). Additionally, the selectivity index in the cleaner stage increased from 13.2 to 24.2. Therefore, the introduction of selective flocculation prior to flotation required only one cleaning stage to obtain an industrially acceptable grade and recovery of chalcopyrite.
Fig. 12. Recovery and grade of chalcopyrite and silica in (a) rougher concentrate (C) and tails (T) and
(b) cleaner 1 concentrate (C) and tails (T)
4. Conclusions
Based on the results obtained from the investigation on the selective dispersion-flocculation and flotation of MMF ore, the following conclusion can be made:
1. The adsorption of XG on chalcopyrite is maximum at pH 2.3 and decreases with increase in pH. However, there is no adsorption of XG on silica. Thus, chalcopyrite could be selectively flocculated in the presence of silica.
2. Desorption of XG from chalcopyrite containing adsorbed XG increases with increase in pH and reaches a maximum of 96%at pH 8.
3. The IEP of MMF ore is located at pH 2.57 indicating that it is highly siliceous. Both STS and XG are found to shift the zeta potential of MMF ore to more electronegative values. Further, the addition of STS in the presence of XG reduced the zeta potential to more electronegative values.
4. The addition of STS in selective dispersion tests promoted the dispersion of 50% MMF ore thereby increasing the chalcopyrite grade from 2.5 to 5% at a dosage of 30 ppm STS.
5. Flocculation of the dispersed portion using 30ppm XG improved the grade of chalcopyrite in MMF ore to 19.8%.
6. The rougher flotation of the settled portion of MMF ore obtained by selective dispersion – flocculation using KAX+KEX (1:1), at pH 10.32, MIBC as the frother, and sodium sulphide as a sulphidiser yielded a recovery of silica and copper of 4.8% and 92.8% respectively, with the grade of 8.4% and 23.5% respectively, and a selectivity index of 13.2. Further flotation of the rougher concentrate in cleaner stage 1 yielded a concentrate with silica and copper grade of 1.2 and 29.2% respectively and a recovery of 1.8% and 89.1%respectively, and a selectivity index of 24.2% was achieved.
Acknowledgments
The authors would like to Indian Bureau of Mines, Bangalore for the help rendered in carry out the mineralogical characterisation. One of the authors (Levie Mweene) would also like to thank the Indian Institute of Science for the grant of scholarship to pursue his doctoral study. The authors are honoured to dedicate this contribution to Professor Janusz Laskowski, a doyen in the field of mineral processing
Physicochem. Probl. Miner. Process., 54(4), 2018, 1282-1291 1291
and who has also been the Postdoctoral supervisor to one of the authors (SS). We take this opportunity to congratulate Professor Laskowski for his seminal contributions during the past six decades to surface and colloid chemistry of relevance to mineral and coal flotation.
References
DAMIAN, F., DANIEL, F., JOHN, R., 1999. Zeta potential study of the oxidation of copper sulfide minerals, Colloids surf., A, 146, 113-121.
DUBOIS, K., GILLES, K. A, HAMILTON. K., REBERS. P, FRED. S., 1956. Colorimetric Method for Determination of Sugars and Related Substances, Anal. Chem., 28, 350.
FRIEND, J.P., KITCHENER, J.A., 1972. Some physico—chemical aspects of the separation of finely-divided minerals by selective flocculation, Chem. Eng. Sci. 28, 1071.
GAUDIN, A.M., 1939. Principiles of Mineral Dressing, McGRAW-HILL, UK., 136-137. GILES, C.H., MACEWAN, T.H., NAKHWA, S., SMITH, D., 1960. Studies in Adssorption, J. Chem. Soc. p. 3973-3993 KEMPPAINEN, K., TERHI, S., OSSI, L., ARI, Ä., HENRIKKI, L., MIRJA, I., 2016. Flocculation of fine hematite and
quartz suspensions with anionic cellulose nanofibers, Chem Eng Sci, 148, 256-266. LI, H., Zhou, Z., Xu,. Z and Masliyah, J., 2005. Role of Acidified Sodium Silicate in Low Temperature Bitumen Extraction
from Poor-Processing Oil Sand Ores, Ind. Eng. Chem. Res., 44, 4753-4761. LIU, Q., LASKOWSKI, J.S, 1989. The interactions between dextrin and metal hydroxides in aqueous solutions, J. Colloid
Interface Sci., 130, 101-111. LIU, Q., LASKOWSKI, J.S, 1989. The role of metal hydroxides at mineral surfaces in dextrin adsorption, I. Studies on
modified quartz samples, Int. J. Miner. Process., 26, 297-316. LIU, Q., LASKOWSKI, J.S, 1989. The role of metal hydroxides at mineral surfaces in dextrin adsorption, II. Chalcopyrite-
galena separations in the presence of dextrin, Int. J. Miner. Process., 27, 147-155. MWEENE, L., and SUBRAMANIAN, S., 2018. Beneficiation of a complex low-grade copper ore, Copper-Cobalt Africa,
SAIMM Symposium series S97, 123-129. NYAMEKYE, G.A., J.S. LASKOWSKI, J.S., 1993. Adsorption and electrokintic studies on the dextrin-sulphide mineral
modified quartz samples, Int. J. Miner. Process., 26, 297-316. Interactions, J. Colloid Interface Sci., 157, 160-167 QIN, W., WEI, Q., JIAO, F., YANG, C., LIU, R., WANG, P., KE, L., 2013. Utilization of polysaccharides as depressants
for the flotation separation of copper/lead concentrate, Int. J. Mineral. Process., 23, 179-186. RATH, R.K., SUBRAMANIAN, S., SIVANANDAMAND PRADEEP, 2001. Studies on the interaction of guar gum with
chalcopyrite, CMQ, 40, 1, 1-12. RATH, R.K., SUBRAMANIAN, S., 1999. Adsorption, electrokinetic and differential flotation studies on sphalerite and
galena using dextrin, Int.J. Miner. Process., 57, 265-283. ROSALAM, S., ENGLAND, R., 2006. Review of xanthan gum production from unmodified starches by Xanthomonas
comparetris sp, Enzyme Microb. Technol. 39 (2), 197-207. SARAVANAN, L., SUBRAMANIAN, S., 2016. Surface chemical properties and selective flocculation studies on alumina
and silica suspensions in the presence of xanthan gum, Miner. Eng. 98, 213-222. SUTHERLAND, W., 1977. Microbial exopolysaccharide synthesis. Dlm, In: Sandford PA, Laskin A, Extracellular
microbial polysaccharides. USA: ACS, 40–57. TEMPIO, J.S., ZATZ, J.L., 1981. Interaction of Xanthan Gum with Suspended Solids, J. Pharm. Sci., 70 (5), 5.


![[LECTURE] Coagulation and Flocculation](https://img.pdfslide.us/doc/110x75/577d2b6f1a28ab4e1eaac2f2/lecture-coagulation-and-flocculation.jpg)