Embed Size (px)
Citation preview
[RI18867 PLEASE DO Nor REMOVE FRCM LIBRARY
Bureau of Mines Report of Investigations/1984
Dispersion-Se"lective Flocculation-Desliming Characteristics of Oxidized Taconites
By R. E. Green and A. F. Colombo
UNITED STATES DEPARTMENT OF THE INTERIOR
,.. i
Report of Investigations 8867
D ispersion-Selective Floccu lation-Desl i m i ng Characteristics of Oxidized Taconites
By R. E. Green and A. F. Colombo
UNITED STATES DEPARTMENT OF THE INTERIOR William P. Clark. Secretary
BUREAU OF MINES Robert C. Horton. Director
Library of Cpngress'Cataloging in Publication Data:
Green, R. E. (Robert E.), 1925-Dispersion-selecti ve flocculation-des liming characteristics of oxi
dized taconites.
(Report of investigations; 8867)
Bibliography: p.17-18.
Supt. of Docs. no.; I 28.23:8867.
1. Ore-dressing. 2 •. Taconite. 3 •. Slimes (Metallurgy) •. 4 •. Flocculation. I. Colombo, A. ,F. (Arthur F .)~ II. Title. III., Series: Report of investigations (United States. Bureau of Mines) ; 8867.
TN23.U43 [TN 538.17J 6228 [622' .341J 83-600302
¥
CONTENTS
Abstract ••••••••••••••.••••••••••••••••••••••••••••••••••••••••••• t............ 1 Introduction................................................................... 2 Materials ••••••••••••••••••••••••••••••••••••••••••••• ••.••••••••••••••••••••• ~ 3
Preparation of samples....................................................... 3 Mineralogy of samples •••••••••••••••••••••••• :............................... 3
Sample A, MN ••••••••••••••••.•••• ,........................................... 3 Samp Ie B, MI............................................................... 3 Sample C, WI............................................................... 3
Experimental procedures........................................................ 4 Standardized selective flocculation tests.................................... 4 Analytical equipment and methodology.......................................... 5 Chemical reagents............................................................ 5
Sodium silicate............................................................ 5 Sodium tripolyphosphate.................................................... 5 Arosurf MG-98A............................................................. 5 Pearl starch................................................................ 5 Water...................................................................... 6
Hexagonal designed experiments............................................... 6 Experimental results and their interpretation.................................. 6
Influence of sodium silicate and sodium hydroxide dispersion system on selec-tive flocculation........................................................... 7
Interaction of calcium ions and sodium silicate.............................. 7 Interaction of calcium and amine collector................................... 11
Influence of sodium tripolyphosphate (STPP) and sodium hydroxide dispersion system on selective flocculation.............................................. 11 Effect of calcium ion and STPP ••••••••••••••••••••••• e....................... 11 Effect of magnesium ion and STPP •••••••••••••••••••••••••••••• ·••••••••••••••• 13 Effect of ferrous ion and STPP............................................... 14 Effect of ferric ion and STPP................................................ 15 Calcium ion and amine collector.............................................. 15 Sodium silicate-tripolyphosphate dispersion system........................... 15
Summa.ry. • • • • • • • • • • • • • • • • • • • • • • • • • • • • • • • • • • • • • • • • • • • • • • • • • • • • • • • • • • • • • • • • • • • • • • • 16 Conclusions .............................................................. . '. . . . . 17 References. . . . . . . . . . . . . . . . . . . . . . . . . . . . . . . . . . . . . . . . . . . . . . . . . . . . . . . . . . . . . . . . . . . . . 17 Appendix.--Response-surface coefficients and statistical data.................. 19
1.
2.
3.
4.
5.
6.
ILLUSTRATIONS
Response-surface diagrams, silicate-hydroxide system, for percent weight of s limes A, B, and C •••••••••••••••••••••••••••••••••••• !I •••••••••••••••••••
Response-surface diagrams, silicate-hydroxide system, fot"percent iron in slimes A, B, and C .........................•............. ~ .............. .
Response-surface diagrams, silicate-hydroxide system, for ptl\frofile and soluble silica in slurry A •••••••••••••••••••••••••••••••••• , •••••••••••••
Response-surface diagrams, silicate-calcium system, for percent" weigE_t and percent iron in slimes A, B, and C ••••••••••••••••••••••••••••••••••••••••
Response-surface diagrams, STPP-hydroxide system, for percent weight, percent iron, pH profile, and soluble silica in slurry A •••••••••••••••••••••
Response-surface diagrams, STPP-Ca 2 + and STPP-Mg2+ system, for percent
6
8
9
10
12
weight and percent iron in slime A........................................ 13
ii
ILLUSTRATIONS--Continued
7. Response-surface diagrams, STPP-Fe 2 + and STPP-Fe3+ system, for percent weight and percent iron in slime A........................................ 14
8. Response-surface diagrams, silicate-STPP system, for percent weight and percent iron in slime A................................................... 16
TABLES
1. Partial chemical analysis of samples....................................... 3 2. Estimated mineral distribution............................................. 3 3. Size distribution and surface area of feed................................. 4 4. Partial chemical analysis of the aqueous phase............................. 5
UNIT OF MEASURE ABBREVIATIONS USED IN THIS REPORT
°c degree centigrade mg/L milligram per liter
cm2/g centimeter squared per gram min minute
cm/min centimeter per minute mL milliliter
cp centipoise llm micrometer
g gram llmho/cm micromho per centimeter
L liter pct percent
lb pound psi pound per square inch
Ib/ft 3 pound per cubic foot vol pct volume percent
lb/ton pound per ton wt pct weight percent
mg milligram
+
I
l'
DISPERSION.SELECTIVE FLOCCULATIONoDESLIMING CHARACTERISTICS OF OXIDIZED TACONITES
By R. E. Green 1 and A. F. Co lombo 2
ABSTRACT
The Bureau of Mines undertook a bench-scale study of three different types of oxidized taconites3 from the Lake Superior district to improve the dispersion-selective flocculation-desliming process for beneficiating these materials. The response-surface contours of the effects of dissolved ionic species in the water and of three dispersion systems on the selective flocculation process were studied. Results of metallurgical data and chemical analyses of the aqueous phase showed that the water quality affects the performance of the selective flocculation process.
lFormerly research chemist, Twin Cities Research Center, Bureau of Mines, Minneapolis, MN.
2Research Director, Reno Research Center, Bureau of Mines, Reno, NV. 3 u Qxidized" refers to iron oxides that are not recovered by a drum-type magnetic
separator.
2
INTRODUCTION
During the past 20 years, the Bureau of Mines has studied iron ore flotation with the objective of increasing the domestic iron supply through the use of low-grade oxidized taconites. Flotation processes are applicable to beneficiation of substantial tonnage (5, 21);4 most recent research was devoted to the selective flocculation and gangue flotation processes. These processes were evaluated on oxidized materials from Minnesota and Michigan, and yielded concentrates with less than 5 pct silica and accompanying ~ran recoveries of mote than 80 pct.
The slime content of ore slurries has been recognized as detrimental to these flotation processes. Gaudin (8) lists several causes for this: (1) low probability of encounter with air bubbles, (2) chemical and physical characteristics of slime particles, and (3) dissolved species in the Iwater surrounding particles and bubbles. The presence of silica slime in an iron ore can increase the collector consumption and slows the flotation of the silica gangues (7, 11). Desliming usually results in high iron losses. Selective flocculation followed by desliming is an attractive technique because a lower iron content in the slime can be rejected and the reagent consumpt ion is lower.
Using the Haseman system for selective flocculation of slime phosphate in the presence of clay (9) as a starting point, the Bureau of Mines developed a method for treating finely ground iron ores (4-6). The process has three steps: (T) dispersion of the ore ground with sodium hydroxide for pH control and sodium silicate and/or sodium tripolyphosphate as dispersants, (2) selective flocculation of the iron oxide particles with a starch, and (3) separation of the
4Underlined numbers in parentheses refer to the list of references preceding the appendix.
supernatant slime from the settled sands. The alkaline reagents increase the negativity of the mineral particles so that the forces of repulsion acting between them prevent natural flocculation and settling. Corn starch, which is slightly negative due to the presence of the carboxylate group, is preferentially adsorbed on the iron oxides (1) which are selectively flocculated. The deslimed sand or pulp is an excellent feed for the flotation of the gangue minerals in a cationic or calcium-activated system. A successful selective flocculation~ des liming separation depends on the electrokinetic properties of the minerals, both the dissolved species in the water and the mineral .constituents of the ore. Minerals that are soluble in alkaline slurries will rer~ase inorganic ions which are adsorbed on the mdneral particles and influence the magnitude and sign of the zeta potential of the mineral particles. Hydrolyzed metal ions can reverse the charge of an anionic colloidal substrate (13-14, 16-17). Since the selective flocculatTOn-desliming flotation process is a very complex physicochemical system, it is important to evaluate the effects of different metal ions on the dispersion of siliceous gangue minerals. The ionic species selected for this study were chosen for the following reasons: Natural and processed water usually contains dissolved calcium and magnesium ions. If an iron ore deposit contains pyrite, pyrrhotite, and similar mineral gangue, they are a source of dissolved ions. For example, the reaction of air on alkaline pyrite pulp yields sulfide; thiosulfate, sulfate, and iron cations. Ferrous ions will be oxidized to the ferric state and will form a complex amorphous iron hydroxide in the alkaline medium. The precipitate formed may become the flocculant for the dispersed mineral particles. Three types of iron ores were studied to better understand the selective flocculation mechanisms involved.
¥
1
3
MATERIALS
PREPARATION OF SAMPLES
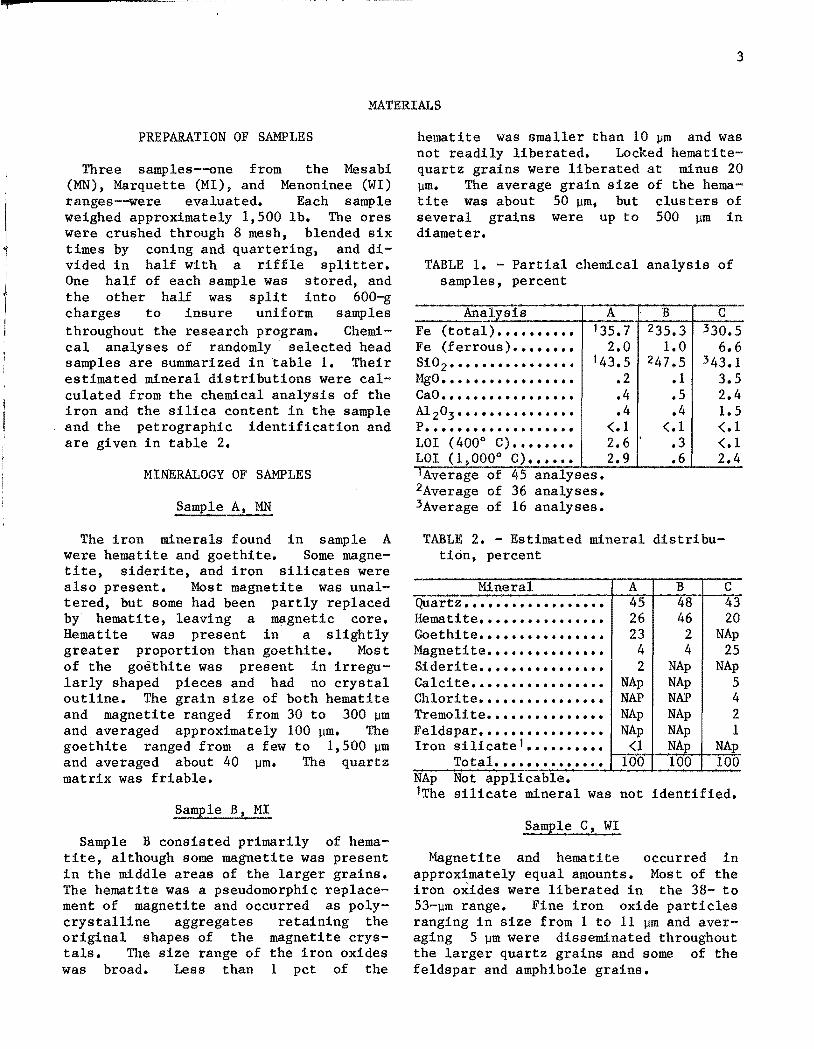
Three samples--one from the Mesabi (MN), Marquette (MI), and Menoninee (WI) ranges--were evaluated. Each sample weighed approximately 1,500 lb. The ores were crushed through 8 mesh, blended six times by coning and quartering, and divided in half with a riffle splitter. One half of each sample was stored, and the other half was split into 600-g charges to insure uniform samples throughout the research program. Chemical analyses of randomly· selected head samples are summarized in table 1. Their estimated mineral distributions were calculated from the chemical analysis of the iron and the silica content in the sample and the petrographic identification and are given in table 2.
MINERALOGY OF SAMPLES
Sample A, MN
The iron minerals found in sample A were hematite and goethite. Some magnetite, siderite, and iron silicates were also present. Most magnetite was unaltered, but some had been partly replaced by hematite, leaving a magnetic core. Hematite was present in a slightly greater proportion than goethite. Most of the goethite was present in irregularly shaped pieces and had no crystal outline. The grain size of both hematite and magnetite ranged from 30 to 300 ~m and averaged approximately 100 ~m. The goethite ranged from a few to 1,500 ~m and averaged about 40 ~m. The quartz matrix was friable.
Sample B, MI
Sample B consisted primarily of hematite, although some magnetite was present in the middle areas of the larger grains. The hematite was a pseudomorphic replacement of magnetite and occurred as polycrystalline aggregates retaining the original shapes of the magnetite crystals. The size range of the iron oxides was broad. Less than 1 pct of the
hematite was smaller than 10 ~m and was not readily liberated. Locked hematitequartz grains were liberated at minus 20 ~m. The average grain size of the hematite was about 50 ~m, but clusters of several grains were up to 500 ~m in diameter.
TABLE 1. - Partial chemical analysis of samples, percent
Analysis A Fe (total) •••••••••• 135.7 Fe (ferrous) •••••••• 2.0 Si02•••••••••••••••• 143.5 MgO .................. CaO •••••••••••••••••
A1 203 • •• • •••• • • • • • • • P ••••••••••••••••••• LOI (4000 C) •••••••• LOI (1,0000 C) •••••• I Average of 45 analyses. 2Average of 36 analyses. 3Average of 16 analyses.
.2
.4
.4 <.1 2.6 2.9
B C 235.3 330.5
1.0 6.6 247.5 343.1
.1 3.5
.5 2.4
.4 1.5 <.1 <.1
.3 <.1
.6 2.4
TABLE 2. - Estimated mineral distribution, percent
Mineral A B C Quartz •••••••••••••••••• 45 48 43 Hematite •••••••••••••••• 26 46 20 Goethite •••••••••••••••• 23 2 NAp Magnetite ••••••••••••••• 4 4 25 Siderite •••••••••••••••• 2 NAp NAp Calcite ••••••••••••••••• NAp NAp 5 Chlorite •••••••••••••••• NAP NAP 4 Tremolite ••••••••••••••• NAp NAp 2 Feldspar •••••••••••••••• NAp NAp 1 Iron silicate 1 •••••••••• <1 NAp NAp
Total .••...•••.•..• 100 100 100 NAp Not applicable. 1The silicate mineral was not identified.
Sample C, WI
Magnetite and hematite occurred in approximately equal amounts. Most of the iron oxides were liberated in the 38- to 53-~m range. Fine iron oxide particles ranging in size from 1 to 11 ~m and averaging 5 ~m were disseminated throughout the larger quartz grains and some of the feldspar and amphibole grains.
,', i
"
I, Ii
'I:
i.II
,: :J 'I: I,
i:, 1< II J ii, J; Ii
i ~
4
EXPERIMENTAL PROCEDURES
STANDARDIZED SELECTIVE FLOCCULATION TESTS
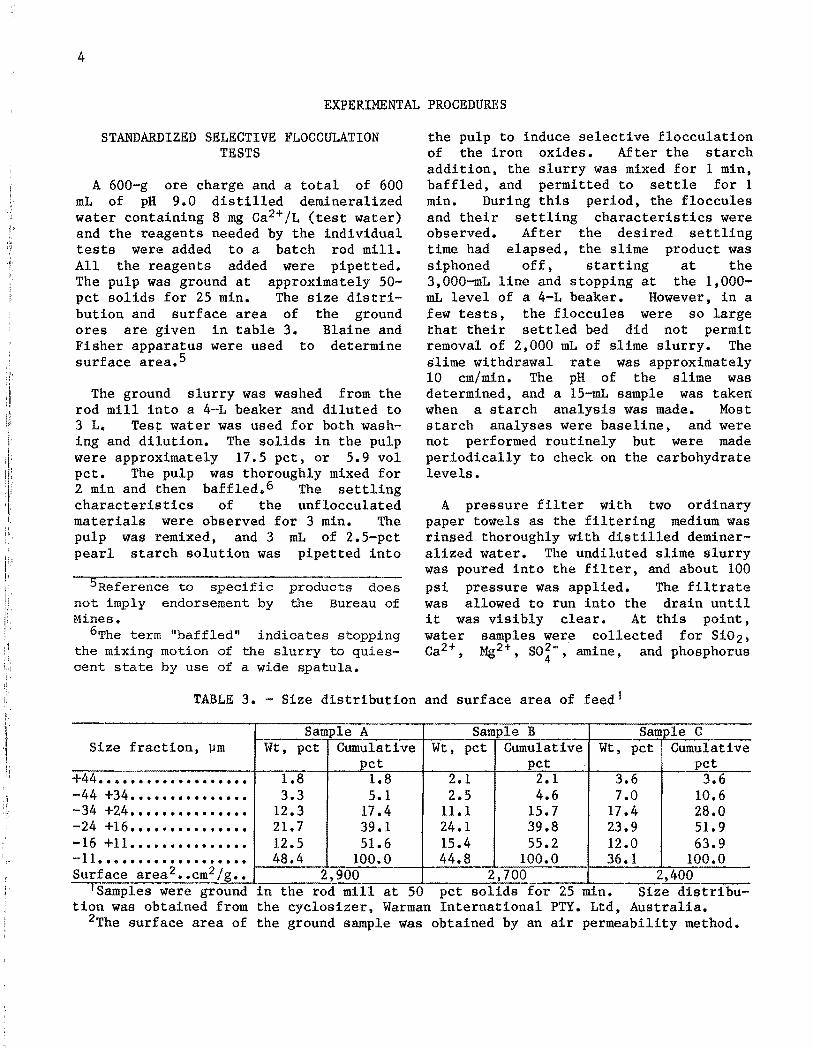
A 600-g ore charge and a total of 600 mL of pH 9.0 distilled demineralized water containing 8 mg Ca2+/L (test water) and the reagents needed by the individual tests were added to a batch rod mill. All the reagents added were pipet ted. The pulp was ground at approximately 50-pct solids for 25 min. The size distribution and surface area of the ground ores are given in table 3. Blaine and Fisher apparatus were used to determine surface area. 5
The ground slurry was washed from the rod mill into a 4-L beaker and diluted to 3 L. Test water was used for both washing and dilution. The solids in the pulp were approximately 17.5 pct, or 5.9 vol pct. The pulp was thoroughly mixed for 2 min and then baffled. 6 The settling characteristics of the unflocculated materials were observed for 3 min. The pulp was remixed, and 3 mL of 2.5-pct pearl starch solution was pipet ted into
5Reference to specific not imply endorsement by Mines.
products does the Bureau of
6 The term "baffled" indicates stopping the mixing motion of the slurry to quiescent state by use of a wide spatula.
the pulp to induce selective flocculation of the iron oxides. After the starch addition, the slurry was mixed for 1 min, baffled, and permitted to settle for 1 min. During this period, the floccules and their settling characteristics were observed. After the desired settling time had elapsed, the slime product was siphoned off, starting at the 3,000-mL line and stopping at the 1,000-mL level of a 4-L beaker. However, in a few tests, the floccules were so large that their settled bed did not permit removal of 2,000 mL of slime slurry. The slime withdrawal rate was approximately 10 em/min. The pH of the slime was determined, and a 15-mL sample was taken when a starch analysis was made. Most starch analyses were baseline, and were not performed routinely but were made periodically to check on the carbohydrate levels.
A pressure filter with two ordinary paper towels as the filtering medium was rinsed thoroughly with distilled demineralized water. The undiluted slime slurry was poured into the filter, and about 100 psi pressure was applied. The filtrate was allowed to run into the drain until it was visibly clear. At this point, water samples were collected for Si02, Ca2+, Mg2+, SO~-, amine, and phosphorus
TABLE 3. - Size distribution and surface area of feed!
Sample A Sample B Sample C Size fraction, !Jm Wt, pct Cumulative Wt, pct Cumulative Wt, pct Cumulative
pct pet pct +44 •.•••••.•.•••.••... 1.8 1.8 2.1 2.1 3~6 3.6 -44 +34 ••••••••••••••. 3.3 5.1 2.5 4.6 7.0 10.6 -34 +24 ••••••••••••••• 12.3 17 .4 11.1 15.7 17 .4 28.0 -24 +16 ••••••••••••••• 21.7 39.1 24.1 39.8 23.9 51.9 -16 +11 ••••••••••••••• 12.5 51.6 15.4 55.2 12.0 63.9 -11 •. ., ••••••.•.••.•••• 48.4 100.0 44.8 100.0 36.1 100.0 Surface 2 2/ area •• cm g •• 2,900 2,700 2,400
'Samples were ground in the rod mill at 50 pct solids for 25 min. Size distribution was obtained from the cyclosizer, Warman International PTY. Ltd, Australia.
2The surface area of the ground sample was obtained by an air permeability method.
as sodium tripolyphosphate (STPP) analyses (19-20). After a sufficient volume was obtained for analysis, the slime remaining was washed· into the filter, filtered, dried, weighed, and analyzed for Fe and SiOz. The sand slurry, which had a volume of approximately 1,000 mL, was filtered, dried, weighed, and analyzed for Fe and SiOz.
The inorganic ions released by the samples were evaluated by grinding 600 g of ore for 25 min in a rod mill with 600 mL of distilled water and no reagent added. The ground ore was washed from the mill with distilled water into a 4-L beaker, and enough water was added to make the final volume 3 L. The slurry was mixed for 2 min and then filtered in a pressure filter. The filtrate was analyzed for pH, calcium, specific conductivity, sulfate, soluble silica, sodium, and total alkalinity. A summary of the averaged results is given in table 4. The low dissolved ionic species leached from the ore samples assures that the selective flocculation procedure can be applied.
ANALYTICAL EQUIPMENT AND METHODOLOGY
A spectrophotometer analyzed the liquid fraction of the slime slurries for soluble silicates, phosphorus as STPP, sulfate, and amine. The ethylenediaminetetroacitic acid (EDTA) complexometric procedure analyzed the calcium and magnesium ions. Reagents used in the chemical analyses were analytized reagent (AR) grade unless stated otherwise.
5
CHEMICAL REAGENTS
Sodium Silicate
The sodium silicate had a SiOz:NazO weight ratio equal to 3.22, a silica content of 28.7 pct, a Baum~ of 41.0°, and a viscosity of 180 cpo A 5-pct silicate solution was used.
Sodium Tripolyphosphate
Granular anhydrous STPP (Na5P3010) with a Pz05 content of 57 pct and a bulk density of 60 Ib/ft 3 was used. One percent STPP solution was made in 1-L batches and gave analyses in the 2,500-mg p/L-range. The theoretical addition was 2,526 mg p/L.
Arosurf MG-98A
MG-98A, an alkyl ether has a chemical formula (CHz)3NH~'acetate, where CsH17 and C,oHZl groups. tion was used.
amine acetate, equal to R-O
R ::II a mixture of A 0.3-pct solu-
Pearl Starch
A Douglas pearl starch was used. Fresh starch dispersion was made every 2 weeks. The percent solids of the thoroughly mixed starch solution was checked with an American Optical TIc refractometer. The readings obtained varied between 2.2 and 2.3 pct solids; theoretically, it should have been 2.5 pct.
TABLE 4. - Partial chemical analysis of the aqueous phase'
Specific Calcium, Sodium, Sulfate, Soluble Total Sample pH conductance, mg/L mg/L mg/L silica, alkalinity,
~mho/cm mg/L mg/L A ••••• 8.1 128 11 10 31 4 21 B ••••• 8.3 65 5 7 10 4 22 C ••••• 9.4 124 7 9 7 10 39 I No reagent addition.
II I" I :'"
I' ! ~,
I'
I I'
6
Water
Distilled and demineralized water, containing less than 0.1 mg salt/L as NaCl per liter, was used to prepare analytical solutions and the test water.
HEXAGONAL DESIGNED EXPERIMENTS
Hexagonal designed experiments were run to evaluate the responses of the three
different ore types. The data obtained were analyzed by a response-surface technique (~-3) using the mathematical model
Y = Bo + Bl(Xl) + B2(X2) + B3(Xl)2
+ B4(X2)2 + B5(Xl)(X2)'
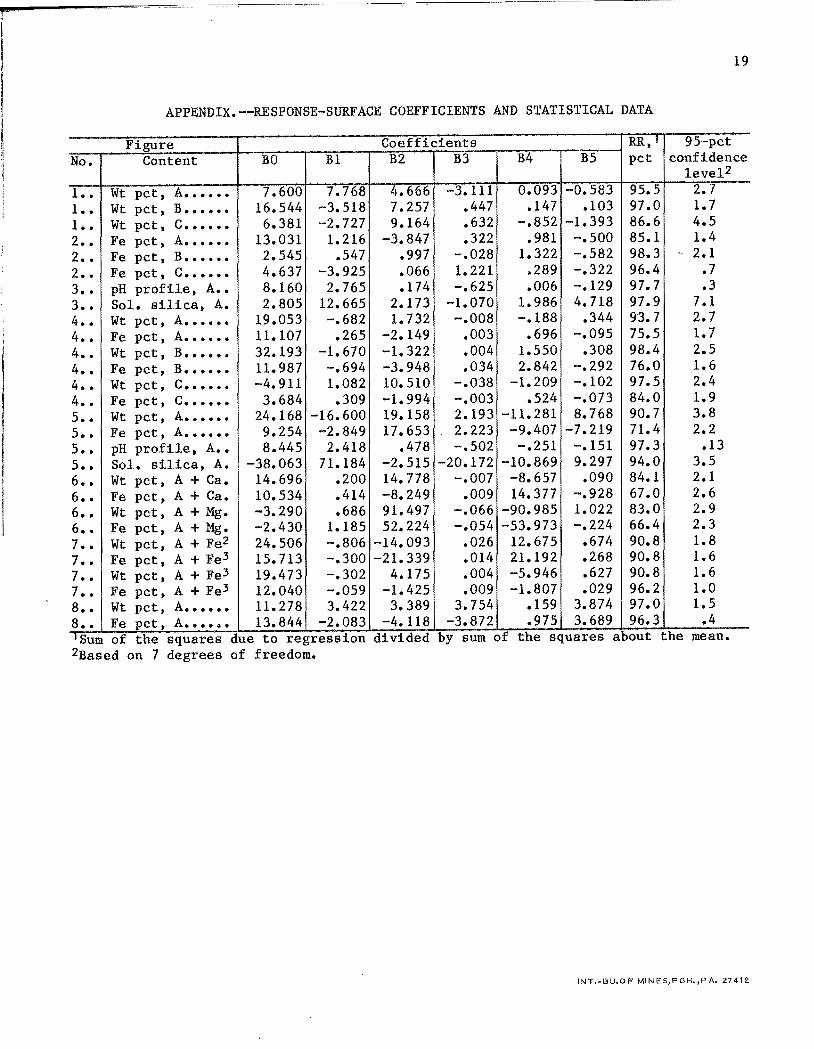
Coefficients for the response-surface diagrams for the statistical analysis of the results are given in the appendix.
EXPERIMENTAL RESULTS AND THEIR INTERPRETATION
In a selective flocculation separation, a sand and a slime product are obtained.
4 c: .2 ....... =: 3 .. W le:::( U ....J 2 C/)
::?E :::> o o C/)
o
WEIGHT, pet
14 SlimeA
0.5 1.0 1.5 2.0 NoOH ADD 1 TION, I b/ton
These products are dependent on each other. Therefore, only one of them needs
WEIGHT, pet 4~~~~~r-~~4<IT-'
c: o .... ?i3 u.i ~ u2 ....J C/)
::?E :::> Ei o (/)
o
__ 30
__ --25
SlimeB
0.5 1.0 1.5 2.0 NoOH ADDI TION, Ib/ton
4 WEIGHT, pet
c: 0 -....... =:3 ..
W l-e:::( U ....J
2 C/)
::?E :::> 0 0 C/)
Slime C
0 0.5 1.0 1.5 2.0 NoOH ADDI TION, Ib/ton
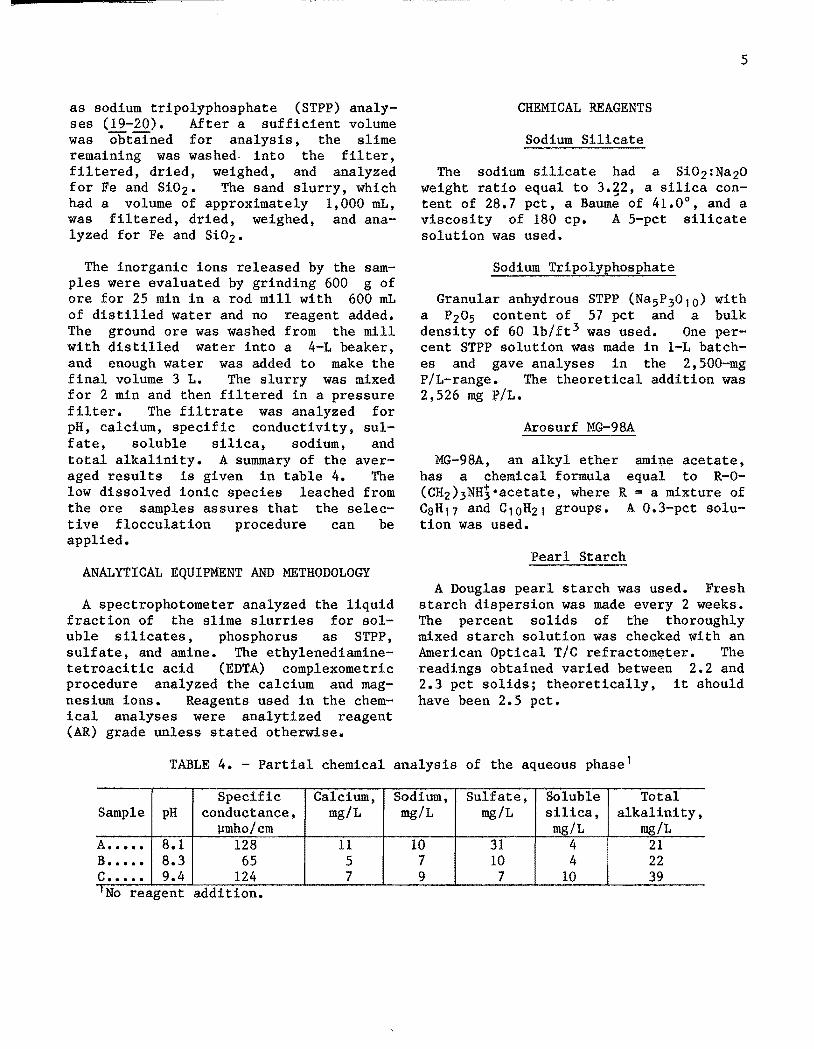
FIGURE 1. • Response-surface dtagrams, silicate-hydroxide system, for percent weight of slimes A,
8, and C.
Z$
to be analyzed. Whenever selective flocculation data are presented or tests are compared, the slime products will be given primary emphasis. This choice was made because the slime slurry is the primary indicator of the state of dispersion and flocculation caused by the reagents being evaluated.
The results of the experiment determined the parameters of the response-surface contours. The figures include two or more test data (parenthesized), which are marked by the solid circles on the figures.
INFLUENCE OF SODIUM SILICATE AND SODIUM HYDROXIDE DISPERSION
SYSTEM ON SELECTIVE FLOCCULATION
Sodium silicate addition between 0 and 4 lb/ton and sodium hydroxide addition from 0 to 2 Ib/ton of ore were evaluated. 7 The starch addition was maintained constant at 0.25 lb/ton for samples A and B. Sample C was selectively flocculated with 0.15 lb/ton of starch; the amount of starch was decreased because all of the mineral suspension including the silica and carbonate gangue flocculated. Figure 1 shows the response-surface diagrams of weight percent of slime obtained from the three types of iron ore: goethite-hematite (A), hematite (B), and magnetite-hematite (C). All the samples evaluated showed an increase in the weight of slime with increased silicate addition. The more highly dispersed slurries were the result of higher electronegativity of the siliceous gangue and the iron oxide minerals, which increased the coulombic dispersion forces among the mineral particles. At constant silicate addition, samples B and C showed a decrease in slime weight with increased hydroxide addition. In
7The ton referred to in this paper is the short ton or 2,000 lb.
7
slurry A, when the hydroxide addition was lIb, the slime weight increased; it decreased at additions greater than 1 lb.
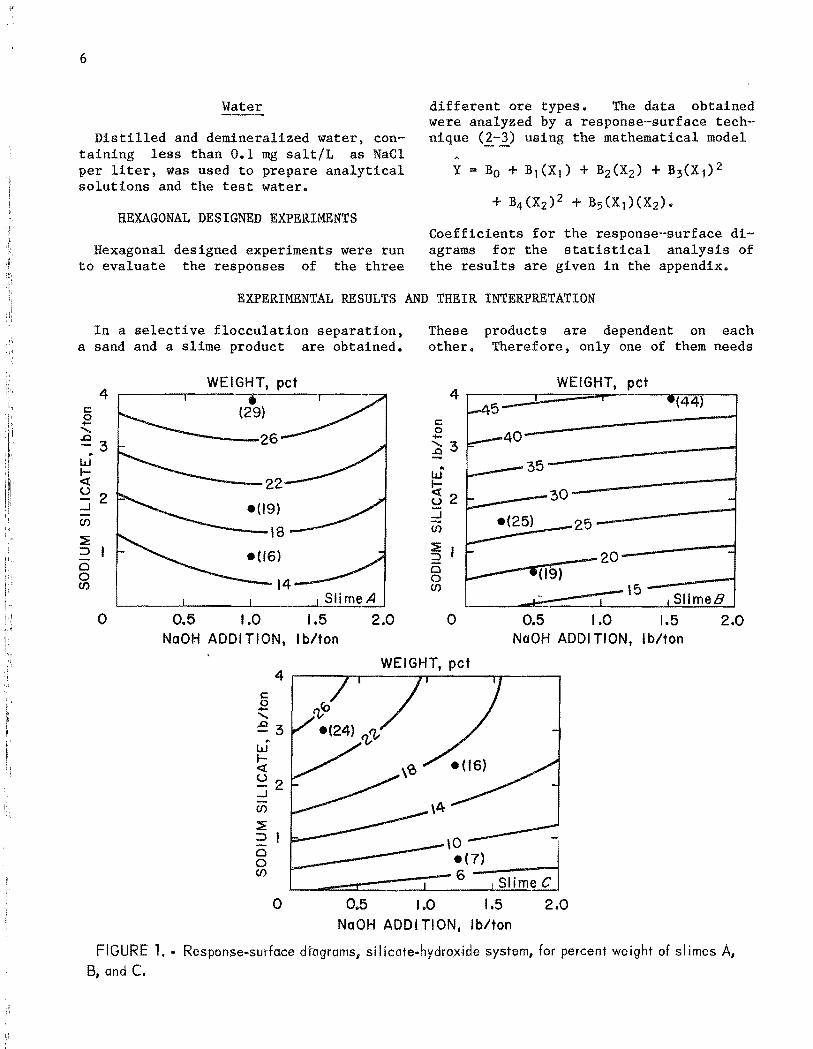
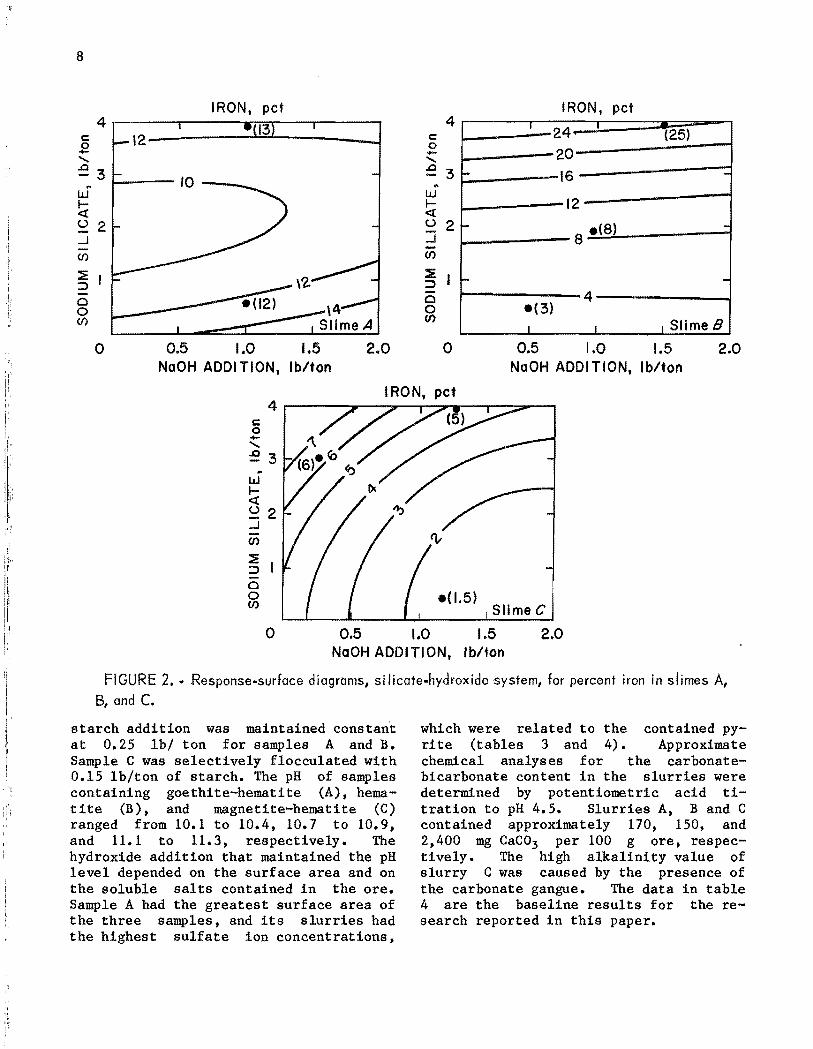
The iron assay of the slime from slurry A (fig. 2) decreased with increased silicate addition up to 2 lb/ton and then increased with silicate addition above this level. Slurry B (fig. 2) gave an increase in the iron assay with more silicate addition. However, the iron lost to the slime product can be regained through the increased addition of starch flocculants. As shown in figure 2, slime iron content of the magnetichematite sample C was increased by increasing the silicate. Ore C gave the lowest slime iron content of the three samples. This may be because magnetite is chemically inert to silicate and hydroxide ions and can form a magnetic floccule.
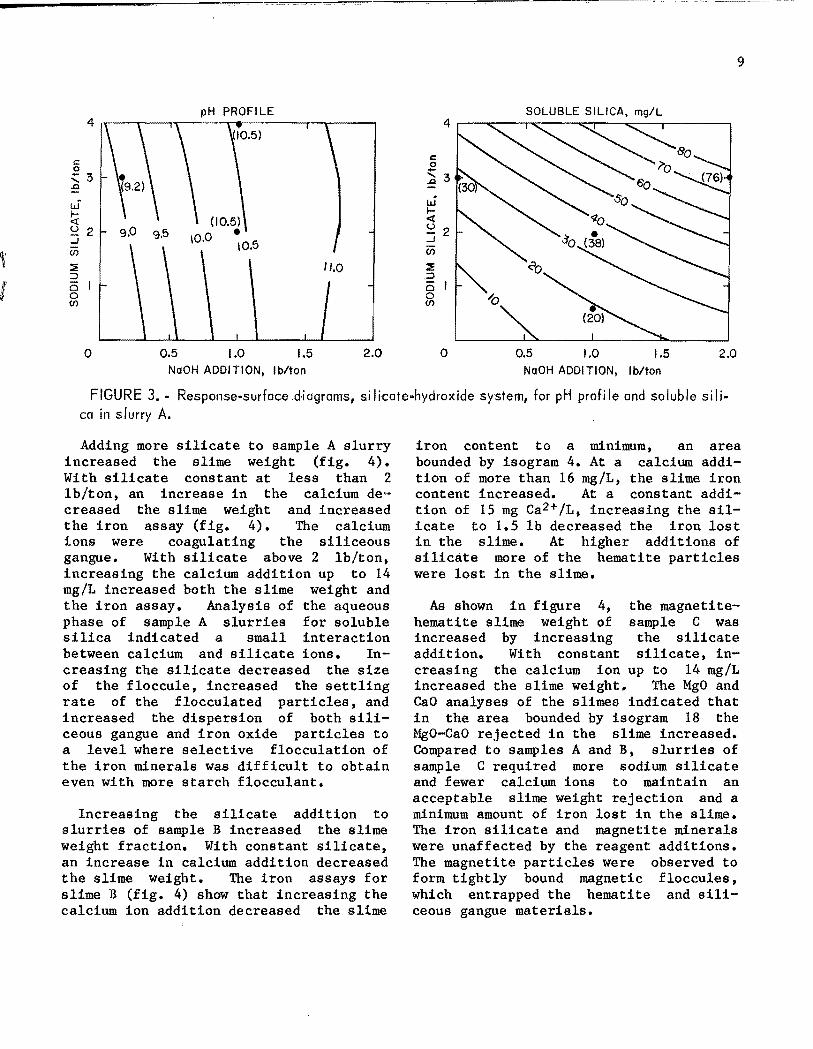
The pH profile reported in figure 3 applied to all three slurries. The soluble silicate isograms in figure 3 were similar to those for the other two except that approximately twice the amount of silicate ions was present. In figure 3 at constant silicate addition, silicate ion content increased with increased sodium hydroxide addition because the fine siliceous gangue particles react with the alkaline water according to the following simplified reaction (!Q) :
Si02 + 2H20 + 20H-~ Si(OH) ~- •
INTERACTION OF CALCIUM IONS AND SODIUM SILICATE
The relationship between calcium ions and sodium silicate was evaluated in the ranges of 0 to 28 mg Ca 2+ (CaC12·2H20) per liter and 0 to 4 lb sodium silicate per ton of ore. The sodium hydroxide addition was constant at 1.0 lb/ton. The
,1,
"
Ii"
I'
, '; ,
8
IRON, pet 4 4
c: 12 c: 0 0 - -....... .......
I 24
I (25)
20 ::!3 .Q
3 - 16 -.. .. w W l- I-<I <I
12 U 2 u 2 ..J ..J
r 8 .(8) -CJ) CJ)
:::E ::2: :::J \'2. :::J - -CJ CJ 0 \4 0 CJ) Slime A
CJ)
4 -(3) I I I SlimeB
0 0.5 1.0 1.5 2.0 0 0.5 1.0 1.5 2.0 NoOH ADDI TION, Ib/ton NoOH ADDITION, Ib/ton
IRON, pet 4
c: 0 -.......
.Q 3 .. w I-<I U 2 ..J CJ)
::E :::J CJ 0 _( 1.5) CJ) Slime C
0 0.5 1.0 1.5 2.0 NoOH ADDITION, Ib/ton
FI GURE 2. -Response-surface diagrams, si I icate.hydrox ide system, for percent iron ins I imes A, B, and C.
starch addition was maintained constant at 0.25 lb/ ton for samples A and B. Sample C was selectively flocculated with 0.15 lb/ton of starch. The pH of samples containing goethite-hematite (A), hematite (B), and magnetite-hematite (C) ranged from 10.1 to 10.4, 10.7 to 10.9, and 11.1 to 11.3, respectively. The hydroxide addition that maintained the pH level depended on the surface area and on the soluble salts contained in the ore. Sample A had the greatest surface area of the three samples, and its slurries had the highest sulfate ion concentrations,
which were related to the contained pyrite (tables 3 and 4). Approximate chemical analyses for the carbonatebicarbonate content in the slurries were determined by potentiometric acid titration to pH 4.5. Slurries A, Band C contained approximately 170, 150, and 2,400 mg CaC03 per 100 g ore, respectively. The high alkalinity value of slurry C was caused by the presence of the carbonate gangue. The data in table 4 are the baseline results for the research reported in this paper.
\
r
9
pH PROFILE SOLUBLE SILICA, mg/L 4 4
c: c 0 0 -.:::: :3 ~ :3
:!i? W W r- r-<t: <4 u 2 u 2 :i -1
U5 U5 :::iE 11.0 ~ :::::> .:::::> 0 0 0 0 (I) (I)
o 0.5 1.0 1.5 2.0 o 0.5 1.0 1.5 2.0 NoOH ADDITION, Ib/ton NoOH ADDITION. Ib/ton
FIGURE 3 •• Response-surfaced·iagrams, silicate-hydroxide system, for pH profile and soluble silica in slurry A.
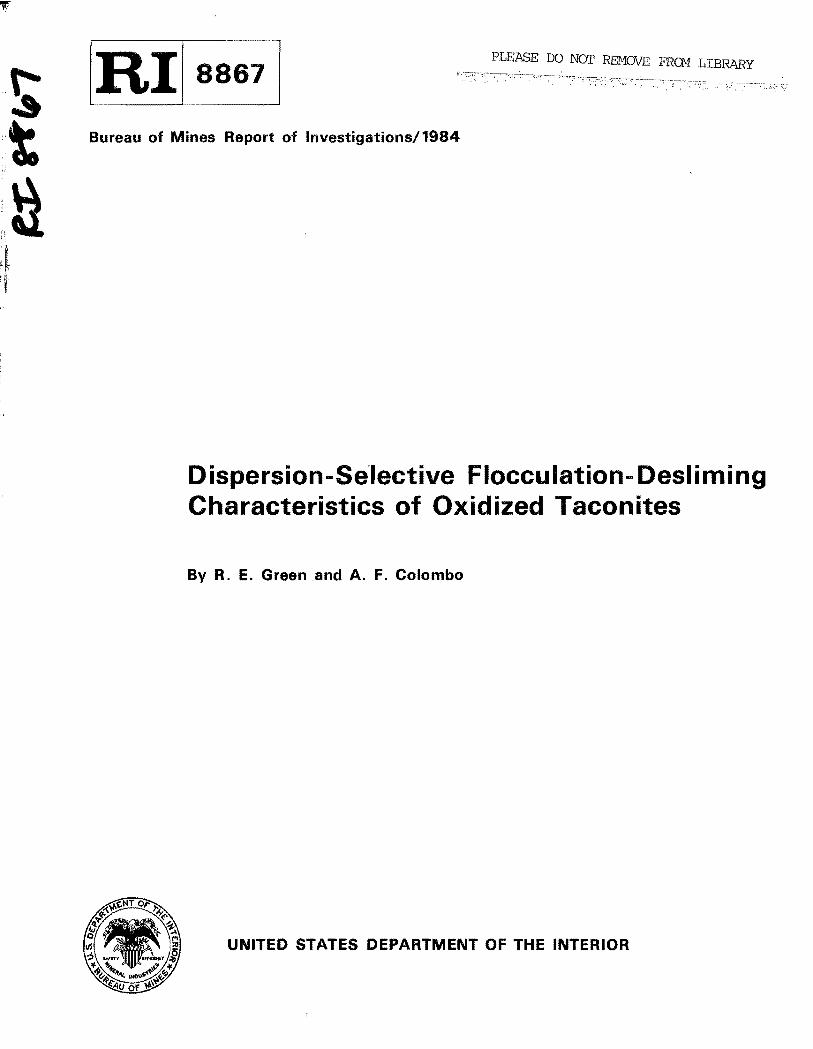
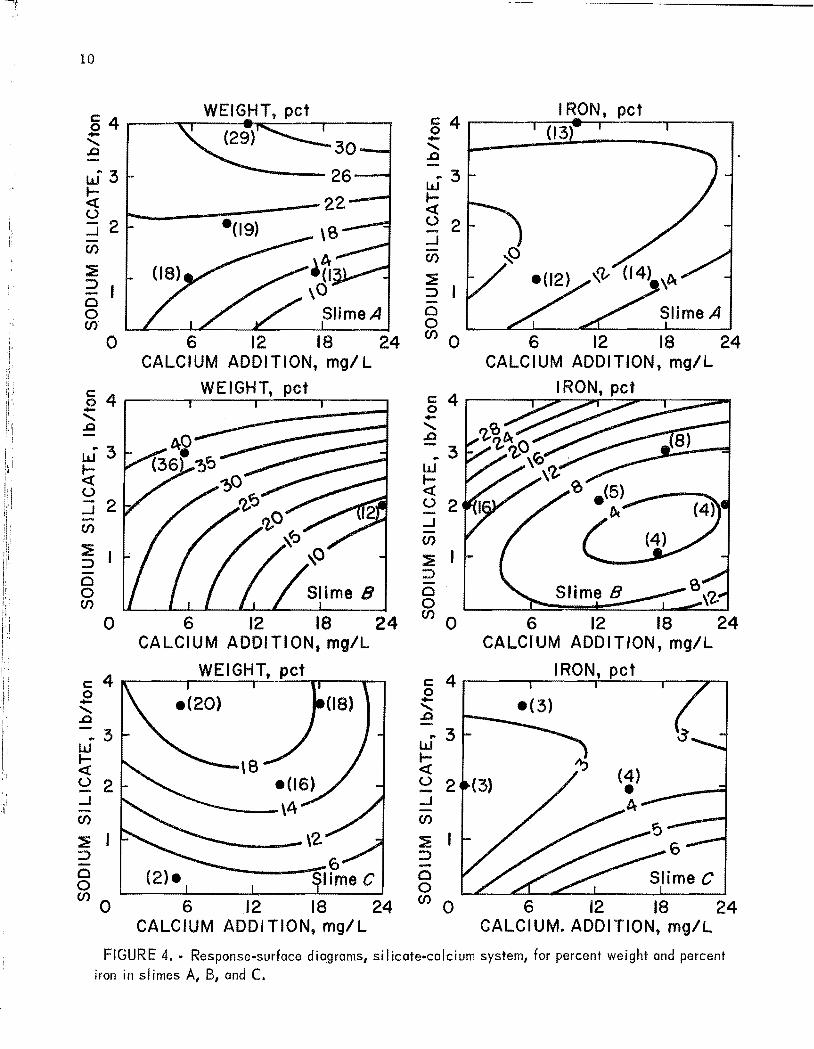
Adding more silicate to sample A slurry increased the slime weight (fig. 4). With silicate constant at less than 2 lb/ton, an increase in the calcium decreased the slime weight and increased the iron assay (fig. 4). The calcium ions were coagulating the siliceous gangue. With silicate above 2 lb/ton, increasing the calcium addition up to 14 mg/L increased both the slime weight and the iron assay. Analysis of the aqueous phase of sample A slurries for soluble silica indicated a small interaction between calcium and silicate ions. Increasing the silicate decreased the size of the floccule, increased the settling rate of the flocculated particles, and increased the dispersion of both siliceous gangue and iron oxide particles to a level where selective flocculation of the iron minerals was difficult to obtain even with more starch flocculant.
Increasing the silicate addition to slurries of sample B increased the slime weight fraction. With constant silicate, an increase in calcium addition decreased the slime weight. The iron assays for slime B (fig. 4) show that increasing the calcium ion addition decreased the slime
iron content to a minimum, an area bounded by isogram 4. At a calcium addition of more than 16 mg/L, the slime iron content increased. At a constant addition of 15 mg Ca2+/L, increasing the silicate to 1.5 lb decreased the iron lost in the slime. At higher additions of silicate more of the hematite particles were lost in the slime.
As shown in figure 4, the magnetitehematite slime weight of sample C was increased by increasing the silicate addition. With constant silicate, increasing the calcium ion up to 14 mg/L increased the slime weight. The MgO and CaO analyses of the slimes indicated that in the area bounded by isogram 18 the MgO-CaO rejected in the slime increased. Compared to samples A and B, slurries of sample C required more sodium silicate and fewer calcium ions to maintain an acceptable slime weight rejection and a minimum amount of iron lost in the slime. The iron silicate and magnetite minerals were unaffected by the reagent additions. The magnetite particles were observed to form tightly bound magnetic floccu1es, which entrapped the hematite and siliceous gangue materials.
10
g 4 ....---.,....,..--~::-----r----r -...... .Q
LJ:3 .... <t (.)
-l 2 00
~ :::> o o 00
o
-(9) \ s
.\t ,0
Slime A
6 12 18 24 CALCIUM ADDITION, mgt L
WEIGHT, g 4~--~----~~--~-----r , .Q
LJ3 ~ (.)
-l 2 00
~ ::> o o 00
o 6 12 18 24 CALCIUM ADDITION, mg/L
c:: 4 .-----v-----.---!-...::.....-..,..,...-__ -.. o -...... .Q
- .. :3 w .... <t (.) 2 -l
00
::!! ::> o o 00
0
(2)-
6 12 18 24 CALCIUM ADDITION, mg/L
g 4 .------"T~___:e--r-----r----, -...... .Q
LJ3 .... <t (.) 2 -l 00
::!! ::> o o 00 0 6 12 18 24
CALCIUM ADDITION, mg/L
c 4 ..------.---",..---:::.i-~ _____ --.--__=_ o -......
.Q
- .. 3 w ~ (.) 2 -l
00
~ ::> o· o 00 0
Slime B ~\'2; 6 12 18 24
CALCIUM ADDITION, mg/L
c:: 4 ...------r----i--'------.----...--, o ,
.Q
.. 3 w .... <t (.) 2 -l
00
~ :::> -o o 00 0
Slime C
6 12 18 24 CALCIUM. ADDITION, mg/L
FIGURE 4 •• Response .. surface diagrams, si licate"calcium system, for percent weight and percent
iron in slimes A, B, and C.
---------------_ .. _--_ ... __ ... r I I 1 , ;
INTERACTION OF CALCIUM AND AMINE COLLECTOR
The effects of flocculation by the calcium and amine additions were evaluated for samples A and B in the range of a to 20 mg Ca2+/L and a to 20 ppm Arosurf MG-98A. The dispersion system employed 1.0 lb NaOH and 2.0 lb sodium silicate per ton of ore. The pH of slurries A and B ranged from 10.1 to 10.5 and 10.8 to 11.0, respectively. The slime weight rejection for the goethite-hematite slurry A and for the hematite slurry B was independent of the amine addition and strongly dependent on the calcium ion addition. Chemical analyses of solutions containing amine-calcium and amine-silicate mixtures, which were adjusted to pH 11.5, showed that no
11
interaction had occurred between these components.
When more calcium was added, the slime weights for both slurries A and B decreased, indicating that adsorbed Ca 2+ caused coagulation of the iron oxides and siliceous gangue. Chemical analyses of the filtrates from both samples indicated that some calcium ions reacted with the silicate ions in the pulp and suppressed the equilibrium condition for the dissolution of siliceous gangue. Slurry B pulp showed more silicate ions because of its more alkaline environment. The residual amine in both pulps was less than 1 mg/L. The amine adsorptive capacities of samples A and B at pH 11.5 were 47 and 35 mg per 100 g of sample, respectively.
INFLUENCE OF SODIUM TRIPOLYPHOSPHATE (STPP) AND SODIUM HYDROXIDE DISPERSION SYSTEM ON SELECTIVE FLOCCULATION
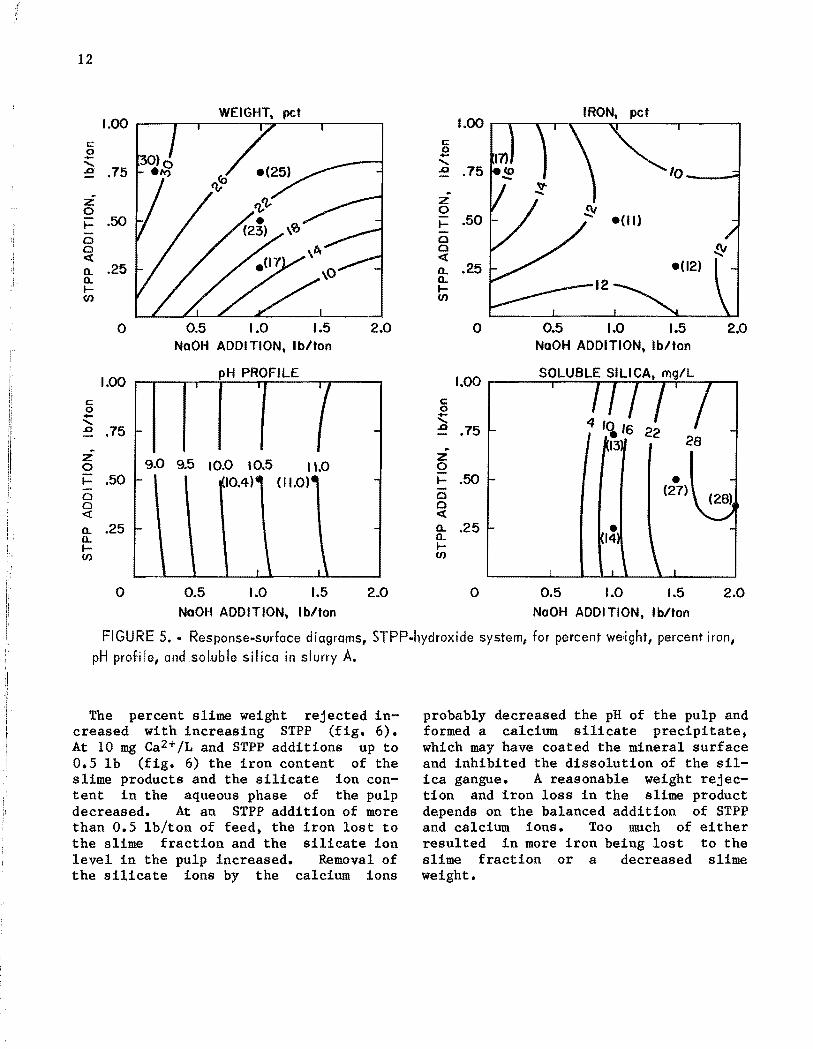
The sodium hydroxide and sodium tripolyphosphate dispersion system was evaluated for ranges from a to 2.0 lb NaOH and from a to 1.0 lb STPP per ton of ore. For the goethite-hematite slime (A) in figure 5, increasing the STPP increased the slime weight. At constant STPP addition, iricreasing the hydroxide decreased the slime weight. The iron assays in figure 5 showed a different trend from that obtained from the slime weight analysis; in general, the iron content of the slime products decreased with increasing reagents.
In ions tion with the 5). 1.5 11.4 from
the system evaluated, the silicate produced from the caustic dissoluof the siliceous gangue increase increased NaOH addition, and also
pH increases from 9.0 to 11.4 (fig. When the NaOH additions were above
lb/ton, the pH ranged from 11.0 to and the soluble silica level ranged 25 to 30 mg/L.
In many types of water treatment, phosphate and tripolyphosphate compounds are used to prevent calcium carbonate deposition. The phosphate anions are also
removed from the water by alumina, kaolinites, montmorillonite, and freshly precipitated ferric and aluminum hydroxides (18). Analyzing the pulp aqueous phase for soluble phosphorus showed a trend of increasing STPP adsorption with increased slime weight. The phrase "STPP adsorption" is used because the STPP ions could be adsorbed as.a complex on the mineral surface or removed from solution as a precipitate. Increasing the sodium ion concentration increased the dissociation of the STPP-metal complex and decreased the STPP adsorption. Increased slime weight and lower iron analyses occurred at high STPP adsorptions and were ind~cations of selective separation of the iron oxide and gangue minerals.
EFFECT OF CALCIUM ION AND STPP
The relationship between Ca2+ (CaCl2 '2H20) and STPP was evaluated for addition limits from a to 1.0 lb STPP/ton and from a to 28 mg calcium/L. The NaOH addition was kept at 1.0 Ib/ton of ore. The pH of the tests ranged from 9.8 to 10.6 for goethite-hematite slurries.
il "
r
1·.1 ,
Ii:
ii " I, ' I, ,
I
t i. I.
I' :1
II
12
WEIGHT, pet 1.00 ......... --.----.------.,,....,.,.---,-------,
c::: o -...... .0' .75
z o I- .50 o o « n. .25 n. l-f/)
o 0.5 1.0 1.5 2.0
c::: o
NoOH ADDITION, Ib/ton
pH PROFILE 1.00 r--r-----r-y--;----,rr---',-r----,
.-...... ..Q .75 f-
z o I- .50 o o « n. .25 -a.. l-f/)
o
, 9.0 9.5 10.0 '0.5 11.0
I 10.4)~ 01.0).
, I \ 1\
0.5 1.0 1.5 2.0 NoOH ADDITION. Ib/ton
IRON, pet 1.00 ,..--,.---r---.-,----.:T---.,..-----.,
c: J2 ...... .0 .75
z o I- .50 o o « n. .25 n. l-f/)
c: o .-:ll ~
z o
o
.75
I- .50 o o « a.. .25 n. l-f/)
o
0.5 1.0 1.5 NoOH ADDITION, Ib/ton
0.5 1.0
28
• (27)
1.5
NaOH ADDITION, Ib/ton
2.0
2.0
FIGURE 5 •• Response .. surface diagrams, STPP .. hydroxide system, for percent we,ight, percent iron,
pH profi Ie, and .soluble silica in slurry A.
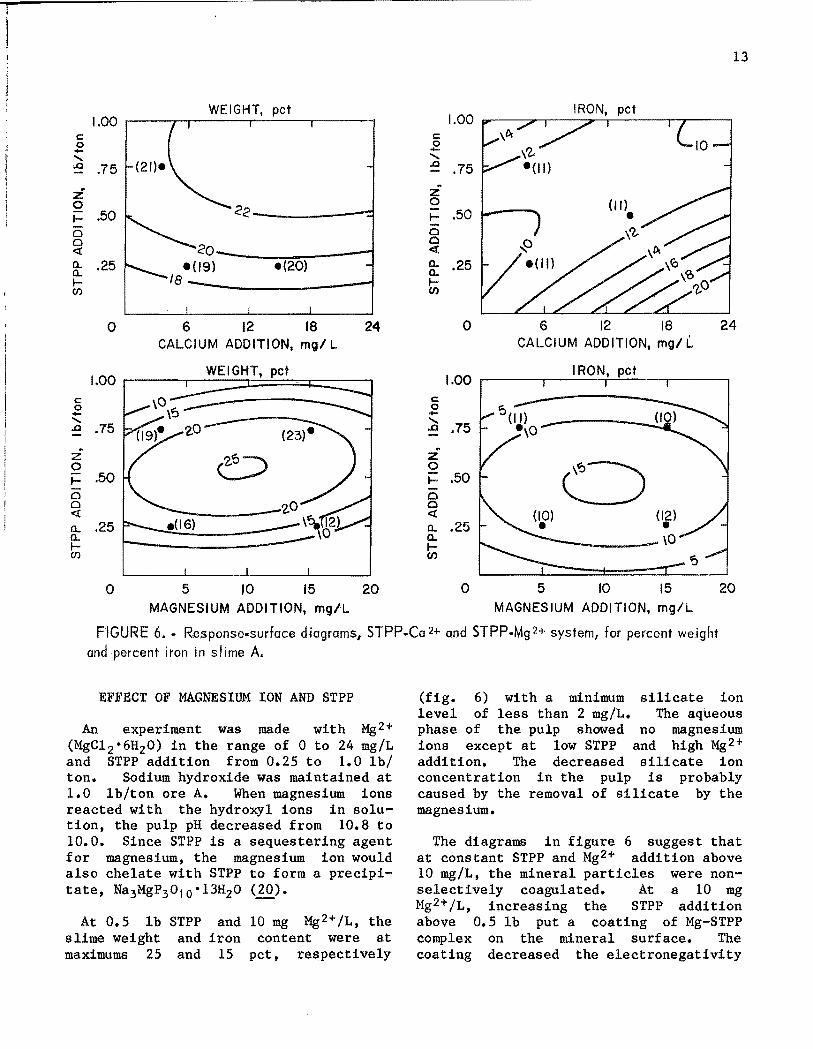
The percent slime weight rejected increased with increasing STPP (fig. 6). At 10 mg Ca2+/L and STPP additions up to 0.5 1b (fig. 6) the iron content of the slime products and the silicate ion content in the aqueous phase of the pulp decreased. At an STPP addition of more than 0.5 1b/ton of feed, the iron lost to the slime fraction and the silicate ion level in the pulp increased. Removal of the silicate ions by the calcium ions
probably decreased the pH of the pulp and formed a calcium silicate precipitate, which may have coated the mineral surface and inhibited the dissolution of the silica gangue. A reasonable weight rejection and iron loss in the slime product depends on the balanced addition of STPP and calcium ions. Too much of either resulted in more iron being lost to the slime fraction or a decreased slime weight.
r ~ 1 I 1 1 , ~ ;
1
13
1.00 WEIGHT, pet
1.00 c c 0 0 - -...... ......
..a .75 (21)e .Q .75
Z Z 0 22
0
I- .50 I- .50 a a a 0 <! « a.. .25 e(20) a.. .25 a.. a.. l- I-00 00
0 6 12 18 24 0 6 12 18 24 CALCIUM ADDITION, mgl L CALCIUM ADDITION, mgl L
1.00 WEIGHT, pet
1.00 c c 0 0 - -...... ......
.75 .Q .75 .c
~ ~
z 0 z 0 0
0 I- .50 I- .50 a a a a <! <! a.. .25 CL .25 a.. a.. l- I-00 C/)
0 5 10 15 20 0 5 10 15 20 MAGNESIUM ADDITION, mglL MAGNESIUM ADDITION, mg/L
FIGURE 6. •• Response.surface diagrams, STPP.Ca 2+ and STPP.Mg 2+ system, for percent weight
and percent iron in slime A.
EFFECT OF MAGNESIUM ION AND STPP
An experiment was made with MgZ+ (MgCl Z·6HzO) in the range of a to 24 mg/L and STPP addition from 0.25 to 1.0 lb/ ton. Sodium hydroxide was maintained at 1.0 lb/ton ore A. When magnesium ions reacted with the hydroxyl ions in solution, the pulp pH decreased from 10.8 to 10.0. Since STPP is a sequestering agent for magnesium, the magnesium ion would also chelate with STPP to form a precipitate, Na3MgP3010·13HzO (~).
At 0.5 lb STPP and 10 mg MgZ+/L, the slime weight maximums 25
and iron content were at and 15 pct, respectively
(fig. 6) with a minimum silicate ion level of less than 2 mg/L. The aqueous phase of the pulp showed no magnesium ions except at low STPP and high Mgz+ addition. The decreased silicate ion concentration in the pulp is probably caused by the removal of silicate by the magnesium.
The diagrams in figure 6 suggest that at constant STPP and MgZ+ addition above 10 mg/L, the mineral particles were nonselectively coagulated. At a 10 mg MgZ+/L, increasing the STPP addition above 0.5 lb put a coating of Mg-STPP complex on the mineral surface. The coating decreased the electronegativity
;.
" 'j
u • "
14
of the mineral particle and subsequently decreased the slime weight rejections.
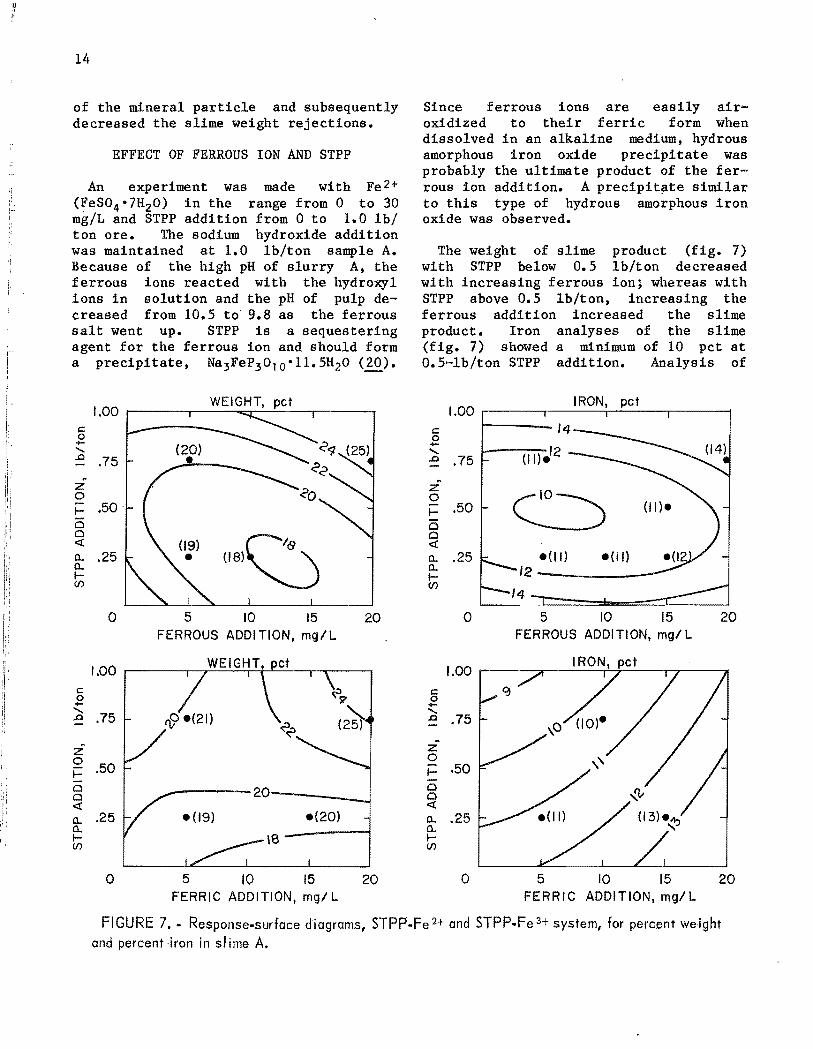
EFFECT OF FERROUS ION AND STPP
An experiment was made with Fe 2+ (FeS04 ·7H2 0) in the range from 0 to 30 mg/L and STPP addition from 0 to 1.0 lb/ ton ore. The sodium hydroxide addition was maintained at 1.0 lb/ton sample A. Because of the high pH of slurry A, the ferrous ions reacted with the hydroxyl ions in solution and the pH of pulp decreased from 10.5 to 9.8 as the ferrous salt went up. STPP is a sequestering agent for the ferrous ion and should form a precipitate, Na3FeP3010·11.5H20 (1Q).
1.00 c: 0 ....
(20) "-.0 .75 ~
z 0 I- ,50 CS a c::(
~ a.. .25 (18) a.. l-(f)
0 5 10 15 20 FERROUS ADDITION, mg/L
1,00 c: 0 +-"- .75 .0
Z 0 I- .50 a 20 a c::(
a.. .25 .(19) .(20) a.. l-(f)
0 5 10 15 20 FERRIC ADDITION, mgl L
Since ferrous ions are easily airoxidized to their ferric form when dissolved in an alkaline medium, hydrous amorphous iron oxide precipitate was probably the ultimate product of the ferrous ion addition. A precipitate similar to this type of hydrous amorphous iron oxide was observed.
The weight of slime product (fig. 7) with STPP below 0.5 lb/ton decreased with increasing ferrous ion; whereas with STPP above 0.5 lb/ton, increasing the ferrous addition increased the slime product. Iron analyses of the slime (fig. 7) showed a minimum of 10 pct at 0.5-lb/ton STPP addition. Analysis of
1.00 c: 0 -"-.0 .75
~
z
~ 0 I- ,50 CS a c::(
a.. .25 .(11) .(11) a.. 12 I-(f)
0 5 10 15 20 FERROUS ADDITION, mg/L
1.00 c: 0 .... "-.0 .75 ~
z 0 I- .50 0 0 c::(
a.. .25 a.. I-(f)
0 5 10 15 20 FERRIC ADD I T ION, mgl L
FIGURE 7 ... Response-surface diagrams, STPP.Fe 2+ and STPP .. Fe 3+ system, for percent weight and percent iron in slime A.
~?------------------------------~--------------------------------.----
the aqueous phase of the pulp showed that the silicate ion level was less than 10 mg/L at low and high STPP addition.
EFFECT OF FERRIC ION AND STPP
An experiment was made with Fe3+ (FeC13·6H20) in the range from 0 to 26 mg/L and STPP addition from 0 to 1.0 lb/ ton feed. Sodium hydroxide addition was again at 1.0 lb/ton of sample A. Because of the high pH, the ferric ions reacted with dissolved hydroxyl ions to decrease the pH of the pulp from 10.6 to 10.0. According to Van Wazer (l1, 20):
When ferric sulfate is added to a solution of sodium tripolyphosphate, the only crystalline phosphate obtained is ferric pyrophoshate. Presumably there is formation of considerable amounts of hydrated ferric oxide which is known to catalyze strongly the degradation of the condensed phosphates.
It is assumed that the phosphates also applies chloride salt.
degradation of to the ferric
The effects on the slime weight (fig. 7) are that at low STPP levels increasing the ferric ion addition had little or no effect and most of the STPP was degraded into pyrophosphate and orthophosphates. At high STPP addition, increasing the ferric ion addition increased the slime weight. Increasing the STPP addition also increased the slime weight. The corresponding analyses of the slime show that the iron content decreased with increasing STPP but increased with increasing ferric addition. Analysis of the aqueous phase showed that the silicate ion concentration decreased with increasing STPP and ferric ion additions. A brown coating was observed on the wall of the mixing beaker, on the spatula, and on the mineral particles throughout these tests, and this coating increased in the direction of increased ferric addition.
15
The ferric salt formed hydrous iron oxide which was adsorbed or inhibited the formation of silicate ions by the caustic dissolution of the siliceous gangue.
CALCIUM ION AND AMINE COLLECTOR
The effects of calcium ion and the amine collector were evaluated .in the range from 0 to 28 mg Ca2+/L and 0 to 20 mg amine/L. The sodium hydroxide and STPP were maintained at 1.0 lb and 0.3 lb/ton of sample A, respectively. The pH of the pulp varied slightly -from 10.8 to 10.9. Results indicated that the amount of slime rejected was independent of amine addition and strongly dependent on the calcium ion addition. The corresponding iron grade of slime product was between 5.5 and 6.5 over the range evaluated. A corresponding analysis on the filtrate showed that the percent STPP adsorbed or precipitated was increased by increasing the calcium and indicates that a precipitate, probably NaCa2P3010·4H20 (20), was formed.
The amine content in the filtrate was less than the amount of amine added. It remained unchanged with increased calcium addition but increased with increasing amine addition. The results were similar to those of tests conducted with sodium silicate dispersants.
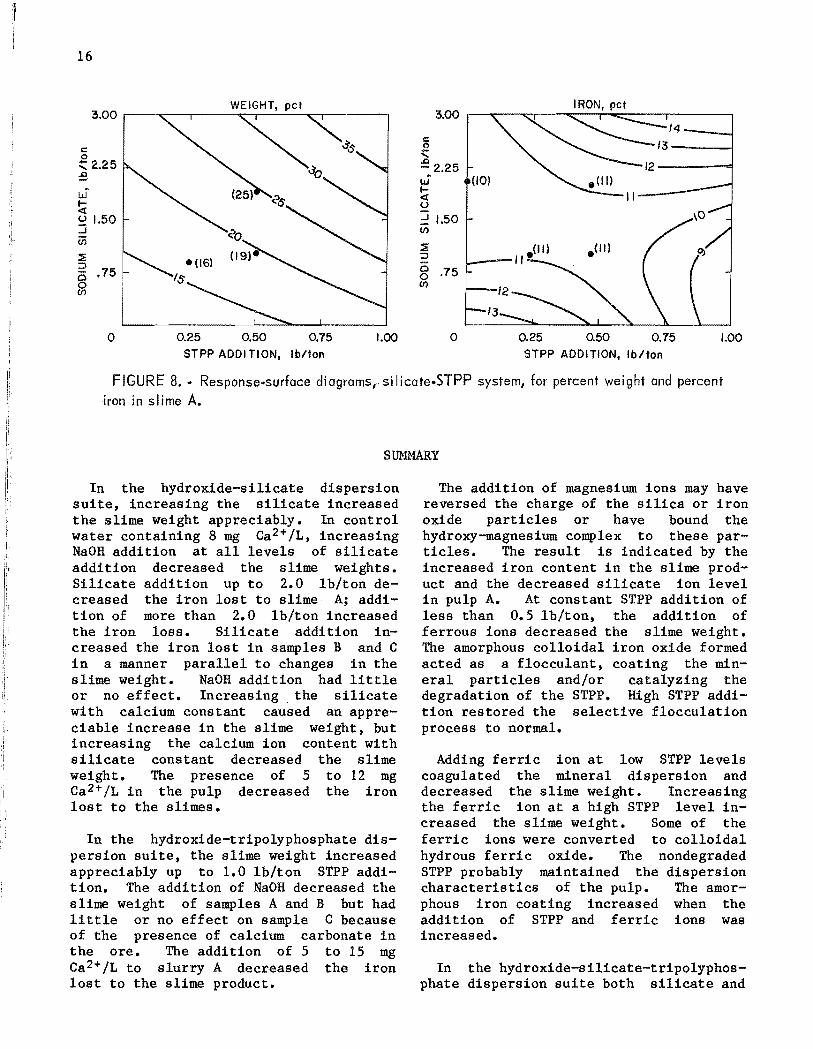
SODIUM SILICATE-TRIPOLYPHOSPHATE DISPERSION SYSTEM
Sodium silicate ranging from 0 to 3.0 lb, STPP -ranging from 0 to 1.0 lb, and NaOH at a constant level of 1.0 Ib per ton of ore A were used. Figure 8 indicates that the slime weight rejection increased with increasing addition of both sodium silicate and STPP reagents. The minimum iron content in the slime was obtained in the range from 2 to 0.8 lb Na2Si03/ton and with STPP increasing from o to lIb/ton. Employing STPP with sodium silicate decreases the iron loss to the slime product.
16
3.00 r----.---,----oc--.__..;.,....:.-~.__--___,
c o :::: 2.25 ~
w ~ ~ 1.50 ....I in :::'i ::::> o .75. g
o
• (16)
IS
0.25 0.50 0.75 STPP ADDI TION, Ib/ton
1.00
3.00 IRON, pet
c 0 ,
.:!! 2.25 t.J (10) l-e:( u ~ 1.50 (f)
:::'i ::::> 0 .75 0 (f)
13
0 0.25 0.50 0.75 1.00 STPP ADDITION, Ib/ton
FIGURE 8 •• Response.surface diagrams, si licate.STPP system, for percent weight and percent
iron in slime A.
SUMMARY
In the hydroxide-silicate dispersion suite, increasing the silicate increased the slime weight appreciably. In control water cont'aining 8 mg Ca 2 + /L, increasing NaOH addition at all levels of silicate addition decreased the slime weights. Silicate addition up to 2.0 lb/ton decreased the iron lost to slime A; addition of more than 2.0 lb/ton increased the iron loss. Silicate addition increased the iron lost in samples Band C in a manner parallel to changes in the slime weight. NaOH addition had little or no effect. Increasing. the silicate with calcium constant caused an appreciable increase in the slime weight, but increasing the calcium ion content with silicate constant decreased the slime weight. The presence of 5 to 12 mg Ca 2+/L in the pulp decreased the iron lost to the slimes.
In the hydroxide-tripolyphosphate dispersion suite, the slime weight increased appreciably up to 1.0 lb/ton STPP addition. The addition of NaOH decreased the slime weight of samples A and B but had little or no effect on sample C because of the presence of calcium carbonate in the ore. The addition of 5 to 15 mg Ca2+/L to slurry A decreased the iron lost to the slime product.
The addition of magnesium ions may have reversed the charge of the silica or iron oxide particles or have bound the hydroxy-magnesium complex to these particles. The result is indicated by the increased iron content in the slime product and the decreased silicate ion level in pulp A. At constant STPP addition of less than 0.5 lb/ton, the addition of ferrous ions decreased the slime weight. The amorphous colloidal iron oxide formed acted as a flocculant, coating the mineral particles and/or catalyzing the degradation of the STPP. High STPP addition restored the selective flocculation process to normal.
Adding ferric ion at low STPP levels coagulated the mineral dispersion and decreased the slime weight. Increasing the ferric ion at a high STPP level increased the slime weight. Some of the ferric ions were converted to colloidal hydrous ferric oxide. The nondegraded STPP probably maintained the dispersion characteristics of the pulp. The amorphous iron coating increased when the addition of STPP and ferric ions was increased.
In the hydroxide-silicate-tripolyphosphate dispersion suite both silicate and
F
STPP contributed to the slime weight rejection. The amount of silicate addition had the most effect on the slime weight. More slime was obtained at minimum STPP adsorption than at maximum adsorption.
The advantage of using STPP was that iron was lost to the slime product. disadvantage is that STPP cost more sodium silicate per unit weight.
17
less The
than
CONCLUSIONS
Application of the selective flocculation method to finely ground ores permits removal of slimes at minimum iron loss. Selective flocculation and desliming levels off the differences in flotation characteristics between ores. Analysis of size-distribution data supports the premise of selective flocculation of iron oxides and also indicates that substantial amounts of near-colloidal-sized iron oxides in some ores contribute to incomplete flocculation and a higher iron content in the slime fraction.
The quality of the feed water has an important impact on the quality of the selective flocculation-desliming process. The presence of excess ionic species (>15 mg/L) such as calcium, magnesium, and ferrous, ferric, and precipitated iron salts will cause undesirable metallurgical results. The presence of magnesium ions may cause reversal of charge that leads to increased iron loss. An index
to acceptable selective flocculationdesliming response based on the Ca 2+ content of the feed water can be established. A level of 1 to 15 mg Ca 2+/L should be maintained for acceptable response, but 5 to 10 mg/L is the best operating range. The Ca 2+ index establishes a common factor that permits the use of different water sources and facilitates the use of reclaimed water. Residual Ca2+ content is also useful in translating bench results to pilot plant operation.
All three iron oxide samples tested-the goethi,te-hematite, hematite, and magnetite-hematite--were amenable to separation by selective flocculationdesliming. The magnetite-hematite mineral sample was least affected by changes in the process, because the magnetite formed magnetic floccules which entrapped the hematite and siliceous gangue.
REFERENCES
1. Balajee, S. R., and I. Iwasaki~ Adsorption Mechanism 6f Starches Flotation and Flocculation of Iron Ores. Trans. AIME, v. 244, 1966, pp. 401-406.
2. Box, G. E. P., and K. B. Wilson. On the Attainment of Optimum Conditions. J. R. Stat. Soc., series B, v. 13, No.1, 1951, pp. 1-34.
3. Davies, O. L. Design and Analysis of Industrial Experiments. Hafner, 1960, pp. 495-551.
4. Frommer, D. W. USBM-CCI Cooperative Research on Flotation of Nonmagnetic Taconites of Marquette Range. Blast Furnace and Steel Plant, v. 57, No.5, 1969, pp. 380-388.
5. USBM Tests on Iron Ore Flotation Point Way Recoveries. Min. Eng., v. 1964, pp. 67-71, 80.
Selective to Greater
16, No.4,
6. Frommer, D. W., and A. F. Colombo. Process for Improved Flotation of Iron Ores by Selective Flocculation. U.S. Pat, 3,292,780, Dec. 20, 1966.
7. Fuerstenau, D. W., A. M. Gaudin, and H. L. Miaw. Iron Oxide Slime Coatings in Flotation. Trans. AIME, v. 211, 1958, pp. 792-796.
8. Gaudin, A. M. Flotation. McGraw-Hill, 1957, p. 143.
~U,5, GPO: 1984-705-02015013
/,
18
9. Haseman, J. F. Selective Flocculation of Colloidal Phosphate Ore in the Presence of Clay. U. S. Pat. 2,660,303, Nov. 1953.
10. Iler, R. K. The Colloid Chemistry of Silica and Silicates, Cornell Univ. Press, 1955, pp. 18-19, 181-184.
11. Iwasaki, I., S. R. B. Cooke, D. H. Harraway, and H. S. Choi. Iron Wash Ore Slimes--Some Mineralogical and Flotation Characteristics. Trans. SME, v. 223, March 1962, pp. 97-l08.
12. Iwasaki, I., and P. L. deBruyn. The Electrochemical Double Layer on Silver Sulfide pH 4.7 in the Presence of Dodecylammonium Acetate. J. Surface Sci., v. 3, No.4, 1965, pp. 299-313.
13. James, R.O., and T. W. Healy. Adsorption of Hydrolyzable Metal Ions at the Oxide-Water Interface (I). J. Colloid Interface Sci., v. 40, July 1972, pp. 42, li3.
14. Klassen, V. I., and V. A. Mokrousov. An Introduction to the Theory of Flotation. Butterworths, 1964, p. 328.
15. Martell, A. E., and M. Calvin. Ii: Chemistry of Metal Chelate Compounds. 1:1 Prentice-Hall, 1962, pp. 490-493. :,1
16. Matijevc, E., M. B. Abramson, R. H. Ottewill, K. F. Schulz, and M. Kerker. Adsorption of Thorium Ions on Silver Iodide Sols. J. Phys. Chem., v. 65, 1961, pp. 1724-1729.
17. Matijevc, E., M. B. Abramson, K. F. Schulz, and M. Kerker. Detection of Metal For Hydrolysis by Coagulation: II. Thorium. J. Phys, Chem. v. 64, 1960, pp. 1157-1161.
18. Stumm, W. , Aquatic Chemistry. 1970, pp. 523-525.
and J. J. Morgan. Wiley Interscience,
19. Taras, M. J. Standard Methods for Examination of Water and Wastewater. Am. Public Health Assoc., Washington, DC, 13th ed., Jan. 1974, pp. 84-86, 303-306, 334-335, 530-532.
20. Van Wazer, J. R.Phosphorus and Its Compounds. Vol. 1. Chemistry. Interscience, 1966, pp. 657-659.
21. Villar, Tilden Mine--A for Iron Ore. pp. 40-48.
J. W., and G. A. Dawne. New Processing Technique Min. Congo J., Oct. 1975,
~-.. ~ .. ~ .. -~-~----.---
f
19
APPENDIX.--RESPONSE-SURFACE COEFFICIENTS AND STATISTICAL DATA
Figure Coefficients RR, J 95-pet No. Content BO B1 B2 B3 B4 B5 pet confidence
leve12
1 •• Wt pet, A ••• " •• 7.600 7.768 4.666 -3.111 0.093 -0.583 95.5 2.7 1 •• Wt pet, B •••••• 16.544 -3.518 7.257 .447 .147 .103 97.0 1.7 1 •• Wt pet, c •••••• 6.381 -2.727 9.164 .632 -.852 -1.393 86.6 4.5 2 •• Fe pet, A •••••• 13.031 1.216 -3.847 .322 .981 -.500 85.1 1.4 2 •• Fe pet, B •••••• 2.545 .547 .997 -.028 1.322 -.582 98.3 ~ 2.1 2 •• Fe pet, c •••••• 4.637 -3.925 .066 1.221 .289 -.322 96.4 .7 3 •• pH profile, A •• 8.160 2.765 .174 -.625 .006 -.129 97.7 .3 3 •• Sol. silica, A. 2.805 12.665 2.173 -1.070 1.986 4.718 97.9 7.1 4 •• Wt pet, A •••••• 19.053 -.682 1.732 -.008 -.188 .344 93.7 2.7 4 •• Fe pet, A •••••• 11.107 .265 -2.149 .003 .696 -.095 75.5 1.7 4 •• Wt pet, B •••••• 32.193 -1.670 -1.322 .004 1.550 .308 98.4 2.5 4 •• Fe pet, B •••••• 11.987 -.694 -3.948 .034 2.842 -.292 76.0 1.6 4 •• Wt pet, c •••••• -4.911 1.082 10.510 -.038 -1.209 -.102 97.5 2.4 4 •• Fe pet, C •••••• 3.684 .309 -1.994 -.003 .524 -.073 84.0 1.9 5 •• Wt pet, A •••••• 24.168 -16.600 19.158 2.193 -11.281 8.768 90.7 3.8 5 •• Fe pet, A •••••• 9.254 -2.849 17.653 2.223 -9.407 -7.219 71.4 2.2 5 •• pH profile, A •• 8.445 2.418 .478 -.502 -.251 -.151 97.3 .13 5 •• Sol. silica, A. -38.063 71.184 -2.515 -20.172 -10.869 9.297 94.0 3.5 6 •• Wt pet, A + Ca. 14.696 .200 14.778 -.007 -8.657 .090 84.1 2.1 6 •• Fe pet, A + Ca. 10.534 .414 -8.249 .009 14.377 -.928 67.0 2.6 6 •• Wt pet, A + Mg. -3.290 .686 91.497 -.066 -90.985 1.022 83.0 2.9 6 •• Fe pet, A + Mg. -2.430 1.185 52.224 -.054 -53.973 -.224 66.4 2.3 7 •• Wt pet, A + Fe2 24.506 -.806 -14.093 .026 12.675 .674 90.8 1.8 7 •• Fe pet, A + Fe3 15.713 -.300 -21.339 .014 21.192 .268 90.8 1.6 7 •• Wt pet, A + Fe3 19.473 -.302 4.175 .004 -5.946 .627 90.8 1.6 7 •• Fe pet, A + Fe3 12.040 -.059 -1.425 .009 -1.807 .029 96.2 1.0 8 •• Wt pet, A •••••• 11.278 3.422 3.389 3.754 .159 3.874 97.0 1.5 8 •• Fe pet, A •••• /I • 13.844 -2.083 -4.118 -3.872 .975 3.689 96.3 .4 I Sum of the squares due to regression divided by sum of the squares about the mean. 2Based on 7 degrees of freedom.
INT.-BU;OF MINES,PGH.,PA. 27412