Embed Size (px)
Citation preview
Digest 2008, December 2008 1231-1250
Selection and Scaling of Real Earthquake Accelerograms to Fit the Turkish Design Spectra†1
Yasin M. FAHJAN*
ABSTRACT
Due to rapid developments in structural analysis and computational facilities, nonlinear time-history analysis is becoming more common in seismic analysis and design of structures. One of the crucial issues of such analysis is the selection of acceleration time histories to satisfy design code requirements and soil type at a specific site. In literature, there are three sources of acceleration time histories: artificial records compatible with design response spectrum, synthetic records obtained from seismological models and accelerograms recorded during real earthquakes. Due to the increase of available strong ground motion database, using and scaling real recorded accelerograms is becoming one of the latest contemporary research issues in this field. In this study, basic methodologies and criteria for selecting strong ground motion time histories are discussed and summarized. The time domain scaling procedure is utilized to scale the available real records to match the proposed elastic design spectrum given in the Turkish Seismic Code (DBYBHY, 2007) for different seismic regions and local site classes. The best fitted ground motion time histories are selected and classified taken into account the earthquake magnitude, focal mechanism and site conditions. Keywords: Strong motion records, time domain scaling, spectrum-compatible records
1. INTRODUCTION
Seismic design codes generally define ground shaking in the form of a response spectrum of acceleration and permit to use spectrally matched natural accelerograms recorded during earthquakes, artificial records compatible with design spectrum, for example SMSIM developed by Boore [2], and synthetic ground motions obtained from seismological models for the linear or nonlinear analysis of structures. Due to the increase of available strong ground motion databases, using and scaling real recorded accelerograms is becoming one of contemporary research issues in this field. Spectral matching using real accelerograms may be performed in either the time domain or the frequency domain in three ways: the spectral acceleration values of the selected time history are simply scaled up or down uniformly; an actual motion is filtered in frequency domain by its spectral ratio with the design target spectrum; elementary wavelets are added or subtracted from the real time history to match a target design spectrum, for example, RSPMATCH developed by Abrahamson [3]. The spectral matching of the real accelerograms can be achieved or enhanced by scaling in the time axis of the records [4]. * Gebze Institute of Technology, Kocaeli, Turkey - [email protected] † Published in Teknik Dergi Vol. 19, No. 3 July 2008, pp: 4423-4444
Selection and Scaling of Real Earthquake Accelerograms to Fit …
1232
The selection criteria of proper time history records to fit the design code spectrum are also taking into account the geological and seismological conditions at a specific site. The seismological and geological parameters can be classified in terms of magnitude, faulting type, distance to fault, rupture directivity, site condition and spectral content.
In this study, all the existing methodologies and criteria for selection of strong ground motion time histories are discussed and summarized. For each seismic zone and site class defined in The Turkish Seismic Code DBYBHY (2007) [1], the ground motion time histories are selected and classified based on earthquake magnitude, focal mechanism, source-to-site distance, and site classification. Response spectra of linear elastic single degree of freedom system have been computed for all the selected records with 5% damping. The output spectra are scaled to match the target design code spectrum for specific seismic region and soil type and the best fitted ten records are obtained.
2. SOURCE OF ACCELEROGRAMS
There are three sources of acceleration time histories: artificial records compatible with design response spectrum, synthetic records obtained from seismological models and accelerograms recorded in real earthquakes.
2.1. Artificial Accelerograms
Artificial accelerograms are generated to match a target response spectrum by obtaining a power spectral density function from the smoothed response spectrum, and then to derive sinusoidal signals having random phase angles and amplitudes. The sinusoidal motions are then summed and an iterative procedure can be invoked to improve the match with the target response spectrum, by calculating the ratio between the target and actual response ordinates at selected frequencies. In order to get other characteristics of artificial spectrum-compatible record, such as duration, it is necessary to obtain supplementary information about the expected earthquake motion apart from the response spectrum. Even though, it is possible to obtain acceleration time-series that are almost completely compatible with the elastic design spectrum, the generated accelerograms often have an excessive number of cycles of strong motion, and consequently have unrealistically high energy content. The difficulty of the artificial time history generation methods lies in trying to match a single ground motion to a design response spectrum that is not intended to represent the motion from an individual earthquake [5]. The design response spectrum is generally a result of a statistical analysis that considers the influence of several seismic sources simultaneously, whence the response at different periods may be driven by earthquakes in different sources and the spectrum is the envelope of spectra corresponding to scenarios in each of the sources [6, 7].
2.2. Synthetic Accelerograms
Synthetic accelerograms can be generated from seismological source models and accounting for path and site effects. In general, there are actual difficulties in defining appropriate input parameters such as the source, path, and site characteristics. To generate
Yasin M. FAHJAN
1233
synthetic accelerograms there is a need for a definition of a specific earthquake scenario in terms of magnitude, rupture mechanism in addition to geological conditions and location of the site. Generally, most of these parameters are not often available, particularly when using seismic design codes [8].
2.3. Real Accelerograms
Real Strong ground motion accelerograms contain a wealth of information about the nature of the ground shaking and carry all the ground-motion characteristics (amplitude, frequency, and energy content, duration and phase characteristics), and reflect all the factors that influence accelerograms (characteristics of the source, path, and site). Due to the increase of available strong ground motion records, using and scaling real recorded accelerograms become one of most referenced contemporary research issues in this field. Despite the continued growth of the global strong -motion databank, there are many combinations of earthquake parameters such as magnitude, rupture mechanism, source-to-site distance and site classification that are not well represented, which can make obtaining suitable records difficult in some circumstances [8].
3. SELECTION OF TIME HISTORY RECORDS
Real earthquake records are selected to match specific features of the ground motion, generally based on either elastic response spectrum, or an earthquake scenario with the minimum parameters being the magnitude, distance and site classification. Guidance given in seismic design codes on how to select appropriate real records is usually focused on compatibility with the response spectrum rather than seismological parameters. Therefore, records are selected on the basis of strong-motion parameters such as peak ground acceleration, peak ground velocity, and duration to match a design response spectrum.
The ground motion time histories used to represent an intensity measure corresponding to a particular hazard level (or return period) should reflect the magnitude, distance, site condition, and other parameters that control the ground motion characteristics. Selection of records having appropriate magnitudes is important because magnitude strongly influences frequency content and duration of ground motion. It is desirable to use earthquake magnitudes within ± 0.25 magnitude units of the target magnitude [9]. Selection of records having appropriate fault-site distances is important especially for near-fault sites, because the characteristics of near-fault ground motions differ from those of other ground motions. Site conditions have a major effect on the characteristics and frequency content of the strong ground motion records. Even though the ground motions are amplified in soft soils, the high frequency motions are attenuated. Generally, the ground motions amplification effects can be observed in spectral acceleration of the records at intermediate to long period.
4. METHODS OF GROUND MOTION SCALING
There are two methods for modifying actual time histories to match a given design spectrum: ground motion simulation in time domain and frequency domain.
Selection and Scaling of Real Earthquake Accelerograms to Fit …
1234
4.1. Ground Motion Scaling in Time Domain
In this approach, recorded motion is simply scaled up or down uniformly to best match the target spectrum within a period range of interest, without changing the frequency content. When dealing with more than one input time history, one can either use the same procedure to fit each record separately, or try to best-fit the average of the produced spectra to the target spectrum.
4.2. General Procedure for a Single Time History
The procedure is based on minimizing the differences between the scaled motion’s response spectrum and target spectrum in a least-square sense. The methodology proposed herein considers as the squared scaled-to-target “Difference”, evaluated by the integral,
[ ] dTTSTSDifferenceF
S
T
T
targeta
actuala
2
)()(∫ −= α
(1)
where
Satarget target acceleration response spectrum,
Saactual acceleration spectrum of the given (actual) time history,
α scaling factor, T period of oscillator, TS lower period of scaling, and TF upper period of scaling
In order to minimize the difference, the first derivative of the “Difference” function with respect to the scaling factor has to be zero:
0=⇒αd
DifferencedDifferencenmi
(2)
By combining Equations 1 and 2, we get Equation 3 in a discrete form in terms of initial (TS) and final (TF) periods and step increment (∆T) of the response spectra range:
2)(
)(
∑
∑
=
=
−=
B
A
B
A
T
TT
actuala
T
TT
gettara
actuala
S
SSα (3)
Yasin M. FAHJAN
1235
4.3. General Procedure for Multiple Time History
When dealing with more than one input time history, one can either use the same procedure to fit each record separately, or try to best-fit the average of the produced motions to the target spectrum. Multiple time history problems can be solved in three distinct ways:
(a) The average of the (N) time histories is fitted to the target using a single scaling factor for all time histories. In this case, the matching of the produced average spectrum to the target one is quite good, since all time histories are amplified by the same factor.
(b) The single time history procedure is used for each one of the (N) time histories individually. Although each motion is “best-scaled”, the resulting average does not perfectly match the target spectrum.
(c) The (N) input motions are fitted using different scaling factors for each time history. In this method, a set of scaling factors are found such that the average spectrum of the scaled motions best fits the target. It should be noted that when using this method, even though an optimal average spectrum can be achieved, the outcome scaling factors for the different input time history may be very large or very small even negative values can be achieved.
4.4. Ground Motion Scaling in Frequency Domain
This method is based on the concept of using actual records to generate time histories that fit a given target response spectrum. The physical characteristics of the earthquake motion are retained throughout the procedure, which makes the technique powerful in comparison with the classical artificial record generation [10]. In this method, an actual motion is filtered in the frequency domain by its spectral ratio with the design target spectrum. The Fourier phases of the motions remain unchanged during the entire procedure. The technique is repeated iteratively until the desired matching is achieved for a certain range of periods. A frequency domain scaling methodology uses an actual record to produce a similar motion that matches almost perfectly a target (design) spectrum. The resulting time histories should be investigated in terms of suitability as input for linear and nonlinear time history analyses of engineering structures. For example, in real earthquake records, average of the ductility factor is expected to be equal to structural behavior factor at longer periods (equal displacement rule) especially for velocity and displacement sensitive spectral regions [11].
5. SCALING OF REAL ACCELEROGRAMS TO FIT THE TURKISH DESIGN SPECTRA (DBYBHY, 2007)
5.1. DBYBHY (2007) Design Spectrum
The design earthquake considered in the Turkish specification [1] corresponds to high intensity earthquake for residential buildings where the probability of exceedance of the design earthquake within a period of 50 years is 10 %. Seismic zones cited in the specification are considered as first, second, third and fourth seismic zones depicted in the Seismic Zoning Map of Turkey prepared by the Ministry of Public Works and Settlement
Selection and Scaling of Real Earthquake Accelerograms to Fit …
1236
and issued by the decree of the Council of Ministers [12]. The spectral acceleration Coefficient, A(T), to be considered for determining seismic loads is given by Equation 4. The elastic spectral acceleration, Sae(T), which is defined as the ordinate of 5% damped elastic design acceleration spectrum, is equal to spectral acceleration coefficient times the acceleration of gravity, g.
gTSTSTSIATA
ae
o)()(
)()(=
= (4)
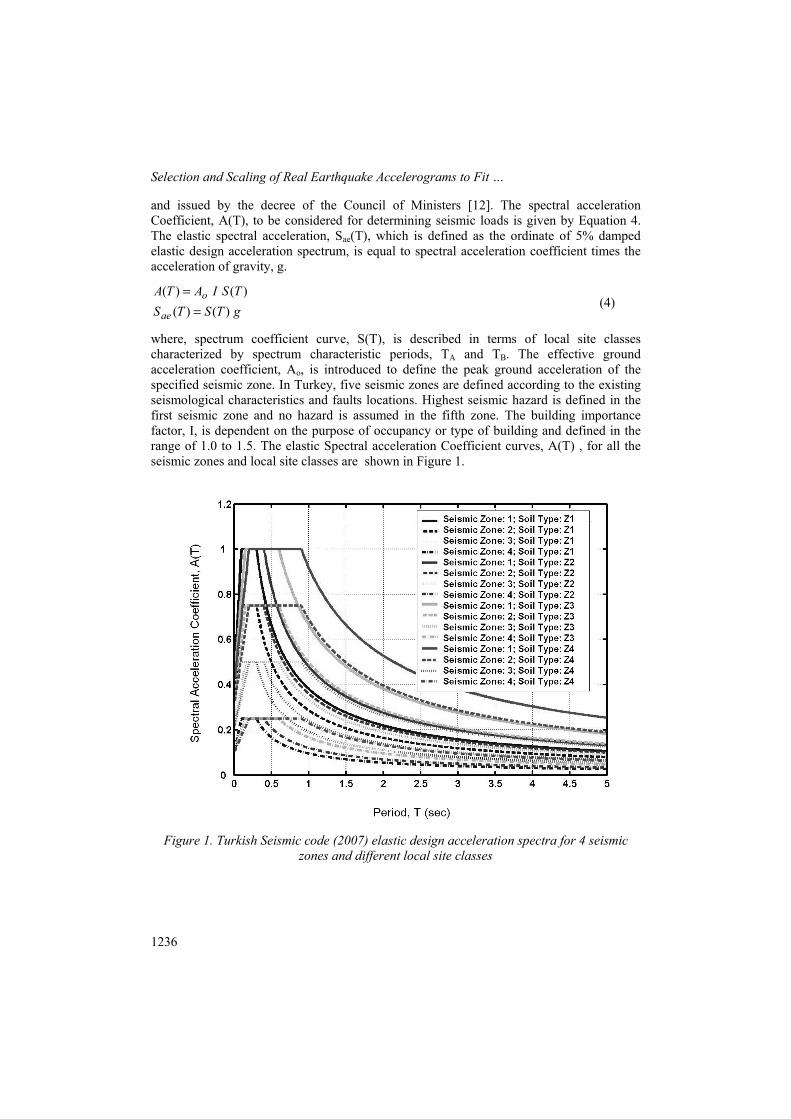
where, spectrum coefficient curve, S(T), is described in terms of local site classes characterized by spectrum characteristic periods, TA and TB. The effective ground acceleration coefficient, Ao, is introduced to define the peak ground acceleration of the specified seismic zone. In Turkey, five seismic zones are defined according to the existing seismological characteristics and faults locations. Highest seismic hazard is defined in the first seismic zone and no hazard is assumed in the fifth zone. The building importance factor, I, is dependent on the purpose of occupancy or type of building and defined in the range of 1.0 to 1.5. The elastic Spectral acceleration Coefficient curves, A(T) , for all the seismic zones and local site classes are shown in Figure 1.
Figure 1. Turkish Seismic code (2007) elastic design acceleration spectra for 4 seismic
zones and different local site classes
Yasin M. FAHJAN
1237
5.2. Scaling Factor for Elastic Spectral Acceleration Coefficient, A(T)
In this study, the time domain scaling procedure is utilized to scale the available real records to match the spectral acceleration coefficient curves, A(T), for all the combinations of seismic zones and local site classes given in DBYBHY(2007). In Equation 4, it can be noticed that the spectral acceleration coefficient curves, A(T), have the same shape as the spectrum coefficient curve, S(T), multiplied by a constant factor representing effective ground acceleration, Ao, and building importance factor, I. This important feature allows the matching procedure to be carried out for the spectrum coefficient, S(T) to obtain the scaling factors, αST, for each of the local site classes (Z1, Z2, Z3, Z4). The scaling factors, αAT, for acceleration coefficient, A(T), can be obtain by multiplying the scaling factors , αST, of the corresponding spectrum coefficient, S(T), by the effective ground acceleration, Ao, and building importance factor, I:
SToAT IA αα = (5)
5.3. Limits of Scaling Factors
In the literature it is proposed that scaling on amplitude should not exceed certain limits depending on the type of problem to which the resulting motion will be applied. For analysis of linear elastic structures an upper limit of 4 could be accepted [13, 14], for nonlinear analyses, scaling factors (α AT) in the range of 0.5 to 2.0 are advised. For liquefaction problems a scaling factor (α AT) no greater than 2 should be used.
5.4. DBYBHY (2007) Criteria for Ground Motions Selection
Turkish seismic code (DBYBHY, 2007) allow the use of artificially generated, previously recorded or simulated accelerograms as input ground motions for linear and nonlinear seismic analyses. The following criteria and specifications should be considered:
• The duration of the strong motion part shall neither be shorter than 5 times the fundamental period of the building nor 15 seconds.
• Mean spectral acceleration of generated ground motions for zero periods shall not be less than Ao g and the mean spectral accelerations of artificially generated acceleration records for 5% damping ratio shall not be less than 90% of the elastic spectral accelerations, Sae(T), in the period range between 0.2T1 and 2T1 with respect to dominant natural period, T1 , of the building in the earthquake direction considered.
• The local site conditions should be considered in recorded earthquakes or physically simulated ground motions.
• At least three ground motions shall be used where the maximum of the results, and if at least seven ground motions are used the mean values of the results shall be considered for design.
Selection and Scaling of Real Earthquake Accelerograms to Fit …
1238
5.5. Real Earthquake Records Database
The Pacific Earthquake Engineering Research (PEER) Center, NGA strong motion data base (PEER, 2005, http://peer.berkeley.edu/smcat) [15] is used for this study. In all, 4062 records from 92 shallow crustal earthquakes in active tectonic regions around the world are used.
5.6. Methodology for Selecting and Scaling the Real Time Histories
The time domain scaling for a single record procedure is utilized for selecting the best matched real records to the target spectrum defined for a known local site class. The methodology can be summarized in the following steps:
1. A list of time series records are prepared from PEER database simply based on magnitude, fault type and site condition.
2. The acceleration response spectra for both of the horizontal components of the records are computed using MatLab Code for the solution of linear elastic single degree of freedom system of 5% damping ratio using the piecewise exact method [16].
3. Scaling procedure is used to match each horizontal component of the records to the specified code spectrum for period range (TA=0.01 sec – TB=5 sec). The scaling factors, α ST, defined in Equation 3 are calculated for both horizontal components.
4. Only one horizontal component for each record, the one which best matches the target spectrum is selected.
5. The records with a duration less than proposed by (DBYBHY, 2007) and those with scale factors, α ST, less than 1/20 or greater than 20 are eliminated.
6. The absolute summation of relative error for each record is computed for the period range (TS=0.01 sec – TF=5 sec) as
[ ]∑ −=F
S
T
T
targeta
targeta
actuala TSTSTS Errors Relative Sum )(/))()((α (6)
The percentage of average relative error is also calculated as follows
1001(%) ×= Errors Relative Sumk
Error Relative Average (7)
where;
k is the number of period steps (∆T) defined in the period range for the spectra
k = ( TF - TS ) / ∆T (8)
7. The first fifty (50) record components which have minimum average relative error values are selected. The best matched ten (10) with the target spectrum are chosen for use in the analysis.
Yasin M. FAHJAN
1239
5.7. Effective Duration of the Time History Records
Strong ground motion duration is an important parameter to measure the potential destructiveness of an earthquake and generally dependent on fault parameters, path from source to station, local site effects and directivity. Many definitions were used to identify the duration of strong ground motion as uniform, significant and bracketed duration [17]. The “bracketed duration” is the interval between two points in time where the acceleration amplitude first and last exceed a prescribed level generally as 0.05 g [18]. The ARIAS Intensity is a measure of the total energy content of seismic excitation, and is defined by the following relation [19]
tdtag
IAT
∫=0
2 )(2π
(9)
where, a(t) is the ground acceleration amplitude at time t and T is the earthquake total duration. “Husid Diagram” is the time history of the seismic energy content defined in Equation 9 scaled to the total energy content [20]. “Significant duration” defines as the time elapsed between 5% and 95% of the HUSID diagram [20].
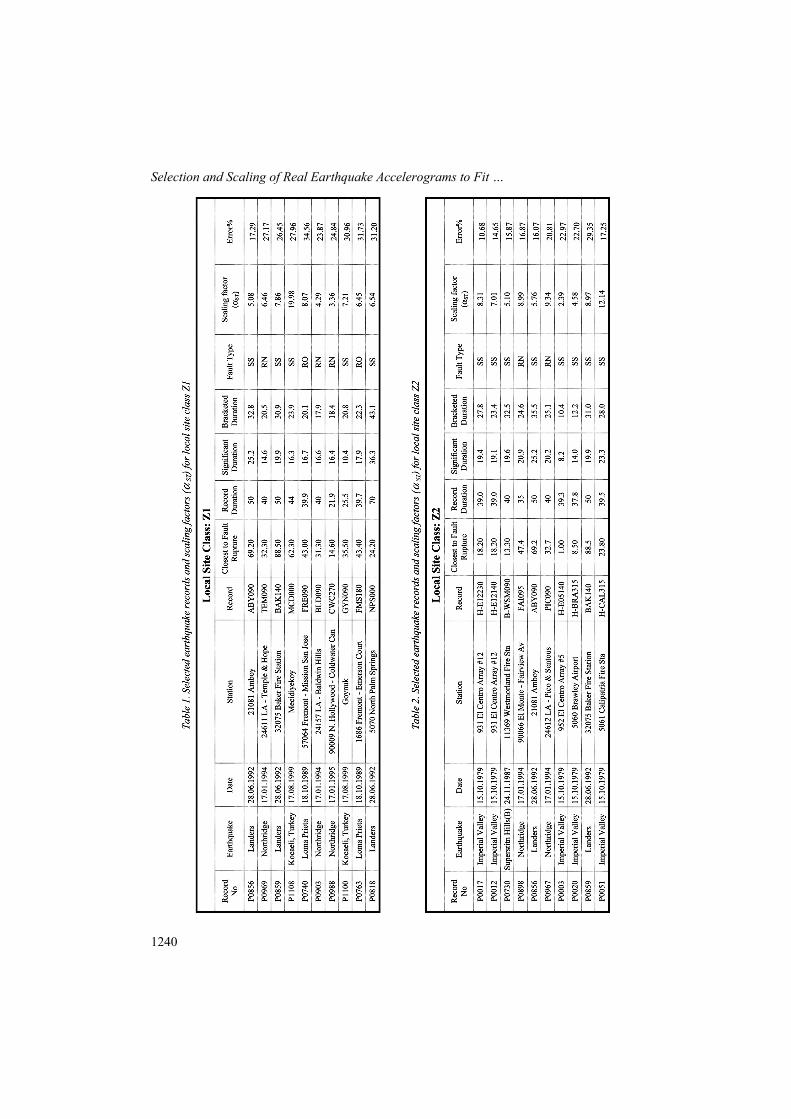
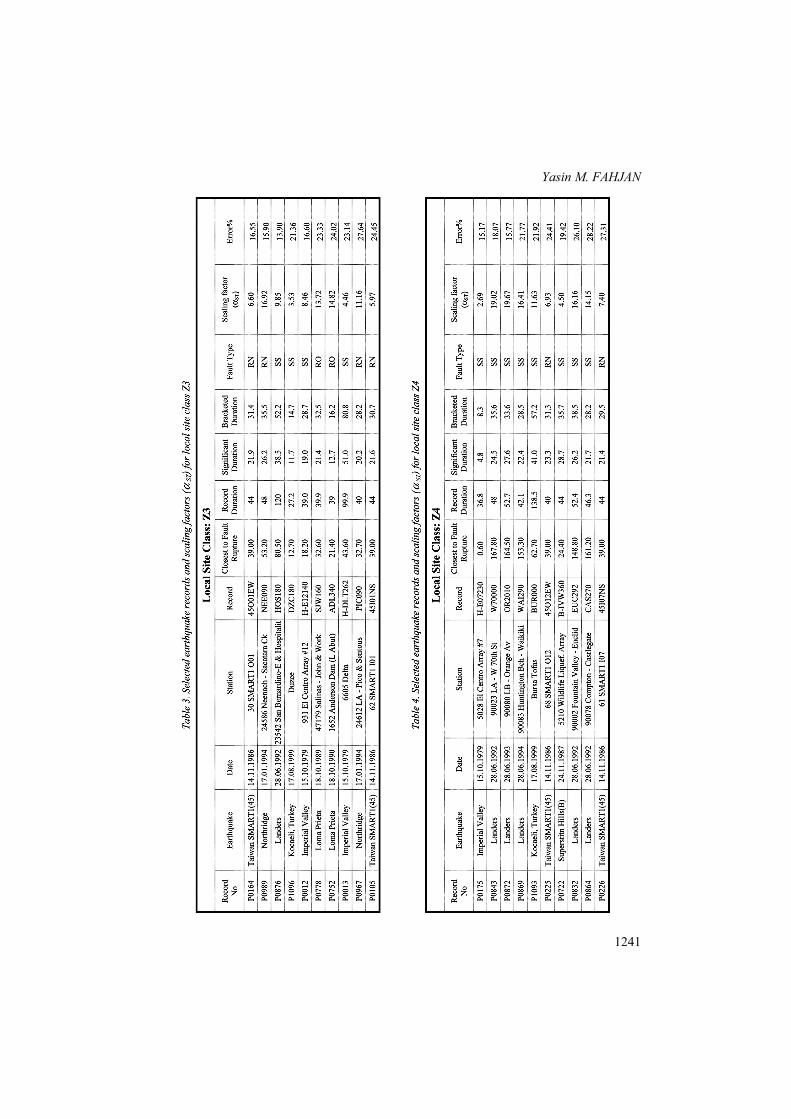
In this study, to consider the limitations defined in the Turkish seismic code (DBYBHY, 2007) for the minimum earthquake record duration, the bracketed and significant durations for the selected records are computed and tabulated in Tables 1, 2, 3, 4. In the computations of bracketed duration, the scaled record is used such that a 2nd seismic zone and a unity building importance factor are considered
5.8. Discussion of the Results
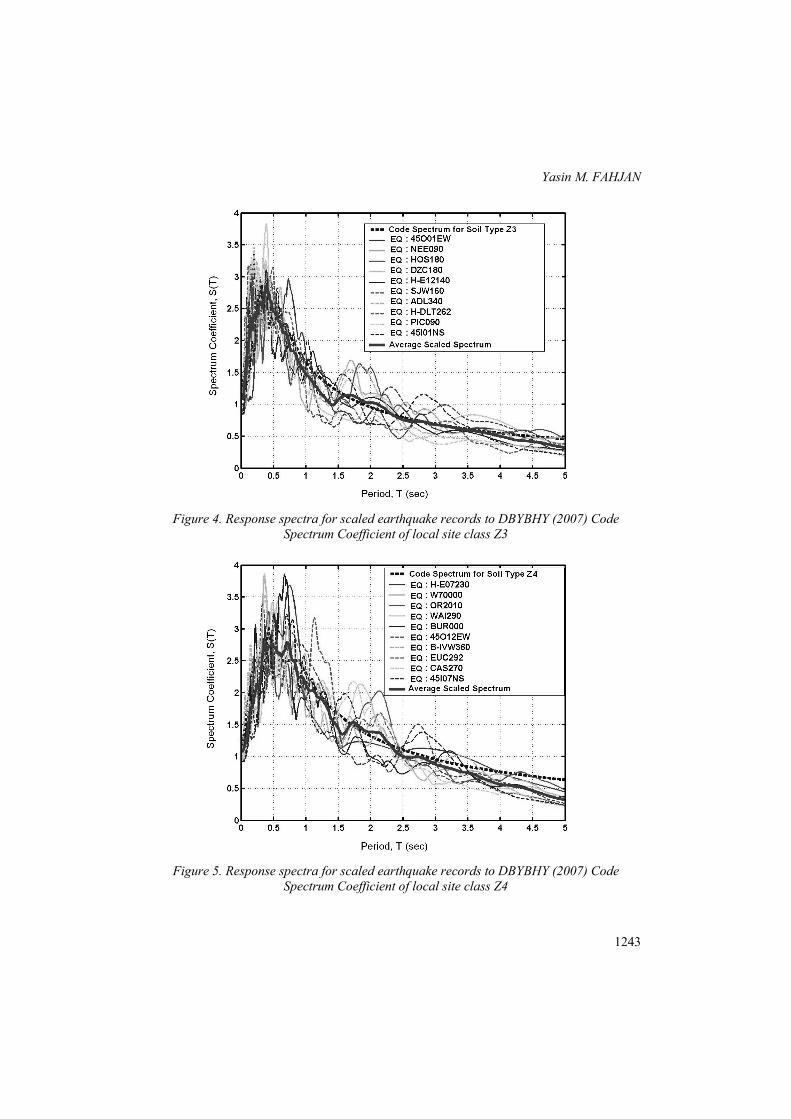
The methodology for selecting and scaling the real time histories is applied to find the best matched ten (10) real earthquake records with the spectrum coefficients, S(T), spectra within the period range (TA=0.01 sec – TB=5 sec) for the four local site classes specified in the Turkish Seismic Code (DBYBHY, 2007). The selected records’ acceleration response spectra for local site classes Z1, Z2, Z3 and Z4 are plotted and compared with the code spectrum coefficients spectra in Figures 2, 3, 4 and 5 respectively. The lists of the selected records with seismological and duration parameters and the scaling factors, α ST, are provided for local site classes Z1, Z2, Z3 and Z4 in Tables 1, 2, 3 and 4 respectively.
It should be mentioned that the scaling factors provided in Tables 1, 2, 3 and 4 are computed for spectrum coefficient, S(T), therefore for engineering analyses the scaling factor, α AT, for spectral acceleration coefficient, A(T) and given in Equation 5 in terms of α ST, building importance factor I and effective ground acceleration coefficient, Ao, should be used. In selection process, accelerograms with different “fault to rupture distance” are chosen to account for the different characteristics of near field and far field earthquakes.
Selection and Scaling of Real Earthquake Accelerograms to Fit …
1240
Yasin M. FAHJAN
1241

Selection and Scaling of Real Earthquake Accelerograms to Fit …
1242
Figure 2. Response spectra for scaled earthquake records to DBYBHY (2007) Code
Spectrum Coefficient of local site class Z1
Figure 3. Response spectra for scaled earthquake records to DBYBHY (2007) Code
Spectrum Coefficient of local site class Z2
Yasin M. FAHJAN
1243
Figure 4. Response spectra for scaled earthquake records to DBYBHY (2007) Code
Spectrum Coefficient of local site class Z3
Figure 5. Response spectra for scaled earthquake records to DBYBHY (2007) Code
Spectrum Coefficient of local site class Z4

Selection and Scaling of Real Earthquake Accelerograms to Fit …
1244
5.9. Scaling Factor for Reduced acceleration Spectrum
For the linear time history analyses defined in the Turkish Seismic Code (DBYBHY, 2007), the reduced acceleration spectra are required to be used. The scaling factors, α AT, defined in Equation 5 for elastic Spectral acceleration coefficient A(T) should be divided by the Structural behavior factor ( R) as follows:
RαIA
α ST0AT = (10)
6. APPLICATION EXAMPLES
In this section, the scaling methodology of real earthquake time history records at specific site classes are explained with two examples. Turkish design spectrum (DBYBHY, 2007) is used as the target spectrum. The earthquake records and corresponding scaling factors listed in Tables 1, 2, 3 and 4 are utilized.
6.1. Example 1
In this example, a time history record for the analysis of a structure located at the 2nd seismic zone (Ao = 0.3) and local site class Z1 with the building importance factor, I, (1.0) is obtained using time domain scaling method given in Section 4.1. For this purpose, (ABY090) component of the record number P0856 that was recorded during Landers earthquake in 28 June 1992 is used from the list given in Table 1. The scaling factor, α ST, of this record to fit the (DBYBHY, 2007) spectrum coefficient, S(T) is given as 5.08 in this table. The scaling factor for spectral acceleration, A(T), is computed using Equation 5 as,
5241085130 ...IA SToAT =××=α=α (11)
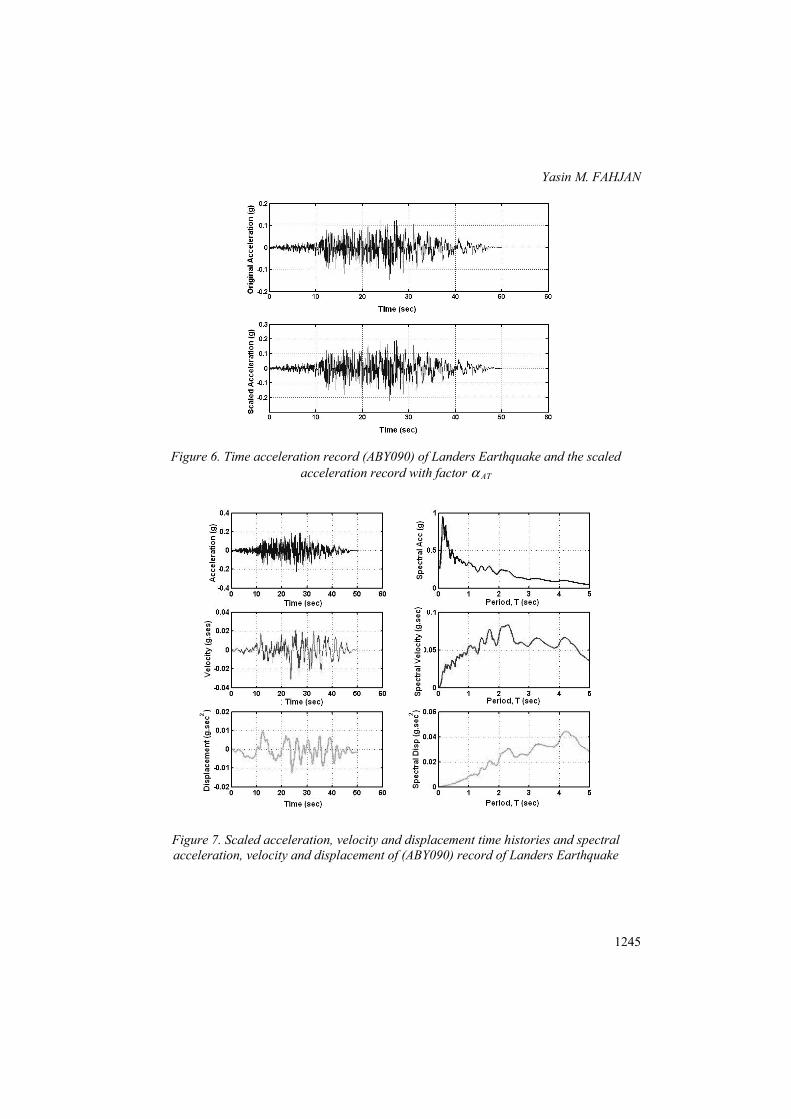
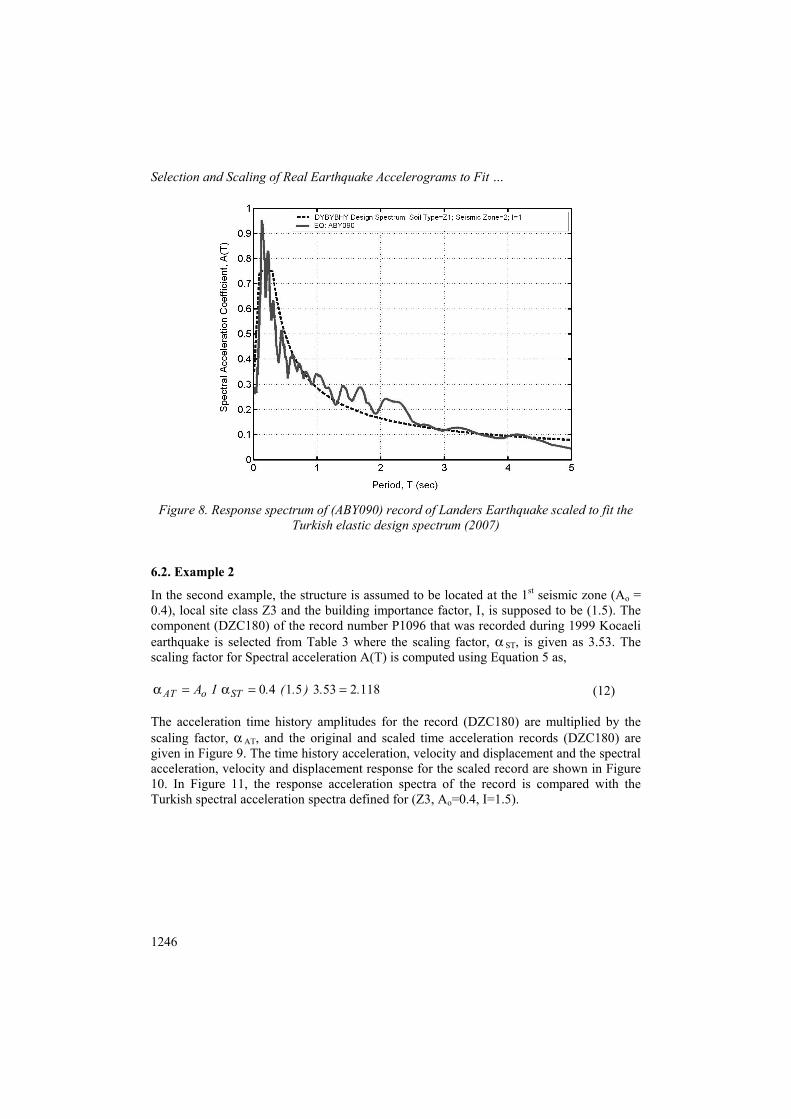
The acceleration time history amplitudes for the record (ABY090) are multiplied by the scaling factor, α AT, to obtain the input motion that will be used in the structural analysis. The original and scaled time acceleration records (ABY090) of Landers Earthquake are shown in Figure 6. The time history acceleration, velocity and displacement for the scaled record together with the response acceleration, velocity and displacement spectra are plotted in Figure 7. In Figure 8, the response acceleration spectrum of the records is well matched with the spectral acceleration spectra defined by the Turkish seismic Code (DBYBHY, 2007) for (Z1, Ao=0.3, I=1.0).
Yasin M. FAHJAN
1245
Figure 6. Time acceleration record (ABY090) of Landers Earthquake and the scaled
acceleration record with factor α AT
Figure 7. Scaled acceleration, velocity and displacement time histories and spectral acceleration, velocity and displacement of (ABY090) record of Landers Earthquake
Selection and Scaling of Real Earthquake Accelerograms to Fit …
1246
Figure 8. Response spectrum of (ABY090) record of Landers Earthquake scaled to fit the
Turkish elastic design spectrum (2007)
6.2. Example 2
In the second example, the structure is assumed to be located at the 1st seismic zone (Ao = 0.4), local site class Z3 and the building importance factor, I, is supposed to be (1.5). The component (DZC180) of the record number P1096 that was recorded during 1999 Kocaeli earthquake is selected from Table 3 where the scaling factor, α ST, is given as 3.53. The scaling factor for Spectral acceleration A(T) is computed using Equation 5 as,
11825335140 ..).(.IA SToAT ==α=α (12)
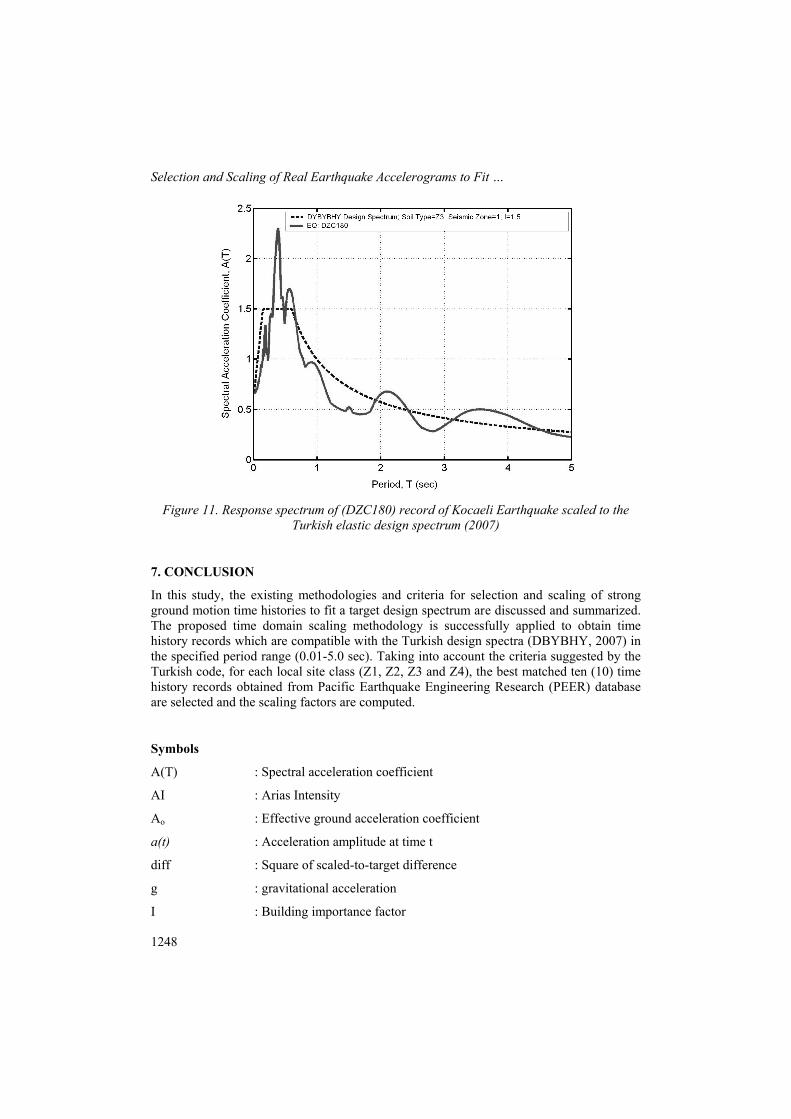
The acceleration time history amplitudes for the record (DZC180) are multiplied by the scaling factor, α AT, and the original and scaled time acceleration records (DZC180) are given in Figure 9. The time history acceleration, velocity and displacement and the spectral acceleration, velocity and displacement response for the scaled record are shown in Figure 10. In Figure 11, the response acceleration spectra of the record is compared with the Turkish spectral acceleration spectra defined for (Z3, Ao=0.4, I=1.5).
Yasin M. FAHJAN
1247
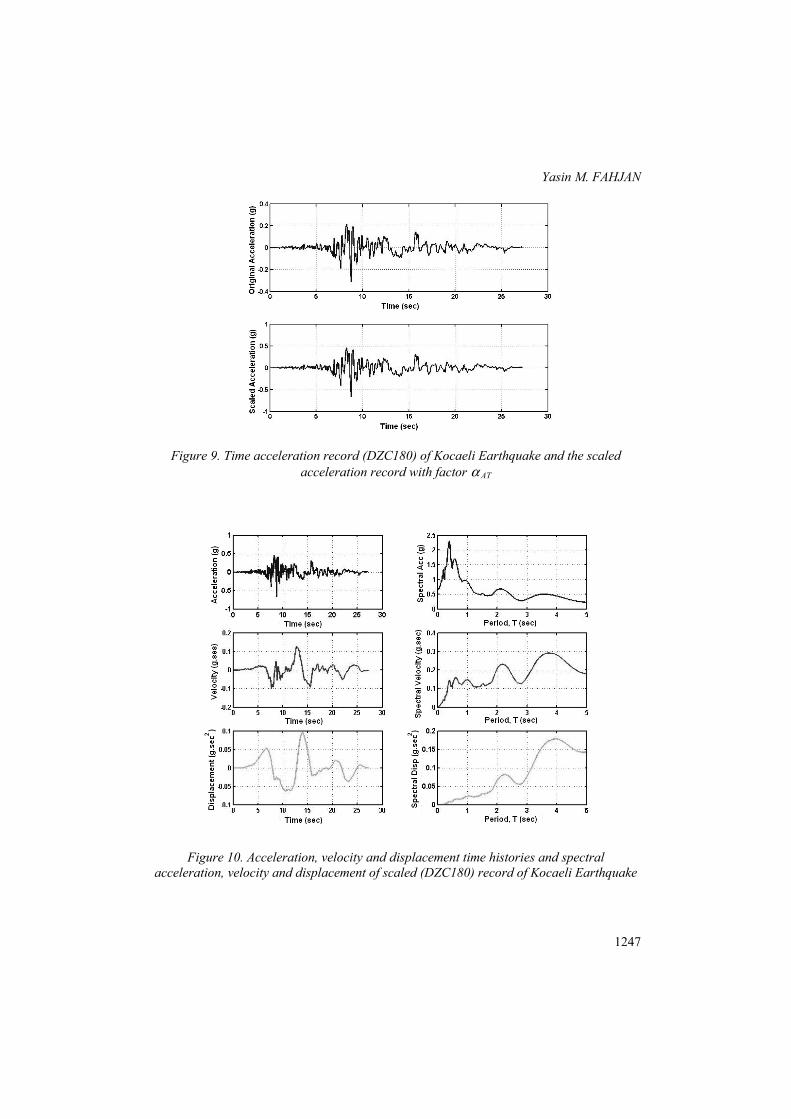
Figure 9. Time acceleration record (DZC180) of Kocaeli Earthquake and the scaled
acceleration record with factor α AT
Figure 10. Acceleration, velocity and displacement time histories and spectral
acceleration, velocity and displacement of scaled (DZC180) record of Kocaeli Earthquake
Selection and Scaling of Real Earthquake Accelerograms to Fit …
1248
Figure 11. Response spectrum of (DZC180) record of Kocaeli Earthquake scaled to the
Turkish elastic design spectrum (2007)
7. CONCLUSION
In this study, the existing methodologies and criteria for selection and scaling of strong ground motion time histories to fit a target design spectrum are discussed and summarized. The proposed time domain scaling methodology is successfully applied to obtain time history records which are compatible with the Turkish design spectra (DBYBHY, 2007) in the specified period range (0.01-5.0 sec). Taking into account the criteria suggested by the Turkish code, for each local site class (Z1, Z2, Z3 and Z4), the best matched ten (10) time history records obtained from Pacific Earthquake Engineering Research (PEER) database are selected and the scaling factors are computed.
Symbols
A(T) : Spectral acceleration coefficient
AI : Arias Intensity
Ao : Effective ground acceleration coefficient
a(t) : Acceleration amplitude at time t
diff : Square of scaled-to-target difference
g : gravitational acceleration
I : Building importance factor
Yasin M. FAHJAN
1249
k : Number of period steps (∆T) used to compute the response spectrum
N : Number of earthquake records
S(T) : Spectrum Coefficient
Satarget : Target acceleration response spectrum
Saactual : acceleration spectrum of the given (actual) time history
T : Total duration of the record
T : Period of oscillator
TS : Lower period of scaling range
TF : Upper period of scaling range
T1 : First effective natural period
Z1, Z2, Z3 ve Z4 : Local site classes defined in Turkish Seismic Code [1]
α : Scaling factor
αAT : Scaling factor for Spectral acceleration coefficient, A(T)
αST : Scaling factor for Spectrum Coefficient, S(T)
∆T : Period step
Acknowledgments
The author would like to thank Ph.D. candidate Zuhal Özdemir for her great contributions to manipulate the earthquake data and to carry out the analyses used in this study.
References
[1] Specification for Buildings to be Built in Seismic Zones (2007), Ministry of Public Works and Settlement Government of Republic of Turkey, Earthquake Research Department, http://www.deprem.gov.tr , 2007 (in Turkish).
[2] Boore, D. M., SMSIM – FORTRAN Programs for Simulating Ground Motions from Earthquakes: Version 2.0 – A Revision of OFR 96-80-A, USGS Open File Report OF 00-509, 2000.
[3] Abrahamson, N. A., Non-Stationary Spectral Matching Program RSPMATCH, User Manual, July 16, 1993.
[4] Kramer, S. L., Geotechnical Earthquake Engineering, Prentice Hall, 1996. [5] Naeim, F., Kelly, J. M., Design of Seismic Isolated Structures: From Theory to
Practice, John Wiley & Sons, 1999. [6] Reiter, L., Earthquake Hazard Analysis: Issues and Insights, Columbia University
Press, 1990.
Selection and Scaling of Real Earthquake Accelerograms to Fit …
1250
[7] Bommer, J. J., Scott, S. G., Sarma, S. K., Hazard-Consistent Earthquake Scenarios, Soil Dynamics and Earthquake Engineering, 19, 219-231, 2000.
[8] Bommer, J. J., Acevedo, A. B., Douglas, J., The Selection and Scaling of Real Earthquake Accelerograms for Use in Seismic Design and Assessment, Proceedings of ACI International Conference on Seismic Bridge Design and Retrofit, American Concrete Institute, 2003.
[9] Stewart, J. P., Chiou, S. J., Bray, J. D., Graves, R. W., Somerville, P. G., Abrahamson, N. A., Ground Motion Evaluation Procedures for Performance-Based Design, PEER Report 2001/09, Pacific Earthquake Engineering Research Center, University of California, Berkeley, 2001.
[10] Nikolaou, A. S., A GIS Platform for Earthquake Risk Analysis, Ph.D. Dissertation, State University of New York at Buffalo, 1998.
[11] Özdemir, Z., and Fahjan, Y. M., Comparison of Time and Frequency domains procedure for Scaling Time History Records to Fit Specified Design Spectrum, 6th National Earthquake Engineering Conference, 16-20 October, Istanbul, Turkey, 2007 (in Turkish).
[12] Seismic Zoning Map of Turkey, Ministry of Public Works and Settlement, Earthquake Research Department, http://www.deprem.gov.tr, 2006.
[13] Vanmarcke, E. H., State-of-the-Art for Assessing Earthquake Hazards in the United States: Representation of Earthquake Ground Motions – Scaled Accelerograms and Equivalent Response Spectra, Miscellaneous Paper S-73-1, Report 14, US Army Corps of Engineers Waterways Experiment Station, Vicksburg, Mississippi, 1979.
[14] Krinitzsky, E. L., Chang F. K., Specifying Peak Motions for Design Earthquakes, State-of the-Art for Assessing Earthquake Hazards in the United States, Report 7, Miscellaneous Paper S-73-1, US Army Corps of Engineers, 1977.
[15] Pacific Earthquake Engineering Research (PEER) Center, PEER Strong Motion Database, http://peer.berkeley.edu/smcat/, 2006.
[16] Aydınoğlu, M. N., Fahjan, Y. M., A Unified Formulation of the Piecewise Exact Method for Inelastic Seismic Demand Analysis including the P-Delta Effect, Earthquake Engineering and Structural Dynamics, 32, 6, 871-890, 2003.
[17] Bommer, J. J., Martínez-Pereira, A., The Effective Duration of Earthquake Strong Motion, Journal of Earthquake Engineering, 3, 127-172, 1999.
[18] Bolt, B. A., Duration of Strong Motion, Proceedings 4th World Conference on Earthquake Engineering, Santiago, Chile, 1304-1315, 1969.
[19] Arias, A., A., Measure of Earthquake Intensity in Seismic Design for Nuclear Power Plants, Ed. By R. Hansen, Cambridge: Massachusetts Institute of Technology, 1969.
[20] Trifunac, M. D., A. G. Brady, A Study on the Duration of Strong Earthquake Ground Motion, The Bulletin of the Seismological Society of America (BSSA), 65, 581-626, 1975.