Embed Size (px)
Citation preview

HIGH FREQUENCY EARTHQUAKE GROUND
MOTION SCALING IN UTAH
Young Soo Jeon, B. E., M.S.
A Thesis Submitted to the Faculty of the Graduate Schoolof Saint Louis University in Partial Fulfillment of
the Requirements for the Degree ofMaster of Science (Research)
2000

Digest
Vertical component velocity seismograms from the University of Utah
Seismograph Stations are used to measure and quantify high frequency
ground motion scaling for the seismically hazardous Wasatch front, the
northeastern Basin and Range province. This study analyzed a data set
consisting of 3000 waveform from 110 stations and 238 regional earth-
quakes and mining related seismic events in the range of 10 - 500 kilometer
hypocentral distance.
The signals were processed to examine the peak ground velocity and
Fourier velocity spectra in the frequency range of 1 - 16 Hz. Random vi-
bration theory (RVT) is used to test estimates of the peak ground motion
in the time domain and duration defined by the limits of 5% - 75% seismic
energy that follows the onset of the S-waves used. Comparison of the two
regressions indicated that our RVT related duration term for band pass fil-
tered spectra is quite good and both regression results display consistent
shapes.
Both the Fourier velocity and peak filtered time domain regression re-
sults are characterized by rapid decreases of amplitude at short distance.
Low�������
and rapid � ��� are required to forward modeling. Using two dif-
ferent geometrical spreadings at short distances,���� ���������� ���
for model A
and���� ��� �!��� �
for model B are required. These�
values are lower than
that obtained in previous studies of�
in the Basin and Range province.
" � � �$#%����and &(' � �����
are obtained by using Boore (1983) constant
stress drop model and our attenuation relationships.
i
ii
Possible explanations for the excitation of mining events are first, a
higher " � �$#%� �which reduces all high frequency because of a shallow
source " effect is needed in addition to the receiver site " effect. The sec-
ond possibility is that these are low stress drop events based on the idea
that the collapse of long tunnels is a very slow process. Low stress drops
imply lower corner frequencies for a given ��� . There is a better fit with
the low stress drop event ( &(' � �$# ), but the seismic moments are unreal-
istically large.

HIGH FREQUENCY EARTHQUAKE GROUND
MOTION SCALING IN UTAH
Young Soo Jeon, B.E., M.S.
A Thesis Submitted to the Faculty of the Graduate Schoolof Saint Louis University in Partial Fulfillment of
the Requirements for the Degree ofMaster of Science (Research)
2000

COMMITTEE IN CHARGE OF CANDIDACY:
Professor Robert B. Herrmann,Chairperson and Advisor
Professor Brian J. Mitchell
Associate Professor Charles J. Ammon
i

Acknowledgments
I would like to thank my parents for supporting me and giving me
their unconditional love through my many years of study. I thank Dr.
Robert B. Herrmann, my advisor, for his support throughout this work
and everything he did for me. I also thank Dr. Brian Mitchell and Dr.
Charles Ammon for critically reviewing this disseration. I also thank Dr.
James Pechman and Ms. Sue Nava of the University of Utah Seismograph
stations for providing the excellent data set used for this research.
Finally I appreciate the assistance of my fellow students and friends for
helping me to finish this work.
ii

Table of Contents
1 Introduction 1
1.1 Importance of high frequency ground motion . . . . . . . . . 1
1.2 Geologic and geophysical features of Utah . . . . . . . . . . 4
1.2.1 Earthquakes . . . . . . . . . . . . . . . . . . . . . . . . 4
1.2.2 Tectonic provinces . . . . . . . . . . . . . . . . . . . . 4
1.2.3 Wasatch fault . . . . . . . . . . . . . . . . . . . . . . . 6
1.2.4 Fault activity . . . . . . . . . . . . . . . . . . . . . . . 8
1.2.5 Heat flow . . . . . . . . . . . . . . . . . . . . . . . . . 9
1.2.6 Q . . . . . . . . . . . . . . . . . . . . . . . . . . . . . . 11
1.3 Seismic hazard . . . . . . . . . . . . . . . . . . . . . . . . . . . 13
1.3.1 General hazards . . . . . . . . . . . . . . . . . . . . . . 13
1.3.2 Large earthquakes . . . . . . . . . . . . . . . . . . . . 15
1.3.3 Specific hazards for Utah . . . . . . . . . . . . . . . . 16
1.4 Objective of this study . . . . . . . . . . . . . . . . . . . . . . 17
2 Data set 19
2.1 The University of Utah Seismic Network . . . . . . . . . . . 19
2.2 Instrument response correction . . . . . . . . . . . . . . . . . 24
3 Data preparation and regression 26
3.1 Objective of regression analysis . . . . . . . . . . . . . . . . . 26
3.2 Initial data preparation . . . . . . . . . . . . . . . . . . . . . . 28
3.3 Trace analysis . . . . . . . . . . . . . . . . . . . . . . . . . . . 28
3.4 Quality control steps for entire data set . . . . . . . . . . . . . 29
iii

3.5 Regression . . . . . . . . . . . . . . . . . . . . . . . . . . . . . 29
3.6 Regression of Fourier Velocity spectra . . . . . . . . . . . . . 33
3.7 Regression of Peak Filtered velocity . . . . . . . . . . . . . . 39
3.8 Duration . . . . . . . . . . . . . . . . . . . . . . . . . . . . . . 46
3.9 Excitation . . . . . . . . . . . . . . . . . . . . . . . . . . . . . . 52
4 Parameterization 59
4.1 Modeling Fourier velocity spectra . . . . . . . . . . . . . . . 59
4.2 Modeling peak time domain values . . . . . . . . . . . . . . . 60
4.3 Propagation parameters . . . . . . . . . . . . . . . . . . . . . 62
4.4 Modeling source excitation . . . . . . . . . . . . . . . . . . . 68
5 CONCLUSIONS 82
5.1 Results . . . . . . . . . . . . . . . . . . . . . . . . . . . . . . . 82
5.2 Comparison of heat flow and attenuation parameters . . . . 83
5.3 Mining events . . . . . . . . . . . . . . . . . . . . . . . . . . . 86
5.4 Final considerations . . . . . . . . . . . . . . . . . . . . . . . . 87
Bibliography 77
Vita Auctoris 84
iv

List of Tables
1.1 Geologic history of study area . . . . . . . . . . . . . . . . . . 7
1.2� ��� and
���relations in the Basin and Range province from
previous studies (Xie and Mitchell, 1990). BRP, GB, NTS,
and SGB each denote Basin and Range province, Grean Basin,
Nevada Test Site, and Southern Grean Basin. . . . . . . . . . 13
1.3 Large earthquakes in the study area. . . . . . . . . . . . . . . 16
3.1 Attenuation functional at 1.0, 2.0, 3.0, and 4.0 Hz for Fourier
Velocity spectra. The columns give values of frequency (first
and sixth columns), hypocentral distance (second and sev-
enth columns), attenuation D(r,f) at a reference distance of
40 km (third and eighth columns), associated error bar (fourth
and ninth columns) and number of observations (fifth and
tenth columns). . . . . . . . . . . . . . . . . . . . . . . . . . . 37
3.2 Attenuation functional at 6.0, 8.0, 10.0, and 12.0 Hz for Fourier
Velocity spectra. The columns give values of frequency (first
and sixth columns), hypocentral distance (second and sev-
enth columns), attenuation D(r,f) at a reference distance of
40 km (third and eighth columns), associated error bar (fourth
and ninth columns) and number of observations (fifth and
tenth columns). . . . . . . . . . . . . . . . . . . . . . . . . . . 38
v

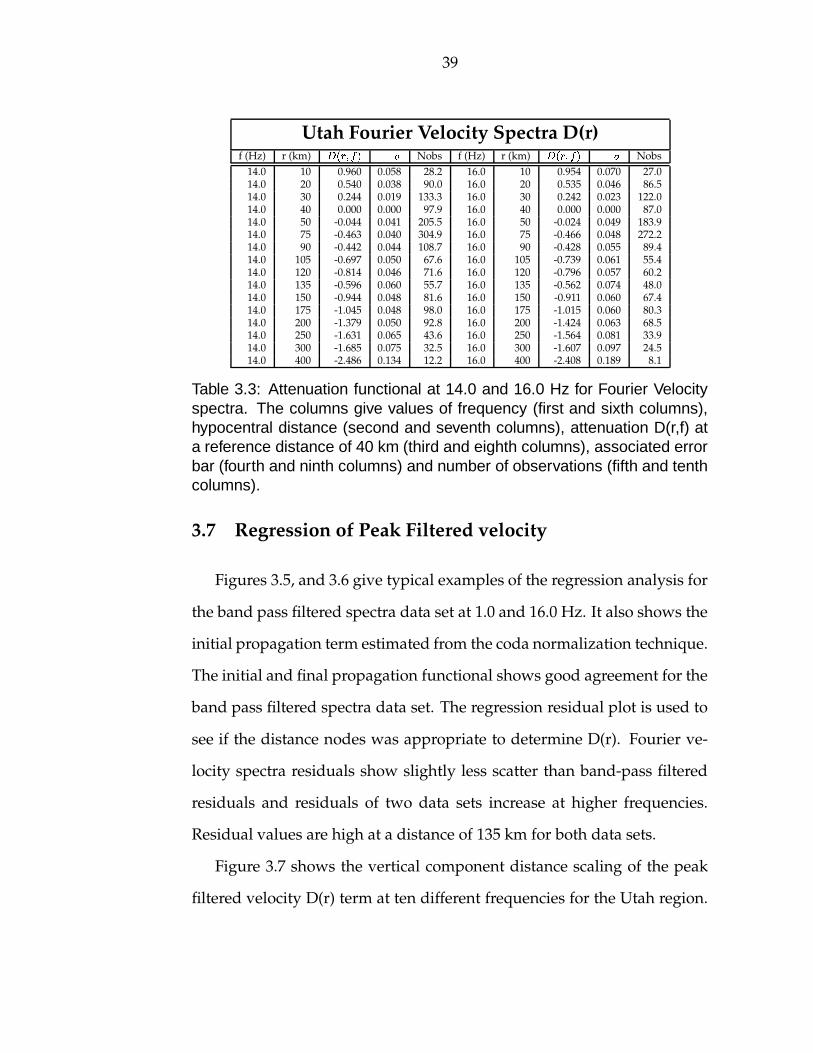
3.3 Attenuation functional at 14.0 and 16.0 Hz for Fourier Veloc-
ity spectra. The columns give values of frequency (first and
sixth columns), hypocentral distance (second and seventh
columns), attenuation D(r,f) at a reference distance of 40 km
(third and eighth columns), associated error bar (fourth and
ninth columns) and number of observations (fifth and tenth
columns). . . . . . . . . . . . . . . . . . . . . . . . . . . . . . . 39
3.4 Distance functional at 1.0, 2.0, 3.0, and 4.0 Hz for Band-
Passed filtered. The columns give values of frequency (first
and sixth columns), hypocentral distance (second and sev-
enth columns), attenuation D(r,f) at a reference distance of
40 km (third and eighth columns), associated error bar (fourth
and ninth columns) and number of observations (fifth and
tenth columns). . . . . . . . . . . . . . . . . . . . . . . . . . . 44
3.5 Distance functional at 6.0, 8.0, 10.0, and 12.0 Hz for Band-
Passed Filtered. The columns give values of frequency (first
and sixth columns), hypocentral distance (second and sev-
enth columns), attenuation D(r,f) at a reference distance of
40 km (third and eighth columns), associated error bar (fourth
and ninth columns) and number of observations (fifth and
tenth columns). . . . . . . . . . . . . . . . . . . . . . . . . . . 45
vi

3.6 Distance functional at 14.0 and 16.0 Hz for Band-Passed Fil-
tered. The columns give values of frequency (first and sixth
columns), hypocentral distance (second and seventh columns),
attenuation D(r,f) at a reference distance of 40 km (third
and eighth columns), associated error bar (fourth and ninth
columns) and number of observations (fifth and tenth columns). 46
3.7 Durations as a function of distance and frequency ranges
from 01 to 16 Hz. . . . . . . . . . . . . . . . . . . . . . . . . . 52
4.1 Propagation parameters of Model A and Model B . . . . . . 63
vii

List of Figures
2.1 Map showing the epicenter and station locations for the Uni-
versity of Utah data set . . . . . . . . . . . . . . . . . . . . . . 20
2.2 Velocity sensitivity for ARUT which has the L4-C seismome-
ter. . . . . . . . . . . . . . . . . . . . . . . . . . . . . . . . . . . 21
2.3 Velocity sensitivity for BHU which has the S-13 seismometer. 21
2.4 Velocity sensitivity for FSU which has the 18300 seismometer. 22
2.5 Velocity sensitivity for YFT which has the CMT-40T seis-
mometer. . . . . . . . . . . . . . . . . . . . . . . . . . . . . . . 22
2.6 Velocity sensitivity for GRD which has the SS-1 seismometer. 23
2.7 Velocity sensitivity for SLC which has the simulated Wood-
anderson response seismometer. . . . . . . . . . . . . . . . . 23
3.1 Source-receiver hypocentral distance distribution of observed
station for the data recorded along the seismic network . . . 30
3.2 Regression analysis for 1.0 Hz. Top, initial estimate of D(r)
using coda normalization technique. Middle, initial and fi-
nal propagation functionals. Bottom, final residuals of the
regression analysis . . . . . . . . . . . . . . . . . . . . . . . . 34
viii
3.3 Regression analysis for 16 Hz. Top, initial estimate of D(r)
using coda normalization technique. Middle, initial and fi-
nal propagation functionals. Bottom, final residuals of the
regression analysis . . . . . . . . . . . . . . . . . . . . . . . . 35
3.4 Attenuation functional� ���� ���
obtained from the regression
of the Fourier amplitudes at the frequencies of 1.0, 2.0, 3.0,
4.0, 6.0, 8.0, 10.0, 12.0, 14.0, and 16.0 Hz. The reference
hypocentral distance is at 40 km. . . . . . . . . . . . . . . . . 36
3.5 Regression analysis for 1.0 Hz. Top, initial estimate of D(r)
using coda normalization technique. Middle, initial and fi-
nal propagation functionals. Bottom, final residuals of the
regression analysis . . . . . . . . . . . . . . . . . . . . . . . . 40
3.6 Regression analysis for 16 Hz. Top, initial estimate of D(r)
using coda normalization technique. Middle, initial and fi-
nal propagation functionals. Bottom, final residuals of the
regression analysis . . . . . . . . . . . . . . . . . . . . . . . . 41
3.7 Attenuation functional� ���� ���
obtained from the regression
of the filtered velocities at the frequencies of 1.0, 2.0, 3.0, 4.0,
6.0, 8.0, 10.0, 12.0, 14.0, and 16.0 Hz. The reference hypocen-
tral distance is at 40 km. . . . . . . . . . . . . . . . . . . . . . 43
3.8 Duration data and regression lines as a function of distance
for filter frequency of 1.0 Hz . . . . . . . . . . . . . . . . . . . 48
ix

3.9 Duration data and regression lines as a function of distance
for filter frequency of 16 Hz . . . . . . . . . . . . . . . . . . . 49
3.10 Distance dependence of duration for filtered data at the dif-
ferent frequencies. Thick black line is a total duration esti-
mation for frequencies . . . . . . . . . . . . . . . . . . . . . . 51
3.11 Inverted Fourier velocity excitation terms for the earthquake
events recorded by vertical component velocity seismograms
plotted on a linear frequency scale . . . . . . . . . . . . . . . 54
3.12 Inverted Fourier velocity excitation terms for the mining re-
lated events recorded by vertical component velocity seis-
mograms plotted on a linear frequency scale . . . . . . . . . 55
3.13 Inverted Filtered ground velocity excitation terms for the
earthquake events recorded by vertical component velocity
seismograms plotted on a linear frequency scale . . . . . . . 56
3.14 Inverted Filtered ground velocity excitation terms for the
mining related events recorded by vertical component ve-
locity seismograms plotted on a linear frequency scale . . . . 57
3.15 Map showing the earthquake-epicenters and stations for Uni-
versity of Utah data . . . . . . . . . . . . . . . . . . . . . . . . 58
3.16 Map showing the explosion induced epicenters and stations
for University of Utah data . . . . . . . . . . . . . . . . . . . 58
x

4.1 Residuals of the model fit to the Fourier velocity distance
and geometrical spreading function of Model A . . . . . . . 64
4.2 Residuals of the model fit to the Fourier velocity distance
and geometrical spreading function of Model B . . . . . . . . 65
4.3 Residuals of the model fit to the band pass distance and ge-
ometrical spreading function of Model A . . . . . . . . . . . 66
4.4 Residuals of the model fit to the band pass distance and ge-
ometrical spreading function of Model B . . . . . . . . . . . . 67
4.5 Fourier acceleration spectra at a distance 1 km as a function
of � � for stress drop 10, 30, 100, 200 and 400 bars. Dark and
lightest line indicate 10 and 400 bars. The different � � are
indicated by the different low frequency asymptotics. For a
given � � , the high frequency level varies as &(' . . . . . . . . 70
4.6 Excitation of Fourier velocity spectra at 40 km (Model A).
The thick dash curve is the prediction of the 400 bar con-
stant stress drop source model. E is the log � � of the Fourier
velocity spectra in ��������
. . . . . . . . . . . . . . . . . . . . . 72
4.7 Excitation of Fourier velocity spectra at 40 km (Model A) in
linear scale of frequency range. The thick dash curve is the
prediction of the 400 bar constant stress drop source model.
E is the log � � of the Fourier velocity spectra in ��������
. . . . . 73
xi
4.8 Excitation of Fourier velocity spectra at 40 km (Model B).
The thick dash curve is the prediction of the 400 bar con-
stant stress drop source model. E is the log � � of the Fourier
velocity spectra in ��������
. . . . . . . . . . . . . . . . . . . . . 74
4.9 Excitation of Fourier velocity spectra at 40 km (Model B) in
linear scale of frequency range. The thick dash curve is the
prediction of the 400 bar constant stress drop source model.
E is the log � � of the Fourier velocity spectra in ��������
. . . . . 75
4.10 Excitation of peak filtered velocity at 40 km (Model A). The
thick dash curve is the prediction of the 400 bar constant
stress drop source model. E is the log � � of the peak filtered
velocity spectra in ��������
. . . . . . . . . . . . . . . . . . . . . 76
4.11 Excitation of peak filtered velocity at 40 km (Model A) in
linear scale of frequency range. The thick dash curve is the
prediction of the 400 bar constant stress drop source model.
E is the log � � of the peak filtered velocity spectra in ��������
. . 77
4.12 Excitation of peak filtered velocity at 40 km (Model B). The
thick dash curve is the prediction of the 400 bar constant
stress drop source model. E is the log � � of the peak filtered
velocity spectra in ��������
. . . . . . . . . . . . . . . . . . . . . 78
xii

4.13 Excitation of peak filtered velocity at 40 km (Model B) in
linear scale of frequency range. The thick dash curve is the
prediction of the 400 bar constant stress drop source model.
E is the log � � of the peak filtered velocity spectra in ��������
. . 79
4.14 Mining related excitation of Fourier velocity spectra at 40
km. The thick curve is the prediction of the 400 bar stress
drop source with " ����� � �$# � �for propagation model A. E is
the log � � of the Fourier velocity spectra in ��������
. . . . . . . . 80
4.15 Mining related excitation of Fourier velocity spectra at 40
km. The thick curve is the prediction of the 0.1 bar constant
stress drop for propagation model A. E is the log � � of the
Fourier velocity spectra in ��������
. . . . . . . . . . . . . . . . . 81
5.1 Regression analysis for 2.0 Hz. Top, initial estimate of D(r)
using coda normalization technique. Middle, initial and fi-
nal propagation functionals. Bottom, Final residuals of the
regression analysis . . . . . . . . . . . . . . . . . . . . . . . . 66
5.2 Regression analysis for 4.0 Hz. Top, initial estimate of D(r)
using coda normalization technique. Middle, initial and fi-
nal propagation functionals. Bottom, Final residuals of the
regression analysis . . . . . . . . . . . . . . . . . . . . . . . . 67
xiii

5.3 Regression analysis for 8.0 Hz. Top, initial estimate of D(r)
using coda normalization technique. Middle, initial and fi-
nal propagation functionals. Bottom, Final residuals of the
regression analysis . . . . . . . . . . . . . . . . . . . . . . . . 68
5.4 Regression analysis for 12 Hz. Top, initial estimate of D(r)
using coda normalization technique. Middle, initial and fi-
nal propagation functionals. Bottom, Final residuals of the
regression analysis . . . . . . . . . . . . . . . . . . . . . . . . 69
5.5 Regression analysis for 2.0 Hz. Top, initial estimate of D(r)
using coda normalization technique. Middle, initial and fi-
nal propagation functionals. Bottom, Final residuals of the
regression analysis . . . . . . . . . . . . . . . . . . . . . . . . 70
5.6 Regression analysis for 4.0 Hz. Top, initial estimate of D(r)
using coda normalization technique. Middle, initial and fi-
nal propagation functionals. Bottom, Final residuals of the
regression analysis . . . . . . . . . . . . . . . . . . . . . . . . 71
5.7 Regression analysis for 8.0 Hz. Top, initial estimate of D(r)
using coda normalization technique. Middle, initial and fi-
nal propagation functionals. Bottom, Final residuals of the
regression analysis . . . . . . . . . . . . . . . . . . . . . . . . 72
xiv

5.8 Regression analysis for 12 Hz. Top, initial estimate of D(r)
using coda normalization technique. Middle, initial and fi-
nal propagation functionals. Bottom, Final residuals of the
regression analysis . . . . . . . . . . . . . . . . . . . . . . . . 73
5.9 Duration data and regression lines as a function of distance
for filtered frequency of 2.0 Hz . . . . . . . . . . . . . . . . . 74
5.10 Duration data and regression lines as a function of distance
for filtered frequency of 6.0 Hz . . . . . . . . . . . . . . . . . 75
5.11 Duration data and regression lines as a function of distance
for filtered frequency of 12 Hz . . . . . . . . . . . . . . . . . . 76
xv

1. Introduction
1.1 Importance of high frequency ground motion
Studies of high frequency (greater than 1 Hz) ground motions provide
seismologists an understanding of seismic source properties and physical
models of the Earth’s structure through which the waves pass. Predictive
or physical ground motion models developed by seismologists usually in-
volve either the prediction of the motions from a fault of specified dimen-
sion and orientation, such as slip or rupture velocity over the fault surface
(e.g., Bouchon, 1978; Joyner and Boore, 1980) or the random superposi-
tion of the theoretically radiated fields from many circular patches, con-
centrated at a point (e.g., Boatwright, 1982). The former is useful for site
specific simulations, whereas the latter captures the essence of high fre-
quency motion at an average site from an average earthquake of specified
size.
Engineers are interested in the motions that structures have to endure.
For engineering purposes, amplitudes, frequency content and duration of
the motion are important. For structural response (Krammer, 1996), the
engineering community requires empirical or model based predictions of
strong motion for design, seismic hazard analysis and loss modeling.
Equations giving ground motion as a function of magnitude and dis-
tance can be empirical or model based. Empirical methods require a large
data set in terms of earthquake size and observation distance for regres-
sion. Model based predictions use parametric models to provide an exci-
tation of site spectrum and duration, which is then used with a stochastic
1

2
simulation of ground motion.
The ground motions produced by earthquakes are very complicated.
The identification and evaluation of factors controlling ground motions as
a function of distance and magnitude are essential for seismological and
earthquake engineering applications. Ground motion at a site is affected
by source, travel path, and local site conditions. Earthquake size, depth,
stress drop, rupture process, and fault geometry influence the source fac-
tors. Travel path factors, which describe seismic wave propagation through
the body of the earth, are geometrical attenuation, dissipation of seismic
energy due to anelastic properties of the earth, and scattering of elastic
waves during propagation. The shallow crustal rock and soil properties
and the effect of the surface topography at a local site control site condi-
tions.
The physical characteristic of the propagation which carries elastic en-
ergy can change. Ground motion at periods ( � 1 sec) will generally be
dominated by surface waves. The fundamental-mode surface waves are
affected by scattering (produced by the complexity) and intrinsic absop-
tion of the medium as they pass through a laterally complex structure.
The direct S wave carries the main shear wave energy at short distance
( � ���km), while the postcritical reflections of S waves, namely Lg wave,
are the dominent phase at distances of 150 to 1000 km. Wave propaga-
tion in the transition distance range of 80 to 150 km is more complex
(Samiezade-Yard, 1993).
Any attempt to understand the attenuation of ground motion has to
deal with the question of separation of the geometrical spreading contri-
bution to amplitude decrease from intrinsic attenuation and scattering in

3
the different distance ranges where the nature of the motion may change.
Geometrical attenuation is usally assumed as a frequency independent op-
erator in the overall wave propagation (Ou and Herrmann, 1990; Frankel
et al., 1990). Cracks, faults, and velocity heterogenieties of different scales
within the crust affect the wave scattering. The scattering itself is a fre-
quency dependent factor causing only a redistribution of the energy in
space and time. A proper strategy of investigating elastic waves should
account for the total energy, the degree of scattering, and total contribu-
tion of apparent attenuation.
Local site effects can amplify or deamplify ground motion as a function
of frequency. Geology and the type of rocks of sediment around the site
are controlling factors in evaluating the site factor (Su et al., 1992; Mayeda
et al., 1992; Castro et al., 1990; Philips and Aki, 1986). Younger and less
consolidated sediments may amplify seismic waves several times more
than hard rocks because of different impedence and resonance effects. At
the same time, wave scattering an anelastic attenuation can remove high
frequencies for the signal (Boore and Joyner, 1991). Non-linear effects on
seismic waves would be an increase in damping and a decrease in propa-
gation velocity, with consequent reduction in high-frequency amplitudes
and shifts to lower frequencies of the spectral resonant peaks of the soil
deposit (Cultrera et. al., 1999). The two competing factors can be de-
scribed in terms of a site amplification,V(f), and an attenuation parameter
kappa, " (Boore and Joyner, 1991). Topography and sediment thickness
variation can distort wave forms and amplitudes. Topographic irregulari-
ties can produce complex patterns of amplification or deamplification, de-
pending on the geometry of the irregularity, the frequencies, and angles of

4
the incoming waves (Sanchez-Sesma and Campillo, 1993). The curvature
of a basin where softer alluvial soils have been deposited can trap body
waves and lead incident body waves to propagate through the alluvium
as surface waves (Vidale and Helmberger, 1988). These waves can produce
stronger shaking and longer durations.
1.2 Geologic and geophysical features of Utah
1.2.1 Earthquakes
About 700 earthquakes (including aftershocks) are recorded in the Utah
region each year. About 2 % of the earthquakes are felt and an average of
13 earthquakes of magnitude 3.0 or larger occur in the region every year.
Earthquakes can occur anywhere in the state of Utah. Since 1850, at least 15
earthquakes of magnitude 5.5 and larger have occured in the Utah region
on the average of once every 7 years (http://www.seis.utah.edu/HTML/
UtahsEarthquakeThreat2.html). The earthquakes are related to the tec-
tonic processes within the region.
1.2.2 Tectonic provinces
Part of Utah lies in the Basin and Range province, the largest intra-
continental rift in the world which contains important clues to the deep
structure of continental rifts, the nature of ”transitional crust,” and the re-
lations of rifting to prior thrust faulting. This region is characterized by
high heat flow, seismicity, intensive normal faulting, and an extensive dis-
tribution of Cenozoic Volcanoes (e.g. Lachenbruch and Sass 1978; Priestley
and Brune; 1978). Petrological studies show that the area was a region of
andesitic volcanism until late Cenozoic, when basaltic volcanism became

5
more predominant (Stewart and Carlson, 1976).
Models of Basin and Range extension include the classic horst and
graben geometry with steeply dipping normal faults (Zoback et al., 1981;
Wernicke, 1981).
The ranges in east-central Nevada and west-central Utah are underlain
mostly by upper Precambrian to Triassic sequence of sandstones, shales,
and carbonates. This well-known miogeoclinal succession includes about
20 distinctive and regionally extensive formations with an aggregate thick-
ness in excess of 13 km (Stewart and Poole, 1974; Hose and Blake, 1976).
Despite major regional variations in the absolute timing of volcanism
and normal faulting, local eruptive and extensional histories are strikingly
similar (Gans et al; 1989). Present-day faulting is concentrated along the
margins of the Basin and Range province, expanding into the thinner,
gravitationally unstable crust of the Sierra Nevada and Colorado Plateau
(e.g., Best and Brimhall, 1974). The seismicity of east of the Wasatch Fault
may be fundamently influenced by the Cenozoic structure, or perhaps by
bending stress induced by crustal flexure (Zandt and Owens, 1980).
The northern Utah region is near the transition of the Basin and Range,
the middle Rocky Mountains, the Colorado Plateau and the Columbia
Plateau geologic provinces. Bucher and Smith (1971) reported that the
crust is about 40 km thick in the northern Colorado Plateau province and
about 32 km thick in the eastern Basin and Range province. Both have sim-
ilar properties such as moderate to high heat flow, low upper-mantle seis-
mic velocities, and a high rate of seismic attenuation. Priestley and Brune
(1978) mentioned that the reason for low shear-wave velocities found in
upper mantle in Great Basin is due to a zone of tension into which deep

6
mantle material has intruded relatively close to the surface to create a zone
of partial melting.
Table 1.1 is a brief summary of significant events in Utah’s geologic
history as extracted from the more detailed description by Utah Geological
Survey at http://www.ugs.state.ut.us/geohist.htm.
1.2.3 Wasatch fault
The Wasatch Mountains is in the zone of transition between the north-
eastern margin of the active Basin and Range extensional province and the
less-deformed Colorado Plateau and Wyoming Basin tectonic provinces
to its east (Powell and Chapman, 1990). The Wasatch Range in the south-
west of the Middle Rocky Mountains province and the Utah High Plateaus
marks the transitional boundary between the thermal regimes, structural
styles and stress states of the Basin and Range and Colorado Plateau (Bodell
and Chapman, 1982; Eaton, 1982).
This transitional region is also the locale of a pronounced zone of in-
traplate seismicity, the Intermountain Seismic Belt (ISB) (Arabasz et al.,
1980). About 500 earthquakes are located in the Wasatch Front region each
year and about 60 % of the earthquakes of magnitude 3.0 and larger in
Utah region occur in the Wasatch front region. The boundary region is
cut by steeply dipping normal faults with northerly strike - an orientation
characteristic of the northern Basin and Range. The slip rate of Wasatch
Front is� �#%� � �$#�� �
mm/yr and most of the earthquake focal depths are
located less than 20 km.
The Wasatch fault, the west front of the Wasatch mountains, is marked
by a large normal fault displacement. It has cut across the Cottonwood

7
Period Duration Description of eventsQuaternary Holocene Erosional and depositional processes
dominate. Basin-Range faults con-tinue to be active. Volcanic eruptionscontinue in western Utah, as recentlyas 660 years ago.
Quaternary Pleistocene Glaciers blanket the Unita Mountains,the Wasatch Range, and mountains ofthe Colorado Plateau.
Tertiary Pliocene Volcanism continues in southwesternUtah. Basin and Range faulting andregional uplift continues.
Tertiary Oligocene Igneous activity produces intrusiverocks in northern Utah and volcanoesin southwestern Utah.
Tertiary Miocene Basin and Range faulting in west-ern Utah creates mountain-valley-mountain topography and theWasatch fault zone. Igneous intru-sions continue to form in the Henryand Abajo Mountains and Igneousactivity continues until approximately15 million years ago.
Tertiary Eocene In the Unita Basin thousands of feetof sediment are deposited. Graniticintrusions and volcanic flows occurin northwestern Utah during the lateEocene.
Tertiary Paleocene Eroding highlands prevail in westernUtah. The Unita Mountains upliftsmaller and the Unita basin becomesprominet features in eastern Utah.
Cretaceous 138 Ma - 66 Ma in eastern Utah, sea invades fromthe east. Western Utah rises due tothrust faulting and folding generatedby east-west directed compressionalfactors.
Jurassic 205 Ma - 138 Ma In central Utah, the Arapien basin de-velops and receives over 6,000 feet ofsediment including large amounts ofgypsum and salt.
Table 1.1: Geologic history of study area

8
dome and been displaced the west part downward several thousand feet
(Guidebook to the geology of Utah, Park City district Utah. No 22, 1968).
It extends approximately 370 km in a north-south direction. Recent GPS
survey results in this region indicate rapid crustal extension at a rate of� #�� � �#��
mm/yr. This horizontal displacement rate across a 55 km wide
area is two or three time larger than the average Late Quaternary fault slip
rate measured in conventional method (Smith et al., 1998).
1.2.4 Fault activity
The presence of a fault itself does not indicate the probability of fu-
ture earthquakes. The more important notion of fault activity has been a
topic of considerable discussion and controversy. The terminology ”ac-
tive fault” describes a fault that poses a current earthquake threat. Formal
definition of fault activity is important because this often trigger legal re-
quirements for special investigations or special design provisions. Various
criteria are used to define fault activity (Krammer, 1996).
Slemmons and McKinney (1977) found 31 different definitions of an
active fault given in terms of the elapsed period of time since the most
recent fault movement. The California Division of Mines and Geology de-
fines an active fault as one that has produced surface displacement within
Holocene time (approximately 10,000 years). For dams, the U.S. Army
Corps of Engineers has used a time period of 35,000 years, and the U.S.
Bureau of Reclamation has used 100,000 years (Idriss, 1985). The U.S Nu-
clear Regulatory Commission (Code of Federal Regulations, 1978) has used
the term Capable fault (rather than active fault) for the following:
I Movement at or near the ground surface at least once within

9
the past 35,000 years or movement of a recurring nature within
the past 500,000 years
II Macroseismicity instrumentally determined with records of suf-
ficient precision to demonstrate a direct relationship with the
fault
III A structural relationship to a capable fault according to charac-
teristics of above, such as movement that one could reasonably
be expected to be accompanied by movement on the other.
Utah has several fault zones in the ”active” category. Any fault which
has displaced recent alluvium and whose surface effects have not been
modified to any appreciable extent by recent erosion (since the last few
hundred or thousand years) is active. More than 90 percent of 263 earth-
quakes since 1847 to early 1960 had their origin in the five active fault
zones identified. These are Hansel Valley fault, Wasatch fault, Sevier fault,
Elsinore fault, and Hurricane fault. Most geological and historical fault
scarps in Utah and the Great Basin are observed in alluvial deposits close
to the foot of the adjacent mountains fronts and extend well into the adja-
cent valleys (Utah Geological Society Guidebook to the geology of Utah.
No 18, 1964).
1.2.5 Heat flow
The study area is focused mainly on the eastern Basin and Range province,
Colorado Plateau, and Wyoming Basin. The Wasatch Mountains of Utah
lie in the zone of transition between these provinces. The thermal state of
the crust influences the rheology, orientation and concentration of stresses,

10
crustal magnetic processes, depth distribution of earthquakes, magmatic
processes, and the physical and chemical conditions of metamorphic pro-
cesses. The temperature distribution within the crust can also reflect pro-
cesses that modify lithospheric structure (Powell and Chapman, 1990).
Therefore, identifying thermal state of tectonic provinces and their bound-
aries is very important.
In the last 30 My, the region has undergone extension and apparent
crustal thinning, with concomitant magmatism. Normal faulting and other
structural elements associated with the extension follow the grain of the
earlier compressional structure. These features are dynamically associated
with the changing convergent and transcurrent conditions at the western
boundary of the North American plate (Atwater, 1970; Eaton, 1982).
The typical heat flow of the eastern Basin and Range is 90-105 mW � ��
(Lachenbruch and Sass, 1977; Blackwell, 1978; Chapman et al., 1981). This
high value of heat flow can be attributed to any of a number of advec-
tive processes which effectively transport heat into and through the crust
(Blackwell, 1978; Lachenbruch and Sass, 1978). Heat flow in the Basin
and Range exhibits more tectonic variability than is usual in a continen-
tal tectonic province, due to active hydrothermal systems in the upper
crust, regional hydrologic effects, and the localized episodic nature of the
extension processes and magmatism (Powell and Chapman, 1990). But
the heat flow observations alone cannot discriminate among the causative
processes.
Heat flow in the interior of the Colorado Plateau is typically 55-60
mW m ��
(Bodell and Chapman, 1982) and exhibits less variability than
the Basin and Range region. The west, south and southeast margins of

11
the Colorado Plateau have higher heat flow than the interior, approaching
that of the adjacent extensional province (Reither et al., 1979; Bodell and
Chapman, 1982). Heat flow in the Wyoming basins is about 60 mW m ��
(Bodell and Chapman, 1982; Chapman et al., 1984). For comparison, heat
flow along the San Andreas Fault in California is 40 - 100 mW m ��
and less
than 40 mW m ��
in Sierra Nevada (Sass et al., 1981; ; Sass et al., 1997). The
mean heat flow values of the eastern United States are 59�
22 mW m ��
in
the Central Lowlands, 42�
17 mW m ��
in the Coastal Plain, and 53�
14
mW m ��
in the Appalachian Highlands (Morgan and Gosnold, 1989).
1.2.6 Q
Q is a paramter that describes the filtering of high frequencies as propa-
gates. The shallow part of the earth’s crust contains lateral heterogeneities
and short period (high frequency) waves are sensitive to those details. The
longer the waves travel, the greater the variety of heterogenieties they en-
counter.
Studies of the rate of anelastic attenuation of seismic waves have shown
the existence of lateral variations in the crust and upper mantle in the
continent of the United States. It is now generally accepted that seis-
mic anelastic attenuation of the western United States is high, while it is
low in the central and eastern United States. However, detailed short-
period attenuation observations over short paths within individual geo-
logical provinces of the continental United States are needed (Singh and
Herrmann, 1983).
Q, which quantify the intrinsic absorption (or anelasticity) of the medium,
is affected by factors such as temperature, the amount of fluid content, and
12
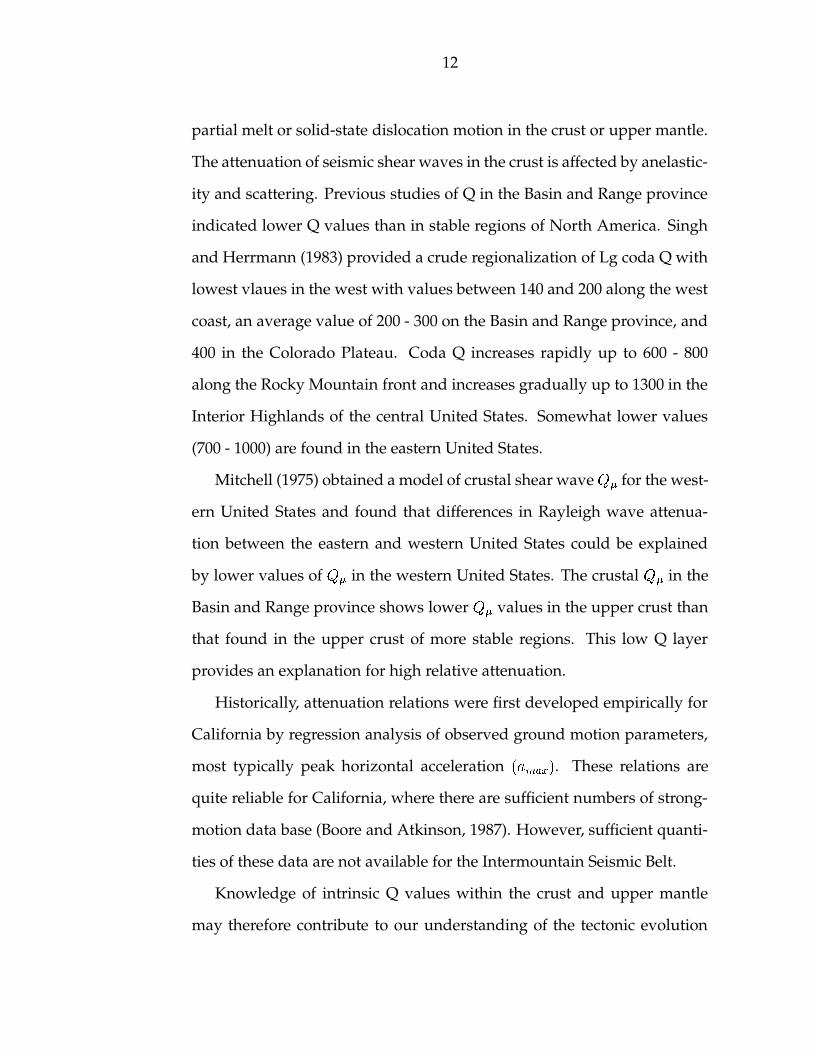
partial melt or solid-state dislocation motion in the crust or upper mantle.
The attenuation of seismic shear waves in the crust is affected by anelastic-
ity and scattering. Previous studies of Q in the Basin and Range province
indicated lower Q values than in stable regions of North America. Singh
and Herrmann (1983) provided a crude regionalization of Lg coda Q with
lowest vlaues in the west with values between 140 and 200 along the west
coast, an average value of 200 - 300 on the Basin and Range province, and
400 in the Colorado Plateau. Coda Q increases rapidly up to 600 - 800
along the Rocky Mountain front and increases gradually up to 1300 in the
Interior Highlands of the central United States. Somewhat lower values
(700 - 1000) are found in the eastern United States.
Mitchell (1975) obtained a model of crustal shear wave�� for the west-
ern United States and found that differences in Rayleigh wave attenua-
tion between the eastern and western United States could be explained
by lower values of�� in the western United States. The crustal
�� in the
Basin and Range province shows lower�� values in the upper crust than
that found in the upper crust of more stable regions. This low Q layer
provides an explanation for high relative attenuation.
Historically, attenuation relations were first developed empirically for
California by regression analysis of observed ground motion parameters,
most typically peak horizontal acceleration��������� �
. These relations are
quite reliable for California, where there are sufficient numbers of strong-
motion data base (Boore and Atkinson, 1987). However, sufficient quanti-
ties of these data are not available for the Intermountain Seismic Belt.
Knowledge of intrinsic Q values within the crust and upper mantle
may therefore contribute to our understanding of the tectonic evolution

13
Authors Source Type & Region Frequency range ResultSingh & Her-rmann (1983)
earthquake & BRP 0.6-3.5 Hz��������� ��� ��� �� ��������� ��������� �����
Chavez &Priestley (1986)
explosion & GB 0.3-10.0 Hz��� �!����� " $# ������� %�&��
Chavez &Priestley (1986)
earthquake & GB 0.3-5.0 Hz��� �!����� '�( ��� ')� ��������� ���*����� ��+��
Nuttli (1986) explosion & NTS 0.5-2.0 Hz� � �����, '�-�. ������� %��
Rogers et al.(1987)
earthquake & SGB 1.0-10.0 Hz���������, '�($- ������� &/���
Rogers et al.(1987)
earthquake & SGB 1.0-10.0 Hz��� �!����� 0�0 ( ������� �����
Table 1.2:� ��� and
���relations in the Basin and Range province from
previous studies (Xie and Mitchell, 1990). BRP, GB, NTS, and SGB eachdenote Basin and Range province, Grean Basin, Nevada Test Site, andSouthern Grean Basin.
of regions where these values have been determined (Mitchel et al., 1994).
The difference between Q models could be due to the regional variations
in crustal structure. Previous studies of� � � and
���values in Basin and
Range province are summarized in Table 1.2, where Lg Q and coda Q are
denoted by� ��� and
���. the
� � � and���
values at 1 Hz vary from 140
- 774. Inconsistant Q relations may be due to impresize inverse methods
(erroneous forward models), inversion parameter trade-offs, a different
seismic phases used (Xie and Mitchell, 1990).
1.3 Seismic hazard
1.3.1 General hazards
Ground shaking
When the seismic waves radiate away from the source and travel through
the earth’s crust reach the surface, they produce shaking that lasts from a
few seconds to minutes. The strength and duration of shaking depends

14
on the size and location of the earthquake and the site’s characteristics.
Ground shaking may cause tremendous damage to the site near the source
of a large earthquake.
Even if the waves propagate through rock from the source of an earth-
quake to the ground surface, the waves normally reach the top soil and
the characteristics of the soil shaking can influence the ground surface.
Soil deposits tend to act as ”filters” to seismic waves by attenuating mo-
tion at certain frequencies and amplifying it at others. Levels of ground
shaking vary within a small area due to the variance of soil conditions on
tha area (Kramer, 1996).
Liquefaction
Liquefaction may occur when soil deposits have lost their strength and
behave as a viscous liquid rather than as a solid. It reduces the strength
of the soil to the point where it causes the building to collapse or to be
unstable, empty buried tanks to rise to the surface, slope failures, lateral
spreading, surface subsidence, ground cracking and sand blows.
Liquefaction in Utah
Earthquake liquefaction has caused significant damage and is also one
major earthquake hazard in Utah. The 1934 Hansel Valley and 1962 Cache
Valley earthquakes caused liquefaction, and large prehistoric lateral spreads
exist at many locations along the Wasatch Front. The valleys of the Wasatch
Front are especially vulnerable to liquefaction because of susceptible soils,
shallow ground water, and relatively high probability of moderate to large
earthquakes.

15
The following conditions must exist for liquefaction to occur: suscep-
tible soil, strong ground shaking and significant duration of strong mo-
tion. Investigation of local geology, subsurface soil and water conditions
in the study region may identify susceptible sites. The most susceptible
soils are generally along rivers, streams, lake shorelines, and some an-
cient river and lake deposits. Hazard-reduction techniques such as soil
improvement or special foundation design may reduce the potential dam-
age (http://www. ugs.state.ut.us/geohist.htm).
Soil improvement techniques are commonly used at sites where the ex-
isting soil conditions are expected to lead to large soil movements, such as
horizontal or vertical movements. Reducing excessive porewater pressing
during earthquake shaking or increasing the strength and stiffness of the
soil are the main goals of the soil improvement techniques. The most com-
mon techniques are densification techniques, reinforcement techniques,
grouting/mixing techniques, and drainage techniques (Krammer, 1996).
1.3.2 Large earthquakes
Utah’s largest earthquakes since settlement in 1847 was the magnitude
of 6.6 1934 Hansel Valley earthquake, north of the Great Salt Lake. Not
only large earthquakes but also moderate-sized earthquakes that occur
near urban areas can cause major damage. Since 1850, at least 15 earth-
quakes of magnitude greater than 5.5 have occured in the Utah region
whose recurrence in a modern urban region could cause significant dam-
age. The time period between moderate size earthquakes in this region is
approximately 7 years. Table 1.3 presents recent magnitude 5.0 and larger
earthquakes in the Utah region for the past 40 years.

16
Local Date Magnitude LocationJan. 29, 1989 5.4 16 miles SE of Salina
Aug. 14, 1988 5.3 Central Emery CountyMar. 27, 1975 6.0 Pocatello Valley (Utah-Idaho border)Oct. 14, 1967 5.2 MarysvaleAug. 16, 1966 5.6 Utah-Nevada borderSep. 05, 1962 5.2 Salt Lake ValleyAug. 30, 1962 5.7 Cache Valley
Table 1.3: Large earthquakes in the study area.
1.3.3 Specific hazards for Utah
The Wasatch front is well recognized as being seismically hazardous
(Smith, 1974; Cluff et al., 1975; Algermissen and Perkins, 1976), and earth-
quakes of magnitude 7.5 have been postulated as ”credible” for this are
by the U.S. Geological Survey (1976). The primary earthquake hazards of
ground shaking and displacement along the surface faults in the Wastch
front area are similar to those of California.
Potential earthquake hazards in this area include;
I Earthquake-triggered landslides and rock and snow avalanches
along the mountainous Wasatch front
II Soil liquefaction, differential ground settlement, and landslides
III Catastropic flooding from impounded reservoirs in the Wasatch
Mountains upstream from densely populated centers
IV Disruption of vulnerable life-support facilities that cross the
Wasatch Fault (Arabasz et al., 1980).

17
Future large earthquakes of a magnitude 7.5 along the Wasatch fault
will break segments of the fault about 32 - 64 kilometers long and 3 - 6
meters of surface displacement and strong ground shaking that could pro-
duce considerable damage up to 80 kilometers from the earthquake. The
strong ground shaking also may cause soil liquefaction, landslides, rock
falls, and broad permanent tilting of valley floors that may force the Great
Salt Lake ot Utah Lake to inundate urban areas (http://www.ugs.state.ut.us/geohist.htm).
1.4 Objective of this study
The objective of this study is the quantative description of the regional
attenuations of the earthquake and mining induced high frequency ground
motion in Utah, especially along the Wasatch front by using University of
Utah’s regional seismic network. Understanding regional variations in at-
tenuation is important for predicting the amplitude of strong ground mo-
tion expected from a future earthquake. Describing the attenuation of the
ground motion as a function of frequency and hypocentral distance can be
used for engineering design and seismic hazard.
The goal of earthquake-resistant design is to produce a structure or fa-
cility that can withstand a certain level of facility without excessive dam-
age. The specification of the ground motion is one of the most difficult and
most important problems in geotechnical earthquake engineering (Kramer,
1996).
A study of high frequency ground motion scaling in Utah can be com-
pared to results of similar studies in other regions of the United States.
Furthermore, we can develop the predictive relation and extrapolate to

18
larger events. The results of this study are important for seismic hazard
studies since a large data set will be used to constrain the distance de-
pendence of high frequency ground motion in the frequency range that is
responsible for earthquake damage.

2. Data set
2.1 The University of Utah Seismic Network
The University of Utah regional seismic network extends from north
of the Idaho-Utah border to south of the Utah-Arizona border, ranging
from� ��
to� � �
in latitude and from �
� ���to �
�� � �in longitude. Figure
2.1 shows the epicenters of events and stations of the University of Utah
Seismograph Network providing the waveform data set used in this study.
The data set analyzed in this paper consists of 3000 waveforms from
110 stations and 238 regional earthquakes and other seismic events recorded
primarily during the first two quarters of 1999. The observations cover a
range of 500 kilometers in hypocentral distance. All events are within the
upper crust.
We use the vertical component velocity seismograms from the Uni-
versity of Utah Seismograph Network to study ground motion scaling
with distance for comparison to other locales in the US. Because of limited
telemetry bandwidth and the desire to cover large geographic regions, re-
gional seismic networks have relied on vertical component data. These
are supplemented by modern three-component broadband data from se-
lected stations. The sensors consist of Mark Products L4 or L4C’s, Geotech
S13 or 18300’s, a simulated Wood Anderson, Kinemetrics SS-1 and Guralp
CMG-40T and CMG3-ESP’s. The velocity sensitivities for selected stations
are plotted in units of (counts/m/sec) in Figures 2.2-2.7 to illustrate the
response shapes. The L4, S13 and 18300 responses are approximately flat
to ground velocity in the 1 - 10 Hz passband. The broadband CMG-40T
19

20
E p i c e n t e r s a n d s t a t i o n s f o r U n i v e r s i t y o f U t a h D a t a
3 6 . 0 0
38.00
40.00
42.00
44.00
- 1 1 6 . 0 0 -112.00 -108.00
EPICENTERS
3 6 . 0 0
38.00
40.00
42.00
44.00
- 1 1 6 . 0 0 -112.00 -108.00
STATIONS
Figure 2.1: Map showing the epicenter and station locations for the Uni-versity of Utah data set
sensor is very flat in the 0.1 - 10.0 Hz passband, while the SS-1 reponse is
peaked between 1 - 2 Hz. The simulated Wood-Anderson displacement
sensitivity at SLC is flat for frequencies greater than 1.25 Hz for which its
corresponding velocity sensitivity falls off as� �
�.
The digital waveforms distributed by the University of Utah are ob-
tained from the University of Utah Seismic Network (Utah), the U. S. Ge-
ological Survey (USGS), Snow College (SNOW), the Idaho National Engi-
neering and Environmental Lab (INEEL), the U.S. Bureau of Reclamation
(USBR), and the Lawrence Livermore National Lab (LLNL) seismic net-
works.
The deployed seismometer systems are described as
1) UUSS single-component, analog-telemetry, short-period
2) UUSS multi-component, analog-telemetry, short-period

21
Figure 2.2: Velocity sensitivity for ARUT which has the L4-C seismometer.
Figure 2.3: Velocity sensitivity for BHU which has the S-13 seismometer.

22
Figure 2.4: Velocity sensitivity for FSU which has the 18300 seismometer.
Figure 2.5: Velocity sensitivity for YFT which has the CMT-40T seismome-ter.

23
Figure 2.6: Velocity sensitivity for GRD which has the SS-1 seismometer.
Figure 2.7: Velocity sensitivity for SLC which has the simulated Wood-anderson response seismometer.

24
3) UUSS multi-component, digital-telemetry, broadband and
4) USNSN multi-component, digital-telemetry, broadband sensors.
2.2 Instrument response correction
The digital data series were corrected for instrument response to form
ground velocity in units of m/sec. This is done by a filtering operation
within SAC (Seismic Analysis Code, ..... 19XX, http://www-ep.es.llnl.gov/tvp/sac.html).
The instrument response was given in the form of SAC pole-zero files for
displacement sensitivity in units of counts/micron. To perform the in-
strument correction to form the desired ground velocity waveforms, we
applied the following SAC commands to each trace:
rtr
taper
transfer from polezero subtype tresp to none freq 0.25 0.3 20 21
dif
div 1000000
mul GAIN
Here we remove the linear trend in the data set, taper the beginning
and end of the time series, remove the instrument response given by the
file emph(tresp) after bandpass filtering the data between 0.3 - 20 Hz. The
result is the displacement time series in units of microns. This is converted
to velocity by differentiation, emph(dif), and to units of meters/sec by
dividing by the factor 1000000. Corrections for low gain channels used

25
the same pole-zero file tresp, but applied the emph(GAIN) multiplication
factor. The bandpass filter used within the emph(transfer) command is
required to ensure stability of the deconvolution process. The band limits
are chosen so that they do not interfere with the the bandpass filtering to
be performed in the next step of precessing.
Careful correction for instrument response is critical to this study since
we will attempt to study the absolute scaling of ground motion generated
by the source. The difficulty of maintaining this for regional seismic net-
works is acknowledged given the large number of field stations and the
many instrument settings controlling system gain and frequency response
that must be carefully documented. The University of Utah Seismic Net-
works is quite confident in the transfer functions for the data set provided.

3. Data preparation and regression
3.1 Objective of regression analysis
We will perform a regression using a large data set of recordings to
obtain the dependence of the ground motion parameters on distance to
derive a regional predictive relationship that can be compared to those
obtained for other regions.
A general form of the observed ground motion is the multiplicative
effect of source, path, and site, which is additive in a logarithmic sense:
��� ��� ��������� ��� ������� � � ��� � ���� � �
Using this relationship to describe our observations, we invert the linear
system to obtain estimates of source, path (attenuation), and site terms.
The propagation term,� ���� � �
, is a function of distance�
and frequency�
.
It can be modeled in terms of geometrical spreading � ��� and frequency
dependent anelastic attenuation through a����� �
term. Propagation fac-
tors such as the existence of geological structures that affect efficient trans-
mission of the seismic energy on a regional scale are included in these
two components. The source term,������� �
, reflects the generation of the
ground motion by the source and the site term,������� ��� �
, reflects the local
modification of the ground motion at the recording site.
Researchers often pre-define the functional dependence of � � ��� for the
region of interest. This fundamental assumption often requires� �
�at short
distances for body waves and� �
��� �
at larger distances for surface waves.
Atkinson (1993) used a trilinear geometrical spreading since her data were
fit better with an��
intermediate trend between the� �
�and
� ���� �
trends
26

27
at intermediate distances. The choice of distances where the form of the
geometrical spreading changes is intimately connected to the final choice
of the� � � �
function. In our work, we defer the choice of � ��� and� � � �
to a
second stage of processing, and initially require that� ���� � �
be a piecewise
linear continuous function which the data are permitted to define.
Because of concerns about instrument response and unknown source
and site effects, we also apply the coda normalization technique (Aki,
1980; Frankel et al., 1990) to provide an estimate of the� � ��� � �
that should
be independent of these unknowns. The coda normalization technique di-
vides the the amplitude of the S or Lg wave amplitude by that of coda
wave envelope level. For a linear system, this removes the frequency de-
pendent instrument gain, source excitation, and site amplification effects.
The peak S-wave arrival amplitude, � � (r,f), and the RMS coda wave level,
��� � � ��� � � , at a reference time� � is used to compute the ratio:
��� ��� � ��� � � � � � � � � ���� � ���� � � ��� � �
which can be modeled as
��� ��� � � ��� � ��� ���� � ��!� � � ��� � ��
���� ��� � �
where � � ���� ��� is the peak amplitude of the shear wave, and���� ��� � � is coda
envelope. Usually� � is chosen greater than about twice the direct S wave
travel time at which the coda level is independent of the source-receiver
distance. Through this procedure, the normalized amplitudes yield an
initial� ���� ���
. Therefore, amplitudes of different events and paths can be
combined on the same plot for each frequency.
Because the site term may include the effect of unknown instrument
response, we hope that the obtained� ���� ���
by coda normalization is an

28
independent, unbiased estimate of the true� � � � � �
. The path term is forced
to be zero at the reference distance at 40 km in this study. The reference
distance is usually chosen at a point within the distance distribution of
observations. This initial� � � � � �
is used to start a damped least-squares
regression to give results of source, site, and distance functions.
3.2 Initial data preparation
We only used unclipped and high signal/noise ratio data. The selected
waveforms must have both P and S waves. We set origin time, computed
distances, and removed the instrument response, as described in Chapter
2.
3.3 Trace analysis
For each waveform, the arrival times of P and S waves were picked for
two reasons. First to provide a quick check on the event location by using
the difference in P- and S-wave arrival times to estimate the epicentral dis-
tance. The other reason is that an analysis of peak S-wave motion requires
knowledge of where the S wave actually begins.
To study the frequency dependence of ground motion, each waveform
was filtered about a center frequency,� � , by an 8-pole highpass causal But-
terworth filter with corner frequency at� � �� �
�Hz, followed by an 8-pole
lowpass Butterworth filter with corner frequency at� � � � Hz. The center
frequencies used were 1, 2, 3, 4, 6, 8, 10, 12, 14 and 16 Hz. The peak filtered
ground velocity was saved. In addition a duration window was defined in
terms of the 5% and 75% bounds of the normalized integral signal-squared

29
following the S arrival. The signal within this window was Fourier trans-
formed, and a smoothed estimate of the Fourier velocity spectra was made
between the two filter corners for each center frequency. For each filter
frequency, the peak filtered motion, Fourier velocity spectra, duration and
signal envelope were tabulated for use in later processing. The reason
for saving this information is to be able to use Random Vibration Theory
(Boore, 1983) later which relates spectral amplitudes and duration to peak
motion.
3.4 Quality control steps for entire data set
The source-receiver distance distribution for the whole dataset is shown
in Figure 3.1. The y-axis of the plot displays the station names, and the x-
axis shows the source-receiver hypocentral distance. The chosen data set
has good overlapping distance sampling by stations which is required for
a stable inversion.
3.5 Regression
Although the observed ground motion is the multiplicative effect of
source, path and site, it is a linear expression in terms of logarithms:
� � ��� � � � � � � � � � � ��� � � � � ���� � � � � ���� � �
This equation is now modified to emphasize observations. The logarithm
of the observed ground motion parameter is a combined effect of site, ex-
citation, and propagation:
� � ��� � � � ��� � ��� � ���� ����� � � � � � �

30
HYPOCENTRAL DISTANCE (km)0 50 100 150 200 250 350 400 450 500
B E IBHUEBHUNBHUZBMUT BTU CWU DAU DCUDUGEDUGMdugeDUGNdugnDUGVDUGZdugz DWUECRI EKUEMUEEMUNEMUVEMUZ EPU FLU FPU FSUGMUEGMUNGMUZ GRDGZUEGZUNGZUZ HDUHHAIHLJEHLJNHLJZHONU HRU HTU I C U IMUJLUEJLUNJLUZ KLJ LDJLEVU LTU MCU MHD M L I MMUMOUT MSUMTUTNAIUNLUZNMUENMUNNMUVNMUZ N P IOWUT P T I PTURBUZRCJERCJNRCJZRSUTARUTSAIU SGUSKYMSLCESLCN SNOSNUT SRUsruvs r u zsruesrums r u lsrun SUUTCUT T M I WCU WLJWMUTWTUEWTUNWTUZWVUTa h i ea h i na h i zc t u ectumctunc t u zhvuehvumh v u lhvunhvuzknbeknbnknbzmpuempunmpuzmvuemvunmvuznoqenoqnnoqz
Figure 3.1: Source-receiver hypocentral distance distribution of observedstation for the data recorded along the seismic network

31
where�
and�
are the hypocentral distance and the observed frequency.� � � � � �
is the excitation term. The term excitation is used since the regres-
sion only defines the scaling of observed ground motions and says nothing
directly about the seismic source.� ���� ���
represents the site term. The true
separation of those terms is hard due to the trade-offs. We use a piecewise
linear function (Anderson and Lei, 1994: Harmsen, 1997) to represent the
distance dependence of observed motion,� � � � � �
, at a fixed frequency,� � :
� � � � � � � ���� � ���
� ��� � �
where �� � ���
is a linear interpretation function and����
� � � � � � �are node
values. We prefer to use a large number of nodes, � , so that the regres-
sion can fit any curvature in the actual distance dependence. The ground
motion regression model is now written as
� � � � � ��� ��� � ��� � � � � � � � � ��� � ���� � ��� �� � � ���� � ��� � �
This linear system can be solved by a least squares inversion using sin-
gular value decomposition (SVD). The following constraints are used in
this study to reduce the number of degrees of freedom of the system to
permit a stable inversion:
� � � � � � � � �, where
� � � � � � �km. The chosen reference distance
should be large enough to avoid the effect of source depth error on
the hypocentral distance. Since these results will be compared to
similar studies in other regions, the reference distance should also be
less than distances where regional variations in geometrical spread-
ing predominate.

32
� � � � � � � � � �. There is a direct trade-off between a DC offset in all
site terms and the excitation. This is just one of many constraints that
could be applied. Often if the geologic site characterisitcs are known,
the constraint� � � � ��� ��� � � � � �
is used.
A smoothing constraint is applied to the� � ���
. We use���
�� �
� ��� ����� � � �
, which is only a linearity constraint if the� �
are evenly
spaced in which case it approximates a zero second derivative. For
unequally spaced nodes, it ensures a uniform variation in slope be-
tween adjacent nodes (Herrmann, 2000).
With these constraints, the regression model can be discribed in words.
Given the level of motion at� � � � ��� ��
� , the� ���� ���
propagates that mo-
tion to the desired distance,�, and the site term adjusts that motion to
a particular physical location. Other aspects of this model that must be
understood are tradeoffs between the excitation, site, and distance terms.
Two cases illustrate the problems. First, if one event dominates a distance
range, then there will be a tradeoff between the excitation for that event
and the adjacent distance terms. This occurs if an event is separated by a
distance of the network dimensions from a neighboring event and if the
distribution of distance nodes is too dense. A second case occurs if only
one station appears in a narrow range of distance it has an anomalous re-
sponse. In this case the D(r) will be distorted by this station and a bias
introduced in all other site terms by the site term constrain (Herrmann,
2000).

33
3.6 Regression of Fourier Velocity spectra
Figures 3.2, and 3.3 give typical examples of the regression analysis at
filter frequencies of 1.0 and 16.0 Hz on the Fourier velocity spectra data
set. It also shows the initial propagation term estimated by the coda nor-
malization technique. The initial and final propagation functionals show
good agreement for the Fourier velocity spectra data set at all distances at
1.0 Hz and at most distances for 16 Hz. The regression residual plot shows
that the distance nodes were appropriate to determine D(r).
Figure 3.4 shows the vertical component distance scaling of the D(r)
term at the ten different frequencies for regression on the Fourier velocity
spectra. The piecewise linear segments in the D(r) are now apparent, For
clarity the regression error bars on D(r) are not plotted. This figure is cor-
rected for an� �
�trend to emphasize departure (scattering, deviation) of
high frequency spectra with distance from� �
�spreading. As expected the
16 Hz signal decreases more rapidly with distance than lower frequencies.
The anomalous spike at 135 km is not accounted for by the error bars and
may be the effect of just one anomalous station.
Table 3.1, Table 3.2, and Table 3.3 give the numerical results of our re-
gression on the regional attenuation functional of Fourier Velocity spectra
for Utah. They give the corresponding value D(r) for each frequency and
distance as well as the number of observations available at the specific
distance (within each distance bin).

34
1 0 1 1 0 2 1 0 3
HYPOCENTRAL DISTANCE (Km)
-1
.00
0.0
0
FIN
AL
RE
SID
UA
L1
.00
0 1 H Z
1 0 1 1 0 2 1 0 3
-2
.00
0.0
0
Me
an
D(r
) 2.0
0
U T A H - F o u r i e r V e l o c i t y 0 1 H zI n i t i a l
F i n a l
1 0 1 1 0 2 1 0 3
-2
.00
0.0
0
D(
r)
2.0
0
R a w D ( r )
I n i t i a l
Figure 3.2: Regression analysis for 1.0 Hz. Top, initial estimate of D(r)using coda normalization technique. Middle, initial and final propagationfunctionals. Bottom, final residuals of the regression analysis

35
1 0 1 1 0 2 1 0 3
HYPOCENTRAL DISTANCE (Km)
-1
.00
0.0
0
FIN
AL
RE
SID
UA
L1
.00
1 6 H Z
1 0 1 1 0 2 1 0 3
-2
.00
0.0
0
Me
an
D(r
) 2.0
0
U T A H - F o u r i e r V e l o c i t y 1 6 H zI n i t i a l
F i n a l
1 0 1 1 0 2 1 0 3
-2
.00
0.0
0
D(
r)
2.0
0
R a w D ( r )
I n i t i a l
Figure 3.3: Regression analysis for 16 Hz. Top, initial estimate of D(r)using coda normalization technique. Middle, initial and final propagationfunctionals. Bottom, final residuals of the regression analysis

36
1 0 1 10 2 10 3
HYPOCENTRAL DISTANCE (km)
-2
.00
-1
.50
-1
.00
log
(r
/40
)+
D(
r)
-0
.50
0.0
00
.50
1.0
0
1234681 0121416
f n ( H z )UTAHF o u r i e r A m p l i t u d e D ( r ) f o r f n
Figure 3.4: Attenuation functional� ���� � �
obtained from the regression ofthe Fourier amplitudes at the frequencies of 1.0, 2.0, 3.0, 4.0, 6.0, 8.0,10.0, 12.0, 14.0, and 16.0 Hz. The reference hypocentral distance is at 40km.

37
Utah Fourier Velocity Spectra D(r)f (Hz) r (km)
��� ��� ��� � Nobs f (Hz) r (km)��� ��� ��� � Nobs
1.0 10 0.901 0.047 26.5 2.0 10 0.990 0.040 30.91.0 20 0.500 0.032 99.1 2.0 20 0.560 0.027 121.21.0 30 0.225 0.016 160.8 2.0 30 0.254 0.013 181.41.0 40 0.000 0.000 110.5 2.0 40 0.000 0.000 133.31.0 50 -0.102 0.031 308.5 2.0 50 -0.133 0.026 338.91.0 75 -0.367 0.028 484.5 2.0 75 -0.440 0.024 530.31.0 90 -0.429 0.035 114.5 2.0 90 -0.440 0.028 154.01.0 105 -0.410 0.035 98.7 2.0 105 -0.429 0.030 129.41.0 120 -0.488 0.035 105.9 2.0 120 -0.557 0.028 144.91.0 135 -0.545 0.036 95.5 2.0 135 -0.543 0.030 120.71.0 150 -0.610 0.035 124.9 2.0 150 -0.733 0.030 142.61.0 175 -0.609 0.031 211.7 2.0 175 -0.713 0.027 236.41.0 200 -0.770 0.033 210.3 2.0 200 -0.959 0.029 234.11.0 250 -0.957 0.037 114.6 2.0 250 -1.058 0.033 132.31.0 300 -1.048 0.039 114.6 2.0 300 -1.250 0.035 117.31.0 400 -1.350 0.058 43.5 2.0 400 -1.628 0.053 44.33.0 10 1.005 0.039 31.7 4.0 10 0.986 0.037 32.13.0 20 0.569 0.026 128.8 4.0 20 0.557 0.025 131.03.0 30 0.259 0.013 186.2 4.0 30 0.253 0.013 190.63.0 40 0.000 0.000 140.2 4.0 40 0.000 0.000 143.03.0 50 -0.160 0.026 347.0 4.0 50 -0.148 0.025 354.83.0 75 -0.412 0.023 545.2 4.0 75 -0.394 0.022 547.93.0 90 -0.406 0.027 163.9 4.0 90 -0.419 0.026 165.83.0 105 -0.474 0.029 133.1 4.0 105 -0.513 0.028 134.83.0 120 -0.551 0.028 155.7 4.0 120 -0.583 0.027 157.13.0 135 -0.564 0.030 123.7 4.0 135 -0.606 0.029 124.83.0 150 -0.767 0.030 145.0 4.0 150 -0.789 0.029 146.63.0 175 -0.763 0.026 237.5 4.0 175 -0.858 0.025 237.63.0 200 -1.027 0.028 232.9 4.0 200 -1.073 0.027 231.73.0 250 -1.159 0.032 131.8 4.0 250 -1.250 0.031 131.63.0 300 -1.394 0.034 117.3 4.0 300 -1.531 0.033 117.23.0 400 -1.821 0.053 44.3 4.0 400 -1.976 0.051 44.3
Table 3.1: Attenuation functional at 1.0, 2.0, 3.0, and 4.0 Hz for FourierVelocity spectra. The columns give values of frequency (first and sixthcolumns), hypocentral distance (second and seventh columns), attenua-tion D(r,f) at a reference distance of 40 km (third and eighth columns), as-sociated error bar (fourth and ninth columns) and number of observations(fifth and tenth columns).

38
Utah Fourier Velocity Spectra D(r)f (Hz) r (km)
��� ��� ��� � Nobs f (Hz) r (km)��� ��� ��� � Nobs
6.0 10 1.020 0.038 32.3 8.0 10 1.013 0.043 31.36.0 20 0.580 0.025 132.5 8.0 20 0.575 0.028 130.56.0 30 0.264 0.013 193.4 8.0 30 0.262 0.014 186.56.0 40 0.000 0.000 146.2 8.0 40 0.000 0.000 141.66.0 50 -0.102 0.025 351.1 8.0 50 -0.078 0.029 312.86.0 75 -0.376 0.023 540.7 8.0 75 -0.372 0.026 472.56.0 90 -0.422 0.027 167.1 8.0 90 -0.438 0.030 164.96.0 105 -0.528 0.029 127.3 8.0 105 -0.584 0.034 116.96.0 120 -0.650 0.027 156.5 8.0 120 -0.678 0.030 154.76.0 135 -0.655 0.029 125.7 8.0 135 -0.682 0.033 121.26.0 150 -0.811 0.029 146.3 8.0 150 -0.824 0.033 142.66.0 175 -0.942 0.026 232.6 8.0 175 -0.978 0.029 220.76.0 200 -1.166 0.028 226.7 8.0 200 -1.223 0.032 211.96.0 250 -1.382 0.032 127.3 8.0 250 -1.456 0.038 112.06.0 300 -1.722 0.035 111.8 8.0 300 -1.833 0.040 98.66.0 400 -2.254 0.053 42.5 8.0 400 -2.269 0.070 31.3
10.0 10 1.002 0.043 30.3 12.0 10 0.988 0.050 28.910.0 20 0.568 0.028 123.2 12.0 20 0.558 0.033 104.110.0 30 0.258 0.014 173.2 12.0 30 0.254 0.017 149.710.0 40 0.000 0.000 129.6 12.0 40 0.000 0.000 111.710.0 50 -0.090 0.030 279.9 12.0 50 -0.064 0.035 244.510.0 75 -0.428 0.027 430.9 12.0 75 -0.455 0.032 370.210.0 90 -0.445 0.030 154.7 12.0 90 -0.441 0.036 128.010.0 105 -0.618 0.034 107.3 12.0 105 -0.671 0.041 83.710.0 120 -0.720 0.031 140.1 12.0 120 -0.781 0.038 90.910.0 135 -0.696 0.035 101.7 12.0 135 -0.684 0.044 77.810.0 150 -0.909 0.034 123.2 12.0 150 -0.976 0.040 100.410.0 175 -1.031 0.031 183.4 12.0 175 -1.055 0.038 133.810.0 200 -1.345 0.034 182.1 12.0 200 -1.370 0.040 138.110.0 250 -1.580 0.040 92.7 12.0 250 -1.703 0.051 65.210.0 300 -1.931 0.046 66.5 12.0 300 -1.860 0.059 45.010.0 400 -2.365 0.079 22.2 12.0 400 -2.461 0.103 16.1
Table 3.2: Attenuation functional at 6.0, 8.0, 10.0, and 12.0 Hz for FourierVelocity spectra. The columns give values of frequency (first and sixthcolumns), hypocentral distance (second and seventh columns), attenua-tion D(r,f) at a reference distance of 40 km (third and eighth columns), as-sociated error bar (fourth and ninth columns) and number of observations(fifth and tenth columns).
39
Utah Fourier Velocity Spectra D(r)f (Hz) r (km)
��� ��� ��� � Nobs f (Hz) r (km)��� ��� ��� � Nobs
14.0 10 0.960 0.058 28.2 16.0 10 0.954 0.070 27.014.0 20 0.540 0.038 90.0 16.0 20 0.535 0.046 86.514.0 30 0.244 0.019 133.3 16.0 30 0.242 0.023 122.014.0 40 0.000 0.000 97.9 16.0 40 0.000 0.000 87.014.0 50 -0.044 0.041 205.5 16.0 50 -0.024 0.049 183.914.0 75 -0.463 0.040 304.9 16.0 75 -0.466 0.048 272.214.0 90 -0.442 0.044 108.7 16.0 90 -0.428 0.055 89.414.0 105 -0.697 0.050 67.6 16.0 105 -0.739 0.061 55.414.0 120 -0.814 0.046 71.6 16.0 120 -0.796 0.057 60.214.0 135 -0.596 0.060 55.7 16.0 135 -0.562 0.074 48.014.0 150 -0.944 0.048 81.6 16.0 150 -0.911 0.060 67.414.0 175 -1.045 0.048 98.0 16.0 175 -1.015 0.060 80.314.0 200 -1.379 0.050 92.8 16.0 200 -1.424 0.063 68.514.0 250 -1.631 0.065 43.6 16.0 250 -1.564 0.081 33.914.0 300 -1.685 0.075 32.5 16.0 300 -1.607 0.097 24.514.0 400 -2.486 0.134 12.2 16.0 400 -2.408 0.189 8.1
Table 3.3: Attenuation functional at 14.0 and 16.0 Hz for Fourier Velocityspectra. The columns give values of frequency (first and sixth columns),hypocentral distance (second and seventh columns), attenuation D(r,f) ata reference distance of 40 km (third and eighth columns), associated errorbar (fourth and ninth columns) and number of observations (fifth and tenthcolumns).
3.7 Regression of Peak Filtered velocity
Figures 3.5, and 3.6 give typical examples of the regression analysis for
the band pass filtered spectra data set at 1.0 and 16.0 Hz. It also shows the
initial propagation term estimated from the coda normalization technique.
The initial and final propagation functional shows good agreement for the
band pass filtered spectra data set. The regression residual plot is used to
see if the distance nodes was appropriate to determine D(r). Fourier ve-
locity spectra residuals show slightly less scatter than band-pass filtered
residuals and residuals of two data sets increase at higher frequencies.
Residual values are high at a distance of 135 km for both data sets.
Figure 3.7 shows the vertical component distance scaling of the peak
filtered velocity D(r) term at ten different frequencies for the Utah region.

40
1 0 1 1 0 2 1 0 3
HYPOCENTRAL DISTANCE (Km)
-1
.00
0.0
0
FIN
AL
RE
SID
UA
L1
.00
0 1 H Z
1 0 1 1 0 2 1 0 3
-2
.00
0.0
0
Me
an
D(r
) 2.0
0
U T A H - B a n d P a s s 0 1 H z I n i t i a l
F i n a l
1 0 1 1 0 2 1 0 3
-2
.00
0.0
0
D(
r)
2.0
0
R a w D ( r )
I n i t i a l
Figure 3.5: Regression analysis for 1.0 Hz. Top, initial estimate of D(r)using coda normalization technique. Middle, initial and final propagationfunctionals. Bottom, final residuals of the regression analysis

41
1 0 1 1 0 2 1 0 3
HYPOCENTRAL DISTANCE (Km)
-1
.00
0.0
0
FIN
AL
RE
SID
UA
L1
.00
1 6 H Z
1 0 1 1 0 2 1 0 3
-2
.00
0.0
0
Me
an
D(r
) 2.0
0
U T A H - B a n d P a s s 1 6 H z I n i t i a l
F i n a l
1 0 1 1 0 2 1 0 3
-2
.00
0.0
0
D(
r)
2.0
0
R a w D ( r )
I n i t i a l
Figure 3.6: Regression analysis for 16 Hz. Top, initial estimate of D(r)using coda normalization technique. Middle, initial and final propagationfunctionals. Bottom, final residuals of the regression analysis

42
This D(r) values are corrected for an� �
�trend to emphasize departure
from simple� �
�spreading.
Table 3.4, Table 3.5, and Table 3.6 give the numerical results of our re-
gression on the regional attenuation functional for the Utah. They give the
corresponding value of D(r) for each frequency and distance as well as the
number of observations contributing to each node.
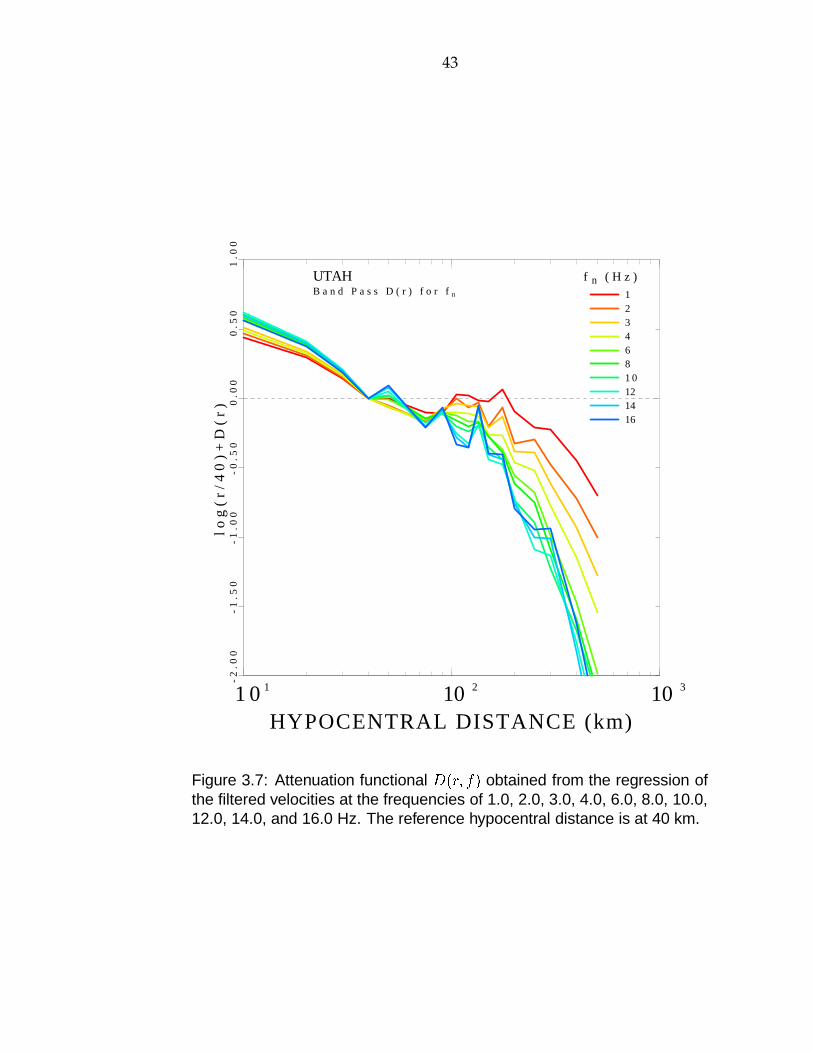
43
1 0 1 10 2 10 3
HYPOCENTRAL DISTANCE (km)
-2
.00
-1
.50
-1
.00
log
(r
/40
)+
D(
r)
-0
.50
0.0
00
.50
1.0
0
1234681 0121416
f n ( H z )UTAHB a n d P a s s D ( r ) f o r f n
Figure 3.7: Attenuation functional� ���� � �
obtained from the regression ofthe filtered velocities at the frequencies of 1.0, 2.0, 3.0, 4.0, 6.0, 8.0, 10.0,12.0, 14.0, and 16.0 Hz. The reference hypocentral distance is at 40 km.
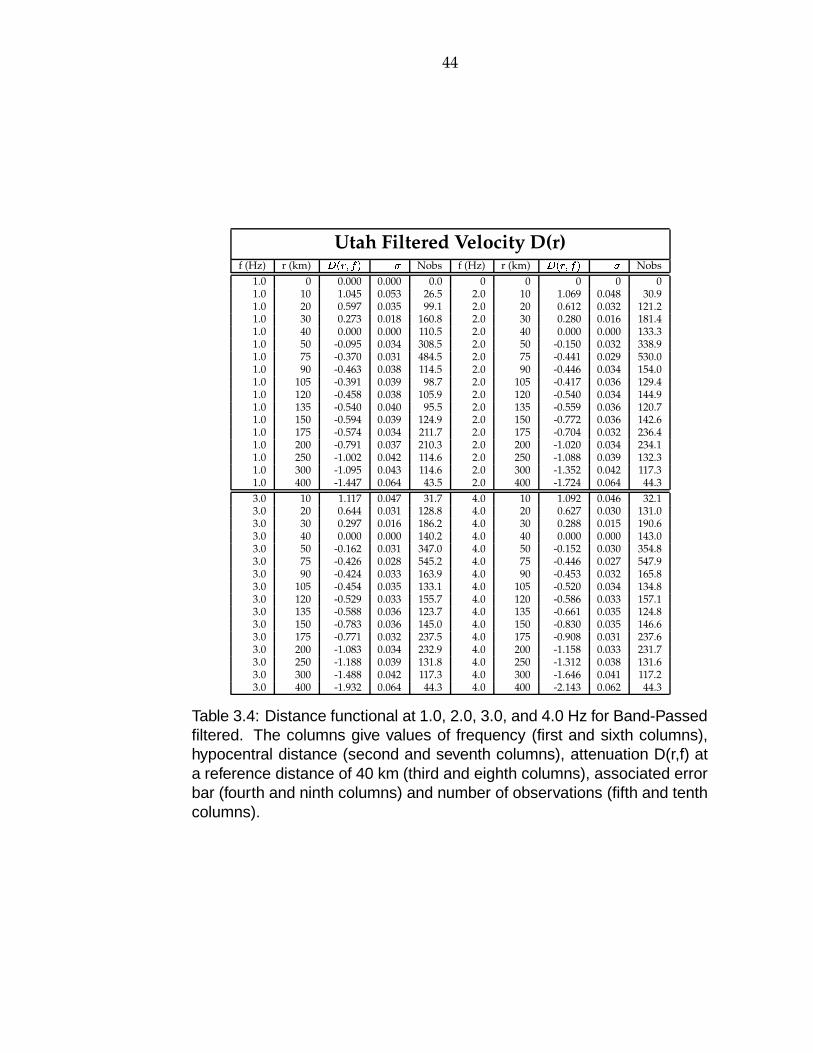
44
Utah Filtered Velocity D(r)f (Hz) r (km)
��� ��� ��� � Nobs f (Hz) r (km)��� ��� ��� � Nobs
1.0 0 0.000 0.000 0.0 0 0 0 0 01.0 10 1.045 0.053 26.5 2.0 10 1.069 0.048 30.91.0 20 0.597 0.035 99.1 2.0 20 0.612 0.032 121.21.0 30 0.273 0.018 160.8 2.0 30 0.280 0.016 181.41.0 40 0.000 0.000 110.5 2.0 40 0.000 0.000 133.31.0 50 -0.095 0.034 308.5 2.0 50 -0.150 0.032 338.91.0 75 -0.370 0.031 484.5 2.0 75 -0.441 0.029 530.01.0 90 -0.463 0.038 114.5 2.0 90 -0.446 0.034 154.01.0 105 -0.391 0.039 98.7 2.0 105 -0.417 0.036 129.41.0 120 -0.458 0.038 105.9 2.0 120 -0.540 0.034 144.91.0 135 -0.540 0.040 95.5 2.0 135 -0.559 0.036 120.71.0 150 -0.594 0.039 124.9 2.0 150 -0.772 0.036 142.61.0 175 -0.574 0.034 211.7 2.0 175 -0.704 0.032 236.41.0 200 -0.791 0.037 210.3 2.0 200 -1.020 0.034 234.11.0 250 -1.002 0.042 114.6 2.0 250 -1.088 0.039 132.31.0 300 -1.095 0.043 114.6 2.0 300 -1.352 0.042 117.31.0 400 -1.447 0.064 43.5 2.0 400 -1.724 0.064 44.33.0 10 1.117 0.047 31.7 4.0 10 1.092 0.046 32.13.0 20 0.644 0.031 128.8 4.0 20 0.627 0.030 131.03.0 30 0.297 0.016 186.2 4.0 30 0.288 0.015 190.63.0 40 0.000 0.000 140.2 4.0 40 0.000 0.000 143.03.0 50 -0.162 0.031 347.0 4.0 50 -0.152 0.030 354.83.0 75 -0.426 0.028 545.2 4.0 75 -0.446 0.027 547.93.0 90 -0.424 0.033 163.9 4.0 90 -0.453 0.032 165.83.0 105 -0.454 0.035 133.1 4.0 105 -0.520 0.034 134.83.0 120 -0.529 0.033 155.7 4.0 120 -0.586 0.033 157.13.0 135 -0.588 0.036 123.7 4.0 135 -0.661 0.035 124.83.0 150 -0.783 0.036 145.0 4.0 150 -0.830 0.035 146.63.0 175 -0.771 0.032 237.5 4.0 175 -0.908 0.031 237.63.0 200 -1.083 0.034 232.9 4.0 200 -1.158 0.033 231.73.0 250 -1.188 0.039 131.8 4.0 250 -1.312 0.038 131.63.0 300 -1.488 0.042 117.3 4.0 300 -1.646 0.041 117.23.0 400 -1.932 0.064 44.3 4.0 400 -2.143 0.062 44.3
Table 3.4: Distance functional at 1.0, 2.0, 3.0, and 4.0 Hz for Band-Passedfiltered. The columns give values of frequency (first and sixth columns),hypocentral distance (second and seventh columns), attenuation D(r,f) ata reference distance of 40 km (third and eighth columns), associated errorbar (fourth and ninth columns) and number of observations (fifth and tenthcolumns).

45
Utah Filtered Velocity D(r)f (Hz) r (km)
��� ��� ��� � Nobs f (Hz) r (km)��� ��� ��� � Nobs
6.0 10 1.176 0.045 32.3 8.0 10 1.187 0.050 31.36.0 20 0.684 0.030 132.5 8.0 20 0.691 0.033 130.56.0 30 0.316 0.015 193.4 8.0 30 0.320 0.017 186.56.0 40 0.000 0.000 146.2 8.0 40 0.000 0.000 141.66.0 50 -0.105 0.030 351.1 8.0 50 -0.072 0.034 312.86.0 75 -0.420 0.027 540.7 8.0 75 -0.415 0.031 472.56.0 90 -0.450 0.032 167.1 8.0 90 -0.460 0.035 164.96.0 105 -0.540 0.035 127.3 8.0 105 -0.575 0.040 116.96.0 120 -0.646 0.033 156.5 8.0 120 -0.680 0.035 154.76.0 135 -0.695 0.035 125.7 8.0 135 -0.702 0.039 121.26.0 150 -0.846 0.035 146.3 8.0 150 -0.851 0.038 142.66.0 175 -1.006 0.031 232.6 8.0 175 -1.032 0.035 220.76.0 200 -1.252 0.034 226.7 8.0 200 -1.309 0.038 211.96.0 250 -1.473 0.039 127.3 8.0 250 -1.543 0.044 112.06.0 300 -1.860 0.042 111.8 8.0 300 -1.965 0.047 98.66.0 400 -2.471 0.064 42.5 8.0 400 -2.595 0.083 31.3
10.0 10 1.207 0.051 30.3 12.0 10 1.222 0.058 28.910.0 20 0.704 0.034 123.2 12.0 20 0.715 0.038 104.110.0 30 0.327 0.017 173.2 12.0 30 0.332 0.019 149.710.0 40 0.000 0.000 129.6 12.0 40 0.000 0.000 111.710.0 50 -0.078 0.035 279.9 12.0 50 -0.045 0.040 244.510.0 75 -0.444 0.032 430.9 12.0 75 -0.482 0.037 370.210.0 90 -0.463 0.036 154.7 12.0 90 -0.452 0.042 128.010.0 105 -0.620 0.041 107.3 12.0 105 -0.668 0.048 83.710.0 120 -0.715 0.037 140.1 12.0 120 -0.803 0.044 90.910.0 135 -0.725 0.042 101.7 12.0 135 -0.714 0.051 77.810.0 150 -0.926 0.041 123.2 12.0 150 -1.011 0.046 100.410.0 175 -1.079 0.037 183.4 12.0 175 -1.119 0.043 133.810.0 200 -1.433 0.040 182.1 12.0 200 -1.421 0.046 138.110.0 250 -1.688 0.048 92.7 12.0 250 -1.882 0.059 65.210.0 300 -2.097 0.055 66.5 12.0 300 -2.010 0.069 45.010.0 400 -2.672 0.095 22.2 12.0 400 -2.755 0.120 16.1
Table 3.5: Distance functional at 6.0, 8.0, 10.0, and 12.0 Hz for Band-Passed Filtered. The columns give values of frequency (first and sixthcolumns), hypocentral distance (second and seventh columns), attenua-tion D(r,f) at a reference distance of 40 km (third and eighth columns), as-sociated error bar (fourth and ninth columns) and number of observations(fifth and tenth columns).

46
Utah Filtered Velocity D(r)f (Hz) r (km)
��� ��� ��� � Nobs f (Hz) r (km)��� ��� ��� � Nobs
14.0 10 1.203 0.065 28.2 16.0 10 1.165 0.075 27.014.0 20 0.701 0.043 90.0 16.0 20 0.676 0.050 86.514.0 30 0.325 0.022 133.3 16.0 30 0.313 0.025 122.014.0 40 0.000 0.000 97.9 16.0 40 0.000 0.000 87.014.0 50 -0.014 0.047 205.5 16.0 50 -0.003 0.053 183.914.0 75 -0.477 0.045 304.9 16.0 75 -0.483 0.052 272.214.0 90 -0.433 0.049 108.7 16.0 90 -0.418 0.060 89.414.0 105 -0.702 0.056 67.6 16.0 105 -0.750 0.066 55.414.0 120 -0.830 0.051 71.6 16.0 120 -0.833 0.062 60.214.0 135 -0.597 0.067 55.7 16.0 135 -0.581 0.080 48.014.0 150 -0.981 0.055 81.6 16.0 150 -0.973 0.065 67.414.0 175 -1.079 0.054 98.0 16.0 175 -1.046 0.065 80.314.0 200 -1.457 0.057 92.8 16.0 200 -1.490 0.069 68.514.0 250 -1.797 0.073 43.6 16.0 250 -1.737 0.088 33.914.0 300 -1.884 0.085 32.5 16.0 300 -1.812 0.105 24.514.0 400 -2.821 0.151 12.2 16.0 400 -2.625 0.205 8.1
Table 3.6: Distance functional at 14.0 and 16.0 Hz for Band-Passed Fil-tered. The columns give values of frequency (first and sixth columns),hypocentral distance (second and seventh columns), attenuation D(r,f) ata reference distance of 40 km (third and eighth columns), associated errorbar (fourth and ninth columns) and number of observations (fifth and tenthcolumns).
3.8 Duration
The duration of strong ground motion can have a strong influence on
earthquake damage. A ground motion with moderate amplitude but long
duration can produce enough load reversals to cause substantial damage
(Kramer, 1996). Properly studied observed ground motions enable us to
characterize the distance and frequency band influence on duration.
Duration is a function of the rupture and of the dispersion that elas-
tic waves experience along source and receivers paths (Herrmann, 1985).
Scattering also contributes to the increase in duration at increasing dis-
tances from the source. Dispersion redistributes the frequency content of
the radiated spectrum (Malagnini, 1999) in time. As a result, the duration
increases with increasing earthquake magnitude and distance. Trifunac

47
and Brady (1975) define duration on the time interval between the points
at which 5 % and 95 % of the total energy has been recorded. Various
other estimates duration (T) are fully described in Kramer (1996). Only
the strong-motion portion of the accelerogram is important for engineer-
ing purposes.
We used integrated square filtered velocity to estimate signal duration.
Integration starts at the S arrival time and continues into the coda. The
signal within 5 % - 75 % limits is Fourier transformed and RMS averaged
between the filter corners to yield the Fourier velocity spectra in �� � � � �
.
Thus the Fourier velocity spectra observation is intimately related to the
duration determination (Raoof et al, 1999).
We used the 5 % - 75 % duration of the seismic ground motion through-
out this study for all the available recording. Raoof et al., (1999) used 5 %
- 75 % duration window and test results indicated that it provided bet-
ter agreement between observed and RVT predicted peak values instead
of using 5 % - 95 % duration. The advantage using a duration based on
the 5 - 75 % integral rather than 5 - 95 % of Atkinson and Boore (1995) is
discussed by Raoof et al. (1999).
Figures 3.8 and 3.9 show the observed durations at 1.0 and 16.0 Hz. We
noted significant scatter at 1.0 Hz which decreased at higher frequencies.
At higher frequencies though, small signals due to attenuation did not
permit a reliable estimation of duration at large distance.
To estimate the distance dependence of duration, we modeled it as a
piecewise linear function of distance.
� ��� � � �� � � � ��� � ���
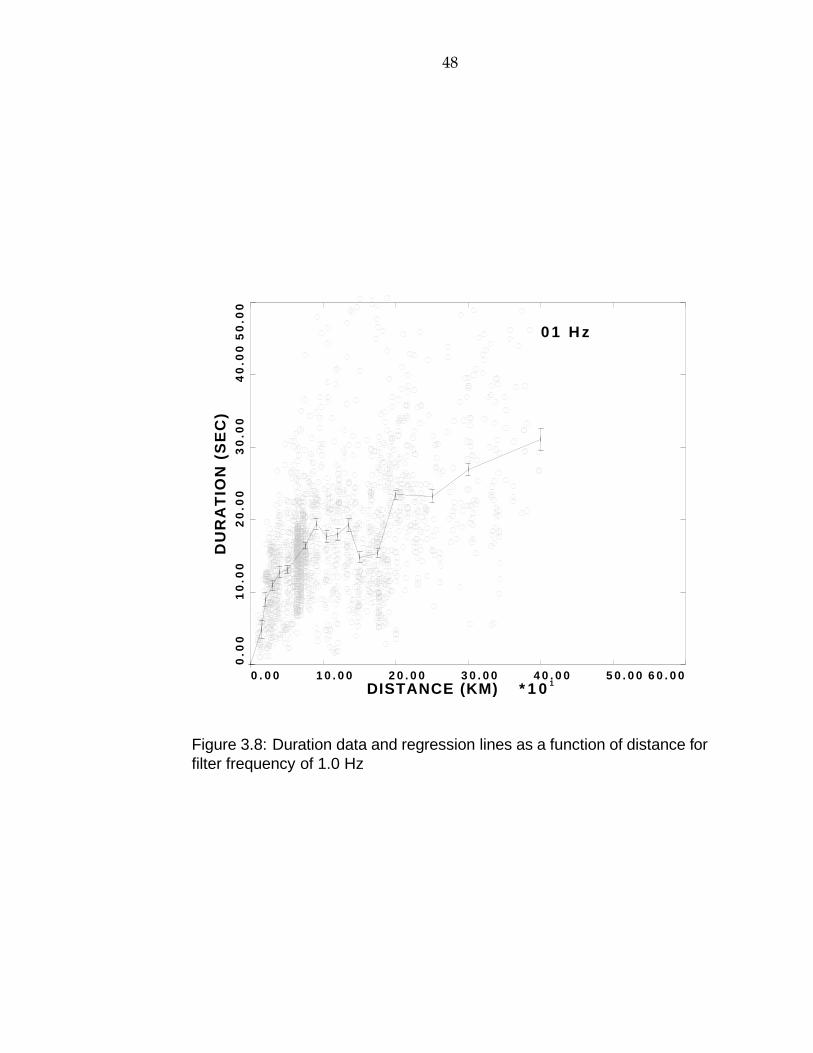
48
0 . 0 0 1 0 . 0 0 2 0 . 0 0 3 0 . 0 0DISTANCE (KM) * 1 0 1
4 0 . 0 0 5 0 . 0 0 6 0 . 0 0
0.0
01
0.0
02
0.0
03
0.0
0
DU
RA
TIO
N (
SE
C)
40
.00
50
.00
0 1 H z
Figure 3.8: Duration data and regression lines as a function of distance forfilter frequency of 1.0 Hz

49
0 . 0 0 1 0 . 0 0 2 0 . 0 0 3 0 . 0 0DISTANCE (KM) * 1 0 1
4 0 . 0 0 5 0 . 0 0 6 0 . 0 0
0.0
01
0.0
02
0.0
03
0.0
0
DU
RA
TIO
N (
SE
C)
40
.00
50
.00
1 6 H z
Figure 3.9: Duration data and regression lines as a function of distance forfilter frequency of 16 Hz

50
The only constraint is that� � � � ��
�� � �
which we feel appropriate for
small earthquakes. We solved this by least-squares even though Malagnini
(1999) proposed the use of an L1 norm because of the scatter. To deter-
mine the� ���
duration function, we assumed the measured duration is
relatively insensitive to event size for small earthquakes. RVT predictions
depend on the assumed signal duration:
� � � � ���
where� � is the source contribution and
� � ���is the distance dependent
wave propagation contribution to total duration. Predictions for larger
earthquakes will use a sufficiently large� � that overwhelms the
� �� ���
�� � �
constraint at short distance (Herrmann, 1985). The least squares
fits are plotted in Figures 3.8 and 3.9. The T(r) functional are compared in
Figure 3.10 for all the filter frequencies and tabulated in Table 3.7. There is
much scatter in the automatic determination of scattering because of the
rapid decrease of high frequency signals with distance. We can only de-
termine the 16 Hz duation reliably out to 250 km. The 1 Hz values are
observed at large distances, but show a lot of scatter. This is similar to the
observations of Raoof et al. (1999). The dark line is adequate for describ-
ing all frequencies greater than 1.0 Hz except near 75 km, which may be
affected by mining related events at that distance.
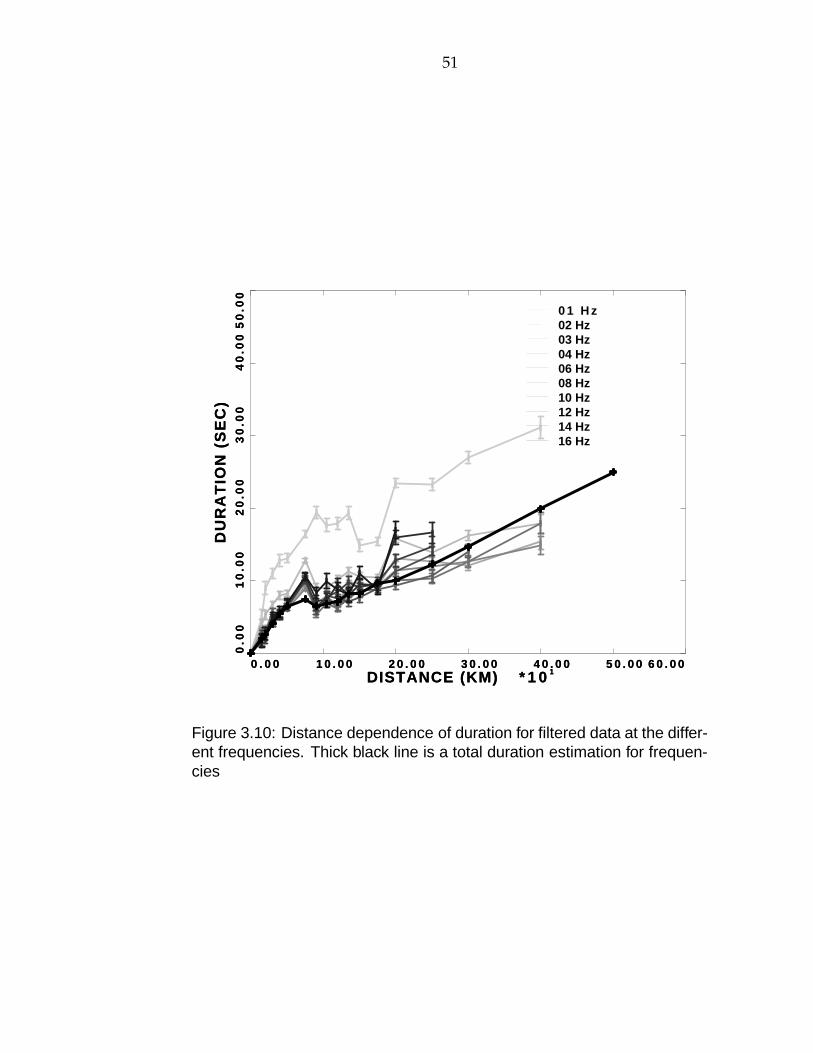
51
0 . 0 0 1 0 . 0 0 2 0 . 0 0 3 0 . 0 0DISTANCE (KM) * 1 0 1
4 0 . 0 0 5 0 . 0 0 6 0 . 0 0
0.0
01
0.0
02
0.0
03
0.0
0
DU
RA
TIO
N (
SE
C)
40
.00
50
.00
0 1 H z02 Hz03 Hz04 Hz06 Hz08 Hz10 Hz12 Hz14 Hz16 Hz
0 . 0 0 1 0 . 0 0 2 0 . 0 0 3 0 . 0 0DISTANCE (KM) * 1 0 1
4 0 . 0 0 5 0 . 0 0 6 0 . 0 0
0.0
01
0.0
02
0.0
03
0.0
0
DU
RA
TIO
N (
SE
C)
40
.00
50
.00
Figure 3.10: Distance dependence of duration for filtered data at the differ-ent frequencies. Thick black line is a total duration estimation for frequen-cies

52
Durations for different frequencies (Hz)Distance(km) 01 02 03 04 06 08 10 12 14 16 FINAL
0 0 0 0 0 0 0 0 0 0 0 015 4.8 3.9 3.0 2.7 2.0 1.7 2.3 1.8 1.8 1.7 2.020 9.0 5.3 3.3 3.0 2.6 3.0 3.0 2.0 2.5 2.7 2.630 10.9 6.6 4.6 4.1 4.1 5.7 4.2 4.6 4.7 5.0 4.140 12.8 8.0 6.1 5.4 5.4 5.3 5.4 5.3 5.4 5.7 5.450 13.1 8.3 6.5 6.2 6.5 6.3 6.4 6.8 6.8 7.0 6.575 16.5 12.8 9.2 8.9 9.8 10.3 10.4 10.0 10.6 10.6 7.590 19.4 9.1 7.0 6.3 5.4 5.7 5.9 6.5 7.3 8.3 6.5
105 17.7 8.9 7.8 7.0 6.8 7.8 7.9 7.7 7.3 9.9 6.8120 17.9 10.2 6.7 6.1 6.1 6.3 7.6 8.5 9.5 8.8 7.1135 19.3 11.3 9.6 9.3 8.2 7.5 7.2 9.8 8.0 8.2 8.2150 14.9 10.5 9.7 9.4 8.2 8.6 7.6 9.0 9.5 11.1 8.2175 15.4 10.5 9.2 9.3 9.7 8.8 9.0 9.8 9.4 8.8 9.7200 23.4 15.8 13.1 11.4 10.0 9.4 11.2 12.7 16.0 17.0 10.0250 23.3 14.0 12.7 12.0 10.3 10.7 13.7 14.8 16.6 – 12.3300 27.0 16.2 12.1 12.7 12.7 14.1 – – – – 20.0400 31.1 17.8 15.4 14.9 17.9 – – – – – 25.0
Table 3.7: Durations as a function of distance and frequency ranges from01 to 16 Hz.
3.9 Excitation
After careful observation, I noticed that the initial plots of excitation,
E��� �
, showed two different populations and decided to separate the exci-
tation in two groups. We applied a simple sieve to the excitation terms by
asking whether the 10 Hz level was significantly beneath the 3.0 Hz level.
This sieve gives the important clue for separating mining related events
from earthquakes.
Figures 3.11 and 3.13 show the excitations at 40 km of earthquakes ob-
tained from the regressions on the Fourier velocity and band passed peak
amplitudes. Figures 3.12 and 3.14 represent the explosion induced excita-
tions at 40 km for the Fourier velocity and band passed peak amplitudes.
This automatic process seems to have left a few mining related events in
the earthquake population at Figures 3.11 and 3.13.
For either source, the shapes of the Fourier velocity and filtered veloc-

53
ity excitation are different. This is due to the fact that the filtered band-
width used with frequency. Forward modeling will account for this. The
differences in frequency dependent excitation between the sources is obvi-
ous. The mining related events have significantly reduced excitation as a
function of increasing frequency. This may be due to differences between
the earthquake source and the deep mine collapses mechanisms and/or
source term function.
Figures 3.15 and 3.16 shows the earthquake and mining induced epi-
center maps in the study area. The epicenters of Figure 3.16 are those have
mining induced spectra in Figures 3.12 and 3.14, while Figure 3.15 shows
locations of presumed earthquakes. Note that there is a narrow group-
ing of mining related events. After personal communication with Walter
Arabasz at the SSA 2000 meeting in San Diego, I realized that mines of
the Colorado Plateau use room-and-pillar methods instead of blasting for
underground mining (Arabasz and McCarter, 2000). The subsequent mine
collapse may be triggered by small, nearby tectonic earthquakes collapse
or self-initiated collapse. Therefore, mining related events differ from con-
ventional earthquakes by a rapid drop of high frequency excitation spectra
and lack of Love wave excitation (Pechmann et al., 1995).
Because of concern about the effect of mining sources on our regres-
sion, we separated them from the data set and redid the regression for� ���� ���
. We did not see significant differences in the results. In the next
chapter we will model the� � ��� � �
from the entire data set.

54
1 . 0 0 5 . 7 5 1 0 . 5 0F r e q ( H Z )
1 5 . 2 5 2 0 . 0 0
-8.0
0-7
.00
-6.0
0-5
.00
Ex
cit
ati
on
at
40
km
-4.0
0-3
.00
F o u r i e r V e l o c i t y - E Q
1 . 0 0 5 . 7 5 1 0 . 5 0F r e q ( H Z )
1 5 . 2 5 2 0 . 0 0
-8.0
0-7
.00
-6.0
0-5
.00
Ex
cit
ati
on
at
40
km
-4.0
0-3
.00
F o u r i e r V e l o c i t y - E Q
1 . 0 0 5 . 7 5 1 0 . 5 0F r e q ( H Z )
1 5 . 2 5 2 0 . 0 0
-8.0
0-7
.00
-6.0
0-5
.00
Ex
cit
ati
on
at
40
km
-4.0
0-3
.00
F o u r i e r V e l o c i t y - E Q
1 . 0 0 5 . 7 5 1 0 . 5 0F r e q ( H Z )
1 5 . 2 5 2 0 . 0 0
-8.0
0-7
.00
-6.0
0-5
.00
Ex
cit
ati
on
at
40
km
-4.0
0-3
.00
F o u r i e r V e l o c i t y - E Q
1 . 0 0 5 . 7 5 1 0 . 5 0F r e q ( H Z )
1 5 . 2 5 2 0 . 0 0
-8.0
0-7
.00
-6.0
0-5
.00
Ex
cit
ati
on
at
40
km
-4.0
0-3
.00
F o u r i e r V e l o c i t y - E Q
1 . 0 0 5 . 7 5 1 0 . 5 0F r e q ( H Z )
1 5 . 2 5 2 0 . 0 0
-8.0
0-7
.00
-6.0
0-5
.00
Ex
cit
ati
on
at
40
km
-4.0
0-3
.00
F o u r i e r V e l o c i t y - E Q
1 . 0 0 5 . 7 5 1 0 . 5 0F r e q ( H Z )
1 5 . 2 5 2 0 . 0 0
-8.0
0-7
.00
-6.0
0-5
.00
Ex
cit
ati
on
at
40
km
-4.0
0-3
.00
F o u r i e r V e l o c i t y - E Q
1 . 0 0 5 . 7 5 1 0 . 5 0F r e q ( H Z )
1 5 . 2 5 2 0 . 0 0
-8.0
0-7
.00
-6.0
0-5
.00
Ex
cit
ati
on
at
40
km
-4.0
0-3
.00
F o u r i e r V e l o c i t y - E Q
1 . 0 0 5 . 7 5 1 0 . 5 0F r e q ( H Z )
1 5 . 2 5 2 0 . 0 0
-8.0
0-7
.00
-6.0
0-5
.00
Ex
cit
ati
on
at
40
km
-4.0
0-3
.00
F o u r i e r V e l o c i t y - E Q
1 . 0 0 5 . 7 5 1 0 . 5 0F r e q ( H Z )
1 5 . 2 5 2 0 . 0 0
-8.0
0-7
.00
-6.0
0-5
.00
Ex
cit
ati
on
at
40
km
-4.0
0-3
.00
F o u r i e r V e l o c i t y - E Q
1 . 0 0 5 . 7 5 1 0 . 5 0F r e q ( H Z )
1 5 . 2 5 2 0 . 0 0
-8.0
0-7
.00
-6.0
0-5
.00
Ex
cit
ati
on
at
40
km
-4.0
0-3
.00
F o u r i e r V e l o c i t y - E Q
1 . 0 0 5 . 7 5 1 0 . 5 0F r e q ( H Z )
1 5 . 2 5 2 0 . 0 0
-8.0
0-7
.00
-6.0
0-5
.00
Ex
cit
ati
on
at
40
km
-4.0
0-3
.00
F o u r i e r V e l o c i t y - E Q
1 . 0 0 5 . 7 5 1 0 . 5 0F r e q ( H Z )
1 5 . 2 5 2 0 . 0 0
-8.0
0-7
.00
-6.0
0-5
.00
Ex
cit
ati
on
at
40
km
-4.0
0-3
.00
F o u r i e r V e l o c i t y - E Q
1 . 0 0 5 . 7 5 1 0 . 5 0F r e q ( H Z )
1 5 . 2 5 2 0 . 0 0
-8.0
0-7
.00
-6.0
0-5
.00
Ex
cit
ati
on
at
40
km
-4.0
0-3
.00
F o u r i e r V e l o c i t y - E Q
1 . 0 0 5 . 7 5 1 0 . 5 0F r e q ( H Z )
1 5 . 2 5 2 0 . 0 0
-8.0
0-7
.00
-6.0
0-5
.00
Ex
cit
ati
on
at
40
km
-4.0
0-3
.00
F o u r i e r V e l o c i t y - E Q
1 . 0 0 5 . 7 5 1 0 . 5 0F r e q ( H Z )
1 5 . 2 5 2 0 . 0 0
-8.0
0-7
.00
-6.0
0-5
.00
Ex
cit
ati
on
at
40
km
-4.0
0-3
.00
F o u r i e r V e l o c i t y - E Q
1 . 0 0 5 . 7 5 1 0 . 5 0F r e q ( H Z )
1 5 . 2 5 2 0 . 0 0
-8.0
0-7
.00
-6.0
0-5
.00
Ex
cit
ati
on
at
40
km
-4.0
0-3
.00
F o u r i e r V e l o c i t y - E Q
1 . 0 0 5 . 7 5 1 0 . 5 0F r e q ( H Z )
1 5 . 2 5 2 0 . 0 0
-8.0
0-7
.00
-6.0
0-5
.00
Ex
cit
ati
on
at
40
km
-4.0
0-3
.00
F o u r i e r V e l o c i t y - E Q
1 . 0 0 5 . 7 5 1 0 . 5 0F r e q ( H Z )
1 5 . 2 5 2 0 . 0 0
-8.0
0-7
.00
-6.0
0-5
.00
Ex
cit
ati
on
at
40
km
-4.0
0-3
.00
F o u r i e r V e l o c i t y - E Q
1 . 0 0 5 . 7 5 1 0 . 5 0F r e q ( H Z )
1 5 . 2 5 2 0 . 0 0
-8.0
0-7
.00
-6.0
0-5
.00
Ex
cit
ati
on
at
40
km
-4.0
0-3
.00
F o u r i e r V e l o c i t y - E Q
1 . 0 0 5 . 7 5 1 0 . 5 0F r e q ( H Z )
1 5 . 2 5 2 0 . 0 0
-8.0
0-7
.00
-6.0
0-5
.00
Ex
cit
ati
on
at
40
km
-4.0
0-3
.00
F o u r i e r V e l o c i t y - E Q
1 . 0 0 5 . 7 5 1 0 . 5 0F r e q ( H Z )
1 5 . 2 5 2 0 . 0 0
-8.0
0-7
.00
-6.0
0-5
.00
Ex
cit
ati
on
at
40
km
-4.0
0-3
.00
F o u r i e r V e l o c i t y - E Q
1 . 0 0 5 . 7 5 1 0 . 5 0F r e q ( H Z )
1 5 . 2 5 2 0 . 0 0
-8.0
0-7
.00
-6.0
0-5
.00
Ex
cit
ati
on
at
40
km
-4.0
0-3
.00
F o u r i e r V e l o c i t y - E Q
1 . 0 0 5 . 7 5 1 0 . 5 0F r e q ( H Z )
1 5 . 2 5 2 0 . 0 0
-8.0
0-7
.00
-6.0
0-5
.00
Ex
cit
ati
on
at
40
km
-4.0
0-3
.00
F o u r i e r V e l o c i t y - E Q
1 . 0 0 5 . 7 5 1 0 . 5 0F r e q ( H Z )
1 5 . 2 5 2 0 . 0 0
-8.0
0-7
.00
-6.0
0-5
.00
Ex
cit
ati
on
at
40
km
-4.0
0-3
.00
F o u r i e r V e l o c i t y - E Q
1 . 0 0 5 . 7 5 1 0 . 5 0F r e q ( H Z )
1 5 . 2 5 2 0 . 0 0
-8.0
0-7
.00
-6.0
0-5
.00
Ex
cit
ati
on
at
40
km
-4.0
0-3
.00
F o u r i e r V e l o c i t y - E Q
1 . 0 0 5 . 7 5 1 0 . 5 0F r e q ( H Z )
1 5 . 2 5 2 0 . 0 0
-8.0
0-7
.00
-6.0
0-5
.00
Ex
cit
ati
on
at
40
km
-4.0
0-3
.00
F o u r i e r V e l o c i t y - E Q
1 . 0 0 5 . 7 5 1 0 . 5 0F r e q ( H Z )
1 5 . 2 5 2 0 . 0 0
-8.0
0-7
.00
-6.0
0-5
.00
Ex
cit
ati
on
at
40
km
-4.0
0-3
.00
F o u r i e r V e l o c i t y - E Q
1 . 0 0 5 . 7 5 1 0 . 5 0F r e q ( H Z )
1 5 . 2 5 2 0 . 0 0
-8.0
0-7
.00
-6.0
0-5
.00
Ex
cit
ati
on
at
40
km
-4.0
0-3
.00
F o u r i e r V e l o c i t y - E Q
1 . 0 0 5 . 7 5 1 0 . 5 0F r e q ( H Z )
1 5 . 2 5 2 0 . 0 0
-8.0
0-7
.00
-6.0
0-5
.00
Ex
cit
ati
on
at
40
km
-4.0
0-3
.00
F o u r i e r V e l o c i t y - E Q
1 . 0 0 5 . 7 5 1 0 . 5 0F r e q ( H Z )
1 5 . 2 5 2 0 . 0 0
-8.0
0-7
.00
-6.0
0-5
.00
Ex
cit
ati
on
at
40
km
-4.0
0-3
.00
F o u r i e r V e l o c i t y - E Q
1 . 0 0 5 . 7 5 1 0 . 5 0F r e q ( H Z )
1 5 . 2 5 2 0 . 0 0
-8.0
0-7
.00
-6.0
0-5
.00
Ex
cit
ati
on
at
40
km
-4.0
0-3
.00
F o u r i e r V e l o c i t y - E Q
1 . 0 0 5 . 7 5 1 0 . 5 0F r e q ( H Z )
1 5 . 2 5 2 0 . 0 0
-8.0
0-7
.00
-6.0
0-5
.00
Ex
cit
ati
on
at
40
km
-4.0
0-3
.00
F o u r i e r V e l o c i t y - E Q
1 . 0 0 5 . 7 5 1 0 . 5 0F r e q ( H Z )
1 5 . 2 5 2 0 . 0 0
-8.0
0-7
.00
-6.0
0-5
.00
Ex
cit
ati
on
at
40
km
-4.0
0-3
.00
F o u r i e r V e l o c i t y - E Q
1 . 0 0 5 . 7 5 1 0 . 5 0F r e q ( H Z )
1 5 . 2 5 2 0 . 0 0
-8.0
0-7
.00
-6.0
0-5
.00
Ex
cit
ati
on
at
40
km
-4.0
0-3
.00
F o u r i e r V e l o c i t y - E Q
1 . 0 0 5 . 7 5 1 0 . 5 0F r e q ( H Z )
1 5 . 2 5 2 0 . 0 0
-8.0
0-7
.00
-6.0
0-5
.00
Ex
cit
ati
on
at
40
km
-4.0
0-3
.00
F o u r i e r V e l o c i t y - E Q
1 . 0 0 5 . 7 5 1 0 . 5 0F r e q ( H Z )
1 5 . 2 5 2 0 . 0 0
-8.0
0-7
.00
-6.0
0-5
.00
Ex
cit
ati
on
at
40
km
-4.0
0-3
.00
F o u r i e r V e l o c i t y - E Q
1 . 0 0 5 . 7 5 1 0 . 5 0F r e q ( H Z )
1 5 . 2 5 2 0 . 0 0
-8.0
0-7
.00
-6.0
0-5
.00
Ex
cit
ati
on
at
40
km
-4.0
0-3
.00
F o u r i e r V e l o c i t y - E Q
1 . 0 0 5 . 7 5 1 0 . 5 0F r e q ( H Z )
1 5 . 2 5 2 0 . 0 0
-8.0
0-7
.00
-6.0
0-5
.00
Ex
cit
ati
on
at
40
km
-4.0
0-3
.00
F o u r i e r V e l o c i t y - E Q
1 . 0 0 5 . 7 5 1 0 . 5 0F r e q ( H Z )
1 5 . 2 5 2 0 . 0 0
-8.0
0-7
.00
-6.0
0-5
.00
Ex
cit
ati
on
at
40
km
-4.0
0-3
.00
F o u r i e r V e l o c i t y - E Q
1 . 0 0 5 . 7 5 1 0 . 5 0F r e q ( H Z )
1 5 . 2 5 2 0 . 0 0
-8.0
0-7
.00
-6.0
0-5
.00
Ex
cit
ati
on
at
40
km
-4.0
0-3
.00
F o u r i e r V e l o c i t y - E Q
1 . 0 0 5 . 7 5 1 0 . 5 0F r e q ( H Z )
1 5 . 2 5 2 0 . 0 0
-8.0
0-7
.00
-6.0
0-5
.00
Ex
cit
ati
on
at
40
km
-4.0
0-3
.00
F o u r i e r V e l o c i t y - E Q
1 . 0 0 5 . 7 5 1 0 . 5 0F r e q ( H Z )
1 5 . 2 5 2 0 . 0 0
-8.0
0-7
.00
-6.0
0-5
.00
Ex
cit
ati
on
at
40
km
-4.0
0-3
.00
F o u r i e r V e l o c i t y - E Q
1 . 0 0 5 . 7 5 1 0 . 5 0F r e q ( H Z )
1 5 . 2 5 2 0 . 0 0
-8.0
0-7
.00
-6.0
0-5
.00
Ex
cit
ati
on
at
40
km
-4.0
0-3
.00
F o u r i e r V e l o c i t y - E Q
1 . 0 0 5 . 7 5 1 0 . 5 0F r e q ( H Z )
1 5 . 2 5 2 0 . 0 0
-8.0
0-7
.00
-6.0
0-5
.00
Ex
cit
ati
on
at
40
km
-4.0
0-3
.00
F o u r i e r V e l o c i t y - E Q
1 . 0 0 5 . 7 5 1 0 . 5 0F r e q ( H Z )
1 5 . 2 5 2 0 . 0 0
-8.0
0-7
.00
-6.0
0-5
.00
Ex
cit
ati
on
at
40
km
-4.0
0-3
.00
F o u r i e r V e l o c i t y - E Q
1 . 0 0 5 . 7 5 1 0 . 5 0F r e q ( H Z )
1 5 . 2 5 2 0 . 0 0
-8.0
0-7
.00
-6.0
0-5
.00
Ex
cit
ati
on
at
40
km
-4.0
0-3
.00
F o u r i e r V e l o c i t y - E Q
1 . 0 0 5 . 7 5 1 0 . 5 0F r e q ( H Z )
1 5 . 2 5 2 0 . 0 0
-8.0
0-7
.00
-6.0
0-5
.00
Ex
cit
ati
on
at
40
km
-4.0
0-3
.00
F o u r i e r V e l o c i t y - E Q
1 . 0 0 5 . 7 5 1 0 . 5 0F r e q ( H Z )
1 5 . 2 5 2 0 . 0 0
-8.0
0-7
.00
-6.0
0-5
.00
Ex
cit
ati
on
at
40
km
-4.0
0-3
.00
F o u r i e r V e l o c i t y - E Q
1 . 0 0 5 . 7 5 1 0 . 5 0F r e q ( H Z )
1 5 . 2 5 2 0 . 0 0
-8.0
0-7
.00
-6.0
0-5
.00
Ex
cit
ati
on
at
40
km
-4.0
0-3
.00
F o u r i e r V e l o c i t y - E Q
1 . 0 0 5 . 7 5 1 0 . 5 0F r e q ( H Z )
1 5 . 2 5 2 0 . 0 0
-8.0
0-7
.00
-6.0
0-5
.00
Ex
cit
ati
on
at
40
km
-4.0
0-3
.00
F o u r i e r V e l o c i t y - E Q
1 . 0 0 5 . 7 5 1 0 . 5 0F r e q ( H Z )
1 5 . 2 5 2 0 . 0 0
-8.0
0-7
.00
-6.0
0-5
.00
Ex
cit
ati
on
at
40
km
-4.0
0-3
.00
F o u r i e r V e l o c i t y - E Q
1 . 0 0 5 . 7 5 1 0 . 5 0F r e q ( H Z )
1 5 . 2 5 2 0 . 0 0
-8.0
0-7
.00
-6.0
0-5
.00
Ex
cit
ati
on
at
40
km
-4.0
0-3
.00
F o u r i e r V e l o c i t y - E Q
1 . 0 0 5 . 7 5 1 0 . 5 0F r e q ( H Z )
1 5 . 2 5 2 0 . 0 0
-8.0
0-7
.00
-6.0
0-5
.00
Ex
cit
ati
on
at
40
km
-4.0
0-3
.00
F o u r i e r V e l o c i t y - E Q
1 . 0 0 5 . 7 5 1 0 . 5 0F r e q ( H Z )
1 5 . 2 5 2 0 . 0 0
-8.0
0-7
.00
-6.0
0-5
.00
Ex
cit
ati
on
at
40
km
-4.0
0-3
.00
F o u r i e r V e l o c i t y - E Q
1 . 0 0 5 . 7 5 1 0 . 5 0F r e q ( H Z )
1 5 . 2 5 2 0 . 0 0
-8.0
0-7
.00
-6.0
0-5
.00
Ex
cit
ati
on
at
40
km
-4.0
0-3
.00
F o u r i e r V e l o c i t y - E Q
1 . 0 0 5 . 7 5 1 0 . 5 0F r e q ( H Z )
1 5 . 2 5 2 0 . 0 0
-8.0
0-7
.00
-6.0
0-5
.00
Ex
cit
ati
on
at
40
km
-4.0
0-3
.00
F o u r i e r V e l o c i t y - E Q
1 . 0 0 5 . 7 5 1 0 . 5 0F r e q ( H Z )
1 5 . 2 5 2 0 . 0 0
-8.0
0-7
.00
-6.0
0-5
.00
Ex
cit
ati
on
at
40
km
-4.0
0-3
.00
F o u r i e r V e l o c i t y - E Q
1 . 0 0 5 . 7 5 1 0 . 5 0F r e q ( H Z )
1 5 . 2 5 2 0 . 0 0
-8.0
0-7
.00
-6.0
0-5
.00
Ex
cit
ati
on
at
40
km
-4.0
0-3
.00
F o u r i e r V e l o c i t y - E Q
1 . 0 0 5 . 7 5 1 0 . 5 0F r e q ( H Z )
1 5 . 2 5 2 0 . 0 0
-8.0
0-7
.00
-6.0
0-5
.00
Ex
cit
ati
on
at
40
km
-4.0
0-3
.00
F o u r i e r V e l o c i t y - E Q
1 . 0 0 5 . 7 5 1 0 . 5 0F r e q ( H Z )
1 5 . 2 5 2 0 . 0 0
-8.0
0-7
.00
-6.0
0-5
.00
Ex
cit
ati
on
at
40
km
-4.0
0-3
.00
F o u r i e r V e l o c i t y - E Q
1 . 0 0 5 . 7 5 1 0 . 5 0F r e q ( H Z )
1 5 . 2 5 2 0 . 0 0
-8.0
0-7
.00
-6.0
0-5
.00
Ex
cit
ati
on
at
40
km
-4.0
0-3
.00
F o u r i e r V e l o c i t y - E Q
1 . 0 0 5 . 7 5 1 0 . 5 0F r e q ( H Z )
1 5 . 2 5 2 0 . 0 0
-8.0
0-7
.00
-6.0
0-5
.00
Ex
cit
ati
on
at
40
km
-4.0
0-3
.00
F o u r i e r V e l o c i t y - E Q
1 . 0 0 5 . 7 5 1 0 . 5 0F r e q ( H Z )
1 5 . 2 5 2 0 . 0 0
-8.0
0-7
.00
-6.0
0-5
.00
Ex
cit
ati
on
at
40
km
-4.0
0-3
.00
F o u r i e r V e l o c i t y - E Q
1 . 0 0 5 . 7 5 1 0 . 5 0F r e q ( H Z )
1 5 . 2 5 2 0 . 0 0
-8.0
0-7
.00
-6.0
0-5
.00
Ex
cit
ati
on
at
40
km
-4.0
0-3
.00
F o u r i e r V e l o c i t y - E Q
1 . 0 0 5 . 7 5 1 0 . 5 0F r e q ( H Z )
1 5 . 2 5 2 0 . 0 0
-8.0
0-7
.00
-6.0
0-5
.00
Ex
cit
ati
on
at
40
km
-4.0
0-3
.00
F o u r i e r V e l o c i t y - E Q
1 . 0 0 5 . 7 5 1 0 . 5 0F r e q ( H Z )
1 5 . 2 5 2 0 . 0 0
-8.0
0-7
.00
-6.0
0-5
.00
Ex
cit
ati
on
at
40
km
-4.0
0-3
.00
F o u r i e r V e l o c i t y - E Q
1 . 0 0 5 . 7 5 1 0 . 5 0F r e q ( H Z )
1 5 . 2 5 2 0 . 0 0
-8.0
0-7
.00
-6.0
0-5
.00
Ex
cit
ati
on
at
40
km
-4.0
0-3
.00
F o u r i e r V e l o c i t y - E Q
1 . 0 0 5 . 7 5 1 0 . 5 0F r e q ( H Z )
1 5 . 2 5 2 0 . 0 0
-8.0
0-7
.00
-6.0
0-5
.00
Ex
cit
ati
on
at
40
km
-4.0
0-3
.00
F o u r i e r V e l o c i t y - E Q
1 . 0 0 5 . 7 5 1 0 . 5 0F r e q ( H Z )
1 5 . 2 5 2 0 . 0 0
-8.0
0-7
.00
-6.0
0-5
.00
Ex
cit
ati
on
at
40
km
-4.0
0-3
.00
F o u r i e r V e l o c i t y - E Q
1 . 0 0 5 . 7 5 1 0 . 5 0F r e q ( H Z )
1 5 . 2 5 2 0 . 0 0
-8.0
0-7
.00
-6.0
0-5
.00
Ex
cit
ati
on
at
40
km
-4.0
0-3
.00
F o u r i e r V e l o c i t y - E Q
1 . 0 0 5 . 7 5 1 0 . 5 0F r e q ( H Z )
1 5 . 2 5 2 0 . 0 0
-8.0
0-7
.00
-6.0
0-5
.00
Ex
cit
ati
on
at
40
km
-4.0
0-3
.00
F o u r i e r V e l o c i t y - E Q
1 . 0 0 5 . 7 5 1 0 . 5 0F r e q ( H Z )
1 5 . 2 5 2 0 . 0 0
-8.0
0-7
.00
-6.0
0-5
.00
Ex
cit
ati
on
at
40
km
-4.0
0-3
.00
F o u r i e r V e l o c i t y - E Q
1 . 0 0 5 . 7 5 1 0 . 5 0F r e q ( H Z )
1 5 . 2 5 2 0 . 0 0
-8.0
0-7
.00
-6.0
0-5
.00
Ex
cit
ati
on
at
40
km
-4.0
0-3
.00
F o u r i e r V e l o c i t y - E Q
1 . 0 0 5 . 7 5 1 0 . 5 0F r e q ( H Z )
1 5 . 2 5 2 0 . 0 0
-8.0
0-7
.00
-6.0
0-5
.00
Ex
cit
ati
on
at
40
km
-4.0
0-3
.00
F o u r i e r V e l o c i t y - E Q
1 . 0 0 5 . 7 5 1 0 . 5 0F r e q ( H Z )
1 5 . 2 5 2 0 . 0 0
-8.0
0-7
.00
-6.0
0-5
.00
Ex
cit
ati
on
at
40
km
-4.0
0-3
.00
F o u r i e r V e l o c i t y - E Q
1 . 0 0 5 . 7 5 1 0 . 5 0F r e q ( H Z )
1 5 . 2 5 2 0 . 0 0
-8.0
0-7
.00
-6.0
0-5
.00
Ex
cit
ati
on
at
40
km
-4.0
0-3
.00
F o u r i e r V e l o c i t y - E Q
1 . 0 0 5 . 7 5 1 0 . 5 0F r e q ( H Z )
1 5 . 2 5 2 0 . 0 0
-8.0
0-7
.00
-6.0
0-5
.00
Ex
cit
ati
on
at
40
km
-4.0
0-3
.00
F o u r i e r V e l o c i t y - E Q
1 . 0 0 5 . 7 5 1 0 . 5 0F r e q ( H Z )
1 5 . 2 5 2 0 . 0 0
-8.0
0-7
.00
-6.0
0-5
.00
Ex
cit
ati
on
at
40
km
-4.0
0-3
.00
F o u r i e r V e l o c i t y - E Q
1 . 0 0 5 . 7 5 1 0 . 5 0F r e q ( H Z )
1 5 . 2 5 2 0 . 0 0
-8.0
0-7
.00
-6.0
0-5
.00
Ex
cit
ati
on
at
40
km
-4.0
0-3
.00
F o u r i e r V e l o c i t y - E Q
1 . 0 0 5 . 7 5 1 0 . 5 0F r e q ( H Z )
1 5 . 2 5 2 0 . 0 0
-8.0
0-7
.00
-6.0
0-5
.00
Ex
cit
ati
on
at
40
km
-4.0
0-3
.00
F o u r i e r V e l o c i t y - E Q
1 . 0 0 5 . 7 5 1 0 . 5 0F r e q ( H Z )
1 5 . 2 5 2 0 . 0 0
-8.0
0-7
.00
-6.0
0-5
.00
Ex
cit
ati
on
at
40
km
-4.0
0-3
.00
F o u r i e r V e l o c i t y - E Q
1 . 0 0 5 . 7 5 1 0 . 5 0F r e q ( H Z )
1 5 . 2 5 2 0 . 0 0
-8.0
0-7
.00
-6.0
0-5
.00
Ex
cit
ati
on
at
40
km
-4.0
0-3
.00
F o u r i e r V e l o c i t y - E Q
1 . 0 0 5 . 7 5 1 0 . 5 0F r e q ( H Z )
1 5 . 2 5 2 0 . 0 0
-8.0
0-7
.00
-6.0
0-5
.00
Ex
cit
ati
on
at
40
km
-4.0
0-3
.00
F o u r i e r V e l o c i t y - E Q
1 . 0 0 5 . 7 5 1 0 . 5 0F r e q ( H Z )
1 5 . 2 5 2 0 . 0 0
-8.0
0-7
.00
-6.0
0-5
.00
Ex
cit
ati
on
at
40
km
-4.0
0-3
.00
F o u r i e r V e l o c i t y - E Q
1 . 0 0 5 . 7 5 1 0 . 5 0F r e q ( H Z )
1 5 . 2 5 2 0 . 0 0
-8.0
0-7
.00
-6.0
0-5
.00
Ex
cit
ati
on
at
40
km
-4.0
0-3
.00
F o u r i e r V e l o c i t y - E Q
1 . 0 0 5 . 7 5 1 0 . 5 0F r e q ( H Z )
1 5 . 2 5 2 0 . 0 0
-8.0
0-7
.00
-6.0
0-5
.00
Ex
cit
ati
on
at
40
km
-4.0
0-3
.00
F o u r i e r V e l o c i t y - E Q
1 . 0 0 5 . 7 5 1 0 . 5 0F r e q ( H Z )
1 5 . 2 5 2 0 . 0 0
-8.0
0-7
.00
-6.0
0-5
.00
Ex
cit
ati
on
at
40
km
-4.0
0-3
.00
F o u r i e r V e l o c i t y - E Q
1 . 0 0 5 . 7 5 1 0 . 5 0F r e q ( H Z )
1 5 . 2 5 2 0 . 0 0
-8.0
0-7
.00
-6.0
0-5
.00
Ex
cit
ati
on
at
40
km
-4.0
0-3
.00
F o u r i e r V e l o c i t y - E Q
1 . 0 0 5 . 7 5 1 0 . 5 0F r e q ( H Z )
1 5 . 2 5 2 0 . 0 0
-8.0
0-7
.00
-6.0
0-5
.00
Ex
cit
ati
on
at
40
km
-4.0
0-3
.00
F o u r i e r V e l o c i t y - E Q
1 . 0 0 5 . 7 5 1 0 . 5 0F r e q ( H Z )
1 5 . 2 5 2 0 . 0 0
-8.0
0-7
.00
-6.0
0-5
.00
Ex
cit
ati
on
at
40
km
-4.0
0-3
.00
F o u r i e r V e l o c i t y - E Q
1 . 0 0 5 . 7 5 1 0 . 5 0F r e q ( H Z )
1 5 . 2 5 2 0 . 0 0
-8.0
0-7
.00
-6.0
0-5
.00
Ex
cit
ati
on
at
40
km
-4.0
0-3
.00
F o u r i e r V e l o c i t y - E Q
1 . 0 0 5 . 7 5 1 0 . 5 0F r e q ( H Z )
1 5 . 2 5 2 0 . 0 0
-8.0
0-7
.00
-6.0
0-5
.00
Ex
cit
ati
on
at
40
km
-4.0
0-3
.00
F o u r i e r V e l o c i t y - E Q
1 . 0 0 5 . 7 5 1 0 . 5 0F r e q ( H Z )
1 5 . 2 5 2 0 . 0 0
-8.0
0-7
.00
-6.0
0-5
.00
Ex
cit
ati
on
at
40
km
-4.0
0-3
.00
F o u r i e r V e l o c i t y - E Q
1 . 0 0 5 . 7 5 1 0 . 5 0F r e q ( H Z )
1 5 . 2 5 2 0 . 0 0
-8.0
0-7
.00
-6.0
0-5
.00
Ex
cit
ati
on
at
40
km
-4.0
0-3
.00
F o u r i e r V e l o c i t y - E Q
1 . 0 0 5 . 7 5 1 0 . 5 0F r e q ( H Z )
1 5 . 2 5 2 0 . 0 0
-8.0
0-7
.00
-6.0
0-5
.00
Ex
cit
ati
on
at
40
km
-4.0
0-3
.00
F o u r i e r V e l o c i t y - E Q
1 . 0 0 5 . 7 5 1 0 . 5 0F r e q ( H Z )
1 5 . 2 5 2 0 . 0 0
-8.0
0-7
.00
-6.0
0-5
.00
Ex
cit
ati
on
at
40
km
-4.0
0-3
.00
F o u r i e r V e l o c i t y - E Q
1 . 0 0 5 . 7 5 1 0 . 5 0F r e q ( H Z )
1 5 . 2 5 2 0 . 0 0
-8.0
0-7
.00
-6.0
0-5
.00
Ex
cit
ati
on
at
40
km
-4.0
0-3
.00
F o u r i e r V e l o c i t y - E Q
1 . 0 0 5 . 7 5 1 0 . 5 0F r e q ( H Z )
1 5 . 2 5 2 0 . 0 0
-8.0
0-7
.00
-6.0
0-5
.00
Ex
cit
ati
on
at
40
km
-4.0
0-3
.00
F o u r i e r V e l o c i t y - E Q
1 . 0 0 5 . 7 5 1 0 . 5 0F r e q ( H Z )
1 5 . 2 5 2 0 . 0 0
-8.0
0-7
.00
-6.0
0-5
.00
Ex
cit
ati
on
at
40
km
-4.0
0-3
.00
F o u r i e r V e l o c i t y - E Q
1 . 0 0 5 . 7 5 1 0 . 5 0F r e q ( H Z )
1 5 . 2 5 2 0 . 0 0
-8.0
0-7
.00
-6.0
0-5
.00
Ex
cit
ati
on
at
40
km
-4.0
0-3
.00
F o u r i e r V e l o c i t y - E Q
1 . 0 0 5 . 7 5 1 0 . 5 0F r e q ( H Z )
1 5 . 2 5 2 0 . 0 0
-8.0
0-7
.00
-6.0
0-5
.00
Ex
cit
ati
on
at
40
km
-4.0
0-3
.00
F o u r i e r V e l o c i t y - E Q
1 . 0 0 5 . 7 5 1 0 . 5 0F r e q ( H Z )
1 5 . 2 5 2 0 . 0 0
-8.0
0-7
.00
-6.0
0-5
.00
Ex
cit
ati
on
at
40
km
-4.0
0-3
.00
F o u r i e r V e l o c i t y - E Q
1 . 0 0 5 . 7 5 1 0 . 5 0F r e q ( H Z )
1 5 . 2 5 2 0 . 0 0
-8.0
0-7
.00
-6.0
0-5
.00
Ex
cit
ati
on
at
40
km
-4.0
0-3
.00
F o u r i e r V e l o c i t y - E Q
1 . 0 0 5 . 7 5 1 0 . 5 0F r e q ( H Z )
1 5 . 2 5 2 0 . 0 0
-8.0
0-7
.00
-6.0
0-5
.00
Ex
cit
ati
on
at
40
km
-4.0
0-3
.00
F o u r i e r V e l o c i t y - E Q
1 . 0 0 5 . 7 5 1 0 . 5 0F r e q ( H Z )
1 5 . 2 5 2 0 . 0 0
-8.0
0-7
.00
-6.0
0-5
.00
Ex
cit
ati
on
at
40
km
-4.0
0-3
.00
F o u r i e r V e l o c i t y - E Q
1 . 0 0 5 . 7 5 1 0 . 5 0F r e q ( H Z )
1 5 . 2 5 2 0 . 0 0
-8.0
0-7
.00
-6.0
0-5
.00
Ex
cit
ati
on
at
40
km
-4.0
0-3
.00
F o u r i e r V e l o c i t y - E Q
1 . 0 0 5 . 7 5 1 0 . 5 0F r e q ( H Z )
1 5 . 2 5 2 0 . 0 0
-8.0
0-7
.00
-6.0
0-5
.00
Ex
cit
ati
on
at
40
km
-4.0
0-3
.00
F o u r i e r V e l o c i t y - E Q
1 . 0 0 5 . 7 5 1 0 . 5 0F r e q ( H Z )
1 5 . 2 5 2 0 . 0 0
-8.0
0-7
.00
-6.0
0-5
.00
Ex
cit
ati
on
at
40
km
-4.0
0-3
.00
F o u r i e r V e l o c i t y - E Q
1 . 0 0 5 . 7 5 1 0 . 5 0F r e q ( H Z )
1 5 . 2 5 2 0 . 0 0
-8.0
0-7
.00
-6.0
0-5
.00
Ex
cit
ati
on
at
40
km
-4.0
0-3
.00
F o u r i e r V e l o c i t y - E Q
1 . 0 0 5 . 7 5 1 0 . 5 0F r e q ( H Z )
1 5 . 2 5 2 0 . 0 0
-8.0
0-7
.00
-6.0
0-5
.00
Ex
cit
ati
on
at
40
km
-4.0
0-3
.00
F o u r i e r V e l o c i t y - E Q
1 . 0 0 5 . 7 5 1 0 . 5 0F r e q ( H Z )
1 5 . 2 5 2 0 . 0 0
-8.0
0-7
.00
-6.0
0-5
.00
Ex
cit
ati
on
at
40
km
-4.0
0-3
.00
F o u r i e r V e l o c i t y - E Q
Figure 3.11: Inverted Fourier velocity excitation terms for the earthquakeevents recorded by vertical component velocity seismograms plotted on alinear frequency scale
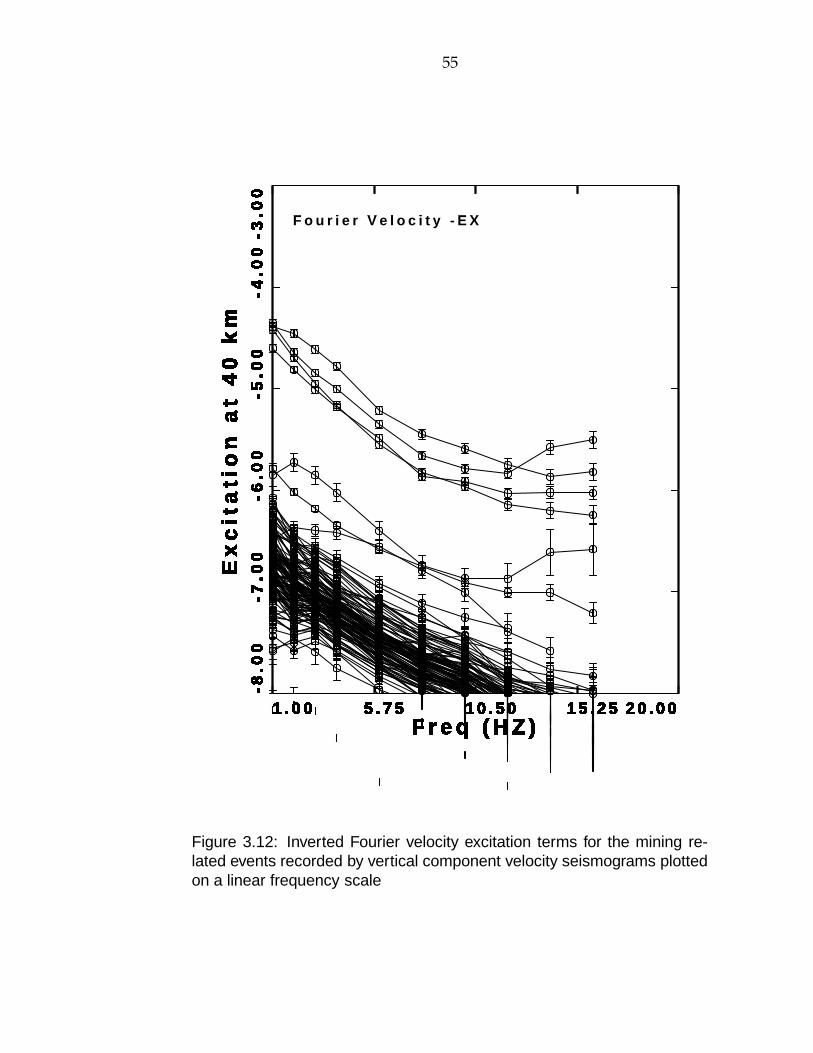
55
1 . 0 0 5 . 7 5 1 0 . 5 0F r e q ( H Z )
1 5 . 2 5 2 0 . 0 0
-8.0
0-7
.00
-6.0
0-5
.00
Ex
cit
ati
on
at
40
km
-4.0
0-3
.00
F o u r i e r V e l o c i t y - E X
1 . 0 0 5 . 7 5 1 0 . 5 0F r e q ( H Z )
1 5 . 2 5 2 0 . 0 0
-8.0
0-7
.00
-6.0
0-5
.00
Ex
cit
ati
on
at
40
km
-4.0
0-3
.00
F o u r i e r V e l o c i t y - E X
1 . 0 0 5 . 7 5 1 0 . 5 0F r e q ( H Z )
1 5 . 2 5 2 0 . 0 0
-8.0
0-7
.00
-6.0
0-5
.00
Ex
cit
ati
on
at
40
km
-4.0
0-3
.00
F o u r i e r V e l o c i t y - E X
1 . 0 0 5 . 7 5 1 0 . 5 0F r e q ( H Z )
1 5 . 2 5 2 0 . 0 0
-8.0
0-7
.00
-6.0
0-5
.00
Ex
cit
ati
on
at
40
km
-4.0
0-3
.00
F o u r i e r V e l o c i t y - E X
1 . 0 0 5 . 7 5 1 0 . 5 0F r e q ( H Z )
1 5 . 2 5 2 0 . 0 0
-8.0
0-7
.00
-6.0
0-5
.00
Ex
cit
ati
on
at
40
km
-4.0
0-3
.00
F o u r i e r V e l o c i t y - E X
1 . 0 0 5 . 7 5 1 0 . 5 0F r e q ( H Z )
1 5 . 2 5 2 0 . 0 0
-8.0
0-7
.00
-6.0
0-5
.00
Ex
cit
ati
on
at
40
km
-4.0
0-3
.00
F o u r i e r V e l o c i t y - E X
1 . 0 0 5 . 7 5 1 0 . 5 0F r e q ( H Z )
1 5 . 2 5 2 0 . 0 0
-8.0
0-7
.00
-6.0
0-5
.00
Ex
cit
ati
on
at
40
km
-4.0
0-3
.00
F o u r i e r V e l o c i t y - E X
1 . 0 0 5 . 7 5 1 0 . 5 0F r e q ( H Z )
1 5 . 2 5 2 0 . 0 0
-8.0
0-7
.00
-6.0
0-5
.00
Ex
cit
ati
on
at
40
km
-4.0
0-3
.00
F o u r i e r V e l o c i t y - E X
1 . 0 0 5 . 7 5 1 0 . 5 0F r e q ( H Z )
1 5 . 2 5 2 0 . 0 0
-8.0
0-7
.00
-6.0
0-5
.00
Ex
cit
ati
on
at
40
km
-4.0
0-3
.00
F o u r i e r V e l o c i t y - E X
1 . 0 0 5 . 7 5 1 0 . 5 0F r e q ( H Z )
1 5 . 2 5 2 0 . 0 0
-8.0
0-7
.00
-6.0
0-5
.00
Ex
cit
ati
on
at
40
km
-4.0
0-3
.00
F o u r i e r V e l o c i t y - E X
1 . 0 0 5 . 7 5 1 0 . 5 0F r e q ( H Z )
1 5 . 2 5 2 0 . 0 0
-8.0
0-7
.00
-6.0
0-5
.00
Ex
cit
ati
on
at
40
km
-4.0
0-3
.00
F o u r i e r V e l o c i t y - E X
1 . 0 0 5 . 7 5 1 0 . 5 0F r e q ( H Z )
1 5 . 2 5 2 0 . 0 0
-8.0
0-7
.00
-6.0
0-5
.00
Ex
cit
ati
on
at
40
km
-4.0
0-3
.00
F o u r i e r V e l o c i t y - E X
1 . 0 0 5 . 7 5 1 0 . 5 0F r e q ( H Z )
1 5 . 2 5 2 0 . 0 0
-8.0
0-7
.00
-6.0
0-5
.00
Ex
cit
ati
on
at
40
km
-4.0
0-3
.00
F o u r i e r V e l o c i t y - E X
1 . 0 0 5 . 7 5 1 0 . 5 0F r e q ( H Z )
1 5 . 2 5 2 0 . 0 0
-8.0
0-7
.00
-6.0
0-5
.00
Ex
cit
ati
on
at
40
km
-4.0
0-3
.00
F o u r i e r V e l o c i t y - E X
1 . 0 0 5 . 7 5 1 0 . 5 0F r e q ( H Z )
1 5 . 2 5 2 0 . 0 0
-8.0
0-7
.00
-6.0
0-5
.00
Ex
cit
ati
on
at
40
km
-4.0
0-3
.00
F o u r i e r V e l o c i t y - E X
1 . 0 0 5 . 7 5 1 0 . 5 0F r e q ( H Z )
1 5 . 2 5 2 0 . 0 0
-8.0
0-7
.00
-6.0
0-5
.00
Ex
cit
ati
on
at
40
km
-4.0
0-3
.00
F o u r i e r V e l o c i t y - E X
1 . 0 0 5 . 7 5 1 0 . 5 0F r e q ( H Z )
1 5 . 2 5 2 0 . 0 0
-8.0
0-7
.00
-6.0
0-5
.00
Ex
cit
ati
on
at
40
km
-4.0
0-3
.00
F o u r i e r V e l o c i t y - E X
1 . 0 0 5 . 7 5 1 0 . 5 0F r e q ( H Z )
1 5 . 2 5 2 0 . 0 0
-8.0
0-7
.00
-6.0
0-5
.00
Ex
cit
ati
on
at
40
km
-4.0
0-3
.00
F o u r i e r V e l o c i t y - E X
1 . 0 0 5 . 7 5 1 0 . 5 0F r e q ( H Z )
1 5 . 2 5 2 0 . 0 0
-8.0
0-7
.00
-6.0
0-5
.00
Ex
cit
ati
on
at
40
km
-4.0
0-3
.00
F o u r i e r V e l o c i t y - E X
1 . 0 0 5 . 7 5 1 0 . 5 0F r e q ( H Z )
1 5 . 2 5 2 0 . 0 0
-8.0
0-7
.00
-6.0
0-5
.00
Ex
cit
ati
on
at
40
km
-4.0
0-3
.00
F o u r i e r V e l o c i t y - E X
1 . 0 0 5 . 7 5 1 0 . 5 0F r e q ( H Z )
1 5 . 2 5 2 0 . 0 0
-8.0
0-7
.00
-6.0
0-5
.00
Ex
cit
ati
on
at
40
km
-4.0
0-3
.00
F o u r i e r V e l o c i t y - E X
1 . 0 0 5 . 7 5 1 0 . 5 0F r e q ( H Z )
1 5 . 2 5 2 0 . 0 0
-8.0
0-7
.00
-6.0
0-5
.00
Ex
cit
ati
on
at
40
km
-4.0
0-3
.00
F o u r i e r V e l o c i t y - E X
1 . 0 0 5 . 7 5 1 0 . 5 0F r e q ( H Z )
1 5 . 2 5 2 0 . 0 0
-8.0
0-7
.00
-6.0
0-5
.00
Ex
cit
ati
on
at
40
km
-4.0
0-3
.00
F o u r i e r V e l o c i t y - E X
1 . 0 0 5 . 7 5 1 0 . 5 0F r e q ( H Z )
1 5 . 2 5 2 0 . 0 0
-8.0
0-7
.00
-6.0
0-5
.00
Ex
cit
ati
on
at
40
km
-4.0
0-3
.00
F o u r i e r V e l o c i t y - E X
1 . 0 0 5 . 7 5 1 0 . 5 0F r e q ( H Z )
1 5 . 2 5 2 0 . 0 0
-8.0
0-7
.00
-6.0
0-5
.00
Ex
cit
ati
on
at
40
km
-4.0
0-3
.00
F o u r i e r V e l o c i t y - E X
1 . 0 0 5 . 7 5 1 0 . 5 0F r e q ( H Z )
1 5 . 2 5 2 0 . 0 0
-8.0
0-7
.00
-6.0
0-5
.00
Ex
cit
ati
on
at
40
km
-4.0
0-3
.00
F o u r i e r V e l o c i t y - E X
1 . 0 0 5 . 7 5 1 0 . 5 0F r e q ( H Z )
1 5 . 2 5 2 0 . 0 0
-8.0
0-7
.00
-6.0
0-5
.00
Ex
cit
ati
on
at
40
km
-4.0
0-3
.00
F o u r i e r V e l o c i t y - E X
1 . 0 0 5 . 7 5 1 0 . 5 0F r e q ( H Z )
1 5 . 2 5 2 0 . 0 0
-8.0
0-7
.00
-6.0
0-5
.00
Ex
cit
ati
on
at
40
km
-4.0
0-3
.00
F o u r i e r V e l o c i t y - E X
1 . 0 0 5 . 7 5 1 0 . 5 0F r e q ( H Z )
1 5 . 2 5 2 0 . 0 0
-8.0
0-7
.00
-6.0
0-5
.00
Ex
cit
ati
on
at
40
km
-4.0
0-3
.00
F o u r i e r V e l o c i t y - E X
1 . 0 0 5 . 7 5 1 0 . 5 0F r e q ( H Z )
1 5 . 2 5 2 0 . 0 0
-8.0
0-7
.00
-6.0
0-5
.00
Ex
cit
ati
on
at
40
km
-4.0
0-3
.00
F o u r i e r V e l o c i t y - E X
1 . 0 0 5 . 7 5 1 0 . 5 0F r e q ( H Z )
1 5 . 2 5 2 0 . 0 0
-8.0
0-7
.00
-6.0
0-5
.00
Ex
cit
ati
on
at
40
km
-4.0
0-3
.00
F o u r i e r V e l o c i t y - E X
1 . 0 0 5 . 7 5 1 0 . 5 0F r e q ( H Z )
1 5 . 2 5 2 0 . 0 0
-8.0
0-7
.00
-6.0
0-5
.00
Ex
cit
ati
on
at
40
km
-4.0
0-3
.00
F o u r i e r V e l o c i t y - E X
1 . 0 0 5 . 7 5 1 0 . 5 0F r e q ( H Z )
1 5 . 2 5 2 0 . 0 0
-8.0
0-7
.00
-6.0
0-5
.00
Ex
cit
ati
on
at
40
km
-4.0
0-3
.00
F o u r i e r V e l o c i t y - E X
1 . 0 0 5 . 7 5 1 0 . 5 0F r e q ( H Z )
1 5 . 2 5 2 0 . 0 0
-8.0
0-7
.00
-6.0
0-5
.00
Ex
cit
ati
on
at
40
km
-4.0
0-3
.00
F o u r i e r V e l o c i t y - E X
1 . 0 0 5 . 7 5 1 0 . 5 0F r e q ( H Z )
1 5 . 2 5 2 0 . 0 0
-8.0
0-7
.00
-6.0
0-5
.00
Ex
cit
ati
on
at
40
km
-4.0
0-3
.00
F o u r i e r V e l o c i t y - E X
1 . 0 0 5 . 7 5 1 0 . 5 0F r e q ( H Z )
1 5 . 2 5 2 0 . 0 0
-8.0
0-7
.00
-6.0
0-5
.00
Ex
cit
ati
on
at
40
km
-4.0
0-3
.00
F o u r i e r V e l o c i t y - E X
1 . 0 0 5 . 7 5 1 0 . 5 0F r e q ( H Z )
1 5 . 2 5 2 0 . 0 0
-8.0
0-7
.00
-6.0
0-5
.00
Ex
cit
ati
on
at
40
km
-4.0
0-3
.00
F o u r i e r V e l o c i t y - E X
1 . 0 0 5 . 7 5 1 0 . 5 0F r e q ( H Z )
1 5 . 2 5 2 0 . 0 0
-8.0
0-7
.00
-6.0
0-5
.00
Ex
cit
ati
on
at
40
km
-4.0
0-3
.00
F o u r i e r V e l o c i t y - E X
1 . 0 0 5 . 7 5 1 0 . 5 0F r e q ( H Z )
1 5 . 2 5 2 0 . 0 0
-8.0
0-7
.00
-6.0
0-5
.00
Ex
cit
ati
on
at
40
km
-4.0
0-3
.00
F o u r i e r V e l o c i t y - E X
1 . 0 0 5 . 7 5 1 0 . 5 0F r e q ( H Z )
1 5 . 2 5 2 0 . 0 0
-8.0
0-7
.00
-6.0
0-5
.00
Ex
cit
ati
on
at
40
km
-4.0
0-3
.00
F o u r i e r V e l o c i t y - E X
1 . 0 0 5 . 7 5 1 0 . 5 0F r e q ( H Z )
1 5 . 2 5 2 0 . 0 0
-8.0
0-7
.00
-6.0
0-5
.00
Ex
cit
ati
on
at
40
km
-4.0
0-3
.00
F o u r i e r V e l o c i t y - E X
1 . 0 0 5 . 7 5 1 0 . 5 0F r e q ( H Z )
1 5 . 2 5 2 0 . 0 0
-8.0
0-7
.00
-6.0
0-5
.00
Ex
cit
ati
on
at
40
km
-4.0
0-3
.00
F o u r i e r V e l o c i t y - E X
1 . 0 0 5 . 7 5 1 0 . 5 0F r e q ( H Z )
1 5 . 2 5 2 0 . 0 0
-8.0
0-7
.00
-6.0
0-5
.00
Ex
cit
ati
on
at
40
km
-4.0
0-3
.00
F o u r i e r V e l o c i t y - E X
1 . 0 0 5 . 7 5 1 0 . 5 0F r e q ( H Z )
1 5 . 2 5 2 0 . 0 0
-8.0
0-7
.00
-6.0
0-5
.00
Ex
cit
ati
on
at
40
km
-4.0
0-3
.00
F o u r i e r V e l o c i t y - E X
1 . 0 0 5 . 7 5 1 0 . 5 0F r e q ( H Z )
1 5 . 2 5 2 0 . 0 0
-8.0
0-7
.00
-6.0
0-5
.00
Ex
cit
ati
on
at
40
km
-4.0
0-3
.00
F o u r i e r V e l o c i t y - E X
1 . 0 0 5 . 7 5 1 0 . 5 0F r e q ( H Z )
1 5 . 2 5 2 0 . 0 0
-8.0
0-7
.00
-6.0
0-5
.00
Ex
cit
ati
on
at
40
km
-4.0
0-3
.00
F o u r i e r V e l o c i t y - E X
1 . 0 0 5 . 7 5 1 0 . 5 0F r e q ( H Z )
1 5 . 2 5 2 0 . 0 0
-8.0
0-7
.00
-6.0
0-5
.00
Ex
cit
ati
on
at
40
km
-4.0
0-3
.00
F o u r i e r V e l o c i t y - E X
1 . 0 0 5 . 7 5 1 0 . 5 0F r e q ( H Z )
1 5 . 2 5 2 0 . 0 0
-8.0
0-7
.00
-6.0
0-5
.00
Ex
cit
ati
on
at
40
km
-4.0
0-3
.00
F o u r i e r V e l o c i t y - E X
1 . 0 0 5 . 7 5 1 0 . 5 0F r e q ( H Z )
1 5 . 2 5 2 0 . 0 0
-8.0
0-7
.00
-6.0
0-5
.00
Ex
cit
ati
on
at
40
km
-4.0
0-3
.00
F o u r i e r V e l o c i t y - E X
1 . 0 0 5 . 7 5 1 0 . 5 0F r e q ( H Z )
1 5 . 2 5 2 0 . 0 0
-8.0
0-7
.00
-6.0
0-5
.00
Ex
cit
ati
on
at
40
km
-4.0
0-3
.00
F o u r i e r V e l o c i t y - E X
1 . 0 0 5 . 7 5 1 0 . 5 0F r e q ( H Z )
1 5 . 2 5 2 0 . 0 0
-8.0
0-7
.00
-6.0
0-5
.00
Ex
cit
ati
on
at
40
km
-4.0
0-3
.00
F o u r i e r V e l o c i t y - E X
1 . 0 0 5 . 7 5 1 0 . 5 0F r e q ( H Z )
1 5 . 2 5 2 0 . 0 0
-8.0
0-7
.00
-6.0
0-5
.00
Ex
cit
ati
on
at
40
km
-4.0
0-3
.00
F o u r i e r V e l o c i t y - E X
1 . 0 0 5 . 7 5 1 0 . 5 0F r e q ( H Z )
1 5 . 2 5 2 0 . 0 0
-8.0
0-7
.00
-6.0
0-5
.00
Ex
cit
ati
on
at
40
km
-4.0
0-3
.00
F o u r i e r V e l o c i t y - E X
1 . 0 0 5 . 7 5 1 0 . 5 0F r e q ( H Z )
1 5 . 2 5 2 0 . 0 0
-8.0
0-7
.00
-6.0
0-5
.00
Ex
cit
ati
on
at
40
km
-4.0
0-3
.00
F o u r i e r V e l o c i t y - E X
1 . 0 0 5 . 7 5 1 0 . 5 0F r e q ( H Z )
1 5 . 2 5 2 0 . 0 0
-8.0
0-7
.00
-6.0
0-5
.00
Ex
cit
ati
on
at
40
km
-4.0
0-3
.00
F o u r i e r V e l o c i t y - E X
1 . 0 0 5 . 7 5 1 0 . 5 0F r e q ( H Z )
1 5 . 2 5 2 0 . 0 0
-8.0
0-7
.00
-6.0
0-5
.00
Ex
cit
ati
on
at
40
km
-4.0
0-3
.00
F o u r i e r V e l o c i t y - E X
1 . 0 0 5 . 7 5 1 0 . 5 0F r e q ( H Z )
1 5 . 2 5 2 0 . 0 0
-8.0
0-7
.00
-6.0
0-5
.00
Ex
cit
ati
on
at
40
km
-4.0
0-3
.00
F o u r i e r V e l o c i t y - E X
1 . 0 0 5 . 7 5 1 0 . 5 0F r e q ( H Z )
1 5 . 2 5 2 0 . 0 0
-8.0
0-7
.00
-6.0
0-5
.00
Ex
cit
ati
on
at
40
km
-4.0
0-3
.00
F o u r i e r V e l o c i t y - E X
1 . 0 0 5 . 7 5 1 0 . 5 0F r e q ( H Z )
1 5 . 2 5 2 0 . 0 0
-8.0
0-7
.00
-6.0
0-5
.00
Ex
cit
ati
on
at
40
km
-4.0
0-3
.00
F o u r i e r V e l o c i t y - E X
1 . 0 0 5 . 7 5 1 0 . 5 0F r e q ( H Z )
1 5 . 2 5 2 0 . 0 0
-8.0
0-7
.00
-6.0
0-5
.00
Ex
cit
ati
on
at
40
km
-4.0
0-3
.00
F o u r i e r V e l o c i t y - E X
1 . 0 0 5 . 7 5 1 0 . 5 0F r e q ( H Z )
1 5 . 2 5 2 0 . 0 0
-8.0
0-7
.00
-6.0
0-5
.00
Ex
cit
ati
on
at
40
km
-4.0
0-3
.00
F o u r i e r V e l o c i t y - E X
1 . 0 0 5 . 7 5 1 0 . 5 0F r e q ( H Z )
1 5 . 2 5 2 0 . 0 0
-8.0
0-7
.00
-6.0
0-5
.00
Ex
cit
ati
on
at
40
km
-4.0
0-3
.00
F o u r i e r V e l o c i t y - E X
1 . 0 0 5 . 7 5 1 0 . 5 0F r e q ( H Z )
1 5 . 2 5 2 0 . 0 0
-8.0
0-7
.00
-6.0
0-5
.00
Ex
cit
ati
on
at
40
km
-4.0
0-3
.00
F o u r i e r V e l o c i t y - E X
1 . 0 0 5 . 7 5 1 0 . 5 0F r e q ( H Z )
1 5 . 2 5 2 0 . 0 0
-8.0
0-7
.00
-6.0
0-5
.00
Ex
cit
ati
on
at
40
km
-4.0
0-3
.00
F o u r i e r V e l o c i t y - E X
1 . 0 0 5 . 7 5 1 0 . 5 0F r e q ( H Z )
1 5 . 2 5 2 0 . 0 0
-8.0
0-7
.00
-6.0
0-5
.00
Ex
cit
ati
on
at
40
km
-4.0
0-3
.00
F o u r i e r V e l o c i t y - E X
1 . 0 0 5 . 7 5 1 0 . 5 0F r e q ( H Z )
1 5 . 2 5 2 0 . 0 0
-8.0
0-7
.00
-6.0
0-5
.00
Ex
cit
ati
on
at
40
km
-4.0
0-3
.00
F o u r i e r V e l o c i t y - E X
1 . 0 0 5 . 7 5 1 0 . 5 0F r e q ( H Z )
1 5 . 2 5 2 0 . 0 0
-8.0
0-7
.00
-6.0
0-5
.00
Ex
cit
ati
on
at
40
km
-4.0
0-3
.00
F o u r i e r V e l o c i t y - E X
1 . 0 0 5 . 7 5 1 0 . 5 0F r e q ( H Z )
1 5 . 2 5 2 0 . 0 0
-8.0
0-7
.00
-6.0
0-5
.00
Ex
cit
ati
on
at
40
km
-4.0
0-3
.00
F o u r i e r V e l o c i t y - E X
1 . 0 0 5 . 7 5 1 0 . 5 0F r e q ( H Z )
1 5 . 2 5 2 0 . 0 0
-8.0
0-7
.00
-6.0
0-5
.00
Ex
cit
ati
on
at
40
km
-4.0
0-3
.00
F o u r i e r V e l o c i t y - E X
1 . 0 0 5 . 7 5 1 0 . 5 0F r e q ( H Z )
1 5 . 2 5 2 0 . 0 0
-8.0
0-7
.00
-6.0
0-5
.00
Ex
cit
ati
on
at
40
km
-4.0
0-3
.00
F o u r i e r V e l o c i t y - E X
1 . 0 0 5 . 7 5 1 0 . 5 0F r e q ( H Z )
1 5 . 2 5 2 0 . 0 0
-8.0
0-7
.00
-6.0
0-5
.00
Ex
cit
ati
on
at
40
km
-4.0
0-3
.00
F o u r i e r V e l o c i t y - E X
1 . 0 0 5 . 7 5 1 0 . 5 0F r e q ( H Z )
1 5 . 2 5 2 0 . 0 0
-8.0
0-7
.00
-6.0
0-5
.00
Ex
cit
ati
on
at
40
km
-4.0
0-3
.00
F o u r i e r V e l o c i t y - E X
1 . 0 0 5 . 7 5 1 0 . 5 0F r e q ( H Z )
1 5 . 2 5 2 0 . 0 0
-8.0
0-7
.00
-6.0
0-5
.00
Ex
cit
ati
on
at
40
km
-4.0
0-3
.00
F o u r i e r V e l o c i t y - E X
1 . 0 0 5 . 7 5 1 0 . 5 0F r e q ( H Z )
1 5 . 2 5 2 0 . 0 0
-8.0
0-7
.00
-6.0
0-5
.00
Ex
cit
ati
on
at
40
km
-4.0
0-3
.00
F o u r i e r V e l o c i t y - E X
1 . 0 0 5 . 7 5 1 0 . 5 0F r e q ( H Z )
1 5 . 2 5 2 0 . 0 0
-8.0
0-7
.00
-6.0
0-5
.00
Ex
cit
ati
on
at
40
km
-4.0
0-3
.00
F o u r i e r V e l o c i t y - E X
1 . 0 0 5 . 7 5 1 0 . 5 0F r e q ( H Z )
1 5 . 2 5 2 0 . 0 0
-8.0
0-7
.00
-6.0
0-5
.00
Ex
cit
ati
on
at
40
km
-4.0
0-3
.00
F o u r i e r V e l o c i t y - E X
1 . 0 0 5 . 7 5 1 0 . 5 0F r e q ( H Z )
1 5 . 2 5 2 0 . 0 0
-8.0
0-7
.00
-6.0
0-5
.00
Ex
cit
ati
on
at
40
km
-4.0
0-3
.00
F o u r i e r V e l o c i t y - E X
1 . 0 0 5 . 7 5 1 0 . 5 0F r e q ( H Z )
1 5 . 2 5 2 0 . 0 0
-8.0
0-7
.00
-6.0
0-5
.00
Ex
cit
ati
on
at
40
km
-4.0
0-3
.00
F o u r i e r V e l o c i t y - E X
1 . 0 0 5 . 7 5 1 0 . 5 0F r e q ( H Z )
1 5 . 2 5 2 0 . 0 0
-8.0
0-7
.00
-6.0
0-5
.00
Ex
cit
ati
on
at
40
km
-4.0
0-3
.00
F o u r i e r V e l o c i t y - E X
1 . 0 0 5 . 7 5 1 0 . 5 0F r e q ( H Z )
1 5 . 2 5 2 0 . 0 0
-8.0
0-7
.00
-6.0
0-5
.00
Ex
cit
ati
on
at
40
km
-4.0
0-3
.00
F o u r i e r V e l o c i t y - E X
1 . 0 0 5 . 7 5 1 0 . 5 0F r e q ( H Z )
1 5 . 2 5 2 0 . 0 0
-8.0
0-7
.00
-6.0
0-5
.00
Ex
cit
ati
on
at
40
km
-4.0
0-3
.00
F o u r i e r V e l o c i t y - E X
1 . 0 0 5 . 7 5 1 0 . 5 0F r e q ( H Z )
1 5 . 2 5 2 0 . 0 0
-8.0
0-7
.00
-6.0
0-5
.00
Ex
cit
ati
on
at
40
km
-4.0
0-3
.00
F o u r i e r V e l o c i t y - E X
1 . 0 0 5 . 7 5 1 0 . 5 0F r e q ( H Z )
1 5 . 2 5 2 0 . 0 0
-8.0
0-7
.00
-6.0
0-5
.00
Ex
cit
ati
on
at
40
km
-4.0
0-3
.00
F o u r i e r V e l o c i t y - E X
1 . 0 0 5 . 7 5 1 0 . 5 0F r e q ( H Z )
1 5 . 2 5 2 0 . 0 0
-8.0
0-7
.00
-6.0
0-5
.00
Ex
cit
ati
on
at
40
km
-4.0
0-3
.00
F o u r i e r V e l o c i t y - E X
1 . 0 0 5 . 7 5 1 0 . 5 0F r e q ( H Z )
1 5 . 2 5 2 0 . 0 0
-8.0
0-7
.00
-6.0
0-5
.00
Ex
cit
ati
on
at
40
km
-4.0
0-3
.00
F o u r i e r V e l o c i t y - E X
1 . 0 0 5 . 7 5 1 0 . 5 0F r e q ( H Z )
1 5 . 2 5 2 0 . 0 0
-8.0
0-7
.00
-6.0
0-5
.00
Ex
cit
ati
on
at
40
km
-4.0
0-3
.00
F o u r i e r V e l o c i t y - E X
1 . 0 0 5 . 7 5 1 0 . 5 0F r e q ( H Z )
1 5 . 2 5 2 0 . 0 0
-8.0
0-7
.00
-6.0
0-5
.00
Ex
cit
ati
on
at
40
km
-4.0
0-3
.00
F o u r i e r V e l o c i t y - E X
1 . 0 0 5 . 7 5 1 0 . 5 0F r e q ( H Z )
1 5 . 2 5 2 0 . 0 0
-8.0
0-7
.00
-6.0
0-5
.00
Ex
cit
ati
on
at
40
km
-4.0
0-3
.00
F o u r i e r V e l o c i t y - E X
1 . 0 0 5 . 7 5 1 0 . 5 0F r e q ( H Z )
1 5 . 2 5 2 0 . 0 0
-8.0
0-7
.00
-6.0
0-5
.00
Ex
cit
ati
on
at
40
km
-4.0
0-3
.00
F o u r i e r V e l o c i t y - E X
1 . 0 0 5 . 7 5 1 0 . 5 0F r e q ( H Z )
1 5 . 2 5 2 0 . 0 0
-8.0
0-7
.00
-6.0
0-5
.00
Ex
cit
ati
on
at
40
km
-4.0
0-3
.00
F o u r i e r V e l o c i t y - E X
1 . 0 0 5 . 7 5 1 0 . 5 0F r e q ( H Z )
1 5 . 2 5 2 0 . 0 0
-8.0
0-7
.00
-6.0
0-5
.00
Ex
cit
ati
on
at
40
km
-4.0
0-3
.00
F o u r i e r V e l o c i t y - E X
1 . 0 0 5 . 7 5 1 0 . 5 0F r e q ( H Z )
1 5 . 2 5 2 0 . 0 0
-8.0
0-7
.00
-6.0
0-5
.00
Ex
cit
ati
on
at
40
km
-4.0
0-3
.00
F o u r i e r V e l o c i t y - E X
1 . 0 0 5 . 7 5 1 0 . 5 0F r e q ( H Z )
1 5 . 2 5 2 0 . 0 0
-8.0
0-7
.00
-6.0
0-5
.00
Ex
cit
ati
on
at
40
km
-4.0
0-3
.00
F o u r i e r V e l o c i t y - E X
1 . 0 0 5 . 7 5 1 0 . 5 0F r e q ( H Z )
1 5 . 2 5 2 0 . 0 0
-8.0
0-7
.00
-6.0
0-5
.00
Ex
cit
ati
on
at
40
km
-4.0
0-3
.00
F o u r i e r V e l o c i t y - E X
1 . 0 0 5 . 7 5 1 0 . 5 0F r e q ( H Z )
1 5 . 2 5 2 0 . 0 0
-8.0
0-7
.00
-6.0
0-5
.00
Ex
cit
ati
on
at
40
km
-4.0
0-3
.00
F o u r i e r V e l o c i t y - E X
1 . 0 0 5 . 7 5 1 0 . 5 0F r e q ( H Z )
1 5 . 2 5 2 0 . 0 0
-8.0
0-7
.00
-6.0
0-5
.00
Ex
cit
ati
on
at
40
km
-4.0
0-3
.00
F o u r i e r V e l o c i t y - E X
1 . 0 0 5 . 7 5 1 0 . 5 0F r e q ( H Z )
1 5 . 2 5 2 0 . 0 0
-8.0
0-7
.00
-6.0
0-5
.00
Ex
cit
ati
on
at
40
km
-4.0
0-3
.00
F o u r i e r V e l o c i t y - E X
1 . 0 0 5 . 7 5 1 0 . 5 0F r e q ( H Z )
1 5 . 2 5 2 0 . 0 0
-8.0
0-7
.00
-6.0
0-5
.00
Ex
cit
ati
on
at
40
km
-4.0
0-3
.00
F o u r i e r V e l o c i t y - E X
1 . 0 0 5 . 7 5 1 0 . 5 0F r e q ( H Z )
1 5 . 2 5 2 0 . 0 0
-8.0
0-7
.00
-6.0
0-5
.00
Ex
cit
ati
on
at
40
km
-4.0
0-3
.00
F o u r i e r V e l o c i t y - E X
1 . 0 0 5 . 7 5 1 0 . 5 0F r e q ( H Z )
1 5 . 2 5 2 0 . 0 0
-8.0
0-7
.00
-6.0
0-5
.00
Ex
cit
ati
on
at
40
km
-4.0
0-3
.00
F o u r i e r V e l o c i t y - E X
1 . 0 0 5 . 7 5 1 0 . 5 0F r e q ( H Z )
1 5 . 2 5 2 0 . 0 0
-8.0
0-7
.00
-6.0
0-5
.00
Ex
cit
ati
on
at
40
km
-4.0
0-3
.00
F o u r i e r V e l o c i t y - E X
1 . 0 0 5 . 7 5 1 0 . 5 0F r e q ( H Z )
1 5 . 2 5 2 0 . 0 0
-8.0
0-7
.00
-6.0
0-5
.00
Ex
cit
ati
on
at
40
km
-4.0
0-3
.00
F o u r i e r V e l o c i t y - E X
1 . 0 0 5 . 7 5 1 0 . 5 0F r e q ( H Z )
1 5 . 2 5 2 0 . 0 0
-8.0
0-7
.00
-6.0
0-5
.00
Ex
cit
ati
on
at
40
km
-4.0
0-3
.00
F o u r i e r V e l o c i t y - E X
1 . 0 0 5 . 7 5 1 0 . 5 0F r e q ( H Z )
1 5 . 2 5 2 0 . 0 0
-8.0
0-7
.00
-6.0
0-5
.00
Ex
cit
ati
on
at
40
km
-4.0
0-3
.00
F o u r i e r V e l o c i t y - E X
1 . 0 0 5 . 7 5 1 0 . 5 0F r e q ( H Z )
1 5 . 2 5 2 0 . 0 0
-8.0
0-7
.00
-6.0
0-5
.00
Ex
cit
ati
on
at
40
km
-4.0
0-3
.00
F o u r i e r V e l o c i t y - E X
1 . 0 0 5 . 7 5 1 0 . 5 0F r e q ( H Z )
1 5 . 2 5 2 0 . 0 0
-8.0
0-7
.00
-6.0
0-5
.00
Ex
cit
ati
on
at
40
km
-4.0
0-3
.00
F o u r i e r V e l o c i t y - E X
1 . 0 0 5 . 7 5 1 0 . 5 0F r e q ( H Z )
1 5 . 2 5 2 0 . 0 0
-8.0
0-7
.00
-6.0
0-5
.00
Ex
cit
ati
on
at
40
km
-4.0
0-3
.00
F o u r i e r V e l o c i t y - E X
1 . 0 0 5 . 7 5 1 0 . 5 0F r e q ( H Z )
1 5 . 2 5 2 0 . 0 0
-8.0
0-7
.00
-6.0
0-5
.00
Ex
cit
ati
on
at
40
km
-4.0
0-3
.00
F o u r i e r V e l o c i t y - E X
1 . 0 0 5 . 7 5 1 0 . 5 0F r e q ( H Z )
1 5 . 2 5 2 0 . 0 0
-8.0
0-7
.00
-6.0
0-5
.00
Ex
cit
ati
on
at
40
km
-4.0
0-3
.00
F o u r i e r V e l o c i t y - E X
1 . 0 0 5 . 7 5 1 0 . 5 0F r e q ( H Z )
1 5 . 2 5 2 0 . 0 0
-8.0
0-7
.00
-6.0
0-5
.00
Ex
cit
ati
on
at
40
km
-4.0
0-3
.00
F o u r i e r V e l o c i t y - E X
1 . 0 0 5 . 7 5 1 0 . 5 0F r e q ( H Z )
1 5 . 2 5 2 0 . 0 0
-8.0
0-7
.00
-6.0
0-5
.00
Ex
cit
ati
on
at
40
km
-4.0
0-3
.00
F o u r i e r V e l o c i t y - E X
1 . 0 0 5 . 7 5 1 0 . 5 0F r e q ( H Z )
1 5 . 2 5 2 0 . 0 0
-8.0
0-7
.00
-6.0
0-5
.00
Ex
cit
ati
on
at
40
km
-4.0
0-3
.00
F o u r i e r V e l o c i t y - E X
1 . 0 0 5 . 7 5 1 0 . 5 0F r e q ( H Z )
1 5 . 2 5 2 0 . 0 0
-8.0
0-7
.00
-6.0
0-5
.00
Ex
cit
ati
on
at
40
km
-4.0
0-3
.00
F o u r i e r V e l o c i t y - E X
1 . 0 0 5 . 7 5 1 0 . 5 0F r e q ( H Z )
1 5 . 2 5 2 0 . 0 0
-8.0
0-7
.00
-6.0
0-5
.00
Ex
cit
ati
on
at
40
km
-4.0
0-3
.00
F o u r i e r V e l o c i t y - E X
1 . 0 0 5 . 7 5 1 0 . 5 0F r e q ( H Z )
1 5 . 2 5 2 0 . 0 0
-8.0
0-7
.00
-6.0
0-5
.00
Ex
cit
ati
on
at
40
km
-4.0
0-3
.00
F o u r i e r V e l o c i t y - E X
1 . 0 0 5 . 7 5 1 0 . 5 0F r e q ( H Z )
1 5 . 2 5 2 0 . 0 0
-8.0
0-7
.00
-6.0
0-5
.00
Ex
cit
ati
on
at
40
km
-4.0
0-3
.00
F o u r i e r V e l o c i t y - E X
1 . 0 0 5 . 7 5 1 0 . 5 0F r e q ( H Z )
1 5 . 2 5 2 0 . 0 0
-8.0
0-7
.00
-6.0
0-5
.00
Ex
cit
ati
on
at
40
km
-4.0
0-3
.00
F o u r i e r V e l o c i t y - E X
1 . 0 0 5 . 7 5 1 0 . 5 0F r e q ( H Z )
1 5 . 2 5 2 0 . 0 0
-8.0
0-7
.00
-6.0
0-5
.00
Ex
cit
ati
on
at
40
km
-4.0
0-3
.00
F o u r i e r V e l o c i t y - E X
1 . 0 0 5 . 7 5 1 0 . 5 0F r e q ( H Z )
1 5 . 2 5 2 0 . 0 0
-8.0
0-7
.00
-6.0
0-5
.00
Ex
cit
ati
on
at
40
km
-4.0
0-3
.00
F o u r i e r V e l o c i t y - E X
1 . 0 0 5 . 7 5 1 0 . 5 0F r e q ( H Z )
1 5 . 2 5 2 0 . 0 0
-8.0
0-7
.00
-6.0
0-5
.00
Ex
cit
ati
on
at
40
km
-4.0
0-3
.00
F o u r i e r V e l o c i t y - E X
1 . 0 0 5 . 7 5 1 0 . 5 0F r e q ( H Z )
1 5 . 2 5 2 0 . 0 0
-8.0
0-7
.00
-6.0
0-5
.00
Ex
cit
ati
on
at
40
km
-4.0
0-3
.00
F o u r i e r V e l o c i t y - E X
1 . 0 0 5 . 7 5 1 0 . 5 0F r e q ( H Z )
1 5 . 2 5 2 0 . 0 0
-8.0
0-7
.00
-6.0
0-5
.00
Ex
cit
ati
on
at
40
km
-4.0
0-3
.00
F o u r i e r V e l o c i t y - E X
1 . 0 0 5 . 7 5 1 0 . 5 0F r e q ( H Z )
1 5 . 2 5 2 0 . 0 0
-8.0
0-7
.00
-6.0
0-5
.00
Ex
cit
ati
on
at
40
km
-4.0
0-3
.00
F o u r i e r V e l o c i t y - E X
1 . 0 0 5 . 7 5 1 0 . 5 0F r e q ( H Z )
1 5 . 2 5 2 0 . 0 0
-8.0
0-7
.00
-6.0
0-5
.00
Ex
cit
ati
on
at
40
km
-4.0
0-3
.00
F o u r i e r V e l o c i t y - E X
1 . 0 0 5 . 7 5 1 0 . 5 0F r e q ( H Z )
1 5 . 2 5 2 0 . 0 0
-8.0
0-7
.00
-6.0
0-5
.00
Ex
cit
ati
on
at
40
km
-4.0
0-3
.00
F o u r i e r V e l o c i t y - E X
1 . 0 0 5 . 7 5 1 0 . 5 0F r e q ( H Z )
1 5 . 2 5 2 0 . 0 0
-8.0
0-7
.00
-6.0
0-5
.00
Ex
cit
ati
on
at
40
km
-4.0
0-3
.00
F o u r i e r V e l o c i t y - E X
Figure 3.12: Inverted Fourier velocity excitation terms for the mining re-lated events recorded by vertical component velocity seismograms plottedon a linear frequency scale

56
1 . 0 0 5 . 7 5 1 0 . 5 0F r e q ( H Z )
1 5 . 2 5 2 0 . 0 0
-8.0
0-7
.00
-6.0
0-5
.00
Ex
cit
ati
on
at
40
km
-4.0
0-3
.00
F i l t e r e d G r o u n d V e l o c i t y
1 . 0 0 5 . 7 5 1 0 . 5 0F r e q ( H Z )
1 5 . 2 5 2 0 . 0 0
-8.0
0-7
.00
-6.0
0-5
.00
Ex
cit
ati
on
at
40
km
-4.0
0-3
.00
F i l t e r e d G r o u n d V e l o c i t y
1 . 0 0 5 . 7 5 1 0 . 5 0F r e q ( H Z )
1 5 . 2 5 2 0 . 0 0
-8.0
0-7
.00
-6.0
0-5
.00
Ex
cit
ati
on
at
40
km
-4.0
0-3
.00
F i l t e r e d G r o u n d V e l o c i t y
1 . 0 0 5 . 7 5 1 0 . 5 0F r e q ( H Z )
1 5 . 2 5 2 0 . 0 0
-8.0
0-7
.00
-6.0
0-5
.00
Ex
cit
ati
on
at
40
km
-4.0
0-3
.00
F i l t e r e d G r o u n d V e l o c i t y
1 . 0 0 5 . 7 5 1 0 . 5 0F r e q ( H Z )
1 5 . 2 5 2 0 . 0 0
-8.0
0-7
.00
-6.0
0-5
.00
Ex
cit
ati
on
at
40
km
-4.0
0-3
.00
F i l t e r e d G r o u n d V e l o c i t y
1 . 0 0 5 . 7 5 1 0 . 5 0F r e q ( H Z )
1 5 . 2 5 2 0 . 0 0
-8.0
0-7
.00
-6.0
0-5
.00
Ex
cit
ati
on
at
40
km
-4.0
0-3
.00
F i l t e r e d G r o u n d V e l o c i t y
1 . 0 0 5 . 7 5 1 0 . 5 0F r e q ( H Z )
1 5 . 2 5 2 0 . 0 0
-8.0
0-7
.00
-6.0
0-5
.00
Ex
cit
ati
on
at
40
km
-4.0
0-3
.00
F i l t e r e d G r o u n d V e l o c i t y
1 . 0 0 5 . 7 5 1 0 . 5 0F r e q ( H Z )
1 5 . 2 5 2 0 . 0 0
-8.0
0-7
.00
-6.0
0-5
.00
Ex
cit
ati
on
at
40
km
-4.0
0-3
.00
F i l t e r e d G r o u n d V e l o c i t y
1 . 0 0 5 . 7 5 1 0 . 5 0F r e q ( H Z )
1 5 . 2 5 2 0 . 0 0
-8.0
0-7
.00
-6.0
0-5
.00
Ex
cit
ati
on
at
40
km
-4.0
0-3
.00
F i l t e r e d G r o u n d V e l o c i t y
1 . 0 0 5 . 7 5 1 0 . 5 0F r e q ( H Z )
1 5 . 2 5 2 0 . 0 0
-8.0
0-7
.00
-6.0
0-5
.00
Ex
cit
ati
on
at
40
km
-4.0
0-3
.00
F i l t e r e d G r o u n d V e l o c i t y
1 . 0 0 5 . 7 5 1 0 . 5 0F r e q ( H Z )
1 5 . 2 5 2 0 . 0 0
-8.0
0-7
.00
-6.0
0-5
.00
Ex
cit
ati
on
at
40
km
-4.0
0-3
.00
F i l t e r e d G r o u n d V e l o c i t y
1 . 0 0 5 . 7 5 1 0 . 5 0F r e q ( H Z )
1 5 . 2 5 2 0 . 0 0
-8.0
0-7
.00
-6.0
0-5
.00
Ex
cit
ati
on
at
40
km
-4.0
0-3
.00
F i l t e r e d G r o u n d V e l o c i t y
1 . 0 0 5 . 7 5 1 0 . 5 0F r e q ( H Z )
1 5 . 2 5 2 0 . 0 0
-8.0
0-7
.00
-6.0
0-5
.00
Ex
cit
ati
on
at
40
km
-4.0
0-3
.00
F i l t e r e d G r o u n d V e l o c i t y
1 . 0 0 5 . 7 5 1 0 . 5 0F r e q ( H Z )
1 5 . 2 5 2 0 . 0 0
-8.0
0-7
.00
-6.0
0-5
.00
Ex
cit
ati
on
at
40
km
-4.0
0-3
.00
F i l t e r e d G r o u n d V e l o c i t y
1 . 0 0 5 . 7 5 1 0 . 5 0F r e q ( H Z )
1 5 . 2 5 2 0 . 0 0
-8.0
0-7
.00
-6.0
0-5
.00
Ex
cit
ati
on
at
40
km
-4.0
0-3
.00
F i l t e r e d G r o u n d V e l o c i t y
1 . 0 0 5 . 7 5 1 0 . 5 0F r e q ( H Z )
1 5 . 2 5 2 0 . 0 0
-8.0
0-7
.00
-6.0
0-5
.00
Ex
cit
ati
on
at
40
km
-4.0
0-3
.00
F i l t e r e d G r o u n d V e l o c i t y
1 . 0 0 5 . 7 5 1 0 . 5 0F r e q ( H Z )
1 5 . 2 5 2 0 . 0 0
-8.0
0-7
.00
-6.0
0-5
.00
Ex
cit
ati
on
at
40
km
-4.0
0-3
.00
F i l t e r e d G r o u n d V e l o c i t y
1 . 0 0 5 . 7 5 1 0 . 5 0F r e q ( H Z )
1 5 . 2 5 2 0 . 0 0
-8.0
0-7
.00
-6.0
0-5
.00
Ex
cit
ati
on
at
40
km
-4.0
0-3
.00
F i l t e r e d G r o u n d V e l o c i t y
1 . 0 0 5 . 7 5 1 0 . 5 0F r e q ( H Z )
1 5 . 2 5 2 0 . 0 0
-8.0
0-7
.00
-6.0
0-5
.00
Ex
cit
ati
on
at
40
km
-4.0
0-3
.00
F i l t e r e d G r o u n d V e l o c i t y
1 . 0 0 5 . 7 5 1 0 . 5 0F r e q ( H Z )
1 5 . 2 5 2 0 . 0 0
-8.0
0-7
.00
-6.0
0-5
.00
Ex
cit
ati
on
at
40
km
-4.0
0-3
.00
F i l t e r e d G r o u n d V e l o c i t y
1 . 0 0 5 . 7 5 1 0 . 5 0F r e q ( H Z )
1 5 . 2 5 2 0 . 0 0
-8.0
0-7
.00
-6.0
0-5
.00
Ex
cit
ati
on
at
40
km
-4.0
0-3
.00
F i l t e r e d G r o u n d V e l o c i t y
1 . 0 0 5 . 7 5 1 0 . 5 0F r e q ( H Z )
1 5 . 2 5 2 0 . 0 0
-8.0
0-7
.00
-6.0
0-5
.00
Ex
cit
ati
on
at
40
km
-4.0
0-3
.00
F i l t e r e d G r o u n d V e l o c i t y
1 . 0 0 5 . 7 5 1 0 . 5 0F r e q ( H Z )
1 5 . 2 5 2 0 . 0 0
-8.0
0-7
.00
-6.0
0-5
.00
Ex
cit
ati
on
at
40
km
-4.0
0-3
.00
F i l t e r e d G r o u n d V e l o c i t y
1 . 0 0 5 . 7 5 1 0 . 5 0F r e q ( H Z )
1 5 . 2 5 2 0 . 0 0
-8.0
0-7
.00
-6.0
0-5
.00
Ex
cit
ati
on
at
40
km
-4.0
0-3
.00
F i l t e r e d G r o u n d V e l o c i t y
1 . 0 0 5 . 7 5 1 0 . 5 0F r e q ( H Z )
1 5 . 2 5 2 0 . 0 0
-8.0
0-7
.00
-6.0
0-5
.00
Ex
cit
ati
on
at
40
km
-4.0
0-3
.00
F i l t e r e d G r o u n d V e l o c i t y
1 . 0 0 5 . 7 5 1 0 . 5 0F r e q ( H Z )
1 5 . 2 5 2 0 . 0 0
-8.0
0-7
.00
-6.0
0-5
.00
Ex
cit
ati
on
at
40
km
-4.0
0-3
.00
F i l t e r e d G r o u n d V e l o c i t y
1 . 0 0 5 . 7 5 1 0 . 5 0F r e q ( H Z )
1 5 . 2 5 2 0 . 0 0
-8.0
0-7
.00
-6.0
0-5
.00
Ex
cit
ati
on
at
40
km
-4.0
0-3
.00
F i l t e r e d G r o u n d V e l o c i t y
1 . 0 0 5 . 7 5 1 0 . 5 0F r e q ( H Z )
1 5 . 2 5 2 0 . 0 0
-8.0
0-7
.00
-6.0
0-5
.00
Ex
cit
ati
on
at
40
km
-4.0
0-3
.00
F i l t e r e d G r o u n d V e l o c i t y
1 . 0 0 5 . 7 5 1 0 . 5 0F r e q ( H Z )
1 5 . 2 5 2 0 . 0 0
-8.0
0-7
.00
-6.0
0-5
.00
Ex
cit
ati
on
at
40
km
-4.0
0-3
.00
F i l t e r e d G r o u n d V e l o c i t y
1 . 0 0 5 . 7 5 1 0 . 5 0F r e q ( H Z )
1 5 . 2 5 2 0 . 0 0
-8.0
0-7
.00
-6.0
0-5
.00
Ex
cit
ati
on
at
40
km
-4.0
0-3
.00
F i l t e r e d G r o u n d V e l o c i t y
1 . 0 0 5 . 7 5 1 0 . 5 0F r e q ( H Z )
1 5 . 2 5 2 0 . 0 0
-8.0
0-7
.00
-6.0
0-5
.00
Ex
cit
ati
on
at
40
km
-4.0
0-3
.00
F i l t e r e d G r o u n d V e l o c i t y
1 . 0 0 5 . 7 5 1 0 . 5 0F r e q ( H Z )
1 5 . 2 5 2 0 . 0 0
-8.0
0-7
.00
-6.0
0-5
.00
Ex
cit
ati
on
at
40
km
-4.0
0-3
.00
F i l t e r e d G r o u n d V e l o c i t y
1 . 0 0 5 . 7 5 1 0 . 5 0F r e q ( H Z )
1 5 . 2 5 2 0 . 0 0
-8.0
0-7
.00
-6.0
0-5
.00
Ex
cit
ati
on
at
40
km
-4.0
0-3
.00
F i l t e r e d G r o u n d V e l o c i t y
1 . 0 0 5 . 7 5 1 0 . 5 0F r e q ( H Z )
1 5 . 2 5 2 0 . 0 0
-8.0
0-7
.00
-6.0
0-5
.00
Ex
cit
ati
on
at
40
km
-4.0
0-3
.00
F i l t e r e d G r o u n d V e l o c i t y
1 . 0 0 5 . 7 5 1 0 . 5 0F r e q ( H Z )
1 5 . 2 5 2 0 . 0 0
-8.0
0-7
.00
-6.0
0-5
.00
Ex
cit
ati
on
at
40
km
-4.0
0-3
.00
F i l t e r e d G r o u n d V e l o c i t y
1 . 0 0 5 . 7 5 1 0 . 5 0F r e q ( H Z )
1 5 . 2 5 2 0 . 0 0
-8.0
0-7
.00
-6.0
0-5
.00
Ex
cit
ati
on
at
40
km
-4.0
0-3
.00
F i l t e r e d G r o u n d V e l o c i t y
1 . 0 0 5 . 7 5 1 0 . 5 0F r e q ( H Z )
1 5 . 2 5 2 0 . 0 0
-8.0
0-7
.00
-6.0
0-5
.00
Ex
cit
ati
on
at
40
km
-4.0
0-3
.00
F i l t e r e d G r o u n d V e l o c i t y
1 . 0 0 5 . 7 5 1 0 . 5 0F r e q ( H Z )
1 5 . 2 5 2 0 . 0 0
-8.0
0-7
.00
-6.0
0-5
.00
Ex
cit
ati
on
at
40
km
-4.0
0-3
.00
F i l t e r e d G r o u n d V e l o c i t y
1 . 0 0 5 . 7 5 1 0 . 5 0F r e q ( H Z )
1 5 . 2 5 2 0 . 0 0
-8.0
0-7
.00
-6.0
0-5
.00
Ex
cit
ati
on
at
40
km
-4.0
0-3
.00
F i l t e r e d G r o u n d V e l o c i t y
1 . 0 0 5 . 7 5 1 0 . 5 0F r e q ( H Z )
1 5 . 2 5 2 0 . 0 0
-8.0
0-7
.00
-6.0
0-5
.00
Ex
cit
ati
on
at
40
km
-4.0
0-3
.00
F i l t e r e d G r o u n d V e l o c i t y
1 . 0 0 5 . 7 5 1 0 . 5 0F r e q ( H Z )
1 5 . 2 5 2 0 . 0 0
-8.0
0-7
.00
-6.0
0-5
.00
Ex
cit
ati
on
at
40
km
-4.0
0-3
.00
F i l t e r e d G r o u n d V e l o c i t y
1 . 0 0 5 . 7 5 1 0 . 5 0F r e q ( H Z )
1 5 . 2 5 2 0 . 0 0
-8.0
0-7
.00
-6.0
0-5
.00
Ex
cit
ati
on
at
40
km
-4.0
0-3
.00
F i l t e r e d G r o u n d V e l o c i t y
1 . 0 0 5 . 7 5 1 0 . 5 0F r e q ( H Z )
1 5 . 2 5 2 0 . 0 0
-8.0
0-7
.00
-6.0
0-5
.00
Ex
cit
ati
on
at
40
km
-4.0
0-3
.00
F i l t e r e d G r o u n d V e l o c i t y
1 . 0 0 5 . 7 5 1 0 . 5 0F r e q ( H Z )
1 5 . 2 5 2 0 . 0 0
-8.0
0-7
.00
-6.0
0-5
.00
Ex
cit
ati
on
at
40
km
-4.0
0-3
.00
F i l t e r e d G r o u n d V e l o c i t y
1 . 0 0 5 . 7 5 1 0 . 5 0F r e q ( H Z )
1 5 . 2 5 2 0 . 0 0
-8.0
0-7
.00
-6.0
0-5
.00
Ex
cit
ati
on
at
40
km
-4.0
0-3
.00
F i l t e r e d G r o u n d V e l o c i t y
1 . 0 0 5 . 7 5 1 0 . 5 0F r e q ( H Z )
1 5 . 2 5 2 0 . 0 0
-8.0
0-7
.00
-6.0
0-5
.00
Ex
cit
ati
on
at
40
km
-4.0
0-3
.00
F i l t e r e d G r o u n d V e l o c i t y
1 . 0 0 5 . 7 5 1 0 . 5 0F r e q ( H Z )
1 5 . 2 5 2 0 . 0 0
-8.0
0-7
.00
-6.0
0-5
.00
Ex
cit
ati
on
at
40
km
-4.0
0-3
.00
F i l t e r e d G r o u n d V e l o c i t y
1 . 0 0 5 . 7 5 1 0 . 5 0F r e q ( H Z )
1 5 . 2 5 2 0 . 0 0
-8.0
0-7
.00
-6.0
0-5
.00
Ex
cit
ati
on
at
40
km
-4.0
0-3
.00
F i l t e r e d G r o u n d V e l o c i t y
1 . 0 0 5 . 7 5 1 0 . 5 0F r e q ( H Z )
1 5 . 2 5 2 0 . 0 0
-8.0
0-7
.00
-6.0
0-5
.00
Ex
cit
ati
on
at
40
km
-4.0
0-3
.00
F i l t e r e d G r o u n d V e l o c i t y
1 . 0 0 5 . 7 5 1 0 . 5 0F r e q ( H Z )
1 5 . 2 5 2 0 . 0 0
-8.0
0-7
.00
-6.0
0-5
.00
Ex
cit
ati
on
at
40
km
-4.0
0-3
.00
F i l t e r e d G r o u n d V e l o c i t y
1 . 0 0 5 . 7 5 1 0 . 5 0F r e q ( H Z )
1 5 . 2 5 2 0 . 0 0
-8.0
0-7
.00
-6.0
0-5
.00
Ex
cit
ati
on
at
40
km
-4.0
0-3
.00
F i l t e r e d G r o u n d V e l o c i t y
1 . 0 0 5 . 7 5 1 0 . 5 0F r e q ( H Z )
1 5 . 2 5 2 0 . 0 0
-8.0
0-7
.00
-6.0
0-5
.00
Ex
cit
ati
on
at
40
km
-4.0
0-3
.00
F i l t e r e d G r o u n d V e l o c i t y
1 . 0 0 5 . 7 5 1 0 . 5 0F r e q ( H Z )
1 5 . 2 5 2 0 . 0 0
-8.0
0-7
.00
-6.0
0-5
.00
Ex
cit
ati
on
at
40
km
-4.0
0-3
.00
F i l t e r e d G r o u n d V e l o c i t y
1 . 0 0 5 . 7 5 1 0 . 5 0F r e q ( H Z )
1 5 . 2 5 2 0 . 0 0
-8.0
0-7
.00
-6.0
0-5
.00
Ex
cit
ati
on
at
40
km
-4.0
0-3
.00
F i l t e r e d G r o u n d V e l o c i t y
1 . 0 0 5 . 7 5 1 0 . 5 0F r e q ( H Z )
1 5 . 2 5 2 0 . 0 0
-8.0
0-7
.00
-6.0
0-5
.00
Ex
cit
ati
on
at
40
km
-4.0
0-3
.00
F i l t e r e d G r o u n d V e l o c i t y
1 . 0 0 5 . 7 5 1 0 . 5 0F r e q ( H Z )
1 5 . 2 5 2 0 . 0 0
-8.0
0-7
.00
-6.0
0-5
.00
Ex
cit
ati
on
at
40
km
-4.0
0-3
.00
F i l t e r e d G r o u n d V e l o c i t y
1 . 0 0 5 . 7 5 1 0 . 5 0F r e q ( H Z )
1 5 . 2 5 2 0 . 0 0
-8.0
0-7
.00
-6.0
0-5
.00
Ex
cit
ati
on
at
40
km
-4.0
0-3
.00
F i l t e r e d G r o u n d V e l o c i t y
1 . 0 0 5 . 7 5 1 0 . 5 0F r e q ( H Z )
1 5 . 2 5 2 0 . 0 0
-8.0
0-7
.00
-6.0
0-5
.00
Ex
cit
ati
on
at
40
km
-4.0
0-3
.00
F i l t e r e d G r o u n d V e l o c i t y
1 . 0 0 5 . 7 5 1 0 . 5 0F r e q ( H Z )
1 5 . 2 5 2 0 . 0 0
-8.0
0-7
.00
-6.0
0-5
.00
Ex
cit
ati
on
at
40
km
-4.0
0-3
.00
F i l t e r e d G r o u n d V e l o c i t y
1 . 0 0 5 . 7 5 1 0 . 5 0F r e q ( H Z )
1 5 . 2 5 2 0 . 0 0
-8.0
0-7
.00
-6.0
0-5
.00
Ex
cit
ati
on
at
40
km
-4.0
0-3
.00
F i l t e r e d G r o u n d V e l o c i t y
1 . 0 0 5 . 7 5 1 0 . 5 0F r e q ( H Z )
1 5 . 2 5 2 0 . 0 0
-8.0
0-7
.00
-6.0
0-5
.00
Ex
cit
ati
on
at
40
km
-4.0
0-3
.00
F i l t e r e d G r o u n d V e l o c i t y
1 . 0 0 5 . 7 5 1 0 . 5 0F r e q ( H Z )
1 5 . 2 5 2 0 . 0 0
-8.0
0-7
.00
-6.0
0-5
.00
Ex
cit
ati
on
at
40
km
-4.0
0-3
.00
F i l t e r e d G r o u n d V e l o c i t y
1 . 0 0 5 . 7 5 1 0 . 5 0F r e q ( H Z )
1 5 . 2 5 2 0 . 0 0
-8.0
0-7
.00
-6.0
0-5
.00
Ex
cit
ati
on
at
40
km
-4.0
0-3
.00
F i l t e r e d G r o u n d V e l o c i t y
1 . 0 0 5 . 7 5 1 0 . 5 0F r e q ( H Z )
1 5 . 2 5 2 0 . 0 0
-8.0
0-7
.00
-6.0
0-5
.00
Ex
cit
ati
on
at
40
km
-4.0
0-3
.00
F i l t e r e d G r o u n d V e l o c i t y
1 . 0 0 5 . 7 5 1 0 . 5 0F r e q ( H Z )
1 5 . 2 5 2 0 . 0 0
-8.0
0-7
.00
-6.0
0-5
.00
Ex
cit
ati
on
at
40
km
-4.0
0-3
.00
F i l t e r e d G r o u n d V e l o c i t y
1 . 0 0 5 . 7 5 1 0 . 5 0F r e q ( H Z )
1 5 . 2 5 2 0 . 0 0
-8.0
0-7
.00
-6.0
0-5
.00
Ex
cit
ati
on
at
40
km
-4.0
0-3
.00
F i l t e r e d G r o u n d V e l o c i t y
1 . 0 0 5 . 7 5 1 0 . 5 0F r e q ( H Z )
1 5 . 2 5 2 0 . 0 0
-8.0
0-7
.00
-6.0
0-5
.00
Ex
cit
ati
on
at
40
km
-4.0
0-3
.00
F i l t e r e d G r o u n d V e l o c i t y
1 . 0 0 5 . 7 5 1 0 . 5 0F r e q ( H Z )
1 5 . 2 5 2 0 . 0 0
-8.0
0-7
.00
-6.0
0-5
.00
Ex
cit
ati
on
at
40
km
-4.0
0-3
.00
F i l t e r e d G r o u n d V e l o c i t y
1 . 0 0 5 . 7 5 1 0 . 5 0F r e q ( H Z )
1 5 . 2 5 2 0 . 0 0
-8.0
0-7
.00
-6.0
0-5
.00
Ex
cit
ati
on
at
40
km
-4.0
0-3
.00
F i l t e r e d G r o u n d V e l o c i t y
1 . 0 0 5 . 7 5 1 0 . 5 0F r e q ( H Z )
1 5 . 2 5 2 0 . 0 0
-8.0
0-7
.00
-6.0
0-5
.00
Ex
cit
ati
on
at
40
km
-4.0
0-3
.00
F i l t e r e d G r o u n d V e l o c i t y
1 . 0 0 5 . 7 5 1 0 . 5 0F r e q ( H Z )
1 5 . 2 5 2 0 . 0 0
-8.0
0-7
.00
-6.0
0-5
.00
Ex
cit
ati
on
at
40
km
-4.0
0-3
.00
F i l t e r e d G r o u n d V e l o c i t y
1 . 0 0 5 . 7 5 1 0 . 5 0F r e q ( H Z )
1 5 . 2 5 2 0 . 0 0
-8.0
0-7
.00
-6.0
0-5
.00
Ex
cit
ati
on
at
40
km
-4.0
0-3
.00
F i l t e r e d G r o u n d V e l o c i t y
1 . 0 0 5 . 7 5 1 0 . 5 0F r e q ( H Z )
1 5 . 2 5 2 0 . 0 0
-8.0
0-7
.00
-6.0
0-5
.00
Ex
cit
ati
on
at
40
km
-4.0
0-3
.00
F i l t e r e d G r o u n d V e l o c i t y
1 . 0 0 5 . 7 5 1 0 . 5 0F r e q ( H Z )
1 5 . 2 5 2 0 . 0 0
-8.0
0-7
.00
-6.0
0-5
.00
Ex
cit
ati
on
at
40
km
-4.0
0-3
.00
F i l t e r e d G r o u n d V e l o c i t y
1 . 0 0 5 . 7 5 1 0 . 5 0F r e q ( H Z )
1 5 . 2 5 2 0 . 0 0
-8.0
0-7
.00
-6.0
0-5
.00
Ex
cit
ati
on
at
40
km
-4.0
0-3
.00
F i l t e r e d G r o u n d V e l o c i t y
1 . 0 0 5 . 7 5 1 0 . 5 0F r e q ( H Z )
1 5 . 2 5 2 0 . 0 0
-8.0
0-7
.00
-6.0
0-5
.00
Ex
cit
ati
on
at
40
km
-4.0
0-3
.00
F i l t e r e d G r o u n d V e l o c i t y
1 . 0 0 5 . 7 5 1 0 . 5 0F r e q ( H Z )
1 5 . 2 5 2 0 . 0 0
-8.0
0-7
.00
-6.0
0-5
.00
Ex
cit
ati
on
at
40
km
-4.0
0-3
.00
F i l t e r e d G r o u n d V e l o c i t y
1 . 0 0 5 . 7 5 1 0 . 5 0F r e q ( H Z )
1 5 . 2 5 2 0 . 0 0
-8.0
0-7
.00
-6.0
0-5
.00
Ex
cit
ati
on
at
40
km
-4.0
0-3
.00
F i l t e r e d G r o u n d V e l o c i t y
1 . 0 0 5 . 7 5 1 0 . 5 0F r e q ( H Z )
1 5 . 2 5 2 0 . 0 0
-8.0
0-7
.00
-6.0
0-5
.00
Ex
cit
ati
on
at
40
km
-4.0
0-3
.00
F i l t e r e d G r o u n d V e l o c i t y
1 . 0 0 5 . 7 5 1 0 . 5 0F r e q ( H Z )
1 5 . 2 5 2 0 . 0 0
-8.0
0-7
.00
-6.0
0-5
.00
Ex
cit
ati
on
at
40
km
-4.0
0-3
.00
F i l t e r e d G r o u n d V e l o c i t y
1 . 0 0 5 . 7 5 1 0 . 5 0F r e q ( H Z )
1 5 . 2 5 2 0 . 0 0
-8.0
0-7
.00
-6.0
0-5
.00
Ex
cit
ati
on
at
40
km
-4.0
0-3
.00
F i l t e r e d G r o u n d V e l o c i t y
1 . 0 0 5 . 7 5 1 0 . 5 0F r e q ( H Z )
1 5 . 2 5 2 0 . 0 0
-8.0
0-7
.00
-6.0
0-5
.00
Ex
cit
ati
on
at
40
km
-4.0
0-3
.00
F i l t e r e d G r o u n d V e l o c i t y
1 . 0 0 5 . 7 5 1 0 . 5 0F r e q ( H Z )
1 5 . 2 5 2 0 . 0 0
-8.0
0-7
.00
-6.0
0-5
.00
Ex
cit
ati
on
at
40
km
-4.0
0-3
.00
F i l t e r e d G r o u n d V e l o c i t y
1 . 0 0 5 . 7 5 1 0 . 5 0F r e q ( H Z )
1 5 . 2 5 2 0 . 0 0
-8.0
0-7
.00
-6.0
0-5
.00
Ex
cit
ati
on
at
40
km
-4.0
0-3
.00
F i l t e r e d G r o u n d V e l o c i t y
1 . 0 0 5 . 7 5 1 0 . 5 0F r e q ( H Z )
1 5 . 2 5 2 0 . 0 0
-8.0
0-7
.00
-6.0
0-5
.00
Ex
cit
ati
on
at
40
km
-4.0
0-3
.00
F i l t e r e d G r o u n d V e l o c i t y
1 . 0 0 5 . 7 5 1 0 . 5 0F r e q ( H Z )
1 5 . 2 5 2 0 . 0 0
-8.0
0-7
.00
-6.0
0-5
.00
Ex
cit
ati
on
at
40
km
-4.0
0-3
.00
F i l t e r e d G r o u n d V e l o c i t y
1 . 0 0 5 . 7 5 1 0 . 5 0F r e q ( H Z )
1 5 . 2 5 2 0 . 0 0
-8.0
0-7
.00
-6.0
0-5
.00
Ex
cit
ati
on
at
40
km
-4.0
0-3
.00
F i l t e r e d G r o u n d V e l o c i t y
1 . 0 0 5 . 7 5 1 0 . 5 0F r e q ( H Z )
1 5 . 2 5 2 0 . 0 0
-8.0
0-7
.00
-6.0
0-5
.00
Ex
cit
ati
on
at
40
km
-4.0
0-3
.00
F i l t e r e d G r o u n d V e l o c i t y
1 . 0 0 5 . 7 5 1 0 . 5 0F r e q ( H Z )
1 5 . 2 5 2 0 . 0 0
-8.0
0-7
.00
-6.0
0-5
.00
Ex
cit
ati
on
at
40
km
-4.0
0-3
.00
F i l t e r e d G r o u n d V e l o c i t y
1 . 0 0 5 . 7 5 1 0 . 5 0F r e q ( H Z )
1 5 . 2 5 2 0 . 0 0
-8.0
0-7
.00
-6.0
0-5
.00
Ex
cit
ati
on
at
40
km
-4.0
0-3
.00
F i l t e r e d G r o u n d V e l o c i t y
1 . 0 0 5 . 7 5 1 0 . 5 0F r e q ( H Z )
1 5 . 2 5 2 0 . 0 0
-8.0
0-7
.00
-6.0
0-5
.00
Ex
cit
ati
on
at
40
km
-4.0
0-3
.00
F i l t e r e d G r o u n d V e l o c i t y
1 . 0 0 5 . 7 5 1 0 . 5 0F r e q ( H Z )
1 5 . 2 5 2 0 . 0 0
-8.0
0-7
.00
-6.0
0-5
.00
Ex
cit
ati
on
at
40
km
-4.0
0-3
.00
F i l t e r e d G r o u n d V e l o c i t y
1 . 0 0 5 . 7 5 1 0 . 5 0F r e q ( H Z )
1 5 . 2 5 2 0 . 0 0
-8.0
0-7
.00
-6.0
0-5
.00
Ex
cit
ati
on
at
40
km
-4.0
0-3
.00
F i l t e r e d G r o u n d V e l o c i t y
1 . 0 0 5 . 7 5 1 0 . 5 0F r e q ( H Z )
1 5 . 2 5 2 0 . 0 0
-8.0
0-7
.00
-6.0
0-5
.00
Ex
cit
ati
on
at
40
km
-4.0
0-3
.00
F i l t e r e d G r o u n d V e l o c i t y
1 . 0 0 5 . 7 5 1 0 . 5 0F r e q ( H Z )
1 5 . 2 5 2 0 . 0 0
-8.0
0-7
.00
-6.0
0-5
.00
Ex
cit
ati
on
at
40
km
-4.0
0-3
.00
F i l t e r e d G r o u n d V e l o c i t y
1 . 0 0 5 . 7 5 1 0 . 5 0F r e q ( H Z )
1 5 . 2 5 2 0 . 0 0
-8.0
0-7
.00
-6.0
0-5
.00
Ex
cit
ati
on
at
40
km
-4.0
0-3
.00
F i l t e r e d G r o u n d V e l o c i t y
1 . 0 0 5 . 7 5 1 0 . 5 0F r e q ( H Z )
1 5 . 2 5 2 0 . 0 0
-8.0
0-7
.00
-6.0
0-5
.00
Ex
cit
ati
on
at
40
km
-4.0
0-3
.00
F i l t e r e d G r o u n d V e l o c i t y
1 . 0 0 5 . 7 5 1 0 . 5 0F r e q ( H Z )
1 5 . 2 5 2 0 . 0 0
-8.0
0-7
.00
-6.0
0-5
.00
Ex
cit
ati
on
at
40
km
-4.0
0-3
.00
F i l t e r e d G r o u n d V e l o c i t y
1 . 0 0 5 . 7 5 1 0 . 5 0F r e q ( H Z )
1 5 . 2 5 2 0 . 0 0
-8.0
0-7
.00
-6.0
0-5
.00
Ex
cit
ati
on
at
40
km
-4.0
0-3
.00
F i l t e r e d G r o u n d V e l o c i t y
1 . 0 0 5 . 7 5 1 0 . 5 0F r e q ( H Z )
1 5 . 2 5 2 0 . 0 0
-8.0
0-7
.00
-6.0
0-5
.00
Ex
cit
ati
on
at
40
km
-4.0
0-3
.00
F i l t e r e d G r o u n d V e l o c i t y
1 . 0 0 5 . 7 5 1 0 . 5 0F r e q ( H Z )
1 5 . 2 5 2 0 . 0 0
-8.0
0-7
.00
-6.0
0-5
.00
Ex
cit
ati
on
at
40
km
-4.0
0-3
.00
F i l t e r e d G r o u n d V e l o c i t y
1 . 0 0 5 . 7 5 1 0 . 5 0F r e q ( H Z )
1 5 . 2 5 2 0 . 0 0
-8.0
0-7
.00
-6.0
0-5
.00
Ex
cit
ati
on
at
40
km
-4.0
0-3
.00
F i l t e r e d G r o u n d V e l o c i t y
1 . 0 0 5 . 7 5 1 0 . 5 0F r e q ( H Z )
1 5 . 2 5 2 0 . 0 0
-8.0
0-7
.00
-6.0
0-5
.00
Ex
cit
ati
on
at
40
km
-4.0
0-3
.00
F i l t e r e d G r o u n d V e l o c i t y
1 . 0 0 5 . 7 5 1 0 . 5 0F r e q ( H Z )
1 5 . 2 5 2 0 . 0 0
-8.0
0-7
.00
-6.0
0-5
.00
Ex
cit
ati
on
at
40
km
-4.0
0-3
.00
F i l t e r e d G r o u n d V e l o c i t y
1 . 0 0 5 . 7 5 1 0 . 5 0F r e q ( H Z )
1 5 . 2 5 2 0 . 0 0
-8.0
0-7
.00
-6.0
0-5
.00
Ex
cit
ati
on
at
40
km
-4.0
0-3
.00
F i l t e r e d G r o u n d V e l o c i t y
1 . 0 0 5 . 7 5 1 0 . 5 0F r e q ( H Z )
1 5 . 2 5 2 0 . 0 0
-8.0
0-7
.00
-6.0
0-5
.00
Ex
cit
ati
on
at
40
km
-4.0
0-3
.00
F i l t e r e d G r o u n d V e l o c i t y
1 . 0 0 5 . 7 5 1 0 . 5 0F r e q ( H Z )
1 5 . 2 5 2 0 . 0 0
-8.0
0-7
.00
-6.0
0-5
.00
Ex
cit
ati
on
at
40
km
-4.0
0-3
.00
F i l t e r e d G r o u n d V e l o c i t y
1 . 0 0 5 . 7 5 1 0 . 5 0F r e q ( H Z )
1 5 . 2 5 2 0 . 0 0
-8.0
0-7
.00
-6.0
0-5
.00
Ex
cit
ati
on
at
40
km
-4.0
0-3
.00
F i l t e r e d G r o u n d V e l o c i t y
1 . 0 0 5 . 7 5 1 0 . 5 0F r e q ( H Z )
1 5 . 2 5 2 0 . 0 0
-8.0
0-7
.00
-6.0
0-5
.00
Ex
cit
ati
on
at
40
km
-4.0
0-3
.00
F i l t e r e d G r o u n d V e l o c i t y
1 . 0 0 5 . 7 5 1 0 . 5 0F r e q ( H Z )
1 5 . 2 5 2 0 . 0 0
-8.0
0-7
.00
-6.0
0-5
.00
Ex
cit
ati
on
at
40
km
-4.0
0-3
.00
F i l t e r e d G r o u n d V e l o c i t y
1 . 0 0 5 . 7 5 1 0 . 5 0F r e q ( H Z )
1 5 . 2 5 2 0 . 0 0
-8.0
0-7
.00
-6.0
0-5
.00
Ex
cit
ati
on
at
40
km
-4.0
0-3
.00
F i l t e r e d G r o u n d V e l o c i t y
1 . 0 0 5 . 7 5 1 0 . 5 0F r e q ( H Z )
1 5 . 2 5 2 0 . 0 0
-8.0
0-7
.00
-6.0
0-5
.00
Ex
cit
ati
on
at
40
km
-4.0
0-3
.00
F i l t e r e d G r o u n d V e l o c i t y
Figure 3.13: Inverted Filtered ground velocity excitation terms for theearthquake events recorded by vertical component velocity seismogramsplotted on a linear frequency scale

57
1 . 0 0 5 . 7 5 1 0 . 5 0F r e q ( H Z )
1 5 . 2 5 2 0 . 0 0
-8.0
0-7
.00
-6.0
0-5
.00
Ex
cit
ati
on
at
40
km
-4.0
0-3
.00
F i l t e r e d G r o u n d V e l o c i t y
1 . 0 0 5 . 7 5 1 0 . 5 0F r e q ( H Z )
1 5 . 2 5 2 0 . 0 0
-8.0
0-7
.00
-6.0
0-5
.00
Ex
cit
ati
on
at
40
km
-4.0
0-3
.00
F i l t e r e d G r o u n d V e l o c i t y
1 . 0 0 5 . 7 5 1 0 . 5 0F r e q ( H Z )
1 5 . 2 5 2 0 . 0 0
-8.0
0-7
.00
-6.0
0-5
.00
Ex
cit
ati
on
at
40
km
-4.0
0-3
.00
F i l t e r e d G r o u n d V e l o c i t y
1 . 0 0 5 . 7 5 1 0 . 5 0F r e q ( H Z )
1 5 . 2 5 2 0 . 0 0
-8.0
0-7
.00
-6.0
0-5
.00
Ex
cit
ati
on
at
40
km
-4.0
0-3
.00
F i l t e r e d G r o u n d V e l o c i t y
1 . 0 0 5 . 7 5 1 0 . 5 0F r e q ( H Z )
1 5 . 2 5 2 0 . 0 0
-8.0
0-7
.00
-6.0
0-5
.00
Ex
cit
ati
on
at
40
km
-4.0
0-3
.00
F i l t e r e d G r o u n d V e l o c i t y
1 . 0 0 5 . 7 5 1 0 . 5 0F r e q ( H Z )
1 5 . 2 5 2 0 . 0 0
-8.0
0-7
.00
-6.0
0-5
.00
Ex
cit
ati
on
at
40
km
-4.0
0-3
.00
F i l t e r e d G r o u n d V e l o c i t y
1 . 0 0 5 . 7 5 1 0 . 5 0F r e q ( H Z )
1 5 . 2 5 2 0 . 0 0
-8.0
0-7
.00
-6.0
0-5
.00
Ex
cit
ati
on
at
40
km
-4.0
0-3
.00
F i l t e r e d G r o u n d V e l o c i t y
1 . 0 0 5 . 7 5 1 0 . 5 0F r e q ( H Z )
1 5 . 2 5 2 0 . 0 0
-8.0
0-7
.00
-6.0
0-5
.00
Ex
cit
ati
on
at
40
km
-4.0
0-3
.00
F i l t e r e d G r o u n d V e l o c i t y
1 . 0 0 5 . 7 5 1 0 . 5 0F r e q ( H Z )
1 5 . 2 5 2 0 . 0 0
-8.0
0-7
.00
-6.0
0-5
.00
Ex
cit
ati
on
at
40
km
-4.0
0-3
.00
F i l t e r e d G r o u n d V e l o c i t y
1 . 0 0 5 . 7 5 1 0 . 5 0F r e q ( H Z )
1 5 . 2 5 2 0 . 0 0
-8.0
0-7
.00
-6.0
0-5
.00
Ex
cit
ati
on
at
40
km
-4.0
0-3
.00
F i l t e r e d G r o u n d V e l o c i t y
1 . 0 0 5 . 7 5 1 0 . 5 0F r e q ( H Z )
1 5 . 2 5 2 0 . 0 0
-8.0
0-7
.00
-6.0
0-5
.00
Ex
cit
ati
on
at
40
km
-4.0
0-3
.00
F i l t e r e d G r o u n d V e l o c i t y
1 . 0 0 5 . 7 5 1 0 . 5 0F r e q ( H Z )
1 5 . 2 5 2 0 . 0 0
-8.0
0-7
.00
-6.0
0-5
.00
Ex
cit
ati
on
at
40
km
-4.0
0-3
.00
F i l t e r e d G r o u n d V e l o c i t y
1 . 0 0 5 . 7 5 1 0 . 5 0F r e q ( H Z )
1 5 . 2 5 2 0 . 0 0
-8.0
0-7
.00
-6.0
0-5
.00
Ex
cit
ati
on
at
40
km
-4.0
0-3
.00
F i l t e r e d G r o u n d V e l o c i t y
1 . 0 0 5 . 7 5 1 0 . 5 0F r e q ( H Z )
1 5 . 2 5 2 0 . 0 0
-8.0
0-7
.00
-6.0
0-5
.00
Ex
cit
ati
on
at
40
km
-4.0
0-3
.00
F i l t e r e d G r o u n d V e l o c i t y
1 . 0 0 5 . 7 5 1 0 . 5 0F r e q ( H Z )
1 5 . 2 5 2 0 . 0 0
-8.0
0-7
.00
-6.0
0-5
.00
Ex
cit
ati
on
at
40
km
-4.0
0-3
.00
F i l t e r e d G r o u n d V e l o c i t y
1 . 0 0 5 . 7 5 1 0 . 5 0F r e q ( H Z )
1 5 . 2 5 2 0 . 0 0
-8.0
0-7
.00
-6.0
0-5
.00
Ex
cit
ati
on
at
40
km
-4.0
0-3
.00
F i l t e r e d G r o u n d V e l o c i t y
1 . 0 0 5 . 7 5 1 0 . 5 0F r e q ( H Z )
1 5 . 2 5 2 0 . 0 0
-8.0
0-7
.00
-6.0
0-5
.00
Ex
cit
ati
on
at
40
km
-4.0
0-3
.00
F i l t e r e d G r o u n d V e l o c i t y
1 . 0 0 5 . 7 5 1 0 . 5 0F r e q ( H Z )
1 5 . 2 5 2 0 . 0 0
-8.0
0-7
.00
-6.0
0-5
.00
Ex
cit
ati
on
at
40
km
-4.0
0-3
.00
F i l t e r e d G r o u n d V e l o c i t y
1 . 0 0 5 . 7 5 1 0 . 5 0F r e q ( H Z )
1 5 . 2 5 2 0 . 0 0
-8.0
0-7
.00
-6.0
0-5
.00
Ex
cit
ati
on
at
40
km
-4.0
0-3
.00
F i l t e r e d G r o u n d V e l o c i t y
1 . 0 0 5 . 7 5 1 0 . 5 0F r e q ( H Z )
1 5 . 2 5 2 0 . 0 0
-8.0
0-7
.00
-6.0
0-5
.00
Ex
cit
ati
on
at
40
km
-4.0
0-3
.00
F i l t e r e d G r o u n d V e l o c i t y
1 . 0 0 5 . 7 5 1 0 . 5 0F r e q ( H Z )
1 5 . 2 5 2 0 . 0 0
-8.0
0-7
.00
-6.0
0-5
.00
Ex
cit
ati
on
at
40
km
-4.0
0-3
.00
F i l t e r e d G r o u n d V e l o c i t y
1 . 0 0 5 . 7 5 1 0 . 5 0F r e q ( H Z )
1 5 . 2 5 2 0 . 0 0
-8.0
0-7
.00
-6.0
0-5
.00
Ex
cit
ati
on
at
40
km
-4.0
0-3
.00
F i l t e r e d G r o u n d V e l o c i t y
1 . 0 0 5 . 7 5 1 0 . 5 0F r e q ( H Z )
1 5 . 2 5 2 0 . 0 0
-8.0
0-7
.00
-6.0
0-5
.00
Ex
cit
ati
on
at
40
km
-4.0
0-3
.00
F i l t e r e d G r o u n d V e l o c i t y
1 . 0 0 5 . 7 5 1 0 . 5 0F r e q ( H Z )
1 5 . 2 5 2 0 . 0 0
-8.0
0-7
.00
-6.0
0-5
.00
Ex
cit
ati
on
at
40
km
-4.0
0-3
.00
F i l t e r e d G r o u n d V e l o c i t y
1 . 0 0 5 . 7 5 1 0 . 5 0F r e q ( H Z )
1 5 . 2 5 2 0 . 0 0
-8.0
0-7
.00
-6.0
0-5
.00
Ex
cit
ati
on
at
40
km
-4.0
0-3
.00
F i l t e r e d G r o u n d V e l o c i t y
1 . 0 0 5 . 7 5 1 0 . 5 0F r e q ( H Z )
1 5 . 2 5 2 0 . 0 0
-8.0
0-7
.00
-6.0
0-5
.00
Ex
cit
ati
on
at
40
km
-4.0
0-3
.00
F i l t e r e d G r o u n d V e l o c i t y
1 . 0 0 5 . 7 5 1 0 . 5 0F r e q ( H Z )
1 5 . 2 5 2 0 . 0 0
-8.0
0-7
.00
-6.0
0-5
.00
Ex
cit
ati
on
at
40
km
-4.0
0-3
.00
F i l t e r e d G r o u n d V e l o c i t y
1 . 0 0 5 . 7 5 1 0 . 5 0F r e q ( H Z )
1 5 . 2 5 2 0 . 0 0
-8.0
0-7
.00
-6.0
0-5
.00
Ex
cit
ati
on
at
40
km
-4.0
0-3
.00
F i l t e r e d G r o u n d V e l o c i t y
1 . 0 0 5 . 7 5 1 0 . 5 0F r e q ( H Z )
1 5 . 2 5 2 0 . 0 0
-8.0
0-7
.00
-6.0
0-5
.00
Ex
cit
ati
on
at
40
km
-4.0
0-3
.00
F i l t e r e d G r o u n d V e l o c i t y
1 . 0 0 5 . 7 5 1 0 . 5 0F r e q ( H Z )
1 5 . 2 5 2 0 . 0 0
-8.0
0-7
.00
-6.0
0-5
.00
Ex
cit
ati
on
at
40
km
-4.0
0-3
.00
F i l t e r e d G r o u n d V e l o c i t y
1 . 0 0 5 . 7 5 1 0 . 5 0F r e q ( H Z )
1 5 . 2 5 2 0 . 0 0
-8.0
0-7
.00
-6.0
0-5
.00
Ex
cit
ati
on
at
40
km
-4.0
0-3
.00
F i l t e r e d G r o u n d V e l o c i t y
1 . 0 0 5 . 7 5 1 0 . 5 0F r e q ( H Z )
1 5 . 2 5 2 0 . 0 0
-8.0
0-7
.00
-6.0
0-5
.00
Ex
cit
ati
on
at
40
km
-4.0
0-3
.00
F i l t e r e d G r o u n d V e l o c i t y
1 . 0 0 5 . 7 5 1 0 . 5 0F r e q ( H Z )
1 5 . 2 5 2 0 . 0 0
-8.0
0-7
.00
-6.0
0-5
.00
Ex
cit
ati
on
at
40
km
-4.0
0-3
.00
F i l t e r e d G r o u n d V e l o c i t y
1 . 0 0 5 . 7 5 1 0 . 5 0F r e q ( H Z )
1 5 . 2 5 2 0 . 0 0
-8.0
0-7
.00
-6.0
0-5
.00
Ex
cit
ati
on
at
40
km
-4.0
0-3
.00
F i l t e r e d G r o u n d V e l o c i t y
1 . 0 0 5 . 7 5 1 0 . 5 0F r e q ( H Z )
1 5 . 2 5 2 0 . 0 0
-8.0
0-7
.00
-6.0
0-5
.00
Ex
cit
ati
on
at
40
km
-4.0
0-3
.00
F i l t e r e d G r o u n d V e l o c i t y
1 . 0 0 5 . 7 5 1 0 . 5 0F r e q ( H Z )
1 5 . 2 5 2 0 . 0 0
-8.0
0-7
.00
-6.0
0-5
.00
Ex
cit
ati
on
at
40
km
-4.0
0-3
.00
F i l t e r e d G r o u n d V e l o c i t y
1 . 0 0 5 . 7 5 1 0 . 5 0F r e q ( H Z )
1 5 . 2 5 2 0 . 0 0
-8.0
0-7
.00
-6.0
0-5
.00
Ex
cit
ati
on
at
40
km
-4.0
0-3
.00
F i l t e r e d G r o u n d V e l o c i t y
1 . 0 0 5 . 7 5 1 0 . 5 0F r e q ( H Z )
1 5 . 2 5 2 0 . 0 0
-8.0
0-7
.00
-6.0
0-5
.00
Ex
cit
ati
on
at
40
km
-4.0
0-3
.00
F i l t e r e d G r o u n d V e l o c i t y
1 . 0 0 5 . 7 5 1 0 . 5 0F r e q ( H Z )
1 5 . 2 5 2 0 . 0 0
-8.0
0-7
.00
-6.0
0-5
.00
Ex
cit
ati
on
at
40
km
-4.0
0-3
.00
F i l t e r e d G r o u n d V e l o c i t y
1 . 0 0 5 . 7 5 1 0 . 5 0F r e q ( H Z )
1 5 . 2 5 2 0 . 0 0
-8.0
0-7
.00
-6.0
0-5
.00
Ex
cit
ati
on
at
40
km
-4.0
0-3
.00
F i l t e r e d G r o u n d V e l o c i t y
1 . 0 0 5 . 7 5 1 0 . 5 0F r e q ( H Z )
1 5 . 2 5 2 0 . 0 0
-8.0
0-7
.00
-6.0
0-5
.00
Ex
cit
ati
on
at
40
km
-4.0
0-3
.00
F i l t e r e d G r o u n d V e l o c i t y
1 . 0 0 5 . 7 5 1 0 . 5 0F r e q ( H Z )
1 5 . 2 5 2 0 . 0 0
-8.0
0-7
.00
-6.0
0-5
.00
Ex
cit
ati
on
at
40
km
-4.0
0-3
.00
F i l t e r e d G r o u n d V e l o c i t y
1 . 0 0 5 . 7 5 1 0 . 5 0F r e q ( H Z )
1 5 . 2 5 2 0 . 0 0
-8.0
0-7
.00
-6.0
0-5
.00
Ex
cit
ati
on
at
40
km
-4.0
0-3
.00
F i l t e r e d G r o u n d V e l o c i t y
1 . 0 0 5 . 7 5 1 0 . 5 0F r e q ( H Z )
1 5 . 2 5 2 0 . 0 0
-8.0
0-7
.00
-6.0
0-5
.00
Ex
cit
ati
on
at
40
km
-4.0
0-3
.00
F i l t e r e d G r o u n d V e l o c i t y
1 . 0 0 5 . 7 5 1 0 . 5 0F r e q ( H Z )
1 5 . 2 5 2 0 . 0 0
-8.0
0-7
.00
-6.0
0-5
.00
Ex
cit
ati
on
at
40
km
-4.0
0-3
.00
F i l t e r e d G r o u n d V e l o c i t y
1 . 0 0 5 . 7 5 1 0 . 5 0F r e q ( H Z )
1 5 . 2 5 2 0 . 0 0
-8.0
0-7
.00
-6.0
0-5
.00
Ex
cit
ati
on
at
40
km
-4.0
0-3
.00
F i l t e r e d G r o u n d V e l o c i t y
1 . 0 0 5 . 7 5 1 0 . 5 0F r e q ( H Z )
1 5 . 2 5 2 0 . 0 0
-8.0
0-7
.00
-6.0
0-5
.00
Ex
cit
ati
on
at
40
km
-4.0
0-3
.00
F i l t e r e d G r o u n d V e l o c i t y
1 . 0 0 5 . 7 5 1 0 . 5 0F r e q ( H Z )
1 5 . 2 5 2 0 . 0 0
-8.0
0-7
.00
-6.0
0-5
.00
Ex
cit
ati
on
at
40
km
-4.0
0-3
.00
F i l t e r e d G r o u n d V e l o c i t y
1 . 0 0 5 . 7 5 1 0 . 5 0F r e q ( H Z )
1 5 . 2 5 2 0 . 0 0
-8.0
0-7
.00
-6.0
0-5
.00
Ex
cit
ati
on
at
40
km
-4.0
0-3
.00
F i l t e r e d G r o u n d V e l o c i t y
1 . 0 0 5 . 7 5 1 0 . 5 0F r e q ( H Z )
1 5 . 2 5 2 0 . 0 0
-8.0
0-7
.00
-6.0
0-5
.00
Ex
cit
ati
on
at
40
km
-4.0
0-3
.00
F i l t e r e d G r o u n d V e l o c i t y
1 . 0 0 5 . 7 5 1 0 . 5 0F r e q ( H Z )
1 5 . 2 5 2 0 . 0 0
-8.0
0-7
.00
-6.0
0-5
.00
Ex
cit
ati
on
at
40
km
-4.0
0-3
.00
F i l t e r e d G r o u n d V e l o c i t y
1 . 0 0 5 . 7 5 1 0 . 5 0F r e q ( H Z )
1 5 . 2 5 2 0 . 0 0
-8.0
0-7
.00
-6.0
0-5
.00
Ex
cit
ati
on
at
40
km
-4.0
0-3
.00
F i l t e r e d G r o u n d V e l o c i t y
1 . 0 0 5 . 7 5 1 0 . 5 0F r e q ( H Z )
1 5 . 2 5 2 0 . 0 0
-8.0
0-7
.00
-6.0
0-5
.00
Ex
cit
ati
on
at
40
km
-4.0
0-3
.00
F i l t e r e d G r o u n d V e l o c i t y
1 . 0 0 5 . 7 5 1 0 . 5 0F r e q ( H Z )
1 5 . 2 5 2 0 . 0 0
-8.0
0-7
.00
-6.0
0-5
.00
Ex
cit
ati
on
at
40
km
-4.0
0-3
.00
F i l t e r e d G r o u n d V e l o c i t y
1 . 0 0 5 . 7 5 1 0 . 5 0F r e q ( H Z )
1 5 . 2 5 2 0 . 0 0
-8.0
0-7
.00
-6.0
0-5
.00
Ex
cit
ati
on
at
40
km
-4.0
0-3
.00
F i l t e r e d G r o u n d V e l o c i t y
1 . 0 0 5 . 7 5 1 0 . 5 0F r e q ( H Z )
1 5 . 2 5 2 0 . 0 0
-8.0
0-7
.00
-6.0
0-5
.00
Ex
cit
ati
on
at
40
km
-4.0
0-3
.00
F i l t e r e d G r o u n d V e l o c i t y
1 . 0 0 5 . 7 5 1 0 . 5 0F r e q ( H Z )
1 5 . 2 5 2 0 . 0 0
-8.0
0-7
.00
-6.0
0-5
.00
Ex
cit
ati
on
at
40
km
-4.0
0-3
.00
F i l t e r e d G r o u n d V e l o c i t y
1 . 0 0 5 . 7 5 1 0 . 5 0F r e q ( H Z )
1 5 . 2 5 2 0 . 0 0
-8.0
0-7
.00
-6.0
0-5
.00
Ex
cit
ati
on
at
40
km
-4.0
0-3
.00
F i l t e r e d G r o u n d V e l o c i t y
1 . 0 0 5 . 7 5 1 0 . 5 0F r e q ( H Z )
1 5 . 2 5 2 0 . 0 0
-8.0
0-7
.00
-6.0
0-5
.00
Ex
cit
ati
on
at
40
km
-4.0
0-3
.00
F i l t e r e d G r o u n d V e l o c i t y
1 . 0 0 5 . 7 5 1 0 . 5 0F r e q ( H Z )
1 5 . 2 5 2 0 . 0 0
-8.0
0-7
.00
-6.0
0-5
.00
Ex
cit
ati
on
at
40
km
-4.0
0-3
.00
F i l t e r e d G r o u n d V e l o c i t y
1 . 0 0 5 . 7 5 1 0 . 5 0F r e q ( H Z )
1 5 . 2 5 2 0 . 0 0
-8.0
0-7
.00
-6.0
0-5
.00
Ex
cit
ati
on
at
40
km
-4.0
0-3
.00
F i l t e r e d G r o u n d V e l o c i t y
1 . 0 0 5 . 7 5 1 0 . 5 0F r e q ( H Z )
1 5 . 2 5 2 0 . 0 0
-8.0
0-7
.00
-6.0
0-5
.00
Ex
cit
ati
on
at
40
km
-4.0
0-3
.00
F i l t e r e d G r o u n d V e l o c i t y
1 . 0 0 5 . 7 5 1 0 . 5 0F r e q ( H Z )
1 5 . 2 5 2 0 . 0 0
-8.0
0-7
.00
-6.0
0-5
.00
Ex
cit
ati
on
at
40
km
-4.0
0-3
.00
F i l t e r e d G r o u n d V e l o c i t y
1 . 0 0 5 . 7 5 1 0 . 5 0F r e q ( H Z )
1 5 . 2 5 2 0 . 0 0
-8.0
0-7
.00
-6.0
0-5
.00
Ex
cit
ati
on
at
40
km
-4.0
0-3
.00
F i l t e r e d G r o u n d V e l o c i t y
1 . 0 0 5 . 7 5 1 0 . 5 0F r e q ( H Z )
1 5 . 2 5 2 0 . 0 0
-8.0
0-7
.00
-6.0
0-5
.00
Ex
cit
ati
on
at
40
km
-4.0
0-3
.00
F i l t e r e d G r o u n d V e l o c i t y
1 . 0 0 5 . 7 5 1 0 . 5 0F r e q ( H Z )
1 5 . 2 5 2 0 . 0 0
-8.0
0-7
.00
-6.0
0-5
.00
Ex
cit
ati
on
at
40
km
-4.0
0-3
.00
F i l t e r e d G r o u n d V e l o c i t y
1 . 0 0 5 . 7 5 1 0 . 5 0F r e q ( H Z )
1 5 . 2 5 2 0 . 0 0
-8.0
0-7
.00
-6.0
0-5
.00
Ex
cit
ati
on
at
40
km
-4.0
0-3
.00
F i l t e r e d G r o u n d V e l o c i t y
1 . 0 0 5 . 7 5 1 0 . 5 0F r e q ( H Z )
1 5 . 2 5 2 0 . 0 0
-8.0
0-7
.00
-6.0
0-5
.00
Ex
cit
ati
on
at
40
km
-4.0
0-3
.00
F i l t e r e d G r o u n d V e l o c i t y
1 . 0 0 5 . 7 5 1 0 . 5 0F r e q ( H Z )
1 5 . 2 5 2 0 . 0 0
-8.0
0-7
.00
-6.0
0-5
.00
Ex
cit
ati
on
at
40
km
-4.0
0-3
.00
F i l t e r e d G r o u n d V e l o c i t y
1 . 0 0 5 . 7 5 1 0 . 5 0F r e q ( H Z )
1 5 . 2 5 2 0 . 0 0
-8.0
0-7
.00
-6.0
0-5
.00
Ex
cit
ati
on
at
40
km
-4.0
0-3
.00
F i l t e r e d G r o u n d V e l o c i t y
1 . 0 0 5 . 7 5 1 0 . 5 0F r e q ( H Z )
1 5 . 2 5 2 0 . 0 0
-8.0
0-7
.00
-6.0
0-5
.00
Ex
cit
ati
on
at
40
km
-4.0
0-3
.00
F i l t e r e d G r o u n d V e l o c i t y
1 . 0 0 5 . 7 5 1 0 . 5 0F r e q ( H Z )
1 5 . 2 5 2 0 . 0 0
-8.0
0-7
.00
-6.0
0-5
.00
Ex
cit
ati
on
at
40
km
-4.0
0-3
.00
F i l t e r e d G r o u n d V e l o c i t y
1 . 0 0 5 . 7 5 1 0 . 5 0F r e q ( H Z )
1 5 . 2 5 2 0 . 0 0
-8.0
0-7
.00
-6.0
0-5
.00
Ex
cit
ati
on
at
40
km
-4.0
0-3
.00
F i l t e r e d G r o u n d V e l o c i t y
1 . 0 0 5 . 7 5 1 0 . 5 0F r e q ( H Z )
1 5 . 2 5 2 0 . 0 0
-8.0
0-7
.00
-6.0
0-5
.00
Ex
cit
ati
on
at
40
km
-4.0
0-3
.00
F i l t e r e d G r o u n d V e l o c i t y
1 . 0 0 5 . 7 5 1 0 . 5 0F r e q ( H Z )
1 5 . 2 5 2 0 . 0 0
-8.0
0-7
.00
-6.0
0-5
.00
Ex
cit
ati
on
at
40
km
-4.0
0-3
.00
F i l t e r e d G r o u n d V e l o c i t y
1 . 0 0 5 . 7 5 1 0 . 5 0F r e q ( H Z )
1 5 . 2 5 2 0 . 0 0
-8.0
0-7
.00
-6.0
0-5
.00
Ex
cit
ati
on
at
40
km
-4.0
0-3
.00
F i l t e r e d G r o u n d V e l o c i t y
1 . 0 0 5 . 7 5 1 0 . 5 0F r e q ( H Z )
1 5 . 2 5 2 0 . 0 0
-8.0
0-7
.00
-6.0
0-5
.00
Ex
cit
ati
on
at
40
km
-4.0
0-3
.00
F i l t e r e d G r o u n d V e l o c i t y
1 . 0 0 5 . 7 5 1 0 . 5 0F r e q ( H Z )
1 5 . 2 5 2 0 . 0 0
-8.0
0-7
.00
-6.0
0-5
.00
Ex
cit
ati
on
at
40
km
-4.0
0-3
.00
F i l t e r e d G r o u n d V e l o c i t y
1 . 0 0 5 . 7 5 1 0 . 5 0F r e q ( H Z )
1 5 . 2 5 2 0 . 0 0
-8.0
0-7
.00
-6.0
0-5
.00
Ex
cit
ati
on
at
40
km
-4.0
0-3
.00
F i l t e r e d G r o u n d V e l o c i t y
1 . 0 0 5 . 7 5 1 0 . 5 0F r e q ( H Z )
1 5 . 2 5 2 0 . 0 0
-8.0
0-7
.00
-6.0
0-5
.00
Ex
cit
ati
on
at
40
km
-4.0
0-3
.00
F i l t e r e d G r o u n d V e l o c i t y
1 . 0 0 5 . 7 5 1 0 . 5 0F r e q ( H Z )
1 5 . 2 5 2 0 . 0 0
-8.0
0-7
.00
-6.0
0-5
.00
Ex
cit
ati
on
at
40
km
-4.0
0-3
.00
F i l t e r e d G r o u n d V e l o c i t y
1 . 0 0 5 . 7 5 1 0 . 5 0F r e q ( H Z )
1 5 . 2 5 2 0 . 0 0
-8.0
0-7
.00
-6.0
0-5
.00
Ex
cit
ati
on
at
40
km
-4.0
0-3
.00
F i l t e r e d G r o u n d V e l o c i t y
1 . 0 0 5 . 7 5 1 0 . 5 0F r e q ( H Z )
1 5 . 2 5 2 0 . 0 0
-8.0
0-7
.00
-6.0
0-5
.00
Ex
cit
ati
on
at
40
km
-4.0
0-3
.00
F i l t e r e d G r o u n d V e l o c i t y
1 . 0 0 5 . 7 5 1 0 . 5 0F r e q ( H Z )
1 5 . 2 5 2 0 . 0 0
-8.0
0-7
.00
-6.0
0-5
.00
Ex
cit
ati
on
at
40
km
-4.0
0-3
.00
F i l t e r e d G r o u n d V e l o c i t y
1 . 0 0 5 . 7 5 1 0 . 5 0F r e q ( H Z )
1 5 . 2 5 2 0 . 0 0
-8.0
0-7
.00
-6.0
0-5
.00
Ex
cit
ati
on
at
40
km
-4.0
0-3
.00
F i l t e r e d G r o u n d V e l o c i t y
1 . 0 0 5 . 7 5 1 0 . 5 0F r e q ( H Z )
1 5 . 2 5 2 0 . 0 0
-8.0
0-7
.00
-6.0
0-5
.00
Ex
cit
ati
on
at
40
km
-4.0
0-3
.00
F i l t e r e d G r o u n d V e l o c i t y
1 . 0 0 5 . 7 5 1 0 . 5 0F r e q ( H Z )
1 5 . 2 5 2 0 . 0 0
-8.0
0-7
.00
-6.0
0-5
.00
Ex
cit
ati
on
at
40
km
-4.0
0-3
.00
F i l t e r e d G r o u n d V e l o c i t y
1 . 0 0 5 . 7 5 1 0 . 5 0F r e q ( H Z )
1 5 . 2 5 2 0 . 0 0
-8.0
0-7
.00
-6.0
0-5
.00
Ex
cit
ati
on
at
40
km
-4.0
0-3
.00
F i l t e r e d G r o u n d V e l o c i t y
1 . 0 0 5 . 7 5 1 0 . 5 0F r e q ( H Z )
1 5 . 2 5 2 0 . 0 0
-8.0
0-7
.00
-6.0
0-5
.00
Ex
cit
ati
on
at
40
km
-4.0
0-3
.00
F i l t e r e d G r o u n d V e l o c i t y
1 . 0 0 5 . 7 5 1 0 . 5 0F r e q ( H Z )
1 5 . 2 5 2 0 . 0 0
-8.0
0-7
.00
-6.0
0-5
.00
Ex
cit
ati
on
at
40
km
-4.0
0-3
.00
F i l t e r e d G r o u n d V e l o c i t y
1 . 0 0 5 . 7 5 1 0 . 5 0F r e q ( H Z )
1 5 . 2 5 2 0 . 0 0
-8.0
0-7
.00
-6.0
0-5
.00
Ex
cit
ati
on
at
40
km
-4.0
0-3
.00
F i l t e r e d G r o u n d V e l o c i t y
1 . 0 0 5 . 7 5 1 0 . 5 0F r e q ( H Z )
1 5 . 2 5 2 0 . 0 0
-8.0
0-7
.00
-6.0
0-5
.00
Ex
cit
ati
on
at
40
km
-4.0
0-3
.00
F i l t e r e d G r o u n d V e l o c i t y
1 . 0 0 5 . 7 5 1 0 . 5 0F r e q ( H Z )
1 5 . 2 5 2 0 . 0 0
-8.0
0-7
.00
-6.0
0-5
.00
Ex
cit
ati
on
at
40
km
-4.0
0-3
.00
F i l t e r e d G r o u n d V e l o c i t y
1 . 0 0 5 . 7 5 1 0 . 5 0F r e q ( H Z )
1 5 . 2 5 2 0 . 0 0
-8.0
0-7
.00
-6.0
0-5
.00
Ex
cit
ati
on
at
40
km
-4.0
0-3
.00
F i l t e r e d G r o u n d V e l o c i t y
1 . 0 0 5 . 7 5 1 0 . 5 0F r e q ( H Z )
1 5 . 2 5 2 0 . 0 0
-8.0
0-7
.00
-6.0
0-5
.00
Ex
cit
ati
on
at
40
km
-4.0
0-3
.00
F i l t e r e d G r o u n d V e l o c i t y
1 . 0 0 5 . 7 5 1 0 . 5 0F r e q ( H Z )
1 5 . 2 5 2 0 . 0 0
-8.0
0-7
.00
-6.0
0-5
.00
Ex
cit
ati
on
at
40
km
-4.0
0-3
.00
F i l t e r e d G r o u n d V e l o c i t y
1 . 0 0 5 . 7 5 1 0 . 5 0F r e q ( H Z )
1 5 . 2 5 2 0 . 0 0
-8.0
0-7
.00
-6.0
0-5
.00
Ex
cit
ati
on
at
40
km
-4.0
0-3
.00
F i l t e r e d G r o u n d V e l o c i t y
1 . 0 0 5 . 7 5 1 0 . 5 0F r e q ( H Z )
1 5 . 2 5 2 0 . 0 0
-8.0
0-7
.00
-6.0
0-5
.00
Ex
cit
ati
on
at
40
km
-4.0
0-3
.00
F i l t e r e d G r o u n d V e l o c i t y
1 . 0 0 5 . 7 5 1 0 . 5 0F r e q ( H Z )
1 5 . 2 5 2 0 . 0 0
-8.0
0-7
.00
-6.0
0-5
.00
Ex
cit
ati
on
at
40
km
-4.0
0-3
.00
F i l t e r e d G r o u n d V e l o c i t y
1 . 0 0 5 . 7 5 1 0 . 5 0F r e q ( H Z )
1 5 . 2 5 2 0 . 0 0
-8.0
0-7
.00
-6.0
0-5
.00
Ex
cit
ati
on
at
40
km
-4.0
0-3
.00
F i l t e r e d G r o u n d V e l o c i t y
1 . 0 0 5 . 7 5 1 0 . 5 0F r e q ( H Z )
1 5 . 2 5 2 0 . 0 0
-8.0
0-7
.00
-6.0
0-5
.00
Ex
cit
ati
on
at
40
km
-4.0
0-3
.00
F i l t e r e d G r o u n d V e l o c i t y
1 . 0 0 5 . 7 5 1 0 . 5 0F r e q ( H Z )
1 5 . 2 5 2 0 . 0 0
-8.0
0-7
.00
-6.0
0-5
.00
Ex
cit
ati
on
at
40
km
-4.0
0-3
.00
F i l t e r e d G r o u n d V e l o c i t y
1 . 0 0 5 . 7 5 1 0 . 5 0F r e q ( H Z )
1 5 . 2 5 2 0 . 0 0
-8.0
0-7
.00
-6.0
0-5
.00
Ex
cit
ati
on
at
40
km
-4.0
0-3
.00
F i l t e r e d G r o u n d V e l o c i t y
1 . 0 0 5 . 7 5 1 0 . 5 0F r e q ( H Z )
1 5 . 2 5 2 0 . 0 0
-8.0
0-7
.00
-6.0
0-5
.00
Ex
cit
ati
on
at
40
km
-4.0
0-3
.00
F i l t e r e d G r o u n d V e l o c i t y
1 . 0 0 5 . 7 5 1 0 . 5 0F r e q ( H Z )
1 5 . 2 5 2 0 . 0 0
-8.0
0-7
.00
-6.0
0-5
.00
Ex
cit
ati
on
at
40
km
-4.0
0-3
.00
F i l t e r e d G r o u n d V e l o c i t y
1 . 0 0 5 . 7 5 1 0 . 5 0F r e q ( H Z )
1 5 . 2 5 2 0 . 0 0
-8.0
0-7
.00
-6.0
0-5
.00
Ex
cit
ati
on
at
40
km
-4.0
0-3
.00
F i l t e r e d G r o u n d V e l o c i t y
1 . 0 0 5 . 7 5 1 0 . 5 0F r e q ( H Z )
1 5 . 2 5 2 0 . 0 0
-8.0
0-7
.00
-6.0
0-5
.00
Ex
cit
ati
on
at
40
km
-4.0
0-3
.00
F i l t e r e d G r o u n d V e l o c i t y
1 . 0 0 5 . 7 5 1 0 . 5 0F r e q ( H Z )
1 5 . 2 5 2 0 . 0 0
-8.0
0-7
.00
-6.0
0-5
.00
Ex
cit
ati
on
at
40
km
-4.0
0-3
.00
F i l t e r e d G r o u n d V e l o c i t y
1 . 0 0 5 . 7 5 1 0 . 5 0F r e q ( H Z )
1 5 . 2 5 2 0 . 0 0
-8.0
0-7
.00
-6.0
0-5
.00
Ex
cit
ati
on
at
40
km
-4.0
0-3
.00
F i l t e r e d G r o u n d V e l o c i t y
1 . 0 0 5 . 7 5 1 0 . 5 0F r e q ( H Z )
1 5 . 2 5 2 0 . 0 0
-8.0
0-7
.00
-6.0
0-5
.00
Ex
cit
ati
on
at
40
km
-4.0
0-3
.00
F i l t e r e d G r o u n d V e l o c i t y
1 . 0 0 5 . 7 5 1 0 . 5 0F r e q ( H Z )
1 5 . 2 5 2 0 . 0 0
-8.0
0-7
.00
-6.0
0-5
.00
Ex
cit
ati
on
at
40
km
-4.0
0-3
.00
F i l t e r e d G r o u n d V e l o c i t y
1 . 0 0 5 . 7 5 1 0 . 5 0F r e q ( H Z )
1 5 . 2 5 2 0 . 0 0
-8.0
0-7
.00
-6.0
0-5
.00
Ex
cit
ati
on
at
40
km
-4.0
0-3
.00
F i l t e r e d G r o u n d V e l o c i t y
1 . 0 0 5 . 7 5 1 0 . 5 0F r e q ( H Z )
1 5 . 2 5 2 0 . 0 0
-8.0
0-7
.00
-6.0
0-5
.00
Ex
cit
ati
on
at
40
km
-4.0
0-3
.00
F i l t e r e d G r o u n d V e l o c i t y
1 . 0 0 5 . 7 5 1 0 . 5 0F r e q ( H Z )
1 5 . 2 5 2 0 . 0 0
-8.0
0-7
.00
-6.0
0-5
.00
Ex
cit
ati
on
at
40
km
-4.0
0-3
.00
F i l t e r e d G r o u n d V e l o c i t y
1 . 0 0 5 . 7 5 1 0 . 5 0F r e q ( H Z )
1 5 . 2 5 2 0 . 0 0
-8.0
0-7
.00
-6.0
0-5
.00
Ex
cit
ati
on
at
40
km
-4.0
0-3
.00
F i l t e r e d G r o u n d V e l o c i t y
1 . 0 0 5 . 7 5 1 0 . 5 0F r e q ( H Z )
1 5 . 2 5 2 0 . 0 0
-8.0
0-7
.00
-6.0
0-5
.00
Ex
cit
ati
on
at
40
km
-4.0
0-3
.00
F i l t e r e d G r o u n d V e l o c i t y
1 . 0 0 5 . 7 5 1 0 . 5 0F r e q ( H Z )
1 5 . 2 5 2 0 . 0 0
-8.0
0-7
.00
-6.0
0-5
.00
Ex
cit
ati
on
at
40
km
-4.0
0-3
.00
F i l t e r e d G r o u n d V e l o c i t y
1 . 0 0 5 . 7 5 1 0 . 5 0F r e q ( H Z )
1 5 . 2 5 2 0 . 0 0
-8.0
0-7
.00
-6.0
0-5
.00
Ex
cit
ati
on
at
40
km
-4.0
0-3
.00
F i l t e r e d G r o u n d V e l o c i t y
1 . 0 0 5 . 7 5 1 0 . 5 0F r e q ( H Z )
1 5 . 2 5 2 0 . 0 0
-8.0
0-7
.00
-6.0
0-5
.00
Ex
cit
ati
on
at
40
km
-4.0
0-3
.00
F i l t e r e d G r o u n d V e l o c i t y
1 . 0 0 5 . 7 5 1 0 . 5 0F r e q ( H Z )
1 5 . 2 5 2 0 . 0 0
-8.0
0-7
.00
-6.0
0-5
.00
Ex
cit
ati
on
at
40
km
-4.0
0-3
.00
F i l t e r e d G r o u n d V e l o c i t y
1 . 0 0 5 . 7 5 1 0 . 5 0F r e q ( H Z )
1 5 . 2 5 2 0 . 0 0
-8.0
0-7
.00
-6.0
0-5
.00
Ex
cit
ati
on
at
40
km
-4.0
0-3
.00
F i l t e r e d G r o u n d V e l o c i t y
1 . 0 0 5 . 7 5 1 0 . 5 0F r e q ( H Z )
1 5 . 2 5 2 0 . 0 0
-8.0
0-7
.00
-6.0
0-5
.00
Ex
cit
ati
on
at
40
km
-4.0
0-3
.00
F i l t e r e d G r o u n d V e l o c i t y
1 . 0 0 5 . 7 5 1 0 . 5 0F r e q ( H Z )
1 5 . 2 5 2 0 . 0 0
-8.0
0-7
.00
-6.0
0-5
.00
Ex
cit
ati
on
at
40
km
-4.0
0-3
.00
F i l t e r e d G r o u n d V e l o c i t y
1 . 0 0 5 . 7 5 1 0 . 5 0F r e q ( H Z )
1 5 . 2 5 2 0 . 0 0
-8.0
0-7
.00
-6.0
0-5
.00
Ex
cit
ati
on
at
40
km
-4.0
0-3
.00
F i l t e r e d G r o u n d V e l o c i t y
1 . 0 0 5 . 7 5 1 0 . 5 0F r e q ( H Z )
1 5 . 2 5 2 0 . 0 0
-8.0
0-7
.00
-6.0
0-5
.00
Ex
cit
ati
on
at
40
km
-4.0
0-3
.00
F i l t e r e d G r o u n d V e l o c i t y
1 . 0 0 5 . 7 5 1 0 . 5 0F r e q ( H Z )
1 5 . 2 5 2 0 . 0 0
-8.0
0-7
.00
-6.0
0-5
.00
Ex
cit
ati
on
at
40
km
-4.0
0-3
.00
F i l t e r e d G r o u n d V e l o c i t y
Figure 3.14: Inverted Filtered ground velocity excitation terms for the min-ing related events recorded by vertical component velocity seismogramsplotted on a linear frequency scale

58
E p i c e n t e r s a n d s t a t i o n s f o r U n i v e r s i t y o f U t a h D a t a
3 6 . 0 0
38.00
40.00
42.00
44.00
- 1 1 6 . 0 0 -112.00 -108.00
E P I C E N T E R S ( e q )
3 6 . 0 0
38.00
40.00
42.00
44.00
- 1 1 6 . 0 0 -112.00 -108.00
STATIONS
Figure 3.15: Map showing the earthquake-epicenters and stations for Uni-versity of Utah data
E p i c e n t e r s a n d s t a t i o n s f o r U n i v e r s i t y o f U t a h D a t a
3 6 . 0 0
38.00
40.00
42.00
44.00
- 1 1 6 . 0 0 -112.00 -108.00
E P I C E N T E R S ( e x )
3 6 . 0 0
38.00
40.00
42.00
44.00
- 1 1 6 . 0 0 -112.00 -108.00
STATIONS
Figure 3.16: Map showing the explosion induced epicenters and stationsfor University of Utah data

4. Parameterization
The previous chapter presented the regression results. The purpose
of this chapter is to model those results in terms of a simple physically
based model which reduces the observations to a few parameters. This
parameterization is an essential step toward creating a forward ground
motion prediction model.
4.1 Modeling Fourier velocity spectra
An equation for the predicted Fourier velocity spectra for a frequency
f at a distance r is
� ���� � � ��� � � �� �
��� � � � � ��� � ��� � � ��� � ����� ��� � � ��� ���
where�!� ��� � �
is the Fourier velocity spectra,� ��� �
� ��
is the source exci-
tation as a function of moment-magnitude,� � � �
is a filter that converts
ground motion to the desired motion, � ��� is the geometrical spreading
function, and� � � �
is the frequency dependent quality factor which is
taken to be� � ��� � # � �� and
� � is the quality factor at 1.0 Hz. � � �
is
a frequency dependent site amplification that accounts for the site ve-
locity structure while " controls site attenuation of high frequency. The
filter function� � � �
can represent the lightly damped single degree-of-
freedom oscillator used for computing response spectra, a simple operator
to give ground velocity, displacement or acceleration or an instrument re-
sponse. A comparison of this simple prediction model to the regression
terms shows the following correspondence:
���� � � � �� �
��� � � � � � � � ��� � � ��� � ������� ��� � ����� � � � ���� � �
59

60
for� � � � � �
�� � � ��� � ��� � � ��� � ������ �� � ��� � � ��� � � ����� ��� � ��� �
�� ��� � � � � ��� � �
� � � ���� � �
where ��� � �
��� � � is the network average site effect (Herrmann, 2000). By
construction these expressions incorporate the regression constraints used
in the previous chapter. The parameters used are phenomenological in
that they describe an aspect of ground motion scaling but may not be the
true physical values. For example, the����� �
will tradeoff with the � � ��� is
the data set consists of only finite distance and frequency ranges.
From the second of these equations, we see that the� ���� ���
term is a
function of the geometrical spreading � ��� and frequency dependent����� �
.
Thus simple forward modeling can provide possible candidates for these
functions. The excitation term� ��� �
depends on these, the source spec-
trum, and the network averaged site effect. If the source spectrum and site
effects are known, then it would be possible to choose among the various
candidates to describe the distance effect.
4.2 Modeling peak time domain values
Random Vibration Theory (RVT) is a tool to estimate peak motion in a
time series given the spectral amplitudes and signal duration (Cartwright
and Longuet-Higgins, 1956). Boore (1983) applied this to the seismological
problem of estimating response spectra and peak velocity and acceleration
from earthquakes.

61
The mathematical development of Cartwright and Longuet-Higgins
(1956) is complicated, but Boore (1996) provides software to perform the
computations. A local adaption of random vibration theory for applica-
tion to this study is called rptcal. Following Boore (1993), the site spec-
trum, which is a function of distance and frequency is use to compute the
0’th, 2’nd and 4’th spectral moments. Using the signal duration, which
is a function of source size to reflect the rupture duration and distance to
reflect the effect of propagation, the the RMS (root mean square) motion
is computed by using Parseval’s theorem. The RMS value is related to the
peak value of motion by the � � � � value computed using the Cartwright
and Longuet-Higgins (1956) definition as
� � � � � � ����� � � � � #
The signal duration enters into the peak motion estimation in two ways:
the estimate of the RMS value and in the definition of � ��� � .
Because the peak value of the time domain motion requires spectral
moments, the time domain results are not truly single frequency results.
They are approximately if the filter function� � � �
is very sharp, as were
the pair of Butterworth filters used in our processing. Comparison of RVT
model based predictions to observations requires that the source spectrum
be appropriate for the earthquakes used. Fortunately, the shape of the
source spectrum is easy to define in our frequency range for the small
earthquakes that we use. Thus the modeling of peak time domain mo-
tions builds upon the � ��� and�������
estimated from the Fourier velocity
spectra modeling and relies heavily on the duration function� ���
.

62
4.3 Propagation parameters
Both the Fourier velocity and peak filtered time domain� ���� ���
regres-
sion results shown in Figures 3.4 and 3.7, respectively, are characterized
by very rapid decreases of amplitude at distances less than 40 km. Such
a rapid decrease can be accounted for by a geometrical spreading faster
than� � at short distances. On the other hand, many authors use an
� �
geometrical spreading at short distances. If we did this, then a very low� � � �
would be required to fit the regression� ���� ���
.
To understand the implication of the use of a very rapid geometrical
spreading at short distances, we will consider two � ��� and� � � �
models.
These models are first defined by fitting the Fourier velocity� ���
of Figure
3.4 and then tested again by using the� � � � � � ��� of Table 3.7 and RVT to
match the time domain� � � � � �
of Figure 3.7. Table 4.1 gives the parameters
of both models. Model A use conventional geometrical spreading of� �
�
at short distances, while Model B use� �
� � � �to fit short distances. The
� � � �
values in Table 4.1 are from the peak filtered velocity data set. The Fourier
velocity� � � �
results indicate 115� ��� � �
for model A and 160� ��� ���
for model
B. We use the time domain results because we wish to model time domain
data.
The effect of anelastic attenuation is reduction of amplitude with dis-
tance by a factor of ����� � ��� � �� � �����
�, where � = 3.5 km/sec. The anelastic at-
tenuation� � � �
trades off with the geometrical spreading and the cross
over distance. Thus it is not unique by determined�������
. In addition it is
closely associated with the signal bursts within the duration window and
may be unrelated to�������
values estimated from other parts of the seimic

63
Model A Model B
����� � ����� ��� ��� ���� � ��� ���
� � ��� � �� � � � � � � � � � �
� � � � � � � � � �� �
� � � � � � � � �� � � ��� ��� � � � � � ���� � ��� � �� � � � ��� � � ��� ��� ��� � �� � ��� � ��� � � � � ��� � ��� � � �� � �
" � ��� 0.045 0.045&(' 400 400
Table 4.1: Propagation parameters of Model A and Model B
waveform.
A comparison of the difference between observed Fourier velocity� ���
and predicted Fourier velocity� ���
is given in Figure 4.1 for model A. The
data set has small numbers of observation beyond 300 kilometers which
is indicated by the larger standard error bars on the� � ���
. Model B (Fig-
ure 4.2) has better agreement with Model A (Figure 4.1) at short distance.
Band pass filtered� ���
residuals of Figure 4.3 and Figure 4.4 are simi-
lar to the Fourier velocity results. The deviations between observed and
predicted� ���� ���
of the distance range are within the error bars for most
distances except at 135 km where an improper station instrument response
may bias the regression. Since the� � ��� � �
is a logarithic quantity, model B
agrees with observations to within a factor of 1.4 (0.15 log units) for most
distances.
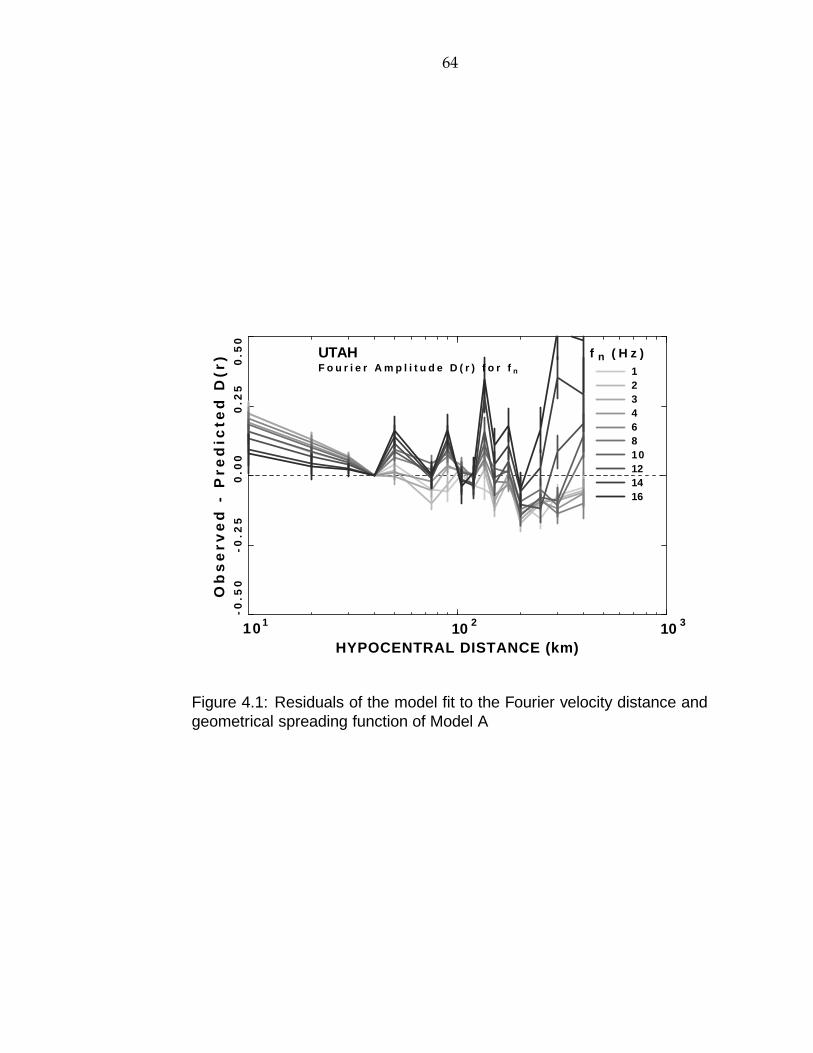
64
101 10 2 10 3
HYPOCENTRAL DISTANCE (km)
-0.5
0-0
.25
0.0
0
Ob
se
rve
d -
Pre
dic
ted
D(r
)0
.25
0.5
0
12346810121416
f n ( H z )UTAHF o u r i e r A m p l i t u d e D ( r ) f o r f n
Figure 4.1: Residuals of the model fit to the Fourier velocity distance andgeometrical spreading function of Model A

65
101 10 2 10 3
HYPOCENTRAL DISTANCE (km)
-0.5
0-0
.25
0.0
0
Ob
se
rve
d -
Pre
dic
ted
D(r
)0
.25
0.5
0
12346810121416
f n ( H z )UTAHF o u r i e r A m p l i t u d e D ( r ) f o r f n
Figure 4.2: Residuals of the model fit to the Fourier velocity distance andgeometrical spreading function of Model B

66
101 10 2 10 3
HYPOCENTRAL DISTANCE (km)
-0.5
0-0
.25
0.0
0
Ob
se
rve
d -
Pre
dic
ted
D(r
)0
.25
0.5
0
12346810121416
f n ( H z )UTAHB a n d P a s s D ( r ) f o r f n
Figure 4.3: Residuals of the model fit to the band pass distance and geo-metrical spreading function of Model A

67
101 10 2 10 3
HYPOCENTRAL DISTANCE (km)
-0.5
0-0
.25
0.0
0
Ob
se
rve
d -
Pre
dic
ted
D(r
)0
.25
0.5
0
12346810121416
f n ( H z )UTAHB a n d P a s s D ( r ) f o r f n
Figure 4.4: Residuals of the model fit to the band pass distance and geo-metrical spreading function of Model B

68
4.4 Modeling source excitation
Although we do not have calibrated events to study source scaling, we
can predict the excitation at� � ���
km for a simple spectral model. The
prediction of Fourier velocity spectra at a distance of� � � �
km is already
mentioned in section 4.1. The source excitation model for Fourier velocity
spectra at� ��
km as a function of moment-magnitude, � � ,
� � � �� �
� � � � � � �
�� � � � � � � �� �� � � #
where C is a constant given by
� � # ��� � #%� �$# � � �
� ��� � �#
Here the 0.55 represents the S-wave average radiation pattern, 2.0 is the
amplification at the free surface, 0.707 is the reduction factor that accounts
for the partitioning of energy into two horizontal components (Boore, 1983)
and � � � # � � � � � �and � � �$# �
����
are the density and shear velocity
we use. The corner frequency� � , seismic moment � � and
�#%� � ���
are�$# ��� ��� � � & ' � � � � ��� � , �� � � ���
� � ��� ���, and the ratio between vertical and
horizontal components respectively. The �� � �
converts kilometers to cen-
timeters.
Figure 1.5 shows the Fourier acceleration spectra at a distance 1 kilo-
meter for 6 different moment magnitudes and five stress drops-10, 30, 100,
200 and 400 bars. We see that for � �� �
and � �� �
, there is little de-
pendence of shape of spectrum between 1 and 16 Hz as a function of stress
drop for 100, 200 and 300 bars. Since we do not know anything about the
sites, we use the effective " , " ����� , for the composite effect of network aver-
age site amplification, �����
, and " which we define as

69
� ��� � ��� � � � ��� � ���� � � #
Because the excitation for small events recorded at 40 km depends only on� � � �
and the " � ��� and not on the stress drop, studying small earthquakes
enables us to estimate the site effect without worrying about the unknown
source spectrum scaling.
From our spectral model (Section 4.1), we conclude that the parame-
ters controlling the shape of the excitation at 40 kilometer for small earth-
quakes are the� � � �
, � � �
and " . We kept � � � �
and varied " ����� to
fit small earthquake spectra. A " ����� � �$#%����sec, shown in the propaga-
tion parameter table (Table 4.1) was selected for use with a 400 bar stress
drop. Linear frequency plots demonstrate the good fit for small earth-
quakes from Figure 4.7 to 4.13.
Figure 1.6 shows the excitation of Fourier velocity spectra for Model A.
We found that the &(' ��� ���was required to match the excitation of both
small and large earthquake shapes since the shape of the excitation does
not change much with source size, a factor of 1000 in low frequency excita-
tion. The fundamental difference between propagation Models A and B is
that the predicted spectral levels for the A model are higher by about�$#�� �
�$# ��� � units than for the B model. This is because Model B has a very rapid
geometrical spreading at short distances. At this point we cannot distin-
guish between the models since we do not know the absolute seismic mo-
ments of any event. An indirect comparison comes from the observation
that the UUSS � � ’s for � � � 3 are close to the � � ’s obtained from wave-
form modeling by Nabelek (http://quakes.oce.orst.edu/moment-tensor/),

70
Mw=7
Mw=6
Mw=5
Mw=4 Mw=3 Mw=2
10 - 2 10 - 1 100 10 1 10 2
F r e q u e n c y ( H z )
10- 2
10- 1
100
101
102
103
104
FA
S (
cm
/se
c)
10 - 2 10 - 1 100 10 1 10 2
F r e q u e n c y ( H z )
10- 2
10- 1
100
101
102
103
104
FA
S (
cm
/se
c)
10 - 2 10 - 1 100 10 1 10 2
F r e q u e n c y ( H z )
10- 2
10- 1
100
101
102
103
104
FA
S (
cm
/se
c)
10 - 2 10 - 1 100 10 1 10 2
F r e q u e n c y ( H z )
10- 2
10- 1
100
101
102
103
104
FA
S (
cm
/se
c)
10 - 2 10 - 1 100 10 1 10 2
F r e q u e n c y ( H z )
10- 2
10- 1
100
101
102
103
104
FA
S (
cm
/se
c)
Figure 4.5: Fourier acceleration spectra at a distance 1 km as a functionof � � for stress drop 10, 30, 100, 200 and 400 bars. Dark and lightestline indicate 10 and 400 bars. The different ��� are indicated by the differ-ent low frequency asymptotics. For a given � � , the high frequency levelvaries as & ' .

71
and thus model B may be preferred even though its geometrical spreading
at short distance is not the typical� �
�usually assumed by other investiga-
tors (Atkinson and Boore, 1995).
We also investigated the excitation of the mining related events. Pos-
sible explanations for the excitation of mining events are first, a higher
" ���$#%� �which reduces all high frequency because of a shallow source "
effect in addition to the receiver site " effect. So doubling the earthquake
" is one way to test this. The " effect is shown in Figure 4.14. The second
possibility is that these are low stress drop events based on the idea that
the collapse of long tunnels is a very slow process. Low stress drops imply
lower corner frequencies for a given � � . Figure 4.15 shows the predic-
tions of the &(' � �$# bar source model. There is a better fit with the low
stress drop event, but the seismic moments are unrealistically large.
The exact nature of the mining collapse source time functions is in-
teresting and requires studying both the� � �#%�
Hz excitation as done
in this study and the� � �#%�
excitation, which can be done by low fre-
quency waveform modeling. Waveform modeling is also required for
events � � � 3.0 to resolve both the absolute scaling of earthquake spectra
and mining spectra.

72
100 10 1 10 2
F r e q ( H Z )
-8.0
0-7
.00
-6.0
0-5
.00
Ex
cit
ati
on
at
40
km
-4.0
0-3
.00
F o u r i e r V e l o c i t y - E Q
100 10 1 10 2
F r e q ( H Z )
-8.0
0-7
.00
-6.0
0-5
.00
Ex
cit
ati
on
at
40
km
-4.0
0-3
.00
F o u r i e r V e l o c i t y - E Q
100 10 1 10 2
F r e q ( H Z )
-8.0
0-7
.00
-6.0
0-5
.00
Ex
cit
ati
on
at
40
km
-4.0
0-3
.00
F o u r i e r V e l o c i t y - E Q
100 10 1 10 2
F r e q ( H Z )
-8.0
0-7
.00
-6.0
0-5
.00
Ex
cit
ati
on
at
40
km
-4.0
0-3
.00
F o u r i e r V e l o c i t y - E Q
100 10 1 10 2
F r e q ( H Z )
-8.0
0-7
.00
-6.0
0-5
.00
Ex
cit
ati
on
at
40
km
-4.0
0-3
.00
F o u r i e r V e l o c i t y - E Q
100 10 1 10 2
F r e q ( H Z )
-8.0
0-7
.00
-6.0
0-5
.00
Ex
cit
ati
on
at
40
km
-4.0
0-3
.00
F o u r i e r V e l o c i t y - E Q
100 10 1 10 2
F r e q ( H Z )
-8.0
0-7
.00
-6.0
0-5
.00
Ex
cit
ati
on
at
40
km
-4.0
0-3
.00
F o u r i e r V e l o c i t y - E Q
100 10 1 10 2
F r e q ( H Z )
-8.0
0-7
.00
-6.0
0-5
.00
Ex
cit
ati
on
at
40
km
-4.0
0-3
.00
F o u r i e r V e l o c i t y - E Q
100 10 1 10 2
F r e q ( H Z )
-8.0
0-7
.00
-6.0
0-5
.00
Ex
cit
ati
on
at
40
km
-4.0
0-3
.00
F o u r i e r V e l o c i t y - E Q
100 10 1 10 2
F r e q ( H Z )
-8.0
0-7
.00
-6.0
0-5
.00
Ex
cit
ati
on
at
40
km
-4.0
0-3
.00
F o u r i e r V e l o c i t y - E Q
100 10 1 10 2
F r e q ( H Z )
-8.0
0-7
.00
-6.0
0-5
.00
Ex
cit
ati
on
at
40
km
-4.0
0-3
.00
F o u r i e r V e l o c i t y - E Q
100 10 1 10 2
F r e q ( H Z )
-8.0
0-7
.00
-6.0
0-5
.00
Ex
cit
ati
on
at
40
km
-4.0
0-3
.00
F o u r i e r V e l o c i t y - E Q
100 10 1 10 2
F r e q ( H Z )
-8.0
0-7
.00
-6.0
0-5
.00
Ex
cit
ati
on
at
40
km
-4.0
0-3
.00
F o u r i e r V e l o c i t y - E Q
100 10 1 10 2
F r e q ( H Z )
-8.0
0-7
.00
-6.0
0-5
.00
Ex
cit
ati
on
at
40
km
-4.0
0-3
.00
F o u r i e r V e l o c i t y - E Q
100 10 1 10 2
F r e q ( H Z )
-8.0
0-7
.00
-6.0
0-5
.00
Ex
cit
ati
on
at
40
km
-4.0
0-3
.00
F o u r i e r V e l o c i t y - E Q
100 10 1 10 2
F r e q ( H Z )
-8.0
0-7
.00
-6.0
0-5
.00
Ex
cit
ati
on
at
40
km
-4.0
0-3
.00
F o u r i e r V e l o c i t y - E Q
100 10 1 10 2
F r e q ( H Z )
-8.0
0-7
.00
-6.0
0-5
.00
Ex
cit
ati
on
at
40
km
-4.0
0-3
.00
F o u r i e r V e l o c i t y - E Q
100 10 1 10 2
F r e q ( H Z )
-8.0
0-7
.00
-6.0
0-5
.00
Ex
cit
ati
on
at
40
km
-4.0
0-3
.00
F o u r i e r V e l o c i t y - E Q
100 10 1 10 2
F r e q ( H Z )
-8.0
0-7
.00
-6.0
0-5
.00
Ex
cit
ati
on
at
40
km
-4.0
0-3
.00
F o u r i e r V e l o c i t y - E Q
100 10 1 10 2
F r e q ( H Z )
-8.0
0-7
.00
-6.0
0-5
.00
Ex
cit
ati
on
at
40
km
-4.0
0-3
.00
F o u r i e r V e l o c i t y - E Q
100 10 1 10 2
F r e q ( H Z )
-8.0
0-7
.00
-6.0
0-5
.00
Ex
cit
ati
on
at
40
km
-4.0
0-3
.00
F o u r i e r V e l o c i t y - E Q
100 10 1 10 2
F r e q ( H Z )
-8.0
0-7
.00
-6.0
0-5
.00
Ex
cit
ati
on
at
40
km
-4.0
0-3
.00
F o u r i e r V e l o c i t y - E Q
100 10 1 10 2
F r e q ( H Z )
-8.0
0-7
.00
-6.0
0-5
.00
Ex
cit
ati
on
at
40
km
-4.0
0-3
.00
F o u r i e r V e l o c i t y - E Q
100 10 1 10 2
F r e q ( H Z )
-8.0
0-7
.00
-6.0
0-5
.00
Ex
cit
ati
on
at
40
km
-4.0
0-3
.00
F o u r i e r V e l o c i t y - E Q
100 10 1 10 2
F r e q ( H Z )
-8.0
0-7
.00
-6.0
0-5
.00
Ex
cit
ati
on
at
40
km
-4.0
0-3
.00
F o u r i e r V e l o c i t y - E Q
100 10 1 10 2
F r e q ( H Z )
-8.0
0-7
.00
-6.0
0-5
.00
Ex
cit
ati
on
at
40
km
-4.0
0-3
.00
F o u r i e r V e l o c i t y - E Q
100 10 1 10 2
F r e q ( H Z )
-8.0
0-7
.00
-6.0
0-5
.00
Ex
cit
ati
on
at
40
km
-4.0
0-3
.00
F o u r i e r V e l o c i t y - E Q
100 10 1 10 2
F r e q ( H Z )
-8.0
0-7
.00
-6.0
0-5
.00
Ex
cit
ati
on
at
40
km
-4.0
0-3
.00
F o u r i e r V e l o c i t y - E Q
100 10 1 10 2
F r e q ( H Z )
-8.0
0-7
.00
-6.0
0-5
.00
Ex
cit
ati
on
at
40
km
-4.0
0-3
.00
F o u r i e r V e l o c i t y - E Q
100 10 1 10 2
F r e q ( H Z )
-8.0
0-7
.00
-6.0
0-5
.00
Ex
cit
ati
on
at
40
km
-4.0
0-3
.00
F o u r i e r V e l o c i t y - E Q
100 10 1 10 2
F r e q ( H Z )
-8.0
0-7
.00
-6.0
0-5
.00
Ex
cit
ati
on
at
40
km
-4.0
0-3
.00
F o u r i e r V e l o c i t y - E Q
100 10 1 10 2
F r e q ( H Z )
-8.0
0-7
.00
-6.0
0-5
.00
Ex
cit
ati
on
at
40
km
-4.0
0-3
.00
F o u r i e r V e l o c i t y - E Q
100 10 1 10 2
F r e q ( H Z )
-8.0
0-7
.00
-6.0
0-5
.00
Ex
cit
ati
on
at
40
km
-4.0
0-3
.00
F o u r i e r V e l o c i t y - E Q
100 10 1 10 2
F r e q ( H Z )
-8.0
0-7
.00
-6.0
0-5
.00
Ex
cit
ati
on
at
40
km
-4.0
0-3
.00
F o u r i e r V e l o c i t y - E Q
100 10 1 10 2
F r e q ( H Z )
-8.0
0-7
.00
-6.0
0-5
.00
Ex
cit
ati
on
at
40
km
-4.0
0-3
.00
F o u r i e r V e l o c i t y - E Q
100 10 1 10 2
F r e q ( H Z )
-8.0
0-7
.00
-6.0
0-5
.00
Ex
cit
ati
on
at
40
km
-4.0
0-3
.00
F o u r i e r V e l o c i t y - E Q
100 10 1 10 2
F r e q ( H Z )
-8.0
0-7
.00
-6.0
0-5
.00
Ex
cit
ati
on
at
40
km
-4.0
0-3
.00
F o u r i e r V e l o c i t y - E Q
100 10 1 10 2
F r e q ( H Z )
-8.0
0-7
.00
-6.0
0-5
.00
Ex
cit
ati
on
at
40
km
-4.0
0-3
.00
F o u r i e r V e l o c i t y - E Q
100 10 1 10 2
F r e q ( H Z )
-8.0
0-7
.00
-6.0
0-5
.00
Ex
cit
ati
on
at
40
km
-4.0
0-3
.00
F o u r i e r V e l o c i t y - E Q
100 10 1 10 2
F r e q ( H Z )
-8.0
0-7
.00
-6.0
0-5
.00
Ex
cit
ati
on
at
40
km
-4.0
0-3
.00
F o u r i e r V e l o c i t y - E Q
100 10 1 10 2
F r e q ( H Z )
-8.0
0-7
.00
-6.0
0-5
.00
Ex
cit
ati
on
at
40
km
-4.0
0-3
.00
F o u r i e r V e l o c i t y - E Q
100 10 1 10 2
F r e q ( H Z )
-8.0
0-7
.00
-6.0
0-5
.00
Ex
cit
ati
on
at
40
km
-4.0
0-3
.00
F o u r i e r V e l o c i t y - E Q
100 10 1 10 2
F r e q ( H Z )
-8.0
0-7
.00
-6.0
0-5
.00
Ex
cit
ati
on
at
40
km
-4.0
0-3
.00
F o u r i e r V e l o c i t y - E Q
100 10 1 10 2
F r e q ( H Z )
-8.0
0-7
.00
-6.0
0-5
.00
Ex
cit
ati
on
at
40
km
-4.0
0-3
.00
F o u r i e r V e l o c i t y - E Q
100 10 1 10 2
F r e q ( H Z )
-8.0
0-7
.00
-6.0
0-5
.00
Ex
cit
ati
on
at
40
km
-4.0
0-3
.00
F o u r i e r V e l o c i t y - E Q
100 10 1 10 2
F r e q ( H Z )
-8.0
0-7
.00
-6.0
0-5
.00
Ex
cit
ati
on
at
40
km
-4.0
0-3
.00
F o u r i e r V e l o c i t y - E Q
100 10 1 10 2
F r e q ( H Z )
-8.0
0-7
.00
-6.0
0-5
.00
Ex
cit
ati
on
at
40
km
-4.0
0-3
.00
F o u r i e r V e l o c i t y - E Q
100 10 1 10 2
F r e q ( H Z )
-8.0
0-7
.00
-6.0
0-5
.00
Ex
cit
ati
on
at
40
km
-4.0
0-3
.00
F o u r i e r V e l o c i t y - E Q
100 10 1 10 2
F r e q ( H Z )
-8.0
0-7
.00
-6.0
0-5
.00
Ex
cit
ati
on
at
40
km
-4.0
0-3
.00
F o u r i e r V e l o c i t y - E Q
100 10 1 10 2
F r e q ( H Z )
-8.0
0-7
.00
-6.0
0-5
.00
Ex
cit
ati
on
at
40
km
-4.0
0-3
.00
F o u r i e r V e l o c i t y - E Q
100 10 1 10 2
F r e q ( H Z )
-8.0
0-7
.00
-6.0
0-5
.00
Ex
cit
ati
on
at
40
km
-4.0
0-3
.00
F o u r i e r V e l o c i t y - E Q
100 10 1 10 2
F r e q ( H Z )
-8.0
0-7
.00
-6.0
0-5
.00
Ex
cit
ati
on
at
40
km
-4.0
0-3
.00
F o u r i e r V e l o c i t y - E Q
100 10 1 10 2
F r e q ( H Z )
-8.0
0-7
.00
-6.0
0-5
.00
Ex
cit
ati
on
at
40
km
-4.0
0-3
.00
F o u r i e r V e l o c i t y - E Q
100 10 1 10 2
F r e q ( H Z )
-8.0
0-7
.00
-6.0
0-5
.00
Ex
cit
ati
on
at
40
km
-4.0
0-3
.00
F o u r i e r V e l o c i t y - E Q
100 10 1 10 2
F r e q ( H Z )
-8.0
0-7
.00
-6.0
0-5
.00
Ex
cit
ati
on
at
40
km
-4.0
0-3
.00
F o u r i e r V e l o c i t y - E Q
100 10 1 10 2
F r e q ( H Z )
-8.0
0-7
.00
-6.0
0-5
.00
Ex
cit
ati
on
at
40
km
-4.0
0-3
.00
F o u r i e r V e l o c i t y - E Q
100 10 1 10 2
F r e q ( H Z )
-8.0
0-7
.00
-6.0
0-5
.00
Ex
cit
ati
on
at
40
km
-4.0
0-3
.00
F o u r i e r V e l o c i t y - E Q
100 10 1 10 2
F r e q ( H Z )
-8.0
0-7
.00
-6.0
0-5
.00
Ex
cit
ati
on
at
40
km
-4.0
0-3
.00
F o u r i e r V e l o c i t y - E Q
100 10 1 10 2
F r e q ( H Z )
-8.0
0-7
.00
-6.0
0-5
.00
Ex
cit
ati
on
at
40
km
-4.0
0-3
.00
F o u r i e r V e l o c i t y - E Q
100 10 1 10 2
F r e q ( H Z )
-8.0
0-7
.00
-6.0
0-5
.00
Ex
cit
ati
on
at
40
km
-4.0
0-3
.00
F o u r i e r V e l o c i t y - E Q
100 10 1 10 2
F r e q ( H Z )
-8.0
0-7
.00
-6.0
0-5
.00
Ex
cit
ati
on
at
40
km
-4.0
0-3
.00
F o u r i e r V e l o c i t y - E Q
100 10 1 10 2
F r e q ( H Z )
-8.0
0-7
.00
-6.0
0-5
.00
Ex
cit
ati
on
at
40
km
-4.0
0-3
.00
F o u r i e r V e l o c i t y - E Q
100 10 1 10 2
F r e q ( H Z )
-8.0
0-7
.00
-6.0
0-5
.00
Ex
cit
ati
on
at
40
km
-4.0
0-3
.00
F o u r i e r V e l o c i t y - E Q
100 10 1 10 2
F r e q ( H Z )
-8.0
0-7
.00
-6.0
0-5
.00
Ex
cit
ati
on
at
40
km
-4.0
0-3
.00
F o u r i e r V e l o c i t y - E Q
100 10 1 10 2
F r e q ( H Z )
-8.0
0-7
.00
-6.0
0-5
.00
Ex
cit
ati
on
at
40
km
-4.0
0-3
.00
F o u r i e r V e l o c i t y - E Q
100 10 1 10 2
F r e q ( H Z )
-8.0
0-7
.00
-6.0
0-5
.00
Ex
cit
ati
on
at
40
km
-4.0
0-3
.00
F o u r i e r V e l o c i t y - E Q
100 10 1 10 2
F r e q ( H Z )
-8.0
0-7
.00
-6.0
0-5
.00
Ex
cit
ati
on
at
40
km
-4.0
0-3
.00
F o u r i e r V e l o c i t y - E Q
100 10 1 10 2
F r e q ( H Z )
-8.0
0-7
.00
-6.0
0-5
.00
Ex
cit
ati
on
at
40
km
-4.0
0-3
.00
F o u r i e r V e l o c i t y - E Q
100 10 1 10 2
F r e q ( H Z )
-8.0
0-7
.00
-6.0
0-5
.00
Ex
cit
ati
on
at
40
km
-4.0
0-3
.00
F o u r i e r V e l o c i t y - E Q
100 10 1 10 2
F r e q ( H Z )
-8.0
0-7
.00
-6.0
0-5
.00
Ex
cit
ati
on
at
40
km
-4.0
0-3
.00
F o u r i e r V e l o c i t y - E Q
100 10 1 10 2
F r e q ( H Z )
-8.0
0-7
.00
-6.0
0-5
.00
Ex
cit
ati
on
at
40
km
-4.0
0-3
.00
F o u r i e r V e l o c i t y - E Q
100 10 1 10 2
F r e q ( H Z )
-8.0
0-7
.00
-6.0
0-5
.00
Ex
cit
ati
on
at
40
km
-4.0
0-3
.00
F o u r i e r V e l o c i t y - E Q
100 10 1 10 2
F r e q ( H Z )
-8.0
0-7
.00
-6.0
0-5
.00
Ex
cit
ati
on
at
40
km
-4.0
0-3
.00
F o u r i e r V e l o c i t y - E Q
100 10 1 10 2
F r e q ( H Z )
-8.0
0-7
.00
-6.0
0-5
.00
Ex
cit
ati
on
at
40
km
-4.0
0-3
.00
F o u r i e r V e l o c i t y - E Q
100 10 1 10 2
F r e q ( H Z )
-8.0
0-7
.00
-6.0
0-5
.00
Ex
cit
ati
on
at
40
km
-4.0
0-3
.00
F o u r i e r V e l o c i t y - E Q
100 10 1 10 2
F r e q ( H Z )
-8.0
0-7
.00
-6.0
0-5
.00
Ex
cit
ati
on
at
40
km
-4.0
0-3
.00
F o u r i e r V e l o c i t y - E Q
100 10 1 10 2
F r e q ( H Z )
-8.0
0-7
.00
-6.0
0-5
.00
Ex
cit
ati
on
at
40
km
-4.0
0-3
.00
F o u r i e r V e l o c i t y - E Q
100 10 1 10 2
F r e q ( H Z )
-8.0
0-7
.00
-6.0
0-5
.00
Ex
cit
ati
on
at
40
km
-4.0
0-3
.00
F o u r i e r V e l o c i t y - E Q
100 10 1 10 2
F r e q ( H Z )
-8.0
0-7
.00
-6.0
0-5
.00
Ex
cit
ati
on
at
40
km
-4.0
0-3
.00
F o u r i e r V e l o c i t y - E Q
100 10 1 10 2
F r e q ( H Z )
-8.0
0-7
.00
-6.0
0-5
.00
Ex
cit
ati
on
at
40
km
-4.0
0-3
.00
F o u r i e r V e l o c i t y - E Q
100 10 1 10 2
F r e q ( H Z )
-8.0
0-7
.00
-6.0
0-5
.00
Ex
cit
ati
on
at
40
km
-4.0
0-3
.00
F o u r i e r V e l o c i t y - E Q
100 10 1 10 2
F r e q ( H Z )
-8.0
0-7
.00
-6.0
0-5
.00
Ex
cit
ati
on
at
40
km
-4.0
0-3
.00
F o u r i e r V e l o c i t y - E Q
100 10 1 10 2
F r e q ( H Z )
-8.0
0-7
.00
-6.0
0-5
.00
Ex
cit
ati
on
at
40
km
-4.0
0-3
.00
F o u r i e r V e l o c i t y - E Q
100 10 1 10 2
F r e q ( H Z )
-8.0
0-7
.00
-6.0
0-5
.00
Ex
cit
ati
on
at
40
km
-4.0
0-3
.00
F o u r i e r V e l o c i t y - E Q
100 10 1 10 2
F r e q ( H Z )
-8.0
0-7
.00
-6.0
0-5
.00
Ex
cit
ati
on
at
40
km
-4.0
0-3
.00
F o u r i e r V e l o c i t y - E Q
100 10 1 10 2
F r e q ( H Z )
-8.0
0-7
.00
-6.0
0-5
.00
Ex
cit
ati
on
at
40
km
-4.0
0-3
.00
F o u r i e r V e l o c i t y - E Q
100 10 1 10 2
F r e q ( H Z )
-8.0
0-7
.00
-6.0
0-5
.00
Ex
cit
ati
on
at
40
km
-4.0
0-3
.00
F o u r i e r V e l o c i t y - E Q
100 10 1 10 2
F r e q ( H Z )
-8.0
0-7
.00
-6.0
0-5
.00
Ex
cit
ati
on
at
40
km
-4.0
0-3
.00
F o u r i e r V e l o c i t y - E Q
100 10 1 10 2
F r e q ( H Z )
-8.0
0-7
.00
-6.0
0-5
.00
Ex
cit
ati
on
at
40
km
-4.0
0-3
.00
F o u r i e r V e l o c i t y - E Q
100 10 1 10 2
F r e q ( H Z )
-8.0
0-7
.00
-6.0
0-5
.00
Ex
cit
ati
on
at
40
km
-4.0
0-3
.00
F o u r i e r V e l o c i t y - E Q
100 10 1 10 2
F r e q ( H Z )
-8.0
0-7
.00
-6.0
0-5
.00
Ex
cit
ati
on
at
40
km
-4.0
0-3
.00
F o u r i e r V e l o c i t y - E Q
100 10 1 10 2
F r e q ( H Z )
-8.0
0-7
.00
-6.0
0-5
.00
Ex
cit
ati
on
at
40
km
-4.0
0-3
.00
F o u r i e r V e l o c i t y - E Q
100 10 1 10 2
F r e q ( H Z )
-8.0
0-7
.00
-6.0
0-5
.00
Ex
cit
ati
on
at
40
km
-4.0
0-3
.00
F o u r i e r V e l o c i t y - E Q
100 10 1 10 2
F r e q ( H Z )
-8.0
0-7
.00
-6.0
0-5
.00
Ex
cit
ati
on
at
40
km
-4.0
0-3
.00
F o u r i e r V e l o c i t y - E Q
100 10 1 10 2
F r e q ( H Z )
-8.0
0-7
.00
-6.0
0-5
.00
Ex
cit
ati
on
at
40
km
-4.0
0-3
.00
F o u r i e r V e l o c i t y - E Q
100 10 1 10 2
F r e q ( H Z )
-8.0
0-7
.00
-6.0
0-5
.00
Ex
cit
ati
on
at
40
km
-4.0
0-3
.00
F o u r i e r V e l o c i t y - E Q
100 10 1 10 2
F r e q ( H Z )
-8.0
0-7
.00
-6.0
0-5
.00
Ex
cit
ati
on
at
40
km
-4.0
0-3
.00
F o u r i e r V e l o c i t y - E Q
100 10 1 10 2
F r e q ( H Z )
-8.0
0-7
.00
-6.0
0-5
.00
Ex
cit
ati
on
at
40
km
-4.0
0-3
.00
F o u r i e r V e l o c i t y - E Q
100 10 1 10 2
F r e q ( H Z )
-8.0
0-7
.00
-6.0
0-5
.00
Ex
cit
ati
on
at
40
km
-4.0
0-3
.00
F o u r i e r V e l o c i t y - E Q
100 10 1 10 2
F r e q ( H Z )
-8.0
0-7
.00
-6.0
0-5
.00
Ex
cit
ati
on
at
40
km
-4.0
0-3
.00
F o u r i e r V e l o c i t y - E Q
100 10 1 10 2
F r e q ( H Z )
-8.0
0-7
.00
-6.0
0-5
.00
Ex
cit
ati
on
at
40
km
-4.0
0-3
.00
F o u r i e r V e l o c i t y - E Q
100 10 1 10 2
F r e q ( H Z )
-8.0
0-7
.00
-6.0
0-5
.00
Ex
cit
ati
on
at
40
km
-4.0
0-3
.00
F o u r i e r V e l o c i t y - E Q
100 10 1 10 2
F r e q ( H Z )
-8.0
0-7
.00
-6.0
0-5
.00
Ex
cit
ati
on
at
40
km
-4.0
0-3
.00
F o u r i e r V e l o c i t y - E Q
100 10 1 10 2
F r e q ( H Z )
-8.0
0-7
.00
-6.0
0-5
.00
Ex
cit
ati
on
at
40
km
-4.0
0-3
.00
F o u r i e r V e l o c i t y - E Q
100 10 1 10 2
F r e q ( H Z )
-8.0
0-7
.00
-6.0
0-5
.00
Ex
cit
ati
on
at
40
km
-4.0
0-3
.00
F o u r i e r V e l o c i t y - E Q
100 10 1 10 2
F r e q ( H Z )
-8.0
0-7
.00
-6.0
0-5
.00
Ex
cit
ati
on
at
40
km
-4.0
0-3
.00
F o u r i e r V e l o c i t y - E Q
100 10 1 10 2
F r e q ( H Z )
-8.0
0-7
.00
-6.0
0-5
.00
Ex
cit
ati
on
at
40
km
-4.0
0-3
.00
F o u r i e r V e l o c i t y - E Q
100 10 1 10 2
F r e q ( H Z )
-8.0
0-7
.00
-6.0
0-5
.00
Ex
cit
ati
on
at
40
km
-4.0
0-3
.00
F o u r i e r V e l o c i t y - E Q
100 10 1 10 2
F r e q ( H Z )
-8.0
0-7
.00
-6.0
0-5
.00
Ex
cit
ati
on
at
40
km
-4.0
0-3
.00
F o u r i e r V e l o c i t y - E Q
100 10 1 10 2
F r e q ( H Z )
-8.0
0-7
.00
-6.0
0-5
.00
Ex
cit
ati
on
at
40
km
-4.0
0-3
.00
F o u r i e r V e l o c i t y - E Q
100 10 1 10 2
F r e q ( H Z )
-8.0
0-7
.00
-6.0
0-5
.00
Ex
cit
ati
on
at
40
km
-4.0
0-3
.00
F o u r i e r V e l o c i t y - E Q
100 10 1 10 2
F r e q ( H Z )
-8.0
0-7
.00
-6.0
0-5
.00
Ex
cit
ati
on
at
40
km
-4.0
0-3
.00
F o u r i e r V e l o c i t y - E Q
100 10 1 10 2
F r e q ( H Z )
-8.0
0-7
.00
-6.0
0-5
.00
Ex
cit
ati
on
at
40
km
-4.0
0-3
.00
F o u r i e r V e l o c i t y S p e c t r a
100 10 1 10 2
F r e q ( H Z )
-8.0
0-7
.00
-6.0
0-5
.00
Ex
cit
ati
on
at
40
km
-4.0
0-3
.00
F o u r i e r V e l o c i t y S p e c t r a
100 10 1 10 2
F r e q ( H Z )
-8.0
0-7
.00
-6.0
0-5
.00
Ex
cit
ati
on
at
40
km
-4.0
0-3
.00
F o u r i e r V e l o c i t y S p e c t r a
100 10 1 10 2
F r e q ( H Z )
-8.0
0-7
.00
-6.0
0-5
.00
Ex
cit
ati
on
at
40
km
-4.0
0-3
.00
F o u r i e r V e l o c i t y S p e c t r a
100 10 1 10 2
F r e q ( H Z )
-8.0
0-7
.00
-6.0
0-5
.00
Ex
cit
ati
on
at
40
km
-4.0
0-3
.00
F o u r i e r V e l o c i t y S p e c t r a
100 10 1 10 2
F r e q ( H Z )
-8.0
0-7
.00
-6.0
0-5
.00
Ex
cit
ati
on
at
40
km
-4.0
0-3
.00
F o u r i e r V e l o c i t y S p e c t r a
Mw=4.5
Mw=4.0
Mw=3.5
Mw=3.0
Mw=2.5
Mw=2.0
RED - THEO
BLACK - Data
Figure 4.6: Excitation of Fourier velocity spectra at 40 km (Model A). Thethick dash curve is the prediction of the 400 bar constant stress dropsource model. E is the log � � of the Fourier velocity spectra in �
�������.

73
0 . 0 0 5 . 0 0 1 0 . 0 0F r e q ( H Z )
1 5 . 0 0 2 0 . 0 0
-8.0
0-7
.00
-6.0
0-5
.00
Ex
cit
ati
on
at
40
km
-4.0
0-3
.00
F o u r i e r V e l o c i t y - E Q
0 . 0 0 5 . 0 0 1 0 . 0 0F r e q ( H Z )
1 5 . 0 0 2 0 . 0 0
-8.0
0-7
.00
-6.0
0-5
.00
Ex
cit
ati
on
at
40
km
-4.0
0-3
.00
F o u r i e r V e l o c i t y - E Q
0 . 0 0 5 . 0 0 1 0 . 0 0F r e q ( H Z )
1 5 . 0 0 2 0 . 0 0
-8.0
0-7
.00
-6.0
0-5
.00
Ex
cit
ati
on
at
40
km
-4.0
0-3
.00
F o u r i e r V e l o c i t y - E Q
0 . 0 0 5 . 0 0 1 0 . 0 0F r e q ( H Z )
1 5 . 0 0 2 0 . 0 0
-8.0
0-7
.00
-6.0
0-5
.00
Ex
cit
ati
on
at
40
km
-4.0
0-3
.00
F o u r i e r V e l o c i t y - E Q
0 . 0 0 5 . 0 0 1 0 . 0 0F r e q ( H Z )
1 5 . 0 0 2 0 . 0 0
-8.0
0-7
.00
-6.0
0-5
.00
Ex
cit
ati
on
at
40
km
-4.0
0-3
.00
F o u r i e r V e l o c i t y - E Q
0 . 0 0 5 . 0 0 1 0 . 0 0F r e q ( H Z )
1 5 . 0 0 2 0 . 0 0
-8.0
0-7
.00
-6.0
0-5
.00
Ex
cit
ati
on
at
40
km
-4.0
0-3
.00
F o u r i e r V e l o c i t y - E Q
0 . 0 0 5 . 0 0 1 0 . 0 0F r e q ( H Z )
1 5 . 0 0 2 0 . 0 0
-8.0
0-7
.00
-6.0
0-5
.00
Ex
cit
ati
on
at
40
km
-4.0
0-3
.00
F o u r i e r V e l o c i t y - E Q
0 . 0 0 5 . 0 0 1 0 . 0 0F r e q ( H Z )
1 5 . 0 0 2 0 . 0 0
-8.0
0-7
.00
-6.0
0-5
.00
Ex
cit
ati
on
at
40
km
-4.0
0-3
.00
F o u r i e r V e l o c i t y - E Q
0 . 0 0 5 . 0 0 1 0 . 0 0F r e q ( H Z )
1 5 . 0 0 2 0 . 0 0
-8.0
0-7
.00
-6.0
0-5
.00
Ex
cit
ati
on
at
40
km
-4.0
0-3
.00
F o u r i e r V e l o c i t y - E Q
0 . 0 0 5 . 0 0 1 0 . 0 0F r e q ( H Z )
1 5 . 0 0 2 0 . 0 0
-8.0
0-7
.00
-6.0
0-5
.00
Ex
cit
ati
on
at
40
km
-4.0
0-3
.00
F o u r i e r V e l o c i t y - E Q
0 . 0 0 5 . 0 0 1 0 . 0 0F r e q ( H Z )
1 5 . 0 0 2 0 . 0 0
-8.0
0-7
.00
-6.0
0-5
.00
Ex
cit
ati
on
at
40
km
-4.0
0-3
.00
F o u r i e r V e l o c i t y - E Q
0 . 0 0 5 . 0 0 1 0 . 0 0F r e q ( H Z )
1 5 . 0 0 2 0 . 0 0
-8.0
0-7
.00
-6.0
0-5
.00
Ex
cit
ati
on
at
40
km
-4.0
0-3
.00
F o u r i e r V e l o c i t y - E Q
0 . 0 0 5 . 0 0 1 0 . 0 0F r e q ( H Z )
1 5 . 0 0 2 0 . 0 0
-8.0
0-7
.00
-6.0
0-5
.00
Ex
cit
ati
on
at
40
km
-4.0
0-3
.00
F o u r i e r V e l o c i t y - E Q
0 . 0 0 5 . 0 0 1 0 . 0 0F r e q ( H Z )
1 5 . 0 0 2 0 . 0 0
-8.0
0-7
.00
-6.0
0-5
.00
Ex
cit
ati
on
at
40
km
-4.0
0-3
.00
F o u r i e r V e l o c i t y - E Q
0 . 0 0 5 . 0 0 1 0 . 0 0F r e q ( H Z )
1 5 . 0 0 2 0 . 0 0
-8.0
0-7
.00
-6.0
0-5
.00
Ex
cit
ati
on
at
40
km
-4.0
0-3
.00
F o u r i e r V e l o c i t y - E Q
0 . 0 0 5 . 0 0 1 0 . 0 0F r e q ( H Z )
1 5 . 0 0 2 0 . 0 0
-8.0
0-7
.00
-6.0
0-5
.00
Ex
cit
ati
on
at
40
km
-4.0
0-3
.00
F o u r i e r V e l o c i t y - E Q
0 . 0 0 5 . 0 0 1 0 . 0 0F r e q ( H Z )
1 5 . 0 0 2 0 . 0 0
-8.0
0-7
.00
-6.0
0-5
.00
Ex
cit
ati
on
at
40
km
-4.0
0-3
.00
F o u r i e r V e l o c i t y - E Q
0 . 0 0 5 . 0 0 1 0 . 0 0F r e q ( H Z )
1 5 . 0 0 2 0 . 0 0
-8.0
0-7
.00
-6.0
0-5
.00
Ex
cit
ati
on
at
40
km
-4.0
0-3
.00
F o u r i e r V e l o c i t y - E Q
0 . 0 0 5 . 0 0 1 0 . 0 0F r e q ( H Z )
1 5 . 0 0 2 0 . 0 0
-8.0
0-7
.00
-6.0
0-5
.00
Ex
cit
ati
on
at
40
km
-4.0
0-3
.00
F o u r i e r V e l o c i t y - E Q
0 . 0 0 5 . 0 0 1 0 . 0 0F r e q ( H Z )
1 5 . 0 0 2 0 . 0 0
-8.0
0-7
.00
-6.0
0-5
.00
Ex
cit
ati
on
at
40
km
-4.0
0-3
.00
F o u r i e r V e l o c i t y - E Q
0 . 0 0 5 . 0 0 1 0 . 0 0F r e q ( H Z )
1 5 . 0 0 2 0 . 0 0
-8.0
0-7
.00
-6.0
0-5
.00
Ex
cit
ati
on
at
40
km
-4.0
0-3
.00
F o u r i e r V e l o c i t y - E Q
0 . 0 0 5 . 0 0 1 0 . 0 0F r e q ( H Z )
1 5 . 0 0 2 0 . 0 0
-8.0
0-7
.00
-6.0
0-5
.00
Ex
cit
ati
on
at
40
km
-4.0
0-3
.00
F o u r i e r V e l o c i t y - E Q
0 . 0 0 5 . 0 0 1 0 . 0 0F r e q ( H Z )
1 5 . 0 0 2 0 . 0 0
-8.0
0-7
.00
-6.0
0-5
.00
Ex
cit
ati
on
at
40
km
-4.0
0-3
.00
F o u r i e r V e l o c i t y - E Q
0 . 0 0 5 . 0 0 1 0 . 0 0F r e q ( H Z )
1 5 . 0 0 2 0 . 0 0
-8.0
0-7
.00
-6.0
0-5
.00
Ex
cit
ati
on
at
40
km
-4.0
0-3
.00
F o u r i e r V e l o c i t y - E Q
0 . 0 0 5 . 0 0 1 0 . 0 0F r e q ( H Z )
1 5 . 0 0 2 0 . 0 0
-8.0
0-7
.00
-6.0
0-5
.00
Ex
cit
ati
on
at
40
km
-4.0
0-3
.00
F o u r i e r V e l o c i t y - E Q
0 . 0 0 5 . 0 0 1 0 . 0 0F r e q ( H Z )
1 5 . 0 0 2 0 . 0 0
-8.0
0-7
.00
-6.0
0-5
.00
Ex
cit
ati
on
at
40
km
-4.0
0-3
.00
F o u r i e r V e l o c i t y - E Q
0 . 0 0 5 . 0 0 1 0 . 0 0F r e q ( H Z )
1 5 . 0 0 2 0 . 0 0
-8.0
0-7
.00
-6.0
0-5
.00
Ex
cit
ati
on
at
40
km
-4.0
0-3
.00
F o u r i e r V e l o c i t y - E Q
0 . 0 0 5 . 0 0 1 0 . 0 0F r e q ( H Z )
1 5 . 0 0 2 0 . 0 0
-8.0
0-7
.00
-6.0
0-5
.00
Ex
cit
ati
on
at
40
km
-4.0
0-3
.00
F o u r i e r V e l o c i t y - E Q
0 . 0 0 5 . 0 0 1 0 . 0 0F r e q ( H Z )
1 5 . 0 0 2 0 . 0 0
-8.0
0-7
.00
-6.0
0-5
.00
Ex
cit
ati
on
at
40
km
-4.0
0-3
.00
F o u r i e r V e l o c i t y - E Q
0 . 0 0 5 . 0 0 1 0 . 0 0F r e q ( H Z )
1 5 . 0 0 2 0 . 0 0
-8.0
0-7
.00
-6.0
0-5
.00
Ex
cit
ati
on
at
40
km
-4.0
0-3
.00
F o u r i e r V e l o c i t y - E Q
0 . 0 0 5 . 0 0 1 0 . 0 0F r e q ( H Z )
1 5 . 0 0 2 0 . 0 0
-8.0
0-7
.00
-6.0
0-5
.00
Ex
cit
ati
on
at
40
km
-4.0
0-3
.00
F o u r i e r V e l o c i t y - E Q
0 . 0 0 5 . 0 0 1 0 . 0 0F r e q ( H Z )
1 5 . 0 0 2 0 . 0 0
-8.0
0-7
.00
-6.0
0-5
.00
Ex
cit
ati
on
at
40
km
-4.0
0-3
.00
F o u r i e r V e l o c i t y - E Q
0 . 0 0 5 . 0 0 1 0 . 0 0F r e q ( H Z )
1 5 . 0 0 2 0 . 0 0
-8.0
0-7
.00
-6.0
0-5
.00
Ex
cit
ati
on
at
40
km
-4.0
0-3
.00
F o u r i e r V e l o c i t y - E Q
0 . 0 0 5 . 0 0 1 0 . 0 0F r e q ( H Z )
1 5 . 0 0 2 0 . 0 0
-8.0
0-7
.00
-6.0
0-5
.00
Ex
cit
ati
on
at
40
km
-4.0
0-3
.00
F o u r i e r V e l o c i t y - E Q
0 . 0 0 5 . 0 0 1 0 . 0 0F r e q ( H Z )
1 5 . 0 0 2 0 . 0 0
-8.0
0-7
.00
-6.0
0-5
.00
Ex
cit
ati
on
at
40
km
-4.0
0-3
.00
F o u r i e r V e l o c i t y - E Q
0 . 0 0 5 . 0 0 1 0 . 0 0F r e q ( H Z )
1 5 . 0 0 2 0 . 0 0
-8.0
0-7
.00
-6.0
0-5
.00
Ex
cit
ati
on
at
40
km
-4.0
0-3
.00
F o u r i e r V e l o c i t y - E Q
0 . 0 0 5 . 0 0 1 0 . 0 0F r e q ( H Z )
1 5 . 0 0 2 0 . 0 0
-8.0
0-7
.00
-6.0
0-5
.00
Ex
cit
ati
on
at
40
km
-4.0
0-3
.00
F o u r i e r V e l o c i t y - E Q
0 . 0 0 5 . 0 0 1 0 . 0 0F r e q ( H Z )
1 5 . 0 0 2 0 . 0 0
-8.0
0-7
.00
-6.0
0-5
.00
Ex
cit
ati
on
at
40
km
-4.0
0-3
.00
F o u r i e r V e l o c i t y - E Q
0 . 0 0 5 . 0 0 1 0 . 0 0F r e q ( H Z )
1 5 . 0 0 2 0 . 0 0
-8.0
0-7
.00
-6.0
0-5
.00
Ex
cit
ati
on
at
40
km
-4.0
0-3
.00
F o u r i e r V e l o c i t y - E Q
0 . 0 0 5 . 0 0 1 0 . 0 0F r e q ( H Z )
1 5 . 0 0 2 0 . 0 0
-8.0
0-7
.00
-6.0
0-5
.00
Ex
cit
ati
on
at
40
km
-4.0
0-3
.00
F o u r i e r V e l o c i t y - E Q
0 . 0 0 5 . 0 0 1 0 . 0 0F r e q ( H Z )
1 5 . 0 0 2 0 . 0 0
-8.0
0-7
.00
-6.0
0-5
.00
Ex
cit
ati
on
at
40
km
-4.0
0-3
.00
F o u r i e r V e l o c i t y - E Q
0 . 0 0 5 . 0 0 1 0 . 0 0F r e q ( H Z )
1 5 . 0 0 2 0 . 0 0
-8.0
0-7
.00
-6.0
0-5
.00
Ex
cit
ati
on
at
40
km
-4.0
0-3
.00
F o u r i e r V e l o c i t y - E Q
0 . 0 0 5 . 0 0 1 0 . 0 0F r e q ( H Z )
1 5 . 0 0 2 0 . 0 0
-8.0
0-7
.00
-6.0
0-5
.00
Ex
cit
ati
on
at
40
km
-4.0
0-3
.00
F o u r i e r V e l o c i t y - E Q
0 . 0 0 5 . 0 0 1 0 . 0 0F r e q ( H Z )
1 5 . 0 0 2 0 . 0 0
-8.0
0-7
.00
-6.0
0-5
.00
Ex
cit
ati
on
at
40
km
-4.0
0-3
.00
F o u r i e r V e l o c i t y - E Q
0 . 0 0 5 . 0 0 1 0 . 0 0F r e q ( H Z )
1 5 . 0 0 2 0 . 0 0
-8.0
0-7
.00
-6.0
0-5
.00
Ex
cit
ati
on
at
40
km
-4.0
0-3
.00
F o u r i e r V e l o c i t y - E Q
0 . 0 0 5 . 0 0 1 0 . 0 0F r e q ( H Z )
1 5 . 0 0 2 0 . 0 0
-8.0
0-7
.00
-6.0
0-5
.00
Ex
cit
ati
on
at
40
km
-4.0
0-3
.00
F o u r i e r V e l o c i t y - E Q
0 . 0 0 5 . 0 0 1 0 . 0 0F r e q ( H Z )
1 5 . 0 0 2 0 . 0 0
-8.0
0-7
.00
-6.0
0-5
.00
Ex
cit
ati
on
at
40
km
-4.0
0-3
.00
F o u r i e r V e l o c i t y - E Q
0 . 0 0 5 . 0 0 1 0 . 0 0F r e q ( H Z )
1 5 . 0 0 2 0 . 0 0
-8.0
0-7
.00
-6.0
0-5
.00
Ex
cit
ati
on
at
40
km
-4.0
0-3
.00
F o u r i e r V e l o c i t y - E Q
0 . 0 0 5 . 0 0 1 0 . 0 0F r e q ( H Z )
1 5 . 0 0 2 0 . 0 0
-8.0
0-7
.00
-6.0
0-5
.00
Ex
cit
ati
on
at
40
km
-4.0
0-3
.00
F o u r i e r V e l o c i t y - E Q
0 . 0 0 5 . 0 0 1 0 . 0 0F r e q ( H Z )
1 5 . 0 0 2 0 . 0 0
-8.0
0-7
.00
-6.0
0-5
.00
Ex
cit
ati
on
at
40
km
-4.0
0-3
.00
F o u r i e r V e l o c i t y - E Q
0 . 0 0 5 . 0 0 1 0 . 0 0F r e q ( H Z )
1 5 . 0 0 2 0 . 0 0
-8.0
0-7
.00
-6.0
0-5
.00
Ex
cit
ati
on
at
40
km
-4.0
0-3
.00
F o u r i e r V e l o c i t y - E Q
0 . 0 0 5 . 0 0 1 0 . 0 0F r e q ( H Z )
1 5 . 0 0 2 0 . 0 0
-8.0
0-7
.00
-6.0
0-5
.00
Ex
cit
ati
on
at
40
km
-4.0
0-3
.00
F o u r i e r V e l o c i t y - E Q
0 . 0 0 5 . 0 0 1 0 . 0 0F r e q ( H Z )
1 5 . 0 0 2 0 . 0 0
-8.0
0-7
.00
-6.0
0-5
.00
Ex
cit
ati
on
at
40
km
-4.0
0-3
.00
F o u r i e r V e l o c i t y - E Q
0 . 0 0 5 . 0 0 1 0 . 0 0F r e q ( H Z )
1 5 . 0 0 2 0 . 0 0
-8.0
0-7
.00
-6.0
0-5
.00
Ex
cit
ati
on
at
40
km
-4.0
0-3
.00
F o u r i e r V e l o c i t y - E Q
0 . 0 0 5 . 0 0 1 0 . 0 0F r e q ( H Z )
1 5 . 0 0 2 0 . 0 0
-8.0
0-7
.00
-6.0
0-5
.00
Ex
cit
ati
on
at
40
km
-4.0
0-3
.00
F o u r i e r V e l o c i t y - E Q
0 . 0 0 5 . 0 0 1 0 . 0 0F r e q ( H Z )
1 5 . 0 0 2 0 . 0 0
-8.0
0-7
.00
-6.0
0-5
.00
Ex
cit
ati
on
at
40
km
-4.0
0-3
.00
F o u r i e r V e l o c i t y - E Q
0 . 0 0 5 . 0 0 1 0 . 0 0F r e q ( H Z )
1 5 . 0 0 2 0 . 0 0
-8.0
0-7
.00
-6.0
0-5
.00
Ex
cit
ati
on
at
40
km
-4.0
0-3
.00
F o u r i e r V e l o c i t y - E Q
0 . 0 0 5 . 0 0 1 0 . 0 0F r e q ( H Z )
1 5 . 0 0 2 0 . 0 0
-8.0
0-7
.00
-6.0
0-5
.00
Ex
cit
ati
on
at
40
km
-4.0
0-3
.00
F o u r i e r V e l o c i t y - E Q
0 . 0 0 5 . 0 0 1 0 . 0 0F r e q ( H Z )
1 5 . 0 0 2 0 . 0 0
-8.0
0-7
.00
-6.0
0-5
.00
Ex
cit
ati
on
at
40
km
-4.0
0-3
.00
F o u r i e r V e l o c i t y - E Q
0 . 0 0 5 . 0 0 1 0 . 0 0F r e q ( H Z )
1 5 . 0 0 2 0 . 0 0
-8.0
0-7
.00
-6.0
0-5
.00
Ex
cit
ati
on
at
40
km
-4.0
0-3
.00
F o u r i e r V e l o c i t y - E Q
0 . 0 0 5 . 0 0 1 0 . 0 0F r e q ( H Z )
1 5 . 0 0 2 0 . 0 0
-8.0
0-7
.00
-6.0
0-5
.00
Ex
cit
ati
on
at
40
km
-4.0
0-3
.00
F o u r i e r V e l o c i t y - E Q
0 . 0 0 5 . 0 0 1 0 . 0 0F r e q ( H Z )
1 5 . 0 0 2 0 . 0 0
-8.0
0-7
.00
-6.0
0-5
.00
Ex
cit
ati
on
at
40
km
-4.0
0-3
.00
F o u r i e r V e l o c i t y - E Q
0 . 0 0 5 . 0 0 1 0 . 0 0F r e q ( H Z )
1 5 . 0 0 2 0 . 0 0
-8.0
0-7
.00
-6.0
0-5
.00
Ex
cit
ati
on
at
40
km
-4.0
0-3
.00
F o u r i e r V e l o c i t y - E Q
0 . 0 0 5 . 0 0 1 0 . 0 0F r e q ( H Z )
1 5 . 0 0 2 0 . 0 0
-8.0
0-7
.00
-6.0
0-5
.00
Ex
cit
ati
on
at
40
km
-4.0
0-3
.00
F o u r i e r V e l o c i t y - E Q
0 . 0 0 5 . 0 0 1 0 . 0 0F r e q ( H Z )
1 5 . 0 0 2 0 . 0 0
-8.0
0-7
.00
-6.0
0-5
.00
Ex
cit
ati
on
at
40
km
-4.0
0-3
.00
F o u r i e r V e l o c i t y - E Q
0 . 0 0 5 . 0 0 1 0 . 0 0F r e q ( H Z )
1 5 . 0 0 2 0 . 0 0
-8.0
0-7
.00
-6.0
0-5
.00
Ex
cit
ati
on
at
40
km
-4.0
0-3
.00
F o u r i e r V e l o c i t y - E Q
0 . 0 0 5 . 0 0 1 0 . 0 0F r e q ( H Z )
1 5 . 0 0 2 0 . 0 0
-8.0
0-7
.00
-6.0
0-5
.00
Ex
cit
ati
on
at
40
km
-4.0
0-3
.00
F o u r i e r V e l o c i t y - E Q
0 . 0 0 5 . 0 0 1 0 . 0 0F r e q ( H Z )
1 5 . 0 0 2 0 . 0 0
-8.0
0-7
.00
-6.0
0-5
.00
Ex
cit
ati
on
at
40
km
-4.0
0-3
.00
F o u r i e r V e l o c i t y - E Q
0 . 0 0 5 . 0 0 1 0 . 0 0F r e q ( H Z )
1 5 . 0 0 2 0 . 0 0
-8.0
0-7
.00
-6.0
0-5
.00
Ex
cit
ati
on
at
40
km
-4.0
0-3
.00
F o u r i e r V e l o c i t y - E Q
0 . 0 0 5 . 0 0 1 0 . 0 0F r e q ( H Z )
1 5 . 0 0 2 0 . 0 0
-8.0
0-7
.00
-6.0
0-5
.00
Ex
cit
ati
on
at
40
km
-4.0
0-3
.00
F o u r i e r V e l o c i t y - E Q
0 . 0 0 5 . 0 0 1 0 . 0 0F r e q ( H Z )
1 5 . 0 0 2 0 . 0 0
-8.0
0-7
.00
-6.0
0-5
.00
Ex
cit
ati
on
at
40
km
-4.0
0-3
.00
F o u r i e r V e l o c i t y - E Q
0 . 0 0 5 . 0 0 1 0 . 0 0F r e q ( H Z )
1 5 . 0 0 2 0 . 0 0
-8.0
0-7
.00
-6.0
0-5
.00
Ex
cit
ati
on
at
40
km
-4.0
0-3
.00
F o u r i e r V e l o c i t y - E Q
0 . 0 0 5 . 0 0 1 0 . 0 0F r e q ( H Z )
1 5 . 0 0 2 0 . 0 0
-8.0
0-7
.00
-6.0
0-5
.00
Ex
cit
ati
on
at
40
km
-4.0
0-3
.00
F o u r i e r V e l o c i t y - E Q
0 . 0 0 5 . 0 0 1 0 . 0 0F r e q ( H Z )
1 5 . 0 0 2 0 . 0 0
-8.0
0-7
.00
-6.0
0-5
.00
Ex
cit
ati
on
at
40
km
-4.0
0-3
.00
F o u r i e r V e l o c i t y - E Q
0 . 0 0 5 . 0 0 1 0 . 0 0F r e q ( H Z )
1 5 . 0 0 2 0 . 0 0
-8.0
0-7
.00
-6.0
0-5
.00
Ex
cit
ati
on
at
40
km
-4.0
0-3
.00
F o u r i e r V e l o c i t y - E Q
0 . 0 0 5 . 0 0 1 0 . 0 0F r e q ( H Z )
1 5 . 0 0 2 0 . 0 0
-8.0
0-7
.00
-6.0
0-5
.00
Ex
cit
ati
on
at
40
km
-4.0
0-3
.00
F o u r i e r V e l o c i t y - E Q
0 . 0 0 5 . 0 0 1 0 . 0 0F r e q ( H Z )
1 5 . 0 0 2 0 . 0 0
-8.0
0-7
.00
-6.0
0-5
.00
Ex
cit
ati
on
at
40
km
-4.0
0-3
.00
F o u r i e r V e l o c i t y - E Q
0 . 0 0 5 . 0 0 1 0 . 0 0F r e q ( H Z )
1 5 . 0 0 2 0 . 0 0
-8.0
0-7
.00
-6.0
0-5
.00
Ex
cit
ati
on
at
40
km
-4.0
0-3
.00
F o u r i e r V e l o c i t y - E Q
0 . 0 0 5 . 0 0 1 0 . 0 0F r e q ( H Z )
1 5 . 0 0 2 0 . 0 0
-8.0
0-7
.00
-6.0
0-5
.00
Ex
cit
ati
on
at
40
km
-4.0
0-3
.00
F o u r i e r V e l o c i t y - E Q
0 . 0 0 5 . 0 0 1 0 . 0 0F r e q ( H Z )
1 5 . 0 0 2 0 . 0 0
-8.0
0-7
.00
-6.0
0-5
.00
Ex
cit
ati
on
at
40
km
-4.0
0-3
.00
F o u r i e r V e l o c i t y - E Q
0 . 0 0 5 . 0 0 1 0 . 0 0F r e q ( H Z )
1 5 . 0 0 2 0 . 0 0
-8.0
0-7
.00
-6.0
0-5
.00
Ex
cit
ati
on
at
40
km
-4.0
0-3
.00
F o u r i e r V e l o c i t y - E Q
0 . 0 0 5 . 0 0 1 0 . 0 0F r e q ( H Z )
1 5 . 0 0 2 0 . 0 0
-8.0
0-7
.00
-6.0
0-5
.00
Ex
cit
ati
on
at
40
km
-4.0
0-3
.00
F o u r i e r V e l o c i t y - E Q
0 . 0 0 5 . 0 0 1 0 . 0 0F r e q ( H Z )
1 5 . 0 0 2 0 . 0 0
-8.0
0-7
.00
-6.0
0-5
.00
Ex
cit
ati
on
at
40
km
-4.0
0-3
.00
F o u r i e r V e l o c i t y - E Q
0 . 0 0 5 . 0 0 1 0 . 0 0F r e q ( H Z )
1 5 . 0 0 2 0 . 0 0
-8.0
0-7
.00
-6.0
0-5
.00
Ex
cit
ati
on
at
40
km
-4.0
0-3
.00
F o u r i e r V e l o c i t y - E Q
0 . 0 0 5 . 0 0 1 0 . 0 0F r e q ( H Z )
1 5 . 0 0 2 0 . 0 0
-8.0
0-7
.00
-6.0
0-5
.00
Ex
cit
ati
on
at
40
km
-4.0
0-3
.00
F o u r i e r V e l o c i t y - E Q
0 . 0 0 5 . 0 0 1 0 . 0 0F r e q ( H Z )
1 5 . 0 0 2 0 . 0 0
-8.0
0-7
.00
-6.0
0-5
.00
Ex
cit
ati
on
at
40
km
-4.0
0-3
.00
F o u r i e r V e l o c i t y - E Q
0 . 0 0 5 . 0 0 1 0 . 0 0F r e q ( H Z )
1 5 . 0 0 2 0 . 0 0
-8.0
0-7
.00
-6.0
0-5
.00
Ex
cit
ati
on
at
40
km
-4.0
0-3
.00
F o u r i e r V e l o c i t y - E Q
0 . 0 0 5 . 0 0 1 0 . 0 0F r e q ( H Z )
1 5 . 0 0 2 0 . 0 0
-8.0
0-7
.00
-6.0
0-5
.00
Ex
cit
ati
on
at
40
km
-4.0
0-3
.00
F o u r i e r V e l o c i t y - E Q
0 . 0 0 5 . 0 0 1 0 . 0 0F r e q ( H Z )
1 5 . 0 0 2 0 . 0 0
-8.0
0-7
.00
-6.0
0-5
.00
Ex
cit
ati
on
at
40
km
-4.0
0-3
.00
F o u r i e r V e l o c i t y - E Q
0 . 0 0 5 . 0 0 1 0 . 0 0F r e q ( H Z )
1 5 . 0 0 2 0 . 0 0
-8.0
0-7
.00
-6.0
0-5
.00
Ex
cit
ati
on
at
40
km
-4.0
0-3
.00
F o u r i e r V e l o c i t y - E Q
0 . 0 0 5 . 0 0 1 0 . 0 0F r e q ( H Z )
1 5 . 0 0 2 0 . 0 0
-8.0
0-7
.00
-6.0
0-5
.00
Ex
cit
ati
on
at
40
km
-4.0
0-3
.00
F o u r i e r V e l o c i t y - E Q
0 . 0 0 5 . 0 0 1 0 . 0 0F r e q ( H Z )
1 5 . 0 0 2 0 . 0 0
-8.0
0-7
.00
-6.0
0-5
.00
Ex
cit
ati
on
at
40
km
-4.0
0-3
.00
F o u r i e r V e l o c i t y - E Q
0 . 0 0 5 . 0 0 1 0 . 0 0F r e q ( H Z )
1 5 . 0 0 2 0 . 0 0
-8.0
0-7
.00
-6.0
0-5
.00
Ex
cit
ati
on
at
40
km
-4.0
0-3
.00
F o u r i e r V e l o c i t y - E Q
0 . 0 0 5 . 0 0 1 0 . 0 0F r e q ( H Z )
1 5 . 0 0 2 0 . 0 0
-8.0
0-7
.00
-6.0
0-5
.00
Ex
cit
ati
on
at
40
km
-4.0
0-3
.00
F o u r i e r V e l o c i t y - E Q
0 . 0 0 5 . 0 0 1 0 . 0 0F r e q ( H Z )
1 5 . 0 0 2 0 . 0 0
-8.0
0-7
.00
-6.0
0-5
.00
Ex
cit
ati
on
at
40
km
-4.0
0-3
.00
F o u r i e r V e l o c i t y - E Q
0 . 0 0 5 . 0 0 1 0 . 0 0F r e q ( H Z )
1 5 . 0 0 2 0 . 0 0
-8.0
0-7
.00
-6.0
0-5
.00
Ex
cit
ati
on
at
40
km
-4.0
0-3
.00
F o u r i e r V e l o c i t y - E Q
0 . 0 0 5 . 0 0 1 0 . 0 0F r e q ( H Z )
1 5 . 0 0 2 0 . 0 0
-8.0
0-7
.00
-6.0
0-5
.00
Ex
cit
ati
on
at
40
km
-4.0
0-3
.00
F o u r i e r V e l o c i t y - E Q
0 . 0 0 5 . 0 0 1 0 . 0 0F r e q ( H Z )
1 5 . 0 0 2 0 . 0 0
-8.0
0-7
.00
-6.0
0-5
.00
Ex
cit
ati
on
at
40
km
-4.0
0-3
.00
F o u r i e r V e l o c i t y - E Q
0 . 0 0 5 . 0 0 1 0 . 0 0F r e q ( H Z )
1 5 . 0 0 2 0 . 0 0
-8.0
0-7
.00
-6.0
0-5
.00
Ex
cit
ati
on
at
40
km
-4.0
0-3
.00
F o u r i e r V e l o c i t y - E Q
0 . 0 0 5 . 0 0 1 0 . 0 0F r e q ( H Z )
1 5 . 0 0 2 0 . 0 0
-8.0
0-7
.00
-6.0
0-5
.00
Ex
cit
ati
on
at
40
km
-4.0
0-3
.00
F o u r i e r V e l o c i t y - E Q
0 . 0 0 5 . 0 0 1 0 . 0 0F r e q ( H Z )
1 5 . 0 0 2 0 . 0 0
-8.0
0-7
.00
-6.0
0-5
.00
Ex
cit
ati
on
at
40
km
-4.0
0-3
.00
F o u r i e r V e l o c i t y - E Q
0 . 0 0 5 . 0 0 1 0 . 0 0F r e q ( H Z )
1 5 . 0 0 2 0 . 0 0
-8.0
0-7
.00
-6.0
0-5
.00
Ex
cit
ati
on
at
40
km
-4.0
0-3
.00
F o u r i e r V e l o c i t y - E Q
0 . 0 0 5 . 0 0 1 0 . 0 0F r e q ( H Z )
1 5 . 0 0 2 0 . 0 0
-8.0
0-7
.00
-6.0
0-5
.00
Ex
cit
ati
on
at
40
km
-4.0
0-3
.00
F o u r i e r V e l o c i t y - E Q
0 . 0 0 5 . 0 0 1 0 . 0 0F r e q ( H Z )
1 5 . 0 0 2 0 . 0 0
-8.0
0-7
.00
-6.0
0-5
.00
Ex
cit
ati
on
at
40
km
-4.0
0-3
.00
F o u r i e r V e l o c i t y - E Q
0 . 0 0 5 . 0 0 1 0 . 0 0F r e q ( H Z )
1 5 . 0 0 2 0 . 0 0
-8.0
0-7
.00
-6.0
0-5
.00
Ex
cit
ati
on
at
40
km
-4.0
0-3
.00
F o u r i e r V e l o c i t y - E Q
0 . 0 0 5 . 0 0 1 0 . 0 0F r e q ( H Z )
1 5 . 0 0 2 0 . 0 0
-8.0
0-7
.00
-6.0
0-5
.00
Ex
cit
ati
on
at
40
km
-4.0
0-3
.00
F o u r i e r V e l o c i t y - E Q
0 . 0 0 5 . 0 0 1 0 . 0 0F r e q ( H Z )
1 5 . 0 0 2 0 . 0 0
-8.0
0-7
.00
-6.0
0-5
.00
Ex
cit
ati
on
at
40
km
-4.0
0-3
.00
F o u r i e r V e l o c i t y - E Q
0 . 0 0 5 . 0 0 1 0 . 0 0F r e q ( H Z )
1 5 . 0 0 2 0 . 0 0
-8.0
0-7
.00
-6.0
0-5
.00
Ex
cit
ati
on
at
40
km
-4.0
0-3
.00
F o u r i e r V e l o c i t y - E Q
0 . 0 0 5 . 0 0 1 0 . 0 0F r e q ( H Z )
1 5 . 0 0 2 0 . 0 0
-8.0
0-7
.00
-6.0
0-5
.00
Ex
cit
ati
on
at
40
km
-4.0
0-3
.00
F o u r i e r V e l o c i t y - E Q
0 . 0 0 5 . 0 0 1 0 . 0 0F r e q ( H Z )
1 5 . 0 0 2 0 . 0 0
-8.0
0-7
.00
-6.0
0-5
.00
Ex
cit
ati
on
at
40
km
-4.0
0-3
.00
F o u r i e r V e l o c i t y - E Q
0 . 0 0 5 . 0 0 1 0 . 0 0F r e q ( H Z )
1 5 . 0 0 2 0 . 0 0
-8.0
0-7
.00
-6.0
0-5
.00
Ex
cit
ati
on
at
40
km
-4.0
0-3
.00
F o u r i e r V e l o c i t y - E Q
0 . 0 0 5 . 0 0 1 0 . 0 0F r e q ( H Z )
1 5 . 0 0 2 0 . 0 0
-8.0
0-7
.00
-6.0
0-5
.00
Ex
cit
ati
on
at
40
km
-4.0
0-3
.00
F o u r i e r V e l o c i t y - E Q
0 . 0 0 5 . 0 0 1 0 . 0 0F r e q ( H Z )
1 5 . 0 0 2 0 . 0 0
-8.0
0-7
.00
-6.0
0-5
.00
Ex
cit
ati
on
at
40
km
-4.0
0-3
.00
F o u r i e r V e l o c i t y S p e c t r a
0 . 0 0 5 . 0 0 1 0 . 0 0F r e q ( H Z )
1 5 . 0 0 2 0 . 0 0
-8.0
0-7
.00
-6.0
0-5
.00
Ex
cit
ati
on
at
40
km
-4.0
0-3
.00
F o u r i e r V e l o c i t y S p e c t r a
0 . 0 0 5 . 0 0 1 0 . 0 0F r e q ( H Z )
1 5 . 0 0 2 0 . 0 0
-8.0
0-7
.00
-6.0
0-5
.00
Ex
cit
ati
on
at
40
km
-4.0
0-3
.00
F o u r i e r V e l o c i t y S p e c t r a
0 . 0 0 5 . 0 0 1 0 . 0 0F r e q ( H Z )
1 5 . 0 0 2 0 . 0 0
-8.0
0-7
.00
-6.0
0-5
.00
Ex
cit
ati
on
at
40
km
-4.0
0-3
.00
F o u r i e r V e l o c i t y S p e c t r a
0 . 0 0 5 . 0 0 1 0 . 0 0F r e q ( H Z )
1 5 . 0 0 2 0 . 0 0
-8.0
0-7
.00
-6.0
0-5
.00
Ex
cit
ati
on
at
40
km
-4.0
0-3
.00
F o u r i e r V e l o c i t y S p e c t r a
0 . 0 0 5 . 0 0 1 0 . 0 0F r e q ( H Z )
1 5 . 0 0 2 0 . 0 0
-8.0
0-7
.00
-6.0
0-5
.00
Ex
cit
ati
on
at
40
km
-4.0
0-3
.00
F o u r i e r V e l o c i t y S p e c t r a
Mw=4.5
Mw=4.0
Mw=3.5
Mw=3.0
Mw=2.5
Mw=2.0
RED - THEO
BLACK - Data Means
Figure 4.7: Excitation of Fourier velocity spectra at 40 km (Model A) inlinear scale of frequency range. The thick dash curve is the prediction ofthe 400 bar constant stress drop source model. E is the log � � of the Fouriervelocity spectra in �
�������.

74
100 10 1 10 2
F r e q ( H Z )
-8.0
0-7
.00
-6.0
0-5
.00
Ex
cit
ati
on
at
40
km
-4.0
0-3
.00
F o u r i e r V e l o c i t y - E Q
100 10 1 10 2
F r e q ( H Z )
-8.0
0-7
.00
-6.0
0-5
.00
Ex
cit
ati
on
at
40
km
-4.0
0-3
.00
F o u r i e r V e l o c i t y - E Q
100 10 1 10 2
F r e q ( H Z )
-8.0
0-7
.00
-6.0
0-5
.00
Ex
cit
ati
on
at
40
km
-4.0
0-3
.00
F o u r i e r V e l o c i t y - E Q
100 10 1 10 2
F r e q ( H Z )
-8.0
0-7
.00
-6.0
0-5
.00
Ex
cit
ati
on
at
40
km
-4.0
0-3
.00
F o u r i e r V e l o c i t y - E Q
100 10 1 10 2
F r e q ( H Z )
-8.0
0-7
.00
-6.0
0-5
.00
Ex
cit
ati
on
at
40
km
-4.0
0-3
.00
F o u r i e r V e l o c i t y - E Q
100 10 1 10 2
F r e q ( H Z )
-8.0
0-7
.00
-6.0
0-5
.00
Ex
cit
ati
on
at
40
km
-4.0
0-3
.00
F o u r i e r V e l o c i t y - E Q
100 10 1 10 2
F r e q ( H Z )
-8.0
0-7
.00
-6.0
0-5
.00
Ex
cit
ati
on
at
40
km
-4.0
0-3
.00
F o u r i e r V e l o c i t y - E Q
100 10 1 10 2
F r e q ( H Z )
-8.0
0-7
.00
-6.0
0-5
.00
Ex
cit
ati
on
at
40
km
-4.0
0-3
.00
F o u r i e r V e l o c i t y - E Q
100 10 1 10 2
F r e q ( H Z )
-8.0
0-7
.00
-6.0
0-5
.00
Ex
cit
ati
on
at
40
km
-4.0
0-3
.00
F o u r i e r V e l o c i t y - E Q
100 10 1 10 2
F r e q ( H Z )
-8.0
0-7
.00
-6.0
0-5
.00
Ex
cit
ati
on
at
40
km
-4.0
0-3
.00
F o u r i e r V e l o c i t y - E Q
100 10 1 10 2
F r e q ( H Z )
-8.0
0-7
.00
-6.0
0-5
.00
Ex
cit
ati
on
at
40
km
-4.0
0-3
.00
F o u r i e r V e l o c i t y - E Q
100 10 1 10 2
F r e q ( H Z )
-8.0
0-7
.00
-6.0
0-5
.00
Ex
cit
ati
on
at
40
km
-4.0
0-3
.00
F o u r i e r V e l o c i t y - E Q
100 10 1 10 2
F r e q ( H Z )
-8.0
0-7
.00
-6.0
0-5
.00
Ex
cit
ati
on
at
40
km
-4.0
0-3
.00
F o u r i e r V e l o c i t y - E Q
100 10 1 10 2
F r e q ( H Z )
-8.0
0-7
.00
-6.0
0-5
.00
Ex
cit
ati
on
at
40
km
-4.0
0-3
.00
F o u r i e r V e l o c i t y - E Q
100 10 1 10 2
F r e q ( H Z )
-8.0
0-7
.00
-6.0
0-5
.00
Ex
cit
ati
on
at
40
km
-4.0
0-3
.00
F o u r i e r V e l o c i t y - E Q
100 10 1 10 2
F r e q ( H Z )
-8.0
0-7
.00
-6.0
0-5
.00
Ex
cit
ati
on
at
40
km
-4.0
0-3
.00
F o u r i e r V e l o c i t y - E Q
100 10 1 10 2
F r e q ( H Z )
-8.0
0-7
.00
-6.0
0-5
.00
Ex
cit
ati
on
at
40
km
-4.0
0-3
.00
F o u r i e r V e l o c i t y - E Q
100 10 1 10 2
F r e q ( H Z )
-8.0
0-7
.00
-6.0
0-5
.00
Ex
cit
ati
on
at
40
km
-4.0
0-3
.00
F o u r i e r V e l o c i t y - E Q
100 10 1 10 2
F r e q ( H Z )
-8.0
0-7
.00
-6.0
0-5
.00
Ex
cit
ati
on
at
40
km
-4.0
0-3
.00
F o u r i e r V e l o c i t y - E Q
100 10 1 10 2
F r e q ( H Z )
-8.0
0-7
.00
-6.0
0-5
.00
Ex
cit
ati
on
at
40
km
-4.0
0-3
.00
F o u r i e r V e l o c i t y - E Q
100 10 1 10 2
F r e q ( H Z )
-8.0
0-7
.00
-6.0
0-5
.00
Ex
cit
ati
on
at
40
km
-4.0
0-3
.00
F o u r i e r V e l o c i t y - E Q
100 10 1 10 2
F r e q ( H Z )
-8.0
0-7
.00
-6.0
0-5
.00
Ex
cit
ati
on
at
40
km
-4.0
0-3
.00
F o u r i e r V e l o c i t y - E Q
100 10 1 10 2
F r e q ( H Z )
-8.0
0-7
.00
-6.0
0-5
.00
Ex
cit
ati
on
at
40
km
-4.0
0-3
.00
F o u r i e r V e l o c i t y - E Q
100 10 1 10 2
F r e q ( H Z )
-8.0
0-7
.00
-6.0
0-5
.00
Ex
cit
ati
on
at
40
km
-4.0
0-3
.00
F o u r i e r V e l o c i t y - E Q
100 10 1 10 2
F r e q ( H Z )
-8.0
0-7
.00
-6.0
0-5
.00
Ex
cit
ati
on
at
40
km
-4.0
0-3
.00
F o u r i e r V e l o c i t y - E Q
100 10 1 10 2
F r e q ( H Z )
-8.0
0-7
.00
-6.0
0-5
.00
Ex
cit
ati
on
at
40
km
-4.0
0-3
.00
F o u r i e r V e l o c i t y - E Q
100 10 1 10 2
F r e q ( H Z )
-8.0
0-7
.00
-6.0
0-5
.00
Ex
cit
ati
on
at
40
km
-4.0
0-3
.00
F o u r i e r V e l o c i t y - E Q
100 10 1 10 2
F r e q ( H Z )
-8.0
0-7
.00
-6.0
0-5
.00
Ex
cit
ati
on
at
40
km
-4.0
0-3
.00
F o u r i e r V e l o c i t y - E Q
100 10 1 10 2
F r e q ( H Z )
-8.0
0-7
.00
-6.0
0-5
.00
Ex
cit
ati
on
at
40
km
-4.0
0-3
.00
F o u r i e r V e l o c i t y - E Q
100 10 1 10 2
F r e q ( H Z )
-8.0
0-7
.00
-6.0
0-5
.00
Ex
cit
ati
on
at
40
km
-4.0
0-3
.00
F o u r i e r V e l o c i t y - E Q
100 10 1 10 2
F r e q ( H Z )
-8.0
0-7
.00
-6.0
0-5
.00
Ex
cit
ati
on
at
40
km
-4.0
0-3
.00
F o u r i e r V e l o c i t y - E Q
100 10 1 10 2
F r e q ( H Z )
-8.0
0-7
.00
-6.0
0-5
.00
Ex
cit
ati
on
at
40
km
-4.0
0-3
.00
F o u r i e r V e l o c i t y - E Q
100 10 1 10 2
F r e q ( H Z )
-8.0
0-7
.00
-6.0
0-5
.00
Ex
cit
ati
on
at
40
km
-4.0
0-3
.00
F o u r i e r V e l o c i t y - E Q
100 10 1 10 2
F r e q ( H Z )
-8.0
0-7
.00
-6.0
0-5
.00
Ex
cit
ati
on
at
40
km
-4.0
0-3
.00
F o u r i e r V e l o c i t y - E Q
100 10 1 10 2
F r e q ( H Z )
-8.0
0-7
.00
-6.0
0-5
.00
Ex
cit
ati
on
at
40
km
-4.0
0-3
.00
F o u r i e r V e l o c i t y - E Q
100 10 1 10 2
F r e q ( H Z )
-8.0
0-7
.00
-6.0
0-5
.00
Ex
cit
ati
on
at
40
km
-4.0
0-3
.00
F o u r i e r V e l o c i t y - E Q
100 10 1 10 2
F r e q ( H Z )
-8.0
0-7
.00
-6.0
0-5
.00
Ex
cit
ati
on
at
40
km
-4.0
0-3
.00
F o u r i e r V e l o c i t y - E Q
100 10 1 10 2
F r e q ( H Z )
-8.0
0-7
.00
-6.0
0-5
.00
Ex
cit
ati
on
at
40
km
-4.0
0-3
.00
F o u r i e r V e l o c i t y - E Q
100 10 1 10 2
F r e q ( H Z )
-8.0
0-7
.00
-6.0
0-5
.00
Ex
cit
ati
on
at
40
km
-4.0
0-3
.00
F o u r i e r V e l o c i t y - E Q
100 10 1 10 2
F r e q ( H Z )
-8.0
0-7
.00
-6.0
0-5
.00
Ex
cit
ati
on
at
40
km
-4.0
0-3
.00
F o u r i e r V e l o c i t y - E Q
100 10 1 10 2
F r e q ( H Z )
-8.0
0-7
.00
-6.0
0-5
.00
Ex
cit
ati
on
at
40
km
-4.0
0-3
.00
F o u r i e r V e l o c i t y - E Q
100 10 1 10 2
F r e q ( H Z )
-8.0
0-7
.00
-6.0
0-5
.00
Ex
cit
ati
on
at
40
km
-4.0
0-3
.00
F o u r i e r V e l o c i t y - E Q
100 10 1 10 2
F r e q ( H Z )
-8.0
0-7
.00
-6.0
0-5
.00
Ex
cit
ati
on
at
40
km
-4.0
0-3
.00
F o u r i e r V e l o c i t y - E Q
100 10 1 10 2
F r e q ( H Z )
-8.0
0-7
.00
-6.0
0-5
.00
Ex
cit
ati
on
at
40
km
-4.0
0-3
.00
F o u r i e r V e l o c i t y - E Q
100 10 1 10 2
F r e q ( H Z )
-8.0
0-7
.00
-6.0
0-5
.00
Ex
cit
ati
on
at
40
km
-4.0
0-3
.00
F o u r i e r V e l o c i t y - E Q
100 10 1 10 2
F r e q ( H Z )
-8.0
0-7
.00
-6.0
0-5
.00
Ex
cit
ati
on
at
40
km
-4.0
0-3
.00
F o u r i e r V e l o c i t y - E Q
100 10 1 10 2
F r e q ( H Z )
-8.0
0-7
.00
-6.0
0-5
.00
Ex
cit
ati
on
at
40
km
-4.0
0-3
.00
F o u r i e r V e l o c i t y - E Q
100 10 1 10 2
F r e q ( H Z )
-8.0
0-7
.00
-6.0
0-5
.00
Ex
cit
ati
on
at
40
km
-4.0
0-3
.00
F o u r i e r V e l o c i t y - E Q
100 10 1 10 2
F r e q ( H Z )
-8.0
0-7
.00
-6.0
0-5
.00
Ex
cit
ati
on
at
40
km
-4.0
0-3
.00
F o u r i e r V e l o c i t y - E Q
100 10 1 10 2
F r e q ( H Z )
-8.0
0-7
.00
-6.0
0-5
.00
Ex
cit
ati
on
at
40
km
-4.0
0-3
.00
F o u r i e r V e l o c i t y - E Q
100 10 1 10 2
F r e q ( H Z )
-8.0
0-7
.00
-6.0
0-5
.00
Ex
cit
ati
on
at
40
km
-4.0
0-3
.00
F o u r i e r V e l o c i t y - E Q
100 10 1 10 2
F r e q ( H Z )
-8.0
0-7
.00
-6.0
0-5
.00
Ex
cit
ati
on
at
40
km
-4.0
0-3
.00
F o u r i e r V e l o c i t y - E Q
100 10 1 10 2
F r e q ( H Z )
-8.0
0-7
.00
-6.0
0-5
.00
Ex
cit
ati
on
at
40
km
-4.0
0-3
.00
F o u r i e r V e l o c i t y - E Q
100 10 1 10 2
F r e q ( H Z )
-8.0
0-7
.00
-6.0
0-5
.00
Ex
cit
ati
on
at
40
km
-4.0
0-3
.00
F o u r i e r V e l o c i t y - E Q
100 10 1 10 2
F r e q ( H Z )
-8.0
0-7
.00
-6.0
0-5
.00
Ex
cit
ati
on
at
40
km
-4.0
0-3
.00
F o u r i e r V e l o c i t y - E Q
100 10 1 10 2
F r e q ( H Z )
-8.0
0-7
.00
-6.0
0-5
.00
Ex
cit
ati
on
at
40
km
-4.0
0-3
.00
F o u r i e r V e l o c i t y - E Q
100 10 1 10 2
F r e q ( H Z )
-8.0
0-7
.00
-6.0
0-5
.00
Ex
cit
ati
on
at
40
km
-4.0
0-3
.00
F o u r i e r V e l o c i t y - E Q
100 10 1 10 2
F r e q ( H Z )
-8.0
0-7
.00
-6.0
0-5
.00
Ex
cit
ati
on
at
40
km
-4.0
0-3
.00
F o u r i e r V e l o c i t y - E Q
100 10 1 10 2
F r e q ( H Z )
-8.0
0-7
.00
-6.0
0-5
.00
Ex
cit
ati
on
at
40
km
-4.0
0-3
.00
F o u r i e r V e l o c i t y - E Q
100 10 1 10 2
F r e q ( H Z )
-8.0
0-7
.00
-6.0
0-5
.00
Ex
cit
ati
on
at
40
km
-4.0
0-3
.00
F o u r i e r V e l o c i t y - E Q
100 10 1 10 2
F r e q ( H Z )
-8.0
0-7
.00
-6.0
0-5
.00
Ex
cit
ati
on
at
40
km
-4.0
0-3
.00
F o u r i e r V e l o c i t y - E Q
100 10 1 10 2
F r e q ( H Z )
-8.0
0-7
.00
-6.0
0-5
.00
Ex
cit
ati
on
at
40
km
-4.0
0-3
.00
F o u r i e r V e l o c i t y - E Q
100 10 1 10 2
F r e q ( H Z )
-8.0
0-7
.00
-6.0
0-5
.00
Ex
cit
ati
on
at
40
km
-4.0
0-3
.00
F o u r i e r V e l o c i t y - E Q
100 10 1 10 2
F r e q ( H Z )
-8.0
0-7
.00
-6.0
0-5
.00
Ex
cit
ati
on
at
40
km
-4.0
0-3
.00
F o u r i e r V e l o c i t y - E Q
100 10 1 10 2
F r e q ( H Z )
-8.0
0-7
.00
-6.0
0-5
.00
Ex
cit
ati
on
at
40
km
-4.0
0-3
.00
F o u r i e r V e l o c i t y - E Q
100 10 1 10 2
F r e q ( H Z )
-8.0
0-7
.00
-6.0
0-5
.00
Ex
cit
ati
on
at
40
km
-4.0
0-3
.00
F o u r i e r V e l o c i t y - E Q
100 10 1 10 2
F r e q ( H Z )
-8.0
0-7
.00
-6.0
0-5
.00
Ex
cit
ati
on
at
40
km
-4.0
0-3
.00
F o u r i e r V e l o c i t y - E Q
100 10 1 10 2
F r e q ( H Z )
-8.0
0-7
.00
-6.0
0-5
.00
Ex
cit
ati
on
at
40
km
-4.0
0-3
.00
F o u r i e r V e l o c i t y - E Q
100 10 1 10 2
F r e q ( H Z )
-8.0
0-7
.00
-6.0
0-5
.00
Ex
cit
ati
on
at
40
km
-4.0
0-3
.00
F o u r i e r V e l o c i t y - E Q
100 10 1 10 2
F r e q ( H Z )
-8.0
0-7
.00
-6.0
0-5
.00
Ex
cit
ati
on
at
40
km
-4.0
0-3
.00
F o u r i e r V e l o c i t y - E Q
100 10 1 10 2
F r e q ( H Z )
-8.0
0-7
.00
-6.0
0-5
.00
Ex
cit
ati
on
at
40
km
-4.0
0-3
.00
F o u r i e r V e l o c i t y - E Q
100 10 1 10 2
F r e q ( H Z )
-8.0
0-7
.00
-6.0
0-5
.00
Ex
cit
ati
on
at
40
km
-4.0
0-3
.00
F o u r i e r V e l o c i t y - E Q
100 10 1 10 2
F r e q ( H Z )
-8.0
0-7
.00
-6.0
0-5
.00
Ex
cit
ati
on
at
40
km
-4.0
0-3
.00
F o u r i e r V e l o c i t y - E Q
100 10 1 10 2
F r e q ( H Z )
-8.0
0-7
.00
-6.0
0-5
.00
Ex
cit
ati
on
at
40
km
-4.0
0-3
.00
F o u r i e r V e l o c i t y - E Q
100 10 1 10 2
F r e q ( H Z )
-8.0
0-7
.00
-6.0
0-5
.00
Ex
cit
ati
on
at
40
km
-4.0
0-3
.00
F o u r i e r V e l o c i t y - E Q
100 10 1 10 2
F r e q ( H Z )
-8.0
0-7
.00
-6.0
0-5
.00
Ex
cit
ati
on
at
40
km
-4.0
0-3
.00
F o u r i e r V e l o c i t y - E Q
100 10 1 10 2
F r e q ( H Z )
-8.0
0-7
.00
-6.0
0-5
.00
Ex
cit
ati
on
at
40
km
-4.0
0-3
.00
F o u r i e r V e l o c i t y - E Q
100 10 1 10 2
F r e q ( H Z )
-8.0
0-7
.00
-6.0
0-5
.00
Ex
cit
ati
on
at
40
km
-4.0
0-3
.00
F o u r i e r V e l o c i t y - E Q
100 10 1 10 2
F r e q ( H Z )
-8.0
0-7
.00
-6.0
0-5
.00
Ex
cit
ati
on
at
40
km
-4.0
0-3
.00
F o u r i e r V e l o c i t y - E Q
100 10 1 10 2
F r e q ( H Z )
-8.0
0-7
.00
-6.0
0-5
.00
Ex
cit
ati
on
at
40
km
-4.0
0-3
.00
F o u r i e r V e l o c i t y - E Q
100 10 1 10 2
F r e q ( H Z )
-8.0
0-7
.00
-6.0
0-5
.00
Ex
cit
ati
on
at
40
km
-4.0
0-3
.00
F o u r i e r V e l o c i t y - E Q
100 10 1 10 2
F r e q ( H Z )
-8.0
0-7
.00
-6.0
0-5
.00
Ex
cit
ati
on
at
40
km
-4.0
0-3
.00
F o u r i e r V e l o c i t y - E Q
100 10 1 10 2
F r e q ( H Z )
-8.0
0-7
.00
-6.0
0-5
.00
Ex
cit
ati
on
at
40
km
-4.0
0-3
.00
F o u r i e r V e l o c i t y - E Q
100 10 1 10 2
F r e q ( H Z )
-8.0
0-7
.00
-6.0
0-5
.00
Ex
cit
ati
on
at
40
km
-4.0
0-3
.00
F o u r i e r V e l o c i t y - E Q
100 10 1 10 2
F r e q ( H Z )
-8.0
0-7
.00
-6.0
0-5
.00
Ex
cit
ati
on
at
40
km
-4.0
0-3
.00
F o u r i e r V e l o c i t y - E Q
100 10 1 10 2
F r e q ( H Z )
-8.0
0-7
.00
-6.0
0-5
.00
Ex
cit
ati
on
at
40
km
-4.0
0-3
.00
F o u r i e r V e l o c i t y - E Q
100 10 1 10 2
F r e q ( H Z )
-8.0
0-7
.00
-6.0
0-5
.00
Ex
cit
ati
on
at
40
km
-4.0
0-3
.00
F o u r i e r V e l o c i t y - E Q
100 10 1 10 2
F r e q ( H Z )
-8.0
0-7
.00
-6.0
0-5
.00
Ex
cit
ati
on
at
40
km
-4.0
0-3
.00
F o u r i e r V e l o c i t y - E Q
100 10 1 10 2
F r e q ( H Z )
-8.0
0-7
.00
-6.0
0-5
.00
Ex
cit
ati
on
at
40
km
-4.0
0-3
.00
F o u r i e r V e l o c i t y - E Q
100 10 1 10 2
F r e q ( H Z )
-8.0
0-7
.00
-6.0
0-5
.00
Ex
cit
ati
on
at
40
km
-4.0
0-3
.00
F o u r i e r V e l o c i t y - E Q
100 10 1 10 2
F r e q ( H Z )
-8.0
0-7
.00
-6.0
0-5
.00
Ex
cit
ati
on
at
40
km
-4.0
0-3
.00
F o u r i e r V e l o c i t y - E Q
100 10 1 10 2
F r e q ( H Z )
-8.0
0-7
.00
-6.0
0-5
.00
Ex
cit
ati
on
at
40
km
-4.0
0-3
.00
F o u r i e r V e l o c i t y - E Q
100 10 1 10 2
F r e q ( H Z )
-8.0
0-7
.00
-6.0
0-5
.00
Ex
cit
ati
on
at
40
km
-4.0
0-3
.00
F o u r i e r V e l o c i t y - E Q
100 10 1 10 2
F r e q ( H Z )
-8.0
0-7
.00
-6.0
0-5
.00
Ex
cit
ati
on
at
40
km
-4.0
0-3
.00
F o u r i e r V e l o c i t y - E Q
100 10 1 10 2
F r e q ( H Z )
-8.0
0-7
.00
-6.0
0-5
.00
Ex
cit
ati
on
at
40
km
-4.0
0-3
.00
F o u r i e r V e l o c i t y - E Q
100 10 1 10 2
F r e q ( H Z )
-8.0
0-7
.00
-6.0
0-5
.00
Ex
cit
ati
on
at
40
km
-4.0
0-3
.00
F o u r i e r V e l o c i t y - E Q
100 10 1 10 2
F r e q ( H Z )
-8.0
0-7
.00
-6.0
0-5
.00
Ex
cit
ati
on
at
40
km
-4.0
0-3
.00
F o u r i e r V e l o c i t y - E Q
100 10 1 10 2
F r e q ( H Z )
-8.0
0-7
.00
-6.0
0-5
.00
Ex
cit
ati
on
at
40
km
-4.0
0-3
.00
F o u r i e r V e l o c i t y - E Q
100 10 1 10 2
F r e q ( H Z )
-8.0
0-7
.00
-6.0
0-5
.00
Ex
cit
ati
on
at
40
km
-4.0
0-3
.00
F o u r i e r V e l o c i t y - E Q
100 10 1 10 2
F r e q ( H Z )
-8.0
0-7
.00
-6.0
0-5
.00
Ex
cit
ati
on
at
40
km
-4.0
0-3
.00
F o u r i e r V e l o c i t y - E Q
100 10 1 10 2
F r e q ( H Z )
-8.0
0-7
.00
-6.0
0-5
.00
Ex
cit
ati
on
at
40
km
-4.0
0-3
.00
F o u r i e r V e l o c i t y - E Q
100 10 1 10 2
F r e q ( H Z )
-8.0
0-7
.00
-6.0
0-5
.00
Ex
cit
ati
on
at
40
km
-4.0
0-3
.00
F o u r i e r V e l o c i t y - E Q
100 10 1 10 2
F r e q ( H Z )
-8.0
0-7
.00
-6.0
0-5
.00
Ex
cit
ati
on
at
40
km
-4.0
0-3
.00
F o u r i e r V e l o c i t y - E Q
100 10 1 10 2
F r e q ( H Z )
-8.0
0-7
.00
-6.0
0-5
.00
Ex
cit
ati
on
at
40
km
-4.0
0-3
.00
F o u r i e r V e l o c i t y - E Q
100 10 1 10 2
F r e q ( H Z )
-8.0
0-7
.00
-6.0
0-5
.00
Ex
cit
ati
on
at
40
km
-4.0
0-3
.00
F o u r i e r V e l o c i t y - E Q
100 10 1 10 2
F r e q ( H Z )
-8.0
0-7
.00
-6.0
0-5
.00
Ex
cit
ati
on
at
40
km
-4.0
0-3
.00
F o u r i e r V e l o c i t y - E Q
100 10 1 10 2
F r e q ( H Z )
-8.0
0-7
.00
-6.0
0-5
.00
Ex
cit
ati
on
at
40
km
-4.0
0-3
.00
F o u r i e r V e l o c i t y - E Q
100 10 1 10 2
F r e q ( H Z )
-8.0
0-7
.00
-6.0
0-5
.00
Ex
cit
ati
on
at
40
km
-4.0
0-3
.00
F o u r i e r V e l o c i t y - E Q
100 10 1 10 2
F r e q ( H Z )
-8.0
0-7
.00
-6.0
0-5
.00
Ex
cit
ati
on
at
40
km
-4.0
0-3
.00
F o u r i e r V e l o c i t y - E Q
100 10 1 10 2
F r e q ( H Z )
-8.0
0-7
.00
-6.0
0-5
.00
Ex
cit
ati
on
at
40
km
-4.0
0-3
.00
F o u r i e r V e l o c i t y - E Q
100 10 1 10 2
F r e q ( H Z )
-8.0
0-7
.00
-6.0
0-5
.00
Ex
cit
ati
on
at
40
km
-4.0
0-3
.00
F o u r i e r V e l o c i t y - E Q
100 10 1 10 2
F r e q ( H Z )
-8.0
0-7
.00
-6.0
0-5
.00
Ex
cit
ati
on
at
40
km
-4.0
0-3
.00
F o u r i e r V e l o c i t y - E Q
100 10 1 10 2
F r e q ( H Z )
-8.0
0-7
.00
-6.0
0-5
.00
Ex
cit
ati
on
at
40
km
-4.0
0-3
.00
F o u r i e r V e l o c i t y S p e c t r a
100 10 1 10 2
F r e q ( H Z )
-8.0
0-7
.00
-6.0
0-5
.00
Ex
cit
ati
on
at
40
km
-4.0
0-3
.00
F o u r i e r V e l o c i t y S p e c t r a
100 10 1 10 2
F r e q ( H Z )
-8.0
0-7
.00
-6.0
0-5
.00
Ex
cit
ati
on
at
40
km
-4.0
0-3
.00
F o u r i e r V e l o c i t y S p e c t r a
100 10 1 10 2
F r e q ( H Z )
-8.0
0-7
.00
-6.0
0-5
.00
Ex
cit
ati
on
at
40
km
-4.0
0-3
.00
F o u r i e r V e l o c i t y S p e c t r a
100 10 1 10 2
F r e q ( H Z )
-8.0
0-7
.00
-6.0
0-5
.00
Ex
cit
ati
on
at
40
km
-4.0
0-3
.00
F o u r i e r V e l o c i t y S p e c t r a
100 10 1 10 2
F r e q ( H Z )
-8.0
0-7
.00
-6.0
0-5
.00
Ex
cit
ati
on
at
40
km
-4.0
0-3
.00
F o u r i e r V e l o c i t y S p e c t r a
Mw=4.5
Mw=4.0
Mw=3.5
Mw=3.0
Mw=2.5
Mw=2.0
RED - THEO
BLACK - Data
Figure 4.8: Excitation of Fourier velocity spectra at 40 km (Model B). Thethick dash curve is the prediction of the 400 bar constant stress dropsource model. E is the log � � of the Fourier velocity spectra in �
�������.

75
0 . 0 0 5 . 0 0 1 0 . 0 0F r e q ( H Z )
1 5 . 0 0 2 0 . 0 0
-8.0
0-7
.00
-6.0
0-5
.00
Ex
cit
ati
on
at
40
km
-4.0
0-3
.00
F o u r i e r V e l o c i t y - E Q
0 . 0 0 5 . 0 0 1 0 . 0 0F r e q ( H Z )
1 5 . 0 0 2 0 . 0 0
-8.0
0-7
.00
-6.0
0-5
.00
Ex
cit
ati
on
at
40
km
-4.0
0-3
.00
F o u r i e r V e l o c i t y - E Q
0 . 0 0 5 . 0 0 1 0 . 0 0F r e q ( H Z )
1 5 . 0 0 2 0 . 0 0
-8.0
0-7
.00
-6.0
0-5
.00
Ex
cit
ati
on
at
40
km
-4.0
0-3
.00
F o u r i e r V e l o c i t y - E Q
0 . 0 0 5 . 0 0 1 0 . 0 0F r e q ( H Z )
1 5 . 0 0 2 0 . 0 0
-8.0
0-7
.00
-6.0
0-5
.00
Ex
cit
ati
on
at
40
km
-4.0
0-3
.00
F o u r i e r V e l o c i t y - E Q
0 . 0 0 5 . 0 0 1 0 . 0 0F r e q ( H Z )
1 5 . 0 0 2 0 . 0 0
-8.0
0-7
.00
-6.0
0-5
.00
Ex
cit
ati
on
at
40
km
-4.0
0-3
.00
F o u r i e r V e l o c i t y - E Q
0 . 0 0 5 . 0 0 1 0 . 0 0F r e q ( H Z )
1 5 . 0 0 2 0 . 0 0
-8.0
0-7
.00
-6.0
0-5
.00
Ex
cit
ati
on
at
40
km
-4.0
0-3
.00
F o u r i e r V e l o c i t y - E Q
0 . 0 0 5 . 0 0 1 0 . 0 0F r e q ( H Z )
1 5 . 0 0 2 0 . 0 0
-8.0
0-7
.00
-6.0
0-5
.00
Ex
cit
ati
on
at
40
km
-4.0
0-3
.00
F o u r i e r V e l o c i t y - E Q
0 . 0 0 5 . 0 0 1 0 . 0 0F r e q ( H Z )
1 5 . 0 0 2 0 . 0 0
-8.0
0-7
.00
-6.0
0-5
.00
Ex
cit
ati
on
at
40
km
-4.0
0-3
.00
F o u r i e r V e l o c i t y - E Q
0 . 0 0 5 . 0 0 1 0 . 0 0F r e q ( H Z )
1 5 . 0 0 2 0 . 0 0
-8.0
0-7
.00
-6.0
0-5
.00
Ex
cit
ati
on
at
40
km
-4.0
0-3
.00
F o u r i e r V e l o c i t y - E Q
0 . 0 0 5 . 0 0 1 0 . 0 0F r e q ( H Z )
1 5 . 0 0 2 0 . 0 0
-8.0
0-7
.00
-6.0
0-5
.00
Ex
cit
ati
on
at
40
km
-4.0
0-3
.00
F o u r i e r V e l o c i t y - E Q
0 . 0 0 5 . 0 0 1 0 . 0 0F r e q ( H Z )
1 5 . 0 0 2 0 . 0 0
-8.0
0-7
.00
-6.0
0-5
.00
Ex
cit
ati
on
at
40
km
-4.0
0-3
.00
F o u r i e r V e l o c i t y - E Q
0 . 0 0 5 . 0 0 1 0 . 0 0F r e q ( H Z )
1 5 . 0 0 2 0 . 0 0
-8.0
0-7
.00
-6.0
0-5
.00
Ex
cit
ati
on
at
40
km
-4.0
0-3
.00
F o u r i e r V e l o c i t y - E Q
0 . 0 0 5 . 0 0 1 0 . 0 0F r e q ( H Z )
1 5 . 0 0 2 0 . 0 0
-8.0
0-7
.00
-6.0
0-5
.00
Ex
cit
ati
on
at
40
km
-4.0
0-3
.00
F o u r i e r V e l o c i t y - E Q
0 . 0 0 5 . 0 0 1 0 . 0 0F r e q ( H Z )
1 5 . 0 0 2 0 . 0 0
-8.0
0-7
.00
-6.0
0-5
.00
Ex
cit
ati
on
at
40
km
-4.0
0-3
.00
F o u r i e r V e l o c i t y - E Q
0 . 0 0 5 . 0 0 1 0 . 0 0F r e q ( H Z )
1 5 . 0 0 2 0 . 0 0
-8.0
0-7
.00
-6.0
0-5
.00
Ex
cit
ati
on
at
40
km
-4.0
0-3
.00
F o u r i e r V e l o c i t y - E Q
0 . 0 0 5 . 0 0 1 0 . 0 0F r e q ( H Z )
1 5 . 0 0 2 0 . 0 0
-8.0
0-7
.00
-6.0
0-5
.00
Ex
cit
ati
on
at
40
km
-4.0
0-3
.00
F o u r i e r V e l o c i t y - E Q
0 . 0 0 5 . 0 0 1 0 . 0 0F r e q ( H Z )
1 5 . 0 0 2 0 . 0 0
-8.0
0-7
.00
-6.0
0-5
.00
Ex
cit
ati
on
at
40
km
-4.0
0-3
.00
F o u r i e r V e l o c i t y - E Q
0 . 0 0 5 . 0 0 1 0 . 0 0F r e q ( H Z )
1 5 . 0 0 2 0 . 0 0
-8.0
0-7
.00
-6.0
0-5
.00
Ex
cit
ati
on
at
40
km
-4.0
0-3
.00
F o u r i e r V e l o c i t y - E Q
0 . 0 0 5 . 0 0 1 0 . 0 0F r e q ( H Z )
1 5 . 0 0 2 0 . 0 0
-8.0
0-7
.00
-6.0
0-5
.00
Ex
cit
ati
on
at
40
km
-4.0
0-3
.00
F o u r i e r V e l o c i t y - E Q
0 . 0 0 5 . 0 0 1 0 . 0 0F r e q ( H Z )
1 5 . 0 0 2 0 . 0 0
-8.0
0-7
.00
-6.0
0-5
.00
Ex
cit
ati
on
at
40
km
-4.0
0-3
.00
F o u r i e r V e l o c i t y - E Q
0 . 0 0 5 . 0 0 1 0 . 0 0F r e q ( H Z )
1 5 . 0 0 2 0 . 0 0
-8.0
0-7
.00
-6.0
0-5
.00
Ex
cit
ati
on
at
40
km
-4.0
0-3
.00
F o u r i e r V e l o c i t y - E Q
0 . 0 0 5 . 0 0 1 0 . 0 0F r e q ( H Z )
1 5 . 0 0 2 0 . 0 0
-8.0
0-7
.00
-6.0
0-5
.00
Ex
cit
ati
on
at
40
km
-4.0
0-3
.00
F o u r i e r V e l o c i t y - E Q
0 . 0 0 5 . 0 0 1 0 . 0 0F r e q ( H Z )
1 5 . 0 0 2 0 . 0 0
-8.0
0-7
.00
-6.0
0-5
.00
Ex
cit
ati
on
at
40
km
-4.0
0-3
.00
F o u r i e r V e l o c i t y - E Q
0 . 0 0 5 . 0 0 1 0 . 0 0F r e q ( H Z )
1 5 . 0 0 2 0 . 0 0
-8.0
0-7
.00
-6.0
0-5
.00
Ex
cit
ati
on
at
40
km
-4.0
0-3
.00
F o u r i e r V e l o c i t y - E Q
0 . 0 0 5 . 0 0 1 0 . 0 0F r e q ( H Z )
1 5 . 0 0 2 0 . 0 0
-8.0
0-7
.00
-6.0
0-5
.00
Ex
cit
ati
on
at
40
km
-4.0
0-3
.00
F o u r i e r V e l o c i t y - E Q
0 . 0 0 5 . 0 0 1 0 . 0 0F r e q ( H Z )
1 5 . 0 0 2 0 . 0 0
-8.0
0-7
.00
-6.0
0-5
.00
Ex
cit
ati
on
at
40
km
-4.0
0-3
.00
F o u r i e r V e l o c i t y - E Q
0 . 0 0 5 . 0 0 1 0 . 0 0F r e q ( H Z )
1 5 . 0 0 2 0 . 0 0
-8.0
0-7
.00
-6.0
0-5
.00
Ex
cit
ati
on
at
40
km
-4.0
0-3
.00
F o u r i e r V e l o c i t y - E Q
0 . 0 0 5 . 0 0 1 0 . 0 0F r e q ( H Z )
1 5 . 0 0 2 0 . 0 0
-8.0
0-7
.00
-6.0
0-5
.00
Ex
cit
ati
on
at
40
km
-4.0
0-3
.00
F o u r i e r V e l o c i t y - E Q
0 . 0 0 5 . 0 0 1 0 . 0 0F r e q ( H Z )
1 5 . 0 0 2 0 . 0 0
-8.0
0-7
.00
-6.0
0-5
.00
Ex
cit
ati
on
at
40
km
-4.0
0-3
.00
F o u r i e r V e l o c i t y - E Q
0 . 0 0 5 . 0 0 1 0 . 0 0F r e q ( H Z )
1 5 . 0 0 2 0 . 0 0
-8.0
0-7
.00
-6.0
0-5
.00
Ex
cit
ati
on
at
40
km
-4.0
0-3
.00
F o u r i e r V e l o c i t y - E Q
0 . 0 0 5 . 0 0 1 0 . 0 0F r e q ( H Z )
1 5 . 0 0 2 0 . 0 0
-8.0
0-7
.00
-6.0
0-5
.00
Ex
cit
ati
on
at
40
km
-4.0
0-3
.00
F o u r i e r V e l o c i t y - E Q
0 . 0 0 5 . 0 0 1 0 . 0 0F r e q ( H Z )
1 5 . 0 0 2 0 . 0 0
-8.0
0-7
.00
-6.0
0-5
.00
Ex
cit
ati
on
at
40
km
-4.0
0-3
.00
F o u r i e r V e l o c i t y - E Q
0 . 0 0 5 . 0 0 1 0 . 0 0F r e q ( H Z )
1 5 . 0 0 2 0 . 0 0
-8.0
0-7
.00
-6.0
0-5
.00
Ex
cit
ati
on
at
40
km
-4.0
0-3
.00
F o u r i e r V e l o c i t y - E Q
0 . 0 0 5 . 0 0 1 0 . 0 0F r e q ( H Z )
1 5 . 0 0 2 0 . 0 0
-8.0
0-7
.00
-6.0
0-5
.00
Ex
cit
ati
on
at
40
km
-4.0
0-3
.00
F o u r i e r V e l o c i t y - E Q
0 . 0 0 5 . 0 0 1 0 . 0 0F r e q ( H Z )
1 5 . 0 0 2 0 . 0 0
-8.0
0-7
.00
-6.0
0-5
.00
Ex
cit
ati
on
at
40
km
-4.0
0-3
.00
F o u r i e r V e l o c i t y - E Q
0 . 0 0 5 . 0 0 1 0 . 0 0F r e q ( H Z )
1 5 . 0 0 2 0 . 0 0
-8.0
0-7
.00
-6.0
0-5
.00
Ex
cit
ati
on
at
40
km
-4.0
0-3
.00
F o u r i e r V e l o c i t y - E Q
0 . 0 0 5 . 0 0 1 0 . 0 0F r e q ( H Z )
1 5 . 0 0 2 0 . 0 0
-8.0
0-7
.00
-6.0
0-5
.00
Ex
cit
ati
on
at
40
km
-4.0
0-3
.00
F o u r i e r V e l o c i t y - E Q
0 . 0 0 5 . 0 0 1 0 . 0 0F r e q ( H Z )
1 5 . 0 0 2 0 . 0 0
-8.0
0-7
.00
-6.0
0-5
.00
Ex
cit
ati
on
at
40
km
-4.0
0-3
.00
F o u r i e r V e l o c i t y - E Q
0 . 0 0 5 . 0 0 1 0 . 0 0F r e q ( H Z )
1 5 . 0 0 2 0 . 0 0
-8.0
0-7
.00
-6.0
0-5
.00
Ex
cit
ati
on
at
40
km
-4.0
0-3
.00
F o u r i e r V e l o c i t y - E Q
0 . 0 0 5 . 0 0 1 0 . 0 0F r e q ( H Z )
1 5 . 0 0 2 0 . 0 0
-8.0
0-7
.00
-6.0
0-5
.00
Ex
cit
ati
on
at
40
km
-4.0
0-3
.00
F o u r i e r V e l o c i t y - E Q
0 . 0 0 5 . 0 0 1 0 . 0 0F r e q ( H Z )
1 5 . 0 0 2 0 . 0 0
-8.0
0-7
.00
-6.0
0-5
.00
Ex
cit
ati
on
at
40
km
-4.0
0-3
.00
F o u r i e r V e l o c i t y - E Q
0 . 0 0 5 . 0 0 1 0 . 0 0F r e q ( H Z )
1 5 . 0 0 2 0 . 0 0
-8.0
0-7
.00
-6.0
0-5
.00
Ex
cit
ati
on
at
40
km
-4.0
0-3
.00
F o u r i e r V e l o c i t y - E Q
0 . 0 0 5 . 0 0 1 0 . 0 0F r e q ( H Z )
1 5 . 0 0 2 0 . 0 0
-8.0
0-7
.00
-6.0
0-5
.00
Ex
cit
ati
on
at
40
km
-4.0
0-3
.00
F o u r i e r V e l o c i t y - E Q
0 . 0 0 5 . 0 0 1 0 . 0 0F r e q ( H Z )
1 5 . 0 0 2 0 . 0 0
-8.0
0-7
.00
-6.0
0-5
.00
Ex
cit
ati
on
at
40
km
-4.0
0-3
.00
F o u r i e r V e l o c i t y - E Q
0 . 0 0 5 . 0 0 1 0 . 0 0F r e q ( H Z )
1 5 . 0 0 2 0 . 0 0
-8.0
0-7
.00
-6.0
0-5
.00
Ex
cit
ati
on
at
40
km
-4.0
0-3
.00
F o u r i e r V e l o c i t y - E Q
0 . 0 0 5 . 0 0 1 0 . 0 0F r e q ( H Z )
1 5 . 0 0 2 0 . 0 0
-8.0
0-7
.00
-6.0
0-5
.00
Ex
cit
ati
on
at
40
km
-4.0
0-3
.00
F o u r i e r V e l o c i t y - E Q
0 . 0 0 5 . 0 0 1 0 . 0 0F r e q ( H Z )
1 5 . 0 0 2 0 . 0 0
-8.0
0-7
.00
-6.0
0-5
.00
Ex
cit
ati
on
at
40
km
-4.0
0-3
.00
F o u r i e r V e l o c i t y - E Q
0 . 0 0 5 . 0 0 1 0 . 0 0F r e q ( H Z )
1 5 . 0 0 2 0 . 0 0
-8.0
0-7
.00
-6.0
0-5
.00
Ex
cit
ati
on
at
40
km
-4.0
0-3
.00
F o u r i e r V e l o c i t y - E Q
0 . 0 0 5 . 0 0 1 0 . 0 0F r e q ( H Z )
1 5 . 0 0 2 0 . 0 0
-8.0
0-7
.00
-6.0
0-5
.00
Ex
cit
ati
on
at
40
km
-4.0
0-3
.00
F o u r i e r V e l o c i t y - E Q
0 . 0 0 5 . 0 0 1 0 . 0 0F r e q ( H Z )
1 5 . 0 0 2 0 . 0 0
-8.0
0-7
.00
-6.0
0-5
.00
Ex
cit
ati
on
at
40
km
-4.0
0-3
.00
F o u r i e r V e l o c i t y - E Q
0 . 0 0 5 . 0 0 1 0 . 0 0F r e q ( H Z )
1 5 . 0 0 2 0 . 0 0
-8.0
0-7
.00
-6.0
0-5
.00
Ex
cit
ati
on
at
40
km
-4.0
0-3
.00
F o u r i e r V e l o c i t y - E Q
0 . 0 0 5 . 0 0 1 0 . 0 0F r e q ( H Z )
1 5 . 0 0 2 0 . 0 0
-8.0
0-7
.00
-6.0
0-5
.00
Ex
cit
ati
on
at
40
km
-4.0
0-3
.00
F o u r i e r V e l o c i t y - E Q
0 . 0 0 5 . 0 0 1 0 . 0 0F r e q ( H Z )
1 5 . 0 0 2 0 . 0 0
-8.0
0-7
.00
-6.0
0-5
.00
Ex
cit
ati
on
at
40
km
-4.0
0-3
.00
F o u r i e r V e l o c i t y - E Q
0 . 0 0 5 . 0 0 1 0 . 0 0F r e q ( H Z )
1 5 . 0 0 2 0 . 0 0
-8.0
0-7
.00
-6.0
0-5
.00
Ex
cit
ati
on
at
40
km
-4.0
0-3
.00
F o u r i e r V e l o c i t y - E Q
0 . 0 0 5 . 0 0 1 0 . 0 0F r e q ( H Z )
1 5 . 0 0 2 0 . 0 0
-8.0
0-7
.00
-6.0
0-5
.00
Ex
cit
ati
on
at
40
km
-4.0
0-3
.00
F o u r i e r V e l o c i t y - E Q
0 . 0 0 5 . 0 0 1 0 . 0 0F r e q ( H Z )
1 5 . 0 0 2 0 . 0 0
-8.0
0-7
.00
-6.0
0-5
.00
Ex
cit
ati
on
at
40
km
-4.0
0-3
.00
F o u r i e r V e l o c i t y - E Q
0 . 0 0 5 . 0 0 1 0 . 0 0F r e q ( H Z )
1 5 . 0 0 2 0 . 0 0
-8.0
0-7
.00
-6.0
0-5
.00
Ex
cit
ati
on
at
40
km
-4.0
0-3
.00
F o u r i e r V e l o c i t y - E Q
0 . 0 0 5 . 0 0 1 0 . 0 0F r e q ( H Z )
1 5 . 0 0 2 0 . 0 0
-8.0
0-7
.00
-6.0
0-5
.00
Ex
cit
ati
on
at
40
km
-4.0
0-3
.00
F o u r i e r V e l o c i t y - E Q
0 . 0 0 5 . 0 0 1 0 . 0 0F r e q ( H Z )
1 5 . 0 0 2 0 . 0 0
-8.0
0-7
.00
-6.0
0-5
.00
Ex
cit
ati
on
at
40
km
-4.0
0-3
.00
F o u r i e r V e l o c i t y - E Q
0 . 0 0 5 . 0 0 1 0 . 0 0F r e q ( H Z )
1 5 . 0 0 2 0 . 0 0
-8.0
0-7
.00
-6.0
0-5
.00
Ex
cit
ati
on
at
40
km
-4.0
0-3
.00
F o u r i e r V e l o c i t y - E Q
0 . 0 0 5 . 0 0 1 0 . 0 0F r e q ( H Z )
1 5 . 0 0 2 0 . 0 0
-8.0
0-7
.00
-6.0
0-5
.00
Ex
cit
ati
on
at
40
km
-4.0
0-3
.00
F o u r i e r V e l o c i t y - E Q
0 . 0 0 5 . 0 0 1 0 . 0 0F r e q ( H Z )
1 5 . 0 0 2 0 . 0 0
-8.0
0-7
.00
-6.0
0-5
.00
Ex
cit
ati
on
at
40
km
-4.0
0-3
.00
F o u r i e r V e l o c i t y - E Q
0 . 0 0 5 . 0 0 1 0 . 0 0F r e q ( H Z )
1 5 . 0 0 2 0 . 0 0
-8.0
0-7
.00
-6.0
0-5
.00
Ex
cit
ati
on
at
40
km
-4.0
0-3
.00
F o u r i e r V e l o c i t y - E Q
0 . 0 0 5 . 0 0 1 0 . 0 0F r e q ( H Z )
1 5 . 0 0 2 0 . 0 0
-8.0
0-7
.00
-6.0
0-5
.00
Ex
cit
ati
on
at
40
km
-4.0
0-3
.00
F o u r i e r V e l o c i t y - E Q
0 . 0 0 5 . 0 0 1 0 . 0 0F r e q ( H Z )
1 5 . 0 0 2 0 . 0 0
-8.0
0-7
.00
-6.0
0-5
.00
Ex
cit
ati
on
at
40
km
-4.0
0-3
.00
F o u r i e r V e l o c i t y - E Q
0 . 0 0 5 . 0 0 1 0 . 0 0F r e q ( H Z )
1 5 . 0 0 2 0 . 0 0
-8.0
0-7
.00
-6.0
0-5
.00
Ex
cit
ati
on
at
40
km
-4.0
0-3
.00
F o u r i e r V e l o c i t y - E Q
0 . 0 0 5 . 0 0 1 0 . 0 0F r e q ( H Z )
1 5 . 0 0 2 0 . 0 0
-8.0
0-7
.00
-6.0
0-5
.00
Ex
cit
ati
on
at
40
km
-4.0
0-3
.00
F o u r i e r V e l o c i t y - E Q
0 . 0 0 5 . 0 0 1 0 . 0 0F r e q ( H Z )
1 5 . 0 0 2 0 . 0 0
-8.0
0-7
.00
-6.0
0-5
.00
Ex
cit
ati
on
at
40
km
-4.0
0-3
.00
F o u r i e r V e l o c i t y - E Q
0 . 0 0 5 . 0 0 1 0 . 0 0F r e q ( H Z )
1 5 . 0 0 2 0 . 0 0
-8.0
0-7
.00
-6.0
0-5
.00
Ex
cit
ati
on
at
40
km
-4.0
0-3
.00
F o u r i e r V e l o c i t y - E Q
0 . 0 0 5 . 0 0 1 0 . 0 0F r e q ( H Z )
1 5 . 0 0 2 0 . 0 0
-8.0
0-7
.00
-6.0
0-5
.00
Ex
cit
ati
on
at
40
km
-4.0
0-3
.00
F o u r i e r V e l o c i t y - E Q
0 . 0 0 5 . 0 0 1 0 . 0 0F r e q ( H Z )
1 5 . 0 0 2 0 . 0 0
-8.0
0-7
.00
-6.0
0-5
.00
Ex
cit
ati
on
at
40
km
-4.0
0-3
.00
F o u r i e r V e l o c i t y - E Q
0 . 0 0 5 . 0 0 1 0 . 0 0F r e q ( H Z )
1 5 . 0 0 2 0 . 0 0
-8.0
0-7
.00
-6.0
0-5
.00
Ex
cit
ati
on
at
40
km
-4.0
0-3
.00
F o u r i e r V e l o c i t y - E Q
0 . 0 0 5 . 0 0 1 0 . 0 0F r e q ( H Z )
1 5 . 0 0 2 0 . 0 0
-8.0
0-7
.00
-6.0
0-5
.00
Ex
cit
ati
on
at
40
km
-4.0
0-3
.00
F o u r i e r V e l o c i t y - E Q
0 . 0 0 5 . 0 0 1 0 . 0 0F r e q ( H Z )
1 5 . 0 0 2 0 . 0 0
-8.0
0-7
.00
-6.0
0-5
.00
Ex
cit
ati
on
at
40
km
-4.0
0-3
.00
F o u r i e r V e l o c i t y - E Q
0 . 0 0 5 . 0 0 1 0 . 0 0F r e q ( H Z )
1 5 . 0 0 2 0 . 0 0
-8.0
0-7
.00
-6.0
0-5
.00
Ex
cit
ati
on
at
40
km
-4.0
0-3
.00
F o u r i e r V e l o c i t y - E Q
0 . 0 0 5 . 0 0 1 0 . 0 0F r e q ( H Z )
1 5 . 0 0 2 0 . 0 0
-8.0
0-7
.00
-6.0
0-5
.00
Ex
cit
ati
on
at
40
km
-4.0
0-3
.00
F o u r i e r V e l o c i t y - E Q
0 . 0 0 5 . 0 0 1 0 . 0 0F r e q ( H Z )
1 5 . 0 0 2 0 . 0 0
-8.0
0-7
.00
-6.0
0-5
.00
Ex
cit
ati
on
at
40
km
-4.0
0-3
.00
F o u r i e r V e l o c i t y - E Q
0 . 0 0 5 . 0 0 1 0 . 0 0F r e q ( H Z )
1 5 . 0 0 2 0 . 0 0
-8.0
0-7
.00
-6.0
0-5
.00
Ex
cit
ati
on
at
40
km
-4.0
0-3
.00
F o u r i e r V e l o c i t y - E Q
0 . 0 0 5 . 0 0 1 0 . 0 0F r e q ( H Z )
1 5 . 0 0 2 0 . 0 0
-8.0
0-7
.00
-6.0
0-5
.00
Ex
cit
ati
on
at
40
km
-4.0
0-3
.00
F o u r i e r V e l o c i t y - E Q
0 . 0 0 5 . 0 0 1 0 . 0 0F r e q ( H Z )
1 5 . 0 0 2 0 . 0 0
-8.0
0-7
.00
-6.0
0-5
.00
Ex
cit
ati
on
at
40
km
-4.0
0-3
.00
F o u r i e r V e l o c i t y - E Q
0 . 0 0 5 . 0 0 1 0 . 0 0F r e q ( H Z )
1 5 . 0 0 2 0 . 0 0
-8.0
0-7
.00
-6.0
0-5
.00
Ex
cit
ati
on
at
40
km
-4.0
0-3
.00
F o u r i e r V e l o c i t y - E Q
0 . 0 0 5 . 0 0 1 0 . 0 0F r e q ( H Z )
1 5 . 0 0 2 0 . 0 0
-8.0
0-7
.00
-6.0
0-5
.00
Ex
cit
ati
on
at
40
km
-4.0
0-3
.00
F o u r i e r V e l o c i t y - E Q
0 . 0 0 5 . 0 0 1 0 . 0 0F r e q ( H Z )
1 5 . 0 0 2 0 . 0 0
-8.0
0-7
.00
-6.0
0-5
.00
Ex
cit
ati
on
at
40
km
-4.0
0-3
.00
F o u r i e r V e l o c i t y - E Q
0 . 0 0 5 . 0 0 1 0 . 0 0F r e q ( H Z )
1 5 . 0 0 2 0 . 0 0
-8.0
0-7
.00
-6.0
0-5
.00
Ex
cit
ati
on
at
40
km
-4.0
0-3
.00
F o u r i e r V e l o c i t y - E Q
0 . 0 0 5 . 0 0 1 0 . 0 0F r e q ( H Z )
1 5 . 0 0 2 0 . 0 0
-8.0
0-7
.00
-6.0
0-5
.00
Ex
cit
ati
on
at
40
km
-4.0
0-3
.00
F o u r i e r V e l o c i t y - E Q
0 . 0 0 5 . 0 0 1 0 . 0 0F r e q ( H Z )
1 5 . 0 0 2 0 . 0 0
-8.0
0-7
.00
-6.0
0-5
.00
Ex
cit
ati
on
at
40
km
-4.0
0-3
.00
F o u r i e r V e l o c i t y - E Q
0 . 0 0 5 . 0 0 1 0 . 0 0F r e q ( H Z )
1 5 . 0 0 2 0 . 0 0
-8.0
0-7
.00
-6.0
0-5
.00
Ex
cit
ati
on
at
40
km
-4.0
0-3
.00
F o u r i e r V e l o c i t y - E Q
0 . 0 0 5 . 0 0 1 0 . 0 0F r e q ( H Z )
1 5 . 0 0 2 0 . 0 0
-8.0
0-7
.00
-6.0
0-5
.00
Ex
cit
ati
on
at
40
km
-4.0
0-3
.00
F o u r i e r V e l o c i t y - E Q
0 . 0 0 5 . 0 0 1 0 . 0 0F r e q ( H Z )
1 5 . 0 0 2 0 . 0 0
-8.0
0-7
.00
-6.0
0-5
.00
Ex
cit
ati
on
at
40
km
-4.0
0-3
.00
F o u r i e r V e l o c i t y - E Q
0 . 0 0 5 . 0 0 1 0 . 0 0F r e q ( H Z )
1 5 . 0 0 2 0 . 0 0
-8.0
0-7
.00
-6.0
0-5
.00
Ex
cit
ati
on
at
40
km
-4.0
0-3
.00
F o u r i e r V e l o c i t y - E Q
0 . 0 0 5 . 0 0 1 0 . 0 0F r e q ( H Z )
1 5 . 0 0 2 0 . 0 0
-8.0
0-7
.00
-6.0
0-5
.00
Ex
cit
ati
on
at
40
km
-4.0
0-3
.00
F o u r i e r V e l o c i t y - E Q
0 . 0 0 5 . 0 0 1 0 . 0 0F r e q ( H Z )
1 5 . 0 0 2 0 . 0 0
-8.0
0-7
.00
-6.0
0-5
.00
Ex
cit
ati
on
at
40
km
-4.0
0-3
.00
F o u r i e r V e l o c i t y - E Q
0 . 0 0 5 . 0 0 1 0 . 0 0F r e q ( H Z )
1 5 . 0 0 2 0 . 0 0
-8.0
0-7
.00
-6.0
0-5
.00
Ex
cit
ati
on
at
40
km
-4.0
0-3
.00
F o u r i e r V e l o c i t y - E Q
0 . 0 0 5 . 0 0 1 0 . 0 0F r e q ( H Z )
1 5 . 0 0 2 0 . 0 0
-8.0
0-7
.00
-6.0
0-5
.00
Ex
cit
ati
on
at
40
km
-4.0
0-3
.00
F o u r i e r V e l o c i t y - E Q
0 . 0 0 5 . 0 0 1 0 . 0 0F r e q ( H Z )
1 5 . 0 0 2 0 . 0 0
-8.0
0-7
.00
-6.0
0-5
.00
Ex
cit
ati
on
at
40
km
-4.0
0-3
.00
F o u r i e r V e l o c i t y - E Q
0 . 0 0 5 . 0 0 1 0 . 0 0F r e q ( H Z )
1 5 . 0 0 2 0 . 0 0
-8.0
0-7
.00
-6.0
0-5
.00
Ex
cit
ati
on
at
40
km
-4.0
0-3
.00
F o u r i e r V e l o c i t y - E Q
0 . 0 0 5 . 0 0 1 0 . 0 0F r e q ( H Z )
1 5 . 0 0 2 0 . 0 0
-8.0
0-7
.00
-6.0
0-5
.00
Ex
cit
ati
on
at
40
km
-4.0
0-3
.00
F o u r i e r V e l o c i t y - E Q
0 . 0 0 5 . 0 0 1 0 . 0 0F r e q ( H Z )
1 5 . 0 0 2 0 . 0 0
-8.0
0-7
.00
-6.0
0-5
.00
Ex
cit
ati
on
at
40
km
-4.0
0-3
.00
F o u r i e r V e l o c i t y - E Q
0 . 0 0 5 . 0 0 1 0 . 0 0F r e q ( H Z )
1 5 . 0 0 2 0 . 0 0
-8.0
0-7
.00
-6.0
0-5
.00
Ex
cit
ati
on
at
40
km
-4.0
0-3
.00
F o u r i e r V e l o c i t y - E Q
0 . 0 0 5 . 0 0 1 0 . 0 0F r e q ( H Z )
1 5 . 0 0 2 0 . 0 0
-8.0
0-7
.00
-6.0
0-5
.00
Ex
cit
ati
on
at
40
km
-4.0
0-3
.00
F o u r i e r V e l o c i t y - E Q
0 . 0 0 5 . 0 0 1 0 . 0 0F r e q ( H Z )
1 5 . 0 0 2 0 . 0 0
-8.0
0-7
.00
-6.0
0-5
.00
Ex
cit
ati
on
at
40
km
-4.0
0-3
.00
F o u r i e r V e l o c i t y - E Q
0 . 0 0 5 . 0 0 1 0 . 0 0F r e q ( H Z )
1 5 . 0 0 2 0 . 0 0
-8.0
0-7
.00
-6.0
0-5
.00
Ex
cit
ati
on
at
40
km
-4.0
0-3
.00
F o u r i e r V e l o c i t y - E Q
0 . 0 0 5 . 0 0 1 0 . 0 0F r e q ( H Z )
1 5 . 0 0 2 0 . 0 0
-8.0
0-7
.00
-6.0
0-5
.00
Ex
cit
ati
on
at
40
km
-4.0
0-3
.00
F o u r i e r V e l o c i t y - E Q
0 . 0 0 5 . 0 0 1 0 . 0 0F r e q ( H Z )
1 5 . 0 0 2 0 . 0 0
-8.0
0-7
.00
-6.0
0-5
.00
Ex
cit
ati
on
at
40
km
-4.0
0-3
.00
F o u r i e r V e l o c i t y - E Q
0 . 0 0 5 . 0 0 1 0 . 0 0F r e q ( H Z )
1 5 . 0 0 2 0 . 0 0
-8.0
0-7
.00
-6.0
0-5
.00
Ex
cit
ati
on
at
40
km
-4.0
0-3
.00
F o u r i e r V e l o c i t y - E Q
0 . 0 0 5 . 0 0 1 0 . 0 0F r e q ( H Z )
1 5 . 0 0 2 0 . 0 0
-8.0
0-7
.00
-6.0
0-5
.00
Ex
cit
ati
on
at
40
km
-4.0
0-3
.00
F o u r i e r V e l o c i t y - E Q
0 . 0 0 5 . 0 0 1 0 . 0 0F r e q ( H Z )
1 5 . 0 0 2 0 . 0 0
-8.0
0-7
.00
-6.0
0-5
.00
Ex
cit
ati
on
at
40
km
-4.0
0-3
.00
F o u r i e r V e l o c i t y - E Q
0 . 0 0 5 . 0 0 1 0 . 0 0F r e q ( H Z )
1 5 . 0 0 2 0 . 0 0
-8.0
0-7
.00
-6.0
0-5
.00
Ex
cit
ati
on
at
40
km
-4.0
0-3
.00
F o u r i e r V e l o c i t y - E Q
0 . 0 0 5 . 0 0 1 0 . 0 0F r e q ( H Z )
1 5 . 0 0 2 0 . 0 0
-8.0
0-7
.00
-6.0
0-5
.00
Ex
cit
ati
on
at
40
km
-4.0
0-3
.00
F o u r i e r V e l o c i t y - E Q
0 . 0 0 5 . 0 0 1 0 . 0 0F r e q ( H Z )
1 5 . 0 0 2 0 . 0 0
-8.0
0-7
.00
-6.0
0-5
.00
Ex
cit
ati
on
at
40
km
-4.0
0-3
.00
F o u r i e r V e l o c i t y - E Q
0 . 0 0 5 . 0 0 1 0 . 0 0F r e q ( H Z )
1 5 . 0 0 2 0 . 0 0
-8.0
0-7
.00
-6.0
0-5
.00
Ex
cit
ati
on
at
40
km
-4.0
0-3
.00
F o u r i e r V e l o c i t y - E Q
0 . 0 0 5 . 0 0 1 0 . 0 0F r e q ( H Z )
1 5 . 0 0 2 0 . 0 0
-8.0
0-7
.00
-6.0
0-5
.00
Ex
cit
ati
on
at
40
km
-4.0
0-3
.00
F o u r i e r V e l o c i t y - E Q
0 . 0 0 5 . 0 0 1 0 . 0 0F r e q ( H Z )
1 5 . 0 0 2 0 . 0 0
-8.0
0-7
.00
-6.0
0-5
.00
Ex
cit
ati
on
at
40
km
-4.0
0-3
.00
F o u r i e r V e l o c i t y S p e c t r a
0 . 0 0 5 . 0 0 1 0 . 0 0F r e q ( H Z )
1 5 . 0 0 2 0 . 0 0
-8.0
0-7
.00
-6.0
0-5
.00
Ex
cit
ati
on
at
40
km
-4.0
0-3
.00
F o u r i e r V e l o c i t y S p e c t r a
0 . 0 0 5 . 0 0 1 0 . 0 0F r e q ( H Z )
1 5 . 0 0 2 0 . 0 0
-8.0
0-7
.00
-6.0
0-5
.00
Ex
cit
ati
on
at
40
km
-4.0
0-3
.00
F o u r i e r V e l o c i t y S p e c t r a
0 . 0 0 5 . 0 0 1 0 . 0 0F r e q ( H Z )
1 5 . 0 0 2 0 . 0 0
-8.0
0-7
.00
-6.0
0-5
.00
Ex
cit
ati
on
at
40
km
-4.0
0-3
.00
F o u r i e r V e l o c i t y S p e c t r a
0 . 0 0 5 . 0 0 1 0 . 0 0F r e q ( H Z )
1 5 . 0 0 2 0 . 0 0
-8.0
0-7
.00
-6.0
0-5
.00
Ex
cit
ati
on
at
40
km
-4.0
0-3
.00
F o u r i e r V e l o c i t y S p e c t r a
0 . 0 0 5 . 0 0 1 0 . 0 0F r e q ( H Z )
1 5 . 0 0 2 0 . 0 0
-8.0
0-7
.00
-6.0
0-5
.00
Ex
cit
ati
on
at
40
km
-4.0
0-3
.00
F o u r i e r V e l o c i t y S p e c t r a
Mw=4.5
Mw=4.0
Mw=3.5
Mw=3.0
Mw=2.5
Mw=2.0
RED - THEO
BLACK - Data Mean
Figure 4.9: Excitation of Fourier velocity spectra at 40 km (Model B) inlinear scale of frequency range. The thick dash curve is the prediction ofthe 400 bar constant stress drop source model. E is the log � � of the Fouriervelocity spectra in �
�������.

76
100 10 1 10 2
F r e q ( H Z )
-8.0
0-7
.00
-6.0
0-5
.00
Ex
cit
ati
on
at
40
km
-4.0
0-3
.00
F i l t e r e d G r o u n d V e l o c i t y - E Q
100 10 1 10 2
F r e q ( H Z )
-8.0
0-7
.00
-6.0
0-5
.00
Ex
cit
ati
on
at
40
km
-4.0
0-3
.00
F i l t e r e d G r o u n d V e l o c i t y - E Q
100 10 1 10 2
F r e q ( H Z )
-8.0
0-7
.00
-6.0
0-5
.00
Ex
cit
ati
on
at
40
km
-4.0
0-3
.00
F i l t e r e d G r o u n d V e l o c i t y - E Q
100 10 1 10 2
F r e q ( H Z )
-8.0
0-7
.00
-6.0
0-5
.00
Ex
cit
ati
on
at
40
km
-4.0
0-3
.00
F i l t e r e d G r o u n d V e l o c i t y - E Q
100 10 1 10 2
F r e q ( H Z )
-8.0
0-7
.00
-6.0
0-5
.00
Ex
cit
ati
on
at
40
km
-4.0
0-3
.00
F i l t e r e d G r o u n d V e l o c i t y - E Q
100 10 1 10 2
F r e q ( H Z )
-8.0
0-7
.00
-6.0
0-5
.00
Ex
cit
ati
on
at
40
km
-4.0
0-3
.00
F i l t e r e d G r o u n d V e l o c i t y - E Q
100 10 1 10 2
F r e q ( H Z )
-8.0
0-7
.00
-6.0
0-5
.00
Ex
cit
ati
on
at
40
km
-4.0
0-3
.00
F i l t e r e d G r o u n d V e l o c i t y - E Q
100 10 1 10 2
F r e q ( H Z )
-8.0
0-7
.00
-6.0
0-5
.00
Ex
cit
ati
on
at
40
km
-4.0
0-3
.00
F i l t e r e d G r o u n d V e l o c i t y - E Q
100 10 1 10 2
F r e q ( H Z )
-8.0
0-7
.00
-6.0
0-5
.00
Ex
cit
ati
on
at
40
km
-4.0
0-3
.00
F i l t e r e d G r o u n d V e l o c i t y - E Q
100 10 1 10 2
F r e q ( H Z )
-8.0
0-7
.00
-6.0
0-5
.00
Ex
cit
ati
on
at
40
km
-4.0
0-3
.00
F i l t e r e d G r o u n d V e l o c i t y - E Q
100 10 1 10 2
F r e q ( H Z )
-8.0
0-7
.00
-6.0
0-5
.00
Ex
cit
ati
on
at
40
km
-4.0
0-3
.00
F i l t e r e d G r o u n d V e l o c i t y - E Q
100 10 1 10 2
F r e q ( H Z )
-8.0
0-7
.00
-6.0
0-5
.00
Ex
cit
ati
on
at
40
km
-4.0
0-3
.00
F i l t e r e d G r o u n d V e l o c i t y - E Q
100 10 1 10 2
F r e q ( H Z )
-8.0
0-7
.00
-6.0
0-5
.00
Ex
cit
ati
on
at
40
km
-4.0
0-3
.00
F i l t e r e d G r o u n d V e l o c i t y - E Q
100 10 1 10 2
F r e q ( H Z )
-8.0
0-7
.00
-6.0
0-5
.00
Ex
cit
ati
on
at
40
km
-4.0
0-3
.00
F i l t e r e d G r o u n d V e l o c i t y - E Q
100 10 1 10 2
F r e q ( H Z )
-8.0
0-7
.00
-6.0
0-5
.00
Ex
cit
ati
on
at
40
km
-4.0
0-3
.00
F i l t e r e d G r o u n d V e l o c i t y - E Q
100 10 1 10 2
F r e q ( H Z )
-8.0
0-7
.00
-6.0
0-5
.00
Ex
cit
ati
on
at
40
km
-4.0
0-3
.00
F i l t e r e d G r o u n d V e l o c i t y - E Q
100 10 1 10 2
F r e q ( H Z )
-8.0
0-7
.00
-6.0
0-5
.00
Ex
cit
ati
on
at
40
km
-4.0
0-3
.00
F i l t e r e d G r o u n d V e l o c i t y - E Q
100 10 1 10 2
F r e q ( H Z )
-8.0
0-7
.00
-6.0
0-5
.00
Ex
cit
ati
on
at
40
km
-4.0
0-3
.00
F i l t e r e d G r o u n d V e l o c i t y - E Q
100 10 1 10 2
F r e q ( H Z )
-8.0
0-7
.00
-6.0
0-5
.00
Ex
cit
ati
on
at
40
km
-4.0
0-3
.00
F i l t e r e d G r o u n d V e l o c i t y - E Q
100 10 1 10 2
F r e q ( H Z )
-8.0
0-7
.00
-6.0
0-5
.00
Ex
cit
ati
on
at
40
km
-4.0
0-3
.00
F i l t e r e d G r o u n d V e l o c i t y - E Q
100 10 1 10 2
F r e q ( H Z )
-8.0
0-7
.00
-6.0
0-5
.00
Ex
cit
ati
on
at
40
km
-4.0
0-3
.00
F i l t e r e d G r o u n d V e l o c i t y - E Q
100 10 1 10 2
F r e q ( H Z )
-8.0
0-7
.00
-6.0
0-5
.00
Ex
cit
ati
on
at
40
km
-4.0
0-3
.00
F i l t e r e d G r o u n d V e l o c i t y - E Q
100 10 1 10 2
F r e q ( H Z )
-8.0
0-7
.00
-6.0
0-5
.00
Ex
cit
ati
on
at
40
km
-4.0
0-3
.00
F i l t e r e d G r o u n d V e l o c i t y - E Q
100 10 1 10 2
F r e q ( H Z )
-8.0
0-7
.00
-6.0
0-5
.00
Ex
cit
ati
on
at
40
km
-4.0
0-3
.00
F i l t e r e d G r o u n d V e l o c i t y - E Q
100 10 1 10 2
F r e q ( H Z )
-8.0
0-7
.00
-6.0
0-5
.00
Ex
cit
ati
on
at
40
km
-4.0
0-3
.00
F i l t e r e d G r o u n d V e l o c i t y - E Q
100 10 1 10 2
F r e q ( H Z )
-8.0
0-7
.00
-6.0
0-5
.00
Ex
cit
ati
on
at
40
km
-4.0
0-3
.00
F i l t e r e d G r o u n d V e l o c i t y - E Q
100 10 1 10 2
F r e q ( H Z )
-8.0
0-7
.00
-6.0
0-5
.00
Ex
cit
ati
on
at
40
km
-4.0
0-3
.00
F i l t e r e d G r o u n d V e l o c i t y - E Q
100 10 1 10 2
F r e q ( H Z )
-8.0
0-7
.00
-6.0
0-5
.00
Ex
cit
ati
on
at
40
km
-4.0
0-3
.00
F i l t e r e d G r o u n d V e l o c i t y - E Q
100 10 1 10 2
F r e q ( H Z )
-8.0
0-7
.00
-6.0
0-5
.00
Ex
cit
ati
on
at
40
km
-4.0
0-3
.00
F i l t e r e d G r o u n d V e l o c i t y - E Q
100 10 1 10 2
F r e q ( H Z )
-8.0
0-7
.00
-6.0
0-5
.00
Ex
cit
ati
on
at
40
km
-4.0
0-3
.00
F i l t e r e d G r o u n d V e l o c i t y - E Q
100 10 1 10 2
F r e q ( H Z )
-8.0
0-7
.00
-6.0
0-5
.00
Ex
cit
ati
on
at
40
km
-4.0
0-3
.00
F i l t e r e d G r o u n d V e l o c i t y - E Q
100 10 1 10 2
F r e q ( H Z )
-8.0
0-7
.00
-6.0
0-5
.00
Ex
cit
ati
on
at
40
km
-4.0
0-3
.00
F i l t e r e d G r o u n d V e l o c i t y - E Q
100 10 1 10 2
F r e q ( H Z )
-8.0
0-7
.00
-6.0
0-5
.00
Ex
cit
ati
on
at
40
km
-4.0
0-3
.00
F i l t e r e d G r o u n d V e l o c i t y - E Q
100 10 1 10 2
F r e q ( H Z )
-8.0
0-7
.00
-6.0
0-5
.00
Ex
cit
ati
on
at
40
km
-4.0
0-3
.00
F i l t e r e d G r o u n d V e l o c i t y - E Q
100 10 1 10 2
F r e q ( H Z )
-8.0
0-7
.00
-6.0
0-5
.00
Ex
cit
ati
on
at
40
km
-4.0
0-3
.00
F i l t e r e d G r o u n d V e l o c i t y - E Q
100 10 1 10 2
F r e q ( H Z )
-8.0
0-7
.00
-6.0
0-5
.00
Ex
cit
ati
on
at
40
km
-4.0
0-3
.00
F i l t e r e d G r o u n d V e l o c i t y - E Q
100 10 1 10 2
F r e q ( H Z )
-8.0
0-7
.00
-6.0
0-5
.00
Ex
cit
ati
on
at
40
km
-4.0
0-3
.00
F i l t e r e d G r o u n d V e l o c i t y - E Q
100 10 1 10 2
F r e q ( H Z )
-8.0
0-7
.00
-6.0
0-5
.00
Ex
cit
ati
on
at
40
km
-4.0
0-3
.00
F i l t e r e d G r o u n d V e l o c i t y - E Q
100 10 1 10 2
F r e q ( H Z )
-8.0
0-7
.00
-6.0
0-5
.00
Ex
cit
ati
on
at
40
km
-4.0
0-3
.00
F i l t e r e d G r o u n d V e l o c i t y - E Q
100 10 1 10 2
F r e q ( H Z )
-8.0
0-7
.00
-6.0
0-5
.00
Ex
cit
ati
on
at
40
km
-4.0
0-3
.00
F i l t e r e d G r o u n d V e l o c i t y - E Q
100 10 1 10 2
F r e q ( H Z )
-8.0
0-7
.00
-6.0
0-5
.00
Ex
cit
ati
on
at
40
km
-4.0
0-3
.00
F i l t e r e d G r o u n d V e l o c i t y - E Q
100 10 1 10 2
F r e q ( H Z )
-8.0
0-7
.00
-6.0
0-5
.00
Ex
cit
ati
on
at
40
km
-4.0
0-3
.00
F i l t e r e d G r o u n d V e l o c i t y - E Q
100 10 1 10 2
F r e q ( H Z )
-8.0
0-7
.00
-6.0
0-5
.00
Ex
cit
ati
on
at
40
km
-4.0
0-3
.00
F i l t e r e d G r o u n d V e l o c i t y - E Q
100 10 1 10 2
F r e q ( H Z )
-8.0
0-7
.00
-6.0
0-5
.00
Ex
cit
ati
on
at
40
km
-4.0
0-3
.00
F i l t e r e d G r o u n d V e l o c i t y - E Q
100 10 1 10 2
F r e q ( H Z )
-8.0
0-7
.00
-6.0
0-5
.00
Ex
cit
ati
on
at
40
km
-4.0
0-3
.00
F i l t e r e d G r o u n d V e l o c i t y - E Q
100 10 1 10 2
F r e q ( H Z )
-8.0
0-7
.00
-6.0
0-5
.00
Ex
cit
ati
on
at
40
km
-4.0
0-3
.00
F i l t e r e d G r o u n d V e l o c i t y - E Q
100 10 1 10 2
F r e q ( H Z )
-8.0
0-7
.00
-6.0
0-5
.00
Ex
cit
ati
on
at
40
km
-4.0
0-3
.00
F i l t e r e d G r o u n d V e l o c i t y - E Q
100 10 1 10 2
F r e q ( H Z )
-8.0
0-7
.00
-6.0
0-5
.00
Ex
cit
ati
on
at
40
km
-4.0
0-3
.00
F i l t e r e d G r o u n d V e l o c i t y - E Q
100 10 1 10 2
F r e q ( H Z )
-8.0
0-7
.00
-6.0
0-5
.00
Ex
cit
ati
on
at
40
km
-4.0
0-3
.00
F i l t e r e d G r o u n d V e l o c i t y - E Q
100 10 1 10 2
F r e q ( H Z )
-8.0
0-7
.00
-6.0
0-5
.00
Ex
cit
ati
on
at
40
km
-4.0
0-3
.00
F i l t e r e d G r o u n d V e l o c i t y - E Q
100 10 1 10 2
F r e q ( H Z )
-8.0
0-7
.00
-6.0
0-5
.00
Ex
cit
ati
on
at
40
km
-4.0
0-3
.00
F i l t e r e d G r o u n d V e l o c i t y - E Q
100 10 1 10 2
F r e q ( H Z )
-8.0
0-7
.00
-6.0
0-5
.00
Ex
cit
ati
on
at
40
km
-4.0
0-3
.00
F i l t e r e d G r o u n d V e l o c i t y - E Q
100 10 1 10 2
F r e q ( H Z )
-8.0
0-7
.00
-6.0
0-5
.00
Ex
cit
ati
on
at
40
km
-4.0
0-3
.00
F i l t e r e d G r o u n d V e l o c i t y - E Q
100 10 1 10 2
F r e q ( H Z )
-8.0
0-7
.00
-6.0
0-5
.00
Ex
cit
ati
on
at
40
km
-4.0
0-3
.00
F i l t e r e d G r o u n d V e l o c i t y - E Q
100 10 1 10 2
F r e q ( H Z )
-8.0
0-7
.00
-6.0
0-5
.00
Ex
cit
ati
on
at
40
km
-4.0
0-3
.00
F i l t e r e d G r o u n d V e l o c i t y - E Q
100 10 1 10 2
F r e q ( H Z )
-8.0
0-7
.00
-6.0
0-5
.00
Ex
cit
ati
on
at
40
km
-4.0
0-3
.00
F i l t e r e d G r o u n d V e l o c i t y - E Q
100 10 1 10 2
F r e q ( H Z )
-8.0
0-7
.00
-6.0
0-5
.00
Ex
cit
ati
on
at
40
km
-4.0
0-3
.00
F i l t e r e d G r o u n d V e l o c i t y - E Q
100 10 1 10 2
F r e q ( H Z )
-8.0
0-7
.00
-6.0
0-5
.00
Ex
cit
ati
on
at
40
km
-4.0
0-3
.00
F i l t e r e d G r o u n d V e l o c i t y - E Q
100 10 1 10 2
F r e q ( H Z )
-8.0
0-7
.00
-6.0
0-5
.00
Ex
cit
ati
on
at
40
km
-4.0
0-3
.00
F i l t e r e d G r o u n d V e l o c i t y - E Q
100 10 1 10 2
F r e q ( H Z )
-8.0
0-7
.00
-6.0
0-5
.00
Ex
cit
ati
on
at
40
km
-4.0
0-3
.00
F i l t e r e d G r o u n d V e l o c i t y - E Q
100 10 1 10 2
F r e q ( H Z )
-8.0
0-7
.00
-6.0
0-5
.00
Ex
cit
ati
on
at
40
km
-4.0
0-3
.00
F i l t e r e d G r o u n d V e l o c i t y - E Q
100 10 1 10 2
F r e q ( H Z )
-8.0
0-7
.00
-6.0
0-5
.00
Ex
cit
ati
on
at
40
km
-4.0
0-3
.00
F i l t e r e d G r o u n d V e l o c i t y - E Q
100 10 1 10 2
F r e q ( H Z )
-8.0
0-7
.00
-6.0
0-5
.00
Ex
cit
ati
on
at
40
km
-4.0
0-3
.00
F i l t e r e d G r o u n d V e l o c i t y - E Q
100 10 1 10 2
F r e q ( H Z )
-8.0
0-7
.00
-6.0
0-5
.00
Ex
cit
ati
on
at
40
km
-4.0
0-3
.00
F i l t e r e d G r o u n d V e l o c i t y - E Q
100 10 1 10 2
F r e q ( H Z )
-8.0
0-7
.00
-6.0
0-5
.00
Ex
cit
ati
on
at
40
km
-4.0
0-3
.00
F i l t e r e d G r o u n d V e l o c i t y - E Q
100 10 1 10 2
F r e q ( H Z )
-8.0
0-7
.00
-6.0
0-5
.00
Ex
cit
ati
on
at
40
km
-4.0
0-3
.00
F i l t e r e d G r o u n d V e l o c i t y - E Q
100 10 1 10 2
F r e q ( H Z )
-8.0
0-7
.00
-6.0
0-5
.00
Ex
cit
ati
on
at
40
km
-4.0
0-3
.00
F i l t e r e d G r o u n d V e l o c i t y - E Q
100 10 1 10 2
F r e q ( H Z )
-8.0
0-7
.00
-6.0
0-5
.00
Ex
cit
ati
on
at
40
km
-4.0
0-3
.00
F i l t e r e d G r o u n d V e l o c i t y - E Q
100 10 1 10 2
F r e q ( H Z )
-8.0
0-7
.00
-6.0
0-5
.00
Ex
cit
ati
on
at
40
km
-4.0
0-3
.00
F i l t e r e d G r o u n d V e l o c i t y - E Q
100 10 1 10 2
F r e q ( H Z )
-8.0
0-7
.00
-6.0
0-5
.00
Ex
cit
ati
on
at
40
km
-4.0
0-3
.00
F i l t e r e d G r o u n d V e l o c i t y - E Q
100 10 1 10 2
F r e q ( H Z )
-8.0
0-7
.00
-6.0
0-5
.00
Ex
cit
ati
on
at
40
km
-4.0
0-3
.00
F i l t e r e d G r o u n d V e l o c i t y - E Q
100 10 1 10 2
F r e q ( H Z )
-8.0
0-7
.00
-6.0
0-5
.00
Ex
cit
ati
on
at
40
km
-4.0
0-3
.00
F i l t e r e d G r o u n d V e l o c i t y - E Q
100 10 1 10 2
F r e q ( H Z )
-8.0
0-7
.00
-6.0
0-5
.00
Ex
cit
ati
on
at
40
km
-4.0
0-3
.00
F i l t e r e d G r o u n d V e l o c i t y - E Q
100 10 1 10 2
F r e q ( H Z )
-8.0
0-7
.00
-6.0
0-5
.00
Ex
cit
ati
on
at
40
km
-4.0
0-3
.00
F i l t e r e d G r o u n d V e l o c i t y - E Q
100 10 1 10 2
F r e q ( H Z )
-8.0
0-7
.00
-6.0
0-5
.00
Ex
cit
ati
on
at
40
km
-4.0
0-3
.00
F i l t e r e d G r o u n d V e l o c i t y - E Q
100 10 1 10 2
F r e q ( H Z )
-8.0
0-7
.00
-6.0
0-5
.00
Ex
cit
ati
on
at
40
km
-4.0
0-3
.00
F i l t e r e d G r o u n d V e l o c i t y - E Q
100 10 1 10 2
F r e q ( H Z )
-8.0
0-7
.00
-6.0
0-5
.00
Ex
cit
ati
on
at
40
km
-4.0
0-3
.00
F i l t e r e d G r o u n d V e l o c i t y - E Q
100 10 1 10 2
F r e q ( H Z )
-8.0
0-7
.00
-6.0
0-5
.00
Ex
cit
ati
on
at
40
km
-4.0
0-3
.00
F i l t e r e d G r o u n d V e l o c i t y - E Q
100 10 1 10 2
F r e q ( H Z )
-8.0
0-7
.00
-6.0
0-5
.00
Ex
cit
ati
on
at
40
km
-4.0
0-3
.00
F i l t e r e d G r o u n d V e l o c i t y - E Q
100 10 1 10 2
F r e q ( H Z )
-8.0
0-7
.00
-6.0
0-5
.00
Ex
cit
ati
on
at
40
km
-4.0
0-3
.00
F i l t e r e d G r o u n d V e l o c i t y - E Q
100 10 1 10 2
F r e q ( H Z )
-8.0
0-7
.00
-6.0
0-5
.00
Ex
cit
ati
on
at
40
km
-4.0
0-3
.00
F i l t e r e d G r o u n d V e l o c i t y - E Q
100 10 1 10 2
F r e q ( H Z )
-8.0
0-7
.00
-6.0
0-5
.00
Ex
cit
ati
on
at
40
km
-4.0
0-3
.00
F i l t e r e d G r o u n d V e l o c i t y - E Q
100 10 1 10 2
F r e q ( H Z )
-8.0
0-7
.00
-6.0
0-5
.00
Ex
cit
ati
on
at
40
km
-4.0
0-3
.00
F i l t e r e d G r o u n d V e l o c i t y - E Q
100 10 1 10 2
F r e q ( H Z )
-8.0
0-7
.00
-6.0
0-5
.00
Ex
cit
ati
on
at
40
km
-4.0
0-3
.00
F i l t e r e d G r o u n d V e l o c i t y - E Q
100 10 1 10 2
F r e q ( H Z )
-8.0
0-7
.00
-6.0
0-5
.00
Ex
cit
ati
on
at
40
km
-4.0
0-3
.00
F i l t e r e d G r o u n d V e l o c i t y - E Q
100 10 1 10 2
F r e q ( H Z )
-8.0
0-7
.00
-6.0
0-5
.00
Ex
cit
ati
on
at
40
km
-4.0
0-3
.00
F i l t e r e d G r o u n d V e l o c i t y - E Q
100 10 1 10 2
F r e q ( H Z )
-8.0
0-7
.00
-6.0
0-5
.00
Ex
cit
ati
on
at
40
km
-4.0
0-3
.00
F i l t e r e d G r o u n d V e l o c i t y - E Q
100 10 1 10 2
F r e q ( H Z )
-8.0
0-7
.00
-6.0
0-5
.00
Ex
cit
ati
on
at
40
km
-4.0
0-3
.00
F i l t e r e d G r o u n d V e l o c i t y - E Q
100 10 1 10 2
F r e q ( H Z )
-8.0
0-7
.00
-6.0
0-5
.00
Ex
cit
ati
on
at
40
km
-4.0
0-3
.00
F i l t e r e d G r o u n d V e l o c i t y - E Q
100 10 1 10 2
F r e q ( H Z )
-8.0
0-7
.00
-6.0
0-5
.00
Ex
cit
ati
on
at
40
km
-4.0
0-3
.00
F i l t e r e d G r o u n d V e l o c i t y - E Q
100 10 1 10 2
F r e q ( H Z )
-8.0
0-7
.00
-6.0
0-5
.00
Ex
cit
ati
on
at
40
km
-4.0
0-3
.00
F i l t e r e d G r o u n d V e l o c i t y - E Q
100 10 1 10 2
F r e q ( H Z )
-8.0
0-7
.00
-6.0
0-5
.00
Ex
cit
ati
on
at
40
km
-4.0
0-3
.00
F i l t e r e d G r o u n d V e l o c i t y - E Q
100 10 1 10 2
F r e q ( H Z )
-8.0
0-7
.00
-6.0
0-5
.00
Ex
cit
ati
on
at
40
km
-4.0
0-3
.00
F i l t e r e d G r o u n d V e l o c i t y - E Q
100 10 1 10 2
F r e q ( H Z )
-8.0
0-7
.00
-6.0
0-5
.00
Ex
cit
ati
on
at
40
km
-4.0
0-3
.00
F i l t e r e d G r o u n d V e l o c i t y - E Q
100 10 1 10 2
F r e q ( H Z )
-8.0
0-7
.00
-6.0
0-5
.00
Ex
cit
ati
on
at
40
km
-4.0
0-3
.00
F i l t e r e d G r o u n d V e l o c i t y - E Q
100 10 1 10 2
F r e q ( H Z )
-8.0
0-7
.00
-6.0
0-5
.00
Ex
cit
ati
on
at
40
km
-4.0
0-3
.00
F i l t e r e d G r o u n d V e l o c i t y - E Q
100 10 1 10 2
F r e q ( H Z )
-8.0
0-7
.00
-6.0
0-5
.00
Ex
cit
ati
on
at
40
km
-4.0
0-3
.00
F i l t e r e d G r o u n d V e l o c i t y - E Q
100 10 1 10 2
F r e q ( H Z )
-8.0
0-7
.00
-6.0
0-5
.00
Ex
cit
ati
on
at
40
km
-4.0
0-3
.00
F i l t e r e d G r o u n d V e l o c i t y - E Q
100 10 1 10 2
F r e q ( H Z )
-8.0
0-7
.00
-6.0
0-5
.00
Ex
cit
ati
on
at
40
km
-4.0
0-3
.00
F i l t e r e d G r o u n d V e l o c i t y - E Q
100 10 1 10 2
F r e q ( H Z )
-8.0
0-7
.00
-6.0
0-5
.00
Ex
cit
ati
on
at
40
km
-4.0
0-3
.00
F i l t e r e d G r o u n d V e l o c i t y - E Q
100 10 1 10 2
F r e q ( H Z )
-8.0
0-7
.00
-6.0
0-5
.00
Ex
cit
ati
on
at
40
km
-4.0
0-3
.00
F i l t e r e d G r o u n d V e l o c i t y - E Q
100 10 1 10 2
F r e q ( H Z )
-8.0
0-7
.00
-6.0
0-5
.00
Ex
cit
ati
on
at
40
km
-4.0
0-3
.00
F i l t e r e d G r o u n d V e l o c i t y - E Q
100 10 1 10 2
F r e q ( H Z )
-8.0
0-7
.00
-6.0
0-5
.00
Ex
cit
ati
on
at
40
km
-4.0
0-3
.00
F i l t e r e d G r o u n d V e l o c i t y - E Q
100 10 1 10 2
F r e q ( H Z )
-8.0
0-7
.00
-6.0
0-5
.00
Ex
cit
ati
on
at
40
km
-4.0
0-3
.00
F i l t e r e d G r o u n d V e l o c i t y - E Q
100 10 1 10 2
F r e q ( H Z )
-8.0
0-7
.00
-6.0
0-5
.00
Ex
cit
ati
on
at
40
km
-4.0
0-3
.00
F i l t e r e d G r o u n d V e l o c i t y - E Q
100 10 1 10 2
F r e q ( H Z )
-8.0
0-7
.00
-6.0
0-5
.00
Ex
cit
ati
on
at
40
km
-4.0
0-3
.00
F i l t e r e d G r o u n d V e l o c i t y - E Q
100 10 1 10 2
F r e q ( H Z )
-8.0
0-7
.00
-6.0
0-5
.00
Ex
cit
ati
on
at
40
km
-4.0
0-3
.00
F i l t e r e d G r o u n d V e l o c i t y - E Q
100 10 1 10 2
F r e q ( H Z )
-8.0
0-7
.00
-6.0
0-5
.00
Ex
cit
ati
on
at
40
km
-4.0
0-3
.00
F i l t e r e d G r o u n d V e l o c i t y - E Q
100 10 1 10 2
F r e q ( H Z )
-8.0
0-7
.00
-6.0
0-5
.00
Ex
cit
ati
on
at
40
km
-4.0
0-3
.00
F i l t e r e d G r o u n d V e l o c i t y - E Q
100 10 1 10 2
F r e q ( H Z )
-8.0
0-7
.00
-6.0
0-5
.00
Ex
cit
ati
on
at
40
km
-4.0
0-3
.00
F i l t e r e d G r o u n d V e l o c i t y - E Q
100 10 1 10 2
F r e q ( H Z )
-8.0
0-7
.00
-6.0
0-5
.00
Ex
cit
ati
on
at
40
km
-4.0
0-3
.00
F i l t e r e d G r o u n d V e l o c i t y - E Q
100 10 1 10 2
F r e q ( H Z )
-8.0
0-7
.00
-6.0
0-5
.00
Ex
cit
ati
on
at
40
km
-4.0
0-3
.00
F i l t e r e d G r o u n d V e l o c i t y - E Q
100 10 1 10 2
F r e q ( H Z )
-8.0
0-7
.00
-6.0
0-5
.00
Ex
cit
ati
on
at
40
km
-4.0
0-3
.00
Band Pass Peak Ampl i tude
100 10 1 10 2
F r e q ( H Z )
-8.0
0-7
.00
-6.0
0-5
.00
Ex
cit
ati
on
at
40
km
-4.0
0-3
.00
Band Pass Peak Ampl i tude
100 10 1 10 2
F r e q ( H Z )
-8.0
0-7
.00
-6.0
0-5
.00
Ex
cit
ati
on
at
40
km
-4.0
0-3
.00
Band Pass Peak Ampl i tude
100 10 1 10 2
F r e q ( H Z )
-8.0
0-7
.00
-6.0
0-5
.00
Ex
cit
ati
on
at
40
km
-4.0
0-3
.00
Band Pass Peak Ampl i tude
100 10 1 10 2
F r e q ( H Z )
-8.0
0-7
.00
-6.0
0-5
.00
Ex
cit
ati
on
at
40
km
-4.0
0-3
.00
Band Pass Peak Ampl i tude
Mw=4.0
Mw=3.5
Mw=3.0
Mw=2.5
Mw=2.0
RED - THEO
BLACK - Data
Figure 4.10: Excitation of peak filtered velocity at 40 km (Model A). Thethick dash curve is the prediction of the 400 bar constant stress dropsource model. E is the log � � of the peak filtered velocity spectra in �
�������.

77
0 . 0 0 5 . 0 0 1 0 . 0 0F r e q ( H Z )
1 5 . 0 0 2 0 . 0 0
-8.0
0-7
.00
-6.0
0-5
.00
Ex
cit
ati
on
at
40
km
-4.0
0-3
.00
F i l t e r e d G r o u n d V e l o c i t y
0 . 0 0 5 . 0 0 1 0 . 0 0F r e q ( H Z )
1 5 . 0 0 2 0 . 0 0
-8.0
0-7
.00
-6.0
0-5
.00
Ex
cit
ati
on
at
40
km
-4.0
0-3
.00
F i l t e r e d G r o u n d V e l o c i t y
0 . 0 0 5 . 0 0 1 0 . 0 0F r e q ( H Z )
1 5 . 0 0 2 0 . 0 0
-8.0
0-7
.00
-6.0
0-5
.00
Ex
cit
ati
on
at
40
km
-4.0
0-3
.00
F i l t e r e d G r o u n d V e l o c i t y
0 . 0 0 5 . 0 0 1 0 . 0 0F r e q ( H Z )
1 5 . 0 0 2 0 . 0 0
-8.0
0-7
.00
-6.0
0-5
.00
Ex
cit
ati
on
at
40
km
-4.0
0-3
.00
F i l t e r e d G r o u n d V e l o c i t y
0 . 0 0 5 . 0 0 1 0 . 0 0F r e q ( H Z )
1 5 . 0 0 2 0 . 0 0
-8.0
0-7
.00
-6.0
0-5
.00
Ex
cit
ati
on
at
40
km
-4.0
0-3
.00
F i l t e r e d G r o u n d V e l o c i t y
0 . 0 0 5 . 0 0 1 0 . 0 0F r e q ( H Z )
1 5 . 0 0 2 0 . 0 0
-8.0
0-7
.00
-6.0
0-5
.00
Ex
cit
ati
on
at
40
km
-4.0
0-3
.00
F i l t e r e d G r o u n d V e l o c i t y
0 . 0 0 5 . 0 0 1 0 . 0 0F r e q ( H Z )
1 5 . 0 0 2 0 . 0 0
-8.0
0-7
.00
-6.0
0-5
.00
Ex
cit
ati
on
at
40
km
-4.0
0-3
.00
F i l t e r e d G r o u n d V e l o c i t y
0 . 0 0 5 . 0 0 1 0 . 0 0F r e q ( H Z )
1 5 . 0 0 2 0 . 0 0
-8.0
0-7
.00
-6.0
0-5
.00
Ex
cit
ati
on
at
40
km
-4.0
0-3
.00
F i l t e r e d G r o u n d V e l o c i t y
0 . 0 0 5 . 0 0 1 0 . 0 0F r e q ( H Z )
1 5 . 0 0 2 0 . 0 0
-8.0
0-7
.00
-6.0
0-5
.00
Ex
cit
ati
on
at
40
km
-4.0
0-3
.00
F i l t e r e d G r o u n d V e l o c i t y
0 . 0 0 5 . 0 0 1 0 . 0 0F r e q ( H Z )
1 5 . 0 0 2 0 . 0 0
-8.0
0-7
.00
-6.0
0-5
.00
Ex
cit
ati
on
at
40
km
-4.0
0-3
.00
F i l t e r e d G r o u n d V e l o c i t y
0 . 0 0 5 . 0 0 1 0 . 0 0F r e q ( H Z )
1 5 . 0 0 2 0 . 0 0
-8.0
0-7
.00
-6.0
0-5
.00
Ex
cit
ati
on
at
40
km
-4.0
0-3
.00
F i l t e r e d G r o u n d V e l o c i t y
0 . 0 0 5 . 0 0 1 0 . 0 0F r e q ( H Z )
1 5 . 0 0 2 0 . 0 0
-8.0
0-7
.00
-6.0
0-5
.00
Ex
cit
ati
on
at
40
km
-4.0
0-3
.00
F i l t e r e d G r o u n d V e l o c i t y
0 . 0 0 5 . 0 0 1 0 . 0 0F r e q ( H Z )
1 5 . 0 0 2 0 . 0 0
-8.0
0-7
.00
-6.0
0-5
.00
Ex
cit
ati
on
at
40
km
-4.0
0-3
.00
F i l t e r e d G r o u n d V e l o c i t y
0 . 0 0 5 . 0 0 1 0 . 0 0F r e q ( H Z )
1 5 . 0 0 2 0 . 0 0
-8.0
0-7
.00
-6.0
0-5
.00
Ex
cit
ati
on
at
40
km
-4.0
0-3
.00
F i l t e r e d G r o u n d V e l o c i t y
0 . 0 0 5 . 0 0 1 0 . 0 0F r e q ( H Z )
1 5 . 0 0 2 0 . 0 0
-8.0
0-7
.00
-6.0
0-5
.00
Ex
cit
ati
on
at
40
km
-4.0
0-3
.00
F i l t e r e d G r o u n d V e l o c i t y
0 . 0 0 5 . 0 0 1 0 . 0 0F r e q ( H Z )
1 5 . 0 0 2 0 . 0 0
-8.0
0-7
.00
-6.0
0-5
.00
Ex
cit
ati
on
at
40
km
-4.0
0-3
.00
F i l t e r e d G r o u n d V e l o c i t y
0 . 0 0 5 . 0 0 1 0 . 0 0F r e q ( H Z )
1 5 . 0 0 2 0 . 0 0
-8.0
0-7
.00
-6.0
0-5
.00
Ex
cit
ati
on
at
40
km
-4.0
0-3
.00
F i l t e r e d G r o u n d V e l o c i t y
0 . 0 0 5 . 0 0 1 0 . 0 0F r e q ( H Z )
1 5 . 0 0 2 0 . 0 0
-8.0
0-7
.00
-6.0
0-5
.00
Ex
cit
ati
on
at
40
km
-4.0
0-3
.00
F i l t e r e d G r o u n d V e l o c i t y
0 . 0 0 5 . 0 0 1 0 . 0 0F r e q ( H Z )
1 5 . 0 0 2 0 . 0 0
-8.0
0-7
.00
-6.0
0-5
.00
Ex
cit
ati
on
at
40
km
-4.0
0-3
.00
F i l t e r e d G r o u n d V e l o c i t y
0 . 0 0 5 . 0 0 1 0 . 0 0F r e q ( H Z )
1 5 . 0 0 2 0 . 0 0
-8.0
0-7
.00
-6.0
0-5
.00
Ex
cit
ati
on
at
40
km
-4.0
0-3
.00
F i l t e r e d G r o u n d V e l o c i t y
0 . 0 0 5 . 0 0 1 0 . 0 0F r e q ( H Z )
1 5 . 0 0 2 0 . 0 0
-8.0
0-7
.00
-6.0
0-5
.00
Ex
cit
ati
on
at
40
km
-4.0
0-3
.00
F i l t e r e d G r o u n d V e l o c i t y
0 . 0 0 5 . 0 0 1 0 . 0 0F r e q ( H Z )
1 5 . 0 0 2 0 . 0 0
-8.0
0-7
.00
-6.0
0-5
.00
Ex
cit
ati
on
at
40
km
-4.0
0-3
.00
F i l t e r e d G r o u n d V e l o c i t y
0 . 0 0 5 . 0 0 1 0 . 0 0F r e q ( H Z )
1 5 . 0 0 2 0 . 0 0
-8.0
0-7
.00
-6.0
0-5
.00
Ex
cit
ati
on
at
40
km
-4.0
0-3
.00
F i l t e r e d G r o u n d V e l o c i t y
0 . 0 0 5 . 0 0 1 0 . 0 0F r e q ( H Z )
1 5 . 0 0 2 0 . 0 0
-8.0
0-7
.00
-6.0
0-5
.00
Ex
cit
ati
on
at
40
km
-4.0
0-3
.00
F i l t e r e d G r o u n d V e l o c i t y
0 . 0 0 5 . 0 0 1 0 . 0 0F r e q ( H Z )
1 5 . 0 0 2 0 . 0 0
-8.0
0-7
.00
-6.0
0-5
.00
Ex
cit
ati
on
at
40
km
-4.0
0-3
.00
F i l t e r e d G r o u n d V e l o c i t y
0 . 0 0 5 . 0 0 1 0 . 0 0F r e q ( H Z )
1 5 . 0 0 2 0 . 0 0
-8.0
0-7
.00
-6.0
0-5
.00
Ex
cit
ati
on
at
40
km
-4.0
0-3
.00
F i l t e r e d G r o u n d V e l o c i t y
0 . 0 0 5 . 0 0 1 0 . 0 0F r e q ( H Z )
1 5 . 0 0 2 0 . 0 0
-8.0
0-7
.00
-6.0
0-5
.00
Ex
cit
ati
on
at
40
km
-4.0
0-3
.00
F i l t e r e d G r o u n d V e l o c i t y
0 . 0 0 5 . 0 0 1 0 . 0 0F r e q ( H Z )
1 5 . 0 0 2 0 . 0 0
-8.0
0-7
.00
-6.0
0-5
.00
Ex
cit
ati
on
at
40
km
-4.0
0-3
.00
F i l t e r e d G r o u n d V e l o c i t y
0 . 0 0 5 . 0 0 1 0 . 0 0F r e q ( H Z )
1 5 . 0 0 2 0 . 0 0
-8.0
0-7
.00
-6.0
0-5
.00
Ex
cit
ati
on
at
40
km
-4.0
0-3
.00
F i l t e r e d G r o u n d V e l o c i t y
0 . 0 0 5 . 0 0 1 0 . 0 0F r e q ( H Z )
1 5 . 0 0 2 0 . 0 0
-8.0
0-7
.00
-6.0
0-5
.00
Ex
cit
ati
on
at
40
km
-4.0
0-3
.00
F i l t e r e d G r o u n d V e l o c i t y
0 . 0 0 5 . 0 0 1 0 . 0 0F r e q ( H Z )
1 5 . 0 0 2 0 . 0 0
-8.0
0-7
.00
-6.0
0-5
.00
Ex
cit
ati
on
at
40
km
-4.0
0-3
.00
F i l t e r e d G r o u n d V e l o c i t y
0 . 0 0 5 . 0 0 1 0 . 0 0F r e q ( H Z )
1 5 . 0 0 2 0 . 0 0
-8.0
0-7
.00
-6.0
0-5
.00
Ex
cit
ati
on
at
40
km
-4.0
0-3
.00
F i l t e r e d G r o u n d V e l o c i t y
0 . 0 0 5 . 0 0 1 0 . 0 0F r e q ( H Z )
1 5 . 0 0 2 0 . 0 0
-8.0
0-7
.00
-6.0
0-5
.00
Ex
cit
ati
on
at
40
km
-4.0
0-3
.00
F i l t e r e d G r o u n d V e l o c i t y
0 . 0 0 5 . 0 0 1 0 . 0 0F r e q ( H Z )
1 5 . 0 0 2 0 . 0 0
-8.0
0-7
.00
-6.0
0-5
.00
Ex
cit
ati
on
at
40
km
-4.0
0-3
.00
F i l t e r e d G r o u n d V e l o c i t y
0 . 0 0 5 . 0 0 1 0 . 0 0F r e q ( H Z )
1 5 . 0 0 2 0 . 0 0
-8.0
0-7
.00
-6.0
0-5
.00
Ex
cit
ati
on
at
40
km
-4.0
0-3
.00
F i l t e r e d G r o u n d V e l o c i t y
0 . 0 0 5 . 0 0 1 0 . 0 0F r e q ( H Z )
1 5 . 0 0 2 0 . 0 0
-8.0
0-7
.00
-6.0
0-5
.00
Ex
cit
ati
on
at
40
km
-4.0
0-3
.00
F i l t e r e d G r o u n d V e l o c i t y
0 . 0 0 5 . 0 0 1 0 . 0 0F r e q ( H Z )
1 5 . 0 0 2 0 . 0 0
-8.0
0-7
.00
-6.0
0-5
.00
Ex
cit
ati
on
at
40
km
-4.0
0-3
.00
F i l t e r e d G r o u n d V e l o c i t y
0 . 0 0 5 . 0 0 1 0 . 0 0F r e q ( H Z )
1 5 . 0 0 2 0 . 0 0
-8.0
0-7
.00
-6.0
0-5
.00
Ex
cit
ati
on
at
40
km
-4.0
0-3
.00
F i l t e r e d G r o u n d V e l o c i t y
0 . 0 0 5 . 0 0 1 0 . 0 0F r e q ( H Z )
1 5 . 0 0 2 0 . 0 0
-8.0
0-7
.00
-6.0
0-5
.00
Ex
cit
ati
on
at
40
km
-4.0
0-3
.00
F i l t e r e d G r o u n d V e l o c i t y
0 . 0 0 5 . 0 0 1 0 . 0 0F r e q ( H Z )
1 5 . 0 0 2 0 . 0 0
-8.0
0-7
.00
-6.0
0-5
.00
Ex
cit
ati
on
at
40
km
-4.0
0-3
.00
F i l t e r e d G r o u n d V e l o c i t y
0 . 0 0 5 . 0 0 1 0 . 0 0F r e q ( H Z )
1 5 . 0 0 2 0 . 0 0
-8.0
0-7
.00
-6.0
0-5
.00
Ex
cit
ati
on
at
40
km
-4.0
0-3
.00
F i l t e r e d G r o u n d V e l o c i t y
0 . 0 0 5 . 0 0 1 0 . 0 0F r e q ( H Z )
1 5 . 0 0 2 0 . 0 0
-8.0
0-7
.00
-6.0
0-5
.00
Ex
cit
ati
on
at
40
km
-4.0
0-3
.00
F i l t e r e d G r o u n d V e l o c i t y
0 . 0 0 5 . 0 0 1 0 . 0 0F r e q ( H Z )
1 5 . 0 0 2 0 . 0 0
-8.0
0-7
.00
-6.0
0-5
.00
Ex
cit
ati
on
at
40
km
-4.0
0-3
.00
F i l t e r e d G r o u n d V e l o c i t y
0 . 0 0 5 . 0 0 1 0 . 0 0F r e q ( H Z )
1 5 . 0 0 2 0 . 0 0
-8.0
0-7
.00
-6.0
0-5
.00
Ex
cit
ati
on
at
40
km
-4.0
0-3
.00
F i l t e r e d G r o u n d V e l o c i t y
0 . 0 0 5 . 0 0 1 0 . 0 0F r e q ( H Z )
1 5 . 0 0 2 0 . 0 0
-8.0
0-7
.00
-6.0
0-5
.00
Ex
cit
ati
on
at
40
km
-4.0
0-3
.00
F i l t e r e d G r o u n d V e l o c i t y
0 . 0 0 5 . 0 0 1 0 . 0 0F r e q ( H Z )
1 5 . 0 0 2 0 . 0 0
-8.0
0-7
.00
-6.0
0-5
.00
Ex
cit
ati
on
at
40
km
-4.0
0-3
.00
F i l t e r e d G r o u n d V e l o c i t y
0 . 0 0 5 . 0 0 1 0 . 0 0F r e q ( H Z )
1 5 . 0 0 2 0 . 0 0
-8.0
0-7
.00
-6.0
0-5
.00
Ex
cit
ati
on
at
40
km
-4.0
0-3
.00
F i l t e r e d G r o u n d V e l o c i t y
0 . 0 0 5 . 0 0 1 0 . 0 0F r e q ( H Z )
1 5 . 0 0 2 0 . 0 0
-8.0
0-7
.00
-6.0
0-5
.00
Ex
cit
ati
on
at
40
km
-4.0
0-3
.00
F i l t e r e d G r o u n d V e l o c i t y
0 . 0 0 5 . 0 0 1 0 . 0 0F r e q ( H Z )
1 5 . 0 0 2 0 . 0 0
-8.0
0-7
.00
-6.0
0-5
.00
Ex
cit
ati
on
at
40
km
-4.0
0-3
.00
F i l t e r e d G r o u n d V e l o c i t y
0 . 0 0 5 . 0 0 1 0 . 0 0F r e q ( H Z )
1 5 . 0 0 2 0 . 0 0
-8.0
0-7
.00
-6.0
0-5
.00
Ex
cit
ati
on
at
40
km
-4.0
0-3
.00
F i l t e r e d G r o u n d V e l o c i t y
0 . 0 0 5 . 0 0 1 0 . 0 0F r e q ( H Z )
1 5 . 0 0 2 0 . 0 0
-8.0
0-7
.00
-6.0
0-5
.00
Ex
cit
ati
on
at
40
km
-4.0
0-3
.00
F i l t e r e d G r o u n d V e l o c i t y
0 . 0 0 5 . 0 0 1 0 . 0 0F r e q ( H Z )
1 5 . 0 0 2 0 . 0 0
-8.0
0-7
.00
-6.0
0-5
.00
Ex
cit
ati
on
at
40
km
-4.0
0-3
.00
F i l t e r e d G r o u n d V e l o c i t y
0 . 0 0 5 . 0 0 1 0 . 0 0F r e q ( H Z )
1 5 . 0 0 2 0 . 0 0
-8.0
0-7
.00
-6.0
0-5
.00
Ex
cit
ati
on
at
40
km
-4.0
0-3
.00
F i l t e r e d G r o u n d V e l o c i t y
0 . 0 0 5 . 0 0 1 0 . 0 0F r e q ( H Z )
1 5 . 0 0 2 0 . 0 0
-8.0
0-7
.00
-6.0
0-5
.00
Ex
cit
ati
on
at
40
km
-4.0
0-3
.00
F i l t e r e d G r o u n d V e l o c i t y
0 . 0 0 5 . 0 0 1 0 . 0 0F r e q ( H Z )
1 5 . 0 0 2 0 . 0 0
-8.0
0-7
.00
-6.0
0-5
.00
Ex
cit
ati
on
at
40
km
-4.0
0-3
.00
F i l t e r e d G r o u n d V e l o c i t y
0 . 0 0 5 . 0 0 1 0 . 0 0F r e q ( H Z )
1 5 . 0 0 2 0 . 0 0
-8.0
0-7
.00
-6.0
0-5
.00
Ex
cit
ati
on
at
40
km
-4.0
0-3
.00
F i l t e r e d G r o u n d V e l o c i t y
0 . 0 0 5 . 0 0 1 0 . 0 0F r e q ( H Z )
1 5 . 0 0 2 0 . 0 0
-8.0
0-7
.00
-6.0
0-5
.00
Ex
cit
ati
on
at
40
km
-4.0
0-3
.00
F i l t e r e d G r o u n d V e l o c i t y
0 . 0 0 5 . 0 0 1 0 . 0 0F r e q ( H Z )
1 5 . 0 0 2 0 . 0 0
-8.0
0-7
.00
-6.0
0-5
.00
Ex
cit
ati
on
at
40
km
-4.0
0-3
.00
F i l t e r e d G r o u n d V e l o c i t y
0 . 0 0 5 . 0 0 1 0 . 0 0F r e q ( H Z )
1 5 . 0 0 2 0 . 0 0
-8.0
0-7
.00
-6.0
0-5
.00
Ex
cit
ati
on
at
40
km
-4.0
0-3
.00
F i l t e r e d G r o u n d V e l o c i t y
0 . 0 0 5 . 0 0 1 0 . 0 0F r e q ( H Z )
1 5 . 0 0 2 0 . 0 0
-8.0
0-7
.00
-6.0
0-5
.00
Ex
cit
ati
on
at
40
km
-4.0
0-3
.00
F i l t e r e d G r o u n d V e l o c i t y
0 . 0 0 5 . 0 0 1 0 . 0 0F r e q ( H Z )
1 5 . 0 0 2 0 . 0 0
-8.0
0-7
.00
-6.0
0-5
.00
Ex
cit
ati
on
at
40
km
-4.0
0-3
.00
F i l t e r e d G r o u n d V e l o c i t y
0 . 0 0 5 . 0 0 1 0 . 0 0F r e q ( H Z )
1 5 . 0 0 2 0 . 0 0
-8.0
0-7
.00
-6.0
0-5
.00
Ex
cit
ati
on
at
40
km
-4.0
0-3
.00
F i l t e r e d G r o u n d V e l o c i t y
0 . 0 0 5 . 0 0 1 0 . 0 0F r e q ( H Z )
1 5 . 0 0 2 0 . 0 0
-8.0
0-7
.00
-6.0
0-5
.00
Ex
cit
ati
on
at
40
km
-4.0
0-3
.00
F i l t e r e d G r o u n d V e l o c i t y
0 . 0 0 5 . 0 0 1 0 . 0 0F r e q ( H Z )
1 5 . 0 0 2 0 . 0 0
-8.0
0-7
.00
-6.0
0-5
.00
Ex
cit
ati
on
at
40
km
-4.0
0-3
.00
F i l t e r e d G r o u n d V e l o c i t y
0 . 0 0 5 . 0 0 1 0 . 0 0F r e q ( H Z )
1 5 . 0 0 2 0 . 0 0
-8.0
0-7
.00
-6.0
0-5
.00
Ex
cit
ati
on
at
40
km
-4.0
0-3
.00
F i l t e r e d G r o u n d V e l o c i t y
0 . 0 0 5 . 0 0 1 0 . 0 0F r e q ( H Z )
1 5 . 0 0 2 0 . 0 0
-8.0
0-7
.00
-6.0
0-5
.00
Ex
cit
ati
on
at
40
km
-4.0
0-3
.00
F i l t e r e d G r o u n d V e l o c i t y
0 . 0 0 5 . 0 0 1 0 . 0 0F r e q ( H Z )
1 5 . 0 0 2 0 . 0 0
-8.0
0-7
.00
-6.0
0-5
.00
Ex
cit
ati
on
at
40
km
-4.0
0-3
.00
F i l t e r e d G r o u n d V e l o c i t y
0 . 0 0 5 . 0 0 1 0 . 0 0F r e q ( H Z )
1 5 . 0 0 2 0 . 0 0
-8.0
0-7
.00
-6.0
0-5
.00
Ex
cit
ati
on
at
40
km
-4.0
0-3
.00
F i l t e r e d G r o u n d V e l o c i t y
0 . 0 0 5 . 0 0 1 0 . 0 0F r e q ( H Z )
1 5 . 0 0 2 0 . 0 0
-8.0
0-7
.00
-6.0
0-5
.00
Ex
cit
ati
on
at
40
km
-4.0
0-3
.00
F i l t e r e d G r o u n d V e l o c i t y
0 . 0 0 5 . 0 0 1 0 . 0 0F r e q ( H Z )
1 5 . 0 0 2 0 . 0 0
-8.0
0-7
.00
-6.0
0-5
.00
Ex
cit
ati
on
at
40
km
-4.0
0-3
.00
F i l t e r e d G r o u n d V e l o c i t y
0 . 0 0 5 . 0 0 1 0 . 0 0F r e q ( H Z )
1 5 . 0 0 2 0 . 0 0
-8.0
0-7
.00
-6.0
0-5
.00
Ex
cit
ati
on
at
40
km
-4.0
0-3
.00
F i l t e r e d G r o u n d V e l o c i t y
0 . 0 0 5 . 0 0 1 0 . 0 0F r e q ( H Z )
1 5 . 0 0 2 0 . 0 0
-8.0
0-7
.00
-6.0
0-5
.00
Ex
cit
ati
on
at
40
km
-4.0
0-3
.00
F i l t e r e d G r o u n d V e l o c i t y
0 . 0 0 5 . 0 0 1 0 . 0 0F r e q ( H Z )
1 5 . 0 0 2 0 . 0 0
-8.0
0-7
.00
-6.0
0-5
.00
Ex
cit
ati
on
at
40
km
-4.0
0-3
.00
F i l t e r e d G r o u n d V e l o c i t y
0 . 0 0 5 . 0 0 1 0 . 0 0F r e q ( H Z )
1 5 . 0 0 2 0 . 0 0
-8.0
0-7
.00
-6.0
0-5
.00
Ex
cit
ati
on
at
40
km
-4.0
0-3
.00
F i l t e r e d G r o u n d V e l o c i t y
0 . 0 0 5 . 0 0 1 0 . 0 0F r e q ( H Z )
1 5 . 0 0 2 0 . 0 0
-8.0
0-7
.00
-6.0
0-5
.00
Ex
cit
ati
on
at
40
km
-4.0
0-3
.00
F i l t e r e d G r o u n d V e l o c i t y
0 . 0 0 5 . 0 0 1 0 . 0 0F r e q ( H Z )
1 5 . 0 0 2 0 . 0 0
-8.0
0-7
.00
-6.0
0-5
.00
Ex
cit
ati
on
at
40
km
-4.0
0-3
.00
F i l t e r e d G r o u n d V e l o c i t y
0 . 0 0 5 . 0 0 1 0 . 0 0F r e q ( H Z )
1 5 . 0 0 2 0 . 0 0
-8.0
0-7
.00
-6.0
0-5
.00
Ex
cit
ati
on
at
40
km
-4.0
0-3
.00
F i l t e r e d G r o u n d V e l o c i t y
0 . 0 0 5 . 0 0 1 0 . 0 0F r e q ( H Z )
1 5 . 0 0 2 0 . 0 0
-8.0
0-7
.00
-6.0
0-5
.00
Ex
cit
ati
on
at
40
km
-4.0
0-3
.00
F i l t e r e d G r o u n d V e l o c i t y
0 . 0 0 5 . 0 0 1 0 . 0 0F r e q ( H Z )
1 5 . 0 0 2 0 . 0 0
-8.0
0-7
.00
-6.0
0-5
.00
Ex
cit
ati
on
at
40
km
-4.0
0-3
.00
F i l t e r e d G r o u n d V e l o c i t y
0 . 0 0 5 . 0 0 1 0 . 0 0F r e q ( H Z )
1 5 . 0 0 2 0 . 0 0
-8.0
0-7
.00
-6.0
0-5
.00
Ex
cit
ati
on
at
40
km
-4.0
0-3
.00
F i l t e r e d G r o u n d V e l o c i t y
0 . 0 0 5 . 0 0 1 0 . 0 0F r e q ( H Z )
1 5 . 0 0 2 0 . 0 0
-8.0
0-7
.00
-6.0
0-5
.00
Ex
cit
ati
on
at
40
km
-4.0
0-3
.00
F i l t e r e d G r o u n d V e l o c i t y
0 . 0 0 5 . 0 0 1 0 . 0 0F r e q ( H Z )
1 5 . 0 0 2 0 . 0 0
-8.0
0-7
.00
-6.0
0-5
.00
Ex
cit
ati
on
at
40
km
-4.0
0-3
.00
F i l t e r e d G r o u n d V e l o c i t y
0 . 0 0 5 . 0 0 1 0 . 0 0F r e q ( H Z )
1 5 . 0 0 2 0 . 0 0
-8.0
0-7
.00
-6.0
0-5
.00
Ex
cit
ati
on
at
40
km
-4.0
0-3
.00
F i l t e r e d G r o u n d V e l o c i t y
0 . 0 0 5 . 0 0 1 0 . 0 0F r e q ( H Z )
1 5 . 0 0 2 0 . 0 0
-8.0
0-7
.00
-6.0
0-5
.00
Ex
cit
ati
on
at
40
km
-4.0
0-3
.00
F i l t e r e d G r o u n d V e l o c i t y
0 . 0 0 5 . 0 0 1 0 . 0 0F r e q ( H Z )
1 5 . 0 0 2 0 . 0 0
-8.0
0-7
.00
-6.0
0-5
.00
Ex
cit
ati
on
at
40
km
-4.0
0-3
.00
F i l t e r e d G r o u n d V e l o c i t y
0 . 0 0 5 . 0 0 1 0 . 0 0F r e q ( H Z )
1 5 . 0 0 2 0 . 0 0
-8.0
0-7
.00
-6.0
0-5
.00
Ex
cit
ati
on
at
40
km
-4.0
0-3
.00
F i l t e r e d G r o u n d V e l o c i t y
0 . 0 0 5 . 0 0 1 0 . 0 0F r e q ( H Z )
1 5 . 0 0 2 0 . 0 0
-8.0
0-7
.00
-6.0
0-5
.00
Ex
cit
ati
on
at
40
km
-4.0
0-3
.00
F i l t e r e d G r o u n d V e l o c i t y
0 . 0 0 5 . 0 0 1 0 . 0 0F r e q ( H Z )
1 5 . 0 0 2 0 . 0 0
-8.0
0-7
.00
-6.0
0-5
.00
Ex
cit
ati
on
at
40
km
-4.0
0-3
.00
F i l t e r e d G r o u n d V e l o c i t y
0 . 0 0 5 . 0 0 1 0 . 0 0F r e q ( H Z )
1 5 . 0 0 2 0 . 0 0
-8.0
0-7
.00
-6.0
0-5
.00
Ex
cit
ati
on
at
40
km
-4.0
0-3
.00
F i l t e r e d G r o u n d V e l o c i t y
0 . 0 0 5 . 0 0 1 0 . 0 0F r e q ( H Z )
1 5 . 0 0 2 0 . 0 0
-8.0
0-7
.00
-6.0
0-5
.00
Ex
cit
ati
on
at
40
km
-4.0
0-3
.00
F i l t e r e d G r o u n d V e l o c i t y
0 . 0 0 5 . 0 0 1 0 . 0 0F r e q ( H Z )
1 5 . 0 0 2 0 . 0 0
-8.0
0-7
.00
-6.0
0-5
.00
Ex
cit
ati
on
at
40
km
-4.0
0-3
.00
F i l t e r e d G r o u n d V e l o c i t y
0 . 0 0 5 . 0 0 1 0 . 0 0F r e q ( H Z )
1 5 . 0 0 2 0 . 0 0
-8.0
0-7
.00
-6.0
0-5
.00
Ex
cit
ati
on
at
40
km
-4.0
0-3
.00
F i l t e r e d G r o u n d V e l o c i t y
0 . 0 0 5 . 0 0 1 0 . 0 0F r e q ( H Z )
1 5 . 0 0 2 0 . 0 0
-8.0
0-7
.00
-6.0
0-5
.00
Ex
cit
ati
on
at
40
km
-4.0
0-3
.00
F i l t e r e d G r o u n d V e l o c i t y
0 . 0 0 5 . 0 0 1 0 . 0 0F r e q ( H Z )
1 5 . 0 0 2 0 . 0 0
-8.0
0-7
.00
-6.0
0-5
.00
Ex
cit
ati
on
at
40
km
-4.0
0-3
.00
F i l t e r e d G r o u n d V e l o c i t y
0 . 0 0 5 . 0 0 1 0 . 0 0F r e q ( H Z )
1 5 . 0 0 2 0 . 0 0
-8.0
0-7
.00
-6.0
0-5
.00
Ex
cit
ati
on
at
40
km
-4.0
0-3
.00
F i l t e r e d G r o u n d V e l o c i t y
0 . 0 0 5 . 0 0 1 0 . 0 0F r e q ( H Z )
1 5 . 0 0 2 0 . 0 0
-8.0
0-7
.00
-6.0
0-5
.00
Ex
cit
ati
on
at
40
km
-4.0
0-3
.00
F i l t e r e d G r o u n d V e l o c i t y
0 . 0 0 5 . 0 0 1 0 . 0 0F r e q ( H Z )
1 5 . 0 0 2 0 . 0 0
-8.0
0-7
.00
-6.0
0-5
.00
Ex
cit
ati
on
at
40
km
-4.0
0-3
.00
F i l t e r e d G r o u n d V e l o c i t y
0 . 0 0 5 . 0 0 1 0 . 0 0F r e q ( H Z )
1 5 . 0 0 2 0 . 0 0
-8.0
0-7
.00
-6.0
0-5
.00
Ex
cit
ati
on
at
40
km
-4.0
0-3
.00
F i l t e r e d G r o u n d V e l o c i t y
0 . 0 0 5 . 0 0 1 0 . 0 0F r e q ( H Z )
1 5 . 0 0 2 0 . 0 0
-8.0
0-7
.00
-6.0
0-5
.00
Ex
cit
ati
on
at
40
km
-4.0
0-3
.00
F i l t e r e d G r o u n d V e l o c i t y
0 . 0 0 5 . 0 0 1 0 . 0 0F r e q ( H Z )
1 5 . 0 0 2 0 . 0 0
-8.0
0-7
.00
-6.0
0-5
.00
Ex
cit
ati
on
at
40
km
-4.0
0-3
.00
F i l t e r e d G r o u n d V e l o c i t y
0 . 0 0 5 . 0 0 1 0 . 0 0F r e q ( H Z )
1 5 . 0 0 2 0 . 0 0
-8.0
0-7
.00
-6.0
0-5
.00
Ex
cit
ati
on
at
40
km
-4.0
0-3
.00
F i l t e r e d G r o u n d V e l o c i t y
0 . 0 0 5 . 0 0 1 0 . 0 0F r e q ( H Z )
1 5 . 0 0 2 0 . 0 0
-8.0
0-7
.00
-6.0
0-5
.00
Ex
cit
ati
on
at
40
km
-4.0
0-3
.00
F i l t e r e d G r o u n d V e l o c i t y
0 . 0 0 5 . 0 0 1 0 . 0 0F r e q ( H Z )
1 5 . 0 0 2 0 . 0 0
-8.0
0-7
.00
-6.0
0-5
.00
Ex
cit
ati
on
at
40
km
-4.0
0-3
.00
F i l t e r e d G r o u n d V e l o c i t y
0 . 0 0 5 . 0 0 1 0 . 0 0F r e q ( H Z )
1 5 . 0 0 2 0 . 0 0
-8.0
0-7
.00
-6.0
0-5
.00
Ex
cit
ati
on
at
40
km
-4.0
0-3
.00
F i l t e r e d G r o u n d V e l o c i t y
0 . 0 0 5 . 0 0 1 0 . 0 0F r e q ( H Z )
1 5 . 0 0 2 0 . 0 0
-8.0
0-7
.00
-6.0
0-5
.00
Ex
cit
ati
on
at
40
km
-4.0
0-3
.00
F i l t e r e d G r o u n d V e l o c i t y
0 . 0 0 5 . 0 0 1 0 . 0 0F r e q ( H Z )
1 5 . 0 0 2 0 . 0 0
-8.0
0-7
.00
-6.0
0-5
.00
Ex
cit
ati
on
at
40
km
-4.0
0-3
.00
F i l t e r e d G r o u n d V e l o c i t y
0 . 0 0 5 . 0 0 1 0 . 0 0F r e q ( H Z )
1 5 . 0 0 2 0 . 0 0
-8.0
0-7
.00
-6.0
0-5
.00
Ex
cit
ati
on
at
40
km
-4.0
0-3
.00
F i l t e r e d G r o u n d V e l o c i t y
0 . 0 0 5 . 0 0 1 0 . 0 0F r e q ( H Z )
1 5 . 0 0 2 0 . 0 0
-8.0
0-7
.00
-6.0
0-5
.00
Ex
cit
ati
on
at
40
km
-4.0
0-3
.00
F i l t e r e d G r o u n d V e l o c i t y
0 . 0 0 5 . 0 0 1 0 . 0 0F r e q ( H Z )
1 5 . 0 0 2 0 . 0 0
-8.0
0-7
.00
-6.0
0-5
.00
Ex
cit
ati
on
at
40
km
-4.0
0-3
.00
F i l t e r e d G r o u n d V e l o c i t y
0 . 0 0 5 . 0 0 1 0 . 0 0F r e q ( H Z )
1 5 . 0 0 2 0 . 0 0
-8.0
0-7
.00
-6.0
0-5
.00
Ex
cit
ati
on
at
40
km
-4.0
0-3
.00
F i l t e r e d G r o u n d V e l o c i t y
0 . 0 0 5 . 0 0 1 0 . 0 0F r e q ( H Z )
1 5 . 0 0 2 0 . 0 0
-8.0
0-7
.00
-6.0
0-5
.00
Ex
cit
ati
on
at
40
km
-4.0
0-3
.00
F i l t e r e d G r o u n d V e l o c i t y
0 . 0 0 5 . 0 0 1 0 . 0 0F r e q ( H Z )
1 5 . 0 0 2 0 . 0 0
-8.0
0-7
.00
-6.0
0-5
.00
Ex
cit
ati
on
at
40
km
-4.0
0-3
.00
F i l t e r e d G r o u n d V e l o c i t y
0 . 0 0 5 . 0 0 1 0 . 0 0F r e q ( H Z )
1 5 . 0 0 2 0 . 0 0
-8.0
0-7
.00
-6.0
0-5
.00
Ex
cit
ati
on
at
40
km
-4.0
0-3
.00
Band Pass Peak Ampl i tude
0 . 0 0 5 . 0 0 1 0 . 0 0F r e q ( H Z )
1 5 . 0 0 2 0 . 0 0
-8.0
0-7
.00
-6.0
0-5
.00
Ex
cit
ati
on
at
40
km
-4.0
0-3
.00
Band Pass Peak Ampl i tude
0 . 0 0 5 . 0 0 1 0 . 0 0F r e q ( H Z )
1 5 . 0 0 2 0 . 0 0
-8.0
0-7
.00
-6.0
0-5
.00
Ex
cit
ati
on
at
40
km
-4.0
0-3
.00
Band Pass Peak Ampl i tude
0 . 0 0 5 . 0 0 1 0 . 0 0F r e q ( H Z )
1 5 . 0 0 2 0 . 0 0
-8.0
0-7
.00
-6.0
0-5
.00
Ex
cit
ati
on
at
40
km
-4.0
0-3
.00
Band Pass Peak Ampl i tude
0 . 0 0 5 . 0 0 1 0 . 0 0F r e q ( H Z )
1 5 . 0 0 2 0 . 0 0
-8.0
0-7
.00
-6.0
0-5
.00
Ex
cit
ati
on
at
40
km
-4.0
0-3
.00
Band Pass Peak Ampl i tude
Mw=4.0
Mw=3.5
Mw=3.0
Mw=2.5
Mw=2.0
RED - THEO
BLACK - Data Means
Figure 4.11: Excitation of peak filtered velocity at 40 km (Model A) in linearscale of frequency range. The thick dash curve is the prediction of the 400bar constant stress drop source model. E is the log � � of the peak filteredvelocity spectra in �
�������.

78
100 10 1 10 2
F r e q ( H Z )
-8.0
0-7
.00
-6.0
0-5
.00
Ex
cit
ati
on
at
40
km
-4.0
0-3
.00
F i l t e r e d G r o u n d V e l o c i t y - E Q
100 10 1 10 2
F r e q ( H Z )
-8.0
0-7
.00
-6.0
0-5
.00
Ex
cit
ati
on
at
40
km
-4.0
0-3
.00
F i l t e r e d G r o u n d V e l o c i t y - E Q
100 10 1 10 2
F r e q ( H Z )
-8.0
0-7
.00
-6.0
0-5
.00
Ex
cit
ati
on
at
40
km
-4.0
0-3
.00
F i l t e r e d G r o u n d V e l o c i t y - E Q
100 10 1 10 2
F r e q ( H Z )
-8.0
0-7
.00
-6.0
0-5
.00
Ex
cit
ati
on
at
40
km
-4.0
0-3
.00
F i l t e r e d G r o u n d V e l o c i t y - E Q
100 10 1 10 2
F r e q ( H Z )
-8.0
0-7
.00
-6.0
0-5
.00
Ex
cit
ati
on
at
40
km
-4.0
0-3
.00
F i l t e r e d G r o u n d V e l o c i t y - E Q
100 10 1 10 2
F r e q ( H Z )
-8.0
0-7
.00
-6.0
0-5
.00
Ex
cit
ati
on
at
40
km
-4.0
0-3
.00
F i l t e r e d G r o u n d V e l o c i t y - E Q
100 10 1 10 2
F r e q ( H Z )
-8.0
0-7
.00
-6.0
0-5
.00
Ex
cit
ati
on
at
40
km
-4.0
0-3
.00
F i l t e r e d G r o u n d V e l o c i t y - E Q
100 10 1 10 2
F r e q ( H Z )
-8.0
0-7
.00
-6.0
0-5
.00
Ex
cit
ati
on
at
40
km
-4.0
0-3
.00
F i l t e r e d G r o u n d V e l o c i t y - E Q
100 10 1 10 2
F r e q ( H Z )
-8.0
0-7
.00
-6.0
0-5
.00
Ex
cit
ati
on
at
40
km
-4.0
0-3
.00
F i l t e r e d G r o u n d V e l o c i t y - E Q
100 10 1 10 2
F r e q ( H Z )
-8.0
0-7
.00
-6.0
0-5
.00
Ex
cit
ati
on
at
40
km
-4.0
0-3
.00
F i l t e r e d G r o u n d V e l o c i t y - E Q
100 10 1 10 2
F r e q ( H Z )
-8.0
0-7
.00
-6.0
0-5
.00
Ex
cit
ati
on
at
40
km
-4.0
0-3
.00
F i l t e r e d G r o u n d V e l o c i t y - E Q
100 10 1 10 2
F r e q ( H Z )
-8.0
0-7
.00
-6.0
0-5
.00
Ex
cit
ati
on
at
40
km
-4.0
0-3
.00
F i l t e r e d G r o u n d V e l o c i t y - E Q
100 10 1 10 2
F r e q ( H Z )
-8.0
0-7
.00
-6.0
0-5
.00
Ex
cit
ati
on
at
40
km
-4.0
0-3
.00
F i l t e r e d G r o u n d V e l o c i t y - E Q
100 10 1 10 2
F r e q ( H Z )
-8.0
0-7
.00
-6.0
0-5
.00
Ex
cit
ati
on
at
40
km
-4.0
0-3
.00
F i l t e r e d G r o u n d V e l o c i t y - E Q
100 10 1 10 2
F r e q ( H Z )
-8.0
0-7
.00
-6.0
0-5
.00
Ex
cit
ati
on
at
40
km
-4.0
0-3
.00
F i l t e r e d G r o u n d V e l o c i t y - E Q
100 10 1 10 2
F r e q ( H Z )
-8.0
0-7
.00
-6.0
0-5
.00
Ex
cit
ati
on
at
40
km
-4.0
0-3
.00
F i l t e r e d G r o u n d V e l o c i t y - E Q
100 10 1 10 2
F r e q ( H Z )
-8.0
0-7
.00
-6.0
0-5
.00
Ex
cit
ati
on
at
40
km
-4.0
0-3
.00
F i l t e r e d G r o u n d V e l o c i t y - E Q
100 10 1 10 2
F r e q ( H Z )
-8.0
0-7
.00
-6.0
0-5
.00
Ex
cit
ati
on
at
40
km
-4.0
0-3
.00
F i l t e r e d G r o u n d V e l o c i t y - E Q
100 10 1 10 2
F r e q ( H Z )
-8.0
0-7
.00
-6.0
0-5
.00
Ex
cit
ati
on
at
40
km
-4.0
0-3
.00
F i l t e r e d G r o u n d V e l o c i t y - E Q
100 10 1 10 2
F r e q ( H Z )
-8.0
0-7
.00
-6.0
0-5
.00
Ex
cit
ati
on
at
40
km
-4.0
0-3
.00
F i l t e r e d G r o u n d V e l o c i t y - E Q
100 10 1 10 2
F r e q ( H Z )
-8.0
0-7
.00
-6.0
0-5
.00
Ex
cit
ati
on
at
40
km
-4.0
0-3
.00
F i l t e r e d G r o u n d V e l o c i t y - E Q
100 10 1 10 2
F r e q ( H Z )
-8.0
0-7
.00
-6.0
0-5
.00
Ex
cit
ati
on
at
40
km
-4.0
0-3
.00
F i l t e r e d G r o u n d V e l o c i t y - E Q
100 10 1 10 2
F r e q ( H Z )
-8.0
0-7
.00
-6.0
0-5
.00
Ex
cit
ati
on
at
40
km
-4.0
0-3
.00
F i l t e r e d G r o u n d V e l o c i t y - E Q
100 10 1 10 2
F r e q ( H Z )
-8.0
0-7
.00
-6.0
0-5
.00
Ex
cit
ati
on
at
40
km
-4.0
0-3
.00
F i l t e r e d G r o u n d V e l o c i t y - E Q
100 10 1 10 2
F r e q ( H Z )
-8.0
0-7
.00
-6.0
0-5
.00
Ex
cit
ati
on
at
40
km
-4.0
0-3
.00
F i l t e r e d G r o u n d V e l o c i t y - E Q
100 10 1 10 2
F r e q ( H Z )
-8.0
0-7
.00
-6.0
0-5
.00
Ex
cit
ati
on
at
40
km
-4.0
0-3
.00
F i l t e r e d G r o u n d V e l o c i t y - E Q
100 10 1 10 2
F r e q ( H Z )
-8.0
0-7
.00
-6.0
0-5
.00
Ex
cit
ati
on
at
40
km
-4.0
0-3
.00
F i l t e r e d G r o u n d V e l o c i t y - E Q
100 10 1 10 2
F r e q ( H Z )
-8.0
0-7
.00
-6.0
0-5
.00
Ex
cit
ati
on
at
40
km
-4.0
0-3
.00
F i l t e r e d G r o u n d V e l o c i t y - E Q
100 10 1 10 2
F r e q ( H Z )
-8.0
0-7
.00
-6.0
0-5
.00
Ex
cit
ati
on
at
40
km
-4.0
0-3
.00
F i l t e r e d G r o u n d V e l o c i t y - E Q
100 10 1 10 2
F r e q ( H Z )
-8.0
0-7
.00
-6.0
0-5
.00
Ex
cit
ati
on
at
40
km
-4.0
0-3
.00
F i l t e r e d G r o u n d V e l o c i t y - E Q
100 10 1 10 2
F r e q ( H Z )
-8.0
0-7
.00
-6.0
0-5
.00
Ex
cit
ati
on
at
40
km
-4.0
0-3
.00
F i l t e r e d G r o u n d V e l o c i t y - E Q
100 10 1 10 2
F r e q ( H Z )
-8.0
0-7
.00
-6.0
0-5
.00
Ex
cit
ati
on
at
40
km
-4.0
0-3
.00
F i l t e r e d G r o u n d V e l o c i t y - E Q
100 10 1 10 2
F r e q ( H Z )
-8.0
0-7
.00
-6.0
0-5
.00
Ex
cit
ati
on
at
40
km
-4.0
0-3
.00
F i l t e r e d G r o u n d V e l o c i t y - E Q
100 10 1 10 2
F r e q ( H Z )
-8.0
0-7
.00
-6.0
0-5
.00
Ex
cit
ati
on
at
40
km
-4.0
0-3
.00
F i l t e r e d G r o u n d V e l o c i t y - E Q
100 10 1 10 2
F r e q ( H Z )
-8.0
0-7
.00
-6.0
0-5
.00
Ex
cit
ati
on
at
40
km
-4.0
0-3
.00
F i l t e r e d G r o u n d V e l o c i t y - E Q
100 10 1 10 2
F r e q ( H Z )
-8.0
0-7
.00
-6.0
0-5
.00
Ex
cit
ati
on
at
40
km
-4.0
0-3
.00
F i l t e r e d G r o u n d V e l o c i t y - E Q
100 10 1 10 2
F r e q ( H Z )
-8.0
0-7
.00
-6.0
0-5
.00
Ex
cit
ati
on
at
40
km
-4.0
0-3
.00
F i l t e r e d G r o u n d V e l o c i t y - E Q
100 10 1 10 2
F r e q ( H Z )
-8.0
0-7
.00
-6.0
0-5
.00
Ex
cit
ati
on
at
40
km
-4.0
0-3
.00
F i l t e r e d G r o u n d V e l o c i t y - E Q
100 10 1 10 2
F r e q ( H Z )
-8.0
0-7
.00
-6.0
0-5
.00
Ex
cit
ati
on
at
40
km
-4.0
0-3
.00
F i l t e r e d G r o u n d V e l o c i t y - E Q
100 10 1 10 2
F r e q ( H Z )
-8.0
0-7
.00
-6.0
0-5
.00
Ex
cit
ati
on
at
40
km
-4.0
0-3
.00
F i l t e r e d G r o u n d V e l o c i t y - E Q
100 10 1 10 2
F r e q ( H Z )
-8.0
0-7
.00
-6.0
0-5
.00
Ex
cit
ati
on
at
40
km
-4.0
0-3
.00
F i l t e r e d G r o u n d V e l o c i t y - E Q
100 10 1 10 2
F r e q ( H Z )
-8.0
0-7
.00
-6.0
0-5
.00
Ex
cit
ati
on
at
40
km
-4.0
0-3
.00
F i l t e r e d G r o u n d V e l o c i t y - E Q
100 10 1 10 2
F r e q ( H Z )
-8.0
0-7
.00
-6.0
0-5
.00
Ex
cit
ati
on
at
40
km
-4.0
0-3
.00
F i l t e r e d G r o u n d V e l o c i t y - E Q
100 10 1 10 2
F r e q ( H Z )
-8.0
0-7
.00
-6.0
0-5
.00
Ex
cit
ati
on
at
40
km
-4.0
0-3
.00
F i l t e r e d G r o u n d V e l o c i t y - E Q
100 10 1 10 2
F r e q ( H Z )
-8.0
0-7
.00
-6.0
0-5
.00
Ex
cit
ati
on
at
40
km
-4.0
0-3
.00
F i l t e r e d G r o u n d V e l o c i t y - E Q
100 10 1 10 2
F r e q ( H Z )
-8.0
0-7
.00
-6.0
0-5
.00
Ex
cit
ati
on
at
40
km
-4.0
0-3
.00
F i l t e r e d G r o u n d V e l o c i t y - E Q
100 10 1 10 2
F r e q ( H Z )
-8.0
0-7
.00
-6.0
0-5
.00
Ex
cit
ati
on
at
40
km
-4.0
0-3
.00
F i l t e r e d G r o u n d V e l o c i t y - E Q
100 10 1 10 2
F r e q ( H Z )
-8.0
0-7
.00
-6.0
0-5
.00
Ex
cit
ati
on
at
40
km
-4.0
0-3
.00
F i l t e r e d G r o u n d V e l o c i t y - E Q
100 10 1 10 2
F r e q ( H Z )
-8.0
0-7
.00
-6.0
0-5
.00
Ex
cit
ati
on
at
40
km
-4.0
0-3
.00
F i l t e r e d G r o u n d V e l o c i t y - E Q
100 10 1 10 2
F r e q ( H Z )
-8.0
0-7
.00
-6.0
0-5
.00
Ex
cit
ati
on
at
40
km
-4.0
0-3
.00
F i l t e r e d G r o u n d V e l o c i t y - E Q
100 10 1 10 2
F r e q ( H Z )
-8.0
0-7
.00
-6.0
0-5
.00
Ex
cit
ati
on
at
40
km
-4.0
0-3
.00
F i l t e r e d G r o u n d V e l o c i t y - E Q
100 10 1 10 2
F r e q ( H Z )
-8.0
0-7
.00
-6.0
0-5
.00
Ex
cit
ati
on
at
40
km
-4.0
0-3
.00
F i l t e r e d G r o u n d V e l o c i t y - E Q
100 10 1 10 2
F r e q ( H Z )
-8.0
0-7
.00
-6.0
0-5
.00
Ex
cit
ati
on
at
40
km
-4.0
0-3
.00
F i l t e r e d G r o u n d V e l o c i t y - E Q
100 10 1 10 2
F r e q ( H Z )
-8.0
0-7
.00
-6.0
0-5
.00
Ex
cit
ati
on
at
40
km
-4.0
0-3
.00
F i l t e r e d G r o u n d V e l o c i t y - E Q
100 10 1 10 2
F r e q ( H Z )
-8.0
0-7
.00
-6.0
0-5
.00
Ex
cit
ati
on
at
40
km
-4.0
0-3
.00
F i l t e r e d G r o u n d V e l o c i t y - E Q
100 10 1 10 2
F r e q ( H Z )
-8.0
0-7
.00
-6.0
0-5
.00
Ex
cit
ati
on
at
40
km
-4.0
0-3
.00
F i l t e r e d G r o u n d V e l o c i t y - E Q
100 10 1 10 2
F r e q ( H Z )
-8.0
0-7
.00
-6.0
0-5
.00
Ex
cit
ati
on
at
40
km
-4.0
0-3
.00
F i l t e r e d G r o u n d V e l o c i t y - E Q
100 10 1 10 2
F r e q ( H Z )
-8.0
0-7
.00
-6.0
0-5
.00
Ex
cit
ati
on
at
40
km
-4.0
0-3
.00
F i l t e r e d G r o u n d V e l o c i t y - E Q
100 10 1 10 2
F r e q ( H Z )
-8.0
0-7
.00
-6.0
0-5
.00
Ex
cit
ati
on
at
40
km
-4.0
0-3
.00
F i l t e r e d G r o u n d V e l o c i t y - E Q
100 10 1 10 2
F r e q ( H Z )
-8.0
0-7
.00
-6.0
0-5
.00
Ex
cit
ati
on
at
40
km
-4.0
0-3
.00
F i l t e r e d G r o u n d V e l o c i t y - E Q
100 10 1 10 2
F r e q ( H Z )
-8.0
0-7
.00
-6.0
0-5
.00
Ex
cit
ati
on
at
40
km
-4.0
0-3
.00
F i l t e r e d G r o u n d V e l o c i t y - E Q
100 10 1 10 2
F r e q ( H Z )
-8.0
0-7
.00
-6.0
0-5
.00
Ex
cit
ati
on
at
40
km
-4.0
0-3
.00
F i l t e r e d G r o u n d V e l o c i t y - E Q
100 10 1 10 2
F r e q ( H Z )
-8.0
0-7
.00
-6.0
0-5
.00
Ex
cit
ati
on
at
40
km
-4.0
0-3
.00
F i l t e r e d G r o u n d V e l o c i t y - E Q
100 10 1 10 2
F r e q ( H Z )
-8.0
0-7
.00
-6.0
0-5
.00
Ex
cit
ati
on
at
40
km
-4.0
0-3
.00
F i l t e r e d G r o u n d V e l o c i t y - E Q
100 10 1 10 2
F r e q ( H Z )
-8.0
0-7
.00
-6.0
0-5
.00
Ex
cit
ati
on
at
40
km
-4.0
0-3
.00
F i l t e r e d G r o u n d V e l o c i t y - E Q
100 10 1 10 2
F r e q ( H Z )
-8.0
0-7
.00
-6.0
0-5
.00
Ex
cit
ati
on
at
40
km
-4.0
0-3
.00
F i l t e r e d G r o u n d V e l o c i t y - E Q
100 10 1 10 2
F r e q ( H Z )
-8.0
0-7
.00
-6.0
0-5
.00
Ex
cit
ati
on
at
40
km
-4.0
0-3
.00
F i l t e r e d G r o u n d V e l o c i t y - E Q
100 10 1 10 2
F r e q ( H Z )
-8.0
0-7
.00
-6.0
0-5
.00
Ex
cit
ati
on
at
40
km
-4.0
0-3
.00
F i l t e r e d G r o u n d V e l o c i t y - E Q
100 10 1 10 2
F r e q ( H Z )
-8.0
0-7
.00
-6.0
0-5
.00
Ex
cit
ati
on
at
40
km
-4.0
0-3
.00
F i l t e r e d G r o u n d V e l o c i t y - E Q
100 10 1 10 2
F r e q ( H Z )
-8.0
0-7
.00
-6.0
0-5
.00
Ex
cit
ati
on
at
40
km
-4.0
0-3
.00
F i l t e r e d G r o u n d V e l o c i t y - E Q
100 10 1 10 2
F r e q ( H Z )
-8.0
0-7
.00
-6.0
0-5
.00
Ex
cit
ati
on
at
40
km
-4.0
0-3
.00
F i l t e r e d G r o u n d V e l o c i t y - E Q
100 10 1 10 2
F r e q ( H Z )
-8.0
0-7
.00
-6.0
0-5
.00
Ex
cit
ati
on
at
40
km
-4.0
0-3
.00
F i l t e r e d G r o u n d V e l o c i t y - E Q
100 10 1 10 2
F r e q ( H Z )
-8.0
0-7
.00
-6.0
0-5
.00
Ex
cit
ati
on
at
40
km
-4.0
0-3
.00
F i l t e r e d G r o u n d V e l o c i t y - E Q
100 10 1 10 2
F r e q ( H Z )
-8.0
0-7
.00
-6.0
0-5
.00
Ex
cit
ati
on
at
40
km
-4.0
0-3
.00
F i l t e r e d G r o u n d V e l o c i t y - E Q
100 10 1 10 2
F r e q ( H Z )
-8.0
0-7
.00
-6.0
0-5
.00
Ex
cit
ati
on
at
40
km
-4.0
0-3
.00
F i l t e r e d G r o u n d V e l o c i t y - E Q
100 10 1 10 2
F r e q ( H Z )
-8.0
0-7
.00
-6.0
0-5
.00
Ex
cit
ati
on
at
40
km
-4.0
0-3
.00
F i l t e r e d G r o u n d V e l o c i t y - E Q
100 10 1 10 2
F r e q ( H Z )
-8.0
0-7
.00
-6.0
0-5
.00
Ex
cit
ati
on
at
40
km
-4.0
0-3
.00
F i l t e r e d G r o u n d V e l o c i t y - E Q
100 10 1 10 2
F r e q ( H Z )
-8.0
0-7
.00
-6.0
0-5
.00
Ex
cit
ati
on
at
40
km
-4.0
0-3
.00
F i l t e r e d G r o u n d V e l o c i t y - E Q
100 10 1 10 2
F r e q ( H Z )
-8.0
0-7
.00
-6.0
0-5
.00
Ex
cit
ati
on
at
40
km
-4.0
0-3
.00
F i l t e r e d G r o u n d V e l o c i t y - E Q
100 10 1 10 2
F r e q ( H Z )
-8.0
0-7
.00
-6.0
0-5
.00
Ex
cit
ati
on
at
40
km
-4.0
0-3
.00
F i l t e r e d G r o u n d V e l o c i t y - E Q
100 10 1 10 2
F r e q ( H Z )
-8.0
0-7
.00
-6.0
0-5
.00
Ex
cit
ati
on
at
40
km
-4.0
0-3
.00
F i l t e r e d G r o u n d V e l o c i t y - E Q
100 10 1 10 2
F r e q ( H Z )
-8.0
0-7
.00
-6.0
0-5
.00
Ex
cit
ati
on
at
40
km
-4.0
0-3
.00
F i l t e r e d G r o u n d V e l o c i t y - E Q
100 10 1 10 2
F r e q ( H Z )
-8.0
0-7
.00
-6.0
0-5
.00
Ex
cit
ati
on
at
40
km
-4.0
0-3
.00
F i l t e r e d G r o u n d V e l o c i t y - E Q
100 10 1 10 2
F r e q ( H Z )
-8.0
0-7
.00
-6.0
0-5
.00
Ex
cit
ati
on
at
40
km
-4.0
0-3
.00
F i l t e r e d G r o u n d V e l o c i t y - E Q
100 10 1 10 2
F r e q ( H Z )
-8.0
0-7
.00
-6.0
0-5
.00
Ex
cit
ati
on
at
40
km
-4.0
0-3
.00
F i l t e r e d G r o u n d V e l o c i t y - E Q
100 10 1 10 2
F r e q ( H Z )
-8.0
0-7
.00
-6.0
0-5
.00
Ex
cit
ati
on
at
40
km
-4.0
0-3
.00
F i l t e r e d G r o u n d V e l o c i t y - E Q
100 10 1 10 2
F r e q ( H Z )
-8.0
0-7
.00
-6.0
0-5
.00
Ex
cit
ati
on
at
40
km
-4.0
0-3
.00
F i l t e r e d G r o u n d V e l o c i t y - E Q
100 10 1 10 2
F r e q ( H Z )
-8.0
0-7
.00
-6.0
0-5
.00
Ex
cit
ati
on
at
40
km
-4.0
0-3
.00
F i l t e r e d G r o u n d V e l o c i t y - E Q
100 10 1 10 2
F r e q ( H Z )
-8.0
0-7
.00
-6.0
0-5
.00
Ex
cit
ati
on
at
40
km
-4.0
0-3
.00
F i l t e r e d G r o u n d V e l o c i t y - E Q
100 10 1 10 2
F r e q ( H Z )
-8.0
0-7
.00
-6.0
0-5
.00
Ex
cit
ati
on
at
40
km
-4.0
0-3
.00
F i l t e r e d G r o u n d V e l o c i t y - E Q
100 10 1 10 2
F r e q ( H Z )
-8.0
0-7
.00
-6.0
0-5
.00
Ex
cit
ati
on
at
40
km
-4.0
0-3
.00
F i l t e r e d G r o u n d V e l o c i t y - E Q
100 10 1 10 2
F r e q ( H Z )
-8.0
0-7
.00
-6.0
0-5
.00
Ex
cit
ati
on
at
40
km
-4.0
0-3
.00
F i l t e r e d G r o u n d V e l o c i t y - E Q
100 10 1 10 2
F r e q ( H Z )
-8.0
0-7
.00
-6.0
0-5
.00
Ex
cit
ati
on
at
40
km
-4.0
0-3
.00
F i l t e r e d G r o u n d V e l o c i t y - E Q
100 10 1 10 2
F r e q ( H Z )
-8.0
0-7
.00
-6.0
0-5
.00
Ex
cit
ati
on
at
40
km
-4.0
0-3
.00
F i l t e r e d G r o u n d V e l o c i t y - E Q
100 10 1 10 2
F r e q ( H Z )
-8.0
0-7
.00
-6.0
0-5
.00
Ex
cit
ati
on
at
40
km
-4.0
0-3
.00
F i l t e r e d G r o u n d V e l o c i t y - E Q
100 10 1 10 2
F r e q ( H Z )
-8.0
0-7
.00
-6.0
0-5
.00
Ex
cit
ati
on
at
40
km
-4.0
0-3
.00
F i l t e r e d G r o u n d V e l o c i t y - E Q
100 10 1 10 2
F r e q ( H Z )
-8.0
0-7
.00
-6.0
0-5
.00
Ex
cit
ati
on
at
40
km
-4.0
0-3
.00
F i l t e r e d G r o u n d V e l o c i t y - E Q
100 10 1 10 2
F r e q ( H Z )
-8.0
0-7
.00
-6.0
0-5
.00
Ex
cit
ati
on
at
40
km
-4.0
0-3
.00
F i l t e r e d G r o u n d V e l o c i t y - E Q
100 10 1 10 2
F r e q ( H Z )
-8.0
0-7
.00
-6.0
0-5
.00
Ex
cit
ati
on
at
40
km
-4.0
0-3
.00
F i l t e r e d G r o u n d V e l o c i t y - E Q
100 10 1 10 2
F r e q ( H Z )
-8.0
0-7
.00
-6.0
0-5
.00
Ex
cit
ati
on
at
40
km
-4.0
0-3
.00
F i l t e r e d G r o u n d V e l o c i t y - E Q
100 10 1 10 2
F r e q ( H Z )
-8.0
0-7
.00
-6.0
0-5
.00
Ex
cit
ati
on
at
40
km
-4.0
0-3
.00
F i l t e r e d G r o u n d V e l o c i t y - E Q
100 10 1 10 2
F r e q ( H Z )
-8.0
0-7
.00
-6.0
0-5
.00
Ex
cit
ati
on
at
40
km
-4.0
0-3
.00
F i l t e r e d G r o u n d V e l o c i t y - E Q
100 10 1 10 2
F r e q ( H Z )
-8.0
0-7
.00
-6.0
0-5
.00
Ex
cit
ati
on
at
40
km
-4.0
0-3
.00
F i l t e r e d G r o u n d V e l o c i t y - E Q
100 10 1 10 2
F r e q ( H Z )
-8.0
0-7
.00
-6.0
0-5
.00
Ex
cit
ati
on
at
40
km
-4.0
0-3
.00
F i l t e r e d G r o u n d V e l o c i t y - E Q
100 10 1 10 2
F r e q ( H Z )
-8.0
0-7
.00
-6.0
0-5
.00
Ex
cit
ati
on
at
40
km
-4.0
0-3
.00
F i l t e r e d G r o u n d V e l o c i t y - E Q
100 10 1 10 2
F r e q ( H Z )
-8.0
0-7
.00
-6.0
0-5
.00
Ex
cit
ati
on
at
40
km
-4.0
0-3
.00
F i l t e r e d G r o u n d V e l o c i t y - E Q
100 10 1 10 2
F r e q ( H Z )
-8.0
0-7
.00
-6.0
0-5
.00
Ex
cit
ati
on
at
40
km
-4.0
0-3
.00
F i l t e r e d G r o u n d V e l o c i t y - E Q
100 10 1 10 2
F r e q ( H Z )
-8.0
0-7
.00
-6.0
0-5
.00
Ex
cit
ati
on
at
40
km
-4.0
0-3
.00
F i l t e r e d G r o u n d V e l o c i t y - E Q
100 10 1 10 2
F r e q ( H Z )
-8.0
0-7
.00
-6.0
0-5
.00
Ex
cit
ati
on
at
40
km
-4.0
0-3
.00
F i l t e r e d G r o u n d V e l o c i t y - E Q
100 10 1 10 2
F r e q ( H Z )
-8.0
0-7
.00
-6.0
0-5
.00
Ex
cit
ati
on
at
40
km
-4.0
0-3
.00
F i l t e r e d G r o u n d V e l o c i t y - E Q
100 10 1 10 2
F r e q ( H Z )
-8.0
0-7
.00
-6.0
0-5
.00
Ex
cit
ati
on
at
40
km
-4.0
0-3
.00
F i l t e r e d G r o u n d V e l o c i t y - E Q
100 10 1 10 2
F r e q ( H Z )
-8.0
0-7
.00
-6.0
0-5
.00
Ex
cit
ati
on
at
40
km
-4.0
0-3
.00
F i l t e r e d G r o u n d V e l o c i t y - E Q
100 10 1 10 2
F r e q ( H Z )
-8.0
0-7
.00
-6.0
0-5
.00
Ex
cit
ati
on
at
40
km
-4.0
0-3
.00
Band Pass Peak Ampl i tude
100 10 1 10 2
F r e q ( H Z )
-8.0
0-7
.00
-6.0
0-5
.00
Ex
cit
ati
on
at
40
km
-4.0
0-3
.00
Band Pass Peak Ampl i tude
100 10 1 10 2
F r e q ( H Z )
-8.0
0-7
.00
-6.0
0-5
.00
Ex
cit
ati
on
at
40
km
-4.0
0-3
.00
Band Pass Peak Ampl i tude
100 10 1 10 2
F r e q ( H Z )
-8.0
0-7
.00
-6.0
0-5
.00
Ex
cit
ati
on
at
40
km
-4.0
0-3
.00
Band Pass Peak Ampl i tude
100 10 1 10 2
F r e q ( H Z )
-8.0
0-7
.00
-6.0
0-5
.00
Ex
cit
ati
on
at
40
km
-4.0
0-3
.00
Band Pass Peak Ampl i tude
100 10 1 10 2
F r e q ( H Z )
-8.0
0-7
.00
-6.0
0-5
.00
Ex
cit
ati
on
at
40
km
-4.0
0-3
.00
Band Pass Peak Ampl i tude
Mw=4.5
Mw=4.0
Mw=3.5
Mw=3.0
Mw=2.5
Mw=2.0
RED - THEO
BLACK - Data
Figure 4.12: Excitation of peak filtered velocity at 40 km (Model B). Thethick dash curve is the prediction of the 400 bar constant stress dropsource model. E is the log � � of the peak filtered velocity spectra in �
�������.

79
0 . 0 0 5 . 0 0 1 0 . 0 0F r e q ( H Z )
1 5 . 0 0 2 0 . 0 0
-8.0
0-7
.00
-6.0
0-5
.00
Ex
cit
ati
on
at
40
km
-4.0
0-3
.00
F i l t e r e d G r o u n d V e l o c i t y
0 . 0 0 5 . 0 0 1 0 . 0 0F r e q ( H Z )
1 5 . 0 0 2 0 . 0 0
-8.0
0-7
.00
-6.0
0-5
.00
Ex
cit
ati
on
at
40
km
-4.0
0-3
.00
F i l t e r e d G r o u n d V e l o c i t y
0 . 0 0 5 . 0 0 1 0 . 0 0F r e q ( H Z )
1 5 . 0 0 2 0 . 0 0
-8.0
0-7
.00
-6.0
0-5
.00
Ex
cit
ati
on
at
40
km
-4.0
0-3
.00
F i l t e r e d G r o u n d V e l o c i t y
0 . 0 0 5 . 0 0 1 0 . 0 0F r e q ( H Z )
1 5 . 0 0 2 0 . 0 0
-8.0
0-7
.00
-6.0
0-5
.00
Ex
cit
ati
on
at
40
km
-4.0
0-3
.00
F i l t e r e d G r o u n d V e l o c i t y
0 . 0 0 5 . 0 0 1 0 . 0 0F r e q ( H Z )
1 5 . 0 0 2 0 . 0 0
-8.0
0-7
.00
-6.0
0-5
.00
Ex
cit
ati
on
at
40
km
-4.0
0-3
.00
F i l t e r e d G r o u n d V e l o c i t y
0 . 0 0 5 . 0 0 1 0 . 0 0F r e q ( H Z )
1 5 . 0 0 2 0 . 0 0
-8.0
0-7
.00
-6.0
0-5
.00
Ex
cit
ati
on
at
40
km
-4.0
0-3
.00
F i l t e r e d G r o u n d V e l o c i t y
0 . 0 0 5 . 0 0 1 0 . 0 0F r e q ( H Z )
1 5 . 0 0 2 0 . 0 0
-8.0
0-7
.00
-6.0
0-5
.00
Ex
cit
ati
on
at
40
km
-4.0
0-3
.00
F i l t e r e d G r o u n d V e l o c i t y
0 . 0 0 5 . 0 0 1 0 . 0 0F r e q ( H Z )
1 5 . 0 0 2 0 . 0 0
-8.0
0-7
.00
-6.0
0-5
.00
Ex
cit
ati
on
at
40
km
-4.0
0-3
.00
F i l t e r e d G r o u n d V e l o c i t y
0 . 0 0 5 . 0 0 1 0 . 0 0F r e q ( H Z )
1 5 . 0 0 2 0 . 0 0
-8.0
0-7
.00
-6.0
0-5
.00
Ex
cit
ati
on
at
40
km
-4.0
0-3
.00
F i l t e r e d G r o u n d V e l o c i t y
0 . 0 0 5 . 0 0 1 0 . 0 0F r e q ( H Z )
1 5 . 0 0 2 0 . 0 0
-8.0
0-7
.00
-6.0
0-5
.00
Ex
cit
ati
on
at
40
km
-4.0
0-3
.00
F i l t e r e d G r o u n d V e l o c i t y
0 . 0 0 5 . 0 0 1 0 . 0 0F r e q ( H Z )
1 5 . 0 0 2 0 . 0 0
-8.0
0-7
.00
-6.0
0-5
.00
Ex
cit
ati
on
at
40
km
-4.0
0-3
.00
F i l t e r e d G r o u n d V e l o c i t y
0 . 0 0 5 . 0 0 1 0 . 0 0F r e q ( H Z )
1 5 . 0 0 2 0 . 0 0
-8.0
0-7
.00
-6.0
0-5
.00
Ex
cit
ati
on
at
40
km
-4.0
0-3
.00
F i l t e r e d G r o u n d V e l o c i t y
0 . 0 0 5 . 0 0 1 0 . 0 0F r e q ( H Z )
1 5 . 0 0 2 0 . 0 0
-8.0
0-7
.00
-6.0
0-5
.00
Ex
cit
ati
on
at
40
km
-4.0
0-3
.00
F i l t e r e d G r o u n d V e l o c i t y
0 . 0 0 5 . 0 0 1 0 . 0 0F r e q ( H Z )
1 5 . 0 0 2 0 . 0 0
-8.0
0-7
.00
-6.0
0-5
.00
Ex
cit
ati
on
at
40
km
-4.0
0-3
.00
F i l t e r e d G r o u n d V e l o c i t y
0 . 0 0 5 . 0 0 1 0 . 0 0F r e q ( H Z )
1 5 . 0 0 2 0 . 0 0
-8.0
0-7
.00
-6.0
0-5
.00
Ex
cit
ati
on
at
40
km
-4.0
0-3
.00
F i l t e r e d G r o u n d V e l o c i t y
0 . 0 0 5 . 0 0 1 0 . 0 0F r e q ( H Z )
1 5 . 0 0 2 0 . 0 0
-8.0
0-7
.00
-6.0
0-5
.00
Ex
cit
ati
on
at
40
km
-4.0
0-3
.00
F i l t e r e d G r o u n d V e l o c i t y
0 . 0 0 5 . 0 0 1 0 . 0 0F r e q ( H Z )
1 5 . 0 0 2 0 . 0 0
-8.0
0-7
.00
-6.0
0-5
.00
Ex
cit
ati
on
at
40
km
-4.0
0-3
.00
F i l t e r e d G r o u n d V e l o c i t y
0 . 0 0 5 . 0 0 1 0 . 0 0F r e q ( H Z )
1 5 . 0 0 2 0 . 0 0
-8.0
0-7
.00
-6.0
0-5
.00
Ex
cit
ati
on
at
40
km
-4.0
0-3
.00
F i l t e r e d G r o u n d V e l o c i t y
0 . 0 0 5 . 0 0 1 0 . 0 0F r e q ( H Z )
1 5 . 0 0 2 0 . 0 0
-8.0
0-7
.00
-6.0
0-5
.00
Ex
cit
ati
on
at
40
km
-4.0
0-3
.00
F i l t e r e d G r o u n d V e l o c i t y
0 . 0 0 5 . 0 0 1 0 . 0 0F r e q ( H Z )
1 5 . 0 0 2 0 . 0 0
-8.0
0-7
.00
-6.0
0-5
.00
Ex
cit
ati
on
at
40
km
-4.0
0-3
.00
F i l t e r e d G r o u n d V e l o c i t y
0 . 0 0 5 . 0 0 1 0 . 0 0F r e q ( H Z )
1 5 . 0 0 2 0 . 0 0
-8.0
0-7
.00
-6.0
0-5
.00
Ex
cit
ati
on
at
40
km
-4.0
0-3
.00
F i l t e r e d G r o u n d V e l o c i t y
0 . 0 0 5 . 0 0 1 0 . 0 0F r e q ( H Z )
1 5 . 0 0 2 0 . 0 0
-8.0
0-7
.00
-6.0
0-5
.00
Ex
cit
ati
on
at
40
km
-4.0
0-3
.00
F i l t e r e d G r o u n d V e l o c i t y
0 . 0 0 5 . 0 0 1 0 . 0 0F r e q ( H Z )
1 5 . 0 0 2 0 . 0 0
-8.0
0-7
.00
-6.0
0-5
.00
Ex
cit
ati
on
at
40
km
-4.0
0-3
.00
F i l t e r e d G r o u n d V e l o c i t y
0 . 0 0 5 . 0 0 1 0 . 0 0F r e q ( H Z )
1 5 . 0 0 2 0 . 0 0
-8.0
0-7
.00
-6.0
0-5
.00
Ex
cit
ati
on
at
40
km
-4.0
0-3
.00
F i l t e r e d G r o u n d V e l o c i t y
0 . 0 0 5 . 0 0 1 0 . 0 0F r e q ( H Z )
1 5 . 0 0 2 0 . 0 0
-8.0
0-7
.00
-6.0
0-5
.00
Ex
cit
ati
on
at
40
km
-4.0
0-3
.00
F i l t e r e d G r o u n d V e l o c i t y
0 . 0 0 5 . 0 0 1 0 . 0 0F r e q ( H Z )
1 5 . 0 0 2 0 . 0 0
-8.0
0-7
.00
-6.0
0-5
.00
Ex
cit
ati
on
at
40
km
-4.0
0-3
.00
F i l t e r e d G r o u n d V e l o c i t y
0 . 0 0 5 . 0 0 1 0 . 0 0F r e q ( H Z )
1 5 . 0 0 2 0 . 0 0
-8.0
0-7
.00
-6.0
0-5
.00
Ex
cit
ati
on
at
40
km
-4.0
0-3
.00
F i l t e r e d G r o u n d V e l o c i t y
0 . 0 0 5 . 0 0 1 0 . 0 0F r e q ( H Z )
1 5 . 0 0 2 0 . 0 0
-8.0
0-7
.00
-6.0
0-5
.00
Ex
cit
ati
on
at
40
km
-4.0
0-3
.00
F i l t e r e d G r o u n d V e l o c i t y
0 . 0 0 5 . 0 0 1 0 . 0 0F r e q ( H Z )
1 5 . 0 0 2 0 . 0 0
-8.0
0-7
.00
-6.0
0-5
.00
Ex
cit
ati
on
at
40
km
-4.0
0-3
.00
F i l t e r e d G r o u n d V e l o c i t y
0 . 0 0 5 . 0 0 1 0 . 0 0F r e q ( H Z )
1 5 . 0 0 2 0 . 0 0
-8.0
0-7
.00
-6.0
0-5
.00
Ex
cit
ati
on
at
40
km
-4.0
0-3
.00
F i l t e r e d G r o u n d V e l o c i t y
0 . 0 0 5 . 0 0 1 0 . 0 0F r e q ( H Z )
1 5 . 0 0 2 0 . 0 0
-8.0
0-7
.00
-6.0
0-5
.00
Ex
cit
ati
on
at
40
km
-4.0
0-3
.00
F i l t e r e d G r o u n d V e l o c i t y
0 . 0 0 5 . 0 0 1 0 . 0 0F r e q ( H Z )
1 5 . 0 0 2 0 . 0 0
-8.0
0-7
.00
-6.0
0-5
.00
Ex
cit
ati
on
at
40
km
-4.0
0-3
.00
F i l t e r e d G r o u n d V e l o c i t y
0 . 0 0 5 . 0 0 1 0 . 0 0F r e q ( H Z )
1 5 . 0 0 2 0 . 0 0
-8.0
0-7
.00
-6.0
0-5
.00
Ex
cit
ati
on
at
40
km
-4.0
0-3
.00
F i l t e r e d G r o u n d V e l o c i t y
0 . 0 0 5 . 0 0 1 0 . 0 0F r e q ( H Z )
1 5 . 0 0 2 0 . 0 0
-8.0
0-7
.00
-6.0
0-5
.00
Ex
cit
ati
on
at
40
km
-4.0
0-3
.00
F i l t e r e d G r o u n d V e l o c i t y
0 . 0 0 5 . 0 0 1 0 . 0 0F r e q ( H Z )
1 5 . 0 0 2 0 . 0 0
-8.0
0-7
.00
-6.0
0-5
.00
Ex
cit
ati
on
at
40
km
-4.0
0-3
.00
F i l t e r e d G r o u n d V e l o c i t y
0 . 0 0 5 . 0 0 1 0 . 0 0F r e q ( H Z )
1 5 . 0 0 2 0 . 0 0
-8.0
0-7
.00
-6.0
0-5
.00
Ex
cit
ati
on
at
40
km
-4.0
0-3
.00
F i l t e r e d G r o u n d V e l o c i t y
0 . 0 0 5 . 0 0 1 0 . 0 0F r e q ( H Z )
1 5 . 0 0 2 0 . 0 0
-8.0
0-7
.00
-6.0
0-5
.00
Ex
cit
ati
on
at
40
km
-4.0
0-3
.00
F i l t e r e d G r o u n d V e l o c i t y
0 . 0 0 5 . 0 0 1 0 . 0 0F r e q ( H Z )
1 5 . 0 0 2 0 . 0 0
-8.0
0-7
.00
-6.0
0-5
.00
Ex
cit
ati
on
at
40
km
-4.0
0-3
.00
F i l t e r e d G r o u n d V e l o c i t y
0 . 0 0 5 . 0 0 1 0 . 0 0F r e q ( H Z )
1 5 . 0 0 2 0 . 0 0
-8.0
0-7
.00
-6.0
0-5
.00
Ex
cit
ati
on
at
40
km
-4.0
0-3
.00
F i l t e r e d G r o u n d V e l o c i t y
0 . 0 0 5 . 0 0 1 0 . 0 0F r e q ( H Z )
1 5 . 0 0 2 0 . 0 0
-8.0
0-7
.00
-6.0
0-5
.00
Ex
cit
ati
on
at
40
km
-4.0
0-3
.00
F i l t e r e d G r o u n d V e l o c i t y
0 . 0 0 5 . 0 0 1 0 . 0 0F r e q ( H Z )
1 5 . 0 0 2 0 . 0 0
-8.0
0-7
.00
-6.0
0-5
.00
Ex
cit
ati
on
at
40
km
-4.0
0-3
.00
F i l t e r e d G r o u n d V e l o c i t y
0 . 0 0 5 . 0 0 1 0 . 0 0F r e q ( H Z )
1 5 . 0 0 2 0 . 0 0
-8.0
0-7
.00
-6.0
0-5
.00
Ex
cit
ati
on
at
40
km
-4.0
0-3
.00
F i l t e r e d G r o u n d V e l o c i t y
0 . 0 0 5 . 0 0 1 0 . 0 0F r e q ( H Z )
1 5 . 0 0 2 0 . 0 0
-8.0
0-7
.00
-6.0
0-5
.00
Ex
cit
ati
on
at
40
km
-4.0
0-3
.00
F i l t e r e d G r o u n d V e l o c i t y
0 . 0 0 5 . 0 0 1 0 . 0 0F r e q ( H Z )
1 5 . 0 0 2 0 . 0 0
-8.0
0-7
.00
-6.0
0-5
.00
Ex
cit
ati
on
at
40
km
-4.0
0-3
.00
F i l t e r e d G r o u n d V e l o c i t y
0 . 0 0 5 . 0 0 1 0 . 0 0F r e q ( H Z )
1 5 . 0 0 2 0 . 0 0
-8.0
0-7
.00
-6.0
0-5
.00
Ex
cit
ati
on
at
40
km
-4.0
0-3
.00
F i l t e r e d G r o u n d V e l o c i t y
0 . 0 0 5 . 0 0 1 0 . 0 0F r e q ( H Z )
1 5 . 0 0 2 0 . 0 0
-8.0
0-7
.00
-6.0
0-5
.00
Ex
cit
ati
on
at
40
km
-4.0
0-3
.00
F i l t e r e d G r o u n d V e l o c i t y
0 . 0 0 5 . 0 0 1 0 . 0 0F r e q ( H Z )
1 5 . 0 0 2 0 . 0 0
-8.0
0-7
.00
-6.0
0-5
.00
Ex
cit
ati
on
at
40
km
-4.0
0-3
.00
F i l t e r e d G r o u n d V e l o c i t y
0 . 0 0 5 . 0 0 1 0 . 0 0F r e q ( H Z )
1 5 . 0 0 2 0 . 0 0
-8.0
0-7
.00
-6.0
0-5
.00
Ex
cit
ati
on
at
40
km
-4.0
0-3
.00
F i l t e r e d G r o u n d V e l o c i t y
0 . 0 0 5 . 0 0 1 0 . 0 0F r e q ( H Z )
1 5 . 0 0 2 0 . 0 0
-8.0
0-7
.00
-6.0
0-5
.00
Ex
cit
ati
on
at
40
km
-4.0
0-3
.00
F i l t e r e d G r o u n d V e l o c i t y
0 . 0 0 5 . 0 0 1 0 . 0 0F r e q ( H Z )
1 5 . 0 0 2 0 . 0 0
-8.0
0-7
.00
-6.0
0-5
.00
Ex
cit
ati
on
at
40
km
-4.0
0-3
.00
F i l t e r e d G r o u n d V e l o c i t y
0 . 0 0 5 . 0 0 1 0 . 0 0F r e q ( H Z )
1 5 . 0 0 2 0 . 0 0
-8.0
0-7
.00
-6.0
0-5
.00
Ex
cit
ati
on
at
40
km
-4.0
0-3
.00
F i l t e r e d G r o u n d V e l o c i t y
0 . 0 0 5 . 0 0 1 0 . 0 0F r e q ( H Z )
1 5 . 0 0 2 0 . 0 0
-8.0
0-7
.00
-6.0
0-5
.00
Ex
cit
ati
on
at
40
km
-4.0
0-3
.00
F i l t e r e d G r o u n d V e l o c i t y
0 . 0 0 5 . 0 0 1 0 . 0 0F r e q ( H Z )
1 5 . 0 0 2 0 . 0 0
-8.0
0-7
.00
-6.0
0-5
.00
Ex
cit
ati
on
at
40
km
-4.0
0-3
.00
F i l t e r e d G r o u n d V e l o c i t y
0 . 0 0 5 . 0 0 1 0 . 0 0F r e q ( H Z )
1 5 . 0 0 2 0 . 0 0
-8.0
0-7
.00
-6.0
0-5
.00
Ex
cit
ati
on
at
40
km
-4.0
0-3
.00
F i l t e r e d G r o u n d V e l o c i t y
0 . 0 0 5 . 0 0 1 0 . 0 0F r e q ( H Z )
1 5 . 0 0 2 0 . 0 0
-8.0
0-7
.00
-6.0
0-5
.00
Ex
cit
ati
on
at
40
km
-4.0
0-3
.00
F i l t e r e d G r o u n d V e l o c i t y
0 . 0 0 5 . 0 0 1 0 . 0 0F r e q ( H Z )
1 5 . 0 0 2 0 . 0 0
-8.0
0-7
.00
-6.0
0-5
.00
Ex
cit
ati
on
at
40
km
-4.0
0-3
.00
F i l t e r e d G r o u n d V e l o c i t y
0 . 0 0 5 . 0 0 1 0 . 0 0F r e q ( H Z )
1 5 . 0 0 2 0 . 0 0
-8.0
0-7
.00
-6.0
0-5
.00
Ex
cit
ati
on
at
40
km
-4.0
0-3
.00
F i l t e r e d G r o u n d V e l o c i t y
0 . 0 0 5 . 0 0 1 0 . 0 0F r e q ( H Z )
1 5 . 0 0 2 0 . 0 0
-8.0
0-7
.00
-6.0
0-5
.00
Ex
cit
ati
on
at
40
km
-4.0
0-3
.00
F i l t e r e d G r o u n d V e l o c i t y
0 . 0 0 5 . 0 0 1 0 . 0 0F r e q ( H Z )
1 5 . 0 0 2 0 . 0 0
-8.0
0-7
.00
-6.0
0-5
.00
Ex
cit
ati
on
at
40
km
-4.0
0-3
.00
F i l t e r e d G r o u n d V e l o c i t y
0 . 0 0 5 . 0 0 1 0 . 0 0F r e q ( H Z )
1 5 . 0 0 2 0 . 0 0
-8.0
0-7
.00
-6.0
0-5
.00
Ex
cit
ati
on
at
40
km
-4.0
0-3
.00
F i l t e r e d G r o u n d V e l o c i t y
0 . 0 0 5 . 0 0 1 0 . 0 0F r e q ( H Z )
1 5 . 0 0 2 0 . 0 0
-8.0
0-7
.00
-6.0
0-5
.00
Ex
cit
ati
on
at
40
km
-4.0
0-3
.00
F i l t e r e d G r o u n d V e l o c i t y
0 . 0 0 5 . 0 0 1 0 . 0 0F r e q ( H Z )
1 5 . 0 0 2 0 . 0 0
-8.0
0-7
.00
-6.0
0-5
.00
Ex
cit
ati
on
at
40
km
-4.0
0-3
.00
F i l t e r e d G r o u n d V e l o c i t y
0 . 0 0 5 . 0 0 1 0 . 0 0F r e q ( H Z )
1 5 . 0 0 2 0 . 0 0
-8.0
0-7
.00
-6.0
0-5
.00
Ex
cit
ati
on
at
40
km
-4.0
0-3
.00
F i l t e r e d G r o u n d V e l o c i t y
0 . 0 0 5 . 0 0 1 0 . 0 0F r e q ( H Z )
1 5 . 0 0 2 0 . 0 0
-8.0
0-7
.00
-6.0
0-5
.00
Ex
cit
ati
on
at
40
km
-4.0
0-3
.00
F i l t e r e d G r o u n d V e l o c i t y
0 . 0 0 5 . 0 0 1 0 . 0 0F r e q ( H Z )
1 5 . 0 0 2 0 . 0 0
-8.0
0-7
.00
-6.0
0-5
.00
Ex
cit
ati
on
at
40
km
-4.0
0-3
.00
F i l t e r e d G r o u n d V e l o c i t y
0 . 0 0 5 . 0 0 1 0 . 0 0F r e q ( H Z )
1 5 . 0 0 2 0 . 0 0
-8.0
0-7
.00
-6.0
0-5
.00
Ex
cit
ati
on
at
40
km
-4.0
0-3
.00
F i l t e r e d G r o u n d V e l o c i t y
0 . 0 0 5 . 0 0 1 0 . 0 0F r e q ( H Z )
1 5 . 0 0 2 0 . 0 0
-8.0
0-7
.00
-6.0
0-5
.00
Ex
cit
ati
on
at
40
km
-4.0
0-3
.00
F i l t e r e d G r o u n d V e l o c i t y
0 . 0 0 5 . 0 0 1 0 . 0 0F r e q ( H Z )
1 5 . 0 0 2 0 . 0 0
-8.0
0-7
.00
-6.0
0-5
.00
Ex
cit
ati
on
at
40
km
-4.0
0-3
.00
F i l t e r e d G r o u n d V e l o c i t y
0 . 0 0 5 . 0 0 1 0 . 0 0F r e q ( H Z )
1 5 . 0 0 2 0 . 0 0
-8.0
0-7
.00
-6.0
0-5
.00
Ex
cit
ati
on
at
40
km
-4.0
0-3
.00
F i l t e r e d G r o u n d V e l o c i t y
0 . 0 0 5 . 0 0 1 0 . 0 0F r e q ( H Z )
1 5 . 0 0 2 0 . 0 0
-8.0
0-7
.00
-6.0
0-5
.00
Ex
cit
ati
on
at
40
km
-4.0
0-3
.00
F i l t e r e d G r o u n d V e l o c i t y
0 . 0 0 5 . 0 0 1 0 . 0 0F r e q ( H Z )
1 5 . 0 0 2 0 . 0 0
-8.0
0-7
.00
-6.0
0-5
.00
Ex
cit
ati
on
at
40
km
-4.0
0-3
.00
F i l t e r e d G r o u n d V e l o c i t y
0 . 0 0 5 . 0 0 1 0 . 0 0F r e q ( H Z )
1 5 . 0 0 2 0 . 0 0
-8.0
0-7
.00
-6.0
0-5
.00
Ex
cit
ati
on
at
40
km
-4.0
0-3
.00
F i l t e r e d G r o u n d V e l o c i t y
0 . 0 0 5 . 0 0 1 0 . 0 0F r e q ( H Z )
1 5 . 0 0 2 0 . 0 0
-8.0
0-7
.00
-6.0
0-5
.00
Ex
cit
ati
on
at
40
km
-4.0
0-3
.00
F i l t e r e d G r o u n d V e l o c i t y
0 . 0 0 5 . 0 0 1 0 . 0 0F r e q ( H Z )
1 5 . 0 0 2 0 . 0 0
-8.0
0-7
.00
-6.0
0-5
.00
Ex
cit
ati
on
at
40
km
-4.0
0-3
.00
F i l t e r e d G r o u n d V e l o c i t y
0 . 0 0 5 . 0 0 1 0 . 0 0F r e q ( H Z )
1 5 . 0 0 2 0 . 0 0
-8.0
0-7
.00
-6.0
0-5
.00
Ex
cit
ati
on
at
40
km
-4.0
0-3
.00
F i l t e r e d G r o u n d V e l o c i t y
0 . 0 0 5 . 0 0 1 0 . 0 0F r e q ( H Z )
1 5 . 0 0 2 0 . 0 0
-8.0
0-7
.00
-6.0
0-5
.00
Ex
cit
ati
on
at
40
km
-4.0
0-3
.00
F i l t e r e d G r o u n d V e l o c i t y
0 . 0 0 5 . 0 0 1 0 . 0 0F r e q ( H Z )
1 5 . 0 0 2 0 . 0 0
-8.0
0-7
.00
-6.0
0-5
.00
Ex
cit
ati
on
at
40
km
-4.0
0-3
.00
F i l t e r e d G r o u n d V e l o c i t y
0 . 0 0 5 . 0 0 1 0 . 0 0F r e q ( H Z )
1 5 . 0 0 2 0 . 0 0
-8.0
0-7
.00
-6.0
0-5
.00
Ex
cit
ati
on
at
40
km
-4.0
0-3
.00
F i l t e r e d G r o u n d V e l o c i t y
0 . 0 0 5 . 0 0 1 0 . 0 0F r e q ( H Z )
1 5 . 0 0 2 0 . 0 0
-8.0
0-7
.00
-6.0
0-5
.00
Ex
cit
ati
on
at
40
km
-4.0
0-3
.00
F i l t e r e d G r o u n d V e l o c i t y
0 . 0 0 5 . 0 0 1 0 . 0 0F r e q ( H Z )
1 5 . 0 0 2 0 . 0 0
-8.0
0-7
.00
-6.0
0-5
.00
Ex
cit
ati
on
at
40
km
-4.0
0-3
.00
F i l t e r e d G r o u n d V e l o c i t y
0 . 0 0 5 . 0 0 1 0 . 0 0F r e q ( H Z )
1 5 . 0 0 2 0 . 0 0
-8.0
0-7
.00
-6.0
0-5
.00
Ex
cit
ati
on
at
40
km
-4.0
0-3
.00
F i l t e r e d G r o u n d V e l o c i t y
0 . 0 0 5 . 0 0 1 0 . 0 0F r e q ( H Z )
1 5 . 0 0 2 0 . 0 0
-8.0
0-7
.00
-6.0
0-5
.00
Ex
cit
ati
on
at
40
km
-4.0
0-3
.00
F i l t e r e d G r o u n d V e l o c i t y
0 . 0 0 5 . 0 0 1 0 . 0 0F r e q ( H Z )
1 5 . 0 0 2 0 . 0 0
-8.0
0-7
.00
-6.0
0-5
.00
Ex
cit
ati
on
at
40
km
-4.0
0-3
.00
F i l t e r e d G r o u n d V e l o c i t y
0 . 0 0 5 . 0 0 1 0 . 0 0F r e q ( H Z )
1 5 . 0 0 2 0 . 0 0
-8.0
0-7
.00
-6.0
0-5
.00
Ex
cit
ati
on
at
40
km
-4.0
0-3
.00
F i l t e r e d G r o u n d V e l o c i t y
0 . 0 0 5 . 0 0 1 0 . 0 0F r e q ( H Z )
1 5 . 0 0 2 0 . 0 0
-8.0
0-7
.00
-6.0
0-5
.00
Ex
cit
ati
on
at
40
km
-4.0
0-3
.00
F i l t e r e d G r o u n d V e l o c i t y
0 . 0 0 5 . 0 0 1 0 . 0 0F r e q ( H Z )
1 5 . 0 0 2 0 . 0 0
-8.0
0-7
.00
-6.0
0-5
.00
Ex
cit
ati
on
at
40
km
-4.0
0-3
.00
F i l t e r e d G r o u n d V e l o c i t y
0 . 0 0 5 . 0 0 1 0 . 0 0F r e q ( H Z )
1 5 . 0 0 2 0 . 0 0
-8.0
0-7
.00
-6.0
0-5
.00
Ex
cit
ati
on
at
40
km
-4.0
0-3
.00
F i l t e r e d G r o u n d V e l o c i t y
0 . 0 0 5 . 0 0 1 0 . 0 0F r e q ( H Z )
1 5 . 0 0 2 0 . 0 0
-8.0
0-7
.00
-6.0
0-5
.00
Ex
cit
ati
on
at
40
km
-4.0
0-3
.00
F i l t e r e d G r o u n d V e l o c i t y
0 . 0 0 5 . 0 0 1 0 . 0 0F r e q ( H Z )
1 5 . 0 0 2 0 . 0 0
-8.0
0-7
.00
-6.0
0-5
.00
Ex
cit
ati
on
at
40
km
-4.0
0-3
.00
F i l t e r e d G r o u n d V e l o c i t y
0 . 0 0 5 . 0 0 1 0 . 0 0F r e q ( H Z )
1 5 . 0 0 2 0 . 0 0
-8.0
0-7
.00
-6.0
0-5
.00
Ex
cit
ati
on
at
40
km
-4.0
0-3
.00
F i l t e r e d G r o u n d V e l o c i t y
0 . 0 0 5 . 0 0 1 0 . 0 0F r e q ( H Z )
1 5 . 0 0 2 0 . 0 0
-8.0
0-7
.00
-6.0
0-5
.00
Ex
cit
ati
on
at
40
km
-4.0
0-3
.00
F i l t e r e d G r o u n d V e l o c i t y
0 . 0 0 5 . 0 0 1 0 . 0 0F r e q ( H Z )
1 5 . 0 0 2 0 . 0 0
-8.0
0-7
.00
-6.0
0-5
.00
Ex
cit
ati
on
at
40
km
-4.0
0-3
.00
F i l t e r e d G r o u n d V e l o c i t y
0 . 0 0 5 . 0 0 1 0 . 0 0F r e q ( H Z )
1 5 . 0 0 2 0 . 0 0
-8.0
0-7
.00
-6.0
0-5
.00
Ex
cit
ati
on
at
40
km
-4.0
0-3
.00
F i l t e r e d G r o u n d V e l o c i t y
0 . 0 0 5 . 0 0 1 0 . 0 0F r e q ( H Z )
1 5 . 0 0 2 0 . 0 0
-8.0
0-7
.00
-6.0
0-5
.00
Ex
cit
ati
on
at
40
km
-4.0
0-3
.00
F i l t e r e d G r o u n d V e l o c i t y
0 . 0 0 5 . 0 0 1 0 . 0 0F r e q ( H Z )
1 5 . 0 0 2 0 . 0 0
-8.0
0-7
.00
-6.0
0-5
.00
Ex
cit
ati
on
at
40
km
-4.0
0-3
.00
F i l t e r e d G r o u n d V e l o c i t y
0 . 0 0 5 . 0 0 1 0 . 0 0F r e q ( H Z )
1 5 . 0 0 2 0 . 0 0
-8.0
0-7
.00
-6.0
0-5
.00
Ex
cit
ati
on
at
40
km
-4.0
0-3
.00
F i l t e r e d G r o u n d V e l o c i t y
0 . 0 0 5 . 0 0 1 0 . 0 0F r e q ( H Z )
1 5 . 0 0 2 0 . 0 0
-8.0
0-7
.00
-6.0
0-5
.00
Ex
cit
ati
on
at
40
km
-4.0
0-3
.00
F i l t e r e d G r o u n d V e l o c i t y
0 . 0 0 5 . 0 0 1 0 . 0 0F r e q ( H Z )
1 5 . 0 0 2 0 . 0 0
-8.0
0-7
.00
-6.0
0-5
.00
Ex
cit
ati
on
at
40
km
-4.0
0-3
.00
F i l t e r e d G r o u n d V e l o c i t y
0 . 0 0 5 . 0 0 1 0 . 0 0F r e q ( H Z )
1 5 . 0 0 2 0 . 0 0
-8.0
0-7
.00
-6.0
0-5
.00
Ex
cit
ati
on
at
40
km
-4.0
0-3
.00
F i l t e r e d G r o u n d V e l o c i t y
0 . 0 0 5 . 0 0 1 0 . 0 0F r e q ( H Z )
1 5 . 0 0 2 0 . 0 0
-8.0
0-7
.00
-6.0
0-5
.00
Ex
cit
ati
on
at
40
km
-4.0
0-3
.00
F i l t e r e d G r o u n d V e l o c i t y
0 . 0 0 5 . 0 0 1 0 . 0 0F r e q ( H Z )
1 5 . 0 0 2 0 . 0 0
-8.0
0-7
.00
-6.0
0-5
.00
Ex
cit
ati
on
at
40
km
-4.0
0-3
.00
F i l t e r e d G r o u n d V e l o c i t y
0 . 0 0 5 . 0 0 1 0 . 0 0F r e q ( H Z )
1 5 . 0 0 2 0 . 0 0
-8.0
0-7
.00
-6.0
0-5
.00
Ex
cit
ati
on
at
40
km
-4.0
0-3
.00
F i l t e r e d G r o u n d V e l o c i t y
0 . 0 0 5 . 0 0 1 0 . 0 0F r e q ( H Z )
1 5 . 0 0 2 0 . 0 0
-8.0
0-7
.00
-6.0
0-5
.00
Ex
cit
ati
on
at
40
km
-4.0
0-3
.00
F i l t e r e d G r o u n d V e l o c i t y
0 . 0 0 5 . 0 0 1 0 . 0 0F r e q ( H Z )
1 5 . 0 0 2 0 . 0 0
-8.0
0-7
.00
-6.0
0-5
.00
Ex
cit
ati
on
at
40
km
-4.0
0-3
.00
F i l t e r e d G r o u n d V e l o c i t y
0 . 0 0 5 . 0 0 1 0 . 0 0F r e q ( H Z )
1 5 . 0 0 2 0 . 0 0
-8.0
0-7
.00
-6.0
0-5
.00
Ex
cit
ati
on
at
40
km
-4.0
0-3
.00
F i l t e r e d G r o u n d V e l o c i t y
0 . 0 0 5 . 0 0 1 0 . 0 0F r e q ( H Z )
1 5 . 0 0 2 0 . 0 0
-8.0
0-7
.00
-6.0
0-5
.00
Ex
cit
ati
on
at
40
km
-4.0
0-3
.00
F i l t e r e d G r o u n d V e l o c i t y
0 . 0 0 5 . 0 0 1 0 . 0 0F r e q ( H Z )
1 5 . 0 0 2 0 . 0 0
-8.0
0-7
.00
-6.0
0-5
.00
Ex
cit
ati
on
at
40
km
-4.0
0-3
.00
F i l t e r e d G r o u n d V e l o c i t y
0 . 0 0 5 . 0 0 1 0 . 0 0F r e q ( H Z )
1 5 . 0 0 2 0 . 0 0
-8.0
0-7
.00
-6.0
0-5
.00
Ex
cit
ati
on
at
40
km
-4.0
0-3
.00
F i l t e r e d G r o u n d V e l o c i t y
0 . 0 0 5 . 0 0 1 0 . 0 0F r e q ( H Z )
1 5 . 0 0 2 0 . 0 0
-8.0
0-7
.00
-6.0
0-5
.00
Ex
cit
ati
on
at
40
km
-4.0
0-3
.00
F i l t e r e d G r o u n d V e l o c i t y
0 . 0 0 5 . 0 0 1 0 . 0 0F r e q ( H Z )
1 5 . 0 0 2 0 . 0 0
-8.0
0-7
.00
-6.0
0-5
.00
Ex
cit
ati
on
at
40
km
-4.0
0-3
.00
F i l t e r e d G r o u n d V e l o c i t y
0 . 0 0 5 . 0 0 1 0 . 0 0F r e q ( H Z )
1 5 . 0 0 2 0 . 0 0
-8.0
0-7
.00
-6.0
0-5
.00
Ex
cit
ati
on
at
40
km
-4.0
0-3
.00
F i l t e r e d G r o u n d V e l o c i t y
0 . 0 0 5 . 0 0 1 0 . 0 0F r e q ( H Z )
1 5 . 0 0 2 0 . 0 0
-8.0
0-7
.00
-6.0
0-5
.00
Ex
cit
ati
on
at
40
km
-4.0
0-3
.00
F i l t e r e d G r o u n d V e l o c i t y
0 . 0 0 5 . 0 0 1 0 . 0 0F r e q ( H Z )
1 5 . 0 0 2 0 . 0 0
-8.0
0-7
.00
-6.0
0-5
.00
Ex
cit
ati
on
at
40
km
-4.0
0-3
.00
Band Pass Peak Ampl i tude
0 . 0 0 5 . 0 0 1 0 . 0 0F r e q ( H Z )
1 5 . 0 0 2 0 . 0 0
-8.0
0-7
.00
-6.0
0-5
.00
Ex
cit
ati
on
at
40
km
-4.0
0-3
.00
Band Pass Peak Ampl i tude
0 . 0 0 5 . 0 0 1 0 . 0 0F r e q ( H Z )
1 5 . 0 0 2 0 . 0 0
-8.0
0-7
.00
-6.0
0-5
.00
Ex
cit
ati
on
at
40
km
-4.0
0-3
.00
Band Pass Peak Ampl i tude
0 . 0 0 5 . 0 0 1 0 . 0 0F r e q ( H Z )
1 5 . 0 0 2 0 . 0 0
-8.0
0-7
.00
-6.0
0-5
.00
Ex
cit
ati
on
at
40
km
-4.0
0-3
.00
Band Pass Peak Ampl i tude
0 . 0 0 5 . 0 0 1 0 . 0 0F r e q ( H Z )
1 5 . 0 0 2 0 . 0 0
-8.0
0-7
.00
-6.0
0-5
.00
Ex
cit
ati
on
at
40
km
-4.0
0-3
.00
Band Pass Peak Ampl i tude
0 . 0 0 5 . 0 0 1 0 . 0 0F r e q ( H Z )
1 5 . 0 0 2 0 . 0 0
-8.0
0-7
.00
-6.0
0-5
.00
Ex
cit
ati
on
at
40
km
-4.0
0-3
.00
Band Pass Peak Ampl i tude
Mw=4.5
Mw=4.0
Mw=3.5
Mw=3.0
Mw=2.5
Mw=2.0
RED - THEO
BLACK - Data Mean
Figure 4.13: Excitation of peak filtered velocity at 40 km (Model B) in linearscale of frequency range. The thick dash curve is the prediction of the 400bar constant stress drop source model. E is the log � � of the peak filteredvelocity spectra in �
�������.

80
100 10 1 10 2
F r e q ( H Z )
-8.0
0-7
.00
-6.0
0-5
.00
Ex
cit
ati
on
at
40
km
-4.0
0-3
.00
F o u r i e r V e l o c i t y - E X
100 10 1 10 2
F r e q ( H Z )
-8.0
0-7
.00
-6.0
0-5
.00
Ex
cit
ati
on
at
40
km
-4.0
0-3
.00
F o u r i e r V e l o c i t y - E X
100 10 1 10 2
F r e q ( H Z )
-8.0
0-7
.00
-6.0
0-5
.00
Ex
cit
ati
on
at
40
km
-4.0
0-3
.00
F o u r i e r V e l o c i t y - E X
100 10 1 10 2
F r e q ( H Z )
-8.0
0-7
.00
-6.0
0-5
.00
Ex
cit
ati
on
at
40
km
-4.0
0-3
.00
F o u r i e r V e l o c i t y - E X
100 10 1 10 2
F r e q ( H Z )
-8.0
0-7
.00
-6.0
0-5
.00
Ex
cit
ati
on
at
40
km
-4.0
0-3
.00
F o u r i e r V e l o c i t y - E X
100 10 1 10 2
F r e q ( H Z )
-8.0
0-7
.00
-6.0
0-5
.00
Ex
cit
ati
on
at
40
km
-4.0
0-3
.00
F o u r i e r V e l o c i t y - E X
100 10 1 10 2
F r e q ( H Z )
-8.0
0-7
.00
-6.0
0-5
.00
Ex
cit
ati
on
at
40
km
-4.0
0-3
.00
F o u r i e r V e l o c i t y - E X
100 10 1 10 2
F r e q ( H Z )
-8.0
0-7
.00
-6.0
0-5
.00
Ex
cit
ati
on
at
40
km
-4.0
0-3
.00
F o u r i e r V e l o c i t y - E X
100 10 1 10 2
F r e q ( H Z )
-8.0
0-7
.00
-6.0
0-5
.00
Ex
cit
ati
on
at
40
km
-4.0
0-3
.00
F o u r i e r V e l o c i t y - E X
100 10 1 10 2
F r e q ( H Z )
-8.0
0-7
.00
-6.0
0-5
.00
Ex
cit
ati
on
at
40
km
-4.0
0-3
.00
F o u r i e r V e l o c i t y - E X
100 10 1 10 2
F r e q ( H Z )
-8.0
0-7
.00
-6.0
0-5
.00
Ex
cit
ati
on
at
40
km
-4.0
0-3
.00
F o u r i e r V e l o c i t y - E X
100 10 1 10 2
F r e q ( H Z )
-8.0
0-7
.00
-6.0
0-5
.00
Ex
cit
ati
on
at
40
km
-4.0
0-3
.00
F o u r i e r V e l o c i t y - E X
100 10 1 10 2
F r e q ( H Z )
-8.0
0-7
.00
-6.0
0-5
.00
Ex
cit
ati
on
at
40
km
-4.0
0-3
.00
F o u r i e r V e l o c i t y - E X
100 10 1 10 2
F r e q ( H Z )
-8.0
0-7
.00
-6.0
0-5
.00
Ex
cit
ati
on
at
40
km
-4.0
0-3
.00
F o u r i e r V e l o c i t y - E X
100 10 1 10 2
F r e q ( H Z )
-8.0
0-7
.00
-6.0
0-5
.00
Ex
cit
ati
on
at
40
km
-4.0
0-3
.00
F o u r i e r V e l o c i t y - E X
100 10 1 10 2
F r e q ( H Z )
-8.0
0-7
.00
-6.0
0-5
.00
Ex
cit
ati
on
at
40
km
-4.0
0-3
.00
F o u r i e r V e l o c i t y - E X
100 10 1 10 2
F r e q ( H Z )
-8.0
0-7
.00
-6.0
0-5
.00
Ex
cit
ati
on
at
40
km
-4.0
0-3
.00
F o u r i e r V e l o c i t y - E X
100 10 1 10 2
F r e q ( H Z )
-8.0
0-7
.00
-6.0
0-5
.00
Ex
cit
ati
on
at
40
km
-4.0
0-3
.00
F o u r i e r V e l o c i t y - E X
100 10 1 10 2
F r e q ( H Z )
-8.0
0-7
.00
-6.0
0-5
.00
Ex
cit
ati
on
at
40
km
-4.0
0-3
.00
F o u r i e r V e l o c i t y - E X
100 10 1 10 2
F r e q ( H Z )
-8.0
0-7
.00
-6.0
0-5
.00
Ex
cit
ati
on
at
40
km
-4.0
0-3
.00
F o u r i e r V e l o c i t y - E X
100 10 1 10 2
F r e q ( H Z )
-8.0
0-7
.00
-6.0
0-5
.00
Ex
cit
ati
on
at
40
km
-4.0
0-3
.00
F o u r i e r V e l o c i t y - E X
100 10 1 10 2
F r e q ( H Z )
-8.0
0-7
.00
-6.0
0-5
.00
Ex
cit
ati
on
at
40
km
-4.0
0-3
.00
F o u r i e r V e l o c i t y - E X
100 10 1 10 2
F r e q ( H Z )
-8.0
0-7
.00
-6.0
0-5
.00
Ex
cit
ati
on
at
40
km
-4.0
0-3
.00
F o u r i e r V e l o c i t y - E X
100 10 1 10 2
F r e q ( H Z )
-8.0
0-7
.00
-6.0
0-5
.00
Ex
cit
ati
on
at
40
km
-4.0
0-3
.00
F o u r i e r V e l o c i t y - E X
100 10 1 10 2
F r e q ( H Z )
-8.0
0-7
.00
-6.0
0-5
.00
Ex
cit
ati
on
at
40
km
-4.0
0-3
.00
F o u r i e r V e l o c i t y - E X
100 10 1 10 2
F r e q ( H Z )
-8.0
0-7
.00
-6.0
0-5
.00
Ex
cit
ati
on
at
40
km
-4.0
0-3
.00
F o u r i e r V e l o c i t y - E X
100 10 1 10 2
F r e q ( H Z )
-8.0
0-7
.00
-6.0
0-5
.00
Ex
cit
ati
on
at
40
km
-4.0
0-3
.00
F o u r i e r V e l o c i t y - E X
100 10 1 10 2
F r e q ( H Z )
-8.0
0-7
.00
-6.0
0-5
.00
Ex
cit
ati
on
at
40
km
-4.0
0-3
.00
F o u r i e r V e l o c i t y - E X
100 10 1 10 2
F r e q ( H Z )
-8.0
0-7
.00
-6.0
0-5
.00
Ex
cit
ati
on
at
40
km
-4.0
0-3
.00
F o u r i e r V e l o c i t y - E X
100 10 1 10 2
F r e q ( H Z )
-8.0
0-7
.00
-6.0
0-5
.00
Ex
cit
ati
on
at
40
km
-4.0
0-3
.00
F o u r i e r V e l o c i t y - E X
100 10 1 10 2
F r e q ( H Z )
-8.0
0-7
.00
-6.0
0-5
.00
Ex
cit
ati
on
at
40
km
-4.0
0-3
.00
F o u r i e r V e l o c i t y - E X
100 10 1 10 2
F r e q ( H Z )
-8.0
0-7
.00
-6.0
0-5
.00
Ex
cit
ati
on
at
40
km
-4.0
0-3
.00
F o u r i e r V e l o c i t y - E X
100 10 1 10 2
F r e q ( H Z )
-8.0
0-7
.00
-6.0
0-5
.00
Ex
cit
ati
on
at
40
km
-4.0
0-3
.00
F o u r i e r V e l o c i t y - E X
100 10 1 10 2
F r e q ( H Z )
-8.0
0-7
.00
-6.0
0-5
.00
Ex
cit
ati
on
at
40
km
-4.0
0-3
.00
F o u r i e r V e l o c i t y - E X
100 10 1 10 2
F r e q ( H Z )
-8.0
0-7
.00
-6.0
0-5
.00
Ex
cit
ati
on
at
40
km
-4.0
0-3
.00
F o u r i e r V e l o c i t y - E X
100 10 1 10 2
F r e q ( H Z )
-8.0
0-7
.00
-6.0
0-5
.00
Ex
cit
ati
on
at
40
km
-4.0
0-3
.00
F o u r i e r V e l o c i t y - E X
100 10 1 10 2
F r e q ( H Z )
-8.0
0-7
.00
-6.0
0-5
.00
Ex
cit
ati
on
at
40
km
-4.0
0-3
.00
F o u r i e r V e l o c i t y - E X
100 10 1 10 2
F r e q ( H Z )
-8.0
0-7
.00
-6.0
0-5
.00
Ex
cit
ati
on
at
40
km
-4.0
0-3
.00
F o u r i e r V e l o c i t y - E X
100 10 1 10 2
F r e q ( H Z )
-8.0
0-7
.00
-6.0
0-5
.00
Ex
cit
ati
on
at
40
km
-4.0
0-3
.00
F o u r i e r V e l o c i t y - E X
100 10 1 10 2
F r e q ( H Z )
-8.0
0-7
.00
-6.0
0-5
.00
Ex
cit
ati
on
at
40
km
-4.0
0-3
.00
F o u r i e r V e l o c i t y - E X
100 10 1 10 2
F r e q ( H Z )
-8.0
0-7
.00
-6.0
0-5
.00
Ex
cit
ati
on
at
40
km
-4.0
0-3
.00
F o u r i e r V e l o c i t y - E X
100 10 1 10 2
F r e q ( H Z )
-8.0
0-7
.00
-6.0
0-5
.00
Ex
cit
ati
on
at
40
km
-4.0
0-3
.00
F o u r i e r V e l o c i t y - E X
100 10 1 10 2
F r e q ( H Z )
-8.0
0-7
.00
-6.0
0-5
.00
Ex
cit
ati
on
at
40
km
-4.0
0-3
.00
F o u r i e r V e l o c i t y - E X
100 10 1 10 2
F r e q ( H Z )
-8.0
0-7
.00
-6.0
0-5
.00
Ex
cit
ati
on
at
40
km
-4.0
0-3
.00
F o u r i e r V e l o c i t y - E X
100 10 1 10 2
F r e q ( H Z )
-8.0
0-7
.00
-6.0
0-5
.00
Ex
cit
ati
on
at
40
km
-4.0
0-3
.00
F o u r i e r V e l o c i t y - E X
100 10 1 10 2
F r e q ( H Z )
-8.0
0-7
.00
-6.0
0-5
.00
Ex
cit
ati
on
at
40
km
-4.0
0-3
.00
F o u r i e r V e l o c i t y - E X
100 10 1 10 2
F r e q ( H Z )
-8.0
0-7
.00
-6.0
0-5
.00
Ex
cit
ati
on
at
40
km
-4.0
0-3
.00
F o u r i e r V e l o c i t y - E X
100 10 1 10 2
F r e q ( H Z )
-8.0
0-7
.00
-6.0
0-5
.00
Ex
cit
ati
on
at
40
km
-4.0
0-3
.00
F o u r i e r V e l o c i t y - E X
100 10 1 10 2
F r e q ( H Z )
-8.0
0-7
.00
-6.0
0-5
.00
Ex
cit
ati
on
at
40
km
-4.0
0-3
.00
F o u r i e r V e l o c i t y - E X
100 10 1 10 2
F r e q ( H Z )
-8.0
0-7
.00
-6.0
0-5
.00
Ex
cit
ati
on
at
40
km
-4.0
0-3
.00
F o u r i e r V e l o c i t y - E X
100 10 1 10 2
F r e q ( H Z )
-8.0
0-7
.00
-6.0
0-5
.00
Ex
cit
ati
on
at
40
km
-4.0
0-3
.00
F o u r i e r V e l o c i t y - E X
100 10 1 10 2
F r e q ( H Z )
-8.0
0-7
.00
-6.0
0-5
.00
Ex
cit
ati
on
at
40
km
-4.0
0-3
.00
F o u r i e r V e l o c i t y - E X
100 10 1 10 2
F r e q ( H Z )
-8.0
0-7
.00
-6.0
0-5
.00
Ex
cit
ati
on
at
40
km
-4.0
0-3
.00
F o u r i e r V e l o c i t y - E X
100 10 1 10 2
F r e q ( H Z )
-8.0
0-7
.00
-6.0
0-5
.00
Ex
cit
ati
on
at
40
km
-4.0
0-3
.00
F o u r i e r V e l o c i t y - E X
100 10 1 10 2
F r e q ( H Z )
-8.0
0-7
.00
-6.0
0-5
.00
Ex
cit
ati
on
at
40
km
-4.0
0-3
.00
F o u r i e r V e l o c i t y - E X
100 10 1 10 2
F r e q ( H Z )
-8.0
0-7
.00
-6.0
0-5
.00
Ex
cit
ati
on
at
40
km
-4.0
0-3
.00
F o u r i e r V e l o c i t y - E X
100 10 1 10 2
F r e q ( H Z )
-8.0
0-7
.00
-6.0
0-5
.00
Ex
cit
ati
on
at
40
km
-4.0
0-3
.00
F o u r i e r V e l o c i t y - E X
100 10 1 10 2
F r e q ( H Z )
-8.0
0-7
.00
-6.0
0-5
.00
Ex
cit
ati
on
at
40
km
-4.0
0-3
.00
F o u r i e r V e l o c i t y - E X
100 10 1 10 2
F r e q ( H Z )
-8.0
0-7
.00
-6.0
0-5
.00
Ex
cit
ati
on
at
40
km
-4.0
0-3
.00
F o u r i e r V e l o c i t y - E X
100 10 1 10 2
F r e q ( H Z )
-8.0
0-7
.00
-6.0
0-5
.00
Ex
cit
ati
on
at
40
km
-4.0
0-3
.00
F o u r i e r V e l o c i t y - E X
100 10 1 10 2
F r e q ( H Z )
-8.0
0-7
.00
-6.0
0-5
.00
Ex
cit
ati
on
at
40
km
-4.0
0-3
.00
F o u r i e r V e l o c i t y - E X
100 10 1 10 2
F r e q ( H Z )
-8.0
0-7
.00
-6.0
0-5
.00
Ex
cit
ati
on
at
40
km
-4.0
0-3
.00
F o u r i e r V e l o c i t y - E X
100 10 1 10 2
F r e q ( H Z )
-8.0
0-7
.00
-6.0
0-5
.00
Ex
cit
ati
on
at
40
km
-4.0
0-3
.00
F o u r i e r V e l o c i t y - E X
100 10 1 10 2
F r e q ( H Z )
-8.0
0-7
.00
-6.0
0-5
.00
Ex
cit
ati
on
at
40
km
-4.0
0-3
.00
F o u r i e r V e l o c i t y - E X
100 10 1 10 2
F r e q ( H Z )
-8.0
0-7
.00
-6.0
0-5
.00
Ex
cit
ati
on
at
40
km
-4.0
0-3
.00
F o u r i e r V e l o c i t y - E X
100 10 1 10 2
F r e q ( H Z )
-8.0
0-7
.00
-6.0
0-5
.00
Ex
cit
ati
on
at
40
km
-4.0
0-3
.00
F o u r i e r V e l o c i t y - E X
100 10 1 10 2
F r e q ( H Z )
-8.0
0-7
.00
-6.0
0-5
.00
Ex
cit
ati
on
at
40
km
-4.0
0-3
.00
F o u r i e r V e l o c i t y - E X
100 10 1 10 2
F r e q ( H Z )
-8.0
0-7
.00
-6.0
0-5
.00
Ex
cit
ati
on
at
40
km
-4.0
0-3
.00
F o u r i e r V e l o c i t y - E X
100 10 1 10 2
F r e q ( H Z )
-8.0
0-7
.00
-6.0
0-5
.00
Ex
cit
ati
on
at
40
km
-4.0
0-3
.00
F o u r i e r V e l o c i t y - E X
100 10 1 10 2
F r e q ( H Z )
-8.0
0-7
.00
-6.0
0-5
.00
Ex
cit
ati
on
at
40
km
-4.0
0-3
.00
F o u r i e r V e l o c i t y - E X
100 10 1 10 2
F r e q ( H Z )
-8.0
0-7
.00
-6.0
0-5
.00
Ex
cit
ati
on
at
40
km
-4.0
0-3
.00
F o u r i e r V e l o c i t y - E X
100 10 1 10 2
F r e q ( H Z )
-8.0
0-7
.00
-6.0
0-5
.00
Ex
cit
ati
on
at
40
km
-4.0
0-3
.00
F o u r i e r V e l o c i t y - E X
100 10 1 10 2
F r e q ( H Z )
-8.0
0-7
.00
-6.0
0-5
.00
Ex
cit
ati
on
at
40
km
-4.0
0-3
.00
F o u r i e r V e l o c i t y - E X
100 10 1 10 2
F r e q ( H Z )
-8.0
0-7
.00
-6.0
0-5
.00
Ex
cit
ati
on
at
40
km
-4.0
0-3
.00
F o u r i e r V e l o c i t y - E X
100 10 1 10 2
F r e q ( H Z )
-8.0
0-7
.00
-6.0
0-5
.00
Ex
cit
ati
on
at
40
km
-4.0
0-3
.00
F o u r i e r V e l o c i t y - E X
100 10 1 10 2
F r e q ( H Z )
-8.0
0-7
.00
-6.0
0-5
.00
Ex
cit
ati
on
at
40
km
-4.0
0-3
.00
F o u r i e r V e l o c i t y - E X
100 10 1 10 2
F r e q ( H Z )
-8.0
0-7
.00
-6.0
0-5
.00
Ex
cit
ati
on
at
40
km
-4.0
0-3
.00
F o u r i e r V e l o c i t y - E X
100 10 1 10 2
F r e q ( H Z )
-8.0
0-7
.00
-6.0
0-5
.00
Ex
cit
ati
on
at
40
km
-4.0
0-3
.00
F o u r i e r V e l o c i t y - E X
100 10 1 10 2
F r e q ( H Z )
-8.0
0-7
.00
-6.0
0-5
.00
Ex
cit
ati
on
at
40
km
-4.0
0-3
.00
F o u r i e r V e l o c i t y - E X
100 10 1 10 2
F r e q ( H Z )
-8.0
0-7
.00
-6.0
0-5
.00
Ex
cit
ati
on
at
40
km
-4.0
0-3
.00
F o u r i e r V e l o c i t y - E X
100 10 1 10 2
F r e q ( H Z )
-8.0
0-7
.00
-6.0
0-5
.00
Ex
cit
ati
on
at
40
km
-4.0
0-3
.00
F o u r i e r V e l o c i t y - E X
100 10 1 10 2
F r e q ( H Z )
-8.0
0-7
.00
-6.0
0-5
.00
Ex
cit
ati
on
at
40
km
-4.0
0-3
.00
F o u r i e r V e l o c i t y - E X
100 10 1 10 2
F r e q ( H Z )
-8.0
0-7
.00
-6.0
0-5
.00
Ex
cit
ati
on
at
40
km
-4.0
0-3
.00
F o u r i e r V e l o c i t y - E X
100 10 1 10 2
F r e q ( H Z )
-8.0
0-7
.00
-6.0
0-5
.00
Ex
cit
ati
on
at
40
km
-4.0
0-3
.00
F o u r i e r V e l o c i t y - E X
100 10 1 10 2
F r e q ( H Z )
-8.0
0-7
.00
-6.0
0-5
.00
Ex
cit
ati
on
at
40
km
-4.0
0-3
.00
F o u r i e r V e l o c i t y - E X
100 10 1 10 2
F r e q ( H Z )
-8.0
0-7
.00
-6.0
0-5
.00
Ex
cit
ati
on
at
40
km
-4.0
0-3
.00
F o u r i e r V e l o c i t y - E X
100 10 1 10 2
F r e q ( H Z )
-8.0
0-7
.00
-6.0
0-5
.00
Ex
cit
ati
on
at
40
km
-4.0
0-3
.00
F o u r i e r V e l o c i t y - E X
100 10 1 10 2
F r e q ( H Z )
-8.0
0-7
.00
-6.0
0-5
.00
Ex
cit
ati
on
at
40
km
-4.0
0-3
.00
F o u r i e r V e l o c i t y - E X
100 10 1 10 2
F r e q ( H Z )
-8.0
0-7
.00
-6.0
0-5
.00
Ex
cit
ati
on
at
40
km
-4.0
0-3
.00
F o u r i e r V e l o c i t y - E X
100 10 1 10 2
F r e q ( H Z )
-8.0
0-7
.00
-6.0
0-5
.00
Ex
cit
ati
on
at
40
km
-4.0
0-3
.00
F o u r i e r V e l o c i t y - E X
100 10 1 10 2
F r e q ( H Z )
-8.0
0-7
.00
-6.0
0-5
.00
Ex
cit
ati
on
at
40
km
-4.0
0-3
.00
F o u r i e r V e l o c i t y - E X
100 10 1 10 2
F r e q ( H Z )
-8.0
0-7
.00
-6.0
0-5
.00
Ex
cit
ati
on
at
40
km
-4.0
0-3
.00
F o u r i e r V e l o c i t y - E X
100 10 1 10 2
F r e q ( H Z )
-8.0
0-7
.00
-6.0
0-5
.00
Ex
cit
ati
on
at
40
km
-4.0
0-3
.00
F o u r i e r V e l o c i t y - E X
100 10 1 10 2
F r e q ( H Z )
-8.0
0-7
.00
-6.0
0-5
.00
Ex
cit
ati
on
at
40
km
-4.0
0-3
.00
F o u r i e r V e l o c i t y - E X
100 10 1 10 2
F r e q ( H Z )
-8.0
0-7
.00
-6.0
0-5
.00
Ex
cit
ati
on
at
40
km
-4.0
0-3
.00
F o u r i e r V e l o c i t y - E X
100 10 1 10 2
F r e q ( H Z )
-8.0
0-7
.00
-6.0
0-5
.00
Ex
cit
ati
on
at
40
km
-4.0
0-3
.00
F o u r i e r V e l o c i t y - E X
100 10 1 10 2
F r e q ( H Z )
-8.0
0-7
.00
-6.0
0-5
.00
Ex
cit
ati
on
at
40
km
-4.0
0-3
.00
F o u r i e r V e l o c i t y - E X
100 10 1 10 2
F r e q ( H Z )
-8.0
0-7
.00
-6.0
0-5
.00
Ex
cit
ati
on
at
40
km
-4.0
0-3
.00
F o u r i e r V e l o c i t y - E X
100 10 1 10 2
F r e q ( H Z )
-8.0
0-7
.00
-6.0
0-5
.00
Ex
cit
ati
on
at
40
km
-4.0
0-3
.00
F o u r i e r V e l o c i t y - E X
100 10 1 10 2
F r e q ( H Z )
-8.0
0-7
.00
-6.0
0-5
.00
Ex
cit
ati
on
at
40
km
-4.0
0-3
.00
F o u r i e r V e l o c i t y - E X
100 10 1 10 2
F r e q ( H Z )
-8.0
0-7
.00
-6.0
0-5
.00
Ex
cit
ati
on
at
40
km
-4.0
0-3
.00
F o u r i e r V e l o c i t y - E X
100 10 1 10 2
F r e q ( H Z )
-8.0
0-7
.00
-6.0
0-5
.00
Ex
cit
ati
on
at
40
km
-4.0
0-3
.00
F o u r i e r V e l o c i t y - E X
100 10 1 10 2
F r e q ( H Z )
-8.0
0-7
.00
-6.0
0-5
.00
Ex
cit
ati
on
at
40
km
-4.0
0-3
.00
F o u r i e r V e l o c i t y - E X
100 10 1 10 2
F r e q ( H Z )
-8.0
0-7
.00
-6.0
0-5
.00
Ex
cit
ati
on
at
40
km
-4.0
0-3
.00
F o u r i e r V e l o c i t y - E X
100 10 1 10 2
F r e q ( H Z )
-8.0
0-7
.00
-6.0
0-5
.00
Ex
cit
ati
on
at
40
km
-4.0
0-3
.00
F o u r i e r V e l o c i t y - E X
100 10 1 10 2
F r e q ( H Z )
-8.0
0-7
.00
-6.0
0-5
.00
Ex
cit
ati
on
at
40
km
-4.0
0-3
.00
F o u r i e r V e l o c i t y - E X
100 10 1 10 2
F r e q ( H Z )
-8.0
0-7
.00
-6.0
0-5
.00
Ex
cit
ati
on
at
40
km
-4.0
0-3
.00
F o u r i e r V e l o c i t y - E X
100 10 1 10 2
F r e q ( H Z )
-8.0
0-7
.00
-6.0
0-5
.00
Ex
cit
ati
on
at
40
km
-4.0
0-3
.00
F o u r i e r V e l o c i t y - E X
100 10 1 10 2
F r e q ( H Z )
-8.0
0-7
.00
-6.0
0-5
.00
Ex
cit
ati
on
at
40
km
-4.0
0-3
.00
F o u r i e r V e l o c i t y - E X
100 10 1 10 2
F r e q ( H Z )
-8.0
0-7
.00
-6.0
0-5
.00
Ex
cit
ati
on
at
40
km
-4.0
0-3
.00
F o u r i e r V e l o c i t y - E X
100 10 1 10 2
F r e q ( H Z )
-8.0
0-7
.00
-6.0
0-5
.00
Ex
cit
ati
on
at
40
km
-4.0
0-3
.00
F o u r i e r V e l o c i t y - E X
100 10 1 10 2
F r e q ( H Z )
-8.0
0-7
.00
-6.0
0-5
.00
Ex
cit
ati
on
at
40
km
-4.0
0-3
.00
F o u r i e r V e l o c i t y - E X
100 10 1 10 2
F r e q ( H Z )
-8.0
0-7
.00
-6.0
0-5
.00
Ex
cit
ati
on
at
40
km
-4.0
0-3
.00
F o u r i e r V e l o c i t y - E X
100 10 1 10 2
F r e q ( H Z )
-8.0
0-7
.00
-6.0
0-5
.00
Ex
cit
ati
on
at
40
km
-4.0
0-3
.00
F o u r i e r V e l o c i t y - E X
100 10 1 10 2
F r e q ( H Z )
-8.0
0-7
.00
-6.0
0-5
.00
Ex
cit
ati
on
at
40
km
-4.0
0-3
.00
F o u r i e r V e l o c i t y - E X
100 10 1 10 2
F r e q ( H Z )
-8.0
0-7
.00
-6.0
0-5
.00
Ex
cit
ati
on
at
40
km
-4.0
0-3
.00
F o u r i e r V e l o c i t y - E X
100 10 1 10 2
F r e q ( H Z )
-8.0
0-7
.00
-6.0
0-5
.00
Ex
cit
ati
on
at
40
km
-4.0
0-3
.00
F o u r i e r V e l o c i t y - E X
100 10 1 10 2
F r e q ( H Z )
-8.0
0-7
.00
-6.0
0-5
.00
Ex
cit
ati
on
at
40
km
-4.0
0-3
.00
F o u r i e r V e l o c i t y - E X
100 10 1 10 2
F r e q ( H Z )
-8.0
0-7
.00
-6.0
0-5
.00
Ex
cit
ati
on
at
40
km
-4.0
0-3
.00
F o u r i e r V e l o c i t y - E X
100 10 1 10 2
F r e q ( H Z )
-8.0
0-7
.00
-6.0
0-5
.00
Ex
cit
ati
on
at
40
km
-4.0
0-3
.00
F o u r i e r V e l o c i t y - E X
100 10 1 10 2
F r e q ( H Z )
-8.0
0-7
.00
-6.0
0-5
.00
Ex
cit
ati
on
at
40
km
-4.0
0-3
.00
F o u r i e r V e l o c i t y - E X
100 10 1 10 2
F r e q ( H Z )
-8.0
0-7
.00
-6.0
0-5
.00
Ex
cit
ati
on
at
40
km
-4.0
0-3
.00
F o u r i e r V e l o c i t y - E X
100 10 1 10 2
F r e q ( H Z )
-8.0
0-7
.00
-6.0
0-5
.00
Ex
cit
ati
on
at
40
km
-4.0
0-3
.00
F o u r i e r V e l o c i t y - E X
100 10 1 10 2
F r e q ( H Z )
-8.0
0-7
.00
-6.0
0-5
.00
Ex
cit
ati
on
at
40
km
-4.0
0-3
.00
F o u r i e r V e l o c i t y - E X
100 10 1 10 2
F r e q ( H Z )
-8.0
0-7
.00
-6.0
0-5
.00
Ex
cit
ati
on
at
40
km
-4.0
0-3
.00
F o u r i e r V e l o c i t y - E X
100 10 1 10 2
F r e q ( H Z )
-8.0
0-7
.00
-6.0
0-5
.00
Ex
cit
ati
on
at
40
km
-4.0
0-3
.00
F o u r i e r V e l o c i t y - E X
100 10 1 10 2
F r e q ( H Z )
-8.0
0-7
.00
-6.0
0-5
.00
Ex
cit
ati
on
at
40
km
-4.0
0-3
.00
F o u r i e r V e l o c i t y S p e c t r a
100 10 1 10 2
F r e q ( H Z )
-8.0
0-7
.00
-6.0
0-5
.00
Ex
cit
ati
on
at
40
km
-4.0
0-3
.00
F o u r i e r V e l o c i t y S p e c t r a
100 10 1 10 2
F r e q ( H Z )
-8.0
0-7
.00
-6.0
0-5
.00
Ex
cit
ati
on
at
40
km
-4.0
0-3
.00
F o u r i e r V e l o c i t y S p e c t r a
100 10 1 10 2
F r e q ( H Z )
-8.0
0-7
.00
-6.0
0-5
.00
Ex
cit
ati
on
at
40
km
-4.0
0-3
.00
F o u r i e r V e l o c i t y S p e c t r a
100 10 1 10 2
F r e q ( H Z )
-8.0
0-7
.00
-6.0
0-5
.00
Ex
cit
ati
on
at
40
km
-4.0
0-3
.00
F o u r i e r V e l o c i t y S p e c t r a
100 10 1 10 2
F r e q ( H Z )
-8.0
0-7
.00
-6.0
0-5
.00
Ex
cit
ati
on
at
40
km
-4.0
0-3
.00
F o u r i e r V e l o c i t y S p e c t r a
Mw=4.5
Mw=4.0
Mw=3.5
Mw=3.0
Mw=2.5
Mw=2.0
RED - THEO
BLACK - Data
Figure 4.14: Mining related excitation of Fourier velocity spectra at 40 km.The thick curve is the prediction of the 400 bar stress drop source with" ����� ��� # � �
for propagation model A. E is the log � � of the Fourier velocityspectra in �
�������.

81
100 10 1 10 2
F r e q ( H Z )
-8.0
0-7
.00
-6.0
0-5
.00
Ex
cit
ati
on
at
40
km
-4.0
0-3
.00
F o u r i e r V e l o c i t y - E X
100 10 1 10 2
F r e q ( H Z )
-8.0
0-7
.00
-6.0
0-5
.00
Ex
cit
ati
on
at
40
km
-4.0
0-3
.00
F o u r i e r V e l o c i t y - E X
100 10 1 10 2
F r e q ( H Z )
-8.0
0-7
.00
-6.0
0-5
.00
Ex
cit
ati
on
at
40
km
-4.0
0-3
.00
F o u r i e r V e l o c i t y - E X
100 10 1 10 2
F r e q ( H Z )
-8.0
0-7
.00
-6.0
0-5
.00
Ex
cit
ati
on
at
40
km
-4.0
0-3
.00
F o u r i e r V e l o c i t y - E X
100 10 1 10 2
F r e q ( H Z )
-8.0
0-7
.00
-6.0
0-5
.00
Ex
cit
ati
on
at
40
km
-4.0
0-3
.00
F o u r i e r V e l o c i t y - E X
100 10 1 10 2
F r e q ( H Z )
-8.0
0-7
.00
-6.0
0-5
.00
Ex
cit
ati
on
at
40
km
-4.0
0-3
.00
F o u r i e r V e l o c i t y - E X
100 10 1 10 2
F r e q ( H Z )
-8.0
0-7
.00
-6.0
0-5
.00
Ex
cit
ati
on
at
40
km
-4.0
0-3
.00
F o u r i e r V e l o c i t y - E X
100 10 1 10 2
F r e q ( H Z )
-8.0
0-7
.00
-6.0
0-5
.00
Ex
cit
ati
on
at
40
km
-4.0
0-3
.00
F o u r i e r V e l o c i t y - E X
100 10 1 10 2
F r e q ( H Z )
-8.0
0-7
.00
-6.0
0-5
.00
Ex
cit
ati
on
at
40
km
-4.0
0-3
.00
F o u r i e r V e l o c i t y - E X
100 10 1 10 2
F r e q ( H Z )
-8.0
0-7
.00
-6.0
0-5
.00
Ex
cit
ati
on
at
40
km
-4.0
0-3
.00
F o u r i e r V e l o c i t y - E X
100 10 1 10 2
F r e q ( H Z )
-8.0
0-7
.00
-6.0
0-5
.00
Ex
cit
ati
on
at
40
km
-4.0
0-3
.00
F o u r i e r V e l o c i t y - E X
100 10 1 10 2
F r e q ( H Z )
-8.0
0-7
.00
-6.0
0-5
.00
Ex
cit
ati
on
at
40
km
-4.0
0-3
.00
F o u r i e r V e l o c i t y - E X
100 10 1 10 2
F r e q ( H Z )
-8.0
0-7
.00
-6.0
0-5
.00
Ex
cit
ati
on
at
40
km
-4.0
0-3
.00
F o u r i e r V e l o c i t y - E X
100 10 1 10 2
F r e q ( H Z )
-8.0
0-7
.00
-6.0
0-5
.00
Ex
cit
ati
on
at
40
km
-4.0
0-3
.00
F o u r i e r V e l o c i t y - E X
100 10 1 10 2
F r e q ( H Z )
-8.0
0-7
.00
-6.0
0-5
.00
Ex
cit
ati
on
at
40
km
-4.0
0-3
.00
F o u r i e r V e l o c i t y - E X
100 10 1 10 2
F r e q ( H Z )
-8.0
0-7
.00
-6.0
0-5
.00
Ex
cit
ati
on
at
40
km
-4.0
0-3
.00
F o u r i e r V e l o c i t y - E X
100 10 1 10 2
F r e q ( H Z )
-8.0
0-7
.00
-6.0
0-5
.00
Ex
cit
ati
on
at
40
km
-4.0
0-3
.00
F o u r i e r V e l o c i t y - E X
100 10 1 10 2
F r e q ( H Z )
-8.0
0-7
.00
-6.0
0-5
.00
Ex
cit
ati
on
at
40
km
-4.0
0-3
.00
F o u r i e r V e l o c i t y - E X
100 10 1 10 2
F r e q ( H Z )
-8.0
0-7
.00
-6.0
0-5
.00
Ex
cit
ati
on
at
40
km
-4.0
0-3
.00
F o u r i e r V e l o c i t y - E X
100 10 1 10 2
F r e q ( H Z )
-8.0
0-7
.00
-6.0
0-5
.00
Ex
cit
ati
on
at
40
km
-4.0
0-3
.00
F o u r i e r V e l o c i t y - E X
100 10 1 10 2
F r e q ( H Z )
-8.0
0-7
.00
-6.0
0-5
.00
Ex
cit
ati
on
at
40
km
-4.0
0-3
.00
F o u r i e r V e l o c i t y - E X
100 10 1 10 2
F r e q ( H Z )
-8.0
0-7
.00
-6.0
0-5
.00
Ex
cit
ati
on
at
40
km
-4.0
0-3
.00
F o u r i e r V e l o c i t y - E X
100 10 1 10 2
F r e q ( H Z )
-8.0
0-7
.00
-6.0
0-5
.00
Ex
cit
ati
on
at
40
km
-4.0
0-3
.00
F o u r i e r V e l o c i t y - E X
100 10 1 10 2
F r e q ( H Z )
-8.0
0-7
.00
-6.0
0-5
.00
Ex
cit
ati
on
at
40
km
-4.0
0-3
.00
F o u r i e r V e l o c i t y - E X
100 10 1 10 2
F r e q ( H Z )
-8.0
0-7
.00
-6.0
0-5
.00
Ex
cit
ati
on
at
40
km
-4.0
0-3
.00
F o u r i e r V e l o c i t y - E X
100 10 1 10 2
F r e q ( H Z )
-8.0
0-7
.00
-6.0
0-5
.00
Ex
cit
ati
on
at
40
km
-4.0
0-3
.00
F o u r i e r V e l o c i t y - E X
100 10 1 10 2
F r e q ( H Z )
-8.0
0-7
.00
-6.0
0-5
.00
Ex
cit
ati
on
at
40
km
-4.0
0-3
.00
F o u r i e r V e l o c i t y - E X
100 10 1 10 2
F r e q ( H Z )
-8.0
0-7
.00
-6.0
0-5
.00
Ex
cit
ati
on
at
40
km
-4.0
0-3
.00
F o u r i e r V e l o c i t y - E X
100 10 1 10 2
F r e q ( H Z )
-8.0
0-7
.00
-6.0
0-5
.00
Ex
cit
ati
on
at
40
km
-4.0
0-3
.00
F o u r i e r V e l o c i t y - E X
100 10 1 10 2
F r e q ( H Z )
-8.0
0-7
.00
-6.0
0-5
.00
Ex
cit
ati
on
at
40
km
-4.0
0-3
.00
F o u r i e r V e l o c i t y - E X
100 10 1 10 2
F r e q ( H Z )
-8.0
0-7
.00
-6.0
0-5
.00
Ex
cit
ati
on
at
40
km
-4.0
0-3
.00
F o u r i e r V e l o c i t y - E X
100 10 1 10 2
F r e q ( H Z )
-8.0
0-7
.00
-6.0
0-5
.00
Ex
cit
ati
on
at
40
km
-4.0
0-3
.00
F o u r i e r V e l o c i t y - E X
100 10 1 10 2
F r e q ( H Z )
-8.0
0-7
.00
-6.0
0-5
.00
Ex
cit
ati
on
at
40
km
-4.0
0-3
.00
F o u r i e r V e l o c i t y - E X
100 10 1 10 2
F r e q ( H Z )
-8.0
0-7
.00
-6.0
0-5
.00
Ex
cit
ati
on
at
40
km
-4.0
0-3
.00
F o u r i e r V e l o c i t y - E X
100 10 1 10 2
F r e q ( H Z )
-8.0
0-7
.00
-6.0
0-5
.00
Ex
cit
ati
on
at
40
km
-4.0
0-3
.00
F o u r i e r V e l o c i t y - E X
100 10 1 10 2
F r e q ( H Z )
-8.0
0-7
.00
-6.0
0-5
.00
Ex
cit
ati
on
at
40
km
-4.0
0-3
.00
F o u r i e r V e l o c i t y - E X
100 10 1 10 2
F r e q ( H Z )
-8.0
0-7
.00
-6.0
0-5
.00
Ex
cit
ati
on
at
40
km
-4.0
0-3
.00
F o u r i e r V e l o c i t y - E X
100 10 1 10 2
F r e q ( H Z )
-8.0
0-7
.00
-6.0
0-5
.00
Ex
cit
ati
on
at
40
km
-4.0
0-3
.00
F o u r i e r V e l o c i t y - E X
100 10 1 10 2
F r e q ( H Z )
-8.0
0-7
.00
-6.0
0-5
.00
Ex
cit
ati
on
at
40
km
-4.0
0-3
.00
F o u r i e r V e l o c i t y - E X
100 10 1 10 2
F r e q ( H Z )
-8.0
0-7
.00
-6.0
0-5
.00
Ex
cit
ati
on
at
40
km
-4.0
0-3
.00
F o u r i e r V e l o c i t y - E X
100 10 1 10 2
F r e q ( H Z )
-8.0
0-7
.00
-6.0
0-5
.00
Ex
cit
ati
on
at
40
km
-4.0
0-3
.00
F o u r i e r V e l o c i t y - E X
100 10 1 10 2
F r e q ( H Z )
-8.0
0-7
.00
-6.0
0-5
.00
Ex
cit
ati
on
at
40
km
-4.0
0-3
.00
F o u r i e r V e l o c i t y - E X
100 10 1 10 2
F r e q ( H Z )
-8.0
0-7
.00
-6.0
0-5
.00
Ex
cit
ati
on
at
40
km
-4.0
0-3
.00
F o u r i e r V e l o c i t y - E X
100 10 1 10 2
F r e q ( H Z )
-8.0
0-7
.00
-6.0
0-5
.00
Ex
cit
ati
on
at
40
km
-4.0
0-3
.00
F o u r i e r V e l o c i t y - E X
100 10 1 10 2
F r e q ( H Z )
-8.0
0-7
.00
-6.0
0-5
.00
Ex
cit
ati
on
at
40
km
-4.0
0-3
.00
F o u r i e r V e l o c i t y - E X
100 10 1 10 2
F r e q ( H Z )
-8.0
0-7
.00
-6.0
0-5
.00
Ex
cit
ati
on
at
40
km
-4.0
0-3
.00
F o u r i e r V e l o c i t y - E X
100 10 1 10 2
F r e q ( H Z )
-8.0
0-7
.00
-6.0
0-5
.00
Ex
cit
ati
on
at
40
km
-4.0
0-3
.00
F o u r i e r V e l o c i t y - E X
100 10 1 10 2
F r e q ( H Z )
-8.0
0-7
.00
-6.0
0-5
.00
Ex
cit
ati
on
at
40
km
-4.0
0-3
.00
F o u r i e r V e l o c i t y - E X
100 10 1 10 2
F r e q ( H Z )
-8.0
0-7
.00
-6.0
0-5
.00
Ex
cit
ati
on
at
40
km
-4.0
0-3
.00
F o u r i e r V e l o c i t y - E X
100 10 1 10 2
F r e q ( H Z )
-8.0
0-7
.00
-6.0
0-5
.00
Ex
cit
ati
on
at
40
km
-4.0
0-3
.00
F o u r i e r V e l o c i t y - E X
100 10 1 10 2
F r e q ( H Z )
-8.0
0-7
.00
-6.0
0-5
.00
Ex
cit
ati
on
at
40
km
-4.0
0-3
.00
F o u r i e r V e l o c i t y - E X
100 10 1 10 2
F r e q ( H Z )
-8.0
0-7
.00
-6.0
0-5
.00
Ex
cit
ati
on
at
40
km
-4.0
0-3
.00
F o u r i e r V e l o c i t y - E X
100 10 1 10 2
F r e q ( H Z )
-8.0
0-7
.00
-6.0
0-5
.00
Ex
cit
ati
on
at
40
km
-4.0
0-3
.00
F o u r i e r V e l o c i t y - E X
100 10 1 10 2
F r e q ( H Z )
-8.0
0-7
.00
-6.0
0-5
.00
Ex
cit
ati
on
at
40
km
-4.0
0-3
.00
F o u r i e r V e l o c i t y - E X
100 10 1 10 2
F r e q ( H Z )
-8.0
0-7
.00
-6.0
0-5
.00
Ex
cit
ati
on
at
40
km
-4.0
0-3
.00
F o u r i e r V e l o c i t y - E X
100 10 1 10 2
F r e q ( H Z )
-8.0
0-7
.00
-6.0
0-5
.00
Ex
cit
ati
on
at
40
km
-4.0
0-3
.00
F o u r i e r V e l o c i t y - E X
100 10 1 10 2
F r e q ( H Z )
-8.0
0-7
.00
-6.0
0-5
.00
Ex
cit
ati
on
at
40
km
-4.0
0-3
.00
F o u r i e r V e l o c i t y - E X
100 10 1 10 2
F r e q ( H Z )
-8.0
0-7
.00
-6.0
0-5
.00
Ex
cit
ati
on
at
40
km
-4.0
0-3
.00
F o u r i e r V e l o c i t y - E X
100 10 1 10 2
F r e q ( H Z )
-8.0
0-7
.00
-6.0
0-5
.00
Ex
cit
ati
on
at
40
km
-4.0
0-3
.00
F o u r i e r V e l o c i t y - E X
100 10 1 10 2
F r e q ( H Z )
-8.0
0-7
.00
-6.0
0-5
.00
Ex
cit
ati
on
at
40
km
-4.0
0-3
.00
F o u r i e r V e l o c i t y - E X
100 10 1 10 2
F r e q ( H Z )
-8.0
0-7
.00
-6.0
0-5
.00
Ex
cit
ati
on
at
40
km
-4.0
0-3
.00
F o u r i e r V e l o c i t y - E X
100 10 1 10 2
F r e q ( H Z )
-8.0
0-7
.00
-6.0
0-5
.00
Ex
cit
ati
on
at
40
km
-4.0
0-3
.00
F o u r i e r V e l o c i t y - E X
100 10 1 10 2
F r e q ( H Z )
-8.0
0-7
.00
-6.0
0-5
.00
Ex
cit
ati
on
at
40
km
-4.0
0-3
.00
F o u r i e r V e l o c i t y - E X
100 10 1 10 2
F r e q ( H Z )
-8.0
0-7
.00
-6.0
0-5
.00
Ex
cit
ati
on
at
40
km
-4.0
0-3
.00
F o u r i e r V e l o c i t y - E X
100 10 1 10 2
F r e q ( H Z )
-8.0
0-7
.00
-6.0
0-5
.00
Ex
cit
ati
on
at
40
km
-4.0
0-3
.00
F o u r i e r V e l o c i t y - E X
100 10 1 10 2
F r e q ( H Z )
-8.0
0-7
.00
-6.0
0-5
.00
Ex
cit
ati
on
at
40
km
-4.0
0-3
.00
F o u r i e r V e l o c i t y - E X
100 10 1 10 2
F r e q ( H Z )
-8.0
0-7
.00
-6.0
0-5
.00
Ex
cit
ati
on
at
40
km
-4.0
0-3
.00
F o u r i e r V e l o c i t y - E X
100 10 1 10 2
F r e q ( H Z )
-8.0
0-7
.00
-6.0
0-5
.00
Ex
cit
ati
on
at
40
km
-4.0
0-3
.00
F o u r i e r V e l o c i t y - E X
100 10 1 10 2
F r e q ( H Z )
-8.0
0-7
.00
-6.0
0-5
.00
Ex
cit
ati
on
at
40
km
-4.0
0-3
.00
F o u r i e r V e l o c i t y - E X
100 10 1 10 2
F r e q ( H Z )
-8.0
0-7
.00
-6.0
0-5
.00
Ex
cit
ati
on
at
40
km
-4.0
0-3
.00
F o u r i e r V e l o c i t y - E X
100 10 1 10 2
F r e q ( H Z )
-8.0
0-7
.00
-6.0
0-5
.00
Ex
cit
ati
on
at
40
km
-4.0
0-3
.00
F o u r i e r V e l o c i t y - E X
100 10 1 10 2
F r e q ( H Z )
-8.0
0-7
.00
-6.0
0-5
.00
Ex
cit
ati
on
at
40
km
-4.0
0-3
.00
F o u r i e r V e l o c i t y - E X
100 10 1 10 2
F r e q ( H Z )
-8.0
0-7
.00
-6.0
0-5
.00
Ex
cit
ati
on
at
40
km
-4.0
0-3
.00
F o u r i e r V e l o c i t y - E X
100 10 1 10 2
F r e q ( H Z )
-8.0
0-7
.00
-6.0
0-5
.00
Ex
cit
ati
on
at
40
km
-4.0
0-3
.00
F o u r i e r V e l o c i t y - E X
100 10 1 10 2
F r e q ( H Z )
-8.0
0-7
.00
-6.0
0-5
.00
Ex
cit
ati
on
at
40
km
-4.0
0-3
.00
F o u r i e r V e l o c i t y - E X
100 10 1 10 2
F r e q ( H Z )
-8.0
0-7
.00
-6.0
0-5
.00
Ex
cit
ati
on
at
40
km
-4.0
0-3
.00
F o u r i e r V e l o c i t y - E X
100 10 1 10 2
F r e q ( H Z )
-8.0
0-7
.00
-6.0
0-5
.00
Ex
cit
ati
on
at
40
km
-4.0
0-3
.00
F o u r i e r V e l o c i t y - E X
100 10 1 10 2
F r e q ( H Z )
-8.0
0-7
.00
-6.0
0-5
.00
Ex
cit
ati
on
at
40
km
-4.0
0-3
.00
F o u r i e r V e l o c i t y - E X
100 10 1 10 2
F r e q ( H Z )
-8.0
0-7
.00
-6.0
0-5
.00
Ex
cit
ati
on
at
40
km
-4.0
0-3
.00
F o u r i e r V e l o c i t y - E X
100 10 1 10 2
F r e q ( H Z )
-8.0
0-7
.00
-6.0
0-5
.00
Ex
cit
ati
on
at
40
km
-4.0
0-3
.00
F o u r i e r V e l o c i t y - E X
100 10 1 10 2
F r e q ( H Z )
-8.0
0-7
.00
-6.0
0-5
.00
Ex
cit
ati
on
at
40
km
-4.0
0-3
.00
F o u r i e r V e l o c i t y - E X
100 10 1 10 2
F r e q ( H Z )
-8.0
0-7
.00
-6.0
0-5
.00
Ex
cit
ati
on
at
40
km
-4.0
0-3
.00
F o u r i e r V e l o c i t y - E X
100 10 1 10 2
F r e q ( H Z )
-8.0
0-7
.00
-6.0
0-5
.00
Ex
cit
ati
on
at
40
km
-4.0
0-3
.00
F o u r i e r V e l o c i t y - E X
100 10 1 10 2
F r e q ( H Z )
-8.0
0-7
.00
-6.0
0-5
.00
Ex
cit
ati
on
at
40
km
-4.0
0-3
.00
F o u r i e r V e l o c i t y - E X
100 10 1 10 2
F r e q ( H Z )
-8.0
0-7
.00
-6.0
0-5
.00
Ex
cit
ati
on
at
40
km
-4.0
0-3
.00
F o u r i e r V e l o c i t y - E X
100 10 1 10 2
F r e q ( H Z )
-8.0
0-7
.00
-6.0
0-5
.00
Ex
cit
ati
on
at
40
km
-4.0
0-3
.00
F o u r i e r V e l o c i t y - E X
100 10 1 10 2
F r e q ( H Z )
-8.0
0-7
.00
-6.0
0-5
.00
Ex
cit
ati
on
at
40
km
-4.0
0-3
.00
F o u r i e r V e l o c i t y - E X
100 10 1 10 2
F r e q ( H Z )
-8.0
0-7
.00
-6.0
0-5
.00
Ex
cit
ati
on
at
40
km
-4.0
0-3
.00
F o u r i e r V e l o c i t y - E X
100 10 1 10 2
F r e q ( H Z )
-8.0
0-7
.00
-6.0
0-5
.00
Ex
cit
ati
on
at
40
km
-4.0
0-3
.00
F o u r i e r V e l o c i t y - E X
100 10 1 10 2
F r e q ( H Z )
-8.0
0-7
.00
-6.0
0-5
.00
Ex
cit
ati
on
at
40
km
-4.0
0-3
.00
F o u r i e r V e l o c i t y - E X
100 10 1 10 2
F r e q ( H Z )
-8.0
0-7
.00
-6.0
0-5
.00
Ex
cit
ati
on
at
40
km
-4.0
0-3
.00
F o u r i e r V e l o c i t y - E X
100 10 1 10 2
F r e q ( H Z )
-8.0
0-7
.00
-6.0
0-5
.00
Ex
cit
ati
on
at
40
km
-4.0
0-3
.00
F o u r i e r V e l o c i t y - E X
100 10 1 10 2
F r e q ( H Z )
-8.0
0-7
.00
-6.0
0-5
.00
Ex
cit
ati
on
at
40
km
-4.0
0-3
.00
F o u r i e r V e l o c i t y - E X
100 10 1 10 2
F r e q ( H Z )
-8.0
0-7
.00
-6.0
0-5
.00
Ex
cit
ati
on
at
40
km
-4.0
0-3
.00
F o u r i e r V e l o c i t y - E X
100 10 1 10 2
F r e q ( H Z )
-8.0
0-7
.00
-6.0
0-5
.00
Ex
cit
ati
on
at
40
km
-4.0
0-3
.00
F o u r i e r V e l o c i t y - E X
100 10 1 10 2
F r e q ( H Z )
-8.0
0-7
.00
-6.0
0-5
.00
Ex
cit
ati
on
at
40
km
-4.0
0-3
.00
F o u r i e r V e l o c i t y - E X
100 10 1 10 2
F r e q ( H Z )
-8.0
0-7
.00
-6.0
0-5
.00
Ex
cit
ati
on
at
40
km
-4.0
0-3
.00
F o u r i e r V e l o c i t y - E X
100 10 1 10 2
F r e q ( H Z )
-8.0
0-7
.00
-6.0
0-5
.00
Ex
cit
ati
on
at
40
km
-4.0
0-3
.00
F o u r i e r V e l o c i t y - E X
100 10 1 10 2
F r e q ( H Z )
-8.0
0-7
.00
-6.0
0-5
.00
Ex
cit
ati
on
at
40
km
-4.0
0-3
.00
F o u r i e r V e l o c i t y - E X
100 10 1 10 2
F r e q ( H Z )
-8.0
0-7
.00
-6.0
0-5
.00
Ex
cit
ati
on
at
40
km
-4.0
0-3
.00
F o u r i e r V e l o c i t y - E X
100 10 1 10 2
F r e q ( H Z )
-8.0
0-7
.00
-6.0
0-5
.00
Ex
cit
ati
on
at
40
km
-4.0
0-3
.00
F o u r i e r V e l o c i t y - E X
100 10 1 10 2
F r e q ( H Z )
-8.0
0-7
.00
-6.0
0-5
.00
Ex
cit
ati
on
at
40
km
-4.0
0-3
.00
F o u r i e r V e l o c i t y - E X
100 10 1 10 2
F r e q ( H Z )
-8.0
0-7
.00
-6.0
0-5
.00
Ex
cit
ati
on
at
40
km
-4.0
0-3
.00
F o u r i e r V e l o c i t y - E X
100 10 1 10 2
F r e q ( H Z )
-8.0
0-7
.00
-6.0
0-5
.00
Ex
cit
ati
on
at
40
km
-4.0
0-3
.00
F o u r i e r V e l o c i t y - E X
100 10 1 10 2
F r e q ( H Z )
-8.0
0-7
.00
-6.0
0-5
.00
Ex
cit
ati
on
at
40
km
-4.0
0-3
.00
F o u r i e r V e l o c i t y - E X
100 10 1 10 2
F r e q ( H Z )
-8.0
0-7
.00
-6.0
0-5
.00
Ex
cit
ati
on
at
40
km
-4.0
0-3
.00
F o u r i e r V e l o c i t y - E X
100 10 1 10 2
F r e q ( H Z )
-8.0
0-7
.00
-6.0
0-5
.00
Ex
cit
ati
on
at
40
km
-4.0
0-3
.00
F o u r i e r V e l o c i t y - E X
100 10 1 10 2
F r e q ( H Z )
-8.0
0-7
.00
-6.0
0-5
.00
Ex
cit
ati
on
at
40
km
-4.0
0-3
.00
F o u r i e r V e l o c i t y - E X
100 10 1 10 2
F r e q ( H Z )
-8.0
0-7
.00
-6.0
0-5
.00
Ex
cit
ati
on
at
40
km
-4.0
0-3
.00
F o u r i e r V e l o c i t y - E X
100 10 1 10 2
F r e q ( H Z )
-8.0
0-7
.00
-6.0
0-5
.00
Ex
cit
ati
on
at
40
km
-4.0
0-3
.00
F o u r i e r V e l o c i t y - E X
100 10 1 10 2
F r e q ( H Z )
-8.0
0-7
.00
-6.0
0-5
.00
Ex
cit
ati
on
at
40
km
-4.0
0-3
.00
F o u r i e r V e l o c i t y - E X
100 10 1 10 2
F r e q ( H Z )
-8.0
0-7
.00
-6.0
0-5
.00
Ex
cit
ati
on
at
40
km
-4.0
0-3
.00
F o u r i e r V e l o c i t y - E X
100 10 1 10 2
F r e q ( H Z )
-8.0
0-7
.00
-6.0
0-5
.00
Ex
cit
ati
on
at
40
km
-4.0
0-3
.00
F o u r i e r V e l o c i t y - E X
100 10 1 10 2
F r e q ( H Z )
-8.0
0-7
.00
-6.0
0-5
.00
Ex
cit
ati
on
at
40
km
-4.0
0-3
.00
F o u r i e r V e l o c i t y - E X
100 10 1 10 2
F r e q ( H Z )
-8.0
0-7
.00
-6.0
0-5
.00
Ex
cit
ati
on
at
40
km
-4.0
0-3
.00
F o u r i e r V e l o c i t y - E X
100 10 1 10 2
F r e q ( H Z )
-8.0
0-7
.00
-6.0
0-5
.00
Ex
cit
ati
on
at
40
km
-4.0
0-3
.00
F o u r i e r V e l o c i t y - E X
100 10 1 10 2
F r e q ( H Z )
-8.0
0-7
.00
-6.0
0-5
.00
Ex
cit
ati
on
at
40
km
-4.0
0-3
.00
F o u r i e r V e l o c i t y - E X
100 10 1 10 2
F r e q ( H Z )
-8.0
0-7
.00
-6.0
0-5
.00
Ex
cit
ati
on
at
40
km
-4.0
0-3
.00
F o u r i e r V e l o c i t y - E X
100 10 1 10 2
F r e q ( H Z )
-8.0
0-7
.00
-6.0
0-5
.00
Ex
cit
ati
on
at
40
km
-4.0
0-3
.00
F o u r i e r V e l o c i t y - E X
100 10 1 10 2
F r e q ( H Z )
-8.0
0-7
.00
-6.0
0-5
.00
Ex
cit
ati
on
at
40
km
-4.0
0-3
.00
F o u r i e r V e l o c i t y - E X
100 10 1 10 2
F r e q ( H Z )
-8.0
0-7
.00
-6.0
0-5
.00
Ex
cit
ati
on
at
40
km
-4.0
0-3
.00
F o u r i e r V e l o c i t y - E X
100 10 1 10 2
F r e q ( H Z )
-8.0
0-7
.00
-6.0
0-5
.00
Ex
cit
ati
on
at
40
km
-4.0
0-3
.00
F o u r i e r V e l o c i t y - E X
100 10 1 10 2
F r e q ( H Z )
-8.0
0-7
.00
-6.0
0-5
.00
Ex
cit
ati
on
at
40
km
-4.0
0-3
.00
F o u r i e r V e l o c i t y - E X
100 10 1 10 2
F r e q ( H Z )
-8.0
0-7
.00
-6.0
0-5
.00
Ex
cit
ati
on
at
40
km
-4.0
0-3
.00
F o u r i e r V e l o c i t y - E X
100 10 1 10 2
F r e q ( H Z )
-8.0
0-7
.00
-6.0
0-5
.00
Ex
cit
ati
on
at
40
km
-4.0
0-3
.00
F o u r i e r V e l o c i t y - E X
100 10 1 10 2
F r e q ( H Z )
-8.0
0-7
.00
-6.0
0-5
.00
Ex
cit
ati
on
at
40
km
-4.0
0-3
.00
F o u r i e r V e l o c i t y - E X
100 10 1 10 2
F r e q ( H Z )
-8.0
0-7
.00
-6.0
0-5
.00
Ex
cit
ati
on
at
40
km
-4.0
0-3
.00
F o u r i e r V e l o c i t y S p e c t r a
100 10 1 10 2
F r e q ( H Z )
-8.0
0-7
.00
-6.0
0-5
.00
Ex
cit
ati
on
at
40
km
-4.0
0-3
.00
F o u r i e r V e l o c i t y S p e c t r a
100 10 1 10 2
F r e q ( H Z )
-8.0
0-7
.00
-6.0
0-5
.00
Ex
cit
ati
on
at
40
km
-4.0
0-3
.00
F o u r i e r V e l o c i t y S p e c t r a
100 10 1 10 2
F r e q ( H Z )
-8.0
0-7
.00
-6.0
0-5
.00
Ex
cit
ati
on
at
40
km
-4.0
0-3
.00
F o u r i e r V e l o c i t y S p e c t r a
100 10 1 10 2
F r e q ( H Z )
-8.0
0-7
.00
-6.0
0-5
.00
Ex
cit
ati
on
at
40
km
-4.0
0-3
.00
F o u r i e r V e l o c i t y S p e c t r a
100 10 1 10 2
F r e q ( H Z )
-8.0
0-7
.00
-6.0
0-5
.00
Ex
cit
ati
on
at
40
km
-4.0
0-3
.00
F o u r i e r V e l o c i t y S p e c t r a
Mw=7.0
Mw=6.0
Mw=5.0
Mw=4.0
Mw=3.0
Mw=2.0
RED - THEO
BLACK - Data
Figure 4.15: Mining related excitation of Fourier velocity spectra at 40 km.The thick curve is the prediction of the 0.1 bar constant stress drop forpropagation model A. E is the log � � of the Fourier velocity spectra in �
�������.

5. CONCLUSIONS
5.1 Results
We studied the regional ground motion scaling for the seismically haz-
ardous Wasatch front, the northeastern Basin and Range province. This
study analyzed a data set consisting of 3000 waveform from 110 stations
and 238 regional earthquakes and mining related seismic events in the
range of 10 - 500 kilometer hypocentral distance. Vertical component ve-
locity seismograms from the University of Utah seismogram seismic net-
work are used to measure and quantify the regional attenuation ground
motion.
The vertical component distance scaling of the� ���
term of Fourier
velocity spectra and band-pass filtered time domain peak motion enables
us to check the appropriateness of duration length by predicting the peak
filtered velocity. Comparison of the two regressions indicated that our
random vibration theory (RVT) related duration term of Fourier ampli-
tude spectra is quite good and both of regression results display consis-
tent shape. RVT is used to obtain estimates of the peak ground motion in
the time domain and duration of 5% - 75% seismic energy that follows the
onset of the S-waves used throughout this study.
Our results show a geometrical spreading of
� ��� ��������� �������
� �� � � � � � �
�� �� � � � � � � � ��
�� � ��� � � � � � � ��� �� � ��� � �� � � � � �� �� � ��� ��� � � � ��
�
and the anelastic attenuation� � ����� ��� ���
for model A. Another set of
82

83
geometrical spreading and anelastic attenuation value is
� ��� ���� ��� �
� � � � � � � � �� � ��� ��� � � � � � ���
�� � ��� ��� � � ��� �
and��� ���� � ��� �
for model B.
The anelastic attenuation����� �
trades off with the geometrical spread-
ing. A more rapid decay of amplitude with distance than expected at
short distance, the low�
, and evidence of many mining related collapse
events in the data set are important regression results. Our estimating of
" � � �$#%����and &(' � �����
are obtained by using Boore (1983) constant
stress drop model and our attenuation relationships.
The network average spectral shape for small events recorded at 40 km
depends only on� � � �
and the " ����� and not on the stress drop. If stress
drop is greater than 100 bars, the limited data for larger events ( � � � �)
indicates the need for at least a 400 stress drop. The rapid decrease of
amplitude vs distance and low�
will mean that the probabilistic hazard
analysis estimates for Utah will be controlled by nearby events.
Both the� � ����� ��� ���
and� � ��� � ��� �
are lower than that obtained
in previous studies of�
in the Basin and Range province (Singh and Her-
rmann, 1983; Baqer and Mitchell, 1998). One reason is that coda techniques
sample a larger geographic region compared to this study of S-wave am-
plitude.
5.2 Comparison of heat flow and attenuation parameters
The apparent Q at high frequencies is affected by thermal and scat-
tering processes. Since the temperature distribution within the crust also

84
reflects processes that modify lithospheric structure (Powell, W. G. and
Chapman, D. S., 1990), identifying thermal state of tectonic provinces and
their boundaries is very important. Normally regions with recent tectonic
activity commonly have higher heat flow than stable regions.
Heat is a measure of energy and the source of the energy is derived
from the conduction of lithosphere and mantle convection. Another source
of heat flow is frictional heat generation along a fault plane in a homoge-
neous medium. The rate and redistribution of frictional heat generation is
not necessarily related to the heat flow anomaly.
Extension may have been an important factor in producing or main-
taining the high heat flow in Basin and Range province. But elsewhere
in western United States - and perhaps in the Basin and Range province
- convection of heat into the crust by mantle derived melts not related to
extension appears to be the primary heat source. These melts are proba-
bly related to subduction, even if the exact mechanism of their origin is
unclear (Morgan and Gosnold, 1989). Low heat flow in the Sierra Nevada
and northwest Pacific Coastal provinces is related to subduction. Rela-
tively normal heat flow in the Colorado Plateau is inconsistent with the
elevation of the plateau. Different tectonic environments must reflect sig-
nificant differences on the propagation characterization.
The typical heat flow of the eastern Basin and Range is 90-105 mW
� ��
(Lachenbruch and Sass, 1977; Blackwell, 1978; Chapman et al., 1981).
Typical value of Colorado Plateau is typically 55-60 mW m ��
(Bodell and
Chapman, 1982) and exhibits less variability than the Basin and Range
region. Heat flow in the Wyoming basins is about 60 mW m ��
(Bodell and
Chapman, 1982; Chapman et al., 1984).

85
In anelastic or intrinsic attenuation, elastic energy is converted to heat,
causing amplitude decay with travel distance in additional to geometrical
spreading. It is also affected by scattering from small-scale heterogeneities
in the crust. The scattering deflects and redistributes amounts of energy in
the direct wave when it propagates the heterogeneous medium, distribut-
ing it into the seismic coda. The combined effect of anelastic attenuation
and scattering alter its shape by reducing high frequencies more rapidly
with distance than lower frequencies. Determining the mechanism of at-
tenuation and what causes regional differences is important to understand
the composition and the physical conditions of continental lithosphere
(Frankel, 1991).
There have been several explanations for the differences in attenuation
between tectonically active areas and stable ones. Aki (1980) suggested
that the strong attenuation in tectonically active ones is caused by the pres-
ence of fractures in the crust. He proposed that the attenuation of S waves
was caused by scattering from these fractures. Others (e. g. Gregersen,
1984) suggest that the strong attenuation of regional phases in certain ar-
eas may be caused by the lack of a continuous waveguide in the crust. Ac-
tive tectonic regions may have a blocklike crustal structure, possibly dis-
rupting Lg wave propagation. Another suggestion is that the differences
in temperature in the crust between the various regions. A related issue
is whether the attenuation in the crust is caused by anelasticity, whether
elastic energy is converted into heat, or by scattering from heterogeneities
in the crust. The mechanism of attenuation may vary with the tectonic
region (Frankel et al., 1990).

86
5.3 Mining events
Microearthquake studies in the eastern Wasatch Plateau (Taylor, 1994)
have indicated two types of seismic triggered or induced events: first,
small high frequency events such as caving of the roof from the longwall
mining and second, events located within a few kilometers of the mine in
a lateral or vertical direction. The first type is generally smaller than the
other and the most of the second types are characterized by dilatational fo-
cal mechanisms and apparent low stress drops (0.01 to 1 MPa; verified by
deficiency of high frequencies). Mining related events in Colorado Plateau
are related to the room-and-pillar methods (Arabasz and McCarter, 2000).
The source of our anomalous seismic events is assumed to be due to the
collapse of an underground mine. This collapse leads an implosional focal
mechanism in which the rock mass surrounding the seismic source sud-
denly moves inward and generating P waves (Wong and McGarr, 1990).
The characteristics of mine seismicity are related with the local geology
and type of mining operation. However, the characteristics signals are dif-
ferent from what would be expected for ”typical” tectonic events (Taylor,
1994).
The chemical explosions (normal mining activities) events detonated
in a typical work day in an industrial region, However, many of these
events are ripple-fired source. Hasegawa et al. (1989) and Johnston (1988)
have summarized anomalous seismicity associated with mining activities
as falling into two categories: events directly associated with mining activ-
ities (type 1) and triggered (or induced) events that can occur at distances
up to a few kilometers from a mine (type 2). The source of energy release

87
of type 1 is the rock mass at or immediately surrounding mining openings
and type 2 events are occurred to movements on faults planes near mining
(Pechmann et al., 1995).
5.4 Final considerations
The experimental correlation of regional attenuation values with heat
flow in Coast Ranges region of California and Basin and Range province
is not well defined, while the values show a good correlation in some re-
gions of United States. Central Coast Ranges of California shows lateral
variation of heat flow range from 50 - 105 mW m ��
(Sass et al., 1997). High
attenuation and various heat flow values in Coast Ranges region is not
well correlated each other. The heat flow is even less than 40 mW m ��
in
Sierra Nevada (Sass et al., 1981; ; Sass et al., 1997) due to a combination
of thermal transients resulting from Neogene subduction and extermely
low crustal radioactivity (Lacenbruch, 1968, 1970), even though it is a high
attenuation (� � ����� � � � � � ��� � �
) region (Nuttli, 1986).
The Wasatch front, among the zones of transition, shows high attenu-
ation and high heat flow values. The low crustal shear wave�� values in
the upper crust have been attributed to the motion of fluids in a networks
of cracks and results imply that fluids are present to 10 kilometer or more
in the crust (Mitchell, 1975, 1980).
Thus we may conclude from a regional perspective that the local ther-
mal regime of Utah is consistent with the Q pattern throughout the Wasatch
front, while unexpected thermal and attenuation relation occur in the Coast
Ranges of California. Further study may required to relate continental

88
lithosphere structure and tectonic evolution by comparing various�
val-
ues and comprehensive geophysical properties (e. g. heat flow) in United
States.
The current situation in much of the United States is the low rate of
earthquake activity so that neither local earthquake nor strong ground mo-
tion recordings exist sufficiently to define strong ground motion scaling re-
lations. Sufficient numbers of strong motion data applicable to developing
predictive relations exist in a few location of the western United States (e.
g. California). Abundant vertical component waveforms for small earth-
quakes in some regions provide some constraints on the extrapolation of
the California relations to the larger events for different regions. The com-
parative regional study result is only confined to small earthquakes until
now. Since the distance dependence is now well known, the results of this
study are important for seismic hazard and future studies can focus on the
scaling of ground motion with earthquake size in this region.

65
7. Appendix
Figure 7.1, 7.2, 7.3, and 7.4 describe initial, and final propagation func-
tionals, and final residuals of the regression analysis of 2.0, 4.0, 8.0, and 12
Hz ranges for Fourier velocity spectra.
Figure 7.5, 7.6, 7.7, and 7.8 describe initial, and final propagation func-
tionals, and final residuals of the regression analysis of 2.0, 4.0, 8.0, and 12
Hz ranges for band-pass filtered spectra.
Figure 7.9, 7.10, and 7.11 show duration data and regression lines as a
function of distance for frequencies of 2.0, 6.0, and 12 Hz.
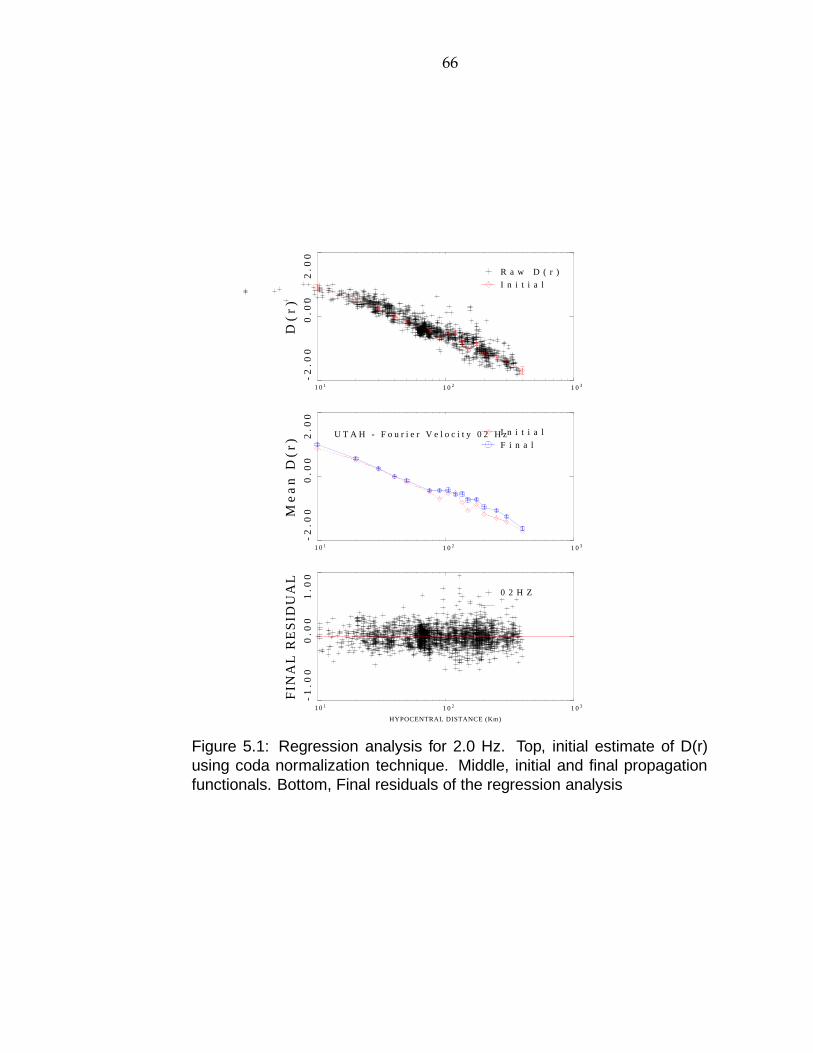
66
1 0 1 1 0 2 1 0 3
HYPOCENTRAL DISTANCE (Km)
-1
.00
0.0
0
FIN
AL
RE
SID
UA
L1
.00
0 2 H Z
1 0 1 1 0 2 1 0 3
-2
.00
0.0
0
Me
an
D(r
) 2.0
0
U T A H - F o u r i e r V e l o c i t y 0 2 H zI n i t i a l
F i n a l
1 0 1 1 0 2 1 0 3
-2
.00
0.0
0
D(
r)
2.0
0
R a w D ( r )
I n i t i a l
Figure 5.1: Regression analysis for 2.0 Hz. Top, initial estimate of D(r)using coda normalization technique. Middle, initial and final propagationfunctionals. Bottom, Final residuals of the regression analysis

67
1 0 1 1 0 2 1 0 3
HYPOCENTRAL DISTANCE (Km)
-1
.00
0.0
0
FIN
AL
RE
SID
UA
L1
.00
0 4 H Z
1 0 1 1 0 2 1 0 3
-2
.00
0.0
0
Me
an
D(r
) 2.0
0
U T A H - F o u r i e r V e l o c i t y 0 4 H zI n i t i a l
F i n a l
1 0 1 1 0 2 1 0 3
-2
.00
0.0
0
D(
r)
2.0
0
R a w D ( r )
I n i t i a l
Figure 5.2: Regression analysis for 4.0 Hz. Top, initial estimate of D(r)using coda normalization technique. Middle, initial and final propagationfunctionals. Bottom, Final residuals of the regression analysis

68
1 0 1 1 0 2 1 0 3
HYPOCENTRAL DISTANCE (Km)
-1
.00
0.0
0
FIN
AL
RE
SID
UA
L1
.00
0 8 H Z
1 0 1 1 0 2 1 0 3
-2
.00
0.0
0
Me
an
D(r
) 2.0
0
U T A H - F o u r i e r V e l o c i t y 0 8 H zI n i t i a l
F i n a l
1 0 1 1 0 2 1 0 3
-2
.00
0.0
0
D(
r)
2.0
0
R a w D ( r )
I n i t i a l
Figure 5.3: Regression analysis for 8.0 Hz. Top, initial estimate of D(r)using coda normalization technique. Middle, initial and final propagationfunctionals. Bottom, Final residuals of the regression analysis
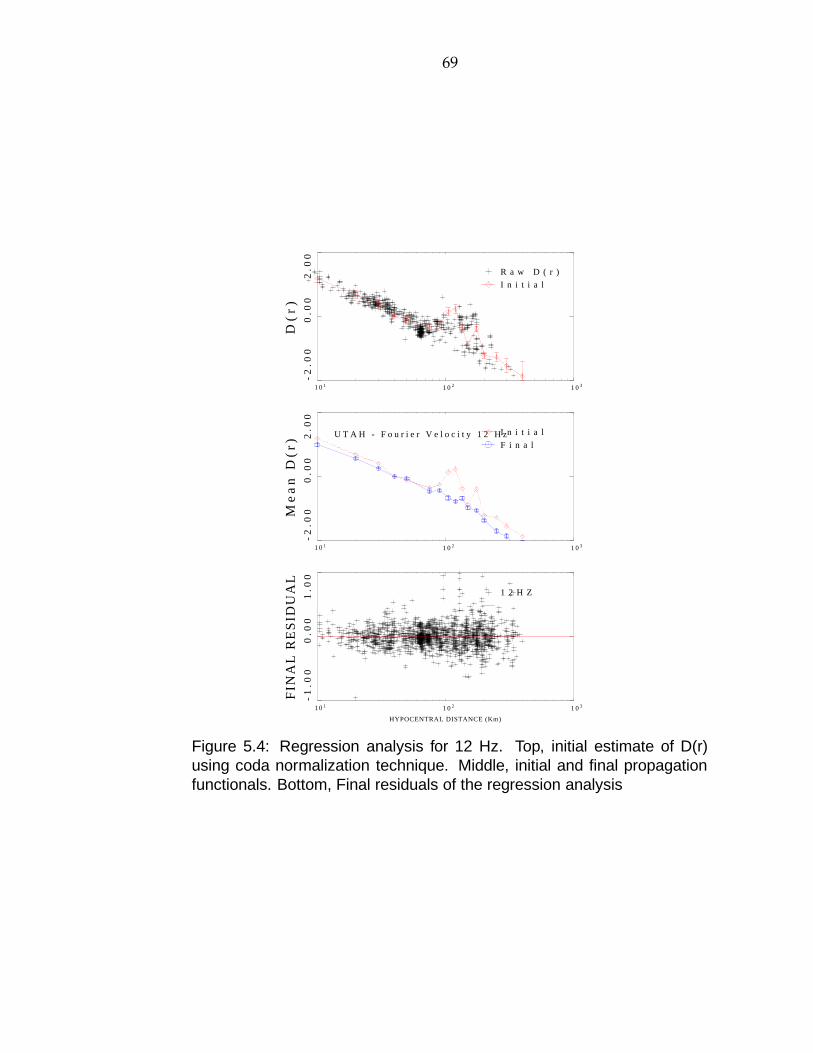
69
1 0 1 1 0 2 1 0 3
HYPOCENTRAL DISTANCE (Km)
-1
.00
0.0
0
FIN
AL
RE
SID
UA
L1
.00
1 2 H Z
1 0 1 1 0 2 1 0 3
-2
.00
0.0
0
Me
an
D(r
) 2.0
0
U T A H - F o u r i e r V e l o c i t y 1 2 H zI n i t i a l
F i n a l
1 0 1 1 0 2 1 0 3
-2
.00
0.0
0
D(
r)
2.0
0
R a w D ( r )
I n i t i a l
Figure 5.4: Regression analysis for 12 Hz. Top, initial estimate of D(r)using coda normalization technique. Middle, initial and final propagationfunctionals. Bottom, Final residuals of the regression analysis

70
1 0 1 1 0 2 1 0 3
HYPOCENTRAL DISTANCE (Km)
-1
.00
0.0
0
FIN
AL
RE
SID
UA
L1
.00
0 2 H Z
1 0 1 1 0 2 1 0 3
-2
.00
0.0
0
Me
an
D(r
) 2.0
0
U T A H - B a n d P a s s 0 2 H z I n i t i a l
F i n a l
1 0 1 1 0 2 1 0 3
-2
.00
0.0
0
D(
r)
2.0
0
R a w D ( r )
I n i t i a l
Figure 5.5: Regression analysis for 2.0 Hz. Top, initial estimate of D(r)using coda normalization technique. Middle, initial and final propagationfunctionals. Bottom, Final residuals of the regression analysis

71
1 0 1 1 0 2 1 0 3
HYPOCENTRAL DISTANCE (Km)
-1
.00
0.0
0
FIN
AL
RE
SID
UA
L1
.00
0 4 H Z
1 0 1 1 0 2 1 0 3
-2
.00
0.0
0
Me
an
D(r
) 2.0
0
U T A H - B a n d P a s s 0 4 H z I n i t i a l
F i n a l
1 0 1 1 0 2 1 0 3
-2
.00
0.0
0
D(
r)
2.0
0
R a w D ( r )
I n i t i a l
Figure 5.6: Regression analysis for 4.0 Hz. Top, initial estimate of D(r)using coda normalization technique. Middle, initial and final propagationfunctionals. Bottom, Final residuals of the regression analysis

72
1 0 1 1 0 2 1 0 3
HYPOCENTRAL DISTANCE (Km)
-1
.00
0.0
0
FIN
AL
RE
SID
UA
L1
.00
0 8 H Z
1 0 1 1 0 2 1 0 3
-2
.00
0.0
0
Me
an
D(r
) 2.0
0
U T A H - B a n d P a s s 0 8 H z I n i t i a l
F i n a l
1 0 1 1 0 2 1 0 3
-2
.00
0.0
0
D(
r)
2.0
0
R a w D ( r )
I n i t i a l
Figure 5.7: Regression analysis for 8.0 Hz. Top, initial estimate of D(r)using coda normalization technique. Middle, initial and final propagationfunctionals. Bottom, Final residuals of the regression analysis

73
1 0 1 1 0 2 1 0 3
HYPOCENTRAL DISTANCE (Km)
-1
.00
0.0
0
FIN
AL
RE
SID
UA
L1
.00
1 2 H Z
1 0 1 1 0 2 1 0 3
-2
.00
0.0
0
Me
an
D(r
) 2.0
0
U T A H - B a n d P a s s 1 2 H z I n i t i a l
F i n a l
1 0 1 1 0 2 1 0 3
-2
.00
0.0
0
D(
r)
2.0
0
R a w D ( r )
I n i t i a l
Figure 5.8: Regression analysis for 12 Hz. Top, initial estimate of D(r)using coda normalization technique. Middle, initial and final propagationfunctionals. Bottom, Final residuals of the regression analysis

74
0 . 0 0 1 0 . 0 0 2 0 . 0 0 3 0 . 0 0DISTANCE (KM) * 1 0 1
4 0 . 0 0 5 0 . 0 0 6 0 . 0 0
0.0
01
0.0
02
0.0
03
0.0
0
DU
RA
TIO
N (
SE
C) 4
0.0
05
0.0
06
0.0
0
0 2 H z
Figure 5.9: Duration data and regression lines as a function of distance forfiltered frequency of 2.0 Hz

75
0 . 0 0 1 0 . 0 0 2 0 . 0 0 3 0 . 0 0DISTANCE (KM) * 1 0 1
4 0 . 0 0 5 0 . 0 0 6 0 . 0 0
0.0
01
0.0
02
0.0
03
0.0
0
DU
RA
TIO
N (
SE
C) 4
0.0
05
0.0
06
0.0
0
0 6 H z
Figure 5.10: Duration data and regression lines as a function of distancefor filtered frequency of 6.0 Hz

76
0 . 0 0 1 0 . 0 0 2 0 . 0 0 3 0 . 0 0DISTANCE (KM) * 1 0 1
4 0 . 0 0 5 0 . 0 0 6 0 . 0 0
0.0
01
0.0
02
0.0
03
0.0
0
DU
RA
TIO
N (
SE
C) 4
0.0
05
0.0
06
0.0
0
1 2 H z
Figure 5.11: Duration data and regression lines as a function of distancefor filtered frequency of 12 Hz

Bibliography
Aki, K., 1980. Scattering and attenuation of shear waves in the litho-sphere, J. Geophys. Res., 85, 6496-6504.
Algermissen, S.T. and D. M. Perkins, 1976. A probabilistic estimate ofmaximum acceleration in rock in the contiguous United States, U.S.Geol. Surv., Open-File Rept. 76-416, 45pp.
Anderson, J. G., and Y. Lei (1994). Nonparametric description of peak ac-celeration as a function of magnitude, distance, and site in Guerrero,Mexico, Bull. Seis. Soc. Am. 84, 1003-1017.
Arabasz, W. J., and M. K. McCarter (2000). Mine seismicity and the inter-face between mining engineers and seismologists (abstract), Seism.Res. Lett., 71 (2), 220.
Arabasz, W. J., Smith, R. B. and Richins, W. D., 1980. Earthquake studiesalong the Wasatch front, Utah: Network monitoring, sesimicity, andseismic hazards, Bull. Seis. Soc. Am., 70. 1479-1499.
Atkinson, G. M. (1993). Earthquake source spectra and attenuation insoutheastern Canada, University of Western Ontario, London, Ontario,Ph.D. thesis.
Atkinson, G. M., and D. M. Boore (1995). Ground-motion relations foreastern North America, Bull. Seis. Soc. Am. 85, 17-30.
Atwater, T., 1970. Implications of plate tectonics for the Cenozoic tectonicevolution of western North America. Geol. Soc. Am. Bull., 81: 3513-3536.
Baqer, S., and Mitchell, B. J., 1998. Regional variation of Lg coda Q inthe continental United States and its relation to crustal structure andevolution, Pure appl. geophys., 153, 613-638.
Blackwell, D. D., 1978. Heat flow and energy loss in the western UnitedStates. In: R. B. Smith and G. P. Eaton (Editors). Cenozoic Tectonicsand Regional Geophysics of the Western Cordillera. Geol. Soc. Am.Mem., 152: 175-208.
Best, M. G., and Brimhall, W. H., 1974. Late Cenozoic alkalic basalticmagmas in the western Colorado plateaus and the Basin and Rangetransition zone, U.S.A., and their bearing on mantle dynamics: Geol.Soc. Am. Bul., 85, 1677-1690.
77

78
Boatwright, J. (1982). A dynamic model for far-field acceleration, Bull.Seis. Soc. Am. 72, 1049-1068.
Bodell, J. M. and Chapman, D. S., 1982. Heat flow in the north-centralColorado Plateau. J. Geophys. Res., 87, 2869-2884.
Boore, D. M. (1983). Stochastic simulation of high-frequency ground mo-tion based on seismological models of the radiated spectra, Bull. Seis.Soc. Am.,73, 1865-1894.
Boore, D. M. and Atkinson, G. M. (1987). Stochastic prediction of groundmotion and spectral response parameters at hard-rock sites in East-ern North America, Bull. Seis. Soc. Am., 77, 440-467.
Boore, D. M. (1996). SMSIM — Fortran Programs for Simulating GroundMotions from Earthquakes: Version 1.0, U.S. Geological Survey Open-File Report 96-80-A, 73 pp
Bouchon, M. (1978). A dynamic source model for the San Fernando earth-quake, Bull. Seis. Soc. Am. 68, 1555-1576.
Bucher, R. L. and Smith R.B., 1971. Crustal structure of the eastern Basinand Range province and the northern Colorado Plateau from phasevelocities of Rayleigh waves in The Structure and Physical Proper-ties of the Earth’s Crust, Am. Geophys. Union Monograph 14, John G.Heacock, Editor, 59-70.
Cartwright, D. E. and M. S. Longuet-Higgins (1956). The statistical distri-bution of the maxima of a random function, Proc. Roy. Soc. London,Ser. A237, 212-223.
Castro, R. R., J. G. Anderson, and S. K. Singh (1990). Site response, at-tenuation, and source spectra of S waves along the Guerrero, Mexicosubduction zone, Bull. Seis. Soc. Am., 80, 1481-1503.
Chapman, D. S., Clement, M. D. and Mase, C. W., 1981. Thermal regimeof the Escalante Desert, Utah, with an analyses of the Newcastlegeothermal system, J. Geophys. Res., 86, 11735-11746.
Chapman, D. S., Keho, T. H., Bauer, M.S and Picard, M.D., 1984. Heatflow in the Unita Basin determined from bottom hole temperature(BHT) data, Geophysics. 49, 453-466.
Chavez, D. E. & Priestley, K. F., 1986. Measurement of frequency de-pendent Lg attenuation in the Great Basin, Geophys. Res. Lett., 13,551-554.

79
Cluff, L. S., L. F. Hintze, G. E. Brogan, and C. E. Glass, 1975. Recent activ-ity of the Wasatch fault, northwestern Utah, U. S. A., Tectonophysics,29, 161-168.
Cultrera, G., Boore, D. M., Joyner, W. B., and Dietel, C. M., 1999. Non-linear soil response vicinity of the Van Norman complex followingthe 1994 Northridge, California, Earthquake, Bull. Seis. Soc. Am., 89,1214-1231.
Eaton, G. P., 1982. The Basin and Range Province: Origin and tectonicsignificance. Annu. Rev. Earth Planet. Sci., 10: 409-440.
Frankel, A. (1982). Source parameters and scaling relationships of smallearthquakes in the northern Caribean, Bull. Seis. Soc. Am., 72, 1173-1190.
Frankel, A. (1991). Mechanisms of seismic attenuation in the crust: Scat-tering and anelasticity in New York state, South Africa, and SouthernCalifornia, J. Geophys. Res., 96, 6269-6289.
Frankel, A., McGarr, A., Bicknell, J., Mori, J., Seeber, L., and Cranswick,E., 1990. Attenuation of high-frequency shear waves in the crust:Measurements from New York state, South Africa, and Southern Cal-ifornia, J. Geophy. Res., 95, 17441-17457.
Gans P. B., Mahood G. A. and Schermer E., 1989. Synextensional Magma-tism in the Basin and Range province, Geological Society of America,Special Paper, 233, 1989.
Gregerson, S., 1984. Lg-wave propagation and crustal structure differ-ences near Denmark and the North Sea, Geophys. J. R. Astro. Soc., 79,217-234.
Guidebook to the geology of Utah, Utah Geological Society No 18, 1964.
Guidebook to the geology of Utah, Park City district Utah. No 22, 1968.
Harmsen, S. (1997). Estimating the diminution of shear-wave amplitudewith distance: application to the Los Angeles, California, urban area,Bull. Seis. Soc. Am. 87, 888-903.
Hasegawa, H. S., R. J. Wetmiller, and D. J. Gendzwill (1989). Inducedseismicity in mines in Canada-An overview, Pageoph, 129, 423-453.
Herrmann, R. B. (2000). Comparative ground motion studies, USGS AwardNumber: 1434-HQ-97-GR03090.

80
Herrmann, R. B., 1985. An extension of Random Vibration Theory esti-mates of strong ground motion to large earthquakes, Bull. Seis. Soc.Am., 75, 1447-1453.
Hose, R. K., and Blake, M.c., Jr., 1976. Geological and mineral resourcesof White Pine Country, Nevada; Part 1, Geology: Nevada Bureau ofMines and Geology Bulletin, 85, p. 1-35.
http://www-ep.es.llnl.gov/tvp/sac.html.
http://quakes.oce.orst.edu/moment-tensor/.
Idriss, I.M. (1985). ”Evaluating seismic rick in engineering practive,” Pro-cessings of the 11th International Conference on Soil Mechanics and Foun-dation Engineering, San Francisco, 1, 255-320.
Johnston, J. C. (1988). A survey of mining associated rockbursts, M.S. Thesis, Massachusetts Institute of Technology, Cambridge, Mas-sachusetts.
Joyner, W. B. and D. M. Boore (1980). A stochastic source model for syn-thetic strong motion seismograms, Proc. of 7th World Conf. on Earth-quake Eng., 1-8.
Kramer, S.(1996). Geotechnical earthquake engineernig, Prentice Hall,Upper Saddle River, NJ, 07458, 653.
Lachenbruch, A. H., Preliminary geothermal model of the Sierra Nevada,J. Geophy. Res., 73, 6977-6989, 1968.
Lachenbruch, A. H., Crustal temperature and heat production: Implica-tions of the linear heat flow relation, J. Geophy. Res., 75, 3291-3300,1970.
Lachenbruch, A. H. and Sass, J. H., 1977. Heat flow in the United Statesand the thermal regime of the crust. In: J. G. Heacock (Editor), TheEarth’s Crust. Am. Geophys. Union, Geophys. Monogr., 20: 626-675.
Lachenbruch, A. H. and Sass, J. H., 1978. Models of an extending litho-sphere and heat flow in the Basin and Range province, Geol. Soc. Am.Mem., 152, 209-250.
Malagnini, L. (1999). Ground motion scaling in Italy and Germany, Ph.D. Dissertation, Saint Louis University.
Mayeda, K., S. Koyanagi, M. Hoshiba, K, Aki, and Y. Zeng (1992). A com-parative study of scattering, intrinsic and coda
� ��
for Hawaii, LongValley, and central California between 1.5 and 15.0 Hz, J. Geophys.Res., 97, 6643-6660.

81
Mitchell, B. J., 1975. Regional Rayleigh wave attenuation in North Amer-ica, J. geophy. Res., 85, 5212-5218.
Mitchell, B. J., 1980. Frequency dependence of shear wave internal fric-tion in the continental crust of eastern North America, Geophys. J.Int., 85, 5212-5218.
Mitchell, B. J. and Xie, J.K., 1994. Attenuation of multiphase waves inthe Basin and Range Province-3. Inversion for crustal anelasticity,Geophys. J. Int., 116, 468-484.
Morgan, P., and Gosnold, W. D., 1989. Heat flow and thermal regimesin the continental United States, Geological Society of America, Memoir172, 1989.
Nuttli, O. W., 1986. Yield estimates of Nevada test site explosions ob-tained from seismic Lg waves, J. Geophy. Res., 91, 2137-2152.
Ou, G. B. and R. B. Herrmann (1990). A statistical model for ground mo-tion produced by earthquakes at local and regional distances, Bull.Seis. Soc. Am., 80, 1397-1417.
Pechmann, J. C., Walter, W. R., Nava, S. J., and Arabasz, W. J. (1995). TheFebruaruy 3, 1995, � � 5.1 seismic event in the Trona mining districtof southwestern Wyoming, Seis. Re. Lett. 66, No. 3.
Peseckis, L. L. & Pomeroy, P. W., 1984. Determination of Q using Lgwaves and its implications for nuclear yield estimation, EOS, Trans.Am. geophys. Un., 65, 995.
Phillips, W. S. and K. Aki (1986). Site amplification of coda waves fromlocal earthquakes in central California, Bull. Seis. Soc. Am., 76, 627-648.
Powell, W. G. and Chapman, D. S., 1990. A detailed study of heat flow atthe Fifth Water Site, Utah, in the Basin and Range-Colorado Plateautransition, Tectonophysics, 176: 291-314.
Priestley, K and Brune, J., 1978. Surface waves and structure of the GreatBasin of Nevada and western Utah, J. Geophy. Res., 83, 2265-2273.
Raoof, M., R. B. Herrmann, and L. Malagnini (1999). Attenuation andexcitation of three component ground motion in Southern California,Bull. Seis. Soc. Am., 89, 888-902.
Reiter, M., Mansure, A. J. and Shearer, C., 1979. Geothermal characteris-tics of the Colorado Plateau. Tectonophysics, 61: 183-195.
82
Rogers, A. M., Harmsen, S. C., Herrmann, R. B. & Meremonte, M. E.,1987. A study of ground motion attenuation in the southern GreatBasin, Nevada-California, using several techniques for estimates of� � , log � � , and coda Q, J. Geophy. Res., 92, 3527-3540.
Samiezade-Yard, M., 1993. Ground motion studies in the southern GreatBasin of Nevada and California, Ph. D. Dissertation, Saint Louis Uni-versity.
Sanchez-Sesma, F. and Campillo, M. (1993). ”Topographic effects for inci-dent P, SV, and Rayleigh waves,” Tectonophysics, 218, No. 1-3, 113-125.
Sass, J. H., D. D. Blackwell, D. S. Chapman, J. K. Costain, E. R. Decker, L.A. Lawver, and C. A. Swanberg, 1981. Heat flow from the crust of theUnited States, in Physical Properties of Rocks and Minerals, edited by Y.S. Touloukian, W. R. Judd, and R. F. Roy, pp. 503-548, McGraw-Hill,New York.
Sass, J. H., C. F. Williams, Arthur H. Lachenbruch, S. P. Galanis Jr., F. V.Grubb, 1997. Thermal regime of the San Andreas fault near Park-field, California, J.Geophys. Res., 102, 27575-27585.
Singh, S. and R. B. Herrmann, 1983. Regionalization of crustal Q in thecontinental United States, J. Geophys. Res., 88, 527-538.
Slemmons, D. B. and Mckkinney, R. (1977). ”Definition of ’active fault’”,Miscellaneous Paper S-77-8, U.S. Army Corps of Engineers WaterwaysExperiment Station, Vicksburg, Mississippi.
Smith, R. B., 1974. Seismicity and earthquake hazards of the Wasatchfront, Utah, July-August, 1974, Earthquake Information Bulletin 6, 12-17.
Smith, R. B., Meertens, C. M., and Martinez, L. J. (1998). Implications ofGPS deformation measurements on earthquake hazard assessmenton the Wasatch Fault zone, Seismological Research Letters, 69, 141.
Stewart, J. H., and Poole, F. G., 1974. Lower Paleozoic and uppermostPrecambrian of the Cordilleran miogeocline, Great Basin, westernUnited States, in Dickinson, W. R., ed., Tectonics and sedimentation;Society of Economic Mineralogists and Paleontologists Special Pub-lication 22, p. 28-57.
Stewart, J. H., and Carlson, J. E., 1976. Cenozoic rocks of Nevada; Fourmaps and brief description of distribution, lithology, age and centersof volcanism: Nevada Bureau of Mines and Geology Map 52, scale 1: 1,000,000.
83
Su, F., K. Aki, T. Teng, Y. Zeng, S. Koyanagi, and K. Mayeda (1992). Therelation between site amplification factor and surficial geology incentral California, Bull. Seis. Soc. Am., 82, 580-602.
Taylor, S. R. (1994). False alarms and mine seismicity: An example fromthe Gentry Mountain mining region, Utah, Bull. Seis. Soc. Am.,84,350-358.
Trifunac, M. D. and Brady, A. G. (1975). ”A study of the duration of strongearthquake ground motion,” Bull. Seis. Soc. Am., 65, 581-626.
University of Utah Seismograph Stations (UUSS) Home Page (2000), http://www.seis.utah.edu/HTML/UtahsEarthquakeThreat2.html/.
University of Utah Seismograph Stations Home Page (2000), http://www.ugs.state.ut.us/geohist.htm/.
U.S. Geological Survey, 1976. A Study of earthquake losses in the SaltLake City, Utah area, U. S. Geol. Surv., Open-File Rept. 76-89, 357 pp.
Vanmarke, E. H. and S. P. Lai (1980). Strong-motion duration of earth-quake, Bull. Seis. Soc. Am. 70, 1293-1307.
Vidale, J. E. and Helmberger, D. V. (1988). ”Elastic finite difference of the1971 San Fernando earthquake,” Bull. Seis. Soc. Am. 78, 122-141.
Wernicke, B., 1981. Low-angle normal faults in the Basin and Rangeprovince: Nature, 291, 645-648.
Wong, I. G. and A. McGarr (1990). Implosional failure in mining inducedseismology: A critical review, in Proc. Second Int. Symp. on Rock-bursts and Seismicity in Mines, C. Fairhurst (Editor), Rotterdam, TheNetherlands, 45-51.
Xie, J. and B. J. Mitchell, (1990). Attenuation of multiphase surfaces wavesin the Basin and Range province, part 1: Lg and Lg coda, Geophys. J.Int., 102, 121-137.
Zandt and Owens, 1980. Crustal flexure associated with normal faultingand implications for seismicity along the Wasatch Front, Utah, Bull.Seis. Soc. Am. 70, 1501-1520.
Zoback, M. L., Anderson, R. E., and Thompson, G. A., 1981, Cenozoicevolution of the state of stress and style of tectonism of the Basin andRange province of the western United States; Royal Society of LondonPhilosophical Transactions, ser. A, 300, 407-434.

Vita Auctoris
Young-Soo Jeon was born in Seoul, Korea on September 27, 1968. He
finished his elementary and secondary education in Seoul. After attending
Sang-ji University he graduated with a B. E. degree in Mineral and Mining
Engineering in February 1995. After this, he entered the army because it
was a basic obligation for young Korean males. He then enrolled at Yonsei
University and graduated with an M. S. degree in Geophysics in February
1997.
After that, while he worked as a researcher at Natural Science Center at
Yonsei University, one of his mentors who works at the KIGAM (Korea In-
stitute of Geology, Mining and Materials) seismology branch encouraged
him to start his future work in Seismology. Even though the topic was
totally new for him, he decided to pursue that field and joined the Saint
Louis University, Department of Earth and Atmospheric Sciences in Au-
gust 1998 to pursue an M. S. degree in geophysics.
84