Embed Size (px)
Citation preview

ORNL/TM-2005/548
Selection and Characterization of Carbon Black and Surfactants for Development of Small Scale Uranium Oxicarbide Kernels
November 2005 Prepared by Cristian I. Contescu Senior Staff Member Oak Ridge National Laboratory
ii
DOCUMENT AVAILABILITY Reports produced after January 1, 1996, are generally available free via the U.S. Department of Energy (DOE) Information Bridge:
Web site: http://www.osti.gov/bridge
Reports produced before January 1, 1996, may be purchased by members of the public from the following source:
National Technical Information Service 5285 Port Royal Road Springfield, VA 22161 Telephone: 703-605-6000 (1-800-553-6847) TDD: 703-487-4639 Fax: 703-605-6900 E-mail: [email protected] Web site: http://www.ntis.gov/support/ordernowabout.htm
Reports are available to DOE employees, DOE contractors, Energy Technology Data Exchange (ETDE) representatives, and International Nuclear Information System (INIS) representatives from the following source:
Office of Scientific and Technical Information P.O. Box 62 Oak Ridge, TN 37831 Telephone: 865-576-8401 Fax: 865-576-5728 E-mail: [email protected]
Web site: http://www.osti.gov/contact.html
This report was prepared as an account of work sponsored by an agency of the United States Government. Neither the United States government nor any agency thereof, nor any of their employees, makes any warranty, express or implied, or assumes any legal liability or responsibility for the accuracy, completeness, or usefulness of any information, apparatus, product, or process disclosed, or represents that its use would not infringe privately owned rights. Reference herein to any specific commercial product, process, or service by trade name, trademark, manufacturer, or otherwise, does not necessarily constitute or imply its endorsement, recommendation, or favoring by the United States Government or any agency thereof. The views and opinions of authors expressed herein do not necessarily state or reflect those of the United States Government or any agency thereof.

Metals and Ceramics Division
SELECTION AND CHARACTERIZATION
OF CARBON BLACK AND SURFACTANTS
FOR DEVELOPMENT OF SMALL SCALE URANIUM OXICARBIDE KERNELS
Cristian I. Contescu
Timothy D. Burchell
Date published: November 2005
Prepared by OAK RIDGE NATIONAL LABORATORY
One Bethel Valley Road, P.O.Box 2008 Oak Ridge, Tennessee 37831-6087
Managed by
U. T. BATTELLE, LLC
For the U.S. DEPARTMENT OF ENERGY
Under contract DE-AC05-00OR22725

ii
This page was intentionally left blank.
iii
CONTENTS Page LIST OF FIGURES……………………………………………………………………………… v LIST OF TABLES……………………………………………………………………………….. ix ACRONYMS…………………………………………………………………………………….. xi ACKNOWLEDGMENTS………………………………………………………………………… xiii ABSTRACT………………………………………………………………………………………. xv
1. INTRODUCTION…………………………………………………………………………… 1
1.1. GOALS OF THIS PROJECT…………………………………………………………. 1
1.2. WORK INCLUDED AND STRUCTURE OF REPORT……………………………. 2
1.3. BACKGROUND INFORMATION ON DISPERSING CARBON BLACK
IN AQUEOUS MEDIA………………………………………………………………… 3
1.3.1. Carbon Black Properties that Affect Water Dispersability………………………. 3
1.3.2. The Dispersing Process…………………………………………………………… 4
1.3.3. Dispersing Agents……………………………………………………………….... 4
1.4. METHODS AVAILABLE FOR CARBON BLACK CHARACTERIZATION……….. 5
1.5. TECHNICAL APPROACH ……………………………………………………………. 7
2. CHARACTERIZATION OF BENCHMARK AND CANDIDATE CARBONS……………. 10
2.1 SURFACE AREA AND POROSITY BY NITROGEN ADSORPTION………………… 10
2.2 MORPHOLOGICAL CHARACTERIZATION BY ELECTRON MICROSCOPY…….. 15
2.3 ELEMENTAL ANALYSIS………………………………………………………………. 19
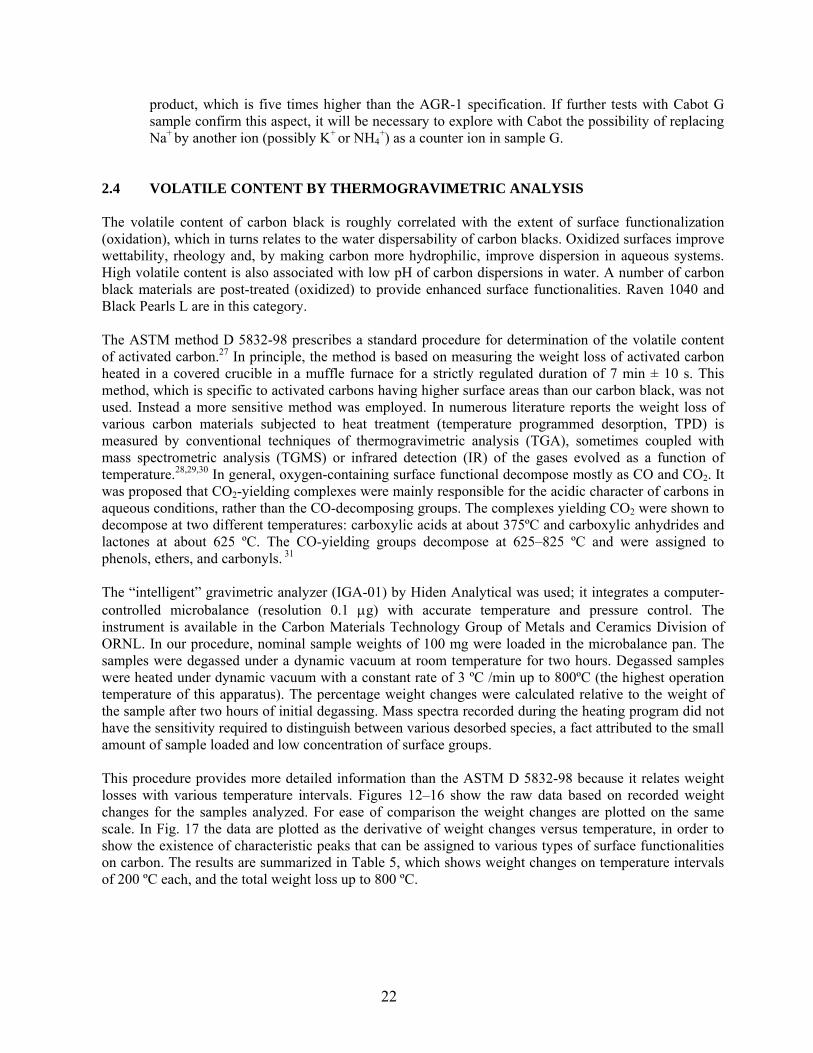
2.4 VOLATILE CONTENT BY THERMOGRAVIMETRIC ANALYSIS………………… 22
2.5 METHODS FOR CHARACTERIZATION OF SURFACE CHEMISTRY…………….. 27
2.5.1. Surface Composition by XPS……………………………………………………… 27
2.5.2. Derivation of pKa Spectra of Surface Functionalities from Potentiometric Titration 33
2.5.2.1. Background and significance…………………………………………….. 33
2.5.2.2. Procedure…………………………………………………………………. 36
2.5.2.3. Calibration……………………………………………………………….. 38
2.5.2.4. Results…………………………………………………………………… 40
2.5.3. Surface Groups by FTIR Spectroscopy…………………………………………… 47

iv
3. CHARACTERIZATION OF SURFACTANTS………………………………………………. 50
3.1 ANIONIC SURFACTANTS………………………………………………………………. 50
3.2 NONIONIC SURFACTANTS……………………………………………………………. 51
4. CHARACTERIZATION OF DISPERSIONS STABILITY…………………………………… 54
4.1. BENCHMARK CARBONS AND NONIONIC DISPERSANTS……………………… 54
4.1.1. Comparison of BorchiGen 0451 and Tergitol XD………………………………… 54
4.1.2. Dispersion Stability and pH Effects on Tergitol XD……………………………… 55
4.2. SURFACE MODIFIED CARBONS (CABOT KIT) …………………………………… 56
4.2.1. Background………………………………………………………………………… 56
4.2.2. Water Dispersability of Surface Modified Cabot Samples………………………… 57
4.2.2.1. Dispersions in water………………………………………………………. 57
4.2.2.2. Dispersions in HMTA/urea and simulated broth…………………………. 58
4.2.2.3. Particle size distribution in carbon dispersions…………………………… 63
5. PROPOSAL FOR PROCESS OPTIMIZATION………………………………………………… 68 6. SUMMARY…………………………………………………………………………………….. 71 APPENDIX …………………………………………………………………………………………. 72 REFERENCES………………………………………………………………………………………. 75
v
LIST OF FIGURES
Figure Page 1 Nitrogen adsorption isotherms at 77 K of benchmark carbons and selected carbons black
candidates…………………………………………………………………………………… 11
2 Nitrogen adsorption isotherms at 77 K of several surface-modified carbon blacks from the Cabot kit ……………………………………………………………………………………. 12
3 Cumulative nitrogen surface area versus pore width for benchmark and selected carbon black
candidates……………………………………………………………………………………. 13 4 Cumulative nitrogen surface area versus pore width for surface-modified carbon black from Cabot kit …………………………………………………………………………………….. 13
5 Incremental pore volume versus pore width for benchmark and selected carbons black candidates …………………………………………………………………………………… 14
6 Incremental pore volume versus pore width for surface-modified carbon blacks from Cabot kit ………………………….. ………………………………………………………… 14
7 STEM images of benchmark carbon Raven 1000 ……………………………………………. 16
8 STEM images of benchmark carbon Black Pearls L…………………………………………. 16
9 STEM images of candidate carbon Raven 1040…………………………………………….. 16
10 STEM images of candidate carbon Raven M (880) ………………………………………….. 17 11 STEM images of surface-modified Cabot sample G………………………………………… 17
12 Weight changes during thermogravimetric analysis of Raven 1000………………………… 23
13 Weight changes during thermogravimetric analysis of Black Pearls L……………………… 23
14 Weight changes during thermogravimetric analysis of Raven 1040………………………… 24
15 Weight changes during thermogravimetric analysis of Raven M (880) ……………………… 24
16 Weight changes during thermogravimetric analysis of Cabot sample G……………………… 25
17 Curves of weight derivative versus temperature during thermogravimetric analysis of selected carbons……………………………………………………………………………… 25
18 High resolution XPS spectra of elements detected on the surface of Raven 1000 ………….. 29
19 High resolution XPS spectra of elements detected on the surface of Raven M (880) ………. 30
vi
20 High resolution XPS spectra of elements detected on the surface of Cabot sample G……….. 31
21 Overlaid high resolution XPS spectra of elements detected on the surface of selected carbons 32
22 High resolution TEM image showing the onion-like arrangement of graphene layers in the structure of primary particles of a carbon black sample (Black Pearls L) …………………… 34
23 Schematic representation of oxygen-containing functional group on edge positions of graphene layers in carbon…………………………………………………………………… 35
24 Automatic titration station Titrino 798 used for carbon characterization by potentiometric titration……………………………………………………………………………………… 36
25 Proton binding isotherm (normalized) measured by potentiometric titration for a citric acid standard…………………………………………………………………………… 39
26 Proton affinity spectrum (pKa spectrum) obtained for a citric acid standard……………….. 40
27 Proton binding isotherms measured for benchmark and unmodified carbon blacks………. 41
28 Proton binding isotherms measured for surface modified Cabot samples…………………… 42
29 Proton affinity distribution spectra (pKa spectra) of benchmark and unmodified carbon black samples………………………………………………………………………………… 43
30 Proton affinity distribution spectra (pKa spectra) for surface-modified Cabot samples……… 44
31 FTIR spectra of benchmark and unmodified carbon black samples………………………… 48
32 FTIR spectra of surface-modified Cabot carbon samples……………………………………. 48 33 FTIR spectrum of Tamol SN and a transformed plot used for identification with a similar anionic surfactant…………………………………………………………………… 51
34 FTIR spectrum of Tergitol XD and a transformed plot used for identification with a similar nonionic surfactant………………………………………………………………….. 53
35 Comparison of stability of dispersions prepared from Raven 1000 dispersed with nonionic surfactants BorchiGen 0451 and Tergitol XD …………………………………… 54
36 Test results showing long-time stability, over a large pH range, of dispersions formed with Raven 1000 and Tergitol XD……………………………………………………………………. 56
37 Test results showing differences in water dispersability of surface-modified Cabot carbons and the long-term stability of dispersion obtained from sample G………………………… 58
38 Test results showing dispersion stability of Cabot samples E, F, G in HMTA/urea solutions and in simulated broth…………………………………………………………… 62
39 Particle size distribution of surface-modified sample E self-dispersed in water, at various sonication times………………………………………………………………… 64
vii
40 Particle size distribution of surface-modified sample F self-dispersed in water, at various sonication times…………………………………………………………………. 64
41 Particle size distribution of surface-modified sample G self-dispersed in water, at various sonication times…………………………………………………………………. 65 42 Particle size distributions typical of surface-modified Cabot sample G dispersed in water……………………………………………………………………………………… 66
43 Particle size distribution of surface-modified sample G self-dispersed in HMTA/urea at 10 minutes sonication time………………………………………………………………… 67

viii
This page was intentionally left blank.
ix
LIST OF TABLES Table Page 1 Surface area values and micropore volumes for benchmark and selected carbons…………… 12 2 Primary particle sizes (in nm) based on STEM images ………………………………………… 18
3 AGR-1 specification of contaminants in the fuel kernel end-product………………………… 19
4 Results of elemental and trace metal analysis of selected carbon blacks and surface-modified carbons……………………………………………………………………. 21
5 Results of volatile content measurements by thermal analysis……………………………… 26
6 Atomic concentration of elements detected by XPS in the surface layer of selected carbons… 27 7 Chemical states for elements detected by XPS in the surface layer of selected carbons…….. 28
8 Apparent acidity constants vs. published data, and normalized amounts of acid groups measured by potentiometric titration of a citric acid standard……………………………….. 40
9 Characterization of acid-base properties of functional groups on carbon samples based on analysis of pKa spectra…………………………………………………………………… 45
10 Experimental details for the test on effects of pH on Raven 1000 dispersions with Tergitol XD…………………………………………………………………………………… 55
11 Composition of simulated broth……………………………………………………………… 60
12 Components of simulated broth preparations ………………………………………………… 60
13 Stability tests for surface-modified carbon dispersions in HMTA/urea solution and simulated broth………………………………………………………………………………… 61
14 Statistical values derived from particle size measurements of surface-modified carbons…… 66 Appendix Table A1 Carbon black properties characterized, values measured and desired range or trend…. 72

x
This page was intentionally left blank.
xi
ACRONYMS ADUN acid-deficient uranyl nitrate
AGR advanced gas-cooled reactor
ASTM American Society for Testing of Materials
BET Brunauer, Emmett and Teller (theory)
BWXT BWX Technologies
DAR dispersing agent requirement
DC direct current
DFT density functional theory
DI de-ionized (water)
EAG Evans Analytical Group
ESCA electron spectroscopy for chemical analysis
FTIR Fourier-transform infrared (spectroscopy)
GDMS glow-discharge mass spectrometry
HMTA hexamethylenetetramine
HOPG highly oriented pyrolytic graphite
HR-GDMS high resolution glow discharge mass spectrometry
IGA intelligent gravimetric analyzer (commercial name)
INL Idaho National Laboratory
IR infrared
MET monotonous equivalent-point titration (instrument routine)
M molar concentration of solutions (moles/liter)
N normal concentration of solutions (equivalents/liter)
NSA nitrogen surface area
OAN oil absorption number
ORNL Oak Ridge National Laboratory
pH measure for hydrogen ion activity, {H+}, in aqueous solutions, pH = - log10 {H+}
pKa measure for strength of Bronsted acids, defined as pKa = - log10 QHA, where QHA is the
dissociation quotient for one step proton dissociation from a HA-type acid (see page 39)
RSF relative sensitivity factor
SAIEUS solution of adsorption integral equation using splines (computer code)
SOW statement of work
STEM scanning transmission electron microscopy

xii
STSA statistical thickness surface area
TEM transmission electron microscopy
TPD temperature-programmed desorption
UCO uranium oxicarbide (mixture UO2 and UC2 in an un-specified ratio)
XPS X-ray photoelectron spectroscopy
xiii
ACKNOWLEDGMENTS This work was sponsored by the U. S. Department of Energy through the Office of Nuclear Energy Science in support of Advanced Gas Reactor Fuel Development and Qualification Program under contract DE-AC05-00OR22725 with U. T. Battelle, LLC. The work was performed at the ORNL under the auspices of the Metals and Ceramics Division and in continuous collaboration with scientists from the Nuclear Science and Technology Division and from the Chemical Sciences Division. The efforts of other ORNL staff are greatly appreciated. The research support personnel, craft personnel, and environmental and safety personnel did a great job in setting up the new wet chemistry lab where the activity on this project was organized. The authors appreciate Gary Bell and Frank Homan for their managerial support; Jack Collins and Rodney Hunt for their continuous sharing of ideas and information; Fred Baker for helpful technical reviews and discussions; Ashli Clark, Michelle Kidder, Douglas Blom, and Paul Menchhofer for their excellent support during the work.

xiv
This page was intentionally left blank.

xv
ABSTRACT
This report supports the effort for development of small scale fabrication of UCO (a mixture of UO2 and UC2) fuel kernels for the generation IV high temperature gas reactor program. In particular, it is focused on optimization of dispersion conditions of carbon black in the broths from which carbon-containing (UO2·H2O + C) gel spheres are prepared by internal gelation. The broth results from mixing a hexamethylenetetramine (HMTA) and urea solution with an acid-deficient uranyl nitrate (ADUN) solution. Carbon black, which is previously added to one or other of the components, must stay dispersed during gelation. The report provides a detailed description of characterization efforts and results, aimed at identification and testing carbon black and surfactant combinations that would produce stable dispersions, with carbon particle sizes below 1 µm, in aqueous HMTA/urea and ADUN solutions. A battery of characterization methods was used to identify the properties affecting the water dispersability of carbon blacks, such as surface area, aggregate morphology, volatile content, and, most importantly, surface chemistry. The report introduces the basic principles for each physical or chemical method of carbon black characterization, lists the results obtained, and underlines cross-correlations between methods. Particular attention is given to a newly developed method for characterization of surface chemical groups on carbons in terms of their acid-base properties (pKa spectra) based on potentiometric titration. Fourier–transform infrared (FTIR) spectroscopy was used to confirm the identity of surfactants, both ionic and non-ionic. In addition, background information on carbon black properties and the mechanism by which surfactants disperse carbon black in water is also provided. A list of main physical and chemical properties characterized, samples analyzed, and results obtained, as well as information on the desired trend or range of values generally associated with better dispersability, is provided in the Appendix. Special attention was given to characterization of several surface-modified carbon blacks produced by Cabot Corporation through proprietary diazonium salts chemistry. As demonstrated in the report, these advanced carbons offer many advantages over traditional dispersions. They disperse very easily, do not require intensive mechanical shearing or sonication, and the particle size of the dispersed carbon black aggregates is in the target range of 0.15–0.20 µm. The dispersions in water and HMTA/urea solutions are stable for at least 30 days; in conditions of simulated broth, the dispersions are stable for at least 6 hours. It is proposed that the optimization of the carbon black dispersing process is possible by replacing traditional carbon blacks and surfactants with surface-modified carbon blacks having suitable chemical groups attached on their surface. It is recognized that the method advanced in this report for optimizing the carbon black dispersion process is based on a limited number of tests made in aqueous and simulated broth conditions. The findings were corroborated by a limited number of tests carried out with ADUN solutions by the Nuclear Science and Technology Division at Oak Ridge National Laboratory (ORNL). More work is necessary, however, to confirm the overall recommendation based on the findings discussed in this report: namely, that the use of surface-modified carbon blacks in the uranium-containing broth will not adversely impact the chemistry of the gelation process, and that high quality uranium oxicarbide (UCO) kernels will be produced after calcination.

1
1. INTRODUCTION
1.1 GOALS OF THIS PROJECT The goals of the AGR Fuel Development and Qualification Program include providing fuel qualification data, in support of the licensing process of a generation IV high temperature gas reactor in the United States. To meet these goals, all steps in the process of fuel manufacturing must be understood, and production of high-quality fuel must be demonstrated for fuel qualification tests. Nuclear fuel composed of uranium oxide (UO2) and uranium carbide (UC2) kernels coated with carbon and silicon carbide represent a significant improvement in efficiency, longevity, and safety of nuclear fuels for the next generation of nuclear power systems. The interest in production of UO2–UC2 kernels has been revived in the last few years. At ORNL, laboratory-scale (UO3·2H2O–C) gel spheres were first prepared in the late ‘70s.1,2 The process is based on the sol-gel reaction between an acid-deficient uranyl nitrate (ADUN) solution and a solution of hexamethylenetetramine (HMTA) and urea; this process is known as internal gelation. In the early studies at ORNL, carbon black was dispersed with a surfactant and was introduced into the process before the gelation step. Several batches of dried gel were prepared with C/U mole ratios of 0.8 to 1.2, which were sintered to make (UO2 + UC2) kernels. However, no optimization of formulation or process conditions was attempted at that time. Subsequent in-depth studies on the chemistry of internal gelation in the ADUN–HMTA/urea system3,4 led to a better understanding of process variables; this made possible in 2004 the production of several batches of good quality UO2 kernels at ORNL.5 Production of high-quality carbon-containing kernels was not without some difficulty. In 2004 BWXT produced UCO kernels for coater development studies and in 2005 produced kernels for AGR fuel, but issues arising during and after fabrication of these kernels prompted the continuation of efforts for development of the kernel fabrication process. The development efforts continued, both at ORNL (for small-scale fabrication) and at BWXT (for large-scale fabrication). This project is in support of the small scale kernel development effort. One issue with the UCO kernels was their lower-than-theoretical density. A key requirement to good density is uniform distribution of carbon in the UO2 gel before the thermochemical step, i.e. during the gel forming step. Because uranium carbides are formed by direct reduction of UO2 with carbon, the presence of large carbon particles or agglomerates is unwanted because they will leave voids during sintering. It was anticipated that, to obtain good kernel density, carbon particles and agglomerates should be smaller than 5 µm in size, and preferably smaller than 1 µm. This conclusion was confirmed by tests at BWXT in 2004. Historically, the work first performed at ORNL on introducing carbon into the gelation process did not specify which component of the reaction mixture the carbon should be added to. This left room for two different approaches. In later work at ORNL, carbon was dispersed in the alkaline solution of HMTA/urea using anionic dispersants that have maximum efficiency in basic pH (e.g. Marasperse CB, Marasperse CBOS-6, and Tamol SN). At BWXT the opposite method was chosen – to disperse carbon in the acidic component, ADUN solution, using one of the same dispersing agents, Tamol SN. In addition, the two organizations used two different carbon blacks: Black Pearls L at ORNL and Raven 1000 at BWXT. Working with different materials and using different protocols for dispersing the carbon in either one of the broth components, the results obtained by the two organizations were divergent. One important parameter which remained to be specified between the two organizations was the dispersing agent
2
requirement (DAR) for stable dispersions. This parameter is specific to each carbon – surfactant combination; for anionic surfactants (such as Tamol SN) DAR varies strongly with pH, especially at very low or very high pH’s. At BWXT it was found that Raven 1000 can be easily dispersed with Tamol SN in acidic simulants of ADUN, but using the same conditions with actual ADUN solutions produced flocculation and instability of dispersions, presumably because of the high ionic strength of these solutions. On the other hand, at ORNL it was observed that addition of Tamol SN to ADUN solutions temporarily produced a partial crystallization of uranyl nitrate, which would, however, dissolve when ADUN was mixed with the HMTA/urea solution. As described in the SOW 2813 of 5-24-05, the objective of small scale kernel fabrication development work was to identify and test carbon blacks and surfactants for improved carbon dispersion in aqueous ADUN and HMTA/urea solutions. The goal was to identify and characterize carbon black and surfactant combinations that would easily disperse carbon agglomerates to sizes less than 1 µm, and form dispersions that remain stable after the two feed stocks are mixed for the gelation process. An additional objective was to examine the ADUN-HMTA/urea chemistry of the carbon-containing broth and to optimize the physical characteristics of the resulting green kernels and sintered kernels. 1.2. WORK INCLUDED AND STRUCTURE OF REPORT The work plan developed initially contained 9 tasks, divided between two research groups, in the Metals and Ceramics Division and in the Nuclear Science and Technology Division of ORNL. This report includes the results obtained under tasks 1–3 and (partially) 4 of the SOW 2813 of 5-24-05 and covers the work carried out in the Metals and Ceramics Division; it is complemented by a parallel report prepared by the group at Nuclear Science and Technology Division. The report is delivered according to line 6.1 of the above mentioned SOW. This part of the project was focused on characterization of the benchmark carbon blacks and surfactants, and on selection and characterization of candidate carbon blacks and surfactants. The bench carbons were Raven 1000 and Black Pearls L, used historically at BWXT and ORNL. The benchmark surfactant was Tamol SN, used by both organizations. In addition, several varieties of carbon black that, based on proprieties, were expected to provide good aqueous dispersions, were procured. We have also procured advanced dispersing agents from chemical companies known for their activity in this field. In order to identify specific differences between benchmark and selected candidate carbon blacks, a battery of multiple physical and chemical methods was used, adequate for characterization of properties that affect carbon black dispersability in water. The chemical identity of surfactants was characterized by appropriate spectroscopic methods. The work led to identification and characterization of a few surface-modified carbon blacks that showed the best dispersing stability in HMTA/urea and simulated broth conditions. This report is organized in a logical order. Background on important properties that affect carbon dispersability is provided first. All characterization methods are briefly introduced, together with specific details on the procedures used, and a summary of most significant results obtained. Special attention is given to introducing the principle, and explaining the experimental setup for characterization of pH response of carbon black materials by potentiometric titration; application of this method to carbon blacks is new. The report contains suggestions for optimization of the carbon dispersing process. It is proposed that replacement of traditional dispersing methods and materials (carbon black with adsorbed surfactants) by surface-modified carbon with suitable chemical groups attached would simplify the process and make it more reliable. Such surface-modified carbons are available from Cabot Corporation. However, more

3
development is needed to verify that the replacing the carbon and the surfactant does not negatively affect the chemistry of the gel forming process, and to confirm that improving carbon dispersion results in calcined UCO kernels with superior quality. A summary table is provided in Appendix, which lists the characterization methods employed and the trends expected (in an ideal situation) for improved dispersability, together with the results obtained from measurements. 1.3 BACKGROUND INFORMATION ON DISPERSING CARBON BLACK IN AQUEOUS
MEDIA 1.3.1. Carbon Black Properties that Affect Water Dispersability Carbon black is an intense black powder made by incomplete combustion or thermal cracking of a hydrocarbon feedstock. Based on the manufacturing method, it is classified as furnace black, produced by burning oil in 50% air; thermal black, produced through thermal decomposition of methane; and channel black, obtained through direct combustion of fossil fuels or municipal waste. The main uses of carbon black are in the rubber industry, as an additive in manufacturing of tires, and as the principal ingredient in ink, paint, and copy machines toners. The technology for producing carbon black has various degrees of complexity, depending on the specific requirements of the end-use application. When used in less demanding applications, carbon black is a low cost commodity produced on large scale and with few restrictive controls during fabrication. However, it takes a high level of technology to produce high quality carbon black materials suitable for obtaining stable dispersions in water- or solvent-based media, as required in ink and paint industries. It is this latter application that led Cabot Corporation to develop advanced surface-modified carbons, which gave the best results in our project. Carbon black is composed of nanometer-sized primary particles which are bonded together to form primary aggregates of various shapes and structure; the primary aggregates may cluster into larger agglomerates, forming fluffy, free-flowing powders, or may be bonded into beads. Formulation of stable carbon black dispersions in water-based systems requires proper selection of the dispersing agent and matching it with the carbon black properties. Both physical and chemical properties of carbon black affect its dispersability. Among the physical properties, the most important are those associated with the size, shape, and distribution of primary particles and aggregates. The particle size describes the “fineness” of the carbon black, and is inversely related to the surface area. Small particle size (or high surface area) determines increased blackness, tint, UV protection, and electrical conductivity, but reduces dispersability. The structure describes the cluster morphology of primary aggregates, which can be either more compact (“low structure”) or more open (“high structure”). In general, low structure carbons are more difficult to disperse because of strong attractive forces acting between primary aggregates that cause packing together into larger clusters. A very important factor that affects dispersability of carbon blacks is their surface chemistry. Various amounts of adsorbed oxygen are present on the surface of all carbons. Oxygen is found in surface functional groups of various chemical nature (carboxylic, phenolic, quinonic or lactonic groups) that result from slow, uncontrolled oxidation of the carbon surface in contact with air. The presence of chemical functionalities on carbon black is beneficial for dispersion because chemical groups improve the wetting of the surface, and help localizing electric charges that stabilize the dispersion. Thus, all other
4
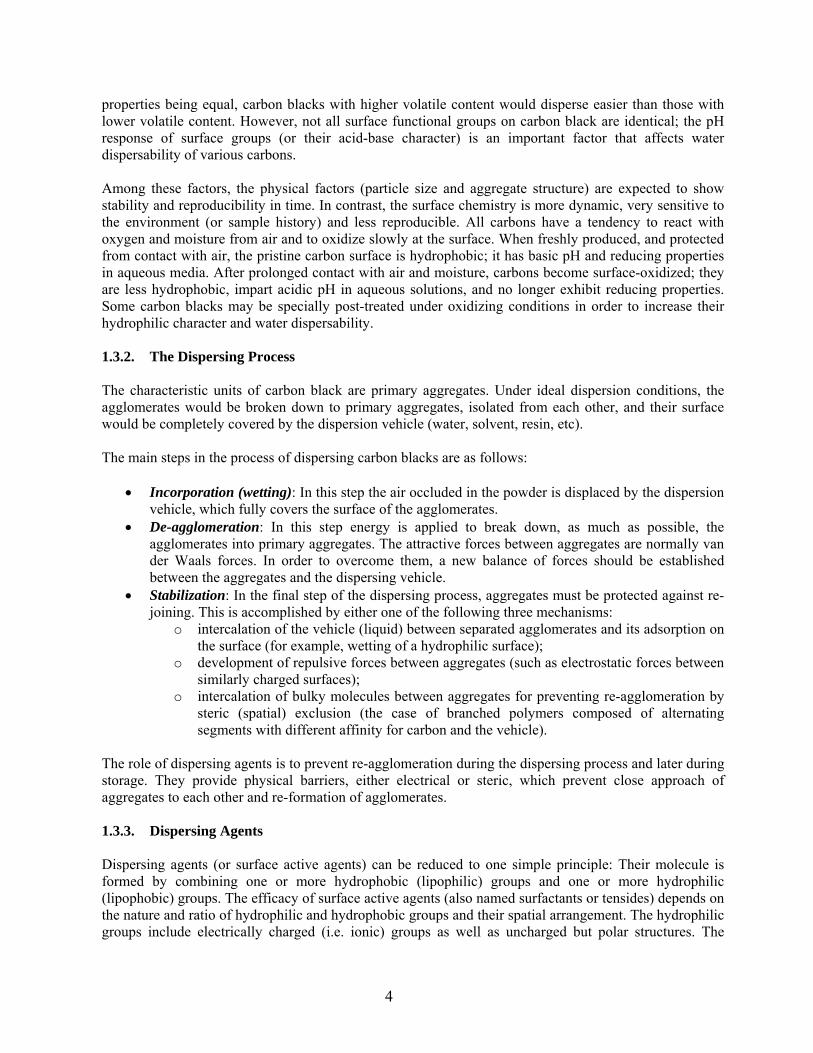
properties being equal, carbon blacks with higher volatile content would disperse easier than those with lower volatile content. However, not all surface functional groups on carbon black are identical; the pH response of surface groups (or their acid-base character) is an important factor that affects water dispersability of various carbons. Among these factors, the physical factors (particle size and aggregate structure) are expected to show stability and reproducibility in time. In contrast, the surface chemistry is more dynamic, very sensitive to the environment (or sample history) and less reproducible. All carbons have a tendency to react with oxygen and moisture from air and to oxidize slowly at the surface. When freshly produced, and protected from contact with air, the pristine carbon surface is hydrophobic; it has basic pH and reducing properties in aqueous media. After prolonged contact with air and moisture, carbons become surface-oxidized; they are less hydrophobic, impart acidic pH in aqueous solutions, and no longer exhibit reducing properties. Some carbon blacks may be specially post-treated under oxidizing conditions in order to increase their hydrophilic character and water dispersability. 1.3.2. The Dispersing Process The characteristic units of carbon black are primary aggregates. Under ideal dispersion conditions, the agglomerates would be broken down to primary aggregates, isolated from each other, and their surface would be completely covered by the dispersion vehicle (water, solvent, resin, etc). The main steps in the process of dispersing carbon blacks are as follows:
• Incorporation (wetting): In this step the air occluded in the powder is displaced by the dispersion vehicle, which fully covers the surface of the agglomerates.
• De-agglomeration: In this step energy is applied to break down, as much as possible, the agglomerates into primary aggregates. The attractive forces between aggregates are normally van der Waals forces. In order to overcome them, a new balance of forces should be established between the aggregates and the dispersing vehicle.
• Stabilization: In the final step of the dispersing process, aggregates must be protected against re-joining. This is accomplished by either one of the following three mechanisms:
o intercalation of the vehicle (liquid) between separated agglomerates and its adsorption on the surface (for example, wetting of a hydrophilic surface);
o development of repulsive forces between aggregates (such as electrostatic forces between similarly charged surfaces);
o intercalation of bulky molecules between aggregates for preventing re-agglomeration by steric (spatial) exclusion (the case of branched polymers composed of alternating segments with different affinity for carbon and the vehicle).
The role of dispersing agents is to prevent re-agglomeration during the dispersing process and later during storage. They provide physical barriers, either electrical or steric, which prevent close approach of aggregates to each other and re-formation of agglomerates. 1.3.3. Dispersing Agents Dispersing agents (or surface active agents) can be reduced to one simple principle: Their molecule is formed by combining one or more hydrophobic (lipophilic) groups and one or more hydrophilic (lipophobic) groups. The efficacy of surface active agents (also named surfactants or tensides) depends on the nature and ratio of hydrophilic and hydrophobic groups and their spatial arrangement. The hydrophilic groups include electrically charged (i.e. ionic) groups as well as uncharged but polar structures. The
5
hydrophobic groups include the rest of the molecule and cover a large variety of aliphatic, aliphatic-aromatic, and aromatic structures.6 Upon dispersing carbon black in aqueous media, the hydrophobic end (or segments) of the dispersing agent becomes attached to the carbon surface (which is normally hydrophobic), and the hydrophilic end (or segments) is oriented towards water. This particular structure helps de-agglomerate carbon black and promotes intercalation of water between aggregates. A classification of dispersing agents includes ionic (i.e. anionic or cationic), electroneutral, amphoteric and non-ionic molecules. Ionic agents consist of pairs of oppositely charged ions, of which only one is surface active and the other is a low molecular weight counter-ion. Electroneutral tensides are composed of a pair of ions, both with tenside character. In amphoteric surface active agents the anion and cation are united in the same molecule. All surface active agents that do not ionize in solution form the group of non-ionic tensides. Ionic tensides are normally dissociated in aqueous solutions, and the solution pH may have a strong effect on the electric charge of the hydrophilic groups. For example, in the case of anionic surfactants, the pH effect is correlated with the acidity constant (pKa) of their anionic structures. Anions derived from weak acids (carboxylates, thiosulfates, etc.) will tend to protonate in acidic solutions (at pH lower than their specific pKa); this cancels their tenside effect in acid solutions. On the other hand, anions derived from strong acids (sulfate, sulfonate, etc.) with very low pKa remain un-protonated and the tenside effect is unchanged over broad pH ranges. The reverse is true for cationic surfactants: those derived from weak bases (quaternary phosphonium compounds, tertiary sulfonium compounds, imidazole derivative, etc.) carry positive charges and are effective only in acidic solutions. Cations derived from strong bases (aliphatic amines) have a broader pH spectrum of efficacy. For the above reasons, the knowledge of the chemical nature of ionic surfactants, and of the acidity constant (pKa) of the ionogen group, is useful to predict the pH effect on the dispersing action of these surfactants. In the case of non-ionic surfactants, the mechanism of dispersion stabilization is based on steric (spatial) exclusion and is dictated by the balance between the number and the hydrophilic/hydrophobic character of various segments of the molecule. It is not expected that pH has any influence on non-ionic surfactants. 1.4 METHODS AVAILABLE FOR CARBON BLACK CHARACTERIZATION A large selection of characterization methods is available for quantification of physical and chemical properties that affect dispersability of carbon blacks. Electron microscopy is used to visualize the aggregate shape and to characterize the average size and morphology of primary particles. The ASTM method D 3849-04 covers the morphological characterization of carbon black primary aggregates based on transmission electron microscopy.7 Image processing software is used to derive the mean particle and aggregate size of carbon black in a dry state. Nitrogen adsorption measurements at liquid nitrogen temperature are used to characterize the total surface area based on the Brunauer, Emmett, and Teller (BET) theory8 of multilayer gas adsorption. Additional information include evaluation of external surface area based on the statistical thickness method, evaluation of the total volume of micropores (pore with widths smaller than 2 nm) based on adsorption potential theories,9 and the pore size distribution based on the density functional theory (DFT) method.10 The ASTM method D 6556-04 covers only the determination of total and external surface area
6
by nitrogen adsorption.11 The other determinations are available in commercial software packages from all manufacturers of advanced gas adsorption equipments on the market. A method for structure characterization of carbon black is based on determination of the oil absorption number (OAN), and is covered by ASTM D 2414-05. It is based on detecting the volume of paraffin oil or dibuthylphthalate that, by incorporation to carbon black powder, suffices to change the state from free powder to a semiplastic agglomerate state. The oil absorption number is related to processing and vulcanizate properties of rubber compounds containing carbon black. High OAN values correlate roughly with high structure aggregates. The method is specific for characterization of carbon black additives for rubber industry, and requires the use of special equipment (absorptometer).12 We have not used the OAN method in this study. Chemical methods for characterization of carbon blacks comprise methods for measuring impurity content and methods for characterization of surface chemistry. Several methods are available for elemental analysis of impurities in carbon. The analysis of sulfur, oxygen and nitrogen content in carbon black is possible using combustion techniques (for S) and inert gas fusion techniques (for O and N) available on commercial instruments equipped with infrared gas analyzers. Analysis of other impurities in carbon black and of elements present in trace concentrations is possible by high resolution glow discharge mass spectrometry (HR-GDMS). In this method the solid sample is atomized by sputtering in low pressure DC plasma and extracted into the mass analyzer for separation and detection. The volatile content of carbon is a measure of oxygen surface complexes that may be present. It is obtainable by thermogravimetric analysis of carbon samples in a flow of inert gas or under vacuum. Upon heating, oxygen surface complexes decompose to yield CO2 and CO. Surface chemistry plays a decisive role in dispersing carbon blacks. However, a method for unequivocal identification and quantification of surface functional groups on carbons is not actually available; all existing methods provide limited information and should be considered as complementary to each other. Among physical methods for surface analysis of carbons, two methods enjoy large popularity: X-ray photoelectron spectroscopy (XPS) and Fourier-transform infrared (FTIR) spectroscopy. The XPS method (also known as ESCA – electron spectroscopy for chemical analysis) is a powerful method for elemental analysis of the surface layer (0–10 nm) of inorganic materials. The method is based on surface excitation of the sample’s surface with monochromatic X-rays and energy analysis of photoelectrons ejected from the sample. High resolution XPS could also be used to identify bonding or oxidation states of specific elements. The use of IR spectra for identification of chemical groups is well established as a chemical detection method. However, the applicability of FTIR spectroscopy for analysis of surface groups on carbons is limited by the very high absorption of infrared radiation by carbons. This can be circumvented by using highly diluted carbon samples in an inert matrix, but this drastically lowers the signal/noise ratio and the quality of IR spectra. A chemical method for identification and quantification of acid-base groups on carbons is based on potentiometric titration in an aqueous electrolyte. The pH-volume titration data are converted into a proton binding isotherm that relates the amount of protons bound (or released) to (from) the surface as a function of pH; this is by itself a measure of surface charge evolution on carbon as a function of solution pH. One more step of data processing allows for the derivation of the continuous spectrum of acidity

7
constants (or pKa spectrum) of the carbon surface. The assignment of surface chemical groups is based on comparison with known acid strengths of the main organic functions. The methods of characterization listed above will be revisited in the following sections; the protocols used will be briefly introduced, and the results obtained in characterization of selected carbon blacks will be discussed. 1.5. TECHNICAL APPROACH The goal of this project was to identify carbon black and surfactant combinations that would readily disperse carbon agglomerates into aggregates less than 1 micron in size in the ADUN and HMTA/urea solutions, and form dispersions that remain stable when the two feedstock solutions are mixed together in the gelation process. Historically, there were two different brands of carbon black used for fabrication of UCO kernels at ORNL and BWXT, as follows:
• Black Pearls L available from Cabot Corporation was used at ORNL • Raven 1000 available from Columbian Chemicals Company was used at BWXT
These two brands of carbon black were considered “benchmark carbons” for this project, and were given special attention in characterization of properties. The following anionic surfactants were historically used at ORNL and BWXT:
• Marasperse CB (from Marathon Chemical Div. of American Can Co.) – occasionally used only at ORNL;
• Marasperse CBOS-6 (from Marathon Chemical Div. of American Can Co.) – occasionally used only at ORNL;
• Tamol SN (from Rohm and Haas Company) used both at ORNL and BWXT. This was considered the “benchmark surfactant” in this project.
The first task was a characterization of the benchmark carbons and surfactant. To this end, a variety of physical and chemical characterizations of benchmark carbons was applied; the results will be presented in the following sections. The identity of the benchmark surfactant was characterized by infrared spectroscopy, which provided the chemical signature of the compound. The second task was finding better carbons and surfactants and characterizing their properties. The criteria for selection of the carbon–surfactant combinations were based on the following requirements:
• Dispersions must withstand pH variations over a wide range, from the initial pH of HMTA/urea solutions (pH ~ 10–10.5), or alternately, from the initial pH of ADUN solutions (pH ~ 1.3–2.0) to the final of pH in the broth at gelation conditions (pH ~ 4.5–5.0).
• Dispersions must withstand a large ionic background and competition from other organic
compounds given the high concentration of uranyl and nitrate ions (about 2.6–2.9 M for UO22+
and about 4.4 M for NO3- in initial the ADUN solution) and the high concentration of HMTA and
urea (about 3.18 M each in the initial solution).

8
• The carbon dispersion must be stable in either one of the HMTA/urea or ADUN solutions, and must remain stable after large and sudden variations in pH and ionic strength during mixing the feedstock solutions to form the broth.
• The impurity level in the raw carbon black must be limited, such that the final calcined fuel
kernels comply with the fuel product specifications. Two leading carbon black manufacturers in the U.S., namely Columbian Chemicals Company13,14 and Cabot Corporation15 were contacted. Both companies have R&D activity in development of carbon black compositions (and selection of matching dispersing agents) for a variety of applications, ranging from water-based dispersions in inks to organic solvent-based and resin-based dispersions for coatings and paints. Based on technical discussions at the headquarters of Columbian Chemical Company two carbon blacks were selected that best matched the requirements for good carbon dispersability, namely Raven 1040 and Raven M. These are carbon blacks with low surface area and high structure, i.e. they have the properties that would make them easily dispersable. Raven 1040 is slightly surface-oxidized, and Raven M is a high purity carbon that is not oxidized. Of the two carbons, only Raven 1040 is produced in the US (in Louisiana), while Raven M is produced in the U.K. The U.S. equivalent of Raven M is Raven 880 which is produced in Hamilton, CA. Two samples of these carbons, namely Raven 1040 and Raven M (880), were obtained. From the same source, the information was obtained that two non-ionic surfactants, BorchiGen 12 (from Lanxess Corporation) and Solesperse 44000 (from Noveon), work best with these carbons. The contacts at Cabot Corporation indicated that Black Pearls L, a “benchmark carbon” used historically at ORNL, is surface-oxidized for superior dispersability; it was developed more than 10 years ago, and was a good product at that time. However, more recently Cabot Corporation has introduced a new class of surface-modified carbon blacks that are specially developed to accommodate a range of needs in terms of dispersability and surface polarity. These advanced carbons are obtained by chemical grafting various chemical groups on carbon black, using a Cabot proprietary procedure based on diazonium salts chemistry. A demonstration kit with seven different carbon samples was procured from Cabot Corporation. It includes the original (unmodified) carbon, its oxidized counterpart, plus five modifications that differ by the chemical nature of surface grafted groups. Of these, the three samples named Cabot E, Cabot F, and Cabot G were expected to show the best dispersability without the need of using a surfactant, and to withstand large pH variations. In parallel contacts were initiated with three major chemical companies which manufacture dispersing agents and surfactants. From Lanxess Corporation16 a sample of the non-ionic surfactant BorchiGen 12 was procured for tests with carbon blacks from the Raven series, based on information from Columbian Chemical Company. When the tests results were not satisfactory, discussions with Lanxess continued and two more non-ionic surfactant samples were obtained, that were expected to work better in aqueous carbon black formulations. They were BorchiGen 0451 and BorchiGen SN 95; the latter is a 25 wt % water solution of the former. Both these surfactants are non-ionic polyurethane oligomers. Non-ionic surfactants were also procured from Noveon Inc.17 This company and its sister Lubrizol are both based in the UK and have branches in the US. Based on available technical information18,19 the dispersants selected were Solsperse 44000 and Solsperse 27000; the former was already known from the
9
contact at Columbian Chemical Company. Both are polymeric dispersants of an undisclosed chemical nature. For reasons that will be apparent later, these samples were not further tested with carbon black. In addition, a sample of Tergitol XD was obtained from Dow Chemicals. This is a non-ionic copolymer based on ethylene oxide and propylene oxide blocks, and is the surfactant listed by Dow Chemicals for carbon blacks.20 Of all non-ionic surfactants, Tergitol XD has the simplest chemical structure, so we selected it for further tests with carbon black. As a part of the technical approach, physical and chemical properties of the carbon samples procured from Columbian Chemical Company and from Cabot Corporation were characterized; in addition, dispersion stability tests were performed for dispersions obtained with the benchmark Raven 1000 carbon and a non-ionic surfactant. A significant breakthrough occurred when it was discovered that several surface-modified carbon black samples from Cabot Corporation disperse spontaneously in water, with only moderate agitation, and do not require addition of surfactants. This was the turning point in the project. From then on the focus was shifted to characterization of surface-modified Cabot samples, especially Cabot sample G, that gave stable dispersions with low viscosity in water, HMTA/urea solutions, simulated broth, and uranium broth. In parallel, dispersion formulations prepared with HMTA/urea solutions and (for samples from Cabot Corporation) with uranium broth were prepared and characterized by researchers in the Nuclear Science and Technology Division at ORNL. The quality of dispersions was evaluated by measuring the viscosity and by optical microscopy. The carbons tested were benchmark Raven 1000 and several surface modified carbons from Cabot Corporation; the surfactants tested were BorchiGen 12, BorchiGen 0451, and Tergitol XD. The results of these tests are reported separately.21 Although the work at ORNL was divided between two groups, one in the Metals and Ceramics Division and one in the Nuclear Science and Technology Division, the information were continuously shared between the two groups at ORNL, and with INL and BWXT. The progress was analyzed periodically and direction was agreed upon in weekly teleconferences with researchers from ORNL, INL, and (occasionally) from BWXT.
10
2. CHARACTERIZATION OF BENCHMARK AND CANDIDATE CARBONS 2.1 SURFACE AREA AND POROSITY BY NITROGEN ADSORPTION
A commercial gas adsorption apparatus, Autosorb-1 by Quantachrome Instruments, was used for
characterization by nitrogen adsorption of benchmark and selected candidate carbon blacks. This is a high sensitivity instrument for measuring nitrogen adsorption isotherms over a pressure range from 10-5 Pa to 0.1 MPa and liquid nitrogen temperature. The instrument is located in the Carbon Material Technology Group of the Metals and Ceramics Division and is used for surface area and porosity distribution characterization of porous or powdered materials, including several modifications of carbon. As a part of standard laboratory practice, the correct operation of the instrument is checked monthly by measuring the surface area of a silica-alumina standard (32.16 ± 0.31 m2/g) supplied by Quantachrome. The operation is considered correct unless the test value differs from the expected result by more than the 95% reproducibility limits (± 2.03 m2/g for multi-point BET).22
The ASTM method D 6556-04 covers a standard procedure for measuring total and external
surface area of carbon black by nitrogen adsorption.11 The procedure is limited to determination of only two properties, the total surface area and the external surface area. The total surface area, also known as nitrogen surface area (NSA), is calculated from multipoint adsorption data based on BET theory8 and includes all internal and external surfaces (including the internal surface of micropores, which are pores with widths less than 2 nm). The external surface area, also known as statistical thickness surface area (STSA), is calculated based on the statistical thickness method (also known as “t-method”) and is defined as the specific surface area minus the micropore internal surface.9
The sample preparation procedure recommended by ASTM D 6556-04 was followed. Duplicate
runs were measured for most samples, using either a large amount of sample (0.3–0.4 g) and fewer collected points for surface area measurements, or smaller amounts of sample (0.07–0.1 g) and more data points collected for analysis of porosity distribution. This choice was imposed by the need to complete the measurements in about 24 hours, before substantial evaporation of liquid nitrogen from the sample’s Dewar occured. The difference between the two runs was in general less than 5%. Before analysis, all samples were vacuum degassed at 300ºC for about 15 hours; for several surface-modified carbons from the Cabot kit the degassing temperature was lowered to 200ºC in an attempt to avoid decomposition of surface grafted modifying layers. However, even at this lower temperature, Cabot samples D and E decomposed during degassing and could not be run. During analysis, the nitrogen saturation pressure Po was automatically measured every two hours and corrections were applied by the Autosorb instrument. We collected a large number of data points (up to 50–60 per sample), much more than the minimum of five data points recommended by ASTM D 6556-04, covering the full range of relative pressures 0 < P/Po < 1. The density of collected data points was higher in the low P/Po range in order to obtain sufficient information for accurate characterization of microporosity, if any. This afforded a comprehensive characterization of texture properties of carbon black samples,23 including and going beyond the standard properties covered by the ASTM D 6556-04 method.
The following characteristic properties were evaluated for each carbon black sample:
• Total surface area (also known as nitrogen surface area, NSA), from linearization of the BET equation in the range 0.05 < P/Po < 0.30 (as recommended by ASTM D 6556-04 and known from common practice)
11
• External surface area (also known as statistical thickness surface area, STSA), from t-plots of volume adsorbed (reduced at standard conditions of temperature and pressure) versus statistical thickness of adsorbed nitrogen layers over the linear range of 0.2 < P/Po < 0.5 (as recommended by ASTM D 6556-04 and used in common practice)
• Micropore surface and micropore volume, from t-plots of adsorbed volumes versus the statistical thickness of nitrogen layers in the range of 0.2 < P/Po < 0.5
• Pore size analysis in the 0.7 to 6 nm range, which covers the micropores (< 2 nm) and the lower end of mesopore (2–50 nm) range; calculations were done using the Quantachrome software based on non linear density functional theory (DFT) and the kernel isotherm for N2 adsorption on carbon at 77 K. The data were plotted as cumulative surface area and incremental pore volume variations versus the pore width.
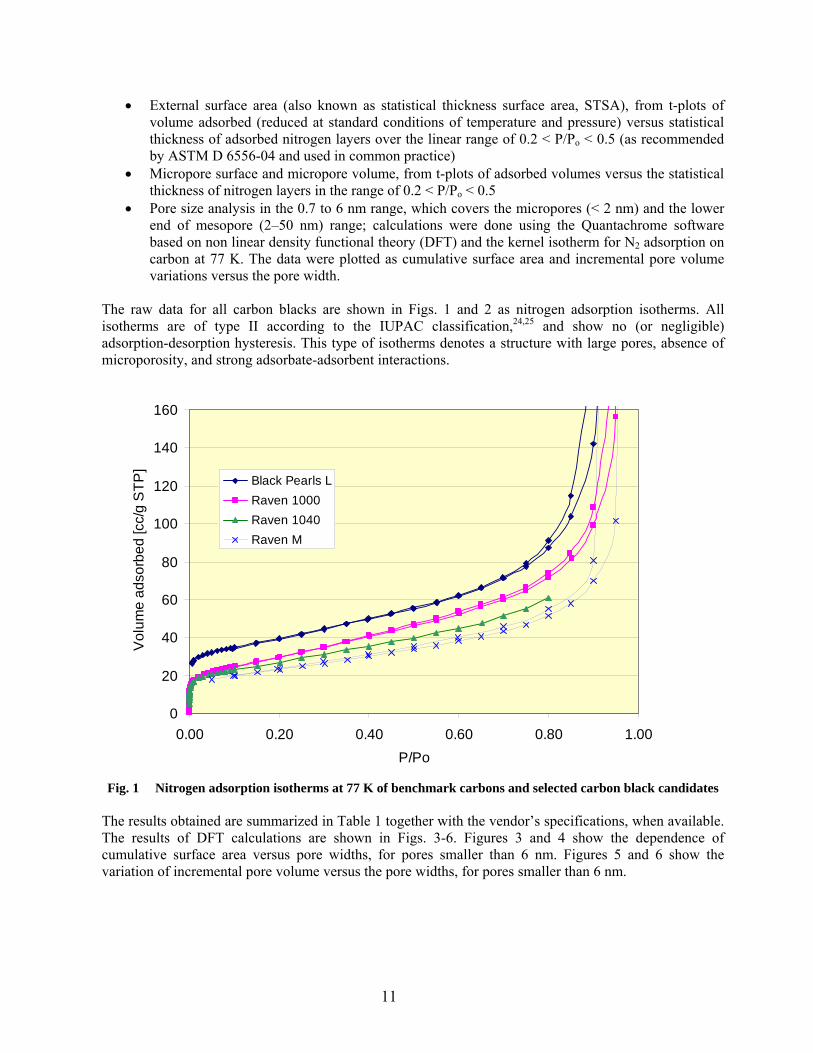
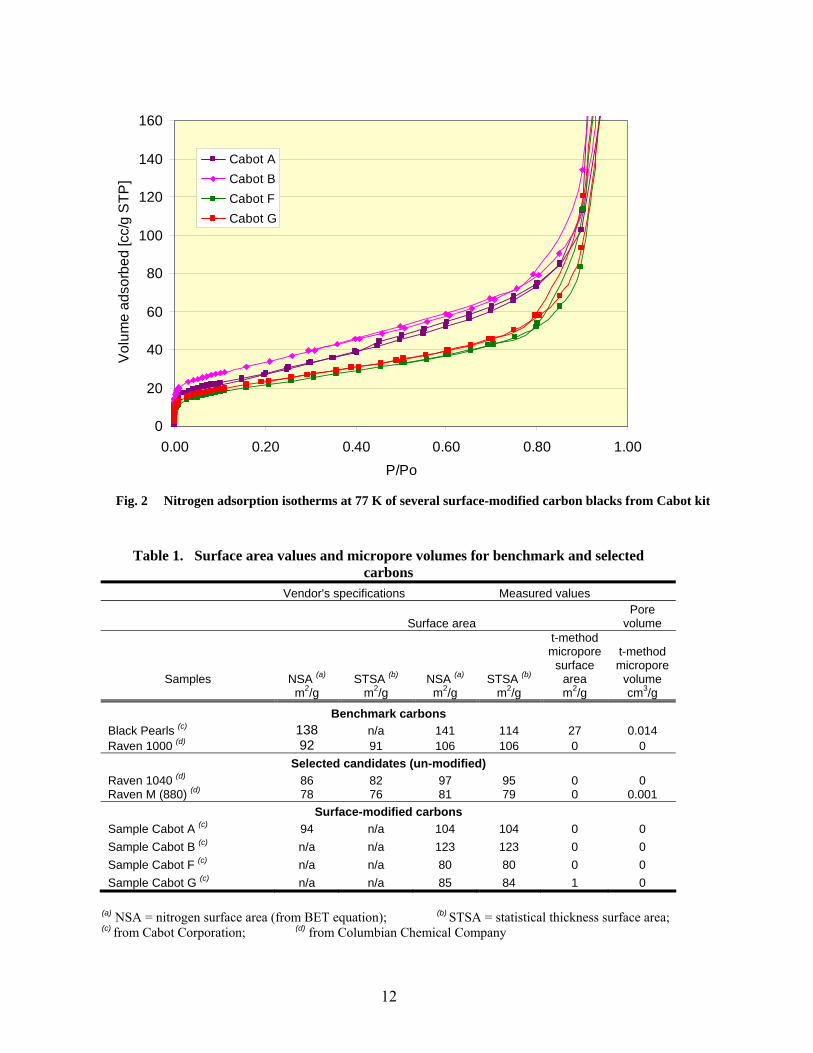
The raw data for all carbon blacks are shown in Figs. 1 and 2 as nitrogen adsorption isotherms. All isotherms are of type II according to the IUPAC classification,24,25 and show no (or negligible) adsorption-desorption hysteresis. This type of isotherms denotes a structure with large pores, absence of microporosity, and strong adsorbate-adsorbent interactions.
Fig. 1 Nitrogen adsorption isotherms at 77 K of benchmark carbons and selected carbon black candidates
The results obtained are summarized in Table 1 together with the vendor’s specifications, when available. The results of DFT calculations are shown in Figs. 3-6. Figures 3 and 4 show the dependence of cumulative surface area versus pore widths, for pores smaller than 6 nm. Figures 5 and 6 show the variation of incremental pore volume versus the pore widths, for pores smaller than 6 nm.
0
20
40
60
80
100
120
140
160
0.00 0.20 0.40 0.60 0.80 1.00P/Po
Vol
ume
adso
rbed
[cc/
g S
TP]
Black Pearls LRaven 1000Raven 1040Raven M
12
0
20
40
60
80
100
120
140
160
0.00 0.20 0.40 0.60 0.80 1.00P/Po
Vol
ume
adso
rbed
[cc/
g S
TP]
Cabot ACabot BCabot FCabot G
Fig. 2 Nitrogen adsorption isotherms at 77 K of several surface-modified carbon blacks from Cabot kit
Table 1. Surface area values and micropore volumes for benchmark and selected carbons
Vendor's specifications Measured values
Surface area Pore
volume
Samples NSA (a) STSA (b) NSA (a) STSA (b)
t-method micropore
surface area
t-method micropore
volume m2/g m2/g m2/g m2/g m2/g cm3/g
Benchmark carbons Black Pearls (c) 138 n/a 141 114 27 0.014 Raven 1000 (d) 92 91 106 106 0 0
Selected candidates (un-modified) Raven 1040 (d) 86 82 97 95 0 0 Raven M (880) (d) 78 76 81 79 0 0.001
Surface-modified carbons Sample Cabot A (c) 94 n/a 104 104 0 0 Sample Cabot B (c) n/a n/a 123 123 0 0 Sample Cabot F (c) n/a n/a 80 80 0 0 Sample Cabot G (c) n/a n/a 85 84 1 0
(a) NSA = nitrogen surface area (from BET equation); (b) STSA = statistical thickness surface area; (c) from Cabot Corporation; (d) from Columbian Chemical Company

13
0
20
40
60
80
100
120
140
0 10 20 30 40 50 60Pore width [A]
Cum
ulat
ive
surfa
ce a
rea
[m2/
g] Black Pearls LRaven 1000Raven 1040Raven M
Fig. 3 Cumulative nitrogen surface area versus pore width for benchmark and selected carbons black
candidates. Data presented are limited to pores smaller than 6 nm.
0
20
40
60
80
100
120
140
0 10 20 30 40 50 60Pore width [A]
Cum
ulat
ive
surfa
ce a
rea
[m2/
g] Cabot ACabot BCabot FCabot G
Fig. 4 Cumulative nitrogen surface area versus pore width for surface-modified carbons black from Cabot
kit. Data presented are limited to pores smaller than 6 nm.
14
0
0.001
0.002
0.003
0.004
0.005
0.006
0.007
0.008
0 10 20 30 40 50 60Pore width [A]
Incr
emen
tal p
ore
volu
me
dV(w
) [cc
/g-A Black Pearls L
Raven 1000Raven 1040Raven M
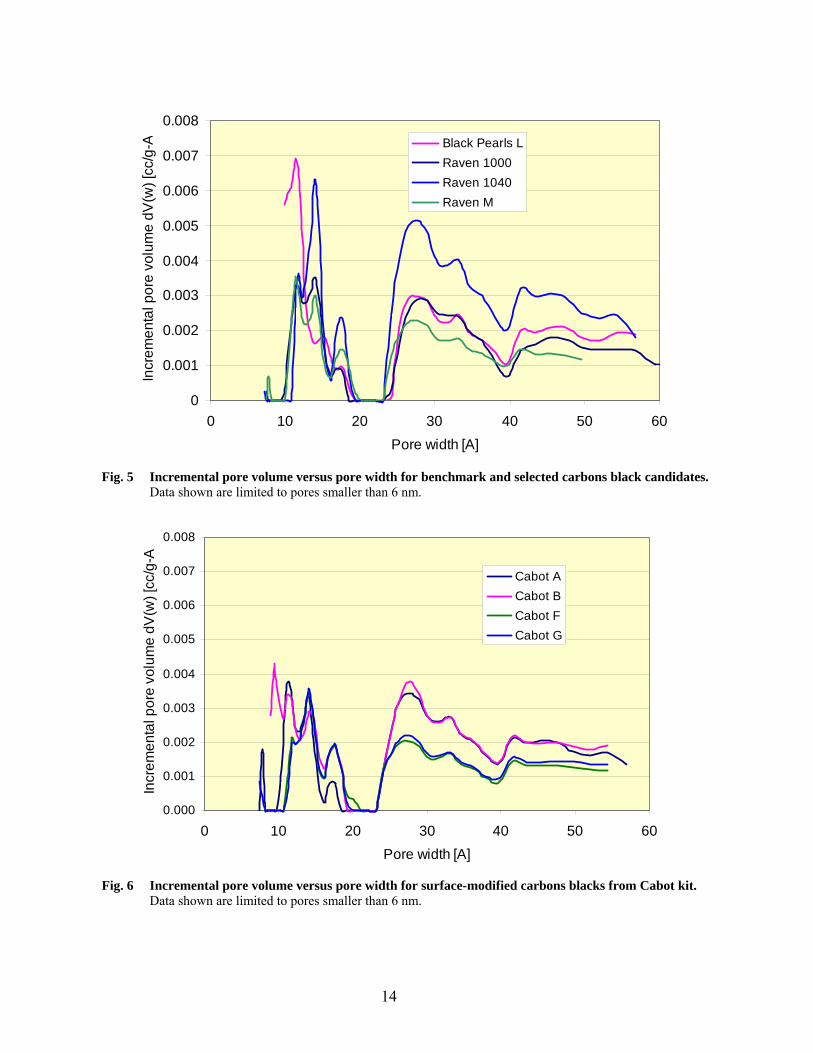
Fig. 5 Incremental pore volume versus pore width for benchmark and selected carbons black candidates.
Data shown are limited to pores smaller than 6 nm.
0.000
0.001
0.002
0.003
0.004
0.005
0.006
0.007
0.008
0 10 20 30 40 50 60Pore width [A]
Incr
emen
tal p
ore
volu
me
dV(w
) [cc
/g-A
Cabot ACabot BCabot FCabot G
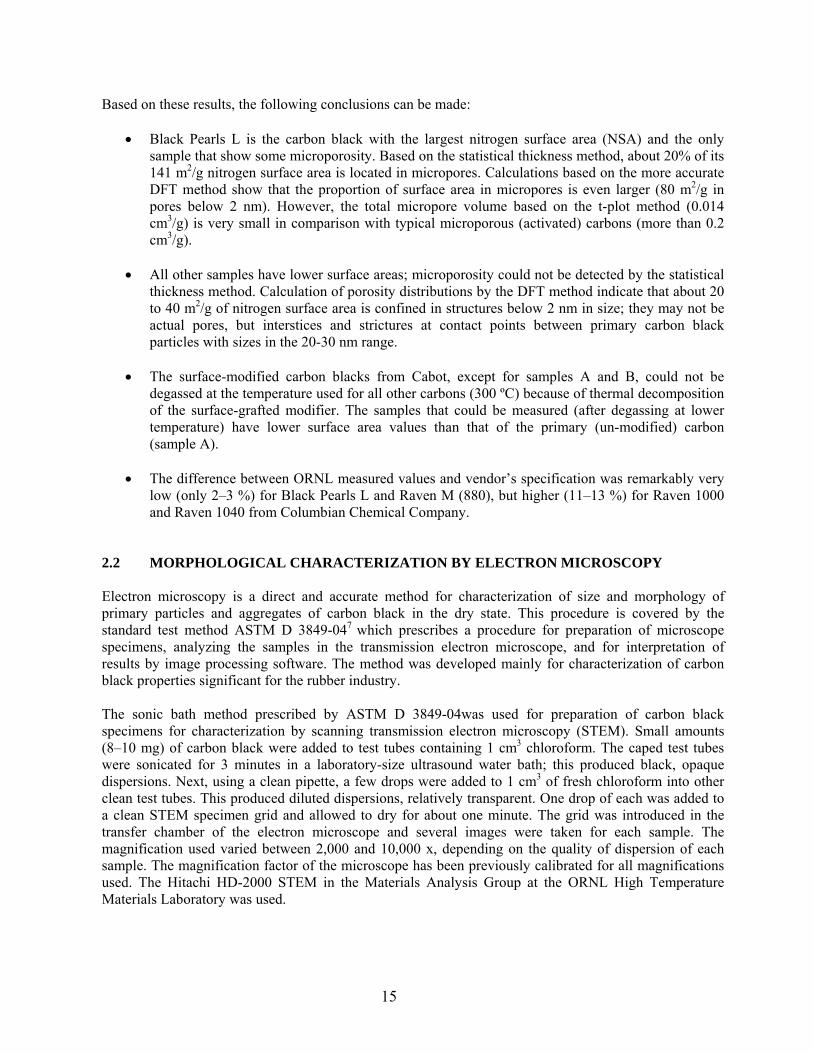
Fig. 6 Incremental pore volume versus pore width for surface-modified carbons blacks from Cabot kit.
Data shown are limited to pores smaller than 6 nm.
15
Based on these results, the following conclusions can be made:
• Black Pearls L is the carbon black with the largest nitrogen surface area (NSA) and the only sample that show some microporosity. Based on the statistical thickness method, about 20% of its 141 m2/g nitrogen surface area is located in micropores. Calculations based on the more accurate DFT method show that the proportion of surface area in micropores is even larger (80 m2/g in pores below 2 nm). However, the total micropore volume based on the t-plot method (0.014 cm3/g) is very small in comparison with typical microporous (activated) carbons (more than 0.2 cm3/g).
• All other samples have lower surface areas; microporosity could not be detected by the statistical
thickness method. Calculation of porosity distributions by the DFT method indicate that about 20 to 40 m2/g of nitrogen surface area is confined in structures below 2 nm in size; they may not be actual pores, but interstices and strictures at contact points between primary carbon black particles with sizes in the 20-30 nm range.
• The surface-modified carbon blacks from Cabot, except for samples A and B, could not be
degassed at the temperature used for all other carbons (300 ºC) because of thermal decomposition of the surface-grafted modifier. The samples that could be measured (after degassing at lower temperature) have lower surface area values than that of the primary (un-modified) carbon (sample A).
• The difference between ORNL measured values and vendor’s specification was remarkably very
low (only 2–3 %) for Black Pearls L and Raven M (880), but higher (11–13 %) for Raven 1000 and Raven 1040 from Columbian Chemical Company.
2.2 MORPHOLOGICAL CHARACTERIZATION BY ELECTRON MICROSCOPY Electron microscopy is a direct and accurate method for characterization of size and morphology of primary particles and aggregates of carbon black in the dry state. This procedure is covered by the standard test method ASTM D 3849-047 which prescribes a procedure for preparation of microscope specimens, analyzing the samples in the transmission electron microscope, and for interpretation of results by image processing software. The method was developed mainly for characterization of carbon black properties significant for the rubber industry. The sonic bath method prescribed by ASTM D 3849-04was used for preparation of carbon black specimens for characterization by scanning transmission electron microscopy (STEM). Small amounts (8–10 mg) of carbon black were added to test tubes containing 1 cm3 chloroform. The caped test tubes were sonicated for 3 minutes in a laboratory-size ultrasound water bath; this produced black, opaque dispersions. Next, using a clean pipette, a few drops were added to 1 cm3 of fresh chloroform into other clean test tubes. This produced diluted dispersions, relatively transparent. One drop of each was added to a clean STEM specimen grid and allowed to dry for about one minute. The grid was introduced in the transfer chamber of the electron microscope and several images were taken for each sample. The magnification used varied between 2,000 and 10,000 x, depending on the quality of dispersion of each sample. The magnification factor of the microscope has been previously calibrated for all magnifications used. The Hitachi HD-2000 STEM in the Materials Analysis Group at the ORNL High Temperature Materials Laboratory was used.
16
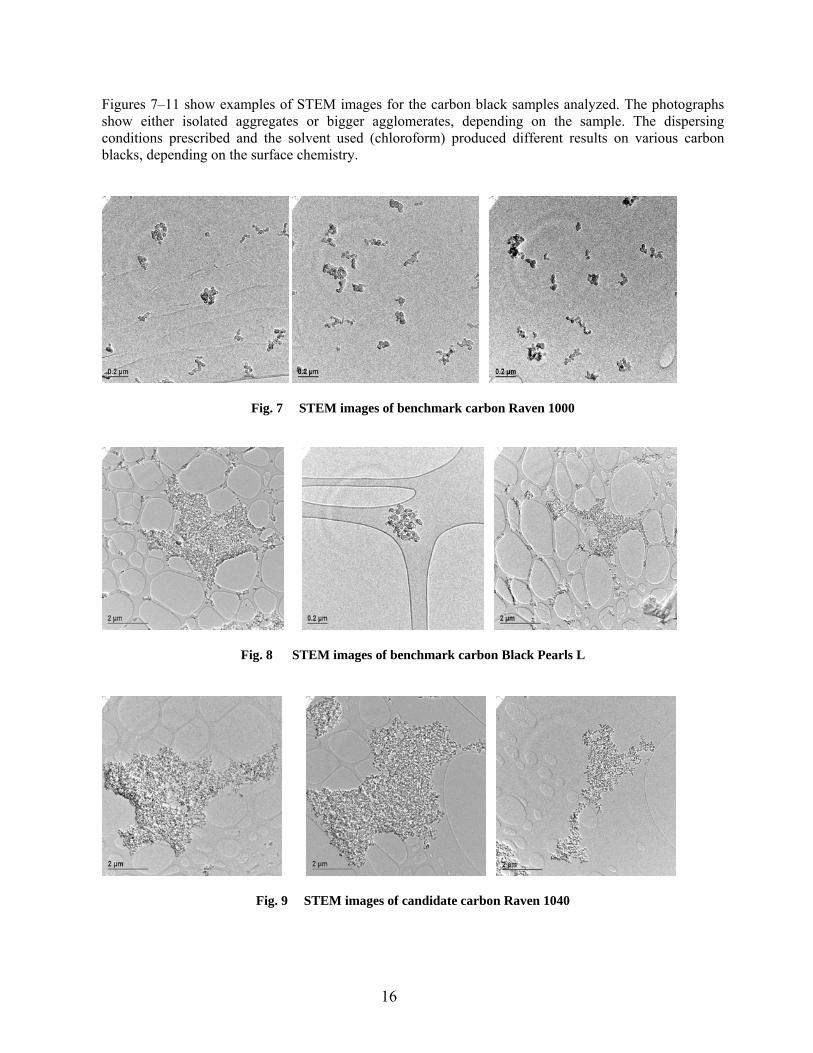
Figures 7–11 show examples of STEM images for the carbon black samples analyzed. The photographs show either isolated aggregates or bigger agglomerates, depending on the sample. The dispersing conditions prescribed and the solvent used (chloroform) produced different results on various carbon blacks, depending on the surface chemistry.
Fig. 7 STEM images of benchmark carbon Raven 1000
Fig. 8 STEM images of benchmark carbon Black Pearls L
Fig. 9 STEM images of candidate carbon Raven 1040

17
Fig. 10 STEM images of candidate carbon Raven M (880)
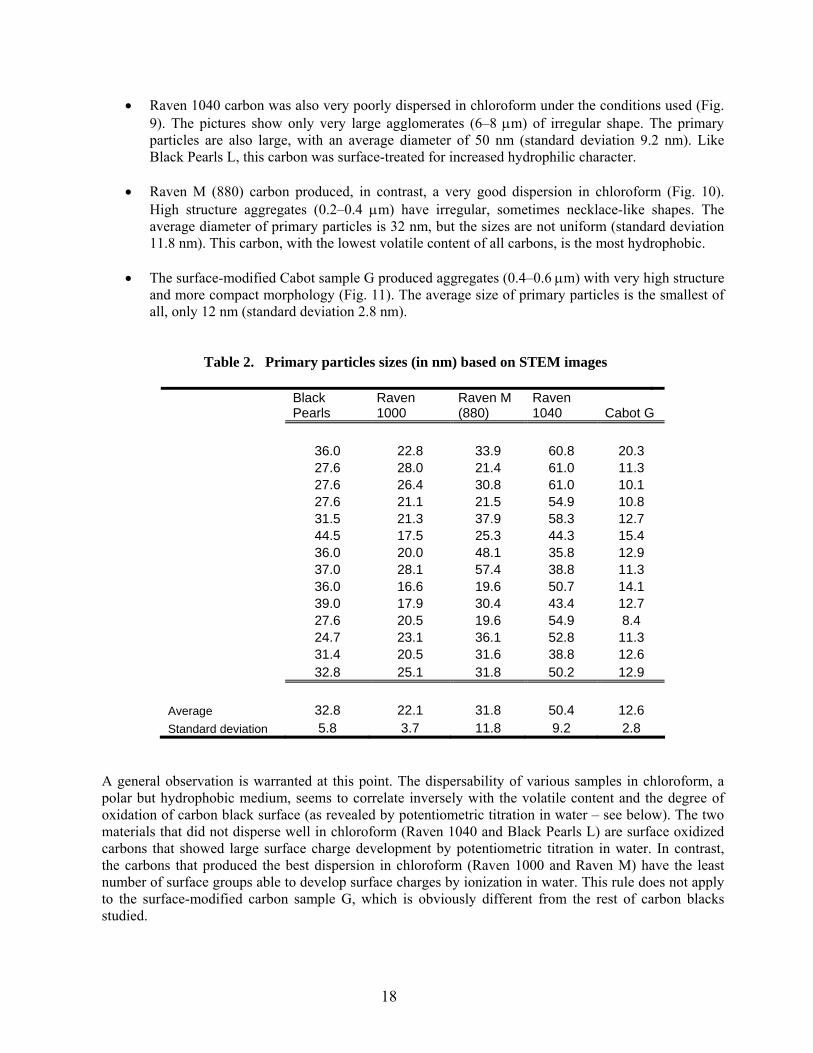
Fig. 11 STEM images of surface-modified Cabot sample G The STEM pictures were further analyzed using the image processing software ImagePro Plus v. 5.0 software (Media Cybernetics) for Windows. The resolution of the pictures was 2.5 nm/pixel at a 10,000 x magnification. Using the measuring tools of the software, the diameter of several individual carbon black particles was measured and the average value and standard deviation were calculated. The results are shown in Table 2. The following conclusions are drawn from these results:
• The benchmark carbon Raven 1000 (Fig. 7) was dispersed well by sonication in chloroform into a multitude of small, low structure aggregates of irregular shape and with sizes between 0.1–0.3 µm. The primary particles are uniform in size, with the average diameter of 22 nm (standard deviation 3.7 nm).
• The other benchmark carbon, Black Pearls L, did not disperse uniformly in chloroform by the
sonication method used. Possible reasons are differences in surface chemistry and physical form. This carbon is formed as small beads (while all other carbons are in a fluffy form), which were not consistently de-agglomerated in chloroform. As Fig. 8 shows, a mixture of small aggregates (about 0.2 µm in size) was present together with much bigger agglomerates (4–5 µm). The average size of primary particles was 33 nm (standard deviation 5.8 nm).
18
• Raven 1040 carbon was also very poorly dispersed in chloroform under the conditions used (Fig. 9). The pictures show only very large agglomerates (6–8 µm) of irregular shape. The primary particles are also large, with an average diameter of 50 nm (standard deviation 9.2 nm). Like Black Pearls L, this carbon was surface-treated for increased hydrophilic character.
• Raven M (880) carbon produced, in contrast, a very good dispersion in chloroform (Fig. 10).
High structure aggregates (0.2–0.4 µm) have irregular, sometimes necklace-like shapes. The average diameter of primary particles is 32 nm, but the sizes are not uniform (standard deviation 11.8 nm). This carbon, with the lowest volatile content of all carbons, is the most hydrophobic.
• The surface-modified Cabot sample G produced aggregates (0.4–0.6 µm) with very high structure
and more compact morphology (Fig. 11). The average size of primary particles is the smallest of all, only 12 nm (standard deviation 2.8 nm).
Table 2. Primary particles sizes (in nm) based on STEM images
Black Pearls
Raven 1000
Raven M (880)
Raven 1040 Cabot G
36.0 22.8 33.9 60.8 20.3 27.6 28.0 21.4 61.0 11.3 27.6 26.4 30.8 61.0 10.1 27.6 21.1 21.5 54.9 10.8 31.5 21.3 37.9 58.3 12.7 44.5 17.5 25.3 44.3 15.4 36.0 20.0 48.1 35.8 12.9 37.0 28.1 57.4 38.8 11.3 36.0 16.6 19.6 50.7 14.1 39.0 17.9 30.4 43.4 12.7 27.6 20.5 19.6 54.9 8.4 24.7 23.1 36.1 52.8 11.3 31.4 20.5 31.6 38.8 12.6 32.8 25.1 31.8 50.2 12.9 Average 32.8 22.1 31.8 50.4 12.6 Standard deviation 5.8 3.7 11.8 9.2 2.8
A general observation is warranted at this point. The dispersability of various samples in chloroform, a polar but hydrophobic medium, seems to correlate inversely with the volatile content and the degree of oxidation of carbon black surface (as revealed by potentiometric titration in water – see below). The two materials that did not disperse well in chloroform (Raven 1040 and Black Pearls L) are surface oxidized carbons that showed large surface charge development by potentiometric titration in water. In contrast, the carbons that produced the best dispersion in chloroform (Raven 1000 and Raven M) have the least number of surface groups able to develop surface charges by ionization in water. This rule does not apply to the surface-modified carbon sample G, which is obviously different from the rest of carbon blacks studied.
19
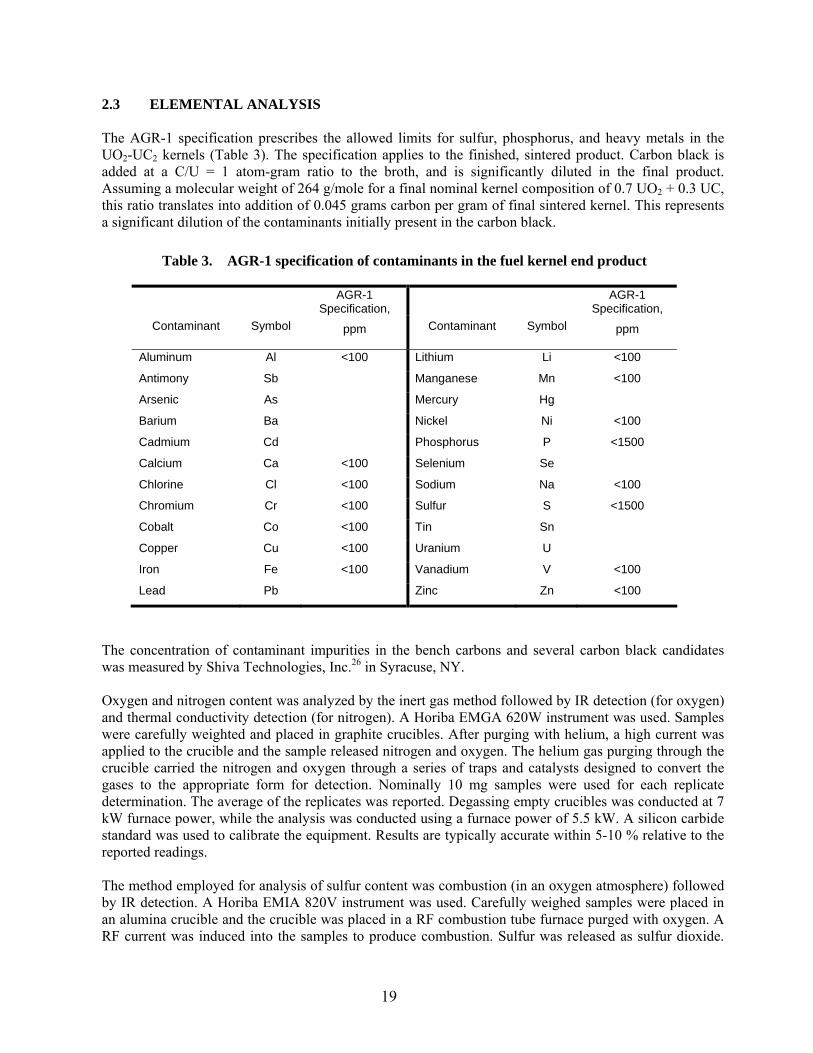
2.3 ELEMENTAL ANALYSIS The AGR-1 specification prescribes the allowed limits for sulfur, phosphorus, and heavy metals in the UO2-UC2 kernels (Table 3). The specification applies to the finished, sintered product. Carbon black is added at a C/U = 1 atom-gram ratio to the broth, and is significantly diluted in the final product. Assuming a molecular weight of 264 g/mole for a final nominal kernel composition of 0.7 UO2 + 0.3 UC, this ratio translates into addition of 0.045 grams carbon per gram of final sintered kernel. This represents a significant dilution of the contaminants initially present in the carbon black.
Table 3. AGR-1 specification of contaminants in the fuel kernel end product
AGR-1 Specification,
AGR-1 Specification,
Contaminant
Symbol
ppm
Contaminant
Symbol
ppm
Aluminum Al <100 Lithium Li <100
Antimony Sb Manganese Mn <100
Arsenic As Mercury Hg
Barium Ba Nickel Ni <100
Cadmium Cd Phosphorus P <1500
Calcium Ca <100 Selenium Se
Chlorine Cl <100 Sodium Na <100
Chromium Cr <100 Sulfur S <1500
Cobalt Co <100 Tin Sn
Copper Cu <100 Uranium U
Iron Fe <100 Vanadium V <100
Lead Pb Zinc Zn <100
The concentration of contaminant impurities in the bench carbons and several carbon black candidates was measured by Shiva Technologies, Inc.26 in Syracuse, NY. Oxygen and nitrogen content was analyzed by the inert gas method followed by IR detection (for oxygen) and thermal conductivity detection (for nitrogen). A Horiba EMGA 620W instrument was used. Samples were carefully weighted and placed in graphite crucibles. After purging with helium, a high current was applied to the crucible and the sample released nitrogen and oxygen. The helium gas purging through the crucible carried the nitrogen and oxygen through a series of traps and catalysts designed to convert the gases to the appropriate form for detection. Nominally 10 mg samples were used for each replicate determination. The average of the replicates was reported. Degassing empty crucibles was conducted at 7 kW furnace power, while the analysis was conducted using a furnace power of 5.5 kW. A silicon carbide standard was used to calibrate the equipment. Results are typically accurate within 5-10 % relative to the reported readings. The method employed for analysis of sulfur content was combustion (in an oxygen atmosphere) followed by IR detection. A Horiba EMIA 820V instrument was used. Carefully weighed samples were placed in an alumina crucible and the crucible was placed in a RF combustion tube furnace purged with oxygen. A RF current was induced into the samples to produce combustion. Sulfur was released as sulfur dioxide.

20
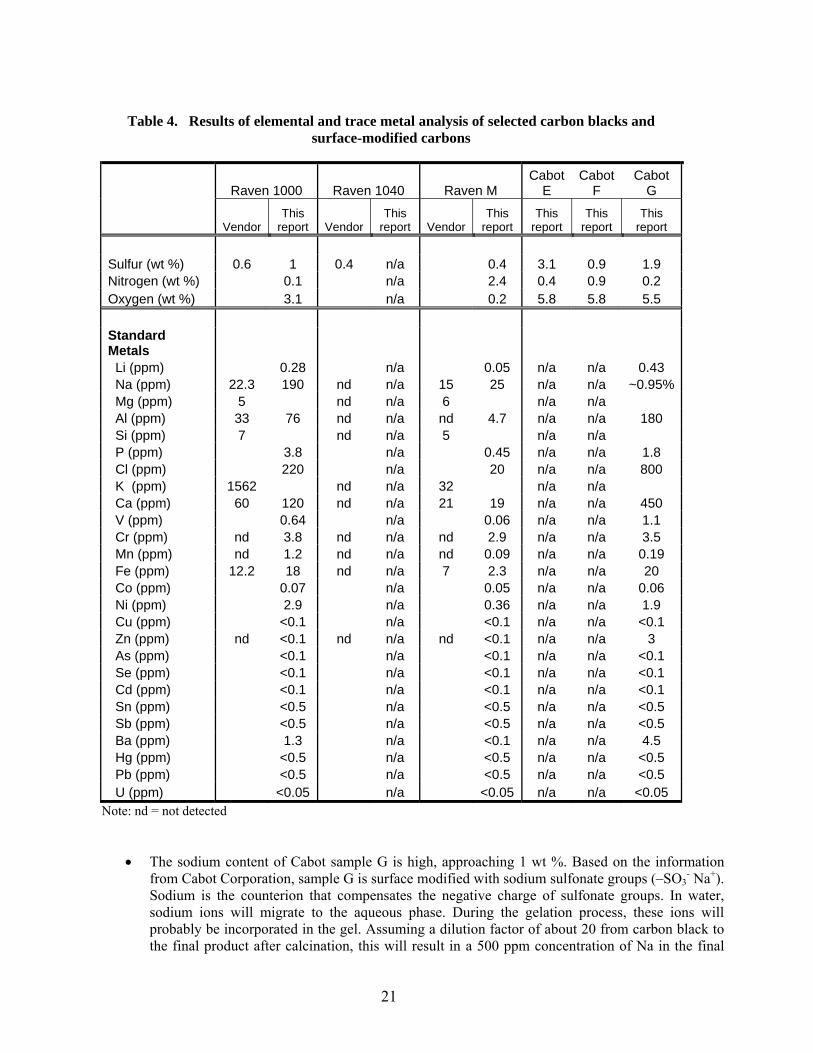
The gas was carried through a series of traps and catalysts and analyzed by infrared detection. Tungsten and tin were used as accelerators for all standards and samples to ensure complete and consistent combustion. A steel standard was used to calibrate the instrument. Nominally 100 mg sample were used for each replicate determination. The average of replicates was reported. Results are typically accurate to within 5-10 % relative to the reported readings. The trace constituents were determined using high resolution glow discharge mass spectrometry (HR-GDMS). This is a state-of-the art method for analysis of trace and ultra-trace element constituents of inorganic materials. Samples were analyzed in solid form, thus avoiding the laborious and complicated dissolution methods of other techniques. The technique involved atomization of the solid sample by sputtering in low pressure direct current (DC) plasma. The sputtered atoms were ionized and extracted into the mass analyzer for separation and detection. The instrument was calibrated using relative sensitivity factors (RSF) based on the analysis of a multitude of standard reference materials. The carbon black powders were pressed onto pre-cleaned, high-purity indium pins that acted as the cathode to produce the DC glow discharge. In GDMS, the ion beam is created in the discharge source and then passes through magnetic and electronic focusing filters on its way to the detector system. The HR-GDMS uses a dual detector system which provides a dynamic range of nine orders of magnitude. All analyte signals are measured and compared to the matrix signal, creating an ion beam ratio. This ion beam ratio is then adjusted using the RSFs for final quantification. Results are typically accurate to within 20-30 % relative to the reported readings. Sulfur, oxygen and nitrogen content was analyzed for five carbon black samples: the benchmark carbon Raven 1000, a cleaner Raven M (880) carbon from Columbian Chemical Company, and the best performing surface modified carbons from Cabot Corporation, samples E, F, and G. The metal traces were only analyzed for Raven 1000, Raven M (880), and sample G from Cabot Corporation. The results are shown in Table 4. Information provided by Columbian Chemical Company for carbon blacks in Raven series is also shown in this table. The most significant results from this table are summarized below:
• Sulfur content measured for Raven 1000 was 1 wt %, higher than 0.6 wt % reported by the vendor. For surface-modified carbons, the sulfur content was even higher (3.1 wt % for Cabot E and 1.9 wt % for Cabot G). However, a value of 2 wt % sulfur in the carbon black would only result in about 900 ppm sulfur in the final kernel, because sulfur is diluted many times in the broth and the kernels. This is below the limit of 1500 ppm S of AGR-1 specification. In addition, some sulfur is expected to volatilize during the thermal process. For example, a sudden release of an unidentified volatile compound was noticed for sample G treated under vacuum at about 500 oC (see below).
• The oxygen content is higher on Raven 1000 than on Raven M (880), in agreement with the
higher concentration of functional groups (probably phenolic –OH groups) identified on Raven 1000 (see below). All surface modified carbons from Cabot Corporation have higher oxygen content.
• The high nitrogen content of Raven M (880) cannot be explained at this time; it may be
associated with the source of the carbon.
• The high potassium content (1562 ppm) reported by the vendor in Raven 1000 was not confirmed by HR-GDMS; however, a sodium content higher than that reported by the vendor was measured (220 ppm) for this sample.
21
Table 4. Results of elemental and trace metal analysis of selected carbon blacks and
surface-modified carbons
Raven 1000 Raven 1040 Raven M Cabot
E Cabot
F Cabot
G
Vendor This
report Vendor This
report Vendor This
report This
report This
report This
report
Sulfur (wt %) 0.6 1 0.4 n/a 0.4 3.1 0.9 1.9 Nitrogen (wt %) 0.1 n/a 2.4 0.4 0.9 0.2 Oxygen (wt %) 3.1 n/a 0.2 5.8 5.8 5.5 Standard Metals Li (ppm) 0.28 n/a 0.05 n/a n/a 0.43 Na (ppm) 22.3 190 nd n/a 15 25 n/a n/a ~0.95% Mg (ppm) 5 nd n/a 6 n/a n/a Al (ppm) 33 76 nd n/a nd 4.7 n/a n/a 180 Si (ppm) 7 nd n/a 5 n/a n/a P (ppm) 3.8 n/a 0.45 n/a n/a 1.8 Cl (ppm) 220 n/a 20 n/a n/a 800 K (ppm) 1562 nd n/a 32 n/a n/a Ca (ppm) 60 120 nd n/a 21 19 n/a n/a 450 V (ppm) 0.64 n/a 0.06 n/a n/a 1.1 Cr (ppm) nd 3.8 nd n/a nd 2.9 n/a n/a 3.5 Mn (ppm) nd 1.2 nd n/a nd 0.09 n/a n/a 0.19 Fe (ppm) 12.2 18 nd n/a 7 2.3 n/a n/a 20 Co (ppm) 0.07 n/a 0.05 n/a n/a 0.06 Ni (ppm) 2.9 n/a 0.36 n/a n/a 1.9 Cu (ppm) <0.1 n/a <0.1 n/a n/a <0.1 Zn (ppm) nd <0.1 nd n/a nd <0.1 n/a n/a 3 As (ppm) <0.1 n/a <0.1 n/a n/a <0.1 Se (ppm) <0.1 n/a <0.1 n/a n/a <0.1 Cd (ppm) <0.1 n/a <0.1 n/a n/a <0.1 Sn (ppm) <0.5 n/a <0.5 n/a n/a <0.5 Sb (ppm) <0.5 n/a <0.5 n/a n/a <0.5 Ba (ppm) 1.3 n/a <0.1 n/a n/a 4.5 Hg (ppm) <0.5 n/a <0.5 n/a n/a <0.5 Pb (ppm) <0.5 n/a <0.5 n/a n/a <0.5 U (ppm) <0.05 n/a <0.05 n/a n/a <0.05
Note: nd = not detected
• The sodium content of Cabot sample G is high, approaching 1 wt %. Based on the information from Cabot Corporation, sample G is surface modified with sodium sulfonate groups (–SO3
- Na+). Sodium is the counterion that compensates the negative charge of sulfonate groups. In water, sodium ions will migrate to the aqueous phase. During the gelation process, these ions will probably be incorporated in the gel. Assuming a dilution factor of about 20 from carbon black to the final product after calcination, this will result in a 500 ppm concentration of Na in the final
22
product, which is five times higher than the AGR-1 specification. If further tests with Cabot G sample confirm this aspect, it will be necessary to explore with Cabot the possibility of replacing Na+ by another ion (possibly K+ or NH4
+) as a counter ion in sample G. 2.4 VOLATILE CONTENT BY THERMOGRAVIMETRIC ANALYSIS The volatile content of carbon black is roughly correlated with the extent of surface functionalization (oxidation), which in turns relates to the water dispersability of carbon blacks. Oxidized surfaces improve wettability, rheology and, by making carbon more hydrophilic, improve dispersion in aqueous systems. High volatile content is also associated with low pH of carbon dispersions in water. A number of carbon black materials are post-treated (oxidized) to provide enhanced surface functionalities. Raven 1040 and Black Pearls L are in this category. The ASTM method D 5832-98 prescribes a standard procedure for determination of the volatile content of activated carbon.27 In principle, the method is based on measuring the weight loss of activated carbon heated in a covered crucible in a muffle furnace for a strictly regulated duration of 7 min ± 10 s. This method, which is specific to activated carbons having higher surface areas than our carbon black, was not used. Instead a more sensitive method was employed. In numerous literature reports the weight loss of various carbon materials subjected to heat treatment (temperature programmed desorption, TPD) is measured by conventional techniques of thermogravimetric analysis (TGA), sometimes coupled with mass spectrometric analysis (TGMS) or infrared detection (IR) of the gases evolved as a function of temperature.28,29,30 In general, oxygen-containing surface functional decompose mostly as CO and CO2. It was proposed that CO2-yielding complexes were mainly responsible for the acidic character of carbons in aqueous conditions, rather than the CO-decomposing groups. The complexes yielding CO2 were shown to decompose at two different temperatures: carboxylic acids at about 375ºC and carboxylic anhydrides and lactones at about 625 ºC. The CO-yielding groups decompose at 625–825 ºC and were assigned to phenols, ethers, and carbonyls. 31 The “intelligent” gravimetric analyzer (IGA-01) by Hiden Analytical was used; it integrates a computer-controlled microbalance (resolution 0.1 µg) with accurate temperature and pressure control. The instrument is available in the Carbon Materials Technology Group of Metals and Ceramics Division of ORNL. In our procedure, nominal sample weights of 100 mg were loaded in the microbalance pan. The samples were degassed under a dynamic vacuum at room temperature for two hours. Degassed samples were heated under dynamic vacuum with a constant rate of 3 ºC /min up to 800ºC (the highest operation temperature of this apparatus). The percentage weight changes were calculated relative to the weight of the sample after two hours of initial degassing. Mass spectra recorded during the heating program did not have the sensitivity required to distinguish between various desorbed species, a fact attributed to the small amount of sample loaded and low concentration of surface groups. This procedure provides more detailed information than the ASTM D 5832-98 because it relates weight losses with various temperature intervals. Figures 12–16 show the raw data based on recorded weight changes for the samples analyzed. For ease of comparison the weight changes are plotted on the same scale. In Fig. 17 the data are plotted as the derivative of weight changes versus temperature, in order to show the existence of characteristic peaks that can be assigned to various types of surface functionalities on carbon. The results are summarized in Table 5, which shows weight changes on temperature intervals of 200 ºC each, and the total weight loss up to 800 ºC.

23
Raven 1000
93
94
95
96
97
98
99
100
101
100 150 200 250 300 350 400 450 500
Time [ min ]
Wei
ght C
hang
e [%
]
0
100
200
300
400
500
600
700
800
900
Tem
pera
ture
[ oC
]
Weight Temperature
Fig. 12 Weight changes during thermogravimetric analysis of Raven 1000
Black Pearls
93
94
95
96
97
98
99
100
101
100 150 200 250 300 350 400 450 500Time [ min ]
Wei
ght C
hang
e [%
]
0
100
200
300
400
500
600
700
800
900
Tem
pera
ture
[ o C
]
Weight Temperature
Fig. 13 Weight changes during thermogravimetric analysis of Black Pearls L
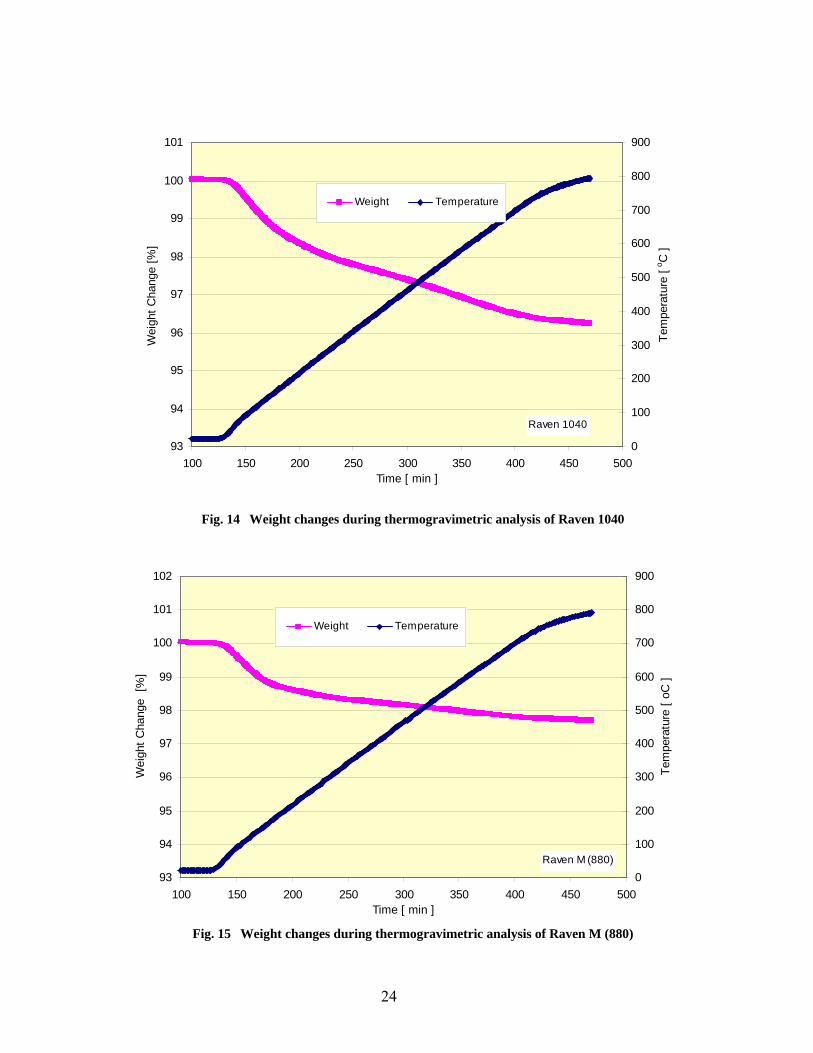
24
Raven 1040
93
94
95
96
97
98
99
100
101
100 150 200 250 300 350 400 450 500Time [ min ]
Wei
ght C
hang
e [%
]
0
100
200
300
400
500
600
700
800
900
Tem
pera
ture
[ o C
]
Weight Temperature
Fig. 14 Weight changes during thermogravimetric analysis of Raven 1040
Raven M (880) 93
94
95
96
97
98
99
100
101
102
100 150 200 250 300 350 400 450 500Time [ min ]
Wei
ght C
hang
e [%
]
0
100
200
300
400
500
600
700
800
900
Tem
pera
ture
[ oC
]
Weight Temperature
Fig. 15 Weight changes during thermogravimetric analysis of Raven M (880)

25
Cabot G
93
94
95
96
97
98
99
100
101
100 150 200 250 300 350 400 450 500Time [ min ]
Wei
ght C
hang
e [%
]
0
100
200
300
400
500
600
700
800
900
Tem
pera
ture
[ oC
]
Weight Temperature
Fig. 16 Weight changes during thermogravimetric analysis of Cabot sample G
0
0.01
0.02
0.03
0.04
0.05
0.06
0 100 200 300 400 500 600 700 800
Temperature [oC]
Wei
ght d
eriv
ativ
e, d
w/d
T [%
/ o C]
Raven 1000
Raven M (880)
Cabot G
Raven 1040
Black Pearls L
Fig. 17 Curves of weight derivatives versus temperature during thermogravimetric analysis of selected
carbons
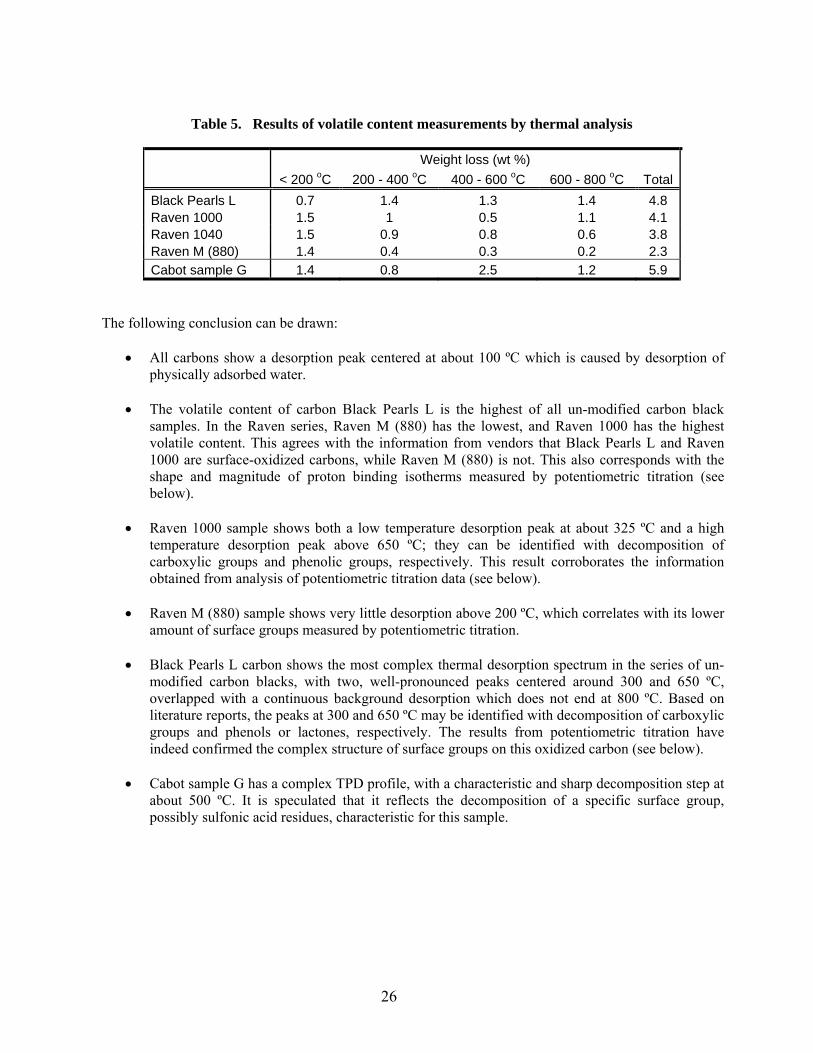
26
Table 5. Results of volatile content measurements by thermal analysis
Weight loss (wt %) < 200 oC 200 - 400 oC 400 - 600 oC 600 - 800 oC Total
Black Pearls L 0.7 1.4 1.3 1.4 4.8 Raven 1000 1.5 1 0.5 1.1 4.1 Raven 1040 1.5 0.9 0.8 0.6 3.8 Raven M (880) 1.4 0.4 0.3 0.2 2.3 Cabot sample G 1.4 0.8 2.5 1.2 5.9
The following conclusion can be drawn:
• All carbons show a desorption peak centered at about 100 ºC which is caused by desorption of physically adsorbed water.
• The volatile content of carbon Black Pearls L is the highest of all un-modified carbon black
samples. In the Raven series, Raven M (880) has the lowest, and Raven 1000 has the highest volatile content. This agrees with the information from vendors that Black Pearls L and Raven 1000 are surface-oxidized carbons, while Raven M (880) is not. This also corresponds with the shape and magnitude of proton binding isotherms measured by potentiometric titration (see below).
• Raven 1000 sample shows both a low temperature desorption peak at about 325 ºC and a high
temperature desorption peak above 650 ºC; they can be identified with decomposition of carboxylic groups and phenolic groups, respectively. This result corroborates the information obtained from analysis of potentiometric titration data (see below).
• Raven M (880) sample shows very little desorption above 200 ºC, which correlates with its lower
amount of surface groups measured by potentiometric titration.
• Black Pearls L carbon shows the most complex thermal desorption spectrum in the series of un-modified carbon blacks, with two, well-pronounced peaks centered around 300 and 650 ºC, overlapped with a continuous background desorption which does not end at 800 ºC. Based on literature reports, the peaks at 300 and 650 ºC may be identified with decomposition of carboxylic groups and phenols or lactones, respectively. The results from potentiometric titration have indeed confirmed the complex structure of surface groups on this oxidized carbon (see below).
• Cabot sample G has a complex TPD profile, with a characteristic and sharp decomposition step at
about 500 ºC. It is speculated that it reflects the decomposition of a specific surface group, possibly sulfonic acid residues, characteristic for this sample.
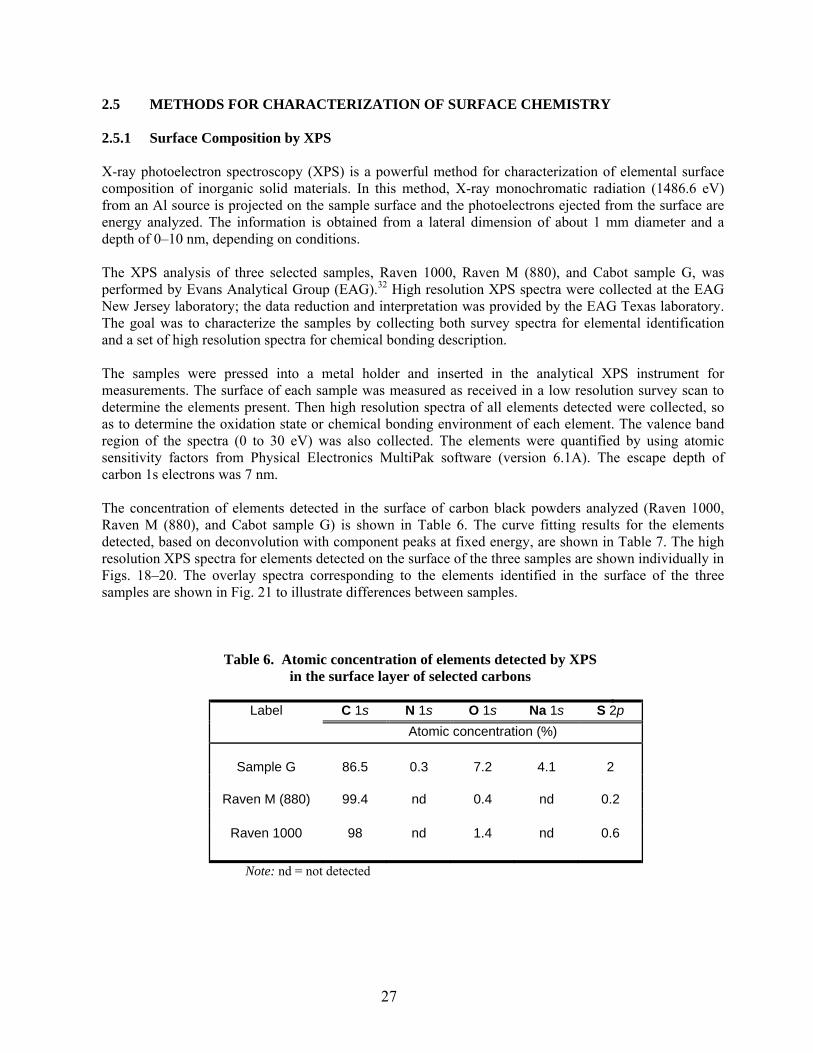
27
2.5 METHODS FOR CHARACTERIZATION OF SURFACE CHEMISTRY
2.5.1 Surface Composition by XPS X-ray photoelectron spectroscopy (XPS) is a powerful method for characterization of elemental surface composition of inorganic solid materials. In this method, X-ray monochromatic radiation (1486.6 eV) from an Al source is projected on the sample surface and the photoelectrons ejected from the surface are energy analyzed. The information is obtained from a lateral dimension of about 1 mm diameter and a depth of 0–10 nm, depending on conditions. The XPS analysis of three selected samples, Raven 1000, Raven M (880), and Cabot sample G, was performed by Evans Analytical Group (EAG).32 High resolution XPS spectra were collected at the EAG New Jersey laboratory; the data reduction and interpretation was provided by the EAG Texas laboratory. The goal was to characterize the samples by collecting both survey spectra for elemental identification and a set of high resolution spectra for chemical bonding description. The samples were pressed into a metal holder and inserted in the analytical XPS instrument for measurements. The surface of each sample was measured as received in a low resolution survey scan to determine the elements present. Then high resolution spectra of all elements detected were collected, so as to determine the oxidation state or chemical bonding environment of each element. The valence band region of the spectra (0 to 30 eV) was also collected. The elements were quantified by using atomic sensitivity factors from Physical Electronics MultiPak software (version 6.1A). The escape depth of carbon 1s electrons was 7 nm. The concentration of elements detected in the surface of carbon black powders analyzed (Raven 1000, Raven M (880), and Cabot sample G) is shown in Table 6. The curve fitting results for the elements detected, based on deconvolution with component peaks at fixed energy, are shown in Table 7. The high resolution XPS spectra for elements detected on the surface of the three samples are shown individually in Figs. 18–20. The overlay spectra corresponding to the elements identified in the surface of the three samples are shown in Fig. 21 to illustrate differences between samples.
Table 6. Atomic concentration of elements detected by XPS in the surface layer of selected carbons
C 1s N 1s O 1s Na 1s S 2p Label
Atomic concentration (%)
Sample G
86.5
0.3
7.2
4.1
2
Raven M (880) 99.4 nd 0.4 nd 0.2
Raven 1000 98 nd 1.4 nd 0.6
Note: nd = not detected
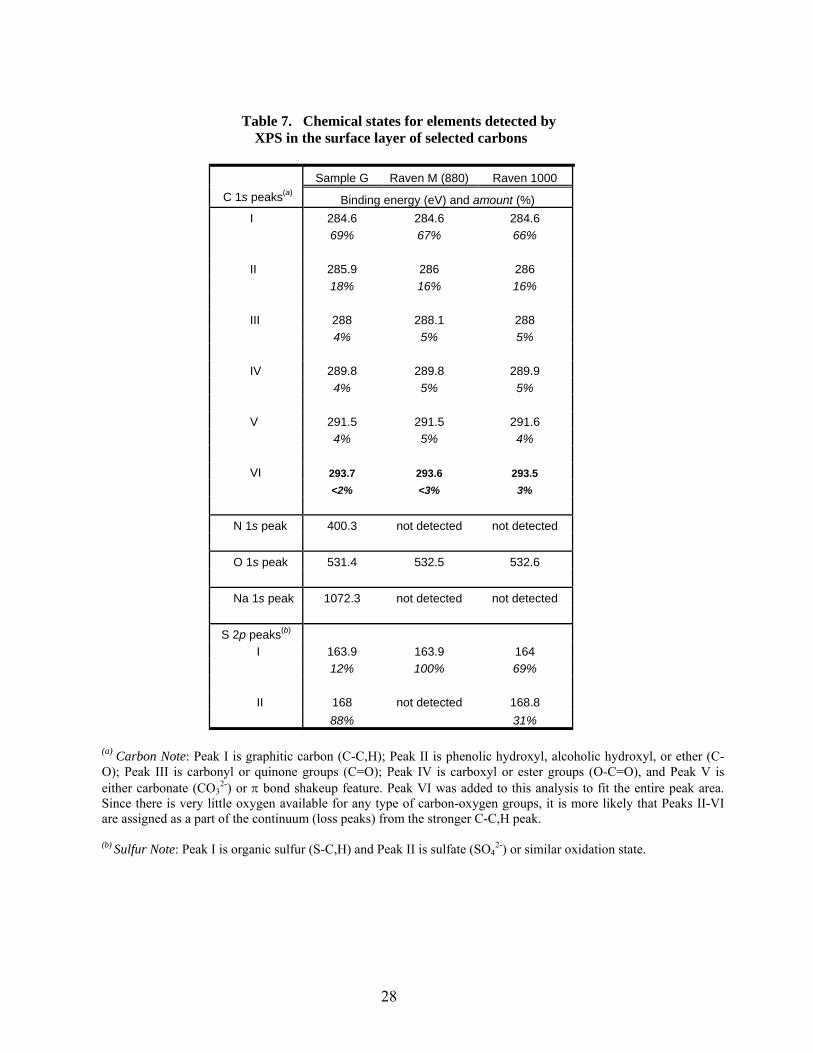
28
Table 7. Chemical states for elements detected by
XPS in the surface layer of selected carbons
Sample G Raven M (880) Raven 1000 C 1s peaks(a) Binding energy (eV) and amount (%)
I 284.6 284.6 284.6 69% 67% 66% II 285.9 286 286 18% 16% 16% III 288 288.1 288 4% 5% 5% IV 289.8 289.8 289.9 4% 5% 5% V 291.5 291.5 291.6 4% 5% 4% VI 293.7 293.6 293.5 <2% <3% 3% N 1s peak 400.3 not detected not detected O 1s peak 531.4 532.5 532.6 Na 1s peak 1072.3 not detected not detected S 2p peaks(b)
I 163.9 163.9 164 12% 100% 69% II 168 not detected 168.8 88% 31%
(a) Carbon Note: Peak I is graphitic carbon (C-C,H); Peak II is phenolic hydroxyl, alcoholic hydroxyl, or ether (C-O); Peak III is carbonyl or quinone groups (C=O); Peak IV is carboxyl or ester groups (O-C=O), and Peak V is either carbonate (CO3
2-) or π bond shakeup feature. Peak VI was added to this analysis to fit the entire peak area. Since there is very little oxygen available for any type of carbon-oxygen groups, it is more likely that Peaks II-VI are assigned as a part of the continuum (loss peaks) from the stronger C-C,H peak. (b) Sulfur Note: Peak I is organic sulfur (S-C,H) and Peak II is sulfate (SO4
2-) or similar oxidation state.
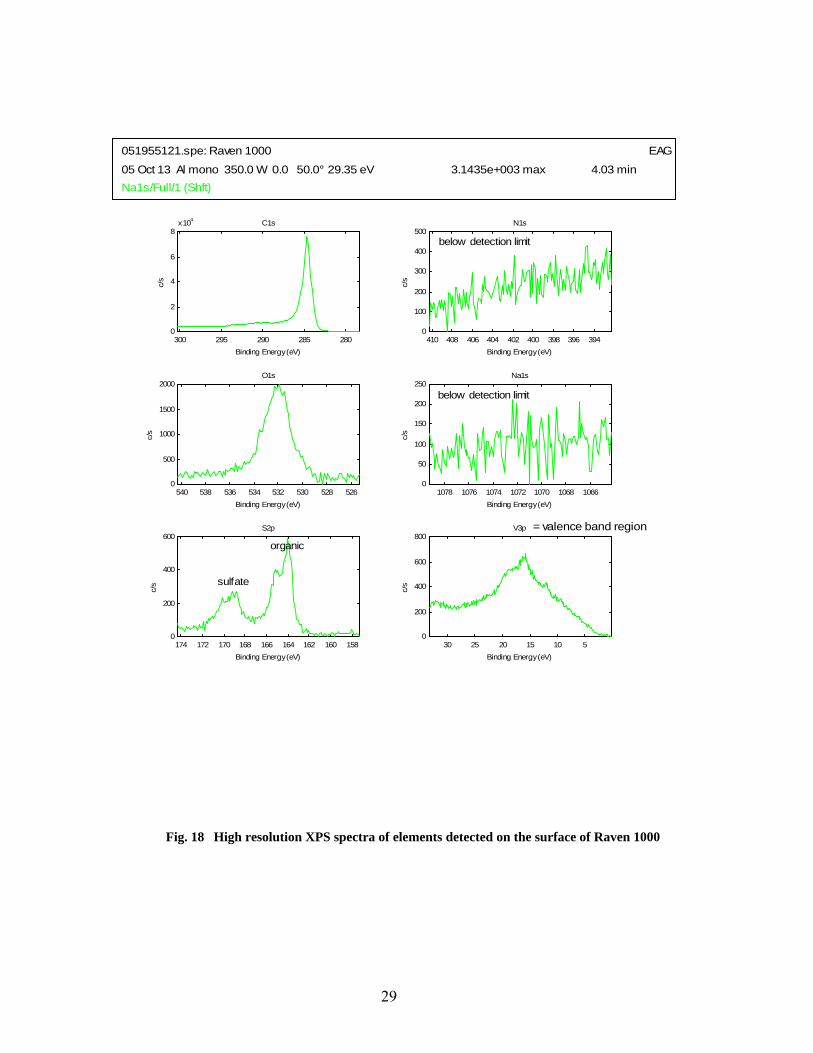
29
051955121.spe: Raven 1000 EAG
05 Oct 13 Al mono 350.0 W 0.0 50.0° 29.35 eV 3.1435e+003 max 4.03 minNa1s/Full/1 (Shft)
5265285305325345365385400
500
1000
1500
2000
Binding Energy (eV)
c/s
O1s
2802852902953000
2
4
6
8x 10⁴
Binding Energy (eV)
c/s
C1s
3943963984004024044064084100
100
200
300
400
500
Binding Energy (eV)
c/s
N1s
below detection limit
10661068107010721074107610780
50
100
150
200
250
Binding Energy (eV)
c/s
Na1s
below detection limit
1581601621641661681701721740
200
400
600
Binding Energy (eV)
c/s
S2p
organic
sulfate
510152025300
200
400
600
800
Binding Energy (eV)
c/s
V3p = valence band region
Fig. 18 High resolution XPS spectra of elements detected on the surface of Raven 1000
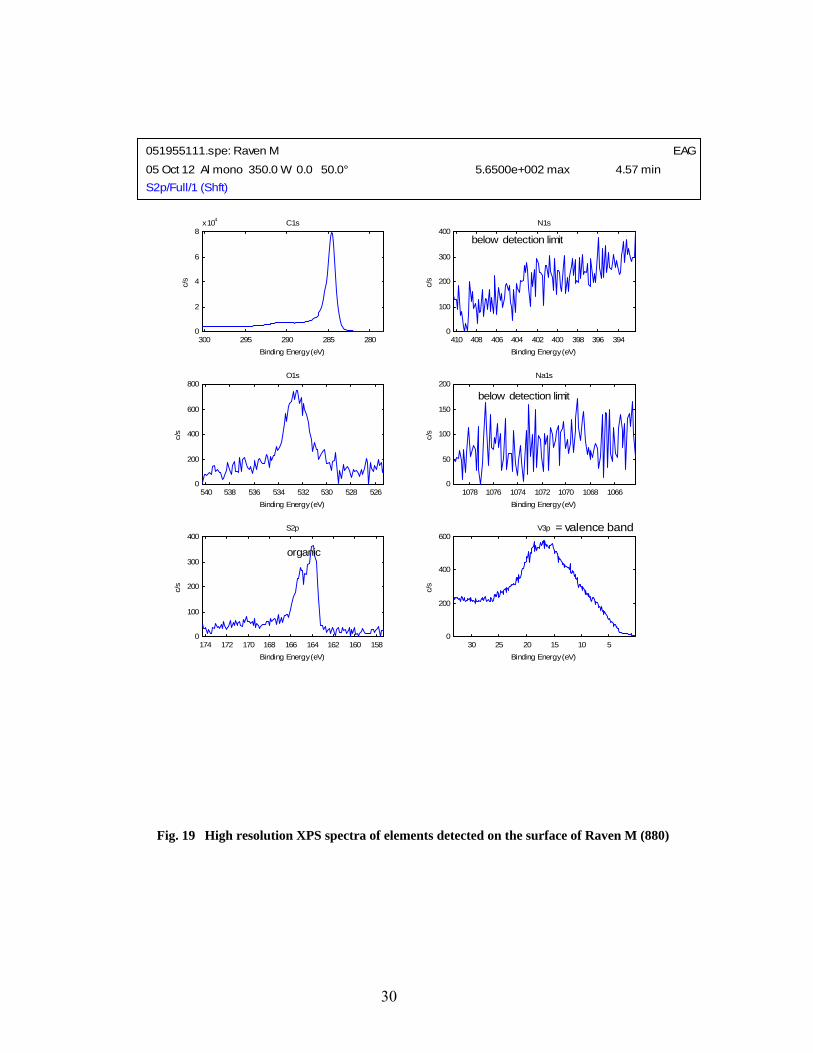
30
051955111.spe: Raven M EAG
05 Oct 12 Al mono 350.0 W 0.0 50.0° 5.6500e+002 max 4.57 minS2p/Full/1 (Shft)
2802852902953000
2
4
6
8x 10⁴
Binding Energy (eV)
c/s
C1s
510152025300
200
400
600
Binding Energy (eV)
c/s
V3p = valence band
10661068107010721074107610780
50
100
150
200
Binding Energy (eV)
c/s
Na1s
below detection limit
3943963984004024044064084100
100
200
300
400
Binding Energy (eV)
c/s
N1s
below detection limit
5265285305325345365385400
200
400
600
800
Binding Energy (eV)
c/s
O1s
1581601621641661681701721740
100
200
300
400
Binding Energy (eV)
c/s
S2p
organic
Fig. 19 High resolution XPS spectra of elements detected on the surface of Raven M (880)
31
051955101.spe: Sample G EAG
05 Oct 12 Al mono 350.0 W 0.0 50.0° 6.0972e+004 max 44.25 sC1s/Full/1 (Shft Shft)
10661068107010721074107610780
5000
10000
15000
Binding Energy (eV)
c/s
Na1s
5265285305325345365385400
5000
10000
15000
Binding Energy (eV)
c/s
O1s
2802852902953000
2
4
6
8x 10⁴
Binding Energy (eV)
c/s
C1s
3943963984004024044064084100
100
200
300
400
500
Binding Energy (eV)
c/s
N1s
organic
1581601621641661681701721740
500
1000
1500
2000
Binding Energy (eV)
c/s
S2p
organic
sulfate
510152025300
200
400
600
Binding Energy (eV)
c/s
V3p
Na2p
----
->
O2s
--->
= valend band region
Fig. 20 High resolution XPS spectra of elements detected on the surface of Cabot sample G
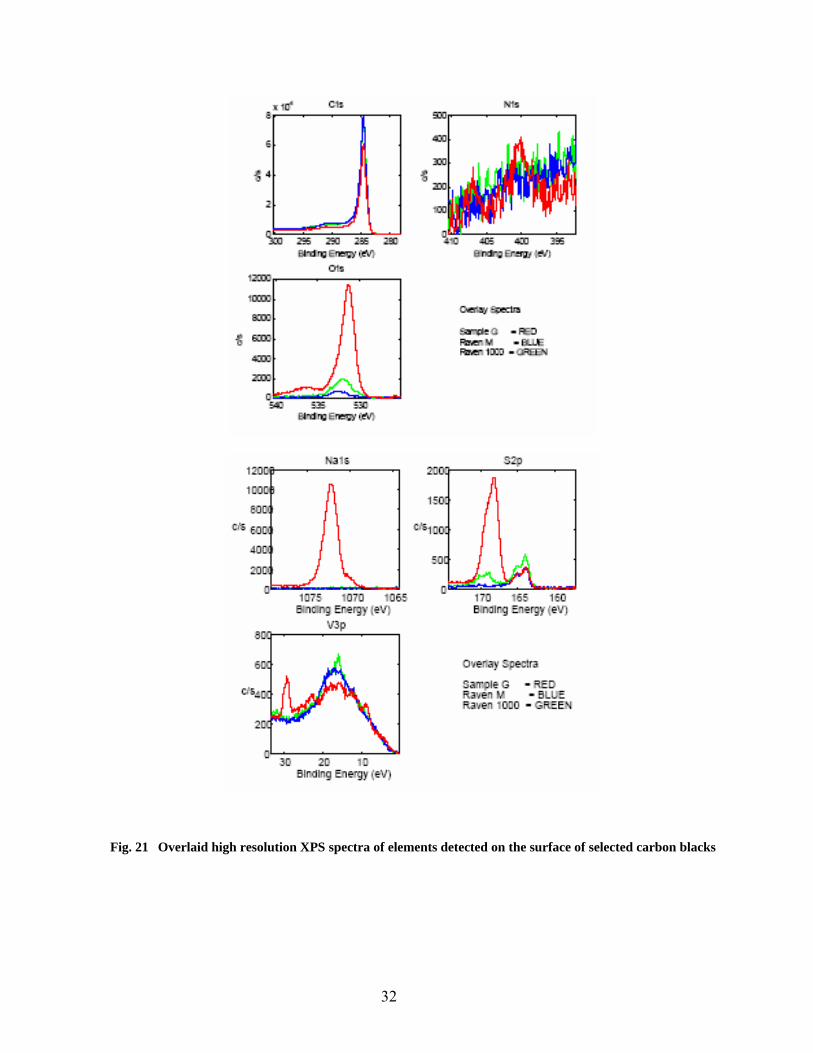
32
Fig. 21 Overlaid high resolution XPS spectra of elements detected on the surface of selected carbon blacks

33
The main results from XPS characterization are summarized below:
• Carbon was the most abundant element detected in all samples; small amounts of oxygen and sulfur were also detected. On Cabot sample G, minor amounts of both nitrogen and sodium were detected on the surface.
• Samples Raven 1000 and Raven M (880) were very similar in surface composition. By
comparison, Cabot sample G had significantly more oxygen and sulfur on the surface. The sodium peak (Na 1s) found for Cabot sample G was assigned to Na+. This confirms the presence of sodium sulfonate groups (–SO3
- Na+) as a modifier in carbon G. • The carbon spectra originating at the C 1s electron energy were fitted with the minimum number
of peaks (6) selected based on literature information.33,34 The dominant bonds of carbon atoms were C–C,H bonds (284.6 eV). A continuous feature at higher energies could be assigned either to a collection of specific surface oxides (as fitted), but it could also be interpreted as a continuous loss feature characteristic for all graphitic materials.
• The O 1s spectrum for Cabot sample G has the main peak at 531.5 eV, while the peak for samples
Raven 1000 and Raven M (880) is shifted to 532 eV. The oxygen peak of sample G has a small component at 532.6 eV and a satellite at 536.3 eV. The peak found on Raven M (880) could be surface oxygen and/or oxygen bonded to carbon. For Raven 1000 and especially for Cabot sample G, the high energy peak could represent oxygen bonded to sulfur.
• The sulfur spectra (S 2p) for all samples has a peak at 163.9 eV which was assigned as organic
sulfur (S–C,H bonding). In addition, sample G and (to a lesser extent) Raven 1000 showed another peak at > 168 eV which was assigned to S4+ as in sulfate (SO4
2-) and organic sulfonates (-SO3
-). Raven 1000 may have some surface traces of sulfates.
• The valence band region of sample G showed a Na 2p peak (29.3 eV) and an O 2s peak (22.9 eV) besides the broad feature below 20 eV. This broad feature represents C 2s (12–22 eV) and C 2p (5–12 eV) electron levels and does not show much difference between samples Raven 1000, Raven M (880), and Cabot sample G. In fact, a similar broad feature is known in the literature for highly-oriented pyrolytic graphite (HOPG) materials.
2.5.2. Derivation of pKa Spectra of Surface Functionalities from Potentiometric Titration 2.5.2.1. Background and significance Carbon materials can be considered as composed of layers of fused aromatic rings (graphene layers) with a certain degree of planarity, which depends on the degree of graphitization of the material. In carbon blacks, the graphene layers are arranged in disordered onion-like structures, as shown for example in the high resolution transmission electron image of primary particles in Black Pearls L (Fig. 22). Two types of sites can be distinguished in graphene layers: basal- and edge-carbon atoms. The edge sites (along with structural vacancies, non-aromatic positions, etc) have a strong tendency to chemisorb heteroatoms such as oxygen, hydrogen, nitrogen, sulfur, etc. giving rise to stable chemical compounds. This is the origin of “surface functionalities” of carbonaceous materials.
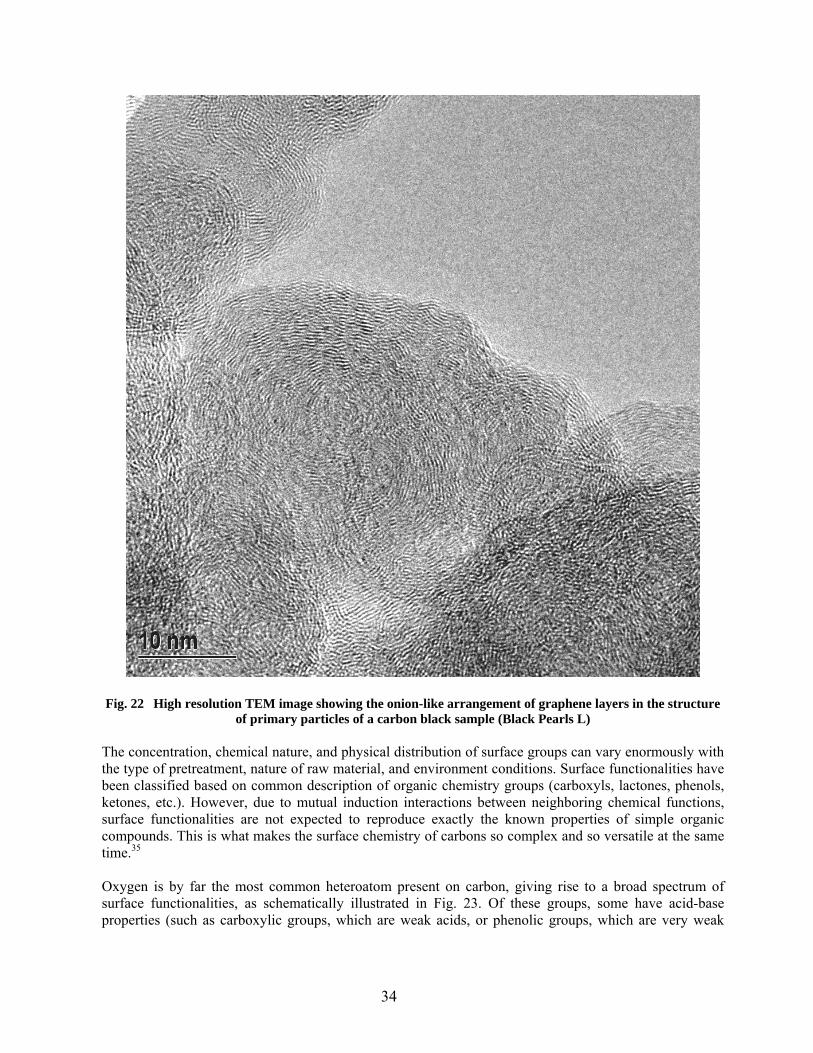
34
Fig. 22 High resolution TEM image showing the onion-like arrangement of graphene layers in the structure
of primary particles of a carbon black sample (Black Pearls L) The concentration, chemical nature, and physical distribution of surface groups can vary enormously with the type of pretreatment, nature of raw material, and environment conditions. Surface functionalities have been classified based on common description of organic chemistry groups (carboxyls, lactones, phenols, ketones, etc.). However, due to mutual induction interactions between neighboring chemical functions, surface functionalities are not expected to reproduce exactly the known properties of simple organic compounds. This is what makes the surface chemistry of carbons so complex and so versatile at the same time.35 Oxygen is by far the most common heteroatom present on carbon, giving rise to a broad spectrum of surface functionalities, as schematically illustrated in Fig. 23. Of these groups, some have acid-base properties (such as carboxylic groups, which are weak acids, or phenolic groups, which are very weak

35
acids), some have redox properties (such as the quinone-phenol couple), and others are neutral or not reactive in normal conditions of pH (ketones, esters).
(a) carboxyl groups (b) lactones (c) phenolic hydroxyl (d) carbonyl (e) quinone (f) ether (g) pyrone
(h) (h) carboxylic anhydride (i) chromene (j) lactol (k) basal plane with localized π
electrons
Fig. 23 Schematic representation of oxygen-containing functional group on edge positions of graphene
layers in carbon A direct chemical method for identification of surface chemical groups on carbons is based on characterization of acid-base properties of carbon in aqueous electrolyte solutions. The simplest characterization possible is measuring the immersion pH: the more oxidized the surface, the more acidic is the immersion pH. A more detailed characterization is based on recording the pH response of carbon dispersions in aqueous electrolyte solutions on controlled additions of strong acid or strong base; in other words, in conditions of potentiometric titrations. This principle is at the basis of determination of proton affinity distribution spectra (or pKa spectra) of carbon materials. The method was first developed in the ‘90s for characterization of inorganic oxides and catalyst supports, and it was later extended to characterization of acid-base properties of carbonaceous materials. The use of potentiometric titration method for characterization of pKa spectra of functional groups on carbon blacks is new in the literature and will be explained in details below. When acid or base is added to carbon suspensions, some surface groups may dissociate protons and others may bind protons, depending on their nature and the solution pH. Under controlled conditions it is possible to accurately evaluate the amounts (millimoles) of protons bound or released per gram of sample by measuring the pH at equilibrium and comparing it with the blank conditions (either measured or calculated). The result of this proton balance equations is a proton binding isotherm, which shows the amounts (mmoles/gram) of protons bound or released by the carbon sample at equilibrium as a function of solution pH. From the mathematical point of view, the proton binding isotherm is an average property of reactive carbon groups, and is composed of the weighed contribution of individual and distinct classes of surface chemical groups. The basic assumption is that each class of surface groups is characterized by its own acidity constant (its own pKa value). Surface groups bind or release protons at various pHs according to their own reactivity expressed by the pKa. The goal is to estimate the function that describes

36
the distribution of surface functionalities (in units of mmol/g) as a function of their acidic strength (or pKa). This is called the proton affinity distribution or the pKa spectrum. 2.5.2.2. Procedure A procedure for accurate measurement of acid-base properties of surface groups on carbon materials by potentiometric titration was setup at ORNL. The equipment was the automatic titration station Metrohm Titrino 798 which was purchased from Brinkmann Instruments, Inc. The unit is complete with a Brinkmann pH-sensitive glass electrode, two delivery burettes (10 mL each) with reagent bottles (one for acid, another for base), a magnetic stirring unit, and a jacketed glass vessel for titrations, with water circulation from a water bath (Fisher Isotemp Circulator) for maintaining a constant temperature (25ºC) during runs. The titrator was metrollogically calibrated with traceable standards by Brinkmann. The titration runs were controlled by a PC computer using the Vezuv 3.0 software. All this equipment is shown in Fig. 24.
Fig. 24 Automatic titration station Titrino 798 used for carbon characterization by potentiometric titration
The reagents used were certified analytical reagents from Fisher Scientific:
• Nitric acid solution, 0.1 N (N/10) normality 0.0995 – 0.1005 • Sodium hydroxide solutions, 0.1 N (N/10) normality 0.0995 – 0.1005 • Sodium nitrate crystals (ACS certified) used as electrolyte • Citric acid anhydrous crystalline (ACS certified) used as a standard

37
In addition, a calibrated Mettler AT-250 analytical balance and Fisher certified graduated glassware (50 mL pipette, 1 L Pyrex volumetric flasks were used. The pH electrode was calibrated periodically against color-coded certified buffer solutions (pH 4.00, pH 7.00, and pH 10.00 at 25 ºC from Fisher Scientific). A stock electrolyte solution of 0.1 M sodium nitrate (NaNO3) was prepared as needed in amounts of 1 L and stored in a capped Nalgene plastic bottle. Ultra-pure deionized (DI) water (0.2 µS.cm-1) was used for preparation of sodium nitrate solutions. Special attention was paid in eliminating the traces of dissolved CO2 from reagents and during titrations. The reagent bottles were protected with a fresh capsule of Ascarite (Fisher Scientific) on the sodium hydroxide bottle (for retention of carbon dioxide), and molecular sieve on the nitric acid bottle (for retention of moisture). During all titration runs, the titration vessel was always closed with a lid having perforated entries for the pH electrode and the burette tip; the liquid inside the titration vessel was bubbled with pure argon in order to remove dissolved carbon dioxide and to protect against re-absorption from air. The equipment was tested in blank acid-base titrations of known volumes (3-5 mL) of nitric acid and sodium hydroxide against each other, using automatic detection of equivalence points by the Titrino software. Based on these results, it was concluded that the normality of acid and base titrants corresponds to the specifications and it was decided not to make any correction for reagent concentrations. The standard procedure in all carbon black titrations was as follows. Using a calibrated 50 mL glass pipette, a volume of 50 mL sodium nitrate solution (NaNO3 0.1 N) was delivered to the clean titration vessel. The temperature of water in the jacketed mantle was 25ºC. A Teflon-covered magnetic stirring bar was introduced in the solution, the vessel was placed on the magnetic stirring station operating at a moderate speed, and a flow of pure argon was bubbled through the solution. The pH was monitored continuously. Usually, the pH dropped about 0.5 pH units, then rose back to levels higher than the initial reading before argon bubbling. After about 15-20 minutes a stable reading in the range of pH 6.5-7.5 was achieved. At this point, a nominal amount of 0.5 grams carbon black sample was added to the electrolyte solution, under continuous stirring and argon bubbling. Depending on the nature of carbon, the new pH was either more acidic or more basic than that of the electrolyte solution. A carefully measured volume of either 0.1 N HNO3 (or 0.1 N NaOH) was added to the acidic (or basic) carbon – electrolyte suspension in order to push the pH to either one of the limits of the pH window that is accessible to measurements; normally, accurate measurements are possible from pH 3.5 to pH 10.5. The titration was started after another 6 hours of equilibration of the carbon-electrolyte suspension at one of the ends of pH range, either 3.5 or 10.5. The titrants were either 0.1 N HNO3 solution (if the starting point was close to pH 10.5) or 0.1 N NaOH (if the starting point was close to pH 3.5). Stirring and argon bubbling continued during all the data collection. A full run lasted from 12 to 20 hours, depending on sample. Titrations were run through the internal software of Titrino instrument. A monotonic equivalent point titration (MET) method was created for each of acid or base titration. In this method equal increments of titrant are delivered to the sample, and the pH variation is monitored; a new increment is added only if the pH drift is smaller than the acceptable equilibrium condition. The method ends when the end-point pH was reached, or when a certain volume of titrant has been consumed. After several trials, it was found that the following titration parameters gave reproducible and stable results:
• Volume of titrant for each addition: 0.020 mL • Rate of titrant additions: maximum rate allowed
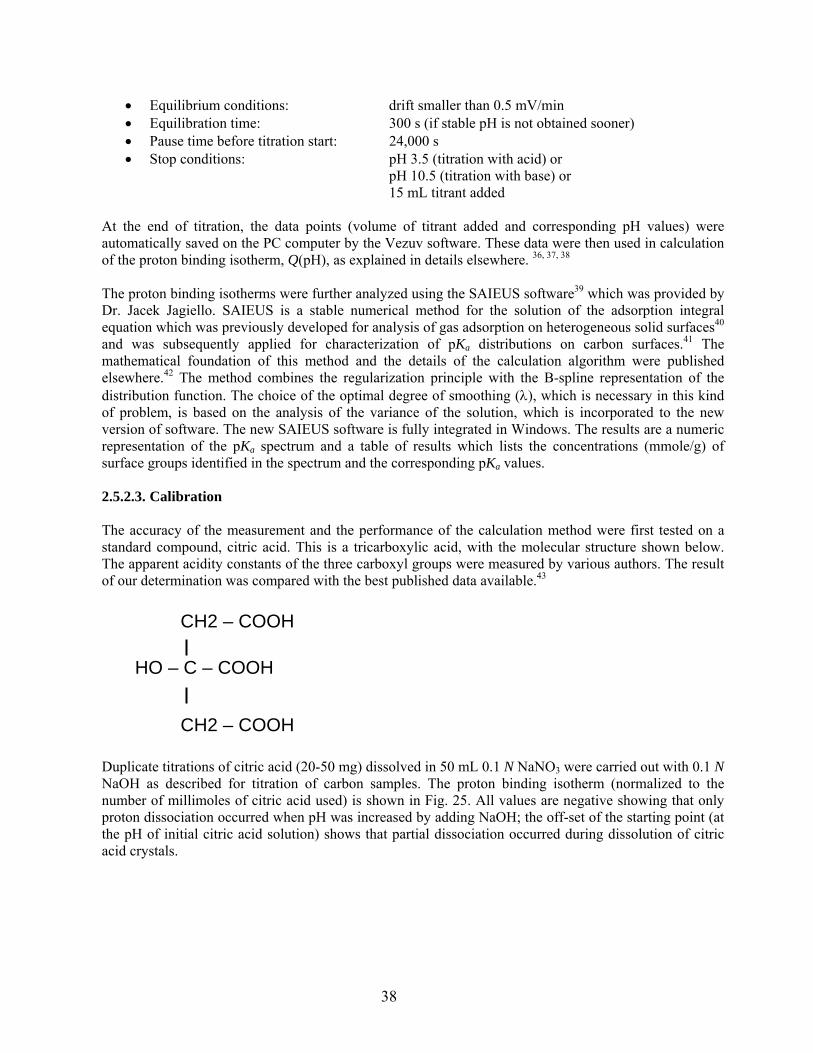
38
• Equilibrium conditions: drift smaller than 0.5 mV/min • Equilibration time: 300 s (if stable pH is not obtained sooner) • Pause time before titration start: 24,000 s • Stop conditions: pH 3.5 (titration with acid) or pH 10.5 (titration with base) or 15 mL titrant added
At the end of titration, the data points (volume of titrant added and corresponding pH values) were automatically saved on the PC computer by the Vezuv software. These data were then used in calculation of the proton binding isotherm, Q(pH), as explained in details elsewhere. 36, 37, 38 The proton binding isotherms were further analyzed using the SAIEUS software39 which was provided by Dr. Jacek Jagiello. SAIEUS is a stable numerical method for the solution of the adsorption integral equation which was previously developed for analysis of gas adsorption on heterogeneous solid surfaces40 and was subsequently applied for characterization of pKa distributions on carbon surfaces.41 The mathematical foundation of this method and the details of the calculation algorithm were published elsewhere.42 The method combines the regularization principle with the B-spline representation of the distribution function. The choice of the optimal degree of smoothing (λ), which is necessary in this kind of problem, is based on the analysis of the variance of the solution, which is incorporated to the new version of software. The new SAIEUS software is fully integrated in Windows. The results are a numeric representation of the pKa spectrum and a table of results which lists the concentrations (mmole/g) of surface groups identified in the spectrum and the corresponding pKa values. 2.5.2.3. Calibration The accuracy of the measurement and the performance of the calculation method were first tested on a standard compound, citric acid. This is a tricarboxylic acid, with the molecular structure shown below. The apparent acidity constants of the three carboxyl groups were measured by various authors. The result of our determination was compared with the best published data available.43
Duplicate titrations of citric acid (20-50 mg) dissolved in 50 mL 0.1 N NaNO3 were carried out with 0.1 N NaOH as described for titration of carbon samples. The proton binding isotherm (normalized to the number of millimoles of citric acid used) is shown in Fig. 25. All values are negative showing that only proton dissociation occurred when pH was increased by adding NaOH; the off-set of the starting point (at the pH of initial citric acid solution) shows that partial dissociation occurred during dissolution of citric acid crystals.
CH2 – COOH
HO – C – COOH
CH2 – COOH
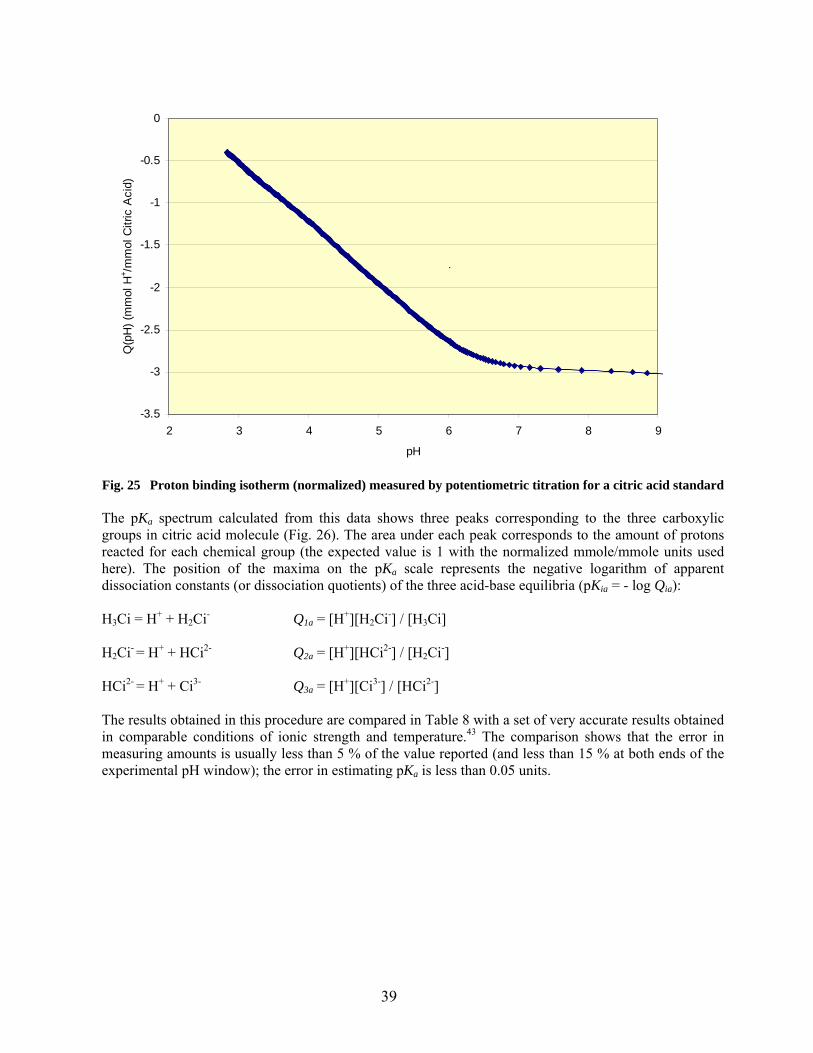
39
-3.5
-3
-2.5
-2
-1.5
-1
-0.5
0
2 3 4 5 6 7 8 9
pH
Q(p
H) (
mm
ol H
+ /mm
ol C
itric
Aci
d)
.
Fig. 25 Proton binding isotherm (normalized) measured by potentiometric titration for a citric acid standard The pKa spectrum calculated from this data shows three peaks corresponding to the three carboxylic groups in citric acid molecule (Fig. 26). The area under each peak corresponds to the amount of protons reacted for each chemical group (the expected value is 1 with the normalized mmole/mmole units used here). The position of the maxima on the pKa scale represents the negative logarithm of apparent dissociation constants (or dissociation quotients) of the three acid-base equilibria (pKia = - log Qia): H3Ci = H+ + H2Ci- Q1a = [H+][H2Ci-] / [H3Ci] H2Ci- = H+ + HCi2- Q2a = [H+][HCi2-] / [H2Ci-] HCi2- = H+ + Ci3- Q3a = [H+][Ci3-] / [HCi2-] The results obtained in this procedure are compared in Table 8 with a set of very accurate results obtained in comparable conditions of ionic strength and temperature.43 The comparison shows that the error in measuring amounts is usually less than 5 % of the value reported (and less than 15 % at both ends of the experimental pH window); the error in estimating pKa is less than 0.05 units.

40
0
0.5
1
1.5
2
2.5
2 3 4 5 6 7 8 9
pK
F(pK
) [m
mol
/g]
Fig. 26 Proton affinity spectrum (pKa spectrum) obtained for a citric acid standard. The three peaks
correspond to the three carboxyl groups in citric acid; their position indicates the apparent dissociation constants, and the area under the peaks measures concentration of each group.
Table 8. Apparent acidity constants vs. published data, and normalized amounts of acid groups measured by
potentiometric titration of citric acid
Apparent dissociation
constants Normalized amounts of
acid groups
This report Published data
[Ref. 43] (mmole/mmole)
pKa1 2.91 2.90 1.13 pKa2 4.38 4.34 1.00 pKa3 5.72 5.68 0.98
2.5.2.4. Results The proton binding isotherms measured for unmodified carbon black samples are shown in Fig. 27. The results for surface-modified carbon blacks from the Cabot kit are given in Fig. 28. Note that these figures have a common scale for the sake of comparison.
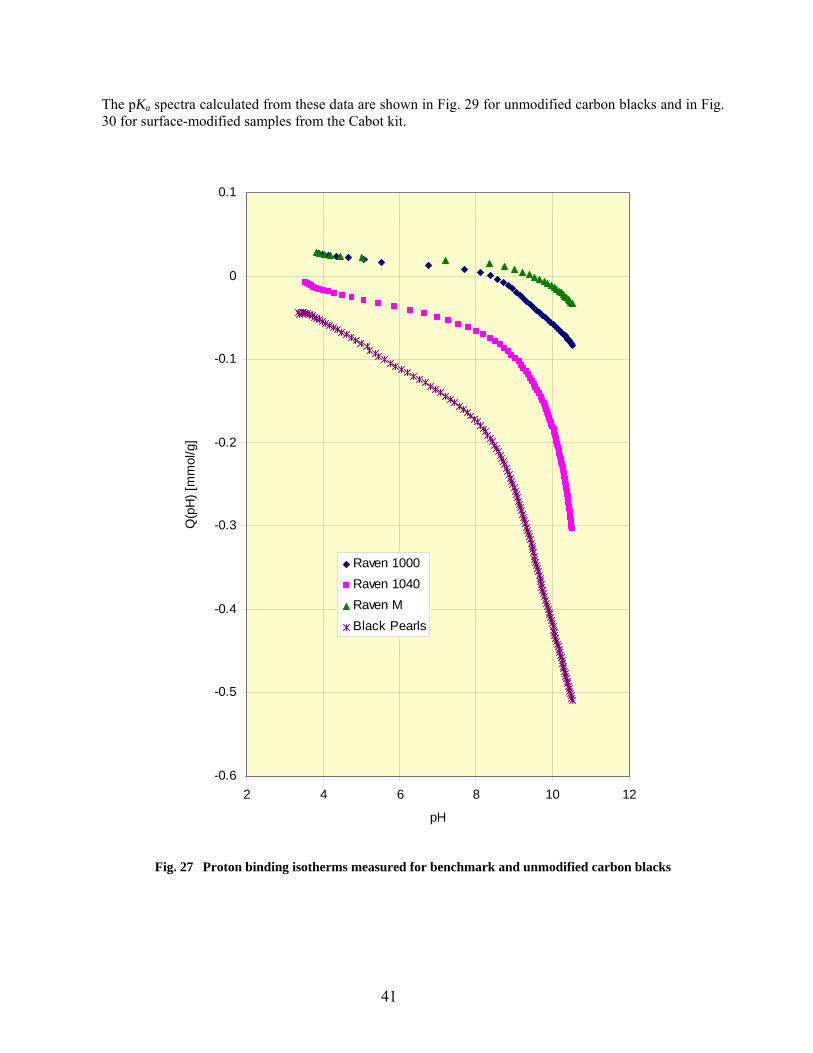
41
The pKa spectra calculated from these data are shown in Fig. 29 for unmodified carbon blacks and in Fig. 30 for surface-modified samples from the Cabot kit.
-0.6
-0.5
-0.4
-0.3
-0.2
-0.1
0
0.1
2 4 6 8 10 12
pH
Q(p
H) [
mm
ol/g
]
Raven 1000Raven 1040Raven MBlack Pearls
Fig. 27 Proton binding isotherms measured for benchmark and unmodified carbon blacks
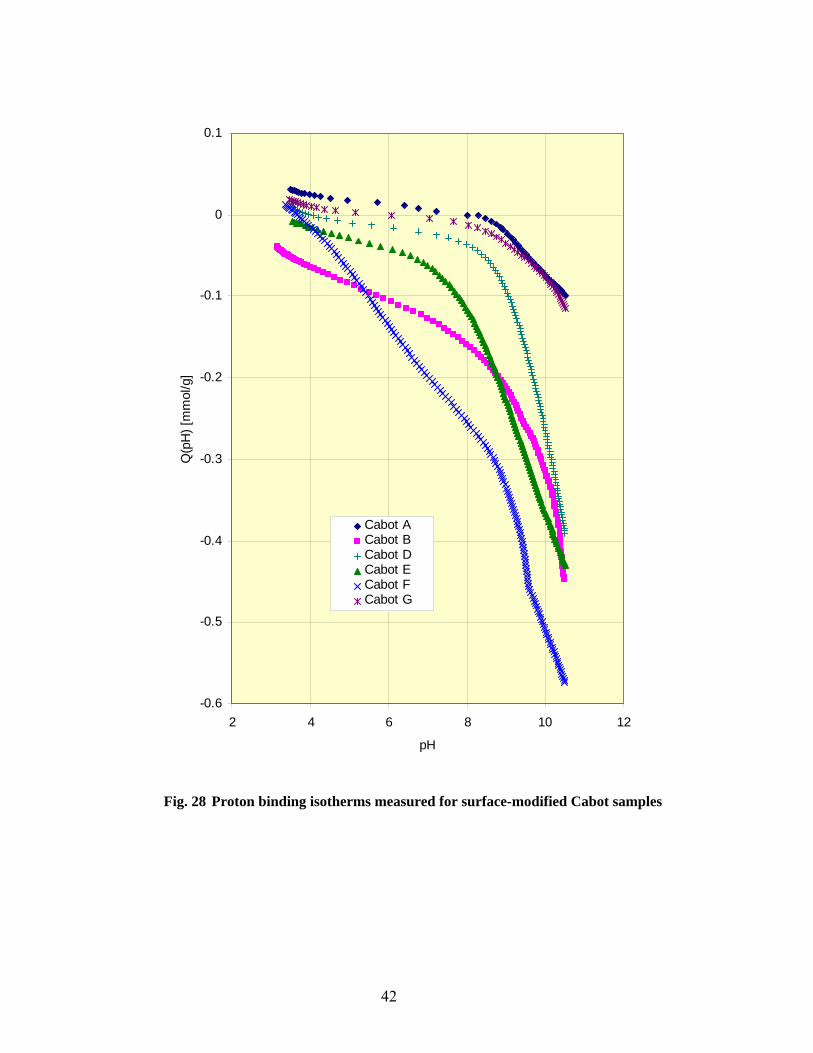
42
-0.6
-0.5
-0.4
-0.3
-0.2
-0.1
0
0.1
2 4 6 8 10 12
pH
Q(p
H) [
mm
ol/g
]
Cabot A Cabot BCabot DCabot ECabot FCabot G
Fig. 28 Proton binding isotherms measured for surface-modified Cabot samples

43
-0.50
0.00
0.50
1.00
1.50
2.00
2.50
3.00
2 4 6 8 10 12
pK
F(pK
) [m
mol
/g]
Raven 1000Raven 1040Raven MBlack Pearls
Raven 1000
Raven M
Raven 1040
Black Pearls L
Fig. 29 Proton affinity distribution spectra (pKa spectra) of benchmark and unmodified carbon black samples
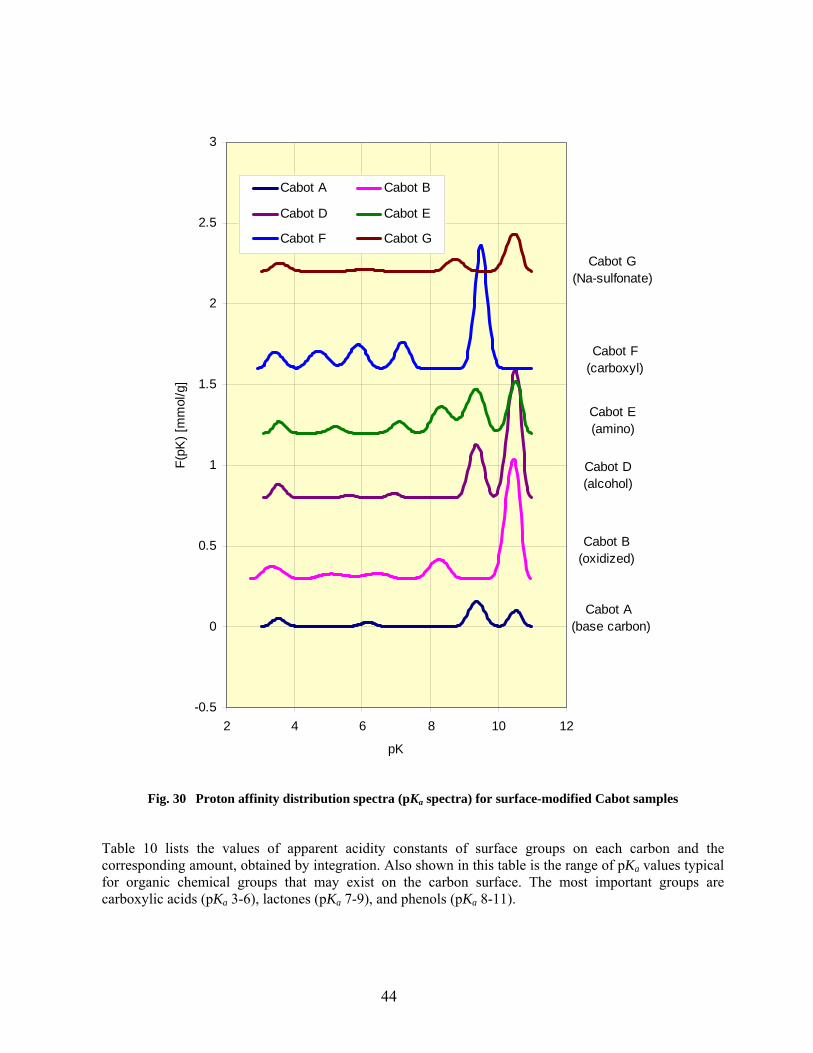
44
-0.5
0
0.5
1
1.5
2
2.5
3
2 4 6 8 10 12
pK
F(pK
) [m
mol
/g]
Cabot A Cabot B
Cabot D Cabot E
Cabot F Cabot G
Cabot A (base carbon)
Cabot B (oxidized)
Cabot E (amino)
Cabot F (carboxyl)
Cabot G (Na-sulfonate)
Cabot D (alcohol)
Fig. 30 Proton affinity distribution spectra (pKa spectra) for surface-modified Cabot samples Table 10 lists the values of apparent acidity constants of surface groups on each carbon and the corresponding amount, obtained by integration. Also shown in this table is the range of pKa values typical for organic chemical groups that may exist on the carbon surface. The most important groups are carboxylic acids (pKa 3-6), lactones (pKa 7-9), and phenols (pKa 8-11).

45
Table 9. Characterization of acid-base properties of functional groups on carbon samples based on analysis of pKa spectra
Peak No 1 2 3 4 5 6 7 pKa range 3 …4 4…5 5…6.5 6.5…7.5 7.5…9 9…10 10…11
Benchmark and unmodified carbons (a)
Raven 1000 3.86 5.31 9.08 10.47 0.009 0.010 0.057 0.070 Raven 1040 3.64 5.94 8.05 10.54 0.033 0.019 0.040 0.407 Raven M (880) 3.74 8.9 10.54 0.013 0.016 0.069 Black Pearls L 4.16 5.41 6.75 7.81 9.39 10.52 0.038 0.040 0.026 0.039 0.235 0.211
Surface-modified carbons (a)
Cabot A 3.52 6.18 9.38 10.53 0.024 0.013 0.089 0.043 Cabot B 3.32 5.11 6.44 8.25 10.41 0.051 0.027 0.030 0.081 0.388 Cabot D 3.52 5.58 6.93 9.34 10.49 0.036 0.008 0.012 0.169 0.383 Cabot E 3.53 5.19 7.09 8.32 9.35 10.53 0.029 0.019 0.036 0.108 0.179 0.15 Cabot F 3.45 4.69 5.86 7.19 9.5 0.053 0.071 0.090 0.080 0.346 Cabot G 3.54 6.09 8.73 10.49 0.027 0.007 0.043 0.122
Reported range of pKa values of Brönsted acid groups on carbon surfaces (b) Ar-amino Ar-imino Ar-carboxyl R-carboxyl Bicarbonate 6.37 Ar-thiol Lactone Ammonia 9.24 Phenol Carbonate 10.25 Amino R-thiol
(a) Numbers printed in bold characters indicate pKa values; numbers printed in italic characters show surface concentrations (mmol/g); (b) Approximate pKa range of functional groups adapted from Ref [35].; Ar = aromatic structure; R = aliphatic structure

46
The most important observations are summarized below for the group of benchmark carbons and unmodified carbon black candidates:
• In the group of benchmark and unmodified carbons, Raven 1000 and Raven M (880) have amphoteric properties; their surface has groups that develop either positive charge (in acidic pH) or negative charges (in basic pH). The amount of surface groups is, however, small. Raven M (880) has the smallest amount of surface reactive surface groups of all carbons. This is in agreement with the low volatile content determined for these materials and good dispersability in a hydrophobic solvent, chloroform (see above).
• In the same group of benchmark and unmodified carbons, Raven 1040 and Black Pearls L have
more surface groups (and higher volatile contents, see above). These carbons have acidic reaction in solution (immersion pH was between 3 and 4) and their acidic groups dissociate protons as the solution pH increases. The concentration of reactive groups is higher on Black Pearls L than on Raven 1040, and the nature of these groups (based on pKa spectra) is more diverse on Black Pearls L.
• Based on the measured pKa values, a broad range of chemical groups (carboxyls, lactones,
phenols) are present, in various ratios, on these carbons (Fig. 29). The dominant groups on all carbons are phenolic hydroxyls (pKa 10.5). The assignment of the group at pKa 9, also present on all carbons and especially on Black Pearls, is ambiguous; it could be either a different type of phenolic group or a lactone group. The groups at pKa 8 (on Raven 1040 and Black Pearls L) and pKa 7 (on Black Pearls L) could possibly represent surface lactones. Carboxylic groups, although detected on all carbons, are in very low concentration. Note that the preponderance of phenolic groups over carboxylic groups is expected for carbon blacks because of their structure dominated by graphene sheets (with carbon in sp2 hybridization); carboxyl groups require presence of sp3 hybridized carbon.
The results for surface modified carbons from Cabot kit are summarized below:
• In this group, only sample A (unmodified, base carbon) and sample G (modified with sodium sulfonate groups) have neutral pH (6–8) at immersion. All other samples have acidic pH on immersion (pH 3–4) and dissociate protons at all pHs higher than the immersion pH.
• Sample B (oxidized) is similar to Raven 1040 (compare Figs. 29 and 30) in that that they both
show phenolic hydroxyl groups (pKa 10.5) and a group at pKa 8 tentatively identified as a lactone group.
• The phenolic hydroxyl group at pKa 10.5 is not specific, as it appears on several other samples
modified with different surface grafted groups. It is possible that samples B, D, E, and G derive all from the same parent carbon with surface properties similar to that of oxidized carbon B. Also unspecific is the group at pKa 3, present in small numbers on all samples.
• The characteristic differences between samples D (modified with alcohol groups), E (modified
with aliphatic amino groups), and F (modified with carboxyl groups) are seen in the pKa range from 4 to 10. Further speculation on the assignment of peaks for these samples is not warranted, because the titration method cannot differentiate between the genuine reaction of carbon surface and the possible reactions due to counter-ions that may be associated with ionized moieties grafted on carbon surface.
47
• Sample G has a remarkably featureless pKa spectrum, similar to that of benchmark carbon Raven 1000; this is slightly oxidized, in contrast with sample Cabot G which is surface-modified with the –SO3
_Na+ group. The difference between these samples can be understood considering that, like any other salts derived from a strong acid (sulfonic acid, pKa = - 6.5) and a strong base (sodium hydroxide, pKa = 15.7), sodium sulfonate has no acid-base reaction within the experimental pH range of potentiometric titrations, from pH 3.5 to pH 10.5. The presence of sulfonate was identified by XPS and FTIR spectroscopy (see below). Sulfonate groups are the source of large negative charges on sample G carbon at all pH values, which keeps it well dispersed in water. In contrast, Raven 1000 cannot form stable dispersions unless a dispersing agent is present.
2.5.3. Surface Groups by FTIR Spectroscopy Fourier-transform infrared spectroscopy (FTIR) is a powerful tool, but requires special conditions for sample preparation and methods of detection. The difficulty comes from the fact that carbon is a very strong absorber in infrared, which makes it difficult to obtain spectra with good signal/noise ratio by common absorption/transmission techniques. In order to improve the signal in the transmission method, the carbon sample must be diluted with large amounts of KBr. Attempts were made to identify specific chemical groups on several carbon samples using KBr diluted powders prepared in thin tablet form. In most cases, this technique did not eliminate the perturbation due to the presence of CO2 (a doublet at 2300–2400 cm-1) and molecular water (fringes in the 1400–1700 and 3500–3800 cm-1) on the carbon surface or in the ambient medium. However, several conclusions supporting the above discussion on pKa spectra could be obtained. A BioRad FTIR spectrometer available in Chemical Sciences Division at ORNL was used. The carbon samples, dried overnight at 120oC, were diluted with large amounts of pre-dried KBr powder and pressed into thin tablets. For each carbon, several tablets were made and analyzed. For each tablet, 64 scans of transmission spectrum were collected at with 4 cm-1 resolution, from which the blank spectrum of a KBr tablet was subtracted. The spectrum with the best signal/noise ratio was recalculated in absorbance units and used for identification of chemical groups. The FTIR spectra collected for benchmark carbons and unmodified carbon blacks are shown in Fig. 31. The spectra recorded for several surface-modified samples from the Cabot kit are shown in Fig. 32.
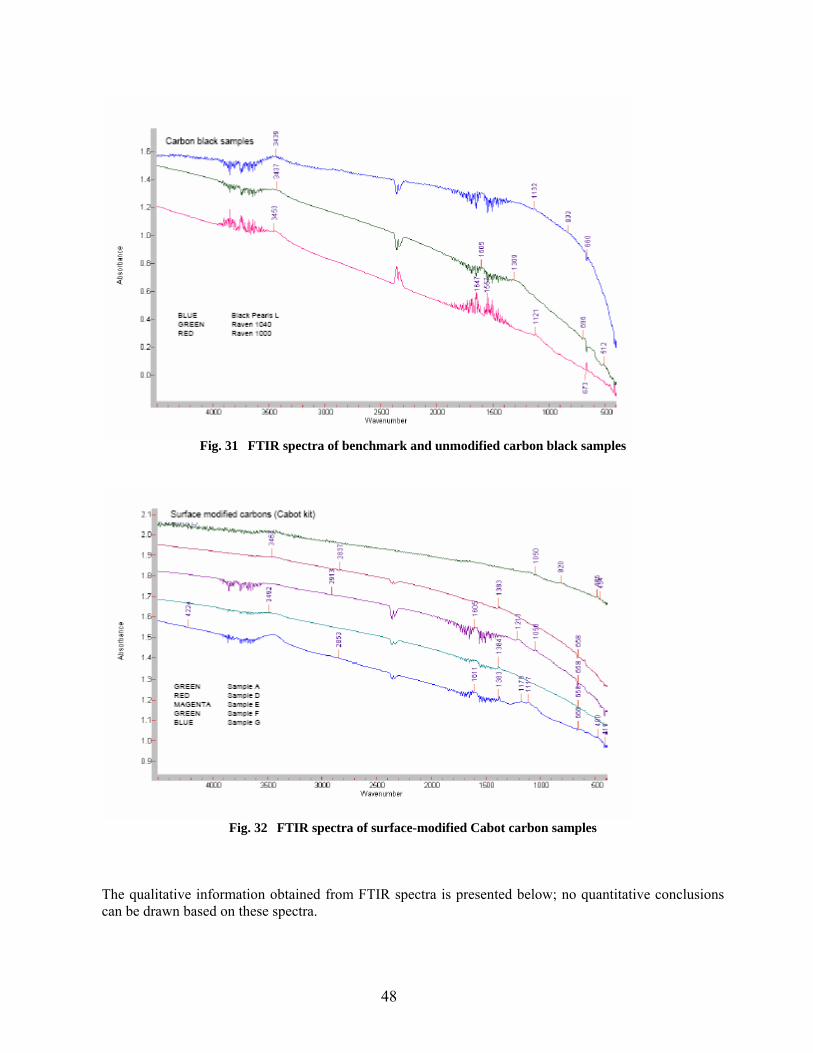
48
Fig. 31 FTIR spectra of benchmark and unmodified carbon black samples
Fig. 32 FTIR spectra of surface-modified Cabot carbon samples
The qualitative information obtained from FTIR spectra is presented below; no quantitative conclusions can be drawn based on these spectra.
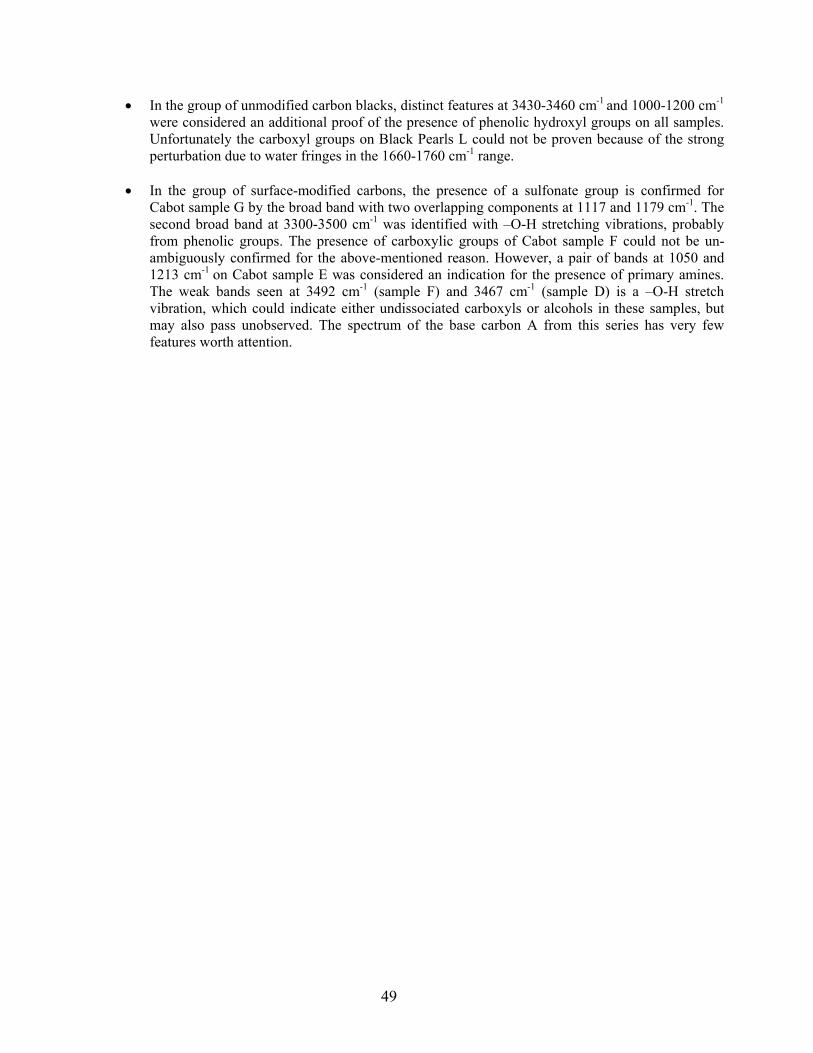
49
• In the group of unmodified carbon blacks, distinct features at 3430-3460 cm-1 and 1000-1200 cm-1 were considered an additional proof of the presence of phenolic hydroxyl groups on all samples. Unfortunately the carboxyl groups on Black Pearls L could not be proven because of the strong perturbation due to water fringes in the 1660-1760 cm-1 range.
• In the group of surface-modified carbons, the presence of a sulfonate group is confirmed for
Cabot sample G by the broad band with two overlapping components at 1117 and 1179 cm-1. The second broad band at 3300-3500 cm-1 was identified with –O-H stretching vibrations, probably from phenolic groups. The presence of carboxylic groups of Cabot sample F could not be un-ambiguously confirmed for the above-mentioned reason. However, a pair of bands at 1050 and 1213 cm-1 on Cabot sample E was considered an indication for the presence of primary amines. The weak bands seen at 3492 cm-1 (sample F) and 3467 cm-1 (sample D) is a –O-H stretch vibration, which could indicate either undissociated carboxyls or alcohols in these samples, but may also pass unobserved. The spectrum of the base carbon A from this series has very few features worth attention.

50
3. CHARACTERIZATION OF SURFACTANTS Infrared spectroscopy was shown to be more powerful in characterization of surfactans. We recorded FTIR spectra of a benchmark anionic surfactant (Tamol SN) and of a candidate non-ionic surfactant (Tergitol XD), and compared them with reference spectra published in the literature. 3.1 ANIONIC SURFACTANTS Tamol SN was historically used as a dispersant at BWXT and at ORNL. Based on the information supplied by the manufacturer, Rohm and Haas Company, Tamol SN is the sodium salt of a naphthalene-formaldehyde condensate, and is primarily designed for use as a dispersant in textile formulations, dispersion of dye-stuffs, clays, and fillers.44 The manufacturer did not provide a chemical formula for Tamol SN, but a representative of this class is dinaphthylmethane sulfonate which is shown below:6 -O3S-C10H6 –CH2- C10H6....SO3
- The surfactant action of Tamol SN is due to the strong anionic effect of sulfonate groups. As a derivative of sulfonic acid, a strong acid with pKa = - 6.5, the sulfonate group is dissociated in water at all pHs and carries a negative charge; this is the hydrophilic end of the surfactant. The hydrophobic part is the naphthalene nucleus, which could be replaced by alkyl-naphthalene for more hydrophobic character. The fused aromatic rings forming the naphthalene nucleus have affinity for hydrophobic, non-polar surfaces. They attach by hydrophobic interactions on surface patches free from functional groups of non-oxidized, non-polar (and therefore hydrophobic) carbon particles. If polar, oxygen-bearing functional groups are present on the carbon black surface (phenols, carboxyls, lactones) the affinity for naphthalene nuclei decreases. As a consequence, a higher concentration of surfactant is needed in solution in order to achieve the surface coverage that ensures effective electrostatic repulsion between surfactant-covered carbon particles. On the other hand, oxidized carbons can develop surface charge by deprotonation of carboxylic and phenolic groups, without the need for a surfactant. Thus the required concentration of surfactant in solution (or dispersing agent requirement, DAR) depends strongly on pH, and is the result of two opposing factors: dynamic adsorption of surfactant on hydrophobic patches on carbons surface and development of negative charge by hydrophilic surface regions. A strong correlation is expected between the DAR variation with pH for a given carbon and the proton binding isotherm of the same carbon. The FTIR spectrum of Tamol SN was recorded using the transmission technique with KBr tablets. Figure 33 shows the transmittance spectrum plotted (as usually) on the wavenumbers scale (cm-1), and a section of it replotted on the wavelengths (µ) scale. The latter is identical with the published spectrum of dinaphthylmethane sulfonate (also shown in Fig. 33), a product commercialized under the trade name of Orotan N by Rohm and Haas Company.6 In Orotan N the sulfonate group has a strong absorption band at about 14.7-14.8 µ (681-676 cm-1) and at 9.6-9.7 µ (1042-1030 cm-1). The bands at 12.1 µ (827 cm-1), 12.6 µ (794 cm-1), and 13.3 µ (752 cm-1) characterize the type of substitution of naphthalene ring and show the presence of two, three, and four adjacent H atoms. A band at 9 µ (1111 cm-1) suggests that some residual Na2SO4 may also be present.6
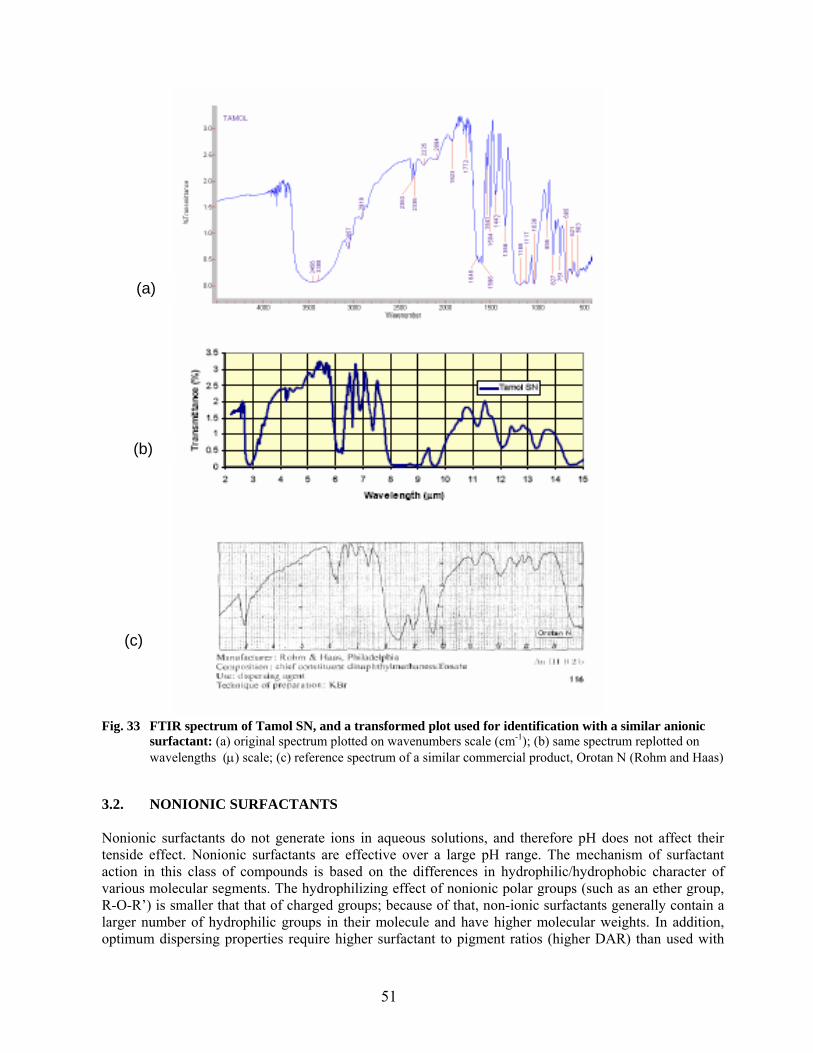
51
Fig. 33 FTIR spectrum of Tamol SN, and a transformed plot used for identification with a similar anionic
surfactant: (a) original spectrum plotted on wavenumbers scale (cm-1); (b) same spectrum replotted on wavelengths (µ) scale; (c) reference spectrum of a similar commercial product, Orotan N (Rohm and Haas)
3.2. NONIONIC SURFACTANTS Nonionic surfactants do not generate ions in aqueous solutions, and therefore pH does not affect their tenside effect. Nonionic surfactants are effective over a large pH range. The mechanism of surfactant action in this class of compounds is based on the differences in hydrophilic/hydrophobic character of various molecular segments. The hydrophilizing effect of nonionic polar groups (such as an ether group, R-O-R’) is smaller that that of charged groups; because of that, non-ionic surfactants generally contain a larger number of hydrophilic groups in their molecule and have higher molecular weights. In addition, optimum dispersing properties require higher surfactant to pigment ratios (higher DAR) than used with
(a)
(b)
(c)
(a)
(b)
(c)
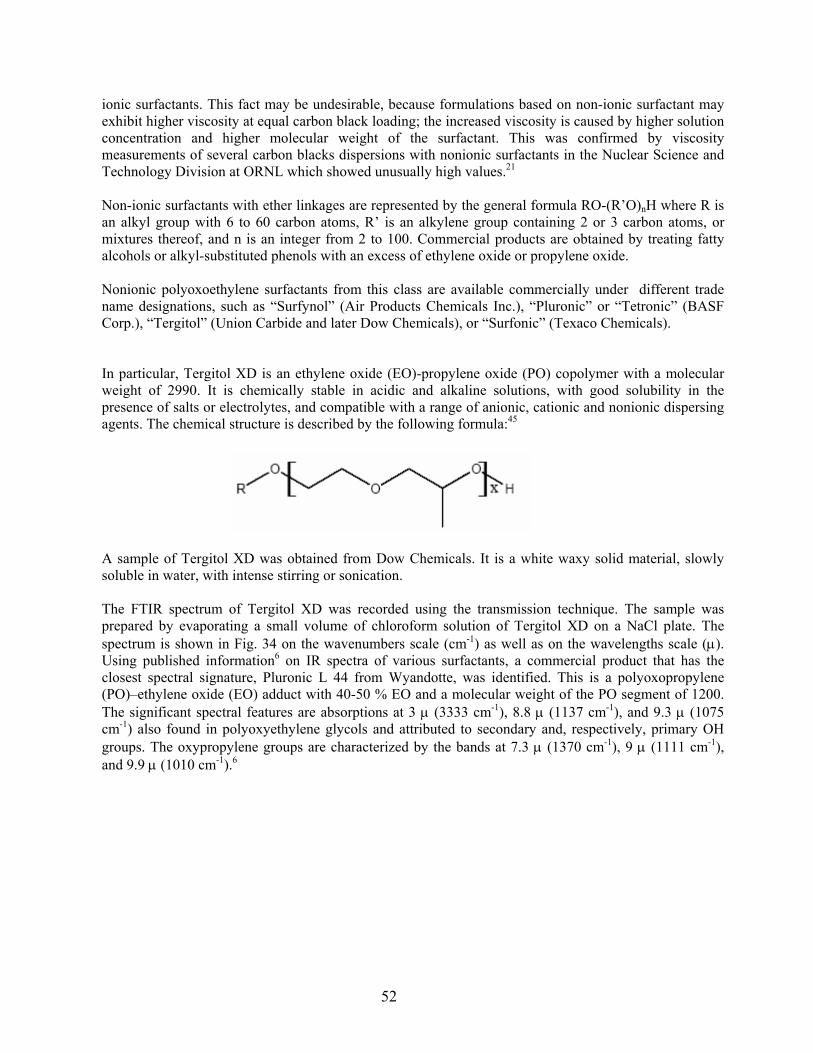
52
ionic surfactants. This fact may be undesirable, because formulations based on non-ionic surfactant may exhibit higher viscosity at equal carbon black loading; the increased viscosity is caused by higher solution concentration and higher molecular weight of the surfactant. This was confirmed by viscosity measurements of several carbon blacks dispersions with nonionic surfactants in the Nuclear Science and Technology Division at ORNL which showed unusually high values.21 Non-ionic surfactants with ether linkages are represented by the general formula RO-(R’O)nH where R is an alkyl group with 6 to 60 carbon atoms, R’ is an alkylene group containing 2 or 3 carbon atoms, or mixtures thereof, and n is an integer from 2 to 100. Commercial products are obtained by treating fatty alcohols or alkyl-substituted phenols with an excess of ethylene oxide or propylene oxide. Nonionic polyoxoethylene surfactants from this class are available commercially under different trade name designations, such as “Surfynol” (Air Products Chemicals Inc.), “Pluronic” or “Tetronic” (BASF Corp.), “Tergitol” (Union Carbide and later Dow Chemicals), or “Surfonic” (Texaco Chemicals). In particular, Tergitol XD is an ethylene oxide (EO)-propylene oxide (PO) copolymer with a molecular weight of 2990. It is chemically stable in acidic and alkaline solutions, with good solubility in the presence of salts or electrolytes, and compatible with a range of anionic, cationic and nonionic dispersing agents. The chemical structure is described by the following formula:45 A sample of Tergitol XD was obtained from Dow Chemicals. It is a white waxy solid material, slowly soluble in water, with intense stirring or sonication. The FTIR spectrum of Tergitol XD was recorded using the transmission technique. The sample was prepared by evaporating a small volume of chloroform solution of Tergitol XD on a NaCl plate. The spectrum is shown in Fig. 34 on the wavenumbers scale (cm-1) as well as on the wavelengths scale (µ). Using published information6 on IR spectra of various surfactants, a commercial product that has the closest spectral signature, Pluronic L 44 from Wyandotte, was identified. This is a polyoxopropylene (PO)–ethylene oxide (EO) adduct with 40-50 % EO and a molecular weight of the PO segment of 1200. The significant spectral features are absorptions at 3 µ (3333 cm-1), 8.8 µ (1137 cm-1), and 9.3 µ (1075 cm-1) also found in polyoxyethylene glycols and attributed to secondary and, respectively, primary OH groups. The oxypropylene groups are characterized by the bands at 7.3 µ (1370 cm-1), 9 µ (1111 cm-1), and 9.9 µ (1010 cm-1).6
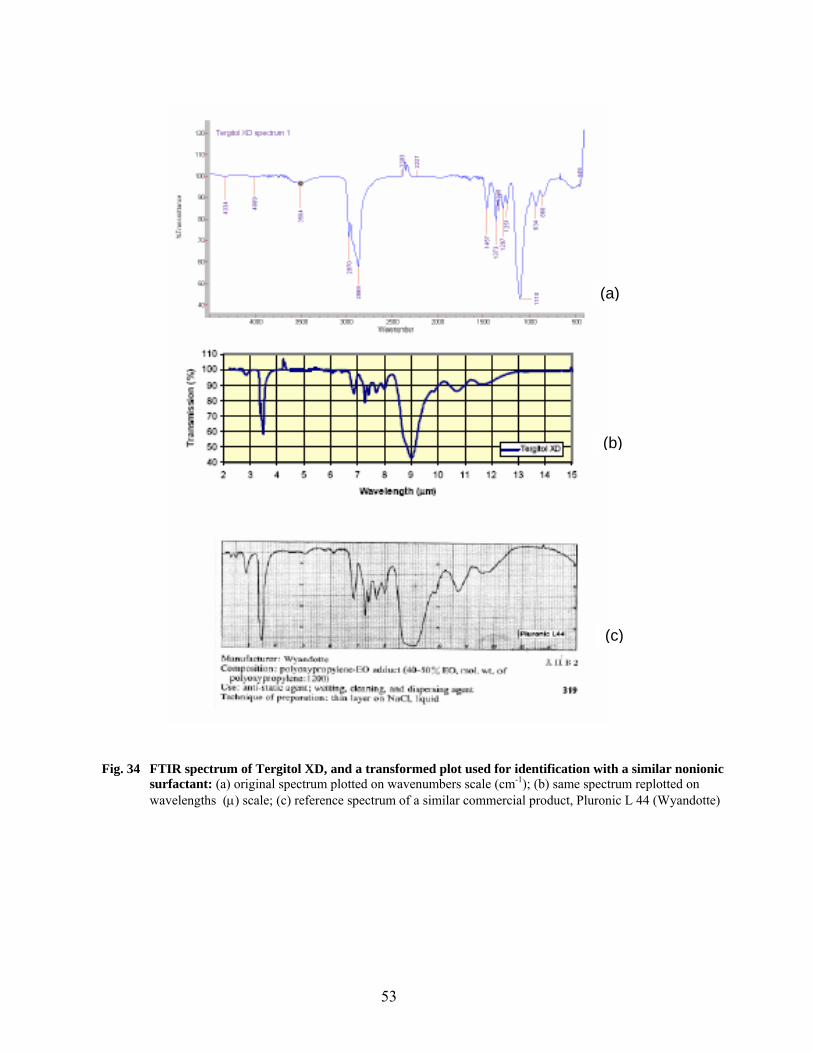
53
Fig. 34 FTIR spectrum of Tergitol XD, and a transformed plot used for identification with a similar nonionic surfactant: (a) original spectrum plotted on wavenumbers scale (cm-1); (b) same spectrum replotted on wavelengths (µ) scale; (c) reference spectrum of a similar commercial product, Pluronic L 44 (Wyandotte)
(a)
(b)
(c)
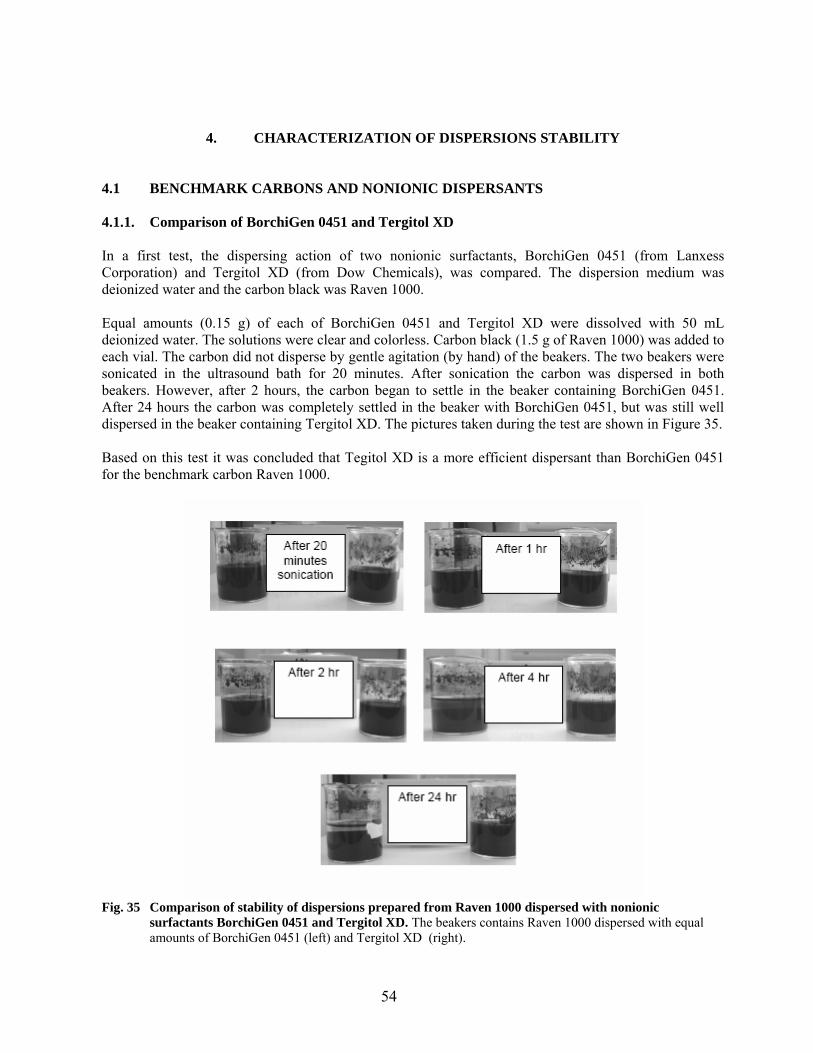
54
4. CHARACTERIZATION OF DISPERSIONS STABILITY 4.1 BENCHMARK CARBONS AND NONIONIC DISPERSANTS 4.1.1. Comparison of BorchiGen 0451 and Tergitol XD In a first test, the dispersing action of two nonionic surfactants, BorchiGen 0451 (from Lanxess Corporation) and Tergitol XD (from Dow Chemicals), was compared. The dispersion medium was deionized water and the carbon black was Raven 1000. Equal amounts (0.15 g) of each of BorchiGen 0451 and Tergitol XD were dissolved with 50 mL deionized water. The solutions were clear and colorless. Carbon black (1.5 g of Raven 1000) was added to each vial. The carbon did not disperse by gentle agitation (by hand) of the beakers. The two beakers were sonicated in the ultrasound bath for 20 minutes. After sonication the carbon was dispersed in both beakers. However, after 2 hours, the carbon began to settle in the beaker containing BorchiGen 0451. After 24 hours the carbon was completely settled in the beaker with BorchiGen 0451, but was still well dispersed in the beaker containing Tergitol XD. The pictures taken during the test are shown in Figure 35. Based on this test it was concluded that Tegitol XD is a more efficient dispersant than BorchiGen 0451 for the benchmark carbon Raven 1000.
Fig. 35 Comparison of stability of dispersions prepared from Raven 1000 dispersed with nonionic
surfactants BorchiGen 0451 and Tergitol XD. The beakers contains Raven 1000 dispersed with equal amounts of BorchiGen 0451 (left) and Tergitol XD (right).

55
4.1.2. Dispersion Stability and pH Effects on Tergitol XD This test confirmed that pH has no effect on dispersion stability of a benchmark carbon black (Raven 1000) in presence of the nonionic surfactant Tergitol XD. A 5 % Tergitol XD solution was prepared by dissolving 1.08 g Tergitol XD with 20 mL deionized water in a 50 mL beaker. Complete dissolution was obtained by magnetically stirring at room temperature for 20 minutes. Separately, a series of aqueous solutions with the composition shown in Table 10 was prepared in 20 mL glass vials. All solutions contained 1 mL of the 5 % Tergitol XD solution prepared above, various amounts of 0.1 M HNO3 or 0.1 M NaOH, and de-ionized water to a total volume of 15 mL. The pH of freshly prepared solutions varied from 1.5 to 10 (see Table 10). A weighed amount of nominally 0.5 g Raven 1000 was added to each vial. The vials were caped and gently shaken (by hand) to homogenize the content, and the pH was measured again (Table 10).
Table 10. Experimental details for the test on pH effects on Raven 1000 dispersions with Tergitol XD
Solutions prepared Carbon added Solution pH
Sample ID
HNO3 0.1 N
NaOH 0.1 N DI water
Surfactant (a)
Total volume
Raven 1000 initial final
mL mL mL mL mL g
1 6.04 0 8 1 15.04 0.5002 1.48 1.52 2 1.02 0 13 1 15.02 0.4876 2.23 2.28 3 0 0 14 1 15 0.5068 5.19 4.19 4 0 0.102 13.9 1 15.002 0.4974 10.3 6.74 5 0 0.227 13.8 1 15.027 0.4934 11.04 10.06
(a) Tergitol XD solution prepared by dissolving 1.08 g Tergitol in 20 mL DI water The next morning the carbon had settled on the bottom of all vials. However, after only a short sonication (20 minutes) in the ultrasound bath, the carbon was redispersed in all vials and remained dispersed. Pictures taken at various times after sonication did not show any sign of settling the carbon; no significant differences were noticed between vials with different pH (Fig. 36). Two months later most of the carbon in each vial was still dispersed, although some settling was noticed on the bottom of vials. This test led to the following conclusions:
• The benchmark carbon Raven 1000 can be dispersed efficiently in water using the nonionic surfactant Tergitol XD
• The dispersions were easily obtained after 20 minutes sonication • No pH effects were noticed over a pH range from 1.5 to 10 • All dispersions remained stable for at least one month
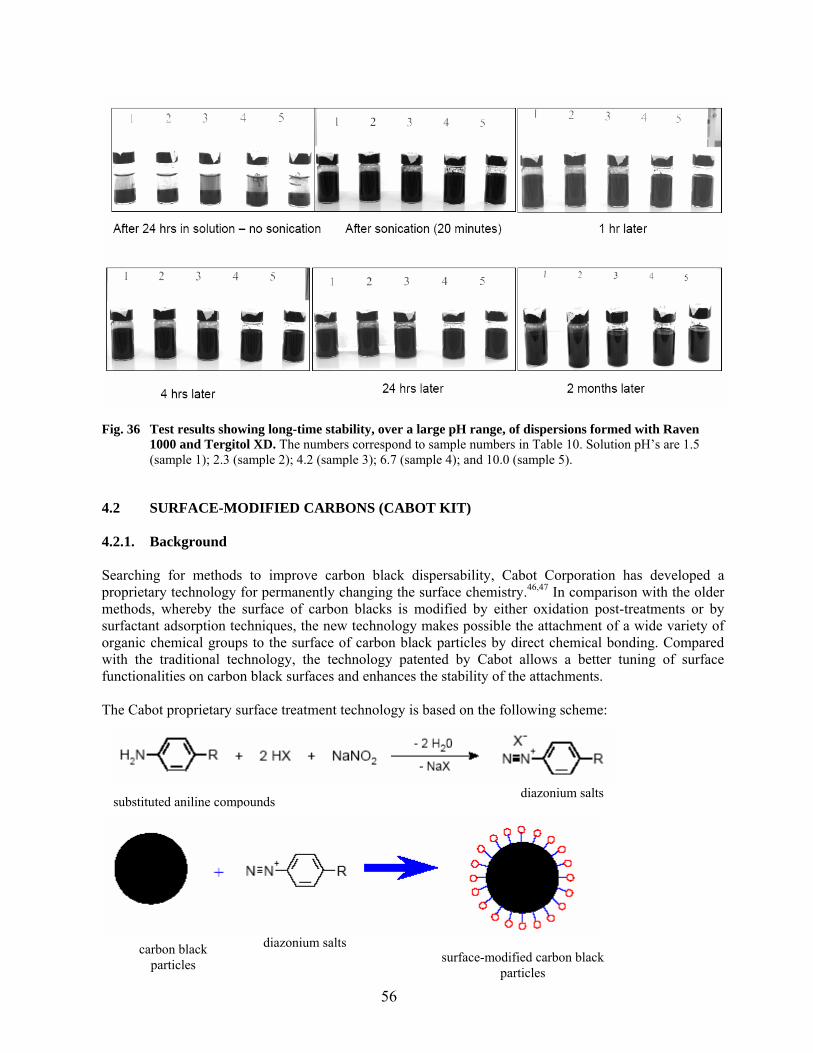
56
Fig. 36 Test results showing long-time stability, over a large pH range, of dispersions formed with Raven 1000 and Tergitol XD. The numbers correspond to sample numbers in Table 10. Solution pH’s are 1.5 (sample 1); 2.3 (sample 2); 4.2 (sample 3); 6.7 (sample 4); and 10.0 (sample 5).
4.2 SURFACE-MODIFIED CARBONS (CABOT KIT) 4.2.1. Background Searching for methods to improve carbon black dispersability, Cabot Corporation has developed a proprietary technology for permanently changing the surface chemistry.46,47 In comparison with the older methods, whereby the surface of carbon blacks is modified by either oxidation post-treatments or by surfactant adsorption techniques, the new technology makes possible the attachment of a wide variety of organic chemical groups to the surface of carbon black particles by direct chemical bonding. Compared with the traditional technology, the technology patented by Cabot allows a better tuning of surface functionalities on carbon black surfaces and enhances the stability of the attachments. The Cabot proprietary surface treatment technology is based on the following scheme:
substituted aniline compounds
diazonium salts
diazonium salts carbon black particles surface-modified carbon black
particles

57
In the first step, diazonium salts are obtained by the reaction of substituted aniline compounds with nitrous acid (prepared in situ from a nitrite salt and a strong acid, HX). In the second step, the diazonium salts are reacted with carbon black, forming surface-modified carbons whereby the aromatic nucleus of substituted aniline is chemically bonded to aromatic structures on carbon black surface. This reaction scheme opens a multitude of possibilities for surface modification of carbons. The modifier groups can be ionic (either cationic or anionic) or nonionic, or can have variable polarity, can be polymeric and so on. Ionic modifiers include sulfonates, carboxylates, and quaternary amines. Polar modifiers can be glycols, alcohols, esters, ketones, etc. The hydrophobic modifiers can be hydrocarbons or fluorocarbons, and the polymeric modifiers include acrylates, styrenes, polyethers, etc. This enables multiple possibilities of manipulation of dispersability of carbon black particles in a wide range of systems. The advantage of using surface-modified carbons over the conventional methods of dispersion is multiple:
• the dispersant groups are covalently bonded to the surface in stable configuration, rather than being subject to dynamic adsorption equilibrium
• carbon black may become self-dispersing, without the need of intensive milling or shearing • surface-modified carbons allows a better control of surface chemistry and pH, in contrast with
oxidized carbons, which are acidic and have less controlled surface chemistry The toolkit received from Cabot Corporation contains seven 200-gram samples of a base black modified with ionic, polar, and nonpolar groups attached to the surface. They cover a broad range of surface functionalities, as listed below:
• Sample A base, unmodified carbon • Sample B oxidized carbon black • Sample C nonpolar, hydrophobic –C6H4-CH2-CH3 end groups • Sample D slightly polar, hydrophilic –C6H4-(CH2)2-OH end group • Sample E polar, hydrophilic, basic –C6H4-(CH2)2-NH2 groups • Sample F polar, hydrophilic, weakly acidic –C6H4-COOH groups • Sample G highly polar, hydrophilic, ionized, –C6H4-SO3Na groups
4.2.2. Water Dispersability of Surface Modified Carbon Samples 4.2.2.1. Dispersions in water The simplest test with surface modified carbon samples from Cabot kit was to check their dispersability in water. In each of seven 20-mL glass vials were introduced 5 mL deionized water and to each vial was added 0.1 g of surface modified carbons. The vials were labeled with letters A to G, corresponding to the samples in the Cabot kit. As shown in Fig. 37, surface-modified samples E, F, and G self-dispersed instantaneously in water, while the other carbons settled on the bottom of the vials. All vials were sonicated for 20 minutes in a laboratory ultrasound bath. Following sonication, samples E, F, and G remained dispersed, and sample D became partially dispersed. Sample A and B did not disperse, and sample C spread in a thin layer over the glass walls of the vial. The pH of water in contact with these carbons is 8.6 (sample A), 3.9 (sample B), 4.6 (sample D), 3.5 (sample E), 4.2 (sample F), and 6.7 (sample G).
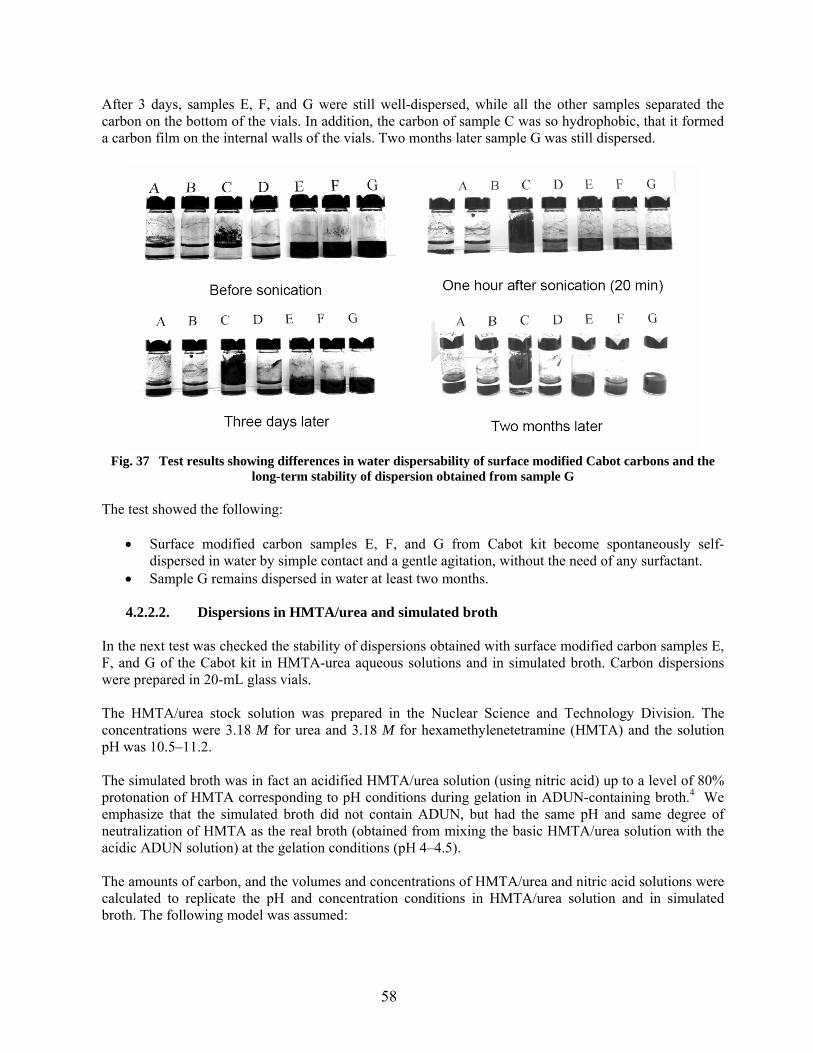
58
After 3 days, samples E, F, and G were still well-dispersed, while all the other samples separated the carbon on the bottom of the vials. In addition, the carbon of sample C was so hydrophobic, that it formed a carbon film on the internal walls of the vials. Two months later sample G was still dispersed.
Fig. 37 Test results showing differences in water dispersability of surface modified Cabot carbons and the
long-term stability of dispersion obtained from sample G The test showed the following:
• Surface modified carbon samples E, F, and G from Cabot kit become spontaneously self-dispersed in water by simple contact and a gentle agitation, without the need of any surfactant.
• Sample G remains dispersed in water at least two months. 4.2.2.2. Dispersions in HMTA/urea and simulated broth
In the next test was checked the stability of dispersions obtained with surface modified carbon samples E, F, and G of the Cabot kit in HMTA-urea aqueous solutions and in simulated broth. Carbon dispersions were prepared in 20-mL glass vials. The HMTA/urea stock solution was prepared in the Nuclear Science and Technology Division. The concentrations were 3.18 M for urea and 3.18 M for hexamethylenetetramine (HMTA) and the solution pH was 10.5–11.2. The simulated broth was in fact an acidified HMTA/urea solution (using nitric acid) up to a level of 80% protonation of HMTA corresponding to pH conditions during gelation in ADUN-containing broth.4 We emphasize that the simulated broth did not contain ADUN, but had the same pH and same degree of neutralization of HMTA as the real broth (obtained from mixing the basic HMTA/urea solution with the acidic ADUN solution) at the gelation conditions (pH 4–4.5). The amounts of carbon, and the volumes and concentrations of HMTA/urea and nitric acid solutions were calculated to replicate the pH and concentration conditions in HMTA/urea solution and in simulated broth. The following model was assumed:
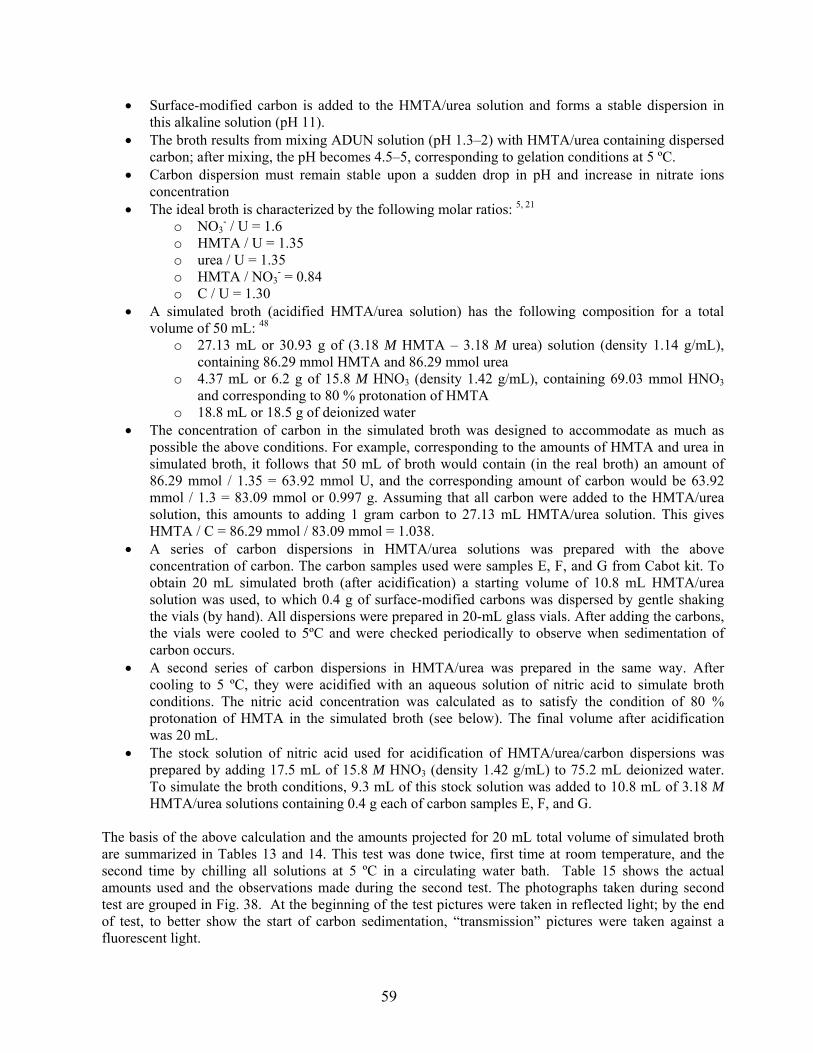
59
• Surface-modified carbon is added to the HMTA/urea solution and forms a stable dispersion in this alkaline solution (pH 11).
• The broth results from mixing ADUN solution (pH 1.3–2) with HMTA/urea containing dispersed carbon; after mixing, the pH becomes 4.5–5, corresponding to gelation conditions at 5 ºC.
• Carbon dispersion must remain stable upon a sudden drop in pH and increase in nitrate ions concentration
• The ideal broth is characterized by the following molar ratios: 5, 21 o NO3
- / U = 1.6 o HMTA / U = 1.35 o urea / U = 1.35 o HMTA / NO3
- = 0.84 o C / U = 1.30
• A simulated broth (acidified HMTA/urea solution) has the following composition for a total volume of 50 mL: 48
o 27.13 mL or 30.93 g of (3.18 M HMTA – 3.18 M urea) solution (density 1.14 g/mL), containing 86.29 mmol HMTA and 86.29 mmol urea
o 4.37 mL or 6.2 g of 15.8 M HNO3 (density 1.42 g/mL), containing 69.03 mmol HNO3 and corresponding to 80 % protonation of HMTA
o 18.8 mL or 18.5 g of deionized water • The concentration of carbon in the simulated broth was designed to accommodate as much as
possible the above conditions. For example, corresponding to the amounts of HMTA and urea in simulated broth, it follows that 50 mL of broth would contain (in the real broth) an amount of 86.29 mmol / 1.35 = 63.92 mmol U, and the corresponding amount of carbon would be 63.92 mmol / 1.3 = 83.09 mmol or 0.997 g. Assuming that all carbon were added to the HMTA/urea solution, this amounts to adding 1 gram carbon to 27.13 mL HMTA/urea solution. This gives HMTA / C = 86.29 mmol / 83.09 mmol = 1.038.
• A series of carbon dispersions in HMTA/urea solutions was prepared with the above concentration of carbon. The carbon samples used were samples E, F, and G from Cabot kit. To obtain 20 mL simulated broth (after acidification) a starting volume of 10.8 mL HMTA/urea solution was used, to which 0.4 g of surface-modified carbons was dispersed by gentle shaking the vials (by hand). All dispersions were prepared in 20-mL glass vials. After adding the carbons, the vials were cooled to 5ºC and were checked periodically to observe when sedimentation of carbon occurs.
• A second series of carbon dispersions in HMTA/urea was prepared in the same way. After cooling to 5 ºC, they were acidified with an aqueous solution of nitric acid to simulate broth conditions. The nitric acid concentration was calculated as to satisfy the condition of 80 % protonation of HMTA in the simulated broth (see below). The final volume after acidification was 20 mL.
• The stock solution of nitric acid used for acidification of HMTA/urea/carbon dispersions was prepared by adding 17.5 mL of 15.8 M HNO3 (density 1.42 g/mL) to 75.2 mL deionized water. To simulate the broth conditions, 9.3 mL of this stock solution was added to 10.8 mL of 3.18 M HMTA/urea solutions containing 0.4 g each of carbon samples E, F, and G.
The basis of the above calculation and the amounts projected for 20 mL total volume of simulated broth are summarized in Tables 13 and 14. This test was done twice, first time at room temperature, and the second time by chilling all solutions at 5 ºC in a circulating water bath. Table 15 shows the actual amounts used and the observations made during the second test. The photographs taken during second test are grouped in Fig. 38. At the beginning of the test pictures were taken in reflected light; by the end of test, to better show the start of carbon sedimentation, “transmission” pictures were taken against a fluorescent light.

60
Table 11. Composition of simulated broth
Volume Weight Amount Composition for 50 mL total volume mL g mmoles 3.18 M HTMA - 3.18 M urea (1.14 g/mL) 27.13 30.93
HMTA 86.29 urea 86.29
15.8 M HNO3 (1.42 g/mL) 4.37 6.20 HNO3 69.03
DI water (0.98 g/mL) 18.8 18.50 Carbon 1.00 83.09
Total 50.3 56.63
Table 12. Components of simulated broth preparations
Volume Weight Amount Calculated for 20 mL final volume mL g mmoles
1 - Carbon dispersion in HMTA/urea solution 3.18 M HTMA - 3.18 M urea 10.85 12.37
HMTA 34.52 urea 34.52
Carbon 0.40 33.24 Subtotal 1 10.85 12.77
2 - Nitric acid solution for acidification
15.8 M HNO3 (1.42 g/mL) 1.75 2.48 HNO3 27.61
DI water 7.52 7.40 Subtotal 2 9.27 9.88
Total 20.12 22.65
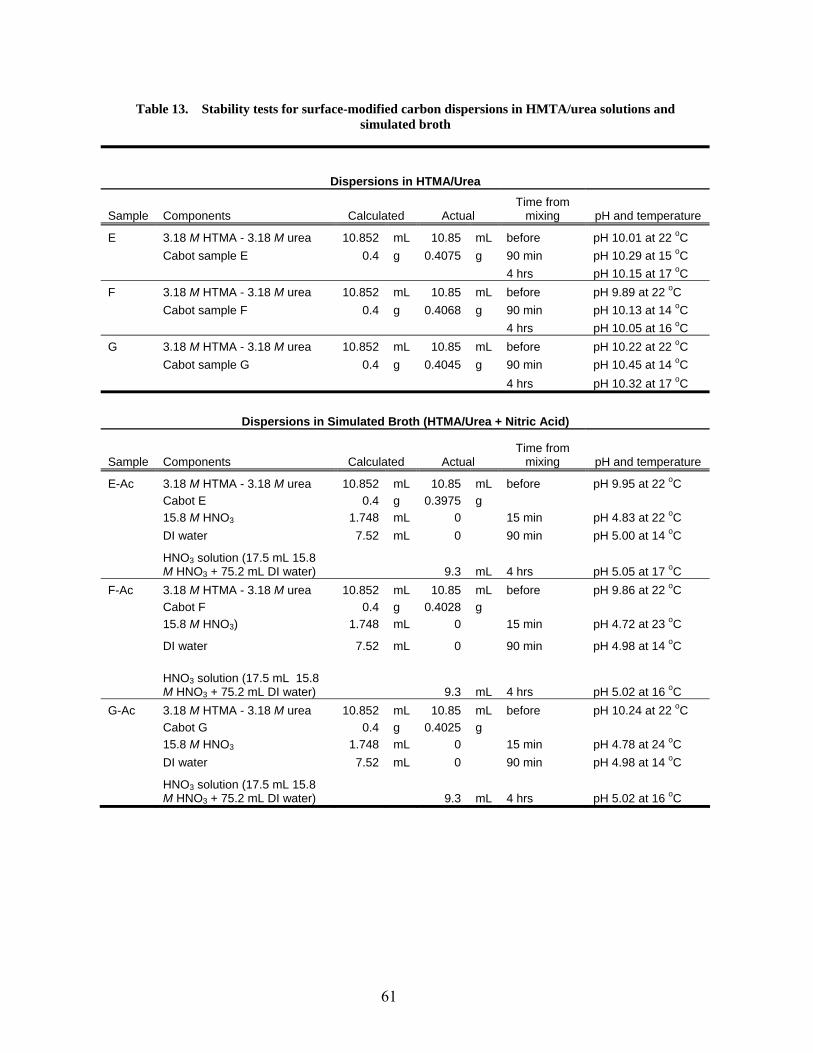
61
Table 13. Stability tests for surface-modified carbon dispersions in HMTA/urea solutions and simulated broth
Dispersions in HTMA/Urea
Sample Components Calculated Actual Time from
mixing pH and temperature
E 3.18 M HTMA - 3.18 M urea 10.852 mL 10.85 mL before pH 10.01 at 22 oC Cabot sample E 0.4 g 0.4075 g 90 min pH 10.29 at 15 oC 4 hrs pH 10.15 at 17 oC F 3.18 M HTMA - 3.18 M urea 10.852 mL 10.85 mL before pH 9.89 at 22 oC Cabot sample F 0.4 g 0.4068 g 90 min pH 10.13 at 14 oC 4 hrs pH 10.05 at 16 oC G 3.18 M HTMA - 3.18 M urea 10.852 mL 10.85 mL before pH 10.22 at 22 oC Cabot sample G 0.4 g 0.4045 g 90 min pH 10.45 at 14 oC 4 hrs pH 10.32 at 17 oC
Dispersions in Simulated Broth (HTMA/Urea + Nitric Acid)
Sample Components Calculated Actual Time from
mixing pH and temperature
E-Ac 3.18 M HTMA - 3.18 M urea 10.852 mL 10.85 mL before pH 9.95 at 22 oC Cabot E 0.4 g 0.3975 g 15.8 M HNO3 1.748 mL 0 15 min pH 4.83 at 22 oC DI water 7.52 mL 0 90 min pH 5.00 at 14 oC
HNO3 solution (17.5 mL 15.8 M HNO3 + 75.2 mL DI water) 9.3 mL 4 hrs pH 5.05 at 17 oC
F-Ac 3.18 M HTMA - 3.18 M urea 10.852 mL 10.85 mL before pH 9.86 at 22 oC Cabot F 0.4 g 0.4028 g 15.8 M HNO3) 1.748 mL 0 15 min pH 4.72 at 23 oC
DI water 7.52 mL 0 90 min pH 4.98 at 14 oC
HNO3 solution (17.5 mL 15.8 M HNO3 + 75.2 mL DI water) 9.3 mL 4 hrs pH 5.02 at 16 oC
G-Ac 3.18 M HTMA - 3.18 M urea 10.852 mL 10.85 mL before pH 10.24 at 22 oC Cabot G 0.4 g 0.4025 g 15.8 M HNO3 1.748 mL 0 15 min pH 4.78 at 24 oC DI water 7.52 mL 0 90 min pH 4.98 at 14 oC
HNO3 solution (17.5 mL 15.8 M HNO3 + 75.2 mL DI water) 9.3 mL 4 hrs pH 5.02 at 16 oC
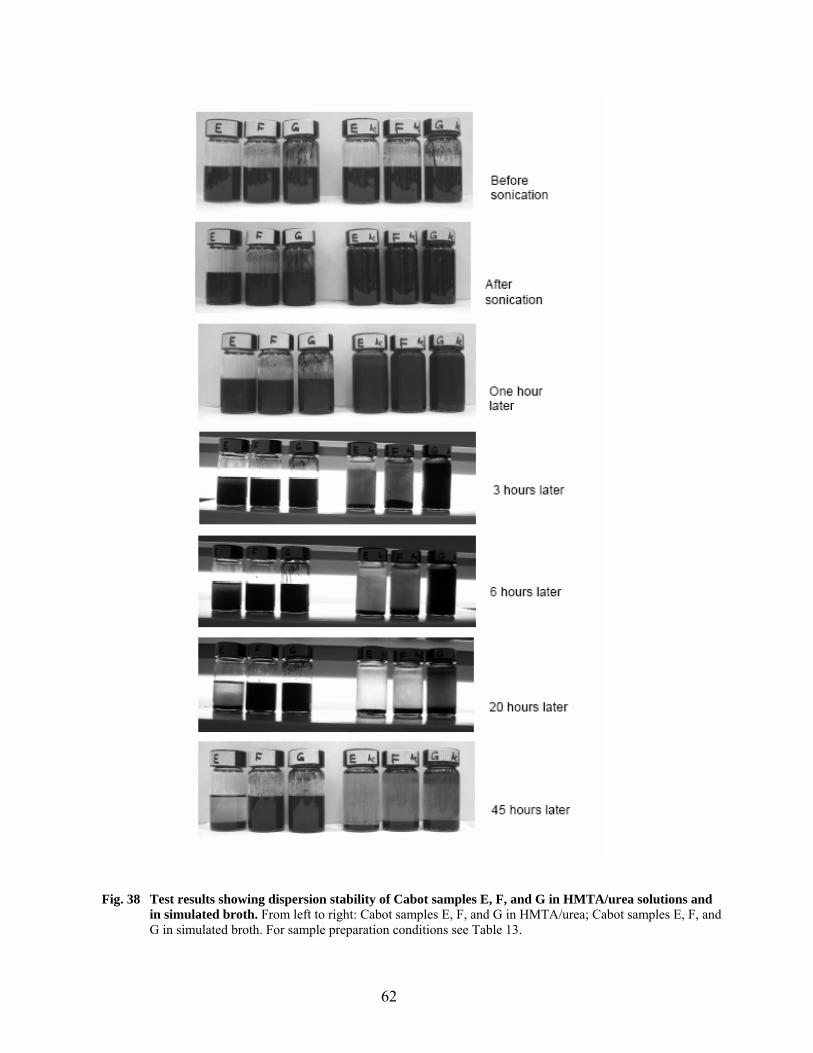
62
Fig. 38 Test results showing dispersion stability of Cabot samples E, F, and G in HMTA/urea solutions and
in simulated broth. From left to right: Cabot samples E, F, and G in HMTA/urea; Cabot samples E, F, and G in simulated broth. For sample preparation conditions see Table 13.
63
The conclusions drawn from this test can be summarized as follows:
• Surface-modified carbon samples E, F, and G from Cabot kit form spontaneous dispersions in alkaline HMTA/urea solutions (pH 10.5–11) at concentrations as required for preparation of broth solutions with C / U = 1.3.
• The dispersions derived from samples F and G in HTML/urea are stable at room temperature and at 5 ºC for at least 40 hours (Fig. 38). Even after one month the carbon is apparently still well dispersed, but a closer look shows that sedimentation on the bottom of the vials has began. The HMTA/urea dispersion with sample E began sedimentation after 6 hours.
• After acidification with a nitric acid solution corresponding to 80 % protonation of HMTA the dispersion formed with sample G stays stable at least 6 hours before carbon separates on bottom. In contrast, dispersions from samples E and F stay stable only one hour and are fully separated after 3 hours.
• After sedimentation of carbon from acidified dispersions, the supernatant liquid is clear, but colored (yellow or orange). It is not clear what causes the coloration.
4.2.2.3 Particle size distribution in carbon dispersions As an additional characterization of dispersion properties for surface-modified carbons, the particle size distribution of samples E, F, and G in water and (for sample G only) in HMTA/urea solution was measured. Referring to the terminology used for carbon black dispersions (see section 1.3.1 above), the “particles” measured in this test are in fact aggregates of many primary particles, or even larger agglomerates. The particle size distribution analysis was done using the Horiba LA 700 laser scattering particle analyzer located in the Metals and Ceramics Division of ORNL. The instrument uses the principles of Fraunhofer diffraction theory and the Mie scattering theory for measuring the size and distribution of minute particles suspended in a liquid. Direct particle size measurement is possible over a wide range, from 0.04 to 262 µm, without the need of doing any adjustment to the apparatus. The instrument has a bath for liquid samples, which are circulated by a circulation pump, and dispersed and stirred in the ultrasonic chamber. There are two light sources, a 632.8 nm He-Ne laser beam and a tungsten lamp, that are radiated on the particles suspended in the liquid. After the laser beam has been dispersed and scattered by the particles in the liquid, it is analyzed by 18 detector elements. The intensity of scattered light is measured and used to calculate the size distribution of particles. The measurement lasts a few minutes only. In a typical run, the sample liquid bath was filled with the liquid vehicle for dispersion, either water or the (3.18 M HMTA – 3.18 M urea) aqueous solution. A few milligrams of carbon were added to the bath, and the circulation pump was started. Measurements were done just after adding the carbon, or after sonication for various times. The results were displayed as a histogram plot on the computer screen (and were printed from there); or they were saved in table format and were later exported and re-plotted from Excel. Figure 39 shows the particle size distributions for sample E dispersed in water at various sonication times. The unexpected result is that these dispersions are unstable to sonication. Although particles smaller than 1 µm were initially present, the distribution was bimodal, and the fraction of large particles (50–200 µm) increased at longer sonication times. The result obtained in HMTA/urea solutions was similar (not shown). A completely opposite result was obtained for samples F and G. As Fig. 40 shows, the particles in dispersions obtained from sample F were of an average size of 0.1–0.2 µm; a small number of larger
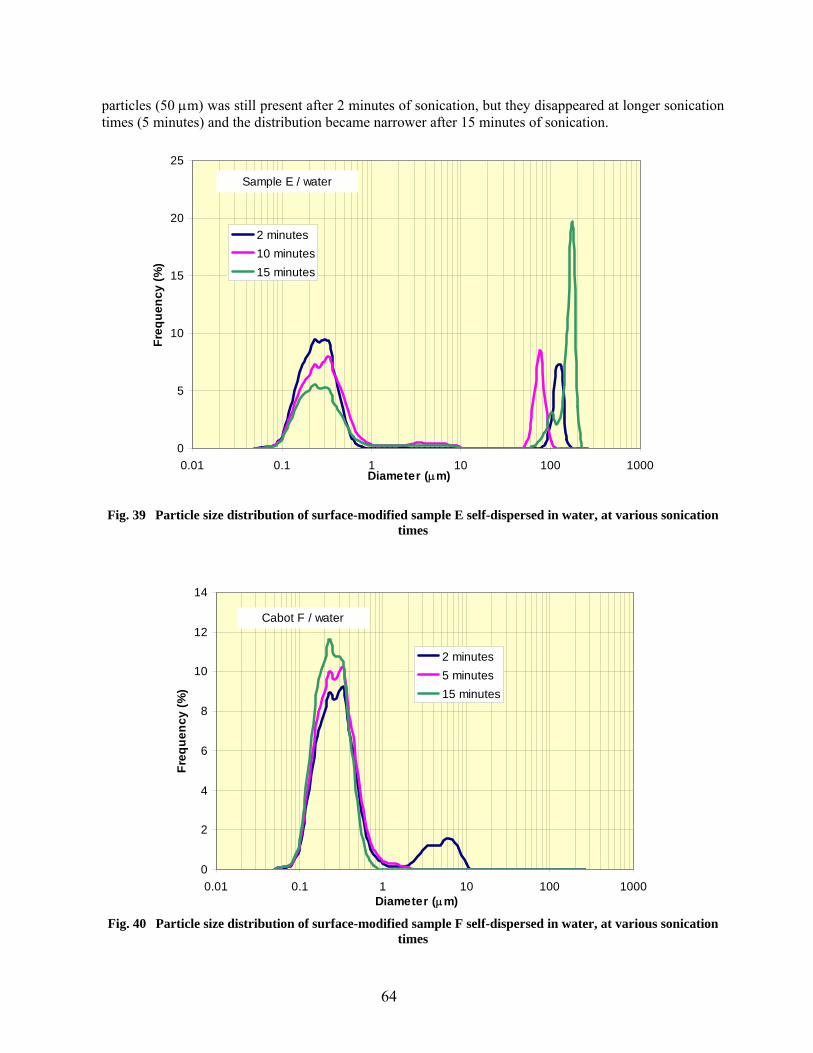
64
particles (50 µm) was still present after 2 minutes of sonication, but they disappeared at longer sonication times (5 minutes) and the distribution became narrower after 15 minutes of sonication.
0
5
10
15
20
25
0.01 0.1 1 10 100 1000Diameter (µm)
Freq
uenc
y (%
)
2 minutes10 minutes15 minutes
Sample E / water
Fig. 39 Particle size distribution of surface-modified sample E self-dispersed in water, at various sonication
times
0
2
4
6
8
10
12
14
0.01 0.1 1 10 100 1000Diameter (µm)
Freq
uenc
y (%
)
2 minutes5 minutes15 minutes
Cabot F / water
Fig. 40 Particle size distribution of surface-modified sample F self-dispersed in water, at various sonication
times
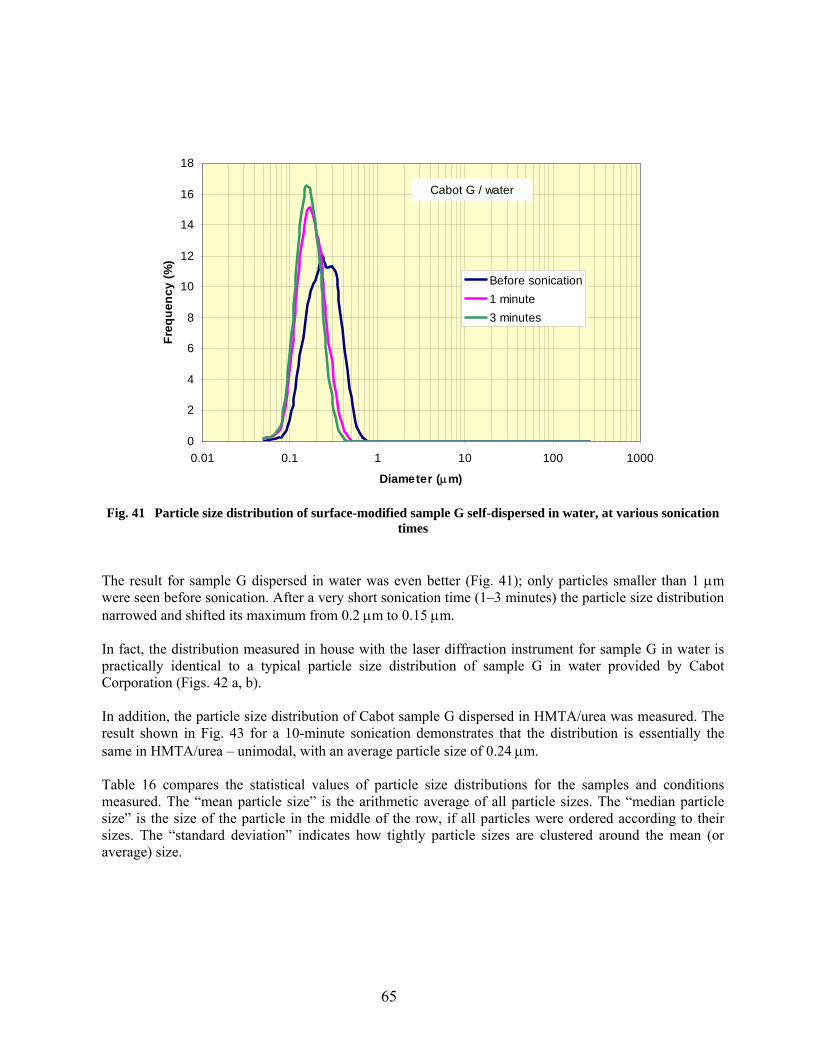
65
0
2
4
6
8
10
12
14
16
18
0.01 0.1 1 10 100 1000
Diameter (µm)
Freq
uenc
y (%
)
Before sonication1 minute3 minutes
Cabot G / water
Fig. 41 Particle size distribution of surface-modified sample G self-dispersed in water, at various sonication
times The result for sample G dispersed in water was even better (Fig. 41); only particles smaller than 1 µm were seen before sonication. After a very short sonication time (1–3 minutes) the particle size distribution narrowed and shifted its maximum from 0.2 µm to 0.15 µm. In fact, the distribution measured in house with the laser diffraction instrument for sample G in water is practically identical to a typical particle size distribution of sample G in water provided by Cabot Corporation (Figs. 42 a, b). In addition, the particle size distribution of Cabot sample G dispersed in HMTA/urea was measured. The result shown in Fig. 43 for a 10-minute sonication demonstrates that the distribution is essentially the same in HMTA/urea – unimodal, with an average particle size of 0.24 µm. Table 16 compares the statistical values of particle size distributions for the samples and conditions measured. The “mean particle size” is the arithmetic average of all particle sizes. The “median particle size” is the size of the particle in the middle of the row, if all particles were ordered according to their sizes. The “standard deviation” indicates how tightly particle sizes are clustered around the mean (or average) size.

66
Fig. 42 Particle size distributions typical of surface-modified Cabot sample G dispersed in water: Data from
Cabot Corporation: (a) and measured in this study (b).
Table 14. Statistical values derived from particle size measurements of surface-modified carbons
Sample Dispersing
medium Sonication
time
Mean particle
size
Median particle
size Standard deviation
µm µm µm
Sample E water 2 min 20.82 0.27 12.2 10 min 14.61 0.32 8.05 15 min 63.38 0.54 24.46 Sample F water 2 min 0.86 0.28 0.47 5 min 0.29 0.25 0.09 15 min 0.25 0.23 0.07 Sample G water before 0.24 0.23 0.07 1 min 0.17 0.16 0.05 3 min 0.16 0.15 0.04 Sample G HMTA/urea 10 min 0.24 0.22 0.06
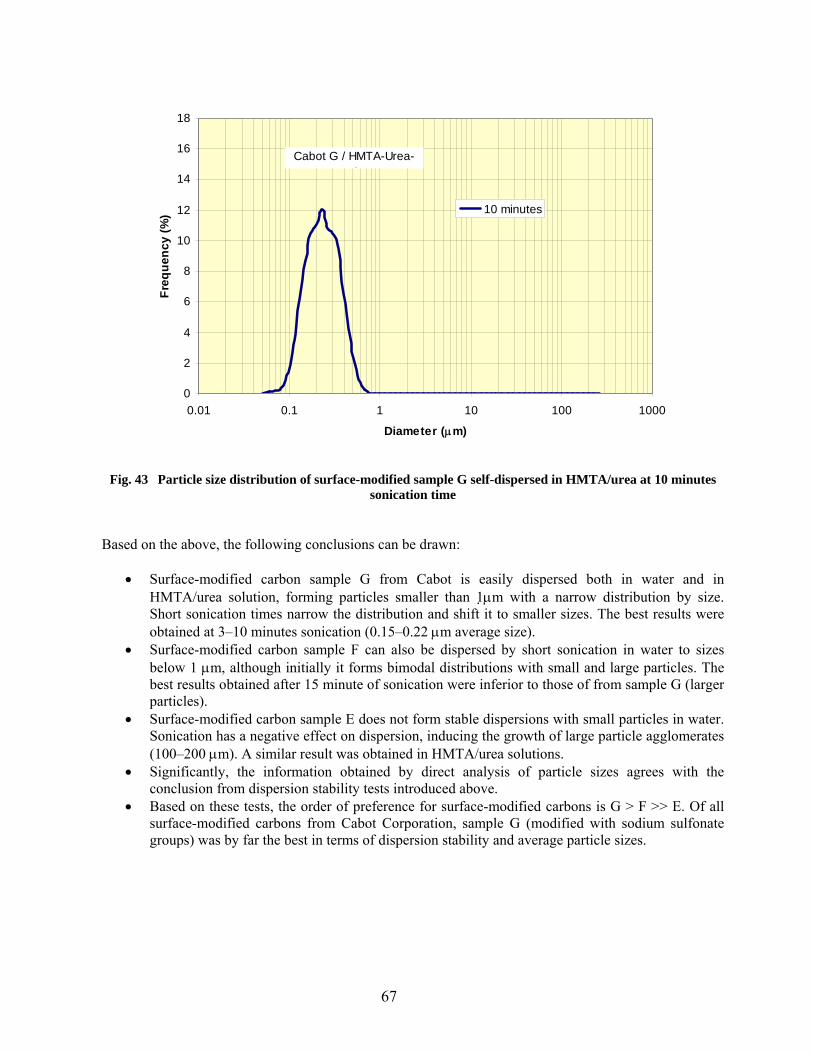
67
0
2
4
6
8
10
12
14
16
18
0.01 0.1 1 10 100 1000
Diameter (µm)
Freq
uenc
y (%
) 10 minutes
Cabot G / HMTA-Urea-t
Fig. 43 Particle size distribution of surface-modified sample G self-dispersed in HMTA/urea at 10 minutes sonication time
Based on the above, the following conclusions can be drawn:
• Surface-modified carbon sample G from Cabot is easily dispersed both in water and in HMTA/urea solution, forming particles smaller than 1µm with a narrow distribution by size. Short sonication times narrow the distribution and shift it to smaller sizes. The best results were obtained at 3–10 minutes sonication (0.15–0.22 µm average size).
• Surface-modified carbon sample F can also be dispersed by short sonication in water to sizes below 1 µm, although initially it forms bimodal distributions with small and large particles. The best results obtained after 15 minute of sonication were inferior to those of from sample G (larger particles).
• Surface-modified carbon sample E does not form stable dispersions with small particles in water. Sonication has a negative effect on dispersion, inducing the growth of large particle agglomerates (100–200 µm). A similar result was obtained in HMTA/urea solutions.
• Significantly, the information obtained by direct analysis of particle sizes agrees with the conclusion from dispersion stability tests introduced above.
• Based on these tests, the order of preference for surface-modified carbons is G > F >> E. Of all surface-modified carbons from Cabot Corporation, sample G (modified with sodium sulfonate groups) was by far the best in terms of dispersion stability and average particle sizes.

68
5. PROPOSAL FOR PROCESS OPTIMIZATION
The results reported above suggest that it is possible to optimize dispersing conditions of carbon black in the broth by using surface-modified carbon blacks with a proper chemical modifier grafted on the surface (sodium sulfonate). Surface-modified carbons can be used without a surfactant. In the optimized process, these surface-modified carbons would replace the traditional dispersing method based on surfactant adsorption on carbon blacks. The use of the traditional method has a series of disadvantages:
• Dispersion conditions are sensitive to the nature and surface properties of carbon black and the type of surfactant. Any change in the surface chemistry of carbon black – such as uncontrolled surface oxidation during prolonged storage – would impact on the wettability and dispersability, and would need to be compensated by re-adjusting the amount of surfactant (DAR).
• The dispersant agent requirement (DAR) needs to be properly determined for each carbon black-
surfactant combination. Too little surfactant is not sufficient to produce good quality dispersions, and too much would be detrimental, too.
• For ionic surfactants DAR is a strong function of pH. For example, in the case of Raven 1000 and
Tamol SN, the amount of surfactant that gives good dispersion at the alkaline pH of HMTA/urea is not sufficient to keep the dispersion stable at the acidic pH of the broth. More surfactant needs to be added with the acidic ADUN solution, but this may cause partial crystallization of uranyl nitrate; although these crystals would later dissolve when ADUN is mixed with HMTA/urea solution, the crystals are unwanted in the process. This fact was documented in the parallel research carried out by the group of Nuclear Science and Technology Division.21
• Because nonionic surfactants are not influenced by pH variations, they might be a better solution,
providing stable dispersions over a wide pH range. This was indeed demonstrated with the example of dispersions obtained with Raven 1000 and Tergitol XD in this research, which were stable in the pH range from 2 to 10 for longer than two months. However, using nonionic dispersants has two major disadvantages: (1) the required amounts (DAR) are much higher than for ionic dispersants, and (2) the dispersions obtained have very high viscosities. Both facts were documented by the group of Nuclear Science and Technology Division in a parallel research.21
• For both ionic and nonionic surfactants, the binding to the carbon surface is a dynamic
adsorption-desorption process during the dispersing step. Due to the dynamic character, the amounts adsorbed on the carbon vary with the concentration (or availability) of the surfactant in the dispersing liquid vehicle, and are sensitive to minute changes in carbon surface properties (such as surface oxidation). In addition, the adsorption process may be significantly slowed down by diffusion from bulk liquid to the aggregate surface, which in turns depends on the size and wettability of agglomerates and the intensity of mechanical work used for de-agglomeration. Briefly, a range of hard to control factors may introduce large variations in the dispersion process.
The results obtained so far with surface-modified carbons from Cabot Corporation are promising, and justify further investigation of their possible use for optimization of the dispersing process. There are several undisputable advantages of using surface-modified carbons in the dispersing process:

69
• Properly selected carbons (such as Cabot sample G) self-disperse in HMTA/urea solutions, i.e. there is no need of using a dispersant; dispersions remain stable for at least one month. In addition, there is no need for sonication or intense mechanical shearing; a short stirring is sufficient to form the dispersion.
• For a particular surface-modified carbon (sample G) the dispersion was stable several hours after
acidification, in conditions simulating the broth. Preliminary results from parallel research in the Nuclear Science and Technology Division indicated that a reasonable uniform gel could be obtained from ADUN-containing broth (in contrast, samples E and F did not form an uniform gel and segregated a carbon layer).21
• The surface modified carbon sample G has the smallest aggregate sizes (based on laser
diffraction) and primary particle sizes (based on STEM) measured in all of the samples (benchmark and un-modified carbons) investigated in this study.
• In addition, the surface chemistry of sample G (with sulfonate groups as a modifier) is the same
as that of surfactants used previously for manufacturing UCO kernels (Tamol SN, Marasperse). Surface-modified carbons are just better because the hydrophilic and ionized sulfonate groups are chemically bonded (as in sample G) rather than dynamically attached on carbon, as in the traditional method.
If a decision is made to replace the traditional dispersing method (and materials) with a surface-modified carbon (such as Cabot sample G), several other aspects should be addressed:
• The sulfur content of sample G (measured in this study) is 1.9 wt %. Considering the dilution ratio of carbon black into the final calcined UCO kernel, the resultant sulfur content would be in the range of 900 ppm, below the AGR-1 specification of 1500 ppm. This needs to be demonstrated.
• The sodium content of sample G (measured in this study) is close to 1 wt %. Considering the
dilution ratio from carbon black to the final calcined UCO kernel, the resultant sodium content would be ~500 ppm. This is more than the accepted limit of <100 ppm of the AGR-1 specification.
• To lower sodium content, it would be needed to explore with Cabot the possibility of replacing
Na+ by another cation for which no restrictions exists (such as potassium) and which is compatible with the surface modification process.
• Replacing Na+
by NH4+ may also solve this problem, because NH4
+ would decompose on calcination. However, ammonium ions may interfere with uranium chemistry in the gelation process. Clarification of this point would require further investigation of gel forming and gel properties.
• The effect of surface modifiers (and of companion counter ions, if any is present) on the
chemistry of uranyl nitrate and the gelation process should be investigated. In particular, the origin of the yellow or orange coloration of the liquid remaining after sedimentation of carbons from dispersions, acidified to simulate the broth conditions, is not clear.

70
Further work is needed in order to demonstrate that the use of carbons surface-modified with chemical groups similar to those of Cabot sample G does indeed produce better carbon dispersion in the gelled kernels; and that better carbon dispersion results in high quality kernels after the carbo-thermal process.
71
6. SUMMARY
Tasks 1–4 described in Section 1 of SOW 2813 of 5-24-05 for small scale AGR kernel fabrication development have been accomplished. Two benchmark carbon blacks (Raven 1000 and Black Pearls L), and of the anionic surfactant Tamol SN, historically used at BWXT and ORNL for manufacturing of UCO kernels, were characterized. In addition, other carbon blacks and nonionic surfactants were identified for improved carbon dispersions. It was demonstrated that Tergitol XD, a nonionic surfactant, produces dispersions of Raven 1000 which remain stable at least two months, and cover a broad pH range, from 2 to 10. A battery of physical and chemical characterization methods was used, including surface area and microporosity measurements by nitrogen adsorption, morphological characterization by electron microscopy, chemical analysis of heteroelements and metal traces, thermogravimetric analysis of desorbed volatiles, characterization of surface atomic composition by photoelectron spectroscopy, and identification of surface groups by infrared spectroscopy. In addition, a new method was setup for characterization of surface chemical groups on carbons by their pKa spectra. Because this method is new at ORNL, the method and results are presented in greater detail. A summary of physical and chemical properties characterized, the results obtained for various carbon blacks, and the desired trend, or range of properties, which can be associated with better dispersability for the purpose of this project, is provided in Table A1 of the Appendix. The most important result was the identification of surface-modified carbons (available from Cabot Corporation) that self-disperse in water and HMTA/urea solutions, without additions of surfactants, only by gentle agitation or short sonication at low power. Dispersions obtained from three surface-modified carbons were characterized. One particular carbon, identified as Cabot sample G, produced dispersions with average aggregate sizes of 0.15–0.20 µm both in water and in HMTA/urea solutions. The dispersions remained stable at least 6 hours (at 5 ºC) after controlled acidification with nitric acid to simulate pH conditions in the broth near the gelation point, where 80 % of HMTA is protonated. A suggestion for optimization of the carbon dispersing process is advanced. It is proposed that the traditional dispersion method, based on dynamic adsorption of dispersant agents on carbon blacks, is replaced by self-dispersion of surface-modified carbons with properly selected chemical groups bonded to the surface. Surface-modified carbons do not require intensive mechanical shearing or prolonged sonication, and they self-disperse in water and HMTA/solution. The best results were obtained with carbon modified with sodium sulfonate groups, such as Cabot sample G. Depending on the amounts needed, this particular carbon may be supplied by Cabot Corporation either as a dry powder, or in water dispersion. Considering the proportion of carbon in the final product, calcined UO2–UC2 kernels, it is estimated that the ~ 2 wt % content of sulfur in Cabot sample G is acceptable, and will not result in sulfur concentration in calcined kernels exceeding the AGR-1 specification. However, the AGR-1 specification for sodium, which is much lower, will probably be exceeded by using Cabot sample G (which is modified with sodium sulfonate and has about 1 wt % Na). More tests and assistance from Cabot Corporation is needed in order to reduce the sodium content below the AGR-1 specification.
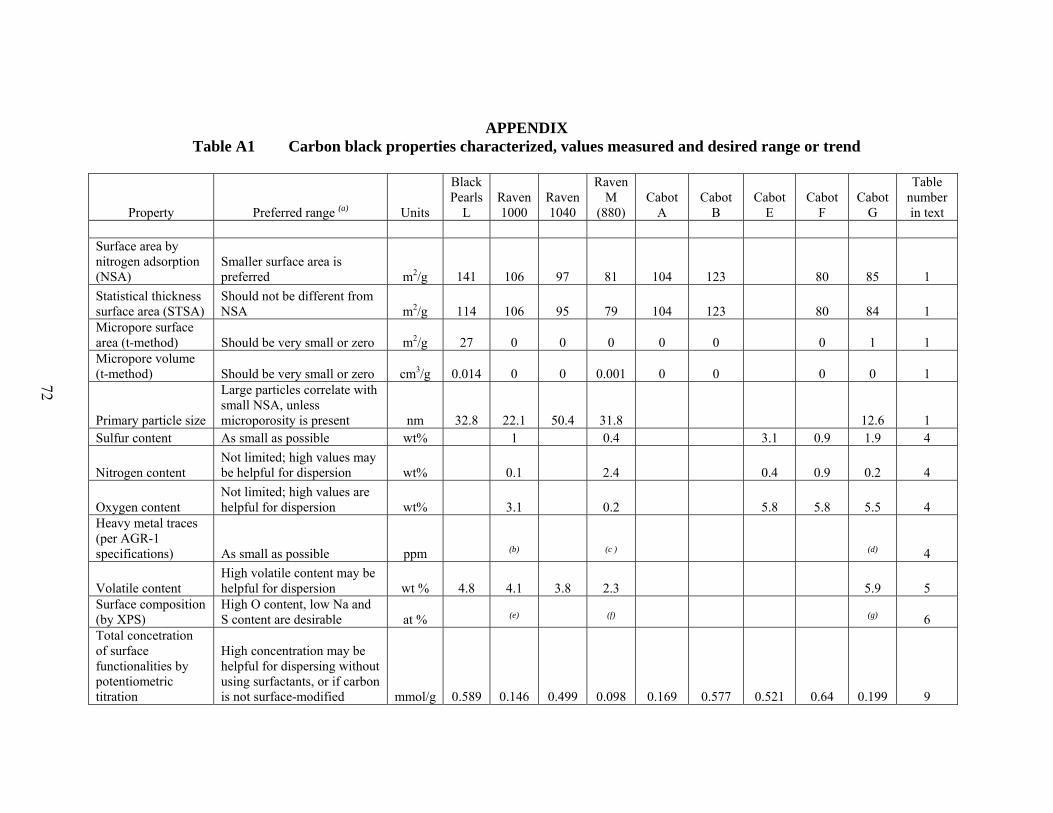
APPENDIX
Table A1 Carbon black properties characterized, values measured and desired range or trend
Property Preferred range (a) Units
Black Pearls
L Raven 1000
Raven 1040
Raven M
(880) Cabot
A Cabot
B Cabot
E Cabot
F Cabot
G
Table number in text
Surface area by nitrogen adsorption (NSA)
Smaller surface area is preferred m2/g 141 106 97 81 104 123 80 85 1
Statistical thickness surface area (STSA)
Should not be different from NSA m2/g 114 106 95 79 104 123 80 84 1
Micropore surface area (t-method) Should be very small or zero m2/g 27 0 0 0 0 0 0 1 1 Micropore volume (t-method) Should be very small or zero cm3/g 0.014 0 0 0.001 0 0 0 0 1
Primary particle size
Large particles correlate with small NSA, unless microporosity is present nm 32.8 22.1 50.4 31.8 12.6 1
Sulfur content As small as possible wt% 1 0.4 3.1 0.9 1.9 4
Nitrogen content Not limited; high values may be helpful for dispersion wt% 0.1 2.4 0.4 0.9 0.2 4
Oxygen content Not limited; high values are helpful for dispersion wt% 3.1 0.2 5.8 5.8 5.5 4
Heavy metal traces (per AGR-1 specifications) As small as possible ppm (b) (c ) (d) 4
Volatile content High volatile content may be helpful for dispersion wt % 4.8 4.1 3.8 2.3 5.9 5
Surface composition (by XPS)
High O content, low Na and S content are desirable at % (e) (f) (g) 6
Total concetration of surface functionalities by potentiometric titration
High concentration may be helpful for dispersing without using surfactants, or if carbon is not surface-modified mmol/g 0.589 0.146 0.499 0.098 0.169 0.577 0.521 0.64 0.199 9
72

Concentration of carboxylic-type groups (pKa<7.5)
May stabilize dispersions in basic solutions mmol/g 0.104 0.019 0.052 0.013 0.037 0.108 0.084 0.294 0.034 9
Concentration of phenolic-type groups (pKa>7.5)
May stabilize dispersions in acidic solutions mmol/g 0.485 0.127 0.447 0.085 0.132 0.469 0.437 0.346 0.165 9
Average size of dispersed particles (agglomerates) (h)
As small as possible, (preferably < 1 µm) µm 20 - 63
0.80-0.26
0.24-0.16 14
a) The preferred range is indicative of a trend only, and should be considered in conjunction with a multitude of parameters; see Comments below. b) Raven 1000: 190 ppm Na; 220 ppm Cl; 120 ppm Ca; 18 ppm Fe; 4 ppm Cr; 3 ppm Ni c) Raven M (880): 3 ppm Cr; 2 ppm Fe d) Cabot G: 0.95 % Na e) Raven 1000: 1.4 % O; 0.6 % S f) Raven M (880): 0.4 % O; 0.2 % S g) Cabot G: 7.2 % O; 4.1 % Na; 2 % S h) Depends on sonication time
Comments: Dispersability of carbon blacks in water is a complex quality, which arises as the combined result of several measurable properties, both physical and chemical, as demonstrated in this report. The significance of each individual property from the above Table, isolated from the rest, should not be overemphasized. On the contrary, selection of the best carbon should be done by comparing all properties identified above, and balancing the effect of surface chemistry versus textural and morphological attributes. The role of surface chemistry prevails, in general, over morphological factors. For example, better dispersability is in general associated with low surface area and large particle sizes, but surface oxidation, or proper surface modification with grafted chemical groups, can completely reverse this trend. In addition, the role of surfactants (in traditional methods of dispersion) is very important, especially with respect to the pH stability of dispersions.
73

74
This page was intentionally left blank.
75
REFERENCES
1 D. P. Stinton, W. J. Lackey, and R. D. Spence: “Production of Spherical UO2-UC2 for nuclear fuel applications using thermochemical principles”, ORNL/TM-7651, Oak Ridge National Laboratory (1981); also J. Am. Ceramic Soc. 65 (1982) 321 2 D. P. Stinton: “Mixed uranium dicarbide and uranium dioxide micropsheres and process of making same”, US Patent 4,367,184, January 4, 1983 3 J. L. Collins, M. F. Lloyd, R. L. Fellows: “Effects of process variables on reaction mechganisms responsible for ADUN hydrolysis, precipitation and gelation in the internal gelation gel-sphere process”, ORNL/TM-8818, Oak Ridge National Laboratory (1981) 4 J. L. Collins, M. H. Lloyd, and R. L. Fellows: “The basic chemistry involved in the internal-gelation method for precipitating uranium as determined by pH measurements”, Radiochimica Acta 42 (1987) 121-134. 5 J. L. Collins, R. D. Hunt, G. D. Del Cuk, and D. F. Williams: “Production of depleted UO2 kernels for the advanced gas-cooled reactor program for use in TRISO coating development”, Oak Ridge National Laboratory report ORNL/TM-2004/123, Oak Ridge, TN, November 2004. 6 D. Hummel: “Identification and Analysis of Surface-Active Agents by Infrared and Chemical Methods”, Interscience Publishers, 1962. 7 “Standard Test Method for Carbon Black – Morphological Characterization of Carbon Black Using Electron Microscopy”, ASTM International method D 3849 – 04, November 2004 8 S, Brunauer, P. H. Emmett, and E. Teller: “Adsorption of gases in multimolecular layers”, J. Am. Chem. Soc., 60 (1938) 309-319 9 S. J. Gregg and K. S. W. Sing: “Adsorption, Surface Area, and Porosity”, 2nd Edition, Academic Press, London, 1982 10 C. Lastoskie, K. E. Gubbins, and N. Quirke: “Pore size distribution analysis of microporous carbons: A density functional theory approach”, J. Phys. Chem., 97 (1993) 4786-4796 11 “Standard Test Method for Carbon Black – Total and External Surface Area by Nitrogen Adsorption”, ASTM International method D 6556 – 04, November 2004 12 “Standard Test Method for Carbon Black – Oil Absorption Number (OAN)”, ASTM International method D 2414 – 05, February 2005 13 Columbian Chemicals Company, http://www.columbianchemicals.com/ accessed August 2005. 14 “Raven Blacks”, technical brochure, Columbian Chemicals Company http://www.columbianchemicals.com/NR/rdonlyres/2AEEF4AE-6A47-40C7-9D56-395C22DA1757/0/CCC_lores_raven.pdf accessed July 2005. 15 Cabot Corporation, http://w1.cabot-corp.com/index.jsp accessed July 2005.
76
16 Lanxess Corporation, www.us.lanxess.com/ accessed August 2005 17 “Noveon Performance Coatings”, Noveon technical information, www.noveoncoatings.com accessed August 2005 18 “Additives Product Guide”, Lubrizol technical information, www.solesperse.com accessed September 2005 19 “Solsperse 44000 for Water Based Packaging Inks”, www.lubrizol-additives.com accessed September 2005 20 “Dow Surfactants Products” Dow Chemicals technical information, www.dow.com/surfactants/index,htm accessed September 2005 21 R. D. Hunt and J. L. Collins: “Optimizing dispersing conditions for broths used in the preparation of uranium fuel kernels with carbon”, to be published at Oak Ridge National Laboratory, Oak Ridge, TN, November 2005. 22 SARM Data sheet 2009-DS, Quantachrome Instruments. 23 P. A. Webb and C. Orr: “Analytical Methods in Fine Particle Technology”, Micromeritics Instrument Corporation, Norcorss, GA, 1997 24 IUPAC Recommendations, Pure Applied Chemistry, 57 (1985), 603 25 IUPAC Recommendations, Pure Applied Chemistry, 66 (1994), 1739 26 “Shiva Technologies, Inc., Contract Analytical Laboratory, Trace Elemental Analysis, Worldwide”, http://www.shivatec.com 27 “Standard Test Method for Volatile Matter Content of Activated Carbon Samples”, ASTM International D 5832 – 90 (Re-approved 2003), March 2003 28 J. L. Figueiredo, M. F. R. Pereira, M. M. A. Freitas, J. J. M. Orfao: “Modification of the surface chemistry of activated carbon”, Carbon, 37 (1999) 1379-1389 29 A. Dandaker, R. T. K. Baker, and M. A. Vannice: “Characterization of activated carbon, graphitized carbon fiber, and synthetic diamond powder using TPD and DRIFTS’ Carbon, 36 (1998) 1821-1831 30 Y. Otake and R. G. Jenkins: “Characterization of oxygen-containing surface complexes created on a microporous carbon by air and nitric acid treatment” Carbon, 31 (1993) 109-121 31 S. Haydar, C. Moreno-Castilla, M. A. Ferro-Garcia, F. Carasco-Marin, J. Riverao-Utrilla, A. Perrard, and J. P. Joly: “Regularities in the temperature-programmed desorption spectra of CO2 and CO from activated carbons”, Carbon, 38 (2000) 1297-11308 32 “EAG Specialist in Materials Characterization”, http://www.eaglabs.com/en-US/index.html 33 K. Laszlo, K. Josepovits, and E. Tombacz: “Analysis of active sites on synthetic carbon surfaces by various methods”, Analytical Sciences, 17 (2001), supplement, i1741-i1744.
77
34 Z. R. Yue, W. Jiang, L. Want, S. D. Gardner, and C. U. Pittman, Jr.: “Surface characterization of electrochemically oxidized carbon fibers” , Carbon 37 (1999) 1785-1796 35 C. Leon y Leon and L. R. Radovic: “Interfacial chemistry and electrochemistry of carbon surfaces”, in Chemistry and Physics of Carbons, Ed. Peter A. Thrower, vol. 24, Marcel Dekker, Inc. 1994, pp. 213-310 36 C. Contescu, J. Jagiello, and J. A. Schwarz: “Heterogeneity of proton binding sites at the oxide/solution interface”, Langmuir, 9 (1993) 1754-1765. 37 A. Contescu, C. Contescu, K. Putyera, and J. A. Schwarz: “Surface acidity of carbons characterized by their continuous pK distribution and Boehm titration”, Carbon, 35 (1997), 83-94. 38 A. Contescu, M. Vass, C. Contescu, K. Putyera, and J. A. Schwarz: “Acid buffering capacity of basic carbons revealed by their continuous pK distribution”, Carbon , 36 (1998) 247-258. 39 J. Jagiello, T. J. Bandosz, K. Putyera, and J. A. Schwarz: “Determination of proton affinity distribution for chemical systems ion aqueous environments using a stable numerical solution of the adsorption integral equation”, J. Colloid Interface Science, 172 (1995) 341-346 40 J. Jagiello and J. A. Schwarz: “Local exact and approximate solutions of the adsorption integral equation with a kernel of a Langmuir isotherm: Determination of adsorption energy distribution”, J. Colloid Interface Science, 146 (1991) 415-424 41 J. Jagiello, T. J. Bandosz, and J. A. Schwarz: “Carbon surface characterization in terms of its acidity constant distribution”, Carbon, 32 (1994) 1026-1028 42 J. Jagiello: “Stable numerical solution of the adsorption integral equation using splines”, Langmuir ,10 (1994) 2778-2785 43 P. Benezeth, D. A. Palmer and D. J. Wesolowski: “Dissociation quotients for citric acid in aqueous sodium chloride media to 150 ºC”, J. Solution Chem,. 26 (1997) 63-84 44 “Tamol SN, Rohm and Haas Company, Specialty Polymers”, http://www.rohmhaas.com/paper/pdf/tamol_sn.pdf 45 Dow Surfactants technical information, http://www.dow.com/surfactants/products/ethylene.htm, accessed August 2005 46 J. A. Belmont: “Process for preparing carbon materials and resultant carbon products” US Patent 5,554,739, September 10, 1996 47 J. A. Belmont, R. M. Amici, and C. P. Galloway: “Reaction of carbon black with diazonium salts, resultant carbon black products and their uses”, US Patent 6,042,643, March 28, 2000. 48 J. Collins, Oak Ridge National Laboratory, Oak Ridge, TN, personal communication to C.I. Contescu, September 2005.

78
This page was intentionally left blank.
79
ORNL/TM-2005/548
ELECTRONIC DISTRIBUTION
Fred Baker Oak Ridge National Laboratory Charles Barnes Idaho National Laboratory Gary Bell Oak Ridge National Laboratory Tim Burchell Oak Ridge National Laboratory Cristian Contescu Oak Ridge National Laboratory Jack Collins Oak Ridge National Laboratory John Cox Idaho National Laboratory Matt Ebner Idaho National Laboratory Madeline Feltus U.S. Department of Energy Jeff Halfinger BWXT Frank Homan Oak Ridge National Laboratory Rodney Hunt Oak Ridge National Laboratory John Hunn Oak Ridge National Laboratory DeWayne Husser BWXT Rick Lowden Oak Ridge National Laboratory Scott Nagley BWXT Peter Pappano Oak Ridge National Laboratory David Petti Idaho National Laboratory Clay Richardson BWXT