Embed Size (px)
Citation preview

Improving Subsurface Stress
Characterization for Carbon Dioxide
Storage Projects by Incorporating Machine
Learning Techniques
(DE-FE0031684)
William Ampomah, PhD
New Mexico Tech - PRRC
U.S. Department of Energy
National Energy Technology Laboratory
Addressing the Nation’s Energy Needs Through Technology Innovation – 2020 Carbon Capture,
Utilization, Storage, and Oil and Gas Technologies Integrated Review Meeting
September 10, 2020

Presentation Outline
• Project overview
• Project objectives
• Technical Approach
• Accomplishments
• Synergy Opportunities
• Summary
2

3
Program Overview
– Funding Profile
– Project Performance Dates:
10/01/2018 – 09/30/2021

4
Project Team
New Mexico Tech Consultants
Dr. William Ampomah (PI) Mr. James Rutledge
Dr. Robert Will Dr. Thomas Bratton
Dr. Robert Balch
Dr. Qian Sun Mr. Donald Lee
Dr. Gary Axen
Mr. George El-Kasseh Students
Ms. Martha Cather Ms. Marcia McMillan
Mr. Noah Hobbs
LANL
Dr. Lianjie Huang
SNL
Dr. Timothy Draelos

5
Program OverviewGoals and Objectives
• The primary objective of our project is to develop a framework to boost the reliability of characterization and prediction of the state of stress in the overburden and underburden (including the basement) in CO2 storage reservoirs using novel machine learning and integrated geomechanics and geophysical methods.
• We are using field data and models developed by the Southwest Regional Partnership on Carbon Sequestration (SWP) for the Farnsworth Unit (FWU), a CO2 enhanced oil recovery (EOR) project being conducted by Perdure in Ochiltree County, Texas, to verify the improved capabilities of our methods.
• The integration methodology is an adaptation of industry accepted practices for calibration of flow simulation models to coupled geomechanical models for improved stress prediction. Computational challenges will be overcome through application of Machine learning.

• Demonstrated at the Farnsworth
Unit ongoing CO2 EOR
development:
Discovered 1956
Primary depletion until~ 1965
Waterflood until ~2010
CO2 WAG EOR Started 2010
• 2 anthropogenic CO2 sources
• Extensive characterization dataset
previously was acquired, and
modeling performed by the SWP
partnership
Technology/Site Selection
6

Technology/Site Selection
7
• Extensive available site characterization dataset includes:
3D surface seismic
Repeat 3D VSP, repeat cross-well seismic
Extensive borehole geophysical logging and coring
Passive seismic monitoring array
• Prior data analysis and modeling:
3D seismic depth imaging
Time-Lapse VSP processing
Core petrophysical and geomechanical testing
Integrated 3D geological modeling
History matched full field compositional reservoir simulation

Technical Approach/Project Scope
8
• The final outcome of this work will be a
methodology for integration of multi-
disciplinary data to reduce uncertainty in
estimation of stress changes in the storage
complex and underburden.
• Significant project risks include stress-
sensitivity of rock behavior under
anticipated effective stress changes, and
microseismic data characteristics.
• The robust characterization dataset which
includes extensive geological, geophysical,
and geomechanical, and seismological
data provide opportunities for technical risk
mitigation through alternative integration
strategies.

Technical
Approach/Project Scope
Task/
Subtask
Milestone Title Planned Completion
2.2 1D MEM Model 2/28/19
2.4 VSP Elastic Inversion 10/31/19
2.6 VSP Stress Estimation 2/28/19
3.0 Microseismic Analysis 11/31/2020
4.0 3D MEM Model 9/30/2019
5.0 Hydrodynamic History Matching 3/31/2020
6.0 Evaluation of one-way and two-way coupling
process
8/30/2020
7.1 Stress Objective function formulation 7/30/2020
7.4/7.5 Completion of VSP - microseismic history
matching
5/31/2021
8.0 Forecasting pressure and stress 8/30/2021

10
Technical Approach/Project Scope(Project Success Criteria)
• Develop a structural and stratigraphic framework honoring basin development and fault kinematic
principles.
• Produce elastic-waveform inversion results on already acquired 3D surface seismic data and time-
lapse 3D VSP data.
• Utilize machine learning techniques to identify spectro-temporal features in the microseismic data
which will allow for event location and event classification.
• Generate a high resolution mechanical Earth model (MEM) integrating all available geological,
geophysical, and mechanical characterization data.
• Develop a history matching framework which involves a proxy model using machine learning algorithm
and optimization techniques to calibrate simulation model as well as coupled hydrodynamic-
geomechanical model to observed data.
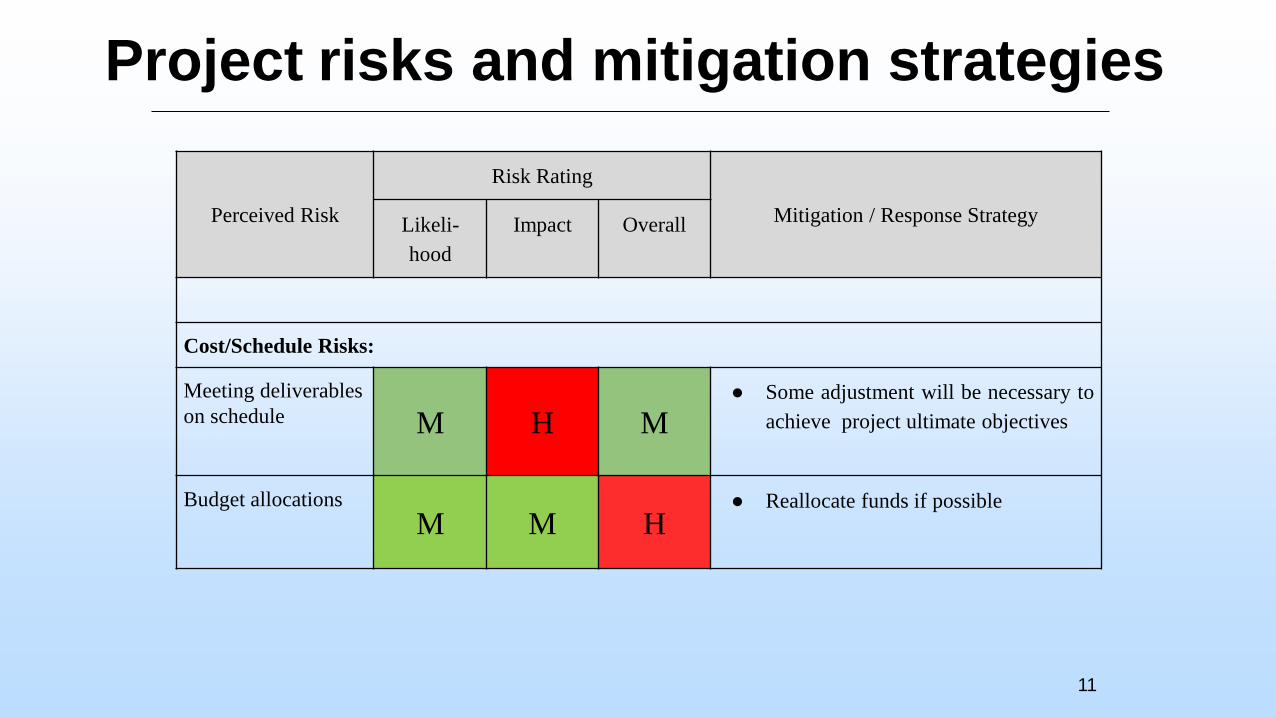
Project risks and mitigation strategies
11
Perceived Risk
Risk Rating
Mitigation / Response StrategyLikeli-
hood
Impact Overall
Cost/Schedule Risks:
Meeting deliverables
on schedule M H M● Some adjustment will be necessary to
achieve project ultimate objectives
Budget allocations
M M H● Reallocate funds if possible

12
Progress and Current Status of ProjectAchievements to Date
• We have rebuilt new initial anisotropic models by upscaling well logs using the Schoenberg-Muir
method within layers divided according to P-wave impedance, and have determined the HTI positions
and parameters besides VTI parameters in most areas.
• Have detected and located hundreds of microseismic events.
• The located events show two distribution peaks in the histogram of distribution of microseismic events
along depth.
• The upper peak coincides with a geologic formation containing strong horizontal transverse isotropic
properties revealed from well-log analysis, while the lower peak lies within a different geologic
formation.
• Completed final geological and geomechanical static models for hydrodynamic flow and coupled
simulations
• Completed final history matching modeling utilizing machine learning based workflow
• Completed evaluation of 1-way and 2-way coupling options for stress calibration process
• At the later stages of objective function development to aid calibration of coupled modeling efforts

13
The project enjoys the benefit of a rich
mechanical characterization dataset
facilitating:
• Analysis of geophysical logs supported
development of a site specific rock physics
model for required fluid substitution
computations.
• Analysis of extensive borehole
geophysical and drilling data providing
insights into stress anisotropy
characteristics in the reservoir and
overburden.
• Analysis of core mechanical test results
providing calibration of geophysical log
derived mechanical properties and stress
sensitivity of velocities.
Wellbore Geophysical
and Mechanical Data
Analysis
14
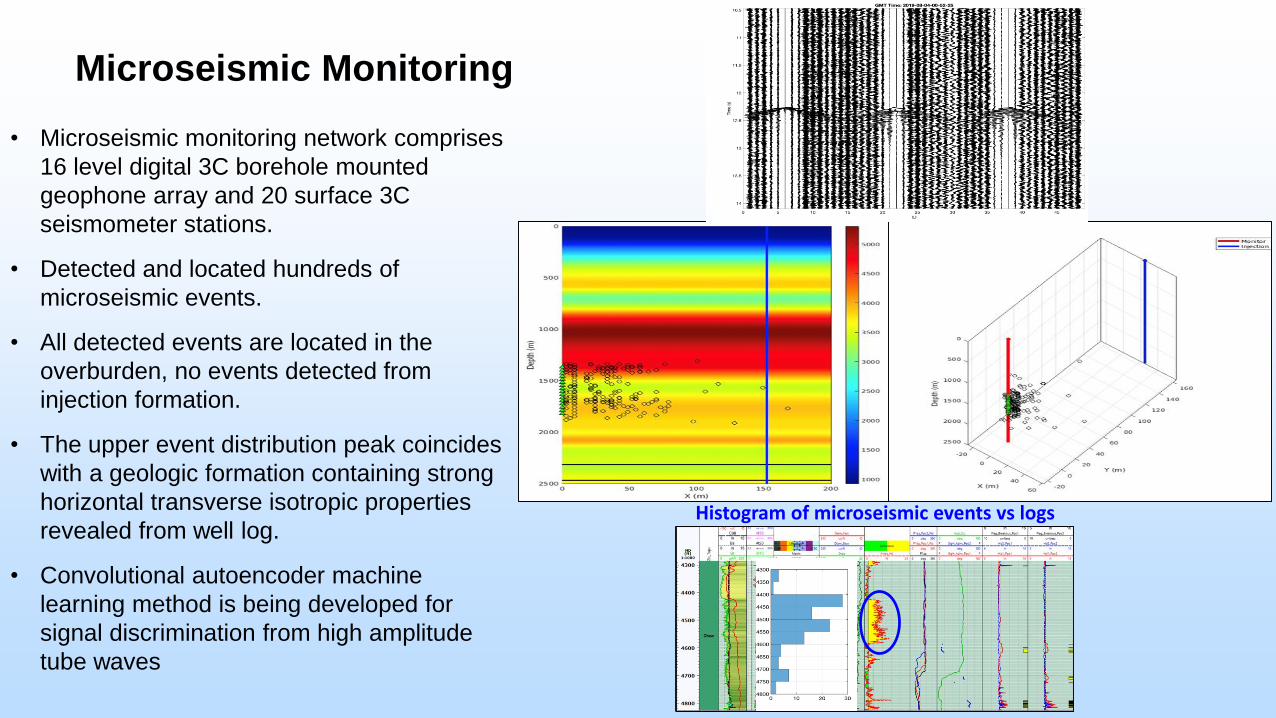
Microseismic Monitoring
• Microseismic monitoring network comprises
16 level digital 3C borehole mounted
geophone array and 20 surface 3C
seismometer stations.
• Detected and located hundreds of
microseismic events.
• All detected events are located in the
overburden, no events detected from
injection formation.
• The upper event distribution peak coincides
with a geologic formation containing strong
horizontal transverse isotropic properties
revealed from well log.
• Convolutional autoencoder machine
learning method is being developed for
signal discrimination from high amplitude
tube waves
Histogram of microseismic events vs logs

SNL Microseismic Denoiser to Remove Borehole
Waves from Microseismic Waveforms
• Deep Denoising
Autoencoder
– Trained on Noisy
Signal inputs artificially
created from isolated
ground truth
• Microseismic Events
• Borehole Waves (BWs)Encod
er
Decode
r
Noisy
SignalSignal
Mask
Noise Mask
Samples Time (s)
Noisy Signal
(Event +
BW)
Denoised
Signal
Seismograms Spectrograms

16
• The geological model developed by SWP has
been updated with structural and stratigraphic
reinterpretation of newly depth imaged seismic
data.
• The updated model extends from ground
surface to below the injection zone (Morrow B
reservoir).
• Petrophysical properties of the reservoir and
caprock have been updated through
integration of geophysical logs, core, and
seismic elastic inversion products.
• Elastic properties of the reservoir,
underburden, and overburden have been
updated through integration of well data based
1-D Mechanical Earth Models (MEM) derived
from geophysical logs and core analysis.
Geological and Geomechanical
Static Modeling

17
• Primary/Secondary (pressure depletion/waterflood) and
tertiary (CO2 WAG) periods were history matched using
proxy modeling and machine learning optimization.
• Separate proxy models were developed for
primary/secondary and CO2 WAG development periods
each using 100 full physics runs to train and verify proxy
models.
• Particle swarm optimization was employed and coupled
with the proxy models to minimize the history matching
error
• Optimized reservoir parameters were verified in full
physics simulations.
Hydrodynamic Flow Calibration

18
• 3D traveltime tomography and 3D hybrid
time-frequency multi-scale elastic-
waveform inversion were used to refine
the baseline velocity models with all
survey source points.
• The same 3D traveltime tomography and
3D elastic-waveform inversion were
applied to three repeat VSP survey
datasets.
• Resulting P and S wave velocity
anomalies show temporal and spatial
evolution with expectations from 5-spot
CO2 WAG production pattern
• Persistent S wave anomaly is evidence
of stress sensitivity in Morrow B
formation
Time-Lapse VSP Processing
and Analysis

Fluid EOS Modeling Using NIST
SuperTrapp in PETREL Process Manager
For Each VSP Survey Time:
• Read Eclipse fluid component
fraction property grids.
• Read Eclipse pressure and
water saturation property grids.
• Invoke external SUPERTRAP
FORTRAN executable for EOS
calculations.
• Compute fluid modulus and
density property grids for use in
fluid substitution calculations.
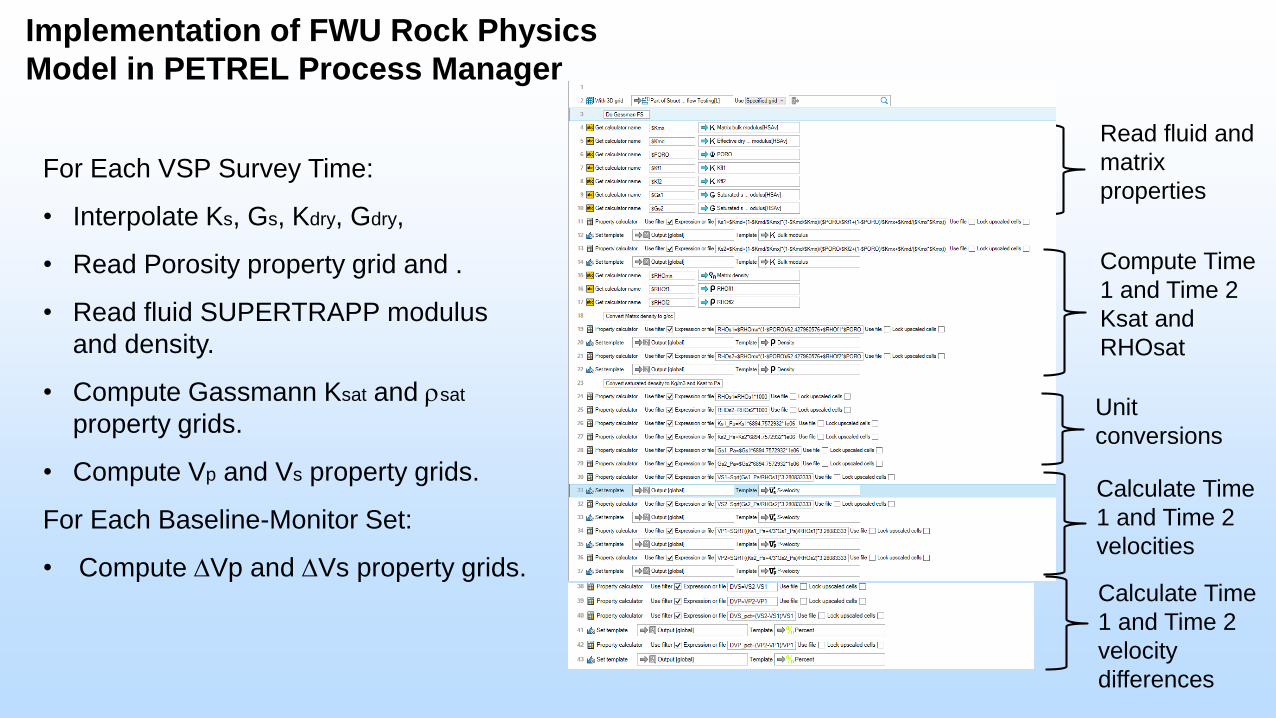
Implementation of FWU Rock Physics
Model in PETREL Process Manager
For Each VSP Survey Time:
• Interpolate Ks, Gs, Kdry, Gdry,
• Read Porosity property grid and .
• Read fluid SUPERTRAPP modulus
and density.
• Compute Gassmann Ksat and rsat
property grids.
• Compute Vp and Vs property grids.
For Each Baseline-Monitor Set:
• Compute DVp and DVs property grids.
Read fluid and
matrix
properties
Compute Time
1 and Time 2
Ksat and
RHOsat
Unit
conversions
Calculate Time
1 and Time 2
velocities
Calculate Time
1 and Time 2
velocity
differences

21
Coupled Modeling – MEM Initialization
• The initial 3D MEM stress state is
established by imposition of horizontal
stresses at lateral model boundaries
(sides), and vertical stress computed
from overburden loading.
• Initial estimates of principal vertical
and horizontal stresses at model
boundaries are computed from
integrated Well log and core 1D Well
MEM’s.
• Horizontal 3D MEM stress boundary
conditions are iteratively adjusted to
achieve agreement of principal
stresses between the 3D MEM and
Well MEM stresses.
Sigma 1 Sigma 3 Sigma 2 Pp
Log Model
YME PR Density
Log Model
Stress InitializationWell MEM and 3D Model Predictions Overlaid at Well 13-10A

22
Gaps/Challenges/Hurdles
• Our major challenge is the characteristics of our observed microseismicity, which is emanating from
the overburden rather than the reservoir, and which lacks the linear spatial organization indicative of
faults and other failure mechanisms.
• Such spatial clustering/organization is the basis for two of our proposed geophysical imaging and
inversion techniques (joint reverse time migration for fault/fracture imaging and joint focal mechanism
inversion). These two products are fundamental to our strategy for integration of microseimicity for
stress model calibration.
• However, our borehole and core geomechanical data analyses has yielded very interesting insights
into high levels of stress anisotropy in the overburden zones from which microseismicity is emanating.
• Additionally, the elastic inversion of VSP data has yielded 3D volumes of rock elastic anisotropy
attributes (Thompson parameters).
• Our proposed process modification involves integration of borehole geomechanics and seismic
anisotropy volumes to develop a 3D mechanical model describing the anisotropic stress conditions in
the overburden.
• The mechanical model will be used to investigate potential source mechanisms for the observed
microseismicity through forward modeling.
• In the new strategy observed microseismicity would be used as an independent observation for
validation of hypothetical source mechanisms.

23
Synergy opportunities
• The team continuous to collaborate with researchers within Southwest Regional
Partnership to compliments each projects efforts.
• Continue to share results with scientific community and field operator to improve
operations

24
Summary Slide
Key Findings/ Lessons Learned
• The far-field stresses are aggressive enough to cause significant mechanical deformation
(breakouts, inward radial strain) and variations in acoustical velocities at three different
scales (core – log – seismic).
• The differential horizontal stresses are large enough to cause mechanical breakouts and
dipole acoustical anisotropy.
• The stress changes due to fluid injection/removal are large enough to cause observable
changes in acoustical velocities.
• Acoustical variations due to changes in fluid properties is likely a small effect compared to
changes in stress loading.
• The quality of initial anisotropic parameters plays an important role in conversion rates
and reliability of anistropic inversion.

25
Summary Slide
Future Plans
• Continue to quantify the relationship between mechanical deformation and stress
• Continue to quantify the relationship between acoustical velocity changes and stress.
• Calibrate coupled model with time-lapse VSP inversion velocities.
• Refine the microseismic 3D location results and estimate focal mechanism characteristics.
• Utilize anisotropic tomography and elastic-waveform inversion to invert for anisotropic parameters of full-size models so support characterization of stress anisotropy in the overburden.
• Use the coupled model and focal mechanism modeling to evaluate potential causality for observed overburden microseismicity.

26
Acknowledgements
The project would like to thank DOE for the award opportunity through
DE-FE0031684 and our partners.

Appendix
– These slides will not be discussed during the presentation, but
are mandatory.
27

28
Organization Chart

29
Gantt Chart

![Characterization of Stress-Responsive CIPK Genes...Characterization of Stress-Responsive CIPK Genes in Rice for Stress Tolerance Improvement1[W] Yong Xiang, Yuemin Huang, and Lizhong](https://img.pdfslide.us/doc/110x75/5f0eef497e708231d441a96d/characterization-of-stress-responsive-cipk-characterization-of-stress-responsive.jpg)