Embed Size (px)
Citation preview
devdespdevmatmetbelometgeotmetpredmetretaproform
Co
in tworimp[3],Mametdevmetto seisinitthe hasembobsenhhardthe datathatinteseispararespexpmet
11th International Conference on Soil Dynamics and Earthquake Engineering (11th ICSDEE) and the 3rd Internationalnference on Earthquake Geotechnical Engineering (3rd ICEGE), University of California, Berkeley, January 2004.
Seismic Soil Pressure for Building Walls-An Updated Approach
Farhang Ostadan Bechtel Corporation, San Francisco, CA 94105
Abstract-The Mononobe-Okabe (M-O) method eloped in the 1920’s in Japan continues to be widely used ite many criticisms and its limitations. The method was
eloped for gravity walls retaining cohesionless backfill erials. In design applications, however, the M-O hod, or any of its derivatives, is commonly used for w ground building walls. In this regard, the M-O hod is one of the most abused methods in the echnical practice. Recognizing the limitation of the M-O hod, a simplified method was recently developed to ict lateral seismic soil pressure for building walls. The
hod is focused on the building walls rather than soil ining walls and specifically considers the dynamic soil perties and frequency content of the design motion in its
ulation.
The new understanding of the attributes to seismic soil pressure prompted the United States Nuclear Regulatory Committee (NRC) to reject the M-O and the M-O based methods for application to critical structures. The major developments that consider the soil-wall interaction under dynamic loading are those by Wood [11] and Veletsos et. al [12,13]. The solution by Wood commonly used for critical facilities [14] are, in fact, based on static “1g” loading of the soil-wall system and does not include the wave propagation and amplification of motion. The recent solution by Veletsos et. al is a much more rigorous solution. The solution, however, is complex and lacks simple computational steps for design application. At this time, while elaborate finite element techniques are available to obtain the soil pressure for design, no simple method has been proposed for quick prediction of the maximum soil pressure, thus hindering the designer’s ability to use an appropriate method in practice. To remedy this problem, the current research was conducted to develop a simple method, which incorporates the main parameters affecting the seismic soil pressure for buildings. In this paper the development of the simplified method and a brief summary of its extensive verification are presented. Its application for a typical wall is demonstrated by a set of simple numerical steps and the results are compared with the commonly used methods such as the M-O method and the solution by Wood.
Keywords— Seismic soil pressure, SSI, SASSI2000
INTRODUCTION
The Mononobe-Okabe (M-O) method was developed he 1920’s [1,2]. Since then, a great deal of research k has been performed to evaluate its adequacy and to rove it. These include the work by Seed and Whitman Whitman et. al [4,5,6], Richard and Elms [7], and tsuzawa et. al [8]. A good summary of the various hods and its application in reported in [9]. Most elopments cited above are based on the M-O original hod. The M-O method is, strictly speaking, applicable gravity retaining walls, which, upon experiencing mic loading, undergo relatively large movement to iate the sliding wedge behind the wall and to relieve pressure to its active state. Unfortunately, the method been and continues to be used extensively for edded walls of the buildings as well. Recent field
ervations and experimental data, along with ancements in analytical techniques have shown that ly any of the assumptions used in the development of M-O method are applicable to building walls. The and the follow up detail analysis have clearly shown the seismic soil-pressure is an outcome of the raction between the soil and the building during the mic excitation and as such is a function of all meters that affect soil-structure interaction (SSI) onse. Some of the more recent observations and erimental data, including a detail discussion of the hod presented herein, are reported in [10].
The proposed method has been adopted and recommended by NEHRP (15).
METHODOLOGY
The method is focused on the building walls rather than soil retaining walls and specifically considers the following. 1) The movement of the walls is limited due to the presence of the floor diaphragms and the walls are considered non-yielding. 2) The frequency content of the design motion is fully considered. Use of a single parameter as a measure of design motion such as the peak ground acceleration may misrepresent the energy content of the motion at frequencies important for soil pressure. 3) Appropriate soil properties, in terms of soil shear wave velocity and damping, are included in the analysis. The method is flexible to allow for consideration of soil
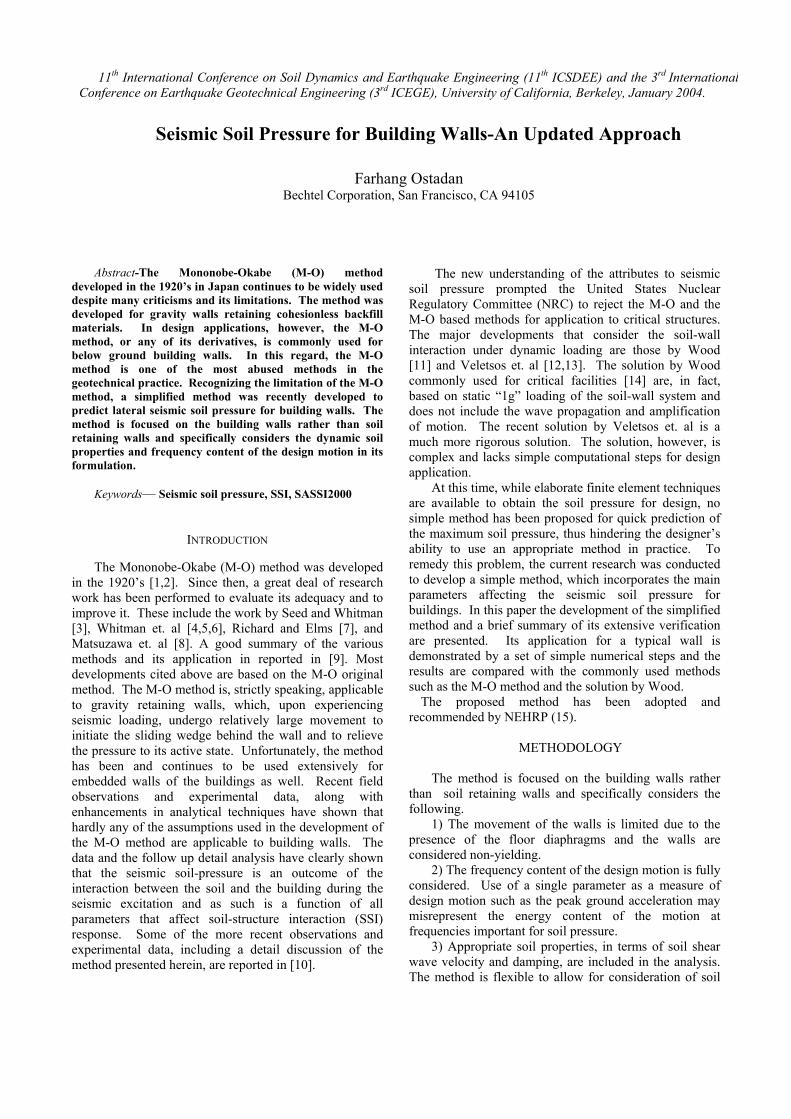
nonlinear effect where soil nonlinearity is expected to be significant. It is recognized that the seismic soil pressure is not only affected by the kinematic interaction of the foundation but also the inertia effect of the building as well. The mass properties of the buildings vary significantly from one building to the other. The proposed solution is limited to prediction of seismic soil pressure as contained within the kinematic interaction effects consistent with those used by the current methods. Experience from numerous rigorous SSI analysis of buildings confirms that using the proposed solution can adequately predict the amplitude of the seismic soil pressure for many buildings even when the inertia effect is included. Some local variation of soil pressure may be different depending on the layout of the interconnecting slabs and the interior walls to the exterior walls and relative stiffness of the walls and the soil. To investigate the characteristics of the lateral seismic soil pressure, a series of seismic soil-structure interaction analyses was performed using the Computer Program SASSI2000[16]. A typical SASSI model of a building basement is shown in Fig. 1. The embedment depth is designated by H and the soil layer is identified by the shear wave velocity, Vs, the Poisson’s ratio, ν, total mass density, ρ and the soil material damping, β. The basemat is resting on rock or a firm soil layer. A column of soil elements next to the wall is explicitly modeled in order to the retrieve the pressure responses from the solution.
Fig. 1: A Typical SASSI Model of the Foundation
The assumption of a firm soil layer or a rock layer under the basemat eliminates the rocking motion of the foundation. For deep soil sites and depending on the aspect ratio of the foundation, the rocking motion can influence the magnitude and distribution of soil pressure. Due to space limitation, the extension of the method for deep soil sites is not presented in this paper. A detail discussion is reported in [10]. For the SASSI analysis, the acceleration time history of the input motion was specified at the top of the rock layer corresponding to the basemat elevation in the free-
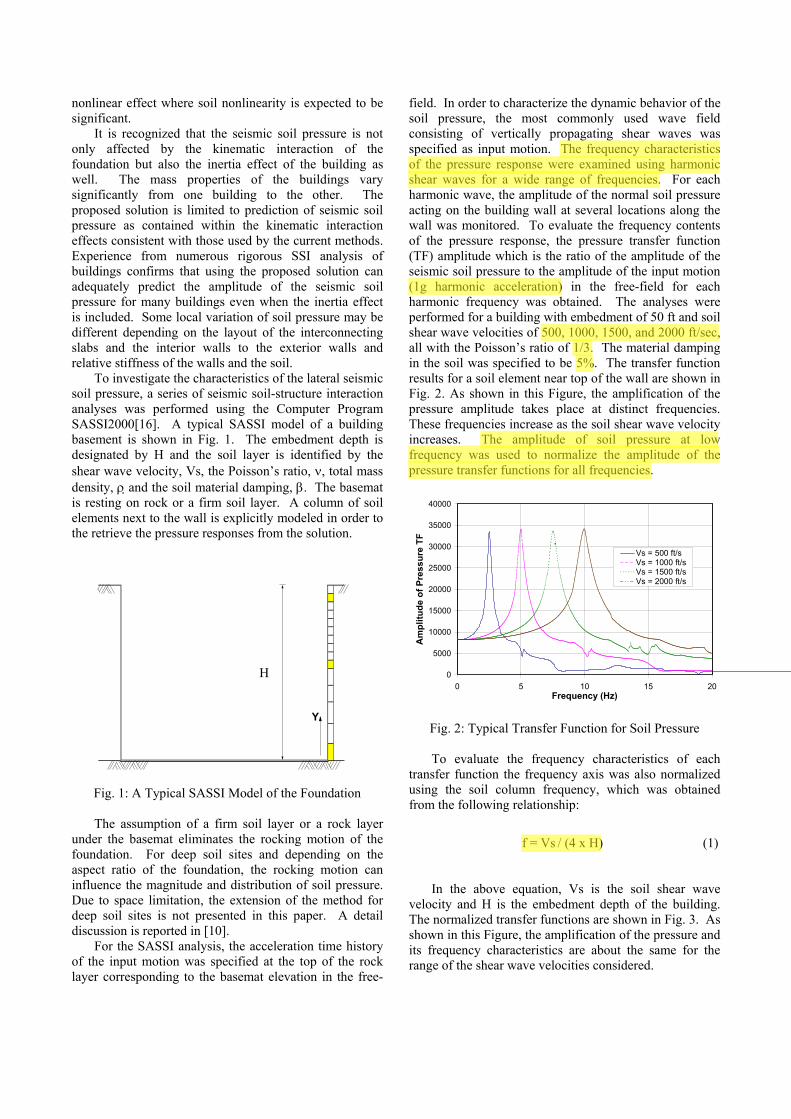
field. In order to characterize the dynamic behavior of the soil pressure, the most commonly used wave field consisting of vertically propagating shear waves was specified as input motion. The frequency characteristics of the pressure response were examined using harmonic shear waves for a wide range of frequencies. For each harmonic wave, the amplitude of the normal soil pressure acting on the building wall at several locations along the wall was monitored. To evaluate the frequency contents of the pressure response, the pressure transfer function (TF) amplitude which is the ratio of the amplitude of the seismic soil pressure to the amplitude of the input motion (1g harmonic acceleration) in the free-field for each harmonic frequency was obtained. The analyses were performed for a building with embedment of 50 ft and soil shear wave velocities of 500, 1000, 1500, and 2000 ft/sec, all with the Poisson’s ratio of 1/3. The material damping in the soil was specified to be 5%. The transfer function results for a soil element near top of the wall are shown in Fig. 2. As shown in this Figure, the amplification of the pressure amplitude takes place at distinct frequencies. These frequencies increase as the soil shear wave velocity increases. The amplitude of soil pressure at low frequency was used to normalize the amplitude of the pressure transfer functions for all frequencies.
0
5000
10000
15000
20000
25000
30000
35000
40000
0 5 10 15 20Frequency (Hz)
Am
plitu
de o
f Pre
ssur
e TF
Vs = 500 ft/sVs = 1000 ft/sVs = 1500 ft/sVs = 2000 ft/s
Y
HH
Fig. 2: Typical Transfer Function for Soil Pressure
To evaluate the frequency characteristics of each transfer function the frequency axis was also normalized using the soil column frequency, which was obtained from the following relationship:
f = Vs / (4 x H) (1)
In the above equation, Vs is the soil shear wave velocity and H is the embedment depth of the building. The normalized transfer functions are shown in Fig. 3. As shown in this Figure, the amplification of the pressure and its frequency characteristics are about the same for the range of the shear wave velocities considered.
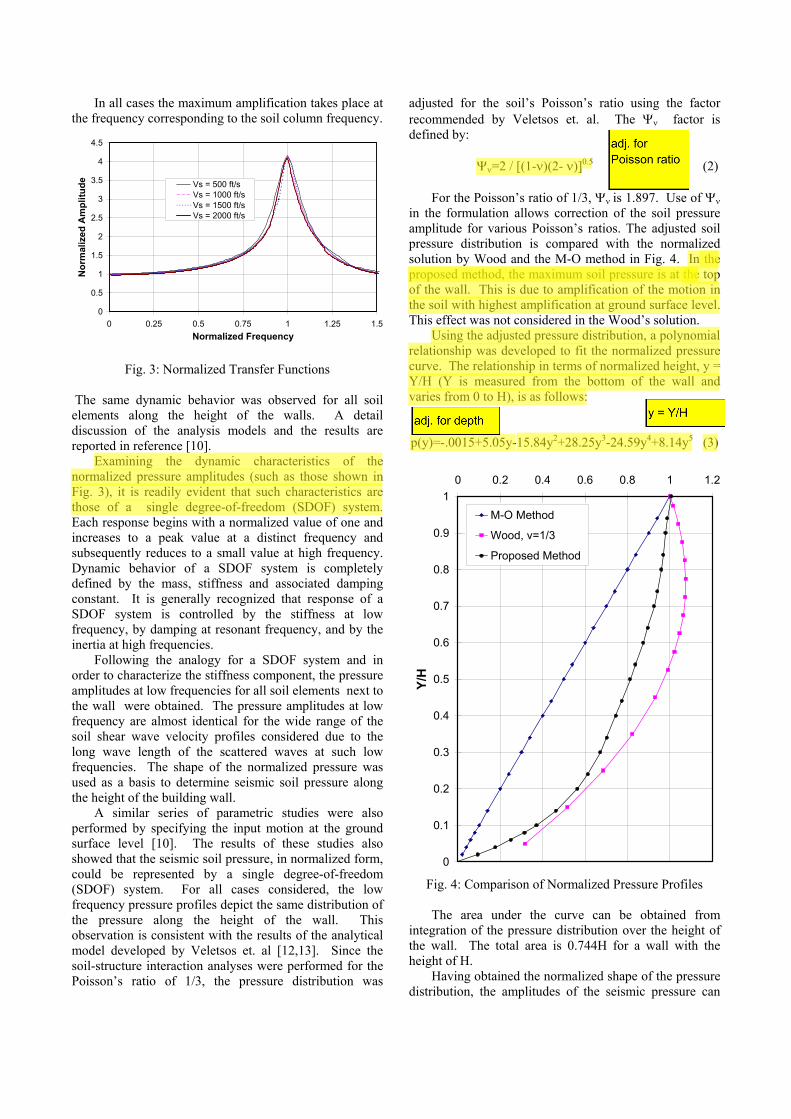
In all cases the maximum amplification takes place at the frequency corresponding to the soil column frequency.
0
0.5
1
1.5
2
2.5
3
3.5
4
4.5
0 0.25 0.5 0.75 1 1.25 1.5Normalized Frequency
Nor
mal
ized
Am
plitu
de Vs = 500 ft/sVs = 1000 ft/sVs = 1500 ft/sVs = 2000 ft/s
Fig. 3: Normalized Transfer Functions The same dynamic behavior was observed for all soil elements along the height of the walls. A detail discussion of the analysis models and the results are reported in reference [10]. Examining the dynamic characteristics of the normalized pressure amplitudes (such as those shown in Fig. 3), it is readily evident that such characteristics are those of a single degree-of-freedom (SDOF) system. Each response begins with a normalized value of one and increases to a peak value at a distinct frequency and subsequently reduces to a small value at high frequency. Dynamic behavior of a SDOF system is completely defined by the mass, stiffness and associated damping constant. It is generally recognized that response of a SDOF system is controlled by the stiffness at low frequency, by damping at resonant frequency, and by the inertia at high frequencies. Following the analogy for a SDOF system and in order to characterize the stiffness component, the pressure amplitudes at low frequencies for all soil elements next to the wall were obtained. The pressure amplitudes at low frequency are almost identical for the wide range of the soil shear wave velocity profiles considered due to the long wave length of the scattered waves at such low frequencies. The shape of the normalized pressure was used as a basis to determine seismic soil pressure along the height of the building wall.
A similar series of parametric studies were also performed by specifying the input motion at the ground surface level [10]. The results of these studies also showed that the seismic soil pressure, in normalized form, could be represented by a single degree-of-freedom (SDOF) system. For all cases considered, the low frequency pressure profiles depict the same distribution of the pressure along the height of the wall. This observation is consistent with the results of the analytical model developed by Veletsos et. al [12,13]. Since the soil-structure interaction analyses were performed for the Poisson’s ratio of 1/3, the pressure distribution was
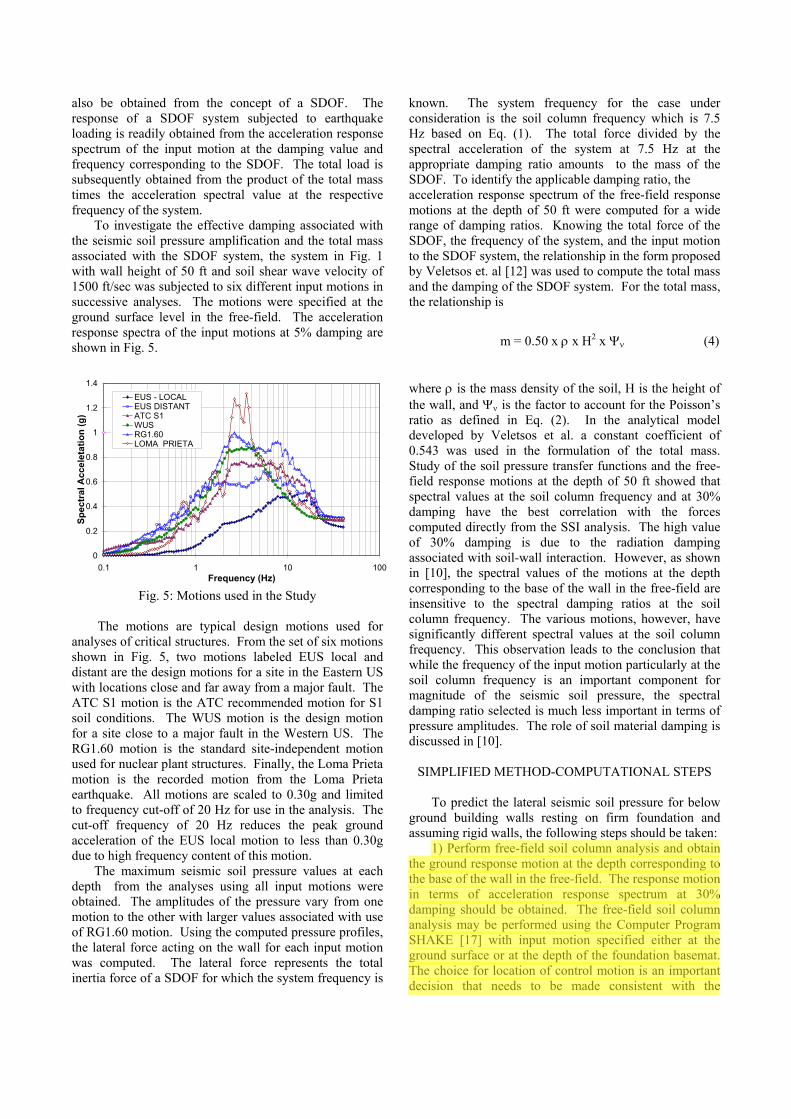
adjusted for the soil’s Poisson’s ratio using the factor recommended by Veletsos et. al. The Ψν factor is defined by: Ψν=2 / [(1-ν)(2- ν)]0.5 (2) For the Poisson’s ratio of 1/3, Ψν is 1.897. Use of Ψν in the formulation allows correction of the soil pressure amplitude for various Poisson’s ratios. The adjusted soil pressure distribution is compared with the normalized solution by Wood and the M-O method in Fig. 4. In the proposed method, the maximum soil pressure is at the top of the wall. This is due to amplification of the motion in the soil with highest amplification at ground surface level. This effect was not considered in the Wood’s solution. Using the adjusted pressure distribution, a polynomial relationship was developed to fit the normalized pressure curve. The relationship in terms of normalized height, y = Y/H (Y is measured from the bottom of the wall and varies from 0 to H), is as follows:
p(y)=-.0015+5.05y-15.84y2+28.25y3-24.59y4+8.14y5 (3)
0
0.1
0.2
0.3
0.4
0.5
0.6
0.7
0.8
0.9
10 0.2 0.4 0.6 0.8 1 1.2
Y/H
M-O Method
Wood, v=1/3
Proposed Method
Fig. 4: Comparison of Normalized Pressure Profiles
The area under the curve can be obtained from integration of the pressure distribution over the height of the wall. The total area is 0.744H for a wall with the height of H. Having obtained the normalized shape of the pressure distribution, the amplitudes of the seismic pressure can
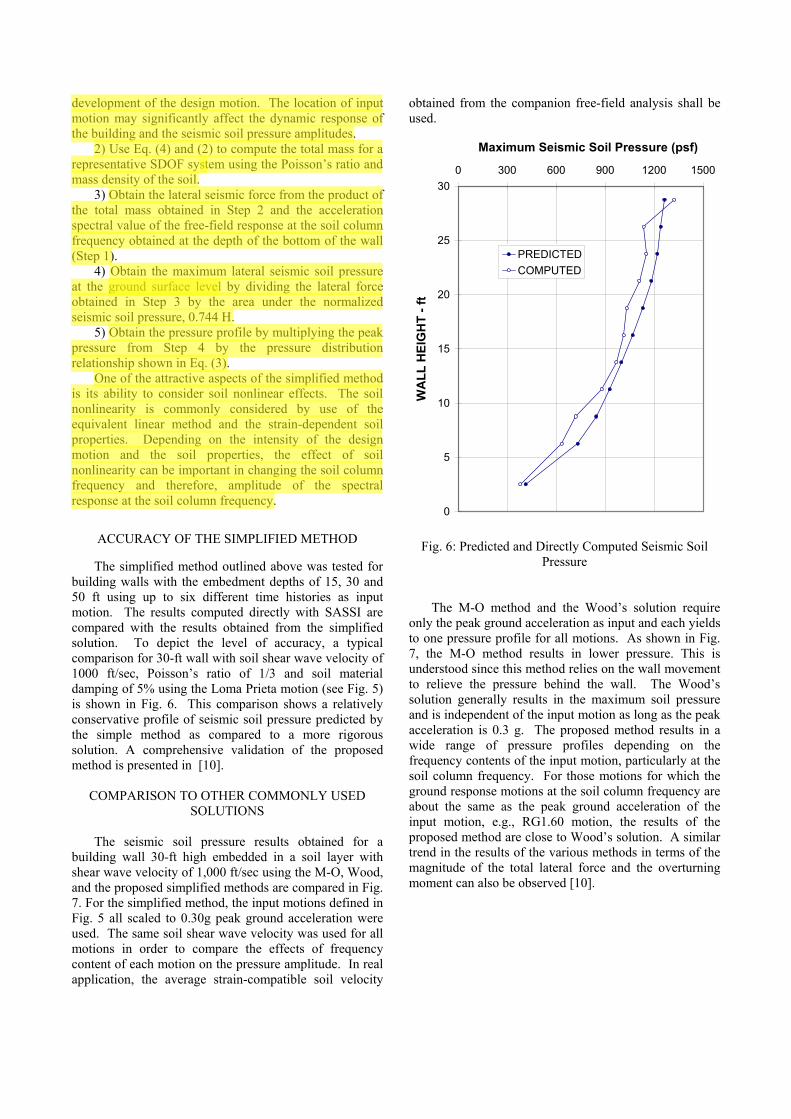
also be obtained from the concept of a SDOF. The response of a SDOF system subjected to earthquake loading is readily obtained from the acceleration response spectrum of the input motion at the damping value and frequency corresponding to the SDOF. The total load is subsequently obtained from the product of the total mass times the acceleration spectral value at the respective frequency of the system. To investigate the effective damping associated with the seismic soil pressure amplification and the total mass associated with the SDOF system, the system in Fig. 1 with wall height of 50 ft and soil shear wave velocity of 1500 ft/sec was subjected to six different input motions in successive analyses. The motions were specified at the ground surface level in the free-field. The acceleration response spectra of the input motions at 5% damping are shown in Fig. 5.
0
0.2
0.4
0.6
0.8
1
1.2
1.4
0.1 1 10 100Frequency (Hz)
Spec
tral
Acc
elet
atio
n (g
)
EUS - LOCALEUS DISTANTATC S1WUSRG1.60LOMA PRIETA
Fig. 5: Motions used in the Study
The motions are typical design motions used for analyses of critical structures. From the set of six motions shown in Fig. 5, two motions labeled EUS local and distant are the design motions for a site in the Eastern US with locations close and far away from a major fault. The ATC S1 motion is the ATC recommended motion for S1 soil conditions. The WUS motion is the design motion for a site close to a major fault in the Western US. The RG1.60 motion is the standard site-independent motion used for nuclear plant structures. Finally, the Loma Prieta motion is the recorded motion from the Loma Prieta earthquake. All motions are scaled to 0.30g and limited to frequency cut-off of 20 Hz for use in the analysis. The cut-off frequency of 20 Hz reduces the peak ground acceleration of the EUS local motion to less than 0.30g due to high frequency content of this motion. The maximum seismic soil pressure values at each depth from the analyses using all input motions were obtained. The amplitudes of the pressure vary from one motion to the other with larger values associated with use of RG1.60 motion. Using the computed pressure profiles, the lateral force acting on the wall for each input motion was computed. The lateral force represents the total inertia force of a SDOF for which the system frequency is
known. The system frequency for the case under consideration is the soil column frequency which is 7.5 Hz based on Eq. (1). The total force divided by the spectral acceleration of the system at 7.5 Hz at the appropriate damping ratio amounts to the mass of the SDOF. To identify the applicable damping ratio, the acceleration response spectrum of the free-field response motions at the depth of 50 ft were computed for a wide range of damping ratios. Knowing the total force of the SDOF, the frequency of the system, and the input motion to the SDOF system, the relationship in the form proposed by Veletsos et. al [12] was used to compute the total mass and the damping of the SDOF system. For the total mass, the relationship is
m = 0.50 x ρ x H2 x Ψν (4)
where ρ is the mass density of the soil, H is the height of the wall, and Ψν is the factor to account for the Poisson’s ratio as defined in Eq. (2). In the analytical model developed by Veletsos et al. a constant coefficient of 0.543 was used in the formulation of the total mass. Study of the soil pressure transfer functions and the free-field response motions at the depth of 50 ft showed that spectral values at the soil column frequency and at 30% damping have the best correlation with the forces computed directly from the SSI analysis. The high value of 30% damping is due to the radiation damping associated with soil-wall interaction. However, as shown in [10], the spectral values of the motions at the depth corresponding to the base of the wall in the free-field are insensitive to the spectral damping ratios at the soil column frequency. The various motions, however, have significantly different spectral values at the soil column frequency. This observation leads to the conclusion that while the frequency of the input motion particularly at the soil column frequency is an important component for magnitude of the seismic soil pressure, the spectral damping ratio selected is much less important in terms of pressure amplitudes. The role of soil material damping is discussed in [10].
SIMPLIFIED METHOD-COMPUTATIONAL STEPS To predict the lateral seismic soil pressure for below ground building walls resting on firm foundation and assuming rigid walls, the following steps should be taken: 1) Perform free-field soil column analysis and obtain the ground response motion at the depth corresponding to the base of the wall in the free-field. The response motion in terms of acceleration response spectrum at 30% damping should be obtained. The free-field soil column analysis may be performed using the Computer Program SHAKE [17] with input motion specified either at the ground surface or at the depth of the foundation basemat. The choice for location of control motion is an important decision that needs to be made consistent with the
development of the design motion. The location of input motion may significantly affect the dynamic response of the building and the seismic soil pressure amplitudes. 2) Use Eq. (4) and (2) to compute the total mass for a representative SDOF system using the Poisson’s ratio and mass density of the soil. 3) Obtain the lateral seismic force from the product of the total mass obtained in Step 2 and the acceleration spectral value of the free-field response at the soil column frequency obtained at the depth of the bottom of the wall (Step 1). 4) Obtain the maximum lateral seismic soil pressure at the ground surface level by dividing the lateral force obtained in Step 3 by the area under the normalized seismic soil pressure, 0.744 H. 5) Obtain the pressure profile by multiplying the peak pressure from Step 4 by the pressure distribution relationship shown in Eq. (3). One of the attractive aspects of the simplified method is its ability to consider soil nonlinear effects. The soil nonlinearity is commonly considered by use of the equivalent linear method and the strain-dependent soil properties. Depending on the intensity of the design motion and the soil properties, the effect of soil nonlinearity can be important in changing the soil column frequency and therefore, amplitude of the spectral response at the soil column frequency.
ACCURACY OF THE SIMPLIFIED METHOD
The simplified method outlined above was tested for building walls with the embedment depths of 15, 30 and 50 ft using up to six different time histories as input motion. The results computed directly with SASSI are compared with the results obtained from the simplified solution. To depict the level of accuracy, a typical comparison for 30-ft wall with soil shear wave velocity of 1000 ft/sec, Poisson’s ratio of 1/3 and soil material damping of 5% using the Loma Prieta motion (see Fig. 5) is shown in Fig. 6. This comparison shows a relatively conservative profile of seismic soil pressure predicted by the simple method as compared to a more rigorous solution. A comprehensive validation of the proposed method is presented in [10].
COMPARISON TO OTHER COMMONLY USED
SOLUTIONS
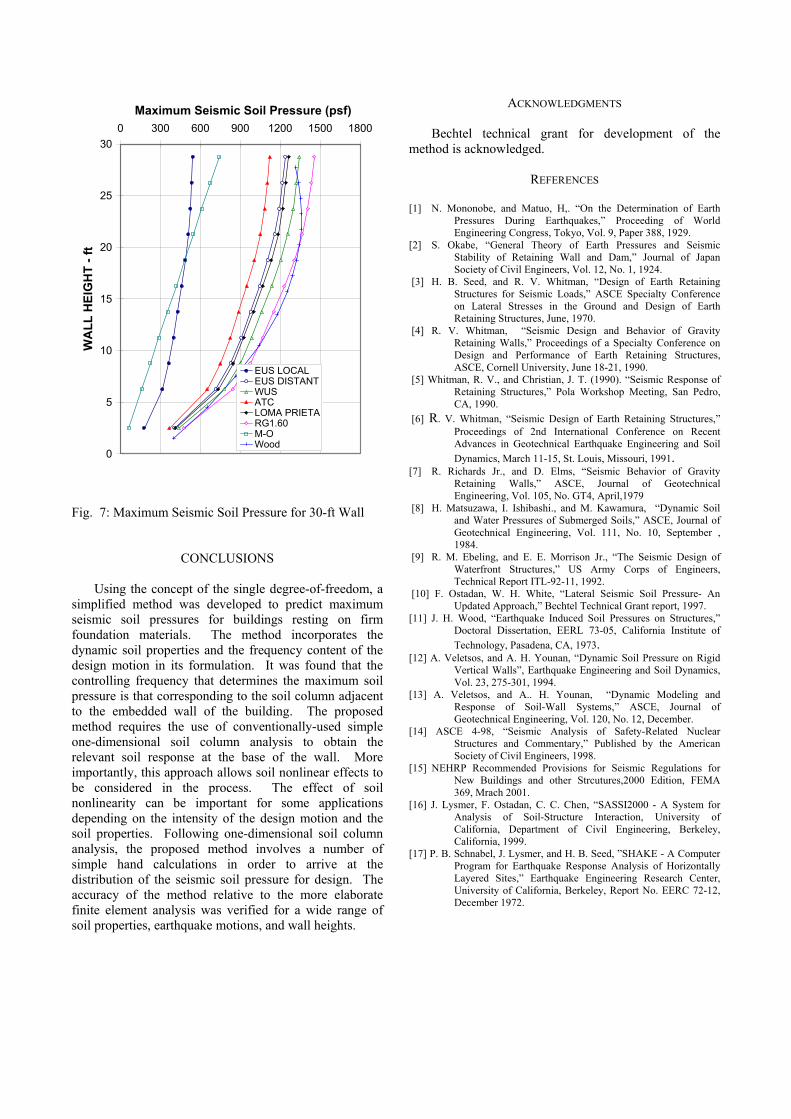
The seismic soil pressure results obtained for a building wall 30-ft high embedded in a soil layer with shear wave velocity of 1,000 ft/sec using the M-O, Wood, and the proposed simplified methods are compared in Fig. 7. For the simplified method, the input motions defined in Fig. 5 all scaled to 0.30g peak ground acceleration were used. The same soil shear wave velocity was used for all motions in order to compare the effects of frequency content of each motion on the pressure amplitude. In real application, the average strain-compatible soil velocity
obtained from the companion free-field analysis shall be used.
Maximum Seismic Soil Pressure (psf)
0
5
10
15
20
25
300 300 600 900 1200 1500
WA
LL H
EIG
HT
- ft
PREDICTEDCOMPUTED
Fig. 6: Predicted and Directly Computed Seismic Soil Pressure
The M-O method and the Wood’s solution require only the peak ground acceleration as input and each yields to one pressure profile for all motions. As shown in Fig. 7, the M-O method results in lower pressure. This is understood since this method relies on the wall movement to relieve the pressure behind the wall. The Wood’s solution generally results in the maximum soil pressure and is independent of the input motion as long as the peak acceleration is 0.3 g. The proposed method results in a wide range of pressure profiles depending on the frequency contents of the input motion, particularly at the soil column frequency. For those motions for which the ground response motions at the soil column frequency are about the same as the peak ground acceleration of the input motion, e.g., RG1.60 motion, the results of the proposed method are close to Wood’s solution. A similar trend in the results of the various methods in terms of the magnitude of the total lateral force and the overturning moment can also be observed [10].
ACKNOWLEDGMENTS Maximum Seismic Soil Pressure (psf)
0
5
10
15
20
25
300 300 600 900 1200 1500 1800
WA
LL H
EIG
HT
- ft
EUS LOCALEUS DISTANTWUSATCLOMA PRIETARG1.60M-OWood
Bechtel technical grant for development of the method is acknowledged.
REFERENCES [1] N. Mononobe, and Matuo, H,. “On the Determination of Earth
Pressures During Earthquakes,” Proceeding of World Engineering Congress, Tokyo, Vol. 9, Paper 388, 1929.
[2] S. Okabe, “General Theory of Earth Pressures and Seismic Stability of Retaining Wall and Dam,” Journal of Japan Society of Civil Engineers, Vol. 12, No. 1, 1924.
[3] H. B. Seed, and R. V. Whitman, “Design of Earth Retaining Structures for Seismic Loads,” ASCE Specialty Conference on Lateral Stresses in the Ground and Design of Earth Retaining Structures, June, 1970.
[4] R. V. Whitman, “Seismic Design and Behavior of Gravity Retaining Walls,” Proceedings of a Specialty Conference on Design and Performance of Earth Retaining Structures, ASCE, Cornell University, June 18-21, 1990.
[5] Whitman, R. V., and Christian, J. T. (1990). “Seismic Response of Retaining Structures,” Pola Workshop Meeting, San Pedro, CA, 1990.
[6] R. V. Whitman, “Seismic Design of Earth Retaining Structures,” Proceedings of 2nd International Conference on Recent Advances in Geotechnical Earthquake Engineering and Soil Dynamics, March 11-15, St. Louis, Missouri, 1991.
[7] R. Richards Jr., and D. Elms, “Seismic Behavior of Gravity Retaining Walls,” ASCE, Journal of Geotechnical Engineering, Vol. 105, No. GT4, April,1979
[8] H. Matsuzawa, I. Ishibashi., and M. Kawamura, “Dynamic Soil and Water Pressures of Submerged Soils,” ASCE, Journal of Geotechnical Engineering, Vol. 111, No. 10, September , 1984.
Fig. 7: Maximum Seismic Soil Pressure for 30-ft Wall
CONCLUSIONS [9] R. M. Ebeling, and E. E. Morrison Jr., “The Seismic Design of Waterfront Structures,” US Army Corps of Engineers, Technical Report ITL-92-11, 1992.
Using the concept of the single degree-of-freedom, a simplified method was developed to predict maximum seismic soil pressures for buildings resting on firm foundation materials. The method incorporates the dynamic soil properties and the frequency content of the design motion in its formulation. It was found that the controlling frequency that determines the maximum soil pressure is that corresponding to the soil column adjacent to the embedded wall of the building. The proposed method requires the use of conventionally-used simple one-dimensional soil column analysis to obtain the relevant soil response at the base of the wall. More importantly, this approach allows soil nonlinear effects to be considered in the process. The effect of soil nonlinearity can be important for some applications depending on the intensity of the design motion and the soil properties. Following one-dimensional soil column analysis, the proposed method involves a number of simple hand calculations in order to arrive at the distribution of the seismic soil pressure for design. The accuracy of the method relative to the more elaborate finite element analysis was verified for a wide range of soil properties, earthquake motions, and wall heights.
[10] F. Ostadan, W. H. White, “Lateral Seismic Soil Pressure- An Updated Approach,” Bechtel Technical Grant report, 1997.
[11] J. H. Wood, “Earthquake Induced Soil Pressures on Structures,” Doctoral Dissertation, EERL 73-05, California Institute of Technology, Pasadena, CA, 1973.
[12] A. Veletsos, and A. H. Younan, “Dynamic Soil Pressure on Rigid Vertical Walls”, Earthquake Engineering and Soil Dynamics, Vol. 23, 275-301, 1994.
[13] A. Veletsos, and A.. H. Younan, “Dynamic Modeling and Response of Soil-Wall Systems,” ASCE, Journal of Geotechnical Engineering, Vol. 120, No. 12, December.
[14] ASCE 4-98, “Seismic Analysis of Safety-Related Nuclear Structures and Commentary,” Published by the American Society of Civil Engineers, 1998.
[15] NEHRP Recommended Provisions for Seismic Regulations for New Buildings and other Strcutures,2000 Edition, FEMA 369, Mrach 2001.
[16] J. Lysmer, F. Ostadan, C. C. Chen, “SASSI2000 - A System for Analysis of Soil-Structure Interaction, University of California, Department of Civil Engineering, Berkeley, California, 1999.
[17] P. B. Schnabel, J. Lysmer, and H. B. Seed, ”SHAKE - A Computer Program for Earthquake Response Analysis of Horizontally Layered Sites,” Earthquake Engineering Research Center, University of California, Berkeley, Report No. EERC 72-12, December 1972.