Embed Size (px)
Citation preview
Study on Implementation of
Integrated Spatial Plan for
The Mamminasata Metropolitan Area
SECTOR STUDY (6)
TRADE AND INVESTMENT STUDY
KRI International Corp.
Nippon Koei Co., Ltd
THE STUDY ON IMPLEMENTATION OF INTEGRATED SPATIAL PLAN FOR THE MAMMINASATA METROPOLITAN AREA
Sector Study (6)TRADE AND INVESTMENT STUDY
Table of Contents
1. PRESENT CONDITION................................................................................................... 1
1.1. Trade .......................................................................................................................... 1
1.2. Investment Promotion................................................................................................ 7
2. ISSUES TO BE ADDRESSED ........................................................................................ 14
2.1. Issues in Trade ......................................................................................................... 14
2.2. Issues in Investment................................................................................................. 15
3. TARGET AND SRATEGY.............................................................................................. 19
3.1. Trade ........................................................................................................................ 19
3.2. Investment................................................................................................................ 20
3.3. Strategies.................................................................................................................. 21
4. ACTION PROGRAMS.................................................................................................... 24
THE STUDY ON IMPLEMENTATION OF INTEGRATED SPATIAL PLAN FOR THE MAMMINASATA METROPOLITAN AREA
Sector Study (6)TRADE AND INVESTMENT STUDY
6-1
1. PRESENT CONDITION
1.1. Trade
1) Contribution to GRDP
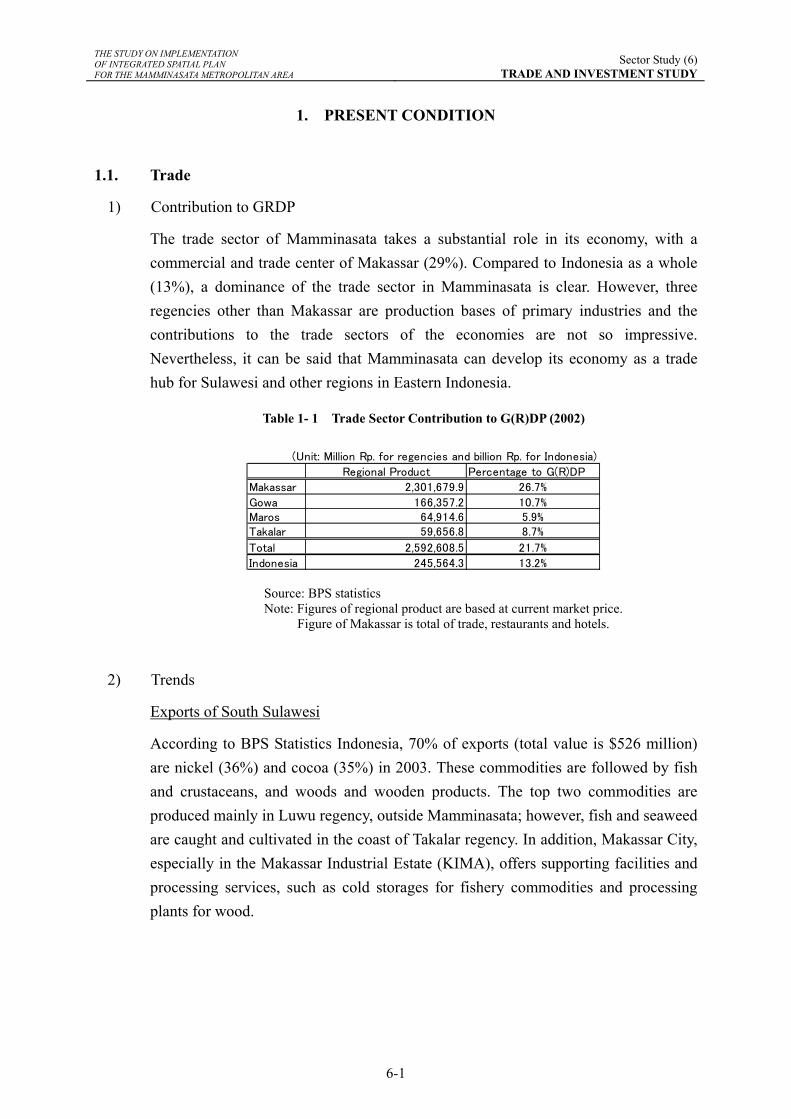
The trade sector of Mamminasata takes a substantial role in its economy, with a commercial and trade center of Makassar (29%). Compared to Indonesia as a whole (13%), a dominance of the trade sector in Mamminasata is clear. However, three regencies other than Makassar are production bases of primary industries and the contributions to the trade sectors of the economies are not so impressive. Nevertheless, it can be said that Mamminasata can develop its economy as a trade hub for Sulawesi and other regions in Eastern Indonesia.
Table 1- 1 Trade Sector Contribution to G(R)DP (2002)
Regional Product Percentage to G(R)DP
Makassar 2,301,679.9 26.7%
Gowa 166,357.2 10.7%Maros 64,914.6 5.9%Takalar 59,656.8 8.7%
Total 2,592,608.5 21.7%
Indonesia 245,564.3 13.2%
(Unit: Million Rp. for regencies and billion Rp. for Indonesia)
Source: BPS statistics Note: Figures of regional product are based at current market price. Figure of Makassar is total of trade, restaurants and hotels.
2) Trends
Exports of South Sulawesi
According to BPS Statistics Indonesia, 70% of exports (total value is $526 million) are nickel (36%) and cocoa (35%) in 2003. These commodities are followed by fish and crustaceans, and woods and wooden products. The top two commodities are produced mainly in Luwu regency, outside Mamminasata; however, fish and seaweed are caught and cultivated in the coast of Takalar regency. In addition, Makassar City, especially in the Makassar Industrial Estate (KIMA), offers supporting facilities and processing services, such as cold storages for fishery commodities and processing plants for wood.
THE STUDY ON IMPLEMENTATION OF INTEGRATED SPATIAL PLAN FOR THE MAMMINASATA METROPOLITAN AREA
Sector Study (6)TRADE AND INVESTMENT STUDY
6-2
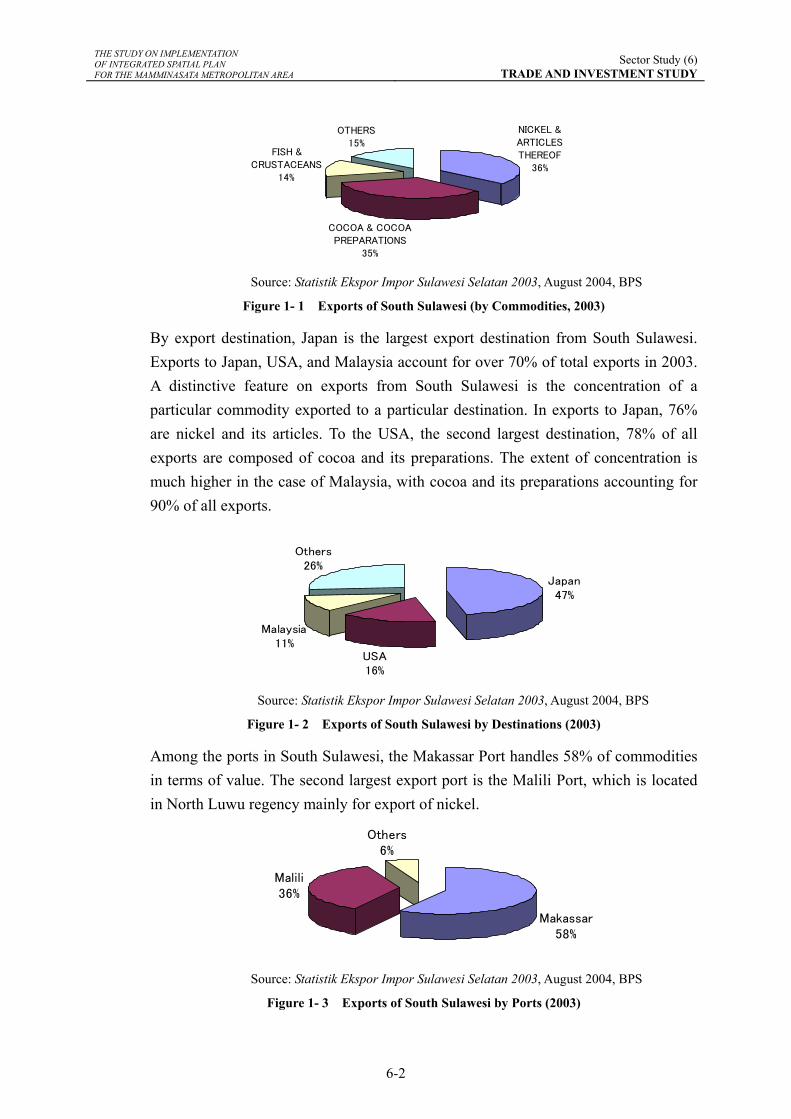
NICKEL &ARTICLESTHEREOF
36%
FISH &CRUSTACEANS
14%
OTHERS15%
COCOA & COCOAPREPARATIONS
35% Source: Statistik Ekspor Impor Sulawesi Selatan 2003, August 2004, BPS
Figure 1- 1 Exports of South Sulawesi (by Commodities, 2003)
By export destination, Japan is the largest export destination from South Sulawesi. Exports to Japan, USA, and Malaysia account for over 70% of total exports in 2003. A distinctive feature on exports from South Sulawesi is the concentration of a particular commodity exported to a particular destination. In exports to Japan, 76% are nickel and its articles. To the USA, the second largest destination, 78% of all exports are composed of cocoa and its preparations. The extent of concentration is much higher in the case of Malaysia, with cocoa and its preparations accounting for 90% of all exports.
Japan47%
USA16%
Malaysia11%
Others26%
Source: Statistik Ekspor Impor Sulawesi Selatan 2003, August 2004, BPS
Figure 1- 2 Exports of South Sulawesi by Destinations (2003)
Among the ports in South Sulawesi, the Makassar Port handles 58% of commodities in terms of value. The second largest export port is the Malili Port, which is located in North Luwu regency mainly for export of nickel.
Makassar58%
Malili36%
Others6%
Source: Statistik Ekspor Impor Sulawesi Selatan 2003, August 2004, BPS
Figure 1- 3 Exports of South Sulawesi by Ports (2003)
THE STUDY ON IMPLEMENTATION OF INTEGRATED SPATIAL PLAN FOR THE MAMMINASATA METROPOLITAN AREA
Sector Study (6)TRADE AND INVESTMENT STUDY
6-3
Imports to South Sulawesi
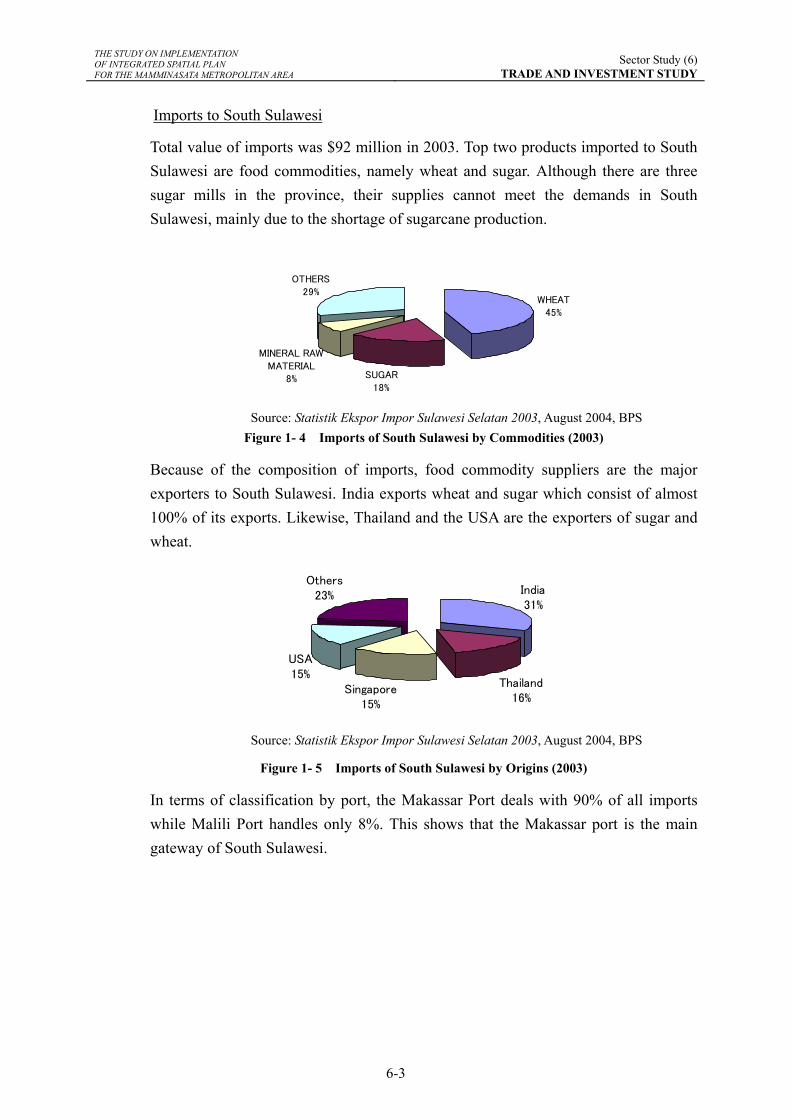
Total value of imports was $92 million in 2003. Top two products imported to South Sulawesi are food commodities, namely wheat and sugar. Although there are three sugar mills in the province, their supplies cannot meet the demands in South Sulawesi, mainly due to the shortage of sugarcane production.
WHEAT45%
SUGAR18%
MINERAL RAWMATERIAL
8%
OTHERS29%
Source: Statistik Ekspor Impor Sulawesi Selatan 2003, August 2004, BPS
Figure 1- 4 Imports of South Sulawesi by Commodities (2003)
Because of the composition of imports, food commodity suppliers are the major exporters to South Sulawesi. India exports wheat and sugar which consist of almost 100% of its exports. Likewise, Thailand and the USA are the exporters of sugar and wheat.
India31%
Thailand16%
Singapore15%
USA15%
Others23%
Source: Statistik Ekspor Impor Sulawesi Selatan 2003, August 2004, BPS
Figure 1- 5 Imports of South Sulawesi by Origins (2003)
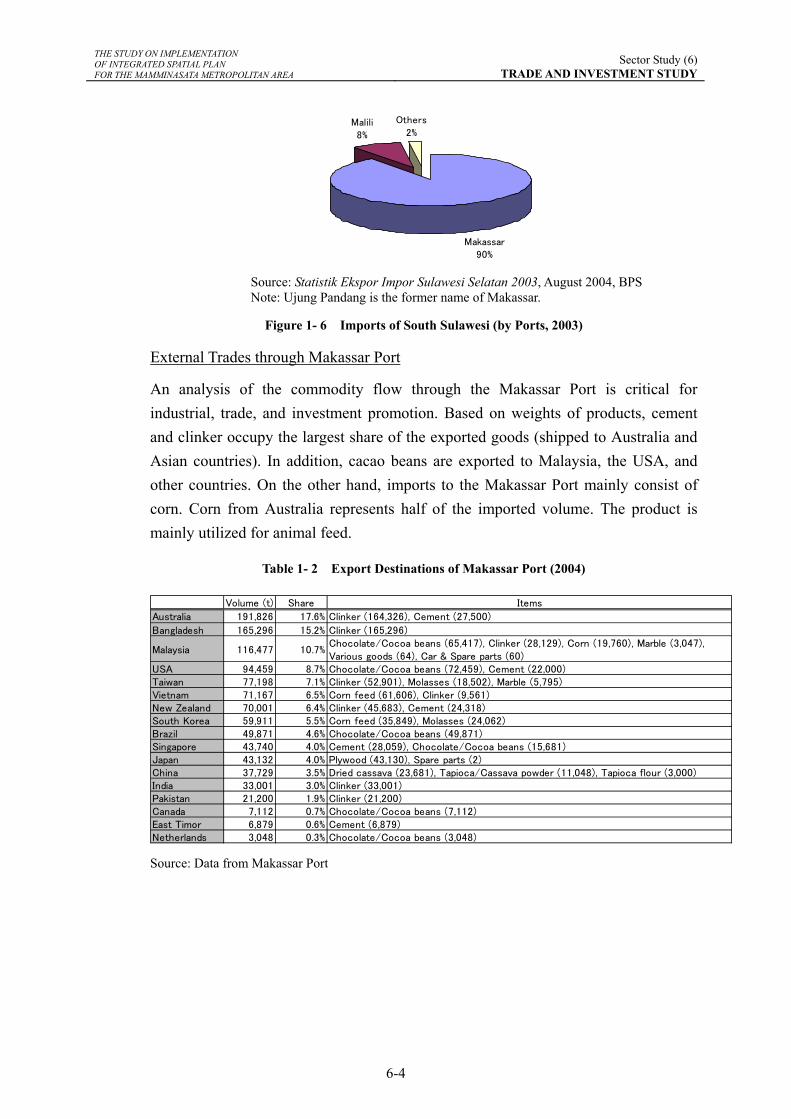
In terms of classification by port, the Makassar Port deals with 90% of all imports while Malili Port handles only 8%. This shows that the Makassar port is the main gateway of South Sulawesi.
THE STUDY ON IMPLEMENTATION OF INTEGRATED SPATIAL PLAN FOR THE MAMMINASATA METROPOLITAN AREA
Sector Study (6)TRADE AND INVESTMENT STUDY
6-4
Makassar90%
Malili8%
Others2%
Source: Statistik Ekspor Impor Sulawesi Selatan 2003, August 2004, BPS Note: Ujung Pandang is the former name of Makassar.
Figure 1- 6 Imports of South Sulawesi (by Ports, 2003)
External Trades through Makassar Port
An analysis of the commodity flow through the Makassar Port is critical for industrial, trade, and investment promotion. Based on weights of products, cement and clinker occupy the largest share of the exported goods (shipped to Australia and Asian countries). In addition, cacao beans are exported to Malaysia, the USA, and other countries. On the other hand, imports to the Makassar Port mainly consist of corn. Corn from Australia represents half of the imported volume. The product is mainly utilized for animal feed.
Table 1- 2 Export Destinations of Makassar Port (2004)
Volume (t) Share Items
Australia 191,826 17.6% Clinker (164,326), Cement (27,500)
Bangladesh 165,296 15.2% Clinker (165,296)
Malaysia 116,477 10.7%Chocolate/Cocoa beans (65,417), Clinker (28,129), Corn (19,760), Marble (3,047),Various goods (64), Car & Spare parts (60)
USA 94,459 8.7% Chocolate/Cocoa beans (72,459), Cement (22,000)Taiwan 77,198 7.1% Clinker (52,901), Molasses (18,502), Marble (5,795)Vietnam 71,167 6.5% Corn feed (61,606), Clinker (9,561)New Zealand 70,001 6.4% Clinker (45,683), Cement (24,318)South Korea 59,911 5.5% Corn feed (35,849), Molasses (24,062)Brazil 49,871 4.6% Chocolate/Cocoa beans (49,871)Singapore 43,740 4.0% Cement (28,059), Chocolate/Cocoa beans (15,681)Japan 43,132 4.0% Plywood (43,130), Spare parts (2)China 37,729 3.5% Dried cassava (23,681), Tapioca/Cassava powder (11,048), Tapioca flour (3,000)India 33,001 3.0% Clinker (33,001)Pakistan 21,200 1.9% Clinker (21,200)Canada 7,112 0.7% Chocolate/Cocoa beans (7,112)East Timor 6,879 0.6% Cement (6,879)Netherlands 3,048 0.3% Chocolate/Cocoa beans (3,048) Source: Data from Makassar Port
THE STUDY ON IMPLEMENTATION OF INTEGRATED SPATIAL PLAN FOR THE MAMMINASATA METROPOLITAN AREA
Sector Study (6)TRADE AND INVESTMENT STUDY
6-5
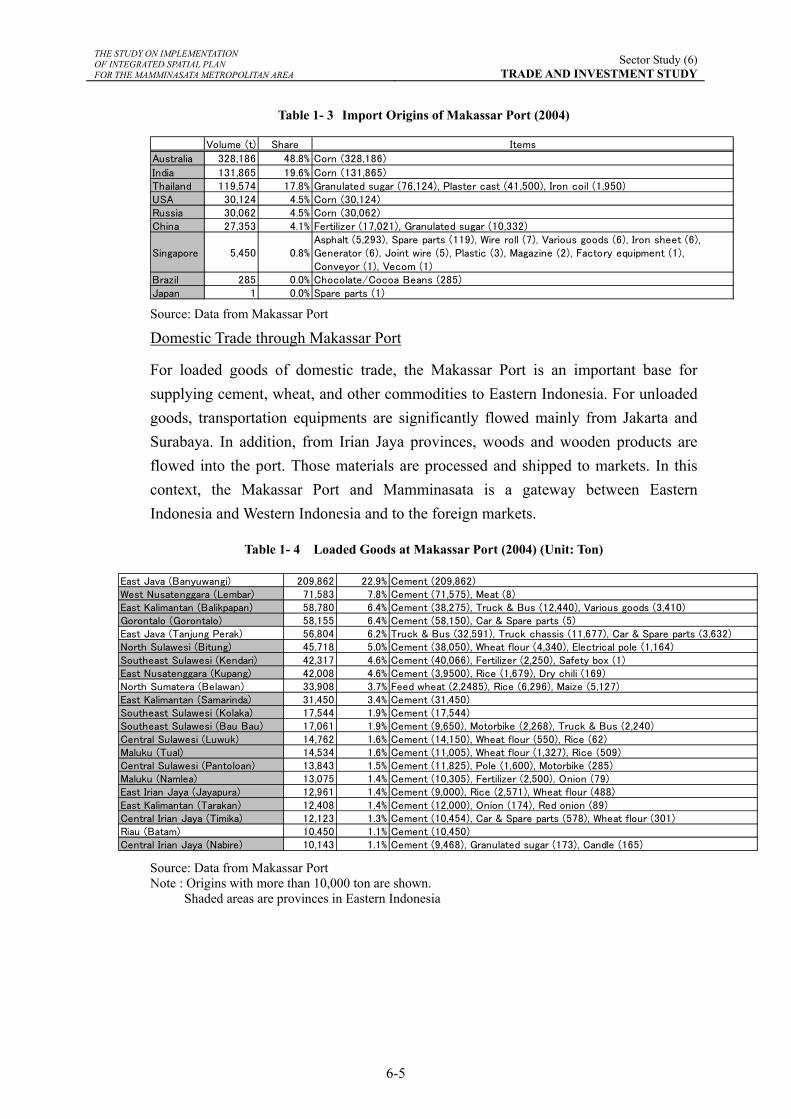
Table 1- 3 Import Origins of Makassar Port (2004)
Volume (t) Share Items
Australia 328,186 48.8% Corn (328,186)
India 131,865 19.6% Corn (131,865)Thailand 119,574 17.8% Granulated sugar (76,124), Plaster cast (41,500), Iron coil (1,950)USA 30,124 4.5% Corn (30,124)Russia 30,062 4.5% Corn (30,062)China 27,353 4.1% Fertilizer (17,021), Granulated sugar (10,332)
Singapore 5,450 0.8%Asphalt (5,293), Spare parts (119), Wire roll (7), Various goods (6), Iron sheet (6),Generator (6), Joint wire (5), Plastic (3), Magazine (2), Factory equipment (1),Conveyor (1), Vecom (1)
Brazil 285 0.0% Chocolate/Cocoa Beans (285)Japan 1 0.0% Spare parts (1) Source: Data from Makassar Port
Domestic Trade through Makassar Port
For loaded goods of domestic trade, the Makassar Port is an important base for supplying cement, wheat, and other commodities to Eastern Indonesia. For unloaded goods, transportation equipments are significantly flowed mainly from Jakarta and Surabaya. In addition, from Irian Jaya provinces, woods and wooden products are flowed into the port. Those materials are processed and shipped to markets. In this context, the Makassar Port and Mamminasata is a gateway between Eastern Indonesia and Western Indonesia and to the foreign markets.
Table 1- 4 Loaded Goods at Makassar Port (2004) (Unit: Ton)
East Java (Banyuwangi) 209,862 22.9% Cement (209,862)West Nusatenggara (Lembar) 71,583 7.8% Cement (71,575), Meat (8)East Kalimantan (Balikpapan) 58,780 6.4% Cement (38,275), Truck & Bus (12,440), Various goods (3,410)Gorontalo (Gorontalo) 58,155 6.4% Cement (58,150), Car & Spare parts (5)East Java (Tanjung Perak) 56,804 6.2% Truck & Bus (32,591), Truck chassis (11,677), Car & Spare parts (3,632)North Sulawesi (Bitung) 45,718 5.0% Cement (38,050), Wheat flour (4,340), Electrical pole (1,164)Southeast Sulawesi (Kendari) 42,317 4.6% Cement (40,066), Fertilizer (2,250), Safety box (1)East Nusatenggara (Kupang) 42,008 4.6% Cement (3,9500), Rice (1,679), Dry chili (169)North Sumatera (Belawan) 33,908 3.7% Feed wheat (2,2485), Rice (6,296), Maize (5,127)East Kalimantan (Samarinda) 31,450 3.4% Cement (31,450)Southeast Sulawesi (Kolaka) 17,544 1.9% Cement (17,544)Southeast Sulawesi (Bau Bau) 17,061 1.9% Cement (9,650), Motorbike (2,268), Truck & Bus (2,240)Central Sulawesi (Luwuk) 14,762 1.6% Cement (14,150), Wheat flour (550), Rice (62)Maluku (Tual) 14,534 1.6% Cement (11,005), Wheat flour (1,327), Rice (509)Central Sulawesi (Pantoloan) 13,843 1.5% Cement (11,825), Pole (1,600), Motorbike (285)Maluku (Namlea) 13,075 1.4% Cement (10,305), Fertilizer (2,500), Onion (79)East Irian Jaya (Jayapura) 12,961 1.4% Cement (9,000), Rice (2,571), Wheat flour (488)East Kalimantan (Tarakan) 12,408 1.4% Cement (12,000), Onion (174), Red onion (89)Central Irian Jaya (Timika) 12,123 1.3% Cement (10,454), Car & Spare parts (578), Wheat flour (301)Riau (Batam) 10,450 1.1% Cement (10,450)Central Irian Jaya (Nabire) 10,143 1.1% Cement (9,468), Granulated sugar (173), Candle (165)
Source: Data from Makassar Port Note : Origins with more than 10,000 ton are shown. Shaded areas are provinces in Eastern Indonesia
THE STUDY ON IMPLEMENTATION OF INTEGRATED SPATIAL PLAN FOR THE MAMMINASATA METROPOLITAN AREA
Sector Study (6)TRADE AND INVESTMENT STUDY
6-6
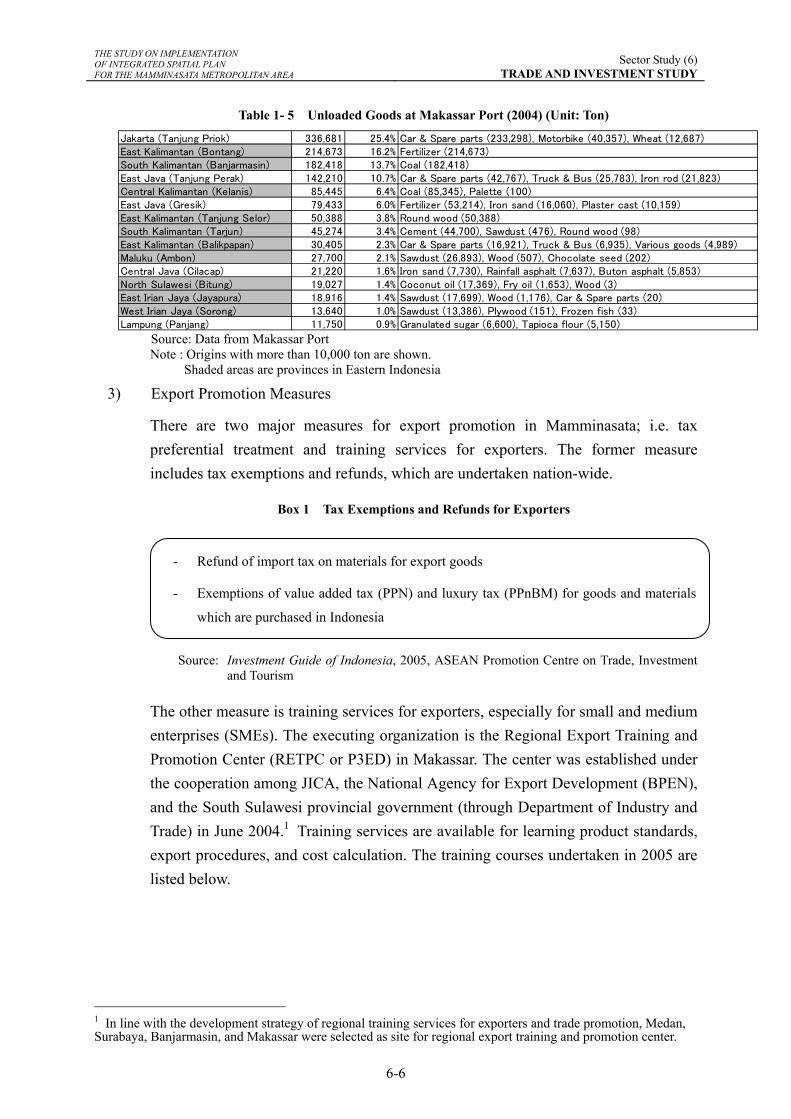
Table 1- 5 Unloaded Goods at Makassar Port (2004) (Unit: Ton)
Jakarta (Tanjung Priok) 336,681 25.4% Car & Spare parts (233,298), Motorbike (40,357), Wheat (12,687)East Kalimantan (Bontang) 214,673 16.2% Fertilizer (214,673)South Kalimantan (Banjarmasin) 182,418 13.7% Coal (182,418)East Java (Tanjung Perak) 142,210 10.7% Car & Spare parts (42,767), Truck & Bus (25,783), Iron rod (21,823)Central Kalimantan (Kelanis) 85,445 6.4% Coal (85,345), Palette (100)East Java (Gresik) 79,433 6.0% Fertilizer (53,214), Iron sand (16,060), Plaster cast (10,159)East Kalimantan (Tanjung Selor) 50,388 3.8% Round wood (50,388)South Kalimantan (Tarjun) 45,274 3.4% Cement (44,700), Sawdust (476), Round wood (98)East Kalimantan (Balikpapan) 30,405 2.3% Car & Spare parts (16,921), Truck & Bus (6,935), Various goods (4,989)Maluku (Ambon) 27,700 2.1% Sawdust (26,893), Wood (507), Chocolate seed (202)Central Java (Cilacap) 21,220 1.6% Iron sand (7,730), Rainfall asphalt (7,637), Buton asphalt (5,853)North Sulawesi (Bitung) 19,027 1.4% Coconut oil (17,369), Fry oil (1,653), Wood (3)East Irian Jaya (Jayapura) 18,916 1.4% Sawdust (17,699), Wood (1,176), Car & Spare parts (20)West Irian Jaya (Sorong) 13,640 1.0% Sawdust (13,386), Plywood (151), Frozen fish (33)Lampung (Panjang) 11,750 0.9% Granulated sugar (6,600), Tapioca flour (5,150) Source: Data from Makassar Port
Note : Origins with more than 10,000 ton are shown. Shaded areas are provinces in Eastern Indonesia
3) Export Promotion Measures
There are two major measures for export promotion in Mamminasata; i.e. tax preferential treatment and training services for exporters. The former measure includes tax exemptions and refunds, which are undertaken nation-wide.
Box 1 Tax Exemptions and Refunds for Exporters
Source: Investment Guide of Indonesia, 2005, ASEAN Promotion Centre on Trade, Investment
and Tourism
The other measure is training services for exporters, especially for small and medium enterprises (SMEs). The executing organization is the Regional Export Training and Promotion Center (RETPC or P3ED) in Makassar. The center was established under the cooperation among JICA, the National Agency for Export Development (BPEN), and the South Sulawesi provincial government (through Department of Industry and Trade) in June 2004.1 Training services are available for learning product standards, export procedures, and cost calculation. The training courses undertaken in 2005 are listed below.
1 In line with the development strategy of regional training services for exporters and trade promotion, Medan, Surabaya, Banjarmasin, and Makassar were selected as site for regional export training and promotion center.
- Refund of import tax on materials for export goods
- Exemptions of value added tax (PPN) and luxury tax (PPnBM) for goods and materials
which are purchased in Indonesia
THE STUDY ON IMPLEMENTATION OF INTEGRATED SPATIAL PLAN FOR THE MAMMINASATA METROPOLITAN AREA
Sector Study (6)TRADE AND INVESTMENT STUDY
6-7
Box 2 Training Courses offered by the RETPC Makassar in 2005
Source: Buku Panduan Program Pelatihan Tahun 2005, Pusat Pelatihan dan Promosi Ekspor Daerah Sulawesi Selatan Note : The duration of these courses are 2 or 3 days.
In addition, the center has a display space, in which exportable goods are displayed for six months, a library holding importer directories and information of foreign markets, and a computer room where one can use internet for searching information on potential buyers.
1.2. Investment Promotion
1) Contribution of investment activities to GRDP
Due to limitation of data, only capital formation in GRDP of South Sulawesi shows an approximation of the contribution of investment activities to GRDP. As shown in the following table, the contribution of capital formation in GRDP had never touched 20 percent for last six years, while Indonesia as a whole had reached that level for three times. Increases in productive and effective investments are needed.
Table 1- 6 Capital Formation in G(R)DP
1999 2000 2001 2002 2003 2004
South Sulawesi 17.2% 15.6% 16.6% 18.8% 18.1% 17.7%Indonesia 20.6% 21.8% 19.2% 19.0% 18.9% 21.0%
Difference -3.4% -6.3% -2.6% -0.2% -0.8% -3.3% Source: BPS statistics
2) Investment Trend
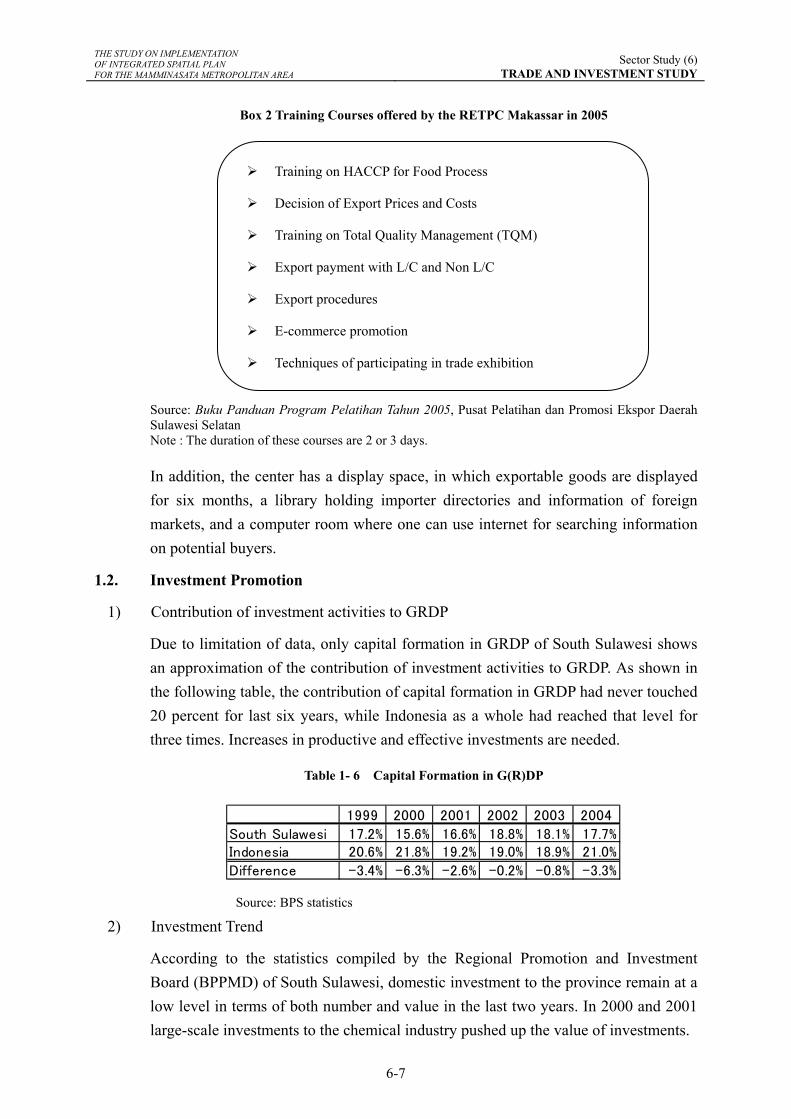
According to the statistics compiled by the Regional Promotion and Investment Board (BPPMD) of South Sulawesi, domestic investment to the province remain at a low level in terms of both number and value in the last two years. In 2000 and 2001 large-scale investments to the chemical industry pushed up the value of investments.
Training on HACCP for Food Process
Decision of Export Prices and Costs
Training on Total Quality Management (TQM)
Export payment with L/C and Non L/C
Export procedures
E-commerce promotion
Techniques of participating in trade exhibition
THE STUDY ON IMPLEMENTATION OF INTEGRATED SPATIAL PLAN FOR THE MAMMINASATA METROPOLITAN AREA
Sector Study (6)TRADE AND INVESTMENT STUDY
6-8
0
2
4
6
8
10
12
14
16
18
1999 2000 2001 2002 2003 2004
0
5,000,000
10,000,000
15,000,000
20,000,000
25,000,000
30,000,000
35,000,000
Number of projects (Left scale) Value of projects (Million Rp.) (Right scale)
Source: BPPMD Note: Figures are realization-base.
Figure 1- 7 Trend of Domestic Investment to South Sulawesi
Chemical
Plantation
Food Transporation
0
1,000,000
2,000,000
3,000,000
4,000,000
5,000,000
1998 1999 2000 2001 2002 2003 2004
(Millio
n R
p.) Chemical
Plantation
Food
Transporation
Other services
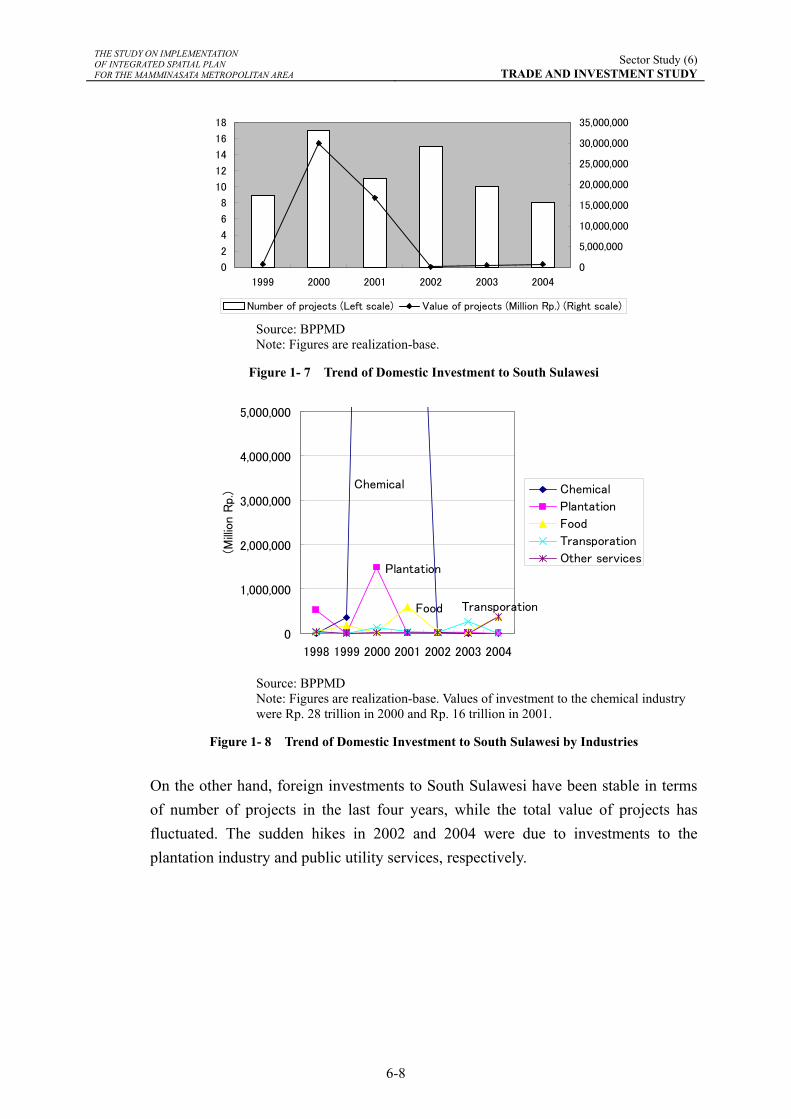
Source: BPPMD Note: Figures are realization-base. Values of investment to the chemical industry were Rp. 28 trillion in 2000 and Rp. 16 trillion in 2001.
Figure 1- 8 Trend of Domestic Investment to South Sulawesi by Industries
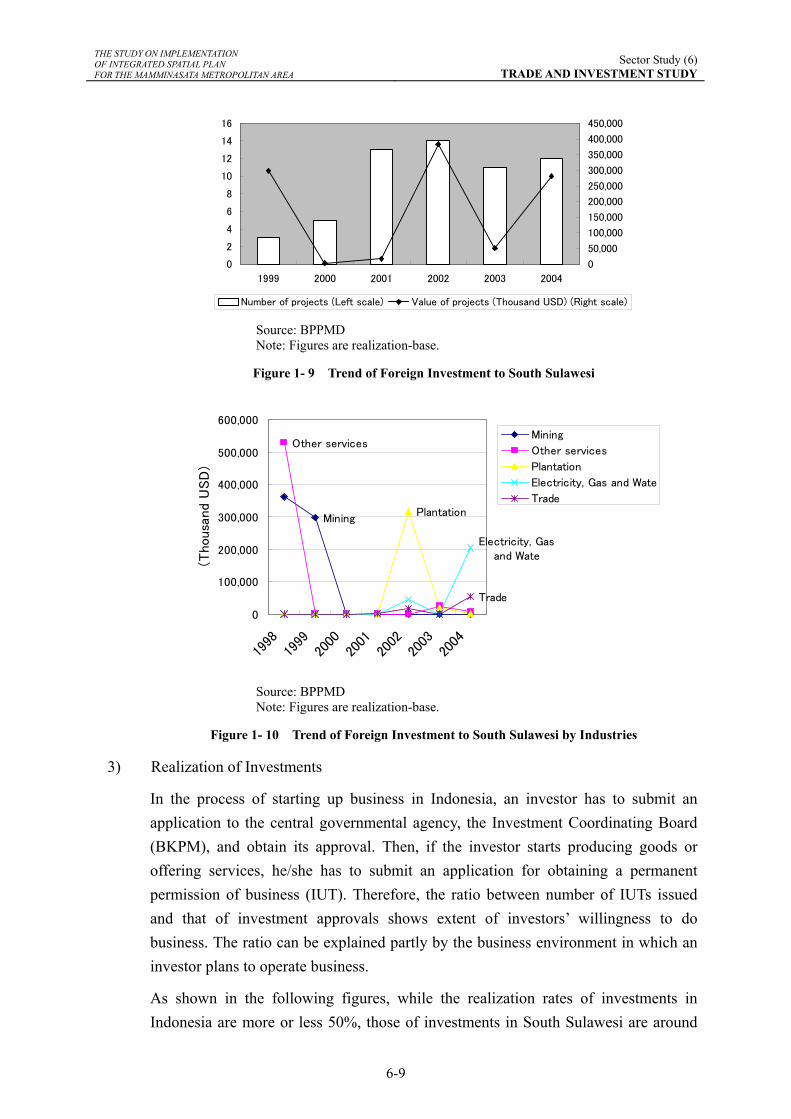
On the other hand, foreign investments to South Sulawesi have been stable in terms of number of projects in the last four years, while the total value of projects has fluctuated. The sudden hikes in 2002 and 2004 were due to investments to the plantation industry and public utility services, respectively.
THE STUDY ON IMPLEMENTATION OF INTEGRATED SPATIAL PLAN FOR THE MAMMINASATA METROPOLITAN AREA
Sector Study (6)TRADE AND INVESTMENT STUDY
6-9
0
2
4
6
8
10
12
14
16
1999 2000 2001 2002 2003 2004
0
50,000
100,000
150,000
200,000
250,000
300,000
350,000
400,000
450,000
Number of projects (Left scale) Value of projects (Thousand USD) (Right scale)
Source: BPPMD Note: Figures are realization-base.
Figure 1- 9 Trend of Foreign Investment to South Sulawesi
Mining
Other services
Plantation
Electricity, Gasand Wate
Trade
0
100,000
200,000
300,000
400,000
500,000
600,000
1998
1999
2000
2001
2002
2003
2004
(Thousa
nd
US
D)
Mining
Other services
Plantation
Electricity, Gas and Wate
Trade
Source: BPPMD Note: Figures are realization-base.
Figure 1- 10 Trend of Foreign Investment to South Sulawesi by Industries
3) Realization of Investments
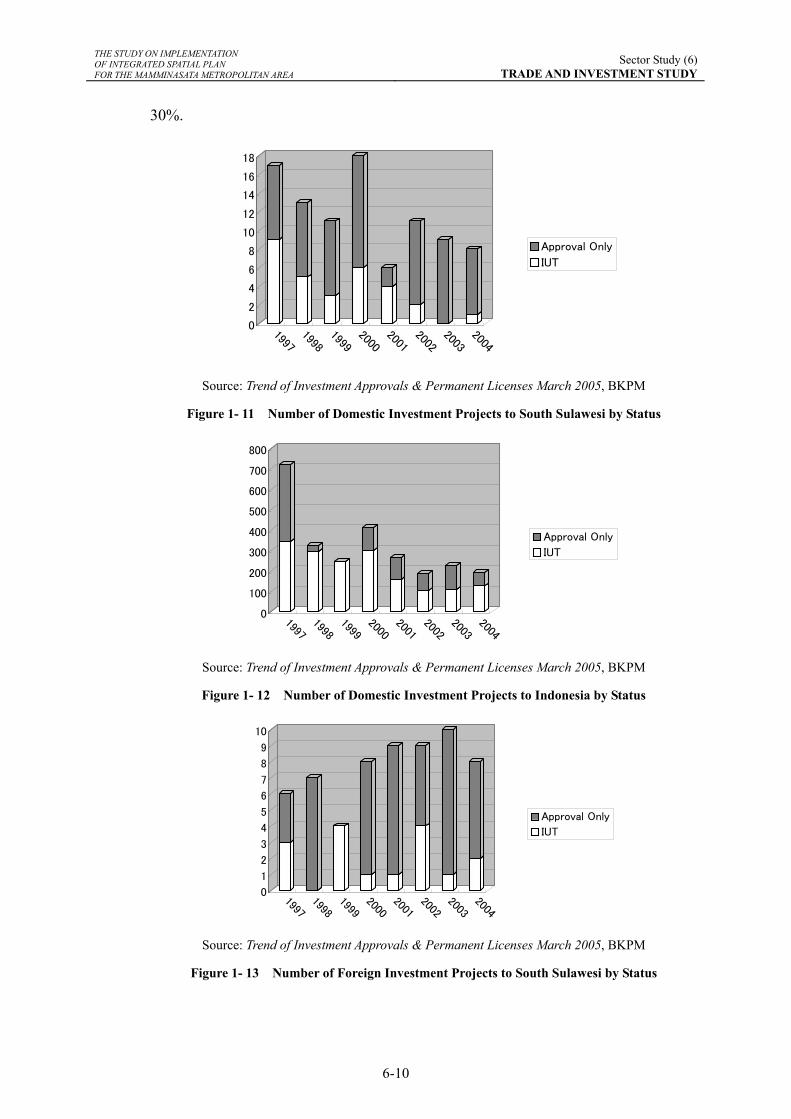
In the process of starting up business in Indonesia, an investor has to submit an application to the central governmental agency, the Investment Coordinating Board (BKPM), and obtain its approval. Then, if the investor starts producing goods or offering services, he/she has to submit an application for obtaining a permanent permission of business (IUT). Therefore, the ratio between number of IUTs issued and that of investment approvals shows extent of investors’ willingness to do business. The ratio can be explained partly by the business environment in which an investor plans to operate business.
As shown in the following figures, while the realization rates of investments in Indonesia are more or less 50%, those of investments in South Sulawesi are around
THE STUDY ON IMPLEMENTATION OF INTEGRATED SPATIAL PLAN FOR THE MAMMINASATA METROPOLITAN AREA
Sector Study (6)TRADE AND INVESTMENT STUDY
6-10
30%.
0
2
4
6
8
10
12
14
16
18
19971998
19992000
20012002
20032004
Approval Only
IUT
Source: Trend of Investment Approvals & Permanent Licenses March 2005, BKPM
Figure 1- 11 Number of Domestic Investment Projects to South Sulawesi by Status
0
100
200
300
400
500
600
700
800
19971998
19992000
20012002
20032004
Approval Only
IUT
Source: Trend of Investment Approvals & Permanent Licenses March 2005, BKPM
Figure 1- 12 Number of Domestic Investment Projects to Indonesia by Status
0
1
2
3
4
5
6
7
8
9
10
19971998
19992000
20012002
20032004
Approval Only
IUT
Source: Trend of Investment Approvals & Permanent Licenses March 2005, BKPM
Figure 1- 13 Number of Foreign Investment Projects to South Sulawesi by Status
THE STUDY ON IMPLEMENTATION OF INTEGRATED SPATIAL PLAN FOR THE MAMMINASATA METROPOLITAN AREA
Sector Study (6)TRADE AND INVESTMENT STUDY
6-11
0
200
400
600
800
1000
1200
1400
1600
19971998
19992000
20012002
20032004
Approval Only
IUT
Source: Trend of Investment Approvals & Permanent Licenses March 2005, BKPM
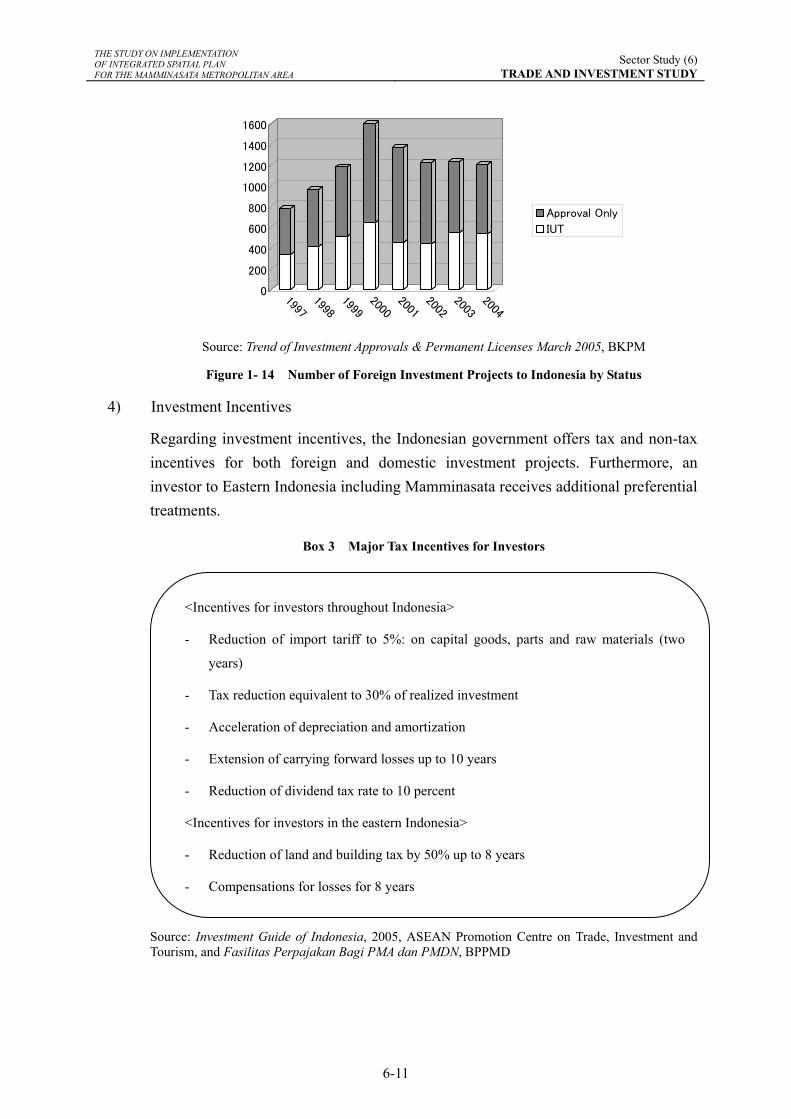
Figure 1- 14 Number of Foreign Investment Projects to Indonesia by Status
4) Investment Incentives
Regarding investment incentives, the Indonesian government offers tax and non-tax incentives for both foreign and domestic investment projects. Furthermore, an investor to Eastern Indonesia including Mamminasata receives additional preferential treatments.
Box 3 Major Tax Incentives for Investors
Source: Investment Guide of Indonesia, 2005, ASEAN Promotion Centre on Trade, Investment and Tourism, and Fasilitas Perpajakan Bagi PMA dan PMDN, BPPMD
<Incentives for investors throughout Indonesia>
- Reduction of import tariff to 5%: on capital goods, parts and raw materials (two
years)
- Tax reduction equivalent to 30% of realized investment
- Acceleration of depreciation and amortization
- Extension of carrying forward losses up to 10 years
- Reduction of dividend tax rate to 10 percent
<Incentives for investors in the eastern Indonesia>
- Reduction of land and building tax by 50% up to 8 years
- Compensations for losses for 8 years
THE STUDY ON IMPLEMENTATION OF INTEGRATED SPATIAL PLAN FOR THE MAMMINASATA METROPOLITAN AREA
Sector Study (6)TRADE AND INVESTMENT STUDY
6-12
5) Effects of Development of Pare-Pare Port on Mamminasata
The Pare-Pare Port is located 155 km to the north of Makassar in South Sulawesi. The Pare-Pare Port is not only the seaport for the Integrated Economic Development Zone (KAPET) Pare-Pare, operated since 1999, but also one of the major ferry ports in South Sulawesi from/to Kalimantan. An approved company in the area can utilize fiscal and non-fiscal incentives that the KAPET offers.2
Although the agency of KAPET promotes their incentives for investors and potentials in terms of resources and infrastructures, investors’ view is different. Unattractiveness from the investors' view is clear from the fact that for five years, only two companies have benefited from the incentives in effect. If the agency does not set up concrete measures for further development, the KAPET scheme is less likely to bring swift economic development to the area.
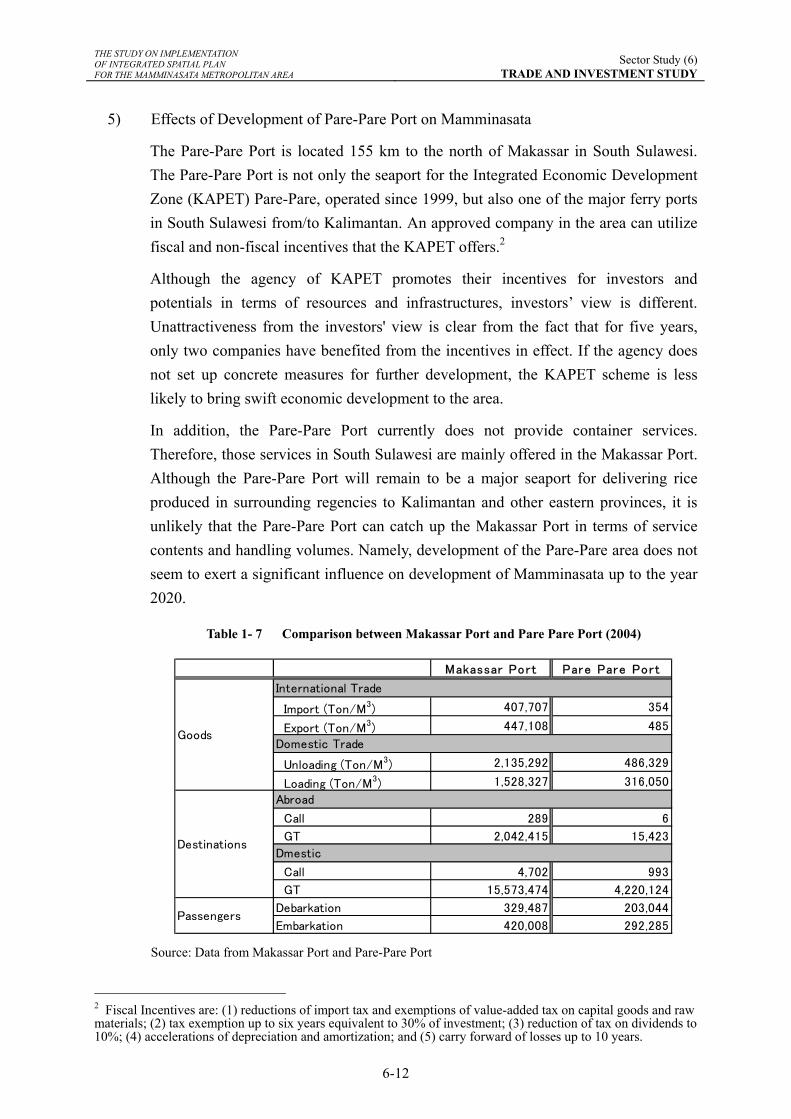
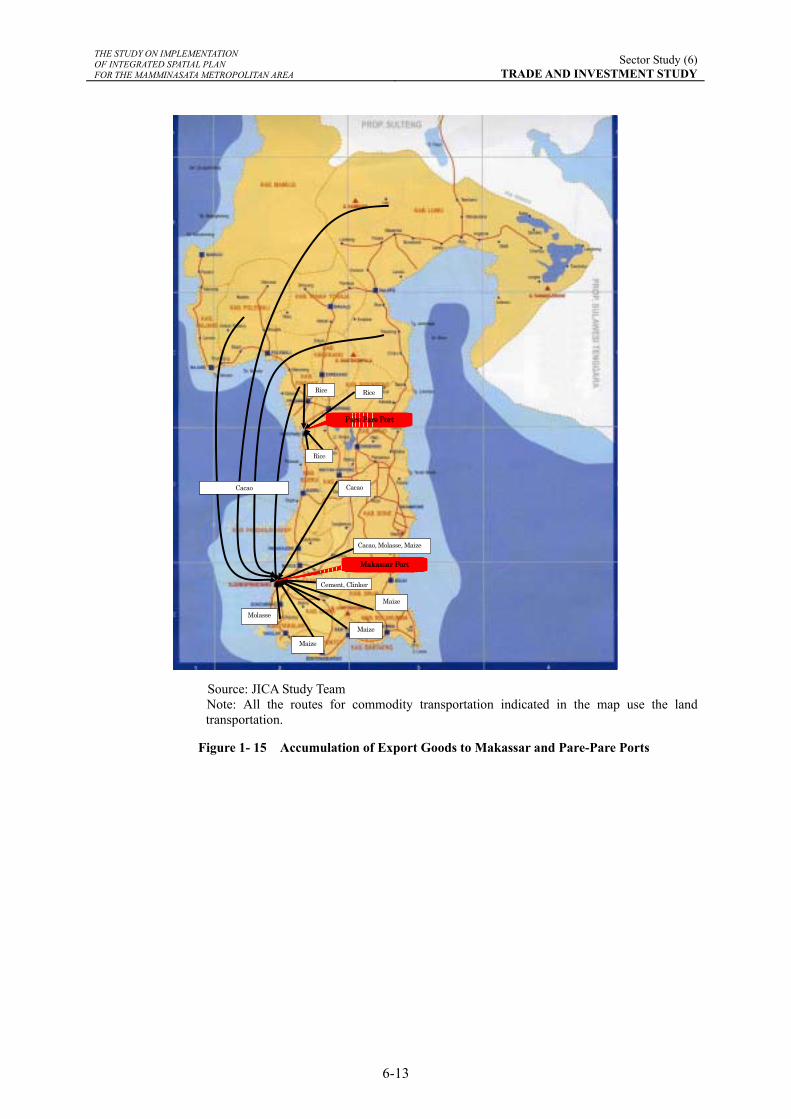
In addition, the Pare-Pare Port currently does not provide container services. Therefore, those services in South Sulawesi are mainly offered in the Makassar Port. Although the Pare-Pare Port will remain to be a major seaport for delivering rice produced in surrounding regencies to Kalimantan and other eastern provinces, it is unlikely that the Pare-Pare Port can catch up the Makassar Port in terms of service contents and handling volumes. Namely, development of the Pare-Pare area does not seem to exert a significant influence on development of Mamminasata up to the year 2020.
Table 1- 7 Comparison between Makassar Port and Pare Pare Port (2004)
Makassar Port Pare Pare Port
Import (Ton/M3) 407,707 354
Export (Ton/M3) 447,108 485
Unloading (Ton/M3) 2,135,292 486,329
Loading (Ton/M3) 1,528,327 316,050
Call 289 6
GT 2,042,415 15,423
Call 4,702 993
GT 15,573,474 4,220,124
Debarkation 329,487 203,044
Embarkation 420,008 292,285
Goods
Destinations
Passengers
International Trade
Domestic Trade
Abroad
Dmestic
Source: Data from Makassar Port and Pare-Pare Port
2 Fiscal Incentives are: (1) reductions of import tax and exemptions of value-added tax on capital goods and raw materials; (2) tax exemption up to six years equivalent to 30% of investment; (3) reduction of tax on dividends to 10%; (4) accelerations of depreciation and amortization; and (5) carry forward of losses up to 10 years.
THE STUDY ON IMPLEMENTATION OF INTEGRATED SPATIAL PLAN FOR THE MAMMINASATA METROPOLITAN AREA
Sector Study (6)TRADE AND INVESTMENT STUDY
6-13
Molasse
Maize
Maize
Maize
Cement, Clinker
Cacao, Molasse, Maize
Cacao
Rice
Rice Rice
Cacao
Pare Pare Port
Makassar Port
Source: JICA Study Team Note: All the routes for commodity transportation indicated in the map use the land transportation.
Figure 1- 15 Accumulation of Export Goods to Makassar and Pare-Pare Ports
THE STUDY ON IMPLEMENTATION OF INTEGRATED SPATIAL PLAN FOR THE MAMMINASATA METROPOLITAN AREA
Sector Study (6)TRADE AND INVESTMENT STUDY
6-14
2. ISSUES TO BE ADDRESSED
2.1. Issues in Trade
To define the targets, strategies and action programs for trade and investment promotion, fundamental issues in business should be clarified. While some business obstacles are unique to Mamminasata, others are common to Indonesia and deep-rooted in the policies of national and regional authorities.
Warehouse functions
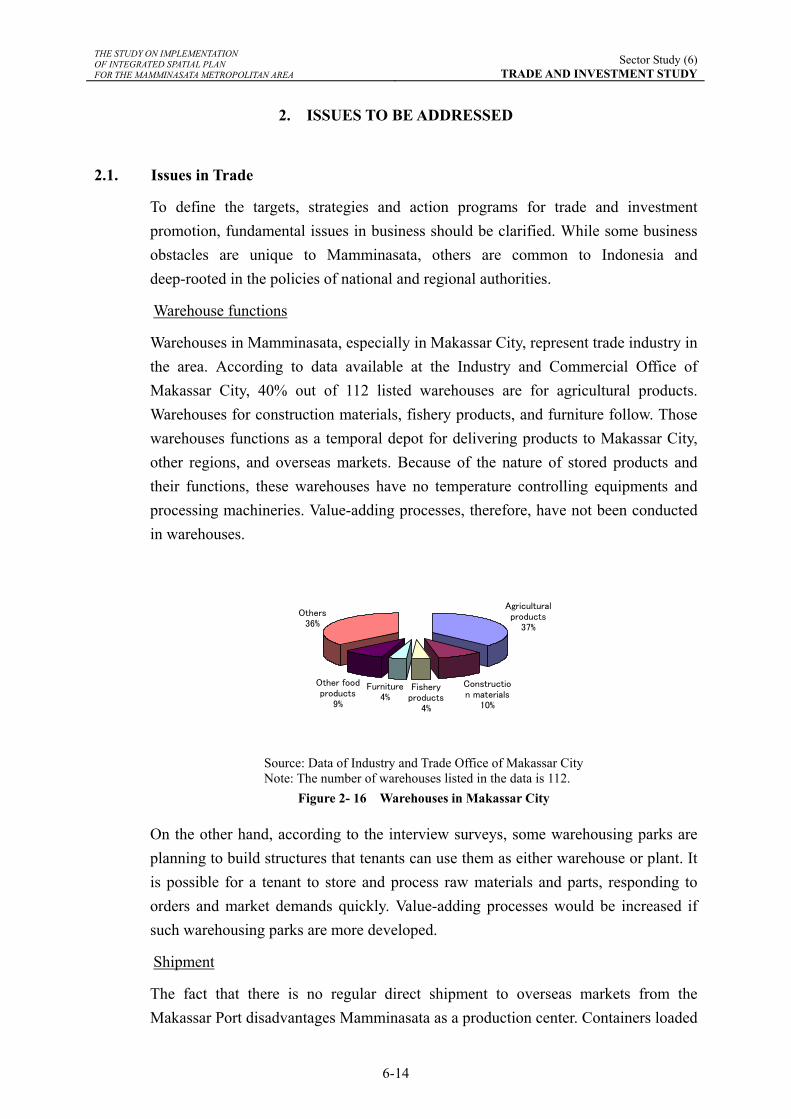
Warehouses in Mamminasata, especially in Makassar City, represent trade industry in the area. According to data available at the Industry and Commercial Office of Makassar City, 40% out of 112 listed warehouses are for agricultural products. Warehouses for construction materials, fishery products, and furniture follow. Those warehouses functions as a temporal depot for delivering products to Makassar City, other regions, and overseas markets. Because of the nature of stored products and their functions, these warehouses have no temperature controlling equipments and processing machineries. Value-adding processes, therefore, have not been conducted in warehouses.
Agriculturalproducts
37%
Construction materials
10%
Fisheryproducts
4%
Furniture4%
Other foodproducts
9%
Others36%
Source: Data of Industry and Trade Office of Makassar City Note: The number of warehouses listed in the data is 112.
Figure 2- 16 Warehouses in Makassar City
On the other hand, according to the interview surveys, some warehousing parks are planning to build structures that tenants can use them as either warehouse or plant. It is possible for a tenant to store and process raw materials and parts, responding to orders and market demands quickly. Value-adding processes would be increased if such warehousing parks are more developed.
Shipment
The fact that there is no regular direct shipment to overseas markets from the Makassar Port disadvantages Mamminasata as a production center. Containers loaded
THE STUDY ON IMPLEMENTATION OF INTEGRATED SPATIAL PLAN FOR THE MAMMINASATA METROPOLITAN AREA
Sector Study (6)TRADE AND INVESTMENT STUDY
6-15
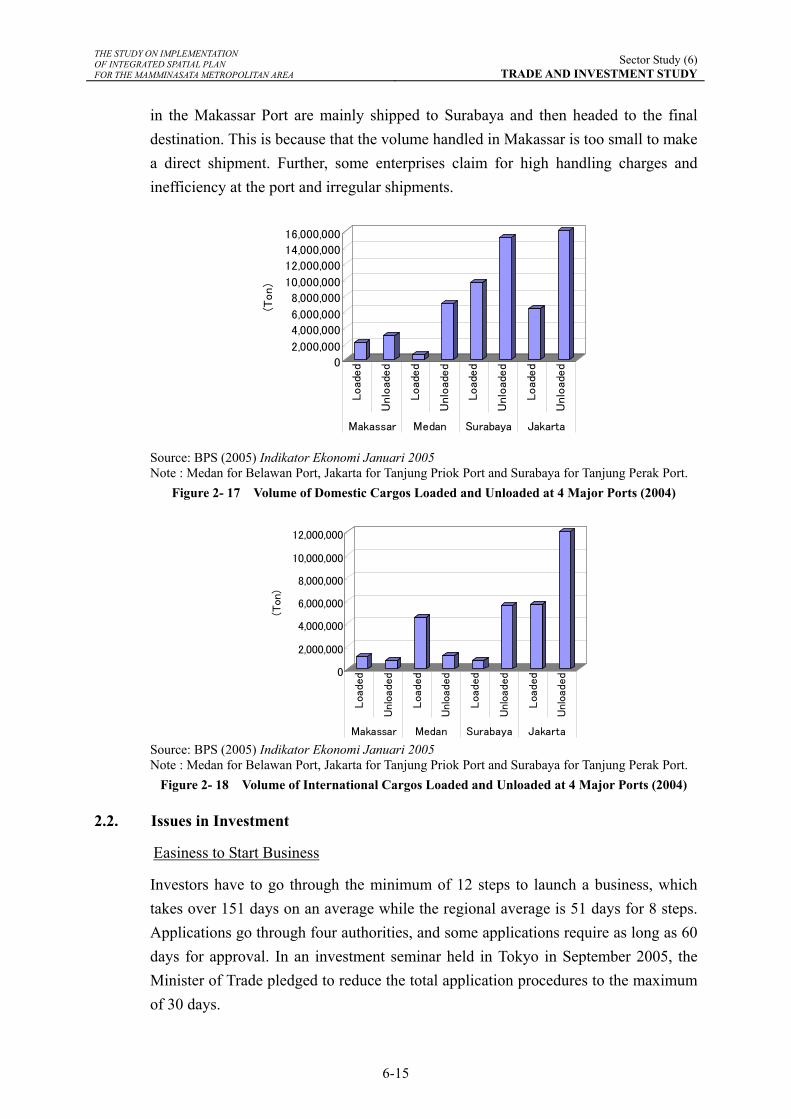
in the Makassar Port are mainly shipped to Surabaya and then headed to the final destination. This is because that the volume handled in Makassar is too small to make a direct shipment. Further, some enterprises claim for high handling charges and inefficiency at the port and irregular shipments.
0
2,000,000
4,000,000
6,000,000
8,000,000
10,000,000
12,000,000
14,000,000
16,000,000
(Ton)
Load
ed
Unlo
aded
Load
ed
Unlo
aded
Load
ed
Unlo
aded
Load
ed
Unlo
aded
Makassar Medan Surabaya Jakarta Source: BPS (2005) Indikator Ekonomi Januari 2005 Note : Medan for Belawan Port, Jakarta for Tanjung Priok Port and Surabaya for Tanjung Perak Port.
Figure 2- 17 Volume of Domestic Cargos Loaded and Unloaded at 4 Major Ports (2004)
0
2,000,000
4,000,000
6,000,000
8,000,000
10,000,000
12,000,000
(Ton)
Loaded
Unlo
aded
Loaded
Unlo
aded
Loaded
Unlo
aded
Loaded
Unlo
aded
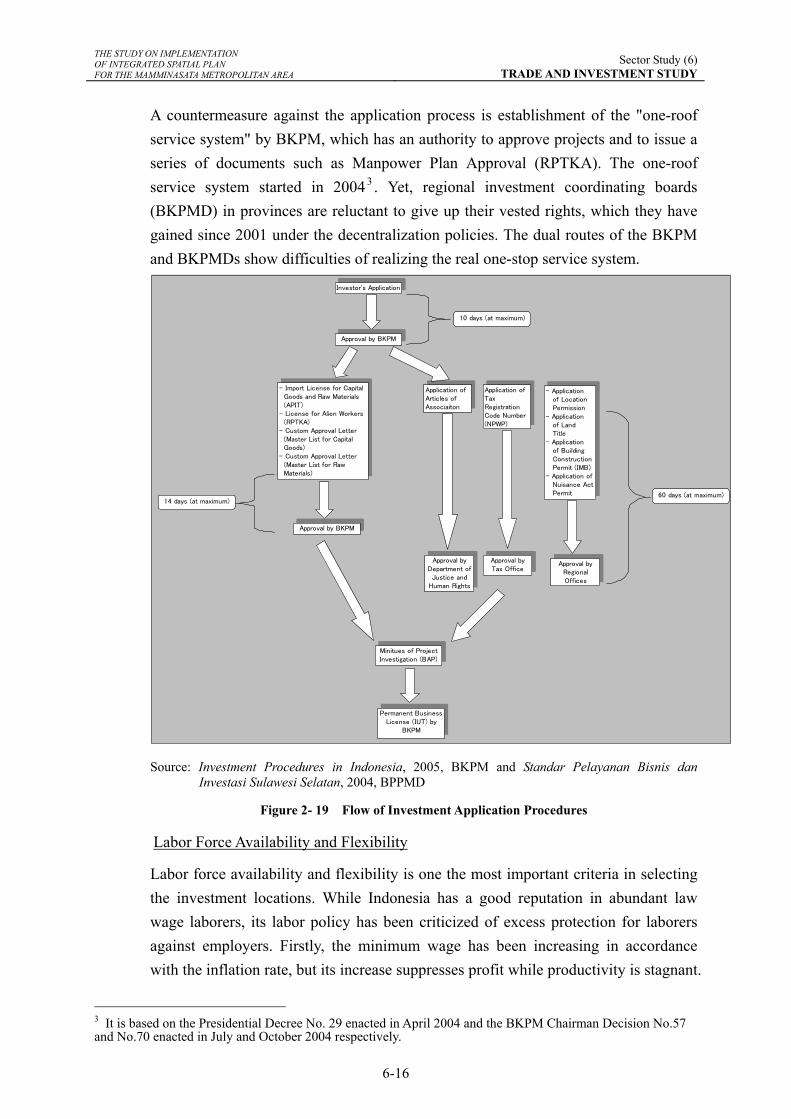
Makassar Medan Surabaya Jakarta Source: BPS (2005) Indikator Ekonomi Januari 2005 Note : Medan for Belawan Port, Jakarta for Tanjung Priok Port and Surabaya for Tanjung Perak Port.
Figure 2- 18 Volume of International Cargos Loaded and Unloaded at 4 Major Ports (2004)
2.2. Issues in Investment
Easiness to Start Business
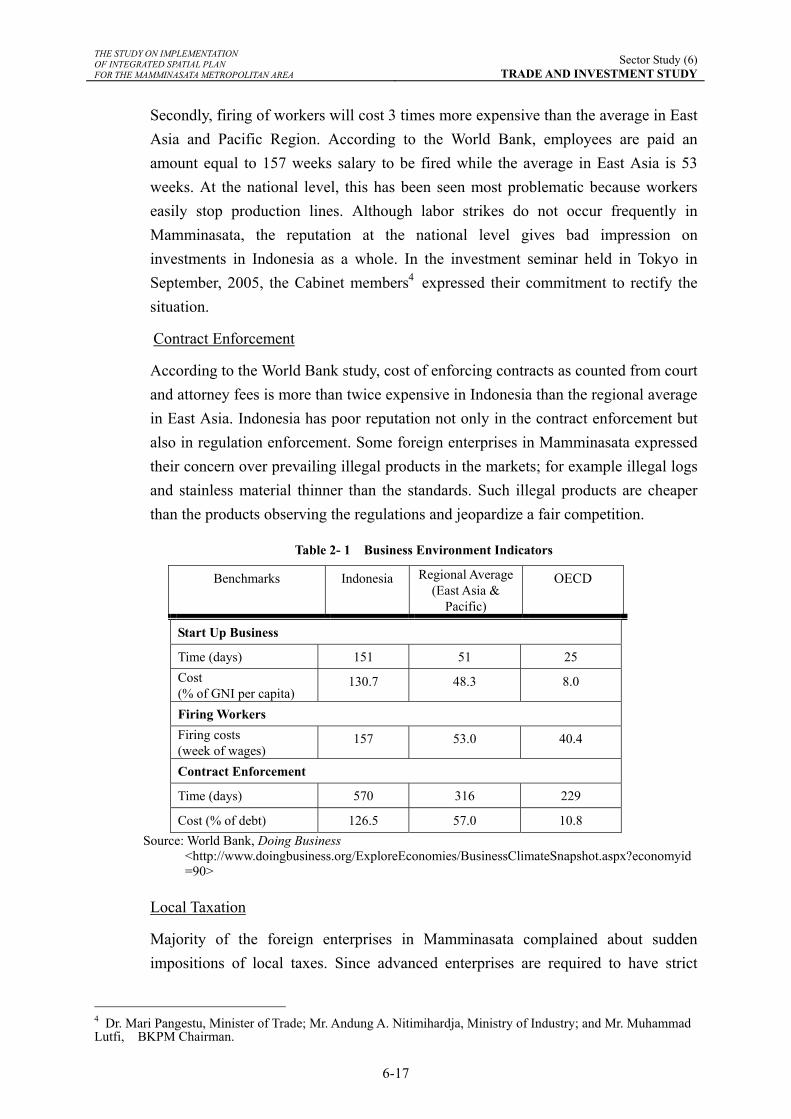
Investors have to go through the minimum of 12 steps to launch a business, which takes over 151 days on an average while the regional average is 51 days for 8 steps. Applications go through four authorities, and some applications require as long as 60 days for approval. In an investment seminar held in Tokyo in September 2005, the Minister of Trade pledged to reduce the total application procedures to the maximum of 30 days.
THE STUDY ON IMPLEMENTATION OF INTEGRATED SPATIAL PLAN FOR THE MAMMINASATA METROPOLITAN AREA
Sector Study (6)TRADE AND INVESTMENT STUDY
6-16
A countermeasure against the application process is establishment of the "one-roof service system" by BKPM, which has an authority to approve projects and to issue a series of documents such as Manpower Plan Approval (RPTKA). The one-roof service system started in 20043 . Yet, regional investment coordinating boards (BKPMD) in provinces are reluctant to give up their vested rights, which they have gained since 2001 under the decentralization policies. The dual routes of the BKPM and BKPMDs show difficulties of realizing the real one-stop service system.
Investor's Application
Approval by BKPM
10 days (at maximum)
- Import License for Capital Goods and Raw Materials (APIT)- License for Alien Workers (RPTKA)- Custom Approval Letter (Master List for Capital Goods)- Custom Approval Letter (Master List for Raw Materials)
Approval by BKPM
14 days (at maximum)
Application ofArticles ofAssociaiton
Approval byDepartment ofJustice and
Human Rights
Application ofTaxRegistrationCode Number(NPWP)
Approval byTax Office
- Application of Location Permission- Application of Land Title- Application of Building Construction Permit (IMB)- Application of Nuisance Act Permit
Approval byRegionalOffices
60 days (at maximum)
Minitues of ProjectInvestigation (BAP)
Permanent BusinessLicense (IUT) by
BKPM
Source: Investment Procedures in Indonesia, 2005, BKPM and Standar Pelayanan Bisnis dan
Investasi Sulawesi Selatan, 2004, BPPMD
Figure 2- 19 Flow of Investment Application Procedures
Labor Force Availability and Flexibility
Labor force availability and flexibility is one the most important criteria in selecting the investment locations. While Indonesia has a good reputation in abundant law wage laborers, its labor policy has been criticized of excess protection for laborers against employers. Firstly, the minimum wage has been increasing in accordance with the inflation rate, but its increase suppresses profit while productivity is stagnant.
3 It is based on the Presidential Decree No. 29 enacted in April 2004 and the BKPM Chairman Decision No.57 and No.70 enacted in July and October 2004 respectively.
THE STUDY ON IMPLEMENTATION OF INTEGRATED SPATIAL PLAN FOR THE MAMMINASATA METROPOLITAN AREA
Sector Study (6)TRADE AND INVESTMENT STUDY
6-17
Secondly, firing of workers will cost 3 times more expensive than the average in East Asia and Pacific Region. According to the World Bank, employees are paid an amount equal to 157 weeks salary to be fired while the average in East Asia is 53 weeks. At the national level, this has been seen most problematic because workers easily stop production lines. Although labor strikes do not occur frequently in Mamminasata, the reputation at the national level gives bad impression on investments in Indonesia as a whole. In the investment seminar held in Tokyo in September, 2005, the Cabinet members4 expressed their commitment to rectify the situation.
Contract Enforcement
According to the World Bank study, cost of enforcing contracts as counted from court and attorney fees is more than twice expensive in Indonesia than the regional average in East Asia. Indonesia has poor reputation not only in the contract enforcement but also in regulation enforcement. Some foreign enterprises in Mamminasata expressed their concern over prevailing illegal products in the markets; for example illegal logs and stainless material thinner than the standards. Such illegal products are cheaper than the products observing the regulations and jeopardize a fair competition.
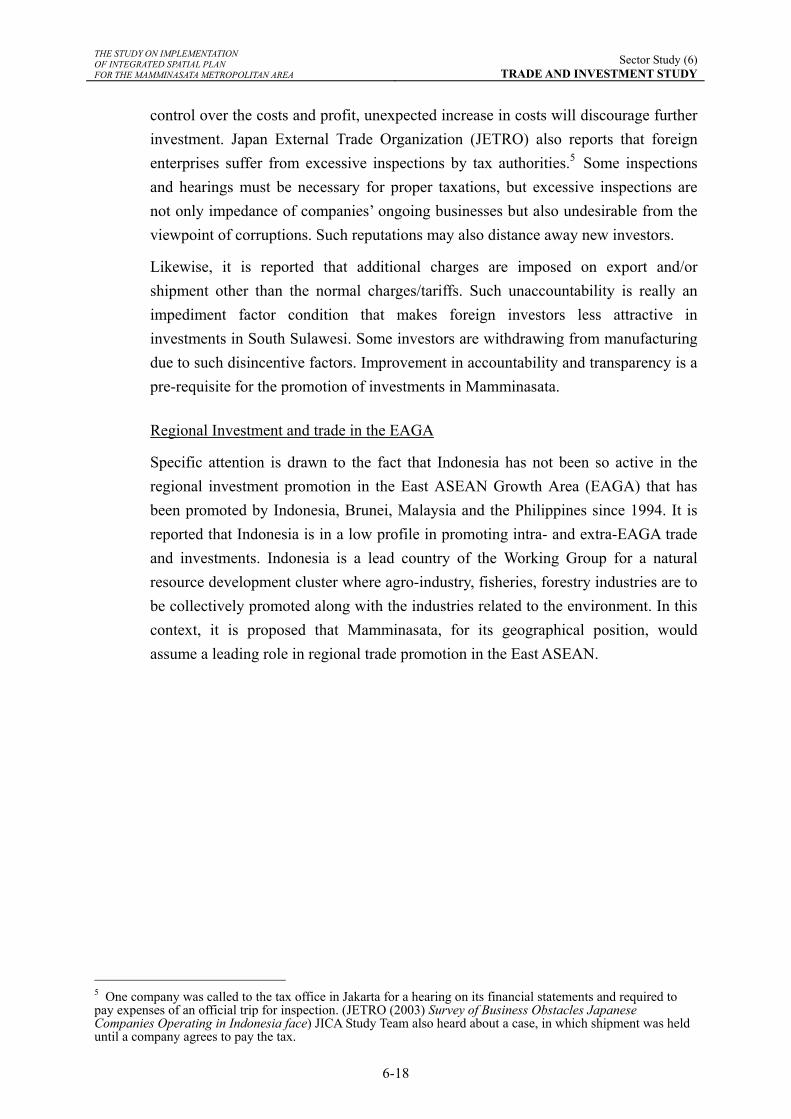
Table 2- 1 Business Environment Indicators
Benchmarks Indonesia Regional Average(East Asia &
Pacific)
OECD
Start Up Business
Time (days) 151 51 25 Cost (% of GNI per capita)
130.7 48.3 8.0
Firing Workers Firing costs (week of wages)
157 53.0 40.4
Contract Enforcement
Time (days) 570 316 229
Cost (% of debt) 126.5 57.0 10.8 Source: World Bank, Doing Business
<http://www.doingbusiness.org/ExploreEconomies/BusinessClimateSnapshot.aspx?economyid=90>
Local Taxation
Majority of the foreign enterprises in Mamminasata complained about sudden impositions of local taxes. Since advanced enterprises are required to have strict
4 Dr. Mari Pangestu, Minister of Trade; Mr. Andung A. Nitimihardja, Ministry of Industry; and Mr. Muhammad Lutfi, BKPM Chairman.
THE STUDY ON IMPLEMENTATION OF INTEGRATED SPATIAL PLAN FOR THE MAMMINASATA METROPOLITAN AREA
Sector Study (6)TRADE AND INVESTMENT STUDY
6-18
control over the costs and profit, unexpected increase in costs will discourage further investment. Japan External Trade Organization (JETRO) also reports that foreign enterprises suffer from excessive inspections by tax authorities.5 Some inspections and hearings must be necessary for proper taxations, but excessive inspections are not only impedance of companies’ ongoing businesses but also undesirable from the viewpoint of corruptions. Such reputations may also distance away new investors.
Likewise, it is reported that additional charges are imposed on export and/or shipment other than the normal charges/tariffs. Such unaccountability is really an impediment factor condition that makes foreign investors less attractive in investments in South Sulawesi. Some investors are withdrawing from manufacturing due to such disincentive factors. Improvement in accountability and transparency is a pre-requisite for the promotion of investments in Mamminasata.
Regional Investment and trade in the EAGA
Specific attention is drawn to the fact that Indonesia has not been so active in the regional investment promotion in the East ASEAN Growth Area (EAGA) that has been promoted by Indonesia, Brunei, Malaysia and the Philippines since 1994. It is reported that Indonesia is in a low profile in promoting intra- and extra-EAGA trade and investments. Indonesia is a lead country of the Working Group for a natural resource development cluster where agro-industry, fisheries, forestry industries are to be collectively promoted along with the industries related to the environment. In this context, it is proposed that Mamminasata, for its geographical position, would assume a leading role in regional trade promotion in the East ASEAN.
5 One company was called to the tax office in Jakarta for a hearing on its financial statements and required to pay expenses of an official trip for inspection. (JETRO (2003) Survey of Business Obstacles Japanese Companies Operating in Indonesia face) JICA Study Team also heard about a case, in which shipment was held until a company agrees to pay the tax.
THE STUDY ON IMPLEMENTATION OF INTEGRATED SPATIAL PLAN FOR THE MAMMINASATA METROPOLITAN AREA
Sector Study (6)TRADE AND INVESTMENT STUDY
6-19
3. TARGET AND SRATEGY
3.1. Trade
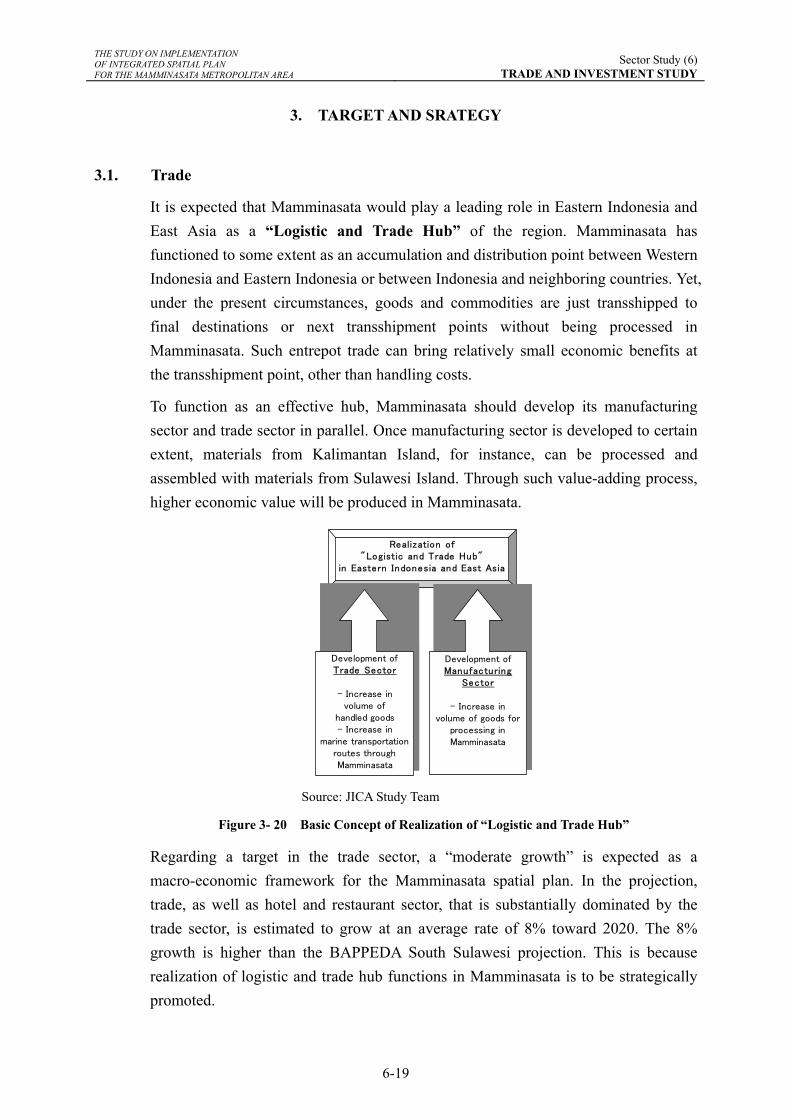
It is expected that Mamminasata would play a leading role in Eastern Indonesia and East Asia as a “Logistic and Trade Hub” of the region. Mamminasata has functioned to some extent as an accumulation and distribution point between Western Indonesia and Eastern Indonesia or between Indonesia and neighboring countries. Yet, under the present circumstances, goods and commodities are just transshipped to final destinations or next transshipment points without being processed in Mamminasata. Such entrepot trade can bring relatively small economic benefits at the transshipment point, other than handling costs.
To function as an effective hub, Mamminasata should develop its manufacturing sector and trade sector in parallel. Once manufacturing sector is developed to certain extent, materials from Kalimantan Island, for instance, can be processed and assembled with materials from Sulawesi Island. Through such value-adding process, higher economic value will be produced in Mamminasata.
Realization of"Logistic and Trade Hub"
in Eastern Indonesia and East Asia
Development ofTrade Sector
- Increase involume of
handled goods- Increase in
marine transportationroutes throughMamminasata
Development ofManufacturing
Sector
- Increase involume of goods for
processing inMamminasata
Source: JICA Study Team
Figure 3- 20 Basic Concept of Realization of “Logistic and Trade Hub”
Regarding a target in the trade sector, a “moderate growth” is expected as a macro-economic framework for the Mamminasata spatial plan. In the projection, trade, as well as hotel and restaurant sector, that is substantially dominated by the trade sector, is estimated to grow at an average rate of 8% toward 2020. The 8% growth is higher than the BAPPEDA South Sulawesi projection. This is because realization of logistic and trade hub functions in Mamminasata is to be strategically promoted.
THE STUDY ON IMPLEMENTATION OF INTEGRATED SPATIAL PLAN FOR THE MAMMINASATA METROPOLITAN AREA
Sector Study (6)TRADE AND INVESTMENT STUDY
6-20
3.2. Investment
The objectives of investment promotion are also defined to attain the “Logistic and Trade Hub” in Eastern Indonesia and East Asia and the “Enhancement of Locally Added Value”. These objectives definitely require new domestic and foreign direct investments in Mamminasata.
Private investments required for the targeted growth is estimated under the two economic growth targets for South Sulawesi; i.e., projection by BAPPEDA (13% annual nominal growth) and a lower case (5% nominal growth) for reference.
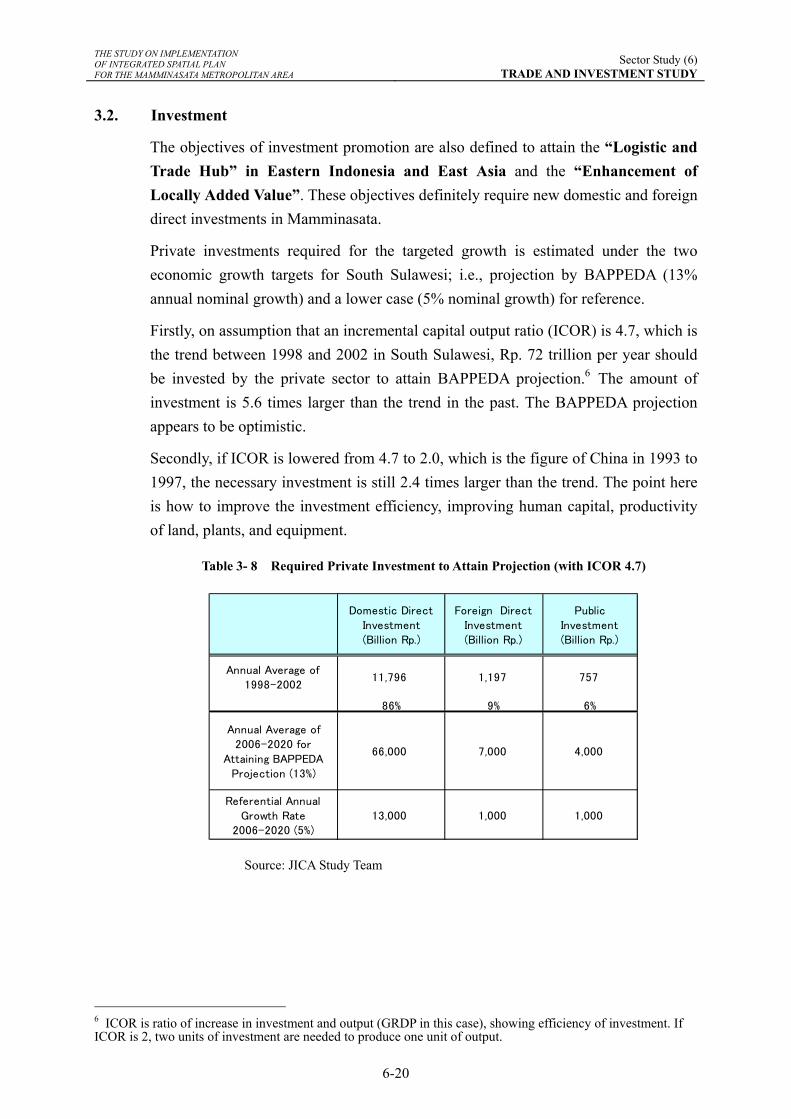
Firstly, on assumption that an incremental capital output ratio (ICOR) is 4.7, which is the trend between 1998 and 2002 in South Sulawesi, Rp. 72 trillion per year should be invested by the private sector to attain BAPPEDA projection.6 The amount of investment is 5.6 times larger than the trend in the past. The BAPPEDA projection appears to be optimistic.
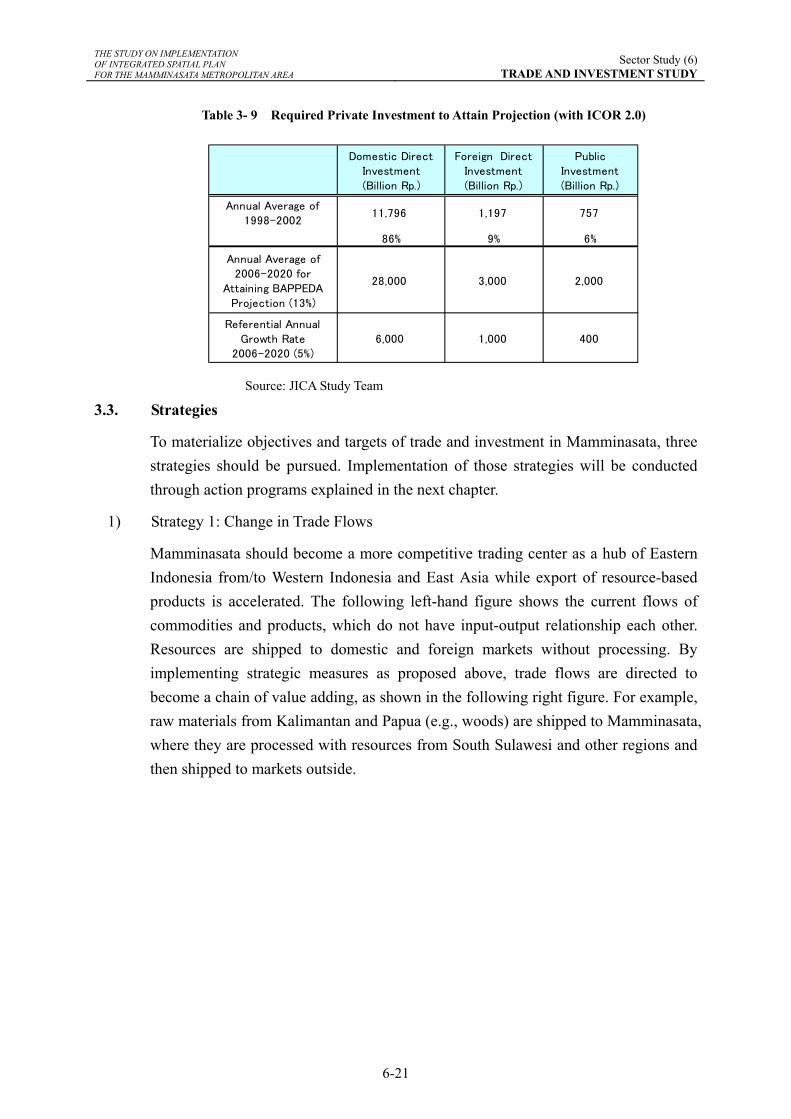
Secondly, if ICOR is lowered from 4.7 to 2.0, which is the figure of China in 1993 to 1997, the necessary investment is still 2.4 times larger than the trend. The point here is how to improve the investment efficiency, improving human capital, productivity of land, plants, and equipment.
Table 3- 8 Required Private Investment to Attain Projection (with ICOR 4.7)
Domestic DirectInvestment(Billion Rp.)
Foreign DirectInvestment(Billion Rp.)
PublicInvestment(Billion Rp.)
Annual Average of1998-2002
11,796 1,197 757
86% 9% 6%
Annual Average of2006-2020 for
Attaining BAPPEDAProjection (13%)
66,000 7,000 4,000
Referential AnnualGrowth Rate
2006-2020 (5%)13,000 1,000 1,000
Source: JICA Study Team
6 ICOR is ratio of increase in investment and output (GRDP in this case), showing efficiency of investment. If ICOR is 2, two units of investment are needed to produce one unit of output.
THE STUDY ON IMPLEMENTATION OF INTEGRATED SPATIAL PLAN FOR THE MAMMINASATA METROPOLITAN AREA
Sector Study (6)TRADE AND INVESTMENT STUDY
6-21
Table 3- 9 Required Private Investment to Attain Projection (with ICOR 2.0)
Domestic DirectInvestment(Billion Rp.)
Foreign DirectInvestment(Billion Rp.)
PublicInvestment(Billion Rp.)
Annual Average of1998-2002
11,796 1,197 757
86% 9% 6%
Annual Average of2006-2020 for
Attaining BAPPEDAProjection (13%)
28,000 3,000 2,000
Referential AnnualGrowth Rate
2006-2020 (5%)6,000 1,000 400
Source: JICA Study Team
3.3. Strategies
To materialize objectives and targets of trade and investment in Mamminasata, three strategies should be pursued. Implementation of those strategies will be conducted through action programs explained in the next chapter.
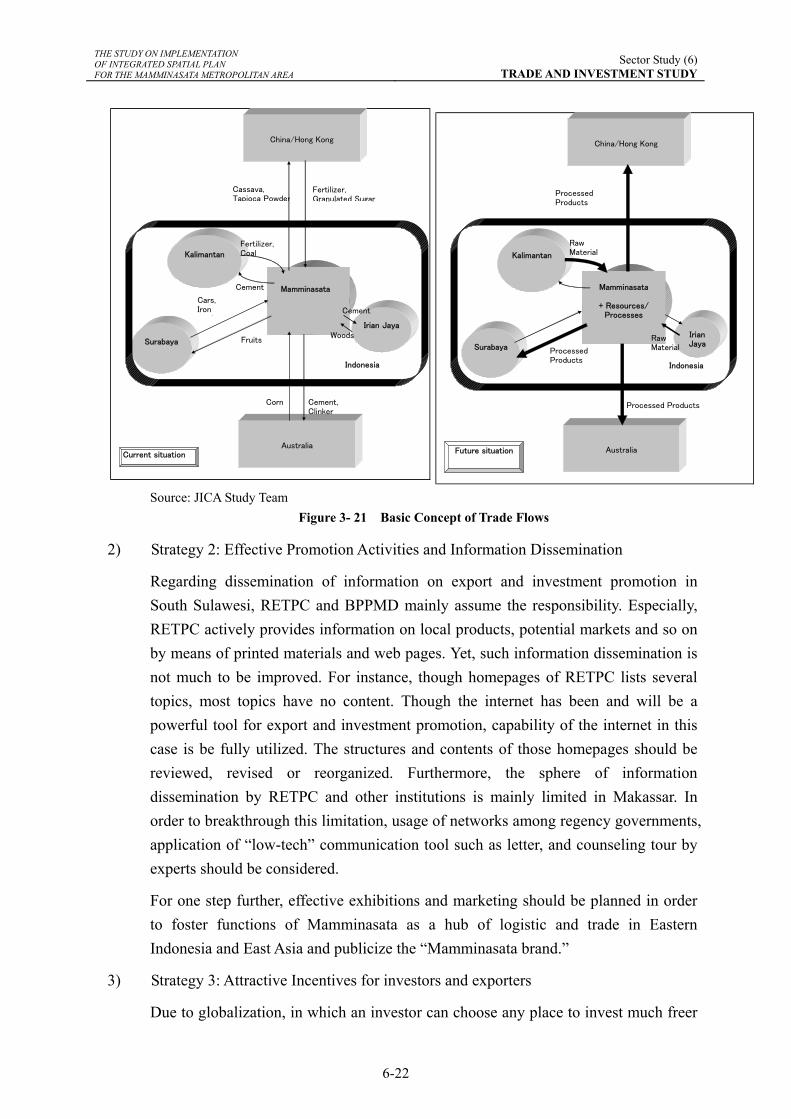
1) Strategy 1: Change in Trade Flows
Mamminasata should become a more competitive trading center as a hub of Eastern Indonesia from/to Western Indonesia and East Asia while export of resource-based products is accelerated. The following left-hand figure shows the current flows of commodities and products, which do not have input-output relationship each other. Resources are shipped to domestic and foreign markets without processing. By implementing strategic measures as proposed above, trade flows are directed to become a chain of value adding, as shown in the following right figure. For example, raw materials from Kalimantan and Papua (e.g., woods) are shipped to Mamminasata, where they are processed with resources from South Sulawesi and other regions and then shipped to markets outside.
THE STUDY ON IMPLEMENTATION OF INTEGRATED SPATIAL PLAN FOR THE MAMMINASATA METROPOLITAN AREA
Sector Study (6)TRADE AND INVESTMENT STUDY
6-22
Mamminasata
Surabaya
Kalimantan
China/Hong Kong
Australia
Indonesia
Fruits
Cars,Iron
d
Fertilizer,Coal
Cement
Cement,Clinker
Corn
Fertilizer,Granulated Sugar
Cassava,Tapioca Powder
Current situation
Irian JayaWoods
Cement
Source: JICA Study Team
Figure 3- 21 Basic Concept of Trade Flows
2) Strategy 2: Effective Promotion Activities and Information Dissemination
Regarding dissemination of information on export and investment promotion in South Sulawesi, RETPC and BPPMD mainly assume the responsibility. Especially, RETPC actively provides information on local products, potential markets and so on by means of printed materials and web pages. Yet, such information dissemination is not much to be improved. For instance, though homepages of RETPC lists several topics, most topics have no content. Though the internet has been and will be a powerful tool for export and investment promotion, capability of the internet in this case is be fully utilized. The structures and contents of those homepages should be reviewed, revised or reorganized. Furthermore, the sphere of information dissemination by RETPC and other institutions is mainly limited in Makassar. In order to breakthrough this limitation, usage of networks among regency governments, application of “low-tech” communication tool such as letter, and counseling tour by experts should be considered.
For one step further, effective exhibitions and marketing should be planned in order to foster functions of Mamminasata as a hub of logistic and trade in Eastern Indonesia and East Asia and publicize the “Mamminasata brand.”
3) Strategy 3: Attractive Incentives for investors and exporters
Due to globalization, in which an investor can choose any place to invest much freer
Mamminasata
+ Resources/Processes
Surabaya
Kalimantan
China/Hong Kong
Australia
Indonesia
RawMaterial
ProcessedProducts
ProcessedProducts
Processed Products
Future situation
IrianJaya
RawMaterial

THE STUDY ON IMPLEMENTATION OF INTEGRATED SPATIAL PLAN FOR THE MAMMINASATA METROPOLITAN AREA
Sector Study (6)TRADE AND INVESTMENT STUDY
6-23
than ever, considerable incentives should be given in Mamminasata to fulfill a gap between its business climate and its superior competitors. On the other hand, due to the progress of decentralization in Indonesia, local governments can give incentives.7 Therefore, local authorities should deliberate new attractive incentives, taking various benefits from business activities stimulated by incentives into consideration. One idea would be that incentives will be offered by the merit system based on export value and ISO certificate. Several action plans are explained in the following chapter.
7 It is based on Law No.32 promulgated in 2004.
THE STUDY ON IMPLEMENTATION OF INTEGRATED SPATIAL PLAN FOR THE MAMMINASATA METROPOLITAN AREA
Sector Study (6)TRADE AND INVESTMENT STUDY
6-24
4. ACTION PROGRAMS
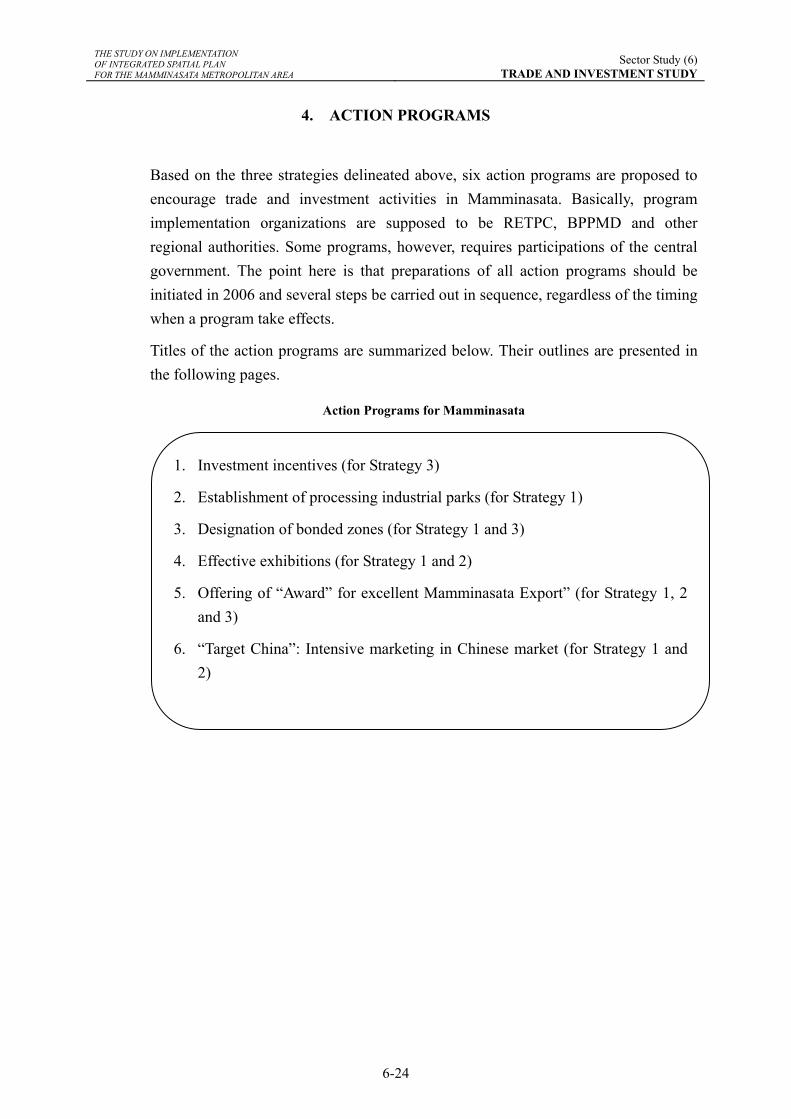
Based on the three strategies delineated above, six action programs are proposed to encourage trade and investment activities in Mamminasata. Basically, program implementation organizations are supposed to be RETPC, BPPMD and other regional authorities. Some programs, however, requires participations of the central government. The point here is that preparations of all action programs should be initiated in 2006 and several steps be carried out in sequence, regardless of the timing when a program take effects.
Titles of the action programs are summarized below. Their outlines are presented in the following pages.
Action Programs for Mamminasata
1. Investment incentives (for Strategy 3)
2. Establishment of processing industrial parks (for Strategy 1)
3. Designation of bonded zones (for Strategy 1 and 3)
4. Effective exhibitions (for Strategy 1 and 2)
5. Offering of “Award” for excellent Mamminasata Export” (for Strategy 1, 2 and 3)
6. “Target China”: Intensive marketing in Chinese market (for Strategy 1 and 2)
THE STUDY ON IMPLEMENTATION OF INTEGRATED SPATIAL PLAN FOR THE MAMMINASATA METROPOLITAN AREA
Sector Study (6)TRADE AND INVESTMENT STUDY
6-25
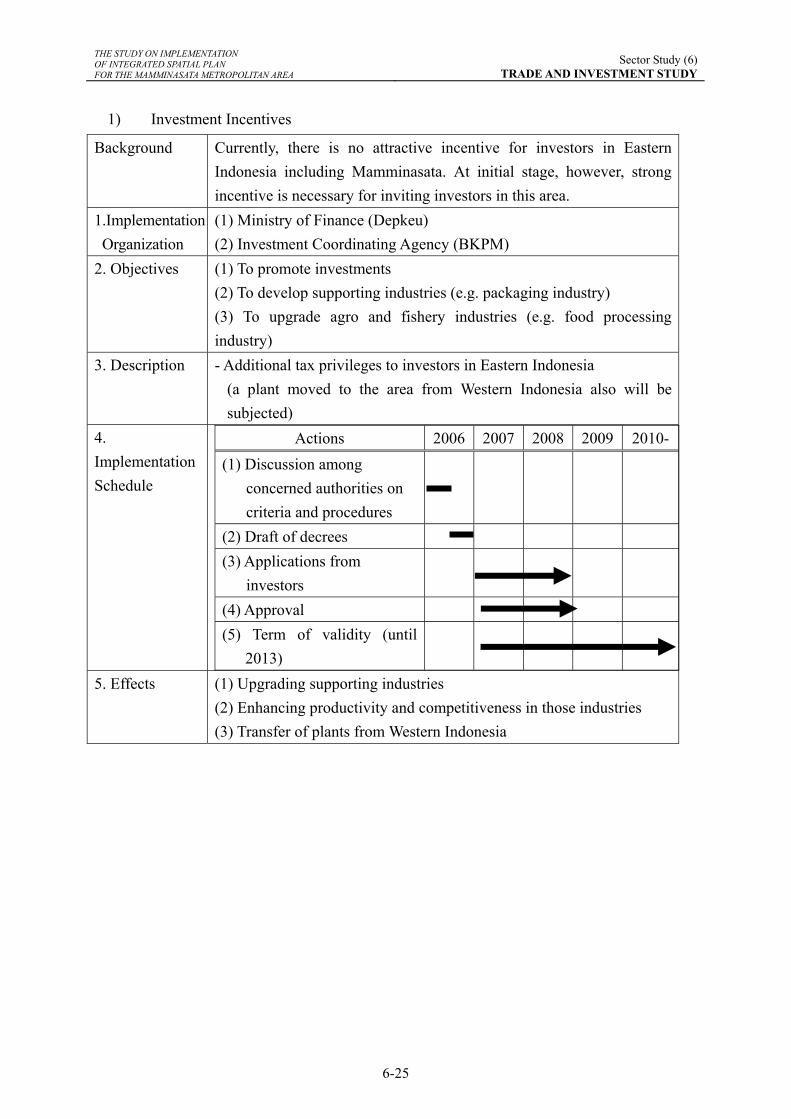
1) Investment Incentives
Background Currently, there is no attractive incentive for investors in Eastern Indonesia including Mamminasata. At initial stage, however, strong incentive is necessary for inviting investors in this area.
1.Implementation Organization
(1) Ministry of Finance (Depkeu) (2) Investment Coordinating Agency (BKPM)
2. Objectives (1) To promote investments (2) To develop supporting industries (e.g. packaging industry) (3) To upgrade agro and fishery industries (e.g. food processing industry)
3. Description - Additional tax privileges to investors in Eastern Indonesia (a plant moved to the area from Western Indonesia also will be subjected)
4. Implementation Schedule
Actions 2006 2007 2008 2009 2010-(1) Discussion among
concerned authorities on criteria and procedures
(2) Draft of decrees (3) Applications from investors
(4) Approval (5) Term of validity (until
2013)
5. Effects (1) Upgrading supporting industries
(2) Enhancing productivity and competitiveness in those industries (3) Transfer of plants from Western Indonesia
THE STUDY ON IMPLEMENTATION OF INTEGRATED SPATIAL PLAN FOR THE MAMMINASATA METROPOLITAN AREA
Sector Study (6)TRADE AND INVESTMENT STUDY
6-26
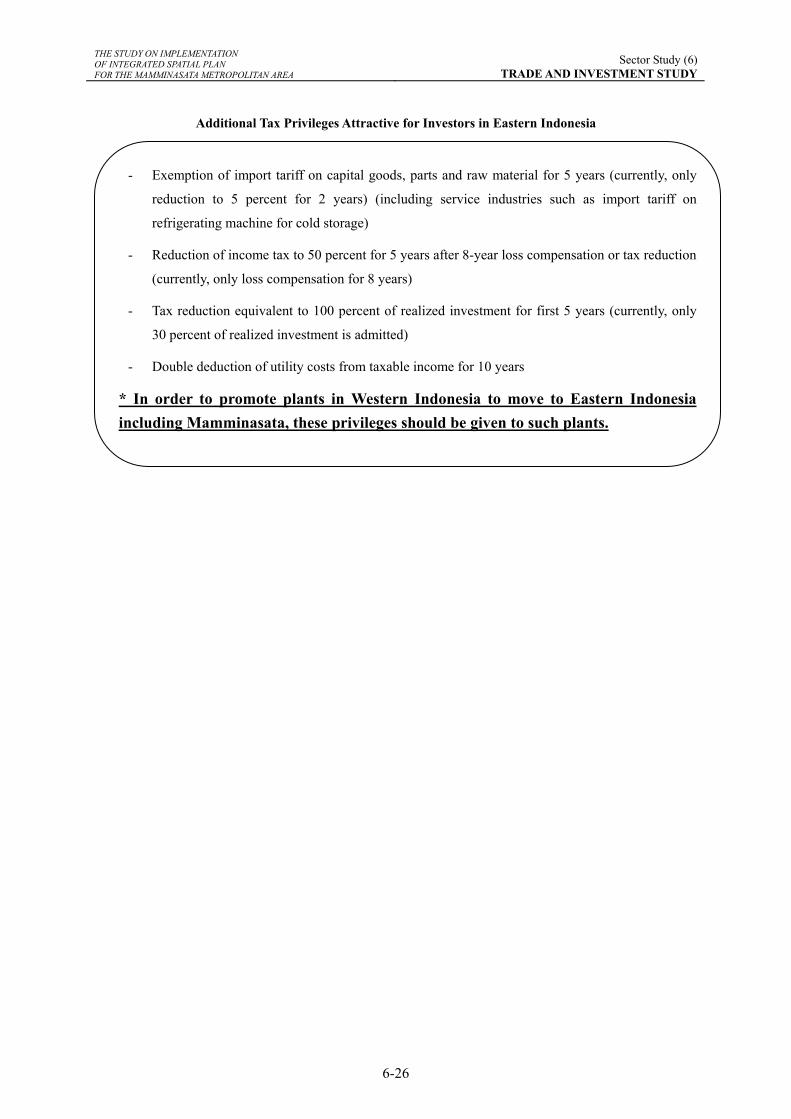
Additional Tax Privileges Attractive for Investors in Eastern Indonesia
- Exemption of import tariff on capital goods, parts and raw material for 5 years (currently, only
reduction to 5 percent for 2 years) (including service industries such as import tariff on
refrigerating machine for cold storage)
- Reduction of income tax to 50 percent for 5 years after 8-year loss compensation or tax reduction
(currently, only loss compensation for 8 years)
- Tax reduction equivalent to 100 percent of realized investment for first 5 years (currently, only
30 percent of realized investment is admitted)
- Double deduction of utility costs from taxable income for 10 years
* In order to promote plants in Western Indonesia to move to Eastern Indonesia including Mamminasata, these privileges should be given to such plants.
THE STUDY ON IMPLEMENTATION OF INTEGRATED SPATIAL PLAN FOR THE MAMMINASATA METROPOLITAN AREA
Sector Study (6)TRADE AND INVESTMENT STUDY
6-27
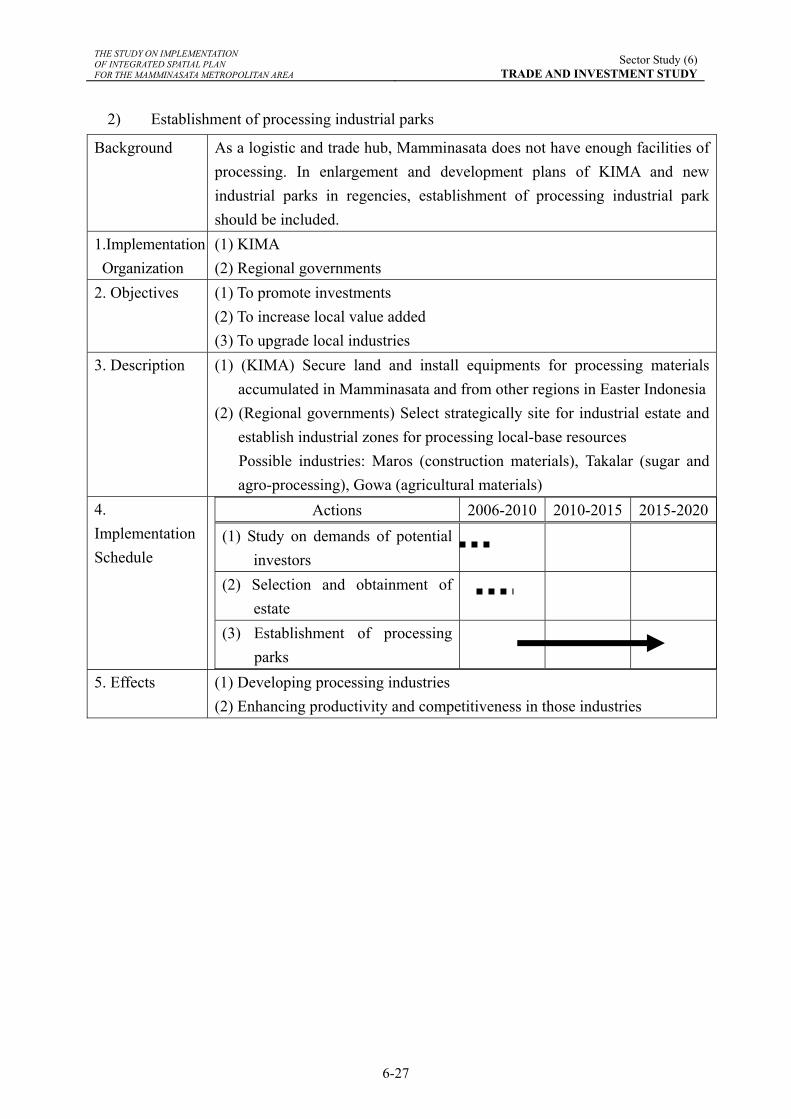
2) Establishment of processing industrial parks
Background As a logistic and trade hub, Mamminasata does not have enough facilities of processing. In enlargement and development plans of KIMA and new industrial parks in regencies, establishment of processing industrial park should be included.
1.Implementation Organization
(1) KIMA (2) Regional governments
2. Objectives (1) To promote investments (2) To increase local value added (3) To upgrade local industries
3. Description (1) (KIMA) Secure land and install equipments for processing materials accumulated in Mamminasata and from other regions in Easter Indonesia
(2) (Regional governments) Select strategically site for industrial estate and establish industrial zones for processing local-base resources
Possible industries: Maros (construction materials), Takalar (sugar and agro-processing), Gowa (agricultural materials)
4. Implementation Schedule
Actions 2006-2010 2010-2015 2015-2020(1) Study on demands of potential
investors
(2) Selection and obtainment of estate
(3) Establishment of processing parks
5. Effects (1) Developing processing industries
(2) Enhancing productivity and competitiveness in those industries
THE STUDY ON IMPLEMENTATION OF INTEGRATED SPATIAL PLAN FOR THE MAMMINASATA METROPOLITAN AREA
Sector Study (6)TRADE AND INVESTMENT STUDY
6-28
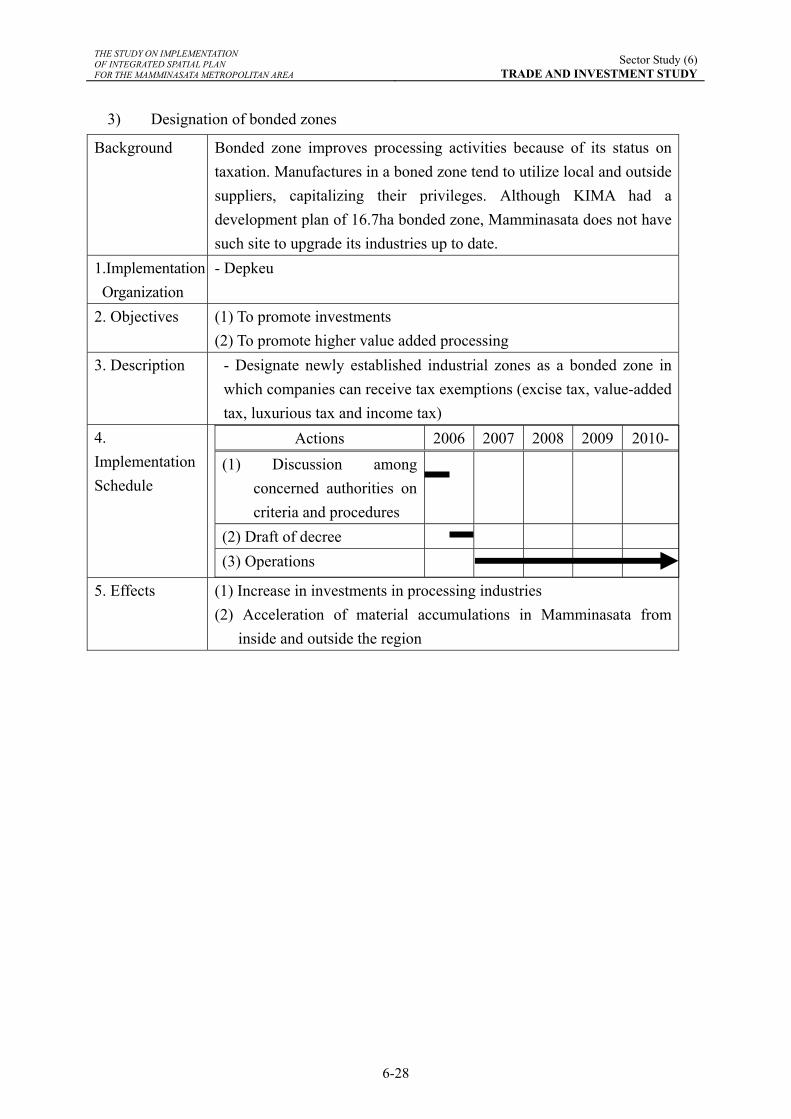
3) Designation of bonded zones
Background Bonded zone improves processing activities because of its status on taxation. Manufactures in a boned zone tend to utilize local and outside suppliers, capitalizing their privileges. Although KIMA had a development plan of 16.7ha bonded zone, Mamminasata does not have such site to upgrade its industries up to date.
1.Implementation Organization
- Depkeu
2. Objectives (1) To promote investments (2) To promote higher value added processing
3. Description - Designate newly established industrial zones as a bonded zone in which companies can receive tax exemptions (excise tax, value-added tax, luxurious tax and income tax)
4. Implementation Schedule
Actions 2006 2007 2008 2009 2010-(1) Discussion among
concerned authorities on criteria and procedures
(2) Draft of decree (3) Operations
5. Effects (1) Increase in investments in processing industries
(2) Acceleration of material accumulations in Mamminasata from inside and outside the region
THE STUDY ON IMPLEMENTATION OF INTEGRATED SPATIAL PLAN FOR THE MAMMINASATA METROPOLITAN AREA
Sector Study (6)TRADE AND INVESTMENT STUDY
6-29
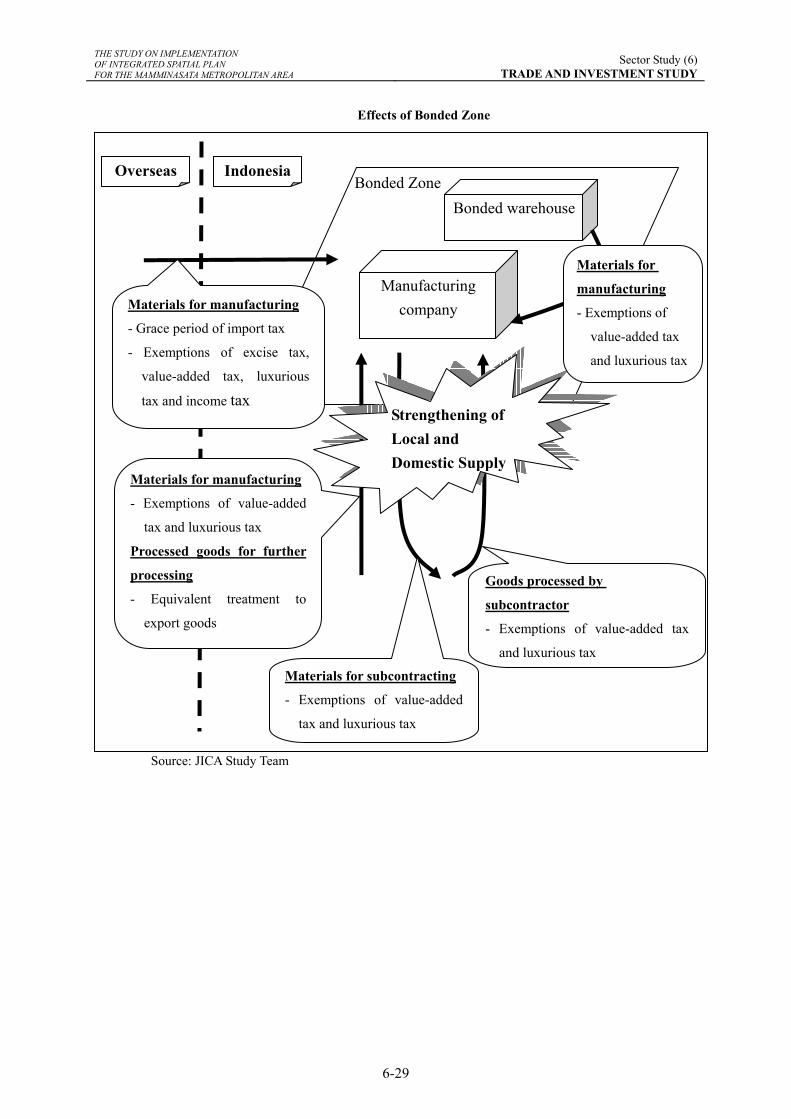
Effects of Bonded Zone
Source: JICA Study Team
Manufacturing company
Bonded Zone Overseas Indonesia
Materials for manufacturing
- Grace period of import tax
- Exemptions of excise tax,
value-added tax, luxurious
tax and income tax
Materials for manufacturing
- Exemptions of value-added
tax and luxurious tax
Processed goods for further
processing
- Equivalent treatment to
export goods
Materials for subcontracting
- Exemptions of value-added
tax and luxurious tax
Goods processed by
subcontractor
- Exemptions of value-added tax
and luxurious tax
Strengthening of Local and Domestic Supply
Bonded warehouse
Materials for
manufacturing
- Exemptions of
value-added tax
and luxurious tax
THE STUDY ON IMPLEMENTATION OF INTEGRATED SPATIAL PLAN FOR THE MAMMINASATA METROPOLITAN AREA
Sector Study (6)TRADE AND INVESTMENT STUDY
6-30
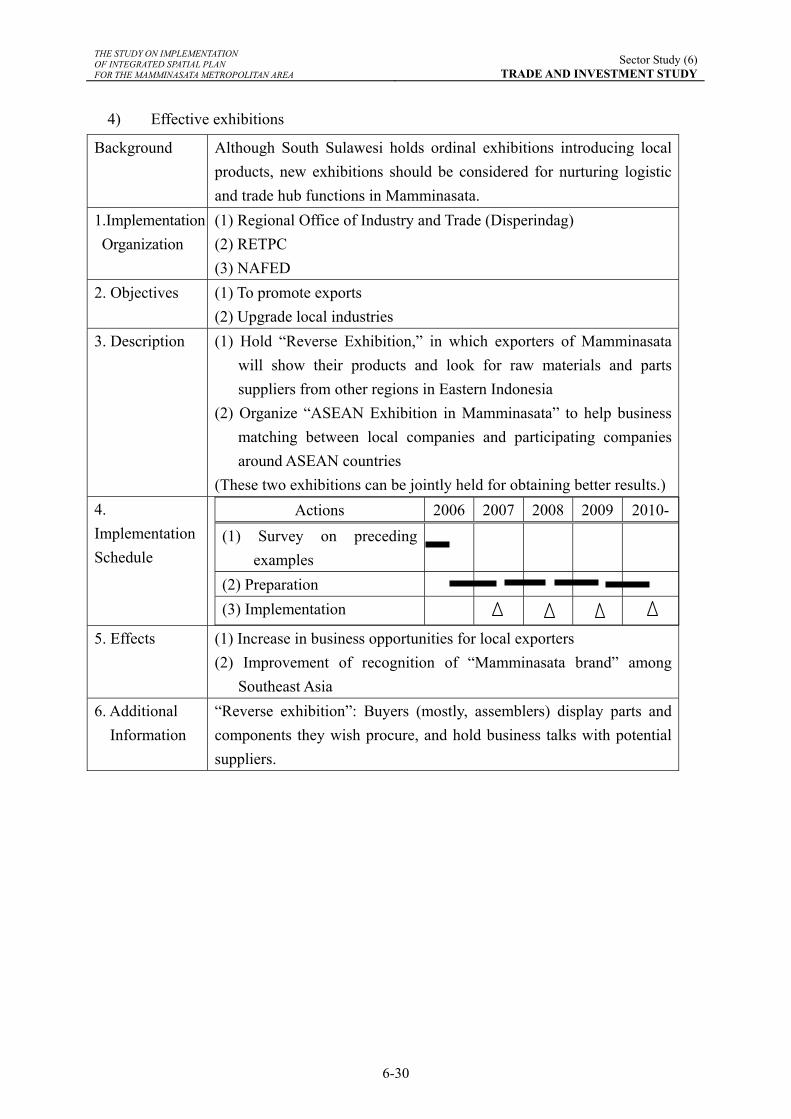
4) Effective exhibitions
Background Although South Sulawesi holds ordinal exhibitions introducing local products, new exhibitions should be considered for nurturing logistic and trade hub functions in Mamminasata.
1.Implementation Organization
(1) Regional Office of Industry and Trade (Disperindag) (2) RETPC (3) NAFED
2. Objectives (1) To promote exports (2) Upgrade local industries
3. Description (1) Hold “Reverse Exhibition,” in which exporters of Mamminasata will show their products and look for raw materials and parts suppliers from other regions in Eastern Indonesia
(2) Organize “ASEAN Exhibition in Mamminasata” to help business matching between local companies and participating companies around ASEAN countries
(These two exhibitions can be jointly held for obtaining better results.) 4. Implementation Schedule
Actions 2006 2007 2008 2009 2010-(1) Survey on preceding
examples
(2) Preparation (3) Implementation
5. Effects (1) Increase in business opportunities for local exporters
(2) Improvement of recognition of “Mamminasata brand” among Southeast Asia
6. Additional Information
“Reverse exhibition”: Buyers (mostly, assemblers) display parts and components they wish procure, and hold business talks with potential suppliers.
THE STUDY ON IMPLEMENTATION OF INTEGRATED SPATIAL PLAN FOR THE MAMMINASATA METROPOLITAN AREA
Sector Study (6)TRADE AND INVESTMENT STUDY
6-31
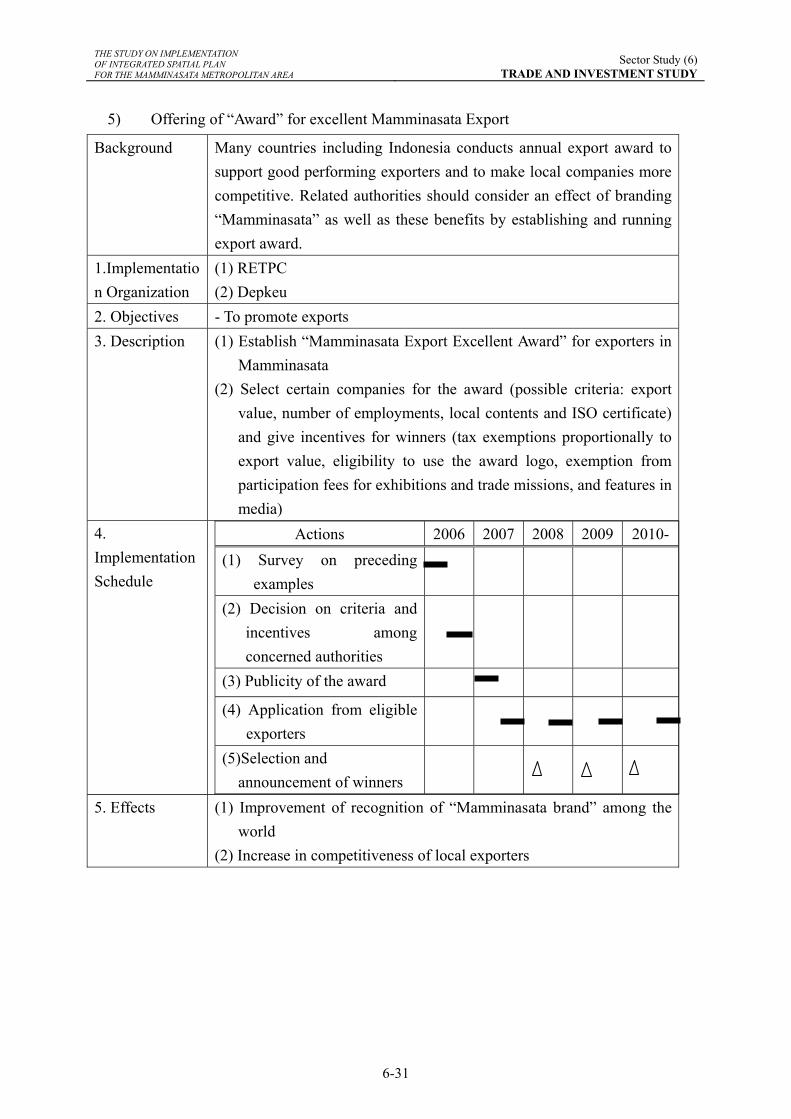
5) Offering of “Award” for excellent Mamminasata Export
Background Many countries including Indonesia conducts annual export award to support good performing exporters and to make local companies more competitive. Related authorities should consider an effect of branding “Mamminasata” as well as these benefits by establishing and running export award.
1.Implementation Organization
(1) RETPC (2) Depkeu
2. Objectives - To promote exports 3. Description (1) Establish “Mamminasata Export Excellent Award” for exporters in
Mamminasata (2) Select certain companies for the award (possible criteria: export
value, number of employments, local contents and ISO certificate) and give incentives for winners (tax exemptions proportionally to export value, eligibility to use the award logo, exemption from participation fees for exhibitions and trade missions, and features in media)
4. Implementation Schedule
Actions 2006 2007 2008 2009 2010-(1) Survey on preceding
examples
(2) Decision on criteria and incentives among concerned authorities
(3) Publicity of the award
(4) Application from eligible exporters
(5)Selection and announcement of winners
5. Effects (1) Improvement of recognition of “Mamminasata brand” among the
world (2) Increase in competitiveness of local exporters
THE STUDY ON IMPLEMENTATION OF INTEGRATED SPATIAL PLAN FOR THE MAMMINASATA METROPOLITAN AREA
Sector Study (6)TRADE AND INVESTMENT STUDY
6-32
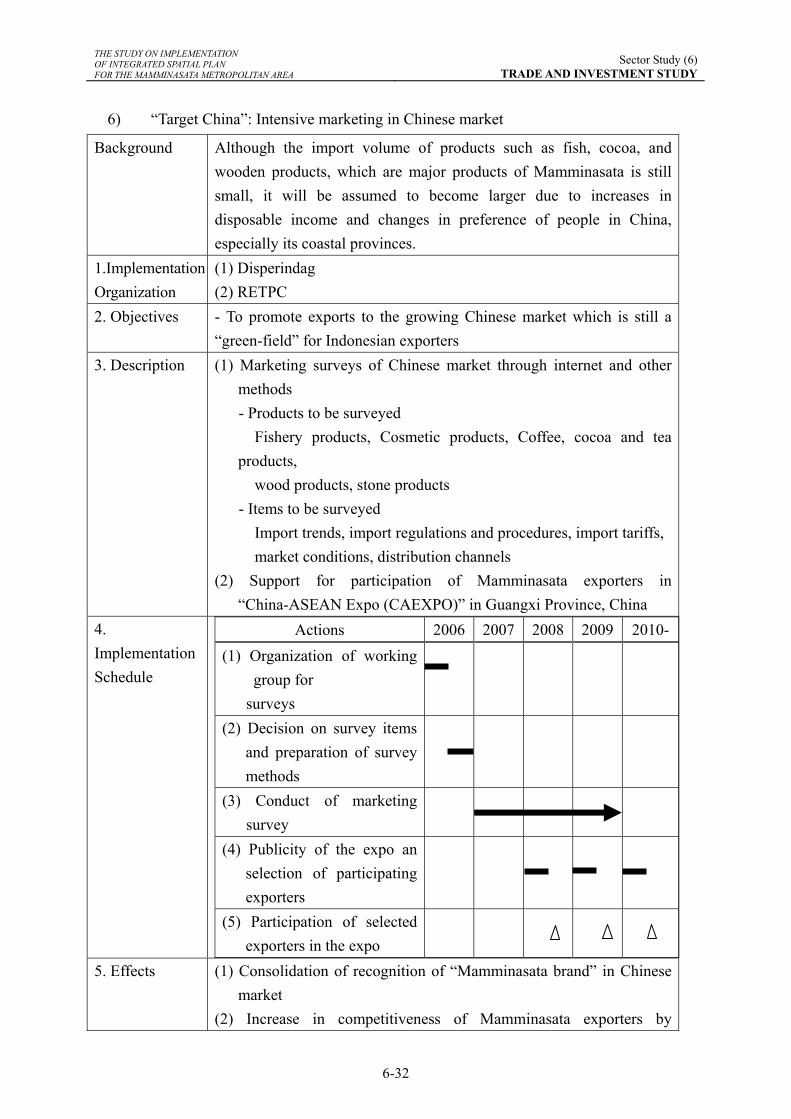
6) “Target China”: Intensive marketing in Chinese market
Background Although the import volume of products such as fish, cocoa, and wooden products, which are major products of Mamminasata is still small, it will be assumed to become larger due to increases in disposable income and changes in preference of people in China, especially its coastal provinces.
1.Implementation Organization
(1) Disperindag (2) RETPC
2. Objectives - To promote exports to the growing Chinese market which is still a “green-field” for Indonesian exporters
3. Description (1) Marketing surveys of Chinese market through internet and other methods
- Products to be surveyed Fishery products, Cosmetic products, Coffee, cocoa and tea
products, wood products, stone products - Items to be surveyed Import trends, import regulations and procedures, import tariffs, market conditions, distribution channels (2) Support for participation of Mamminasata exporters in
“China-ASEAN Expo (CAEXPO)” in Guangxi Province, China 4. Implementation Schedule
Actions 2006 2007 2008 2009 2010-(1) Organization of working
group for surveys
(2) Decision on survey items and preparation of survey methods
(3) Conduct of marketing survey
(4) Publicity of the expo an selection of participating exporters
(5) Participation of selected exporters in the expo
5. Effects (1) Consolidation of recognition of “Mamminasata brand” in Chinese
market (2) Increase in competitiveness of Mamminasata exporters by
THE STUDY ON IMPLEMENTATION OF INTEGRATED SPATIAL PLAN FOR THE MAMMINASATA METROPOLITAN AREA
Sector Study (6)TRADE AND INVESTMENT STUDY
6-33
understanding characteristic of the market and participating in the expo
6. Additional Information
(1) Under ASEAN-China Free Trade Area (ACFTA), tariff rates of fish, edible fruits and vegetables exported to China will be reduced to null in 2006.
(2) 11 Indonesian companies took part in the second CAEXPO in October, 2005. All signed contracts in the expo reached 1 billion USD.
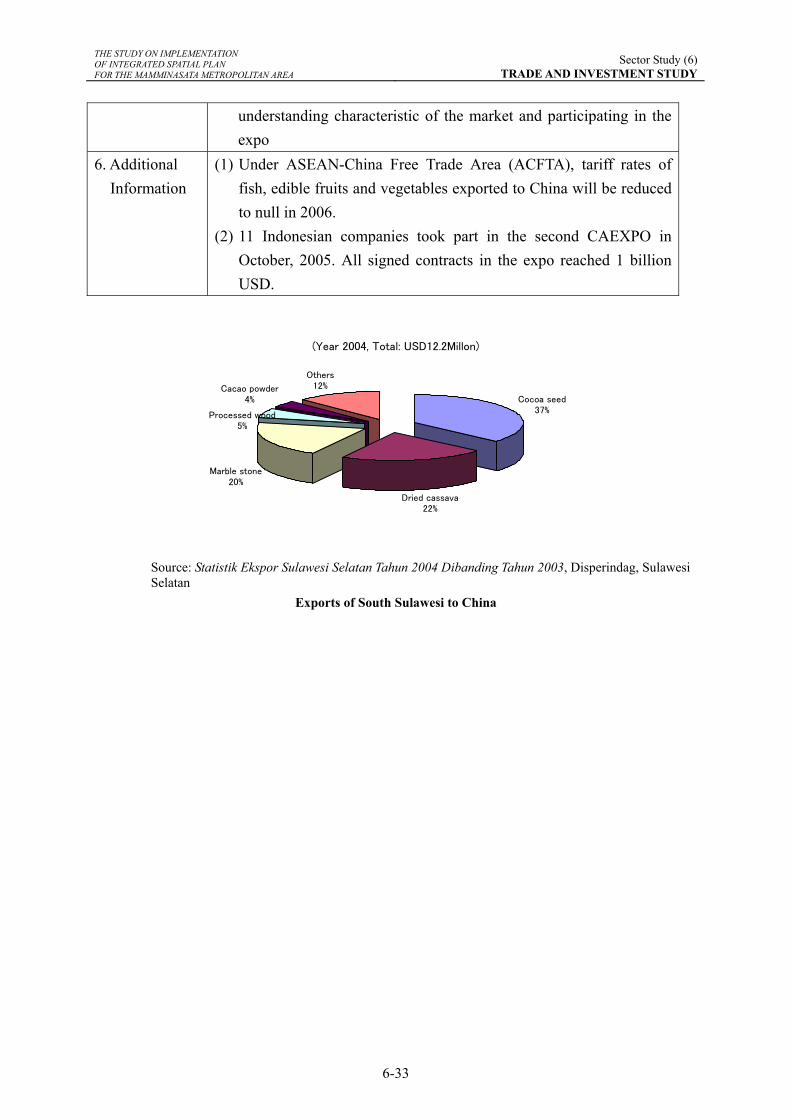
(Year 2004, Total: USD12.2Millon)
Cocoa seed37%
Dried cassava22%
Marble stone20%
Cacao powder4%
Others12%
Processed wood5%
Source: Statistik Ekspor Sulawesi Selatan Tahun 2004 Dibanding Tahun 2003, Disperindag, Sulawesi Selatan
Exports of South Sulawesi to China
THE STUDY ON IMPLEMENTATION OF INTEGRATED SPATIAL PLAN FOR THE MAMMINASATA METROPOLITAN AREA
Sector Study (6)TRADE AND INVESTMENT STUDY
6-34
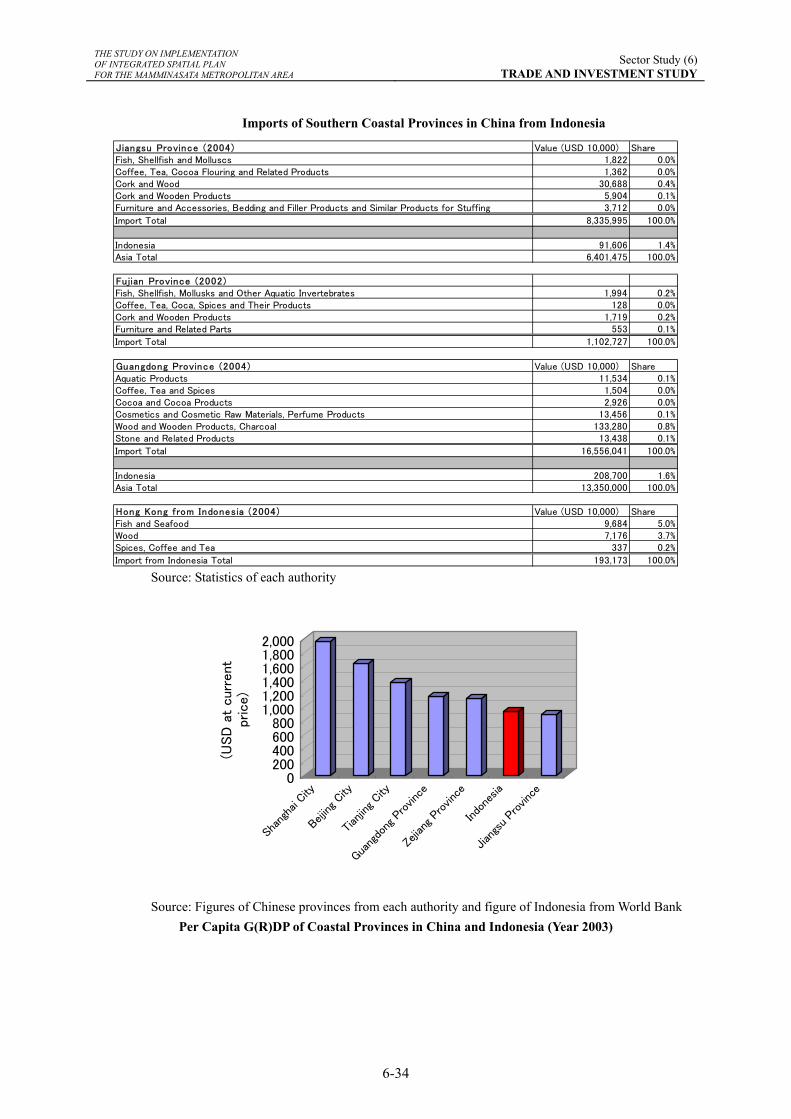
Imports of Southern Coastal Provinces in China from Indonesia
Jiangsu Province (2004) Value (USD 10,000) ShareFish, Shellfish and Molluscs 1,822 0.0%Coffee, Tea, Cocoa Flouring and Related Products 1,362 0.0%Cork and Wood 30,688 0.4%Cork and Wooden Products 5,904 0.1%Furniture and Accessories, Bedding and Filler Products and Similar Products for Stuffing 3,712 0.0%
Import Total 8,335,995 100.0%
Indonesia 91,606 1.4%Asia Total 6,401,475 100.0%
Fujian Province (2002)Fish, Shellfish, Mollusks and Other Aquatic Invertebrates 1,994 0.2%Coffee, Tea, Coca, Spices and Their Products 128 0.0%Cork and Wooden Products 1,719 0.2%Furniture and Related Parts 553 0.1%
Import Total 1,102,727 100.0%
Guangdong Province (2004) Value (USD 10,000) ShareAquatic Products 11,534 0.1%Coffee, Tea and Spices 1,504 0.0%Cocoa and Cocoa Products 2,926 0.0%Cosmetics and Cosmetic Raw Materials, Perfume Products 13,456 0.1%Wood and Wooden Products, Charcoal 133,280 0.8%Stone and Related Products 13,438 0.1%
Import Total 16,556,041 100.0%
Indonesia 208,700 1.6%Asia Total 13,350,000 100.0%
Hong Kong from Indonesia (2004) Value (USD 10,000) ShareFish and Seafood 9,684 5.0%Wood 7,176 3.7%Spices, Coffee and Tea 337 0.2%
Import from Indonesia Total 193,173 100.0% Source: Statistics of each authority
0200400600800
1,0001,2001,4001,6001,8002,000
(USD
at
curr
ent
pric
e)
Shan
ghai
City
Beijin
g City
Tian
jing City
Guang
dong
Provin
ce
Zejia
ng P
rovin
ce
Indo
nesia
Jian
gsu Pr
ovinc
e
Source: Figures of Chinese provinces from each authority and figure of Indonesia from World Bank Per Capita G(R)DP of Coastal Provinces in China and Indonesia (Year 2003)
Study on Implementation of
Integrated Spatial Plan for
The Mamminasata Metropolitan Area
SECTOR STUDY (7)
TOURISM DEVELOPMENT STUDY
KRI International Corp.
Nippon Koei Co., Ltd.
THE STUDY ON IMPLEMENTATION OF INTEGRATED SPATIAL PLAN FOR THE MAMMINASATA METROPOLITAN AREA
Sector Study (7)TOURISM DEVELOPMENT STUDY
Table of Contents
1. OVERVIEW OF TOURISM SECTOR.......................................................................... 1 1.1. Present Condition of Tourism............................................................................. 1
1.2. Tourism Market Trend in South Sulawesi.......................................................... 2
1.3. Tourism Market Trend in Mamminasata ............................................................ 3
1.4. Tourism Resources and Attractions in Mamminasata ........................................ 5
1.5. Tourism-related Products ................................................................................. 10
1.6. Tourism Zones and Network in Mamminasata ................................................ 10
1.7. Typical Tour Patterns to South Sulawesi.......................................................... 11
1.8. Major Constraints on Tourism.......................................................................... 12
1.9. Tourism Development Potential....................................................................... 13
2. TOURISM DEVELOPMENT PLAN........................................................................... 15 2.1. Tourism Demand Projection............................................................................. 15
2.2. Tourism Receipt and Contribution to GRDP ................................................... 18
2.3. Target Tourism Market ..................................................................................... 20
2.4. Development and Scenario............................................................................... 21
2.5. Tourism Promotion Strategy ............................................................................ 23
2.6. Proposed Projects/Programs............................................................................. 29
THE STUDY ON IMPLEMENTATION OF INTEGRATED SPATIAL PLAN FOR THE MAMMINASATA METROPOLITAN AREA
Sector Study (7)TOURISM DEVELOPMENT STUDY
7-1
1. OVERVIEW OF TOURISM SECTOR
1.1. Present Condition of Tourism
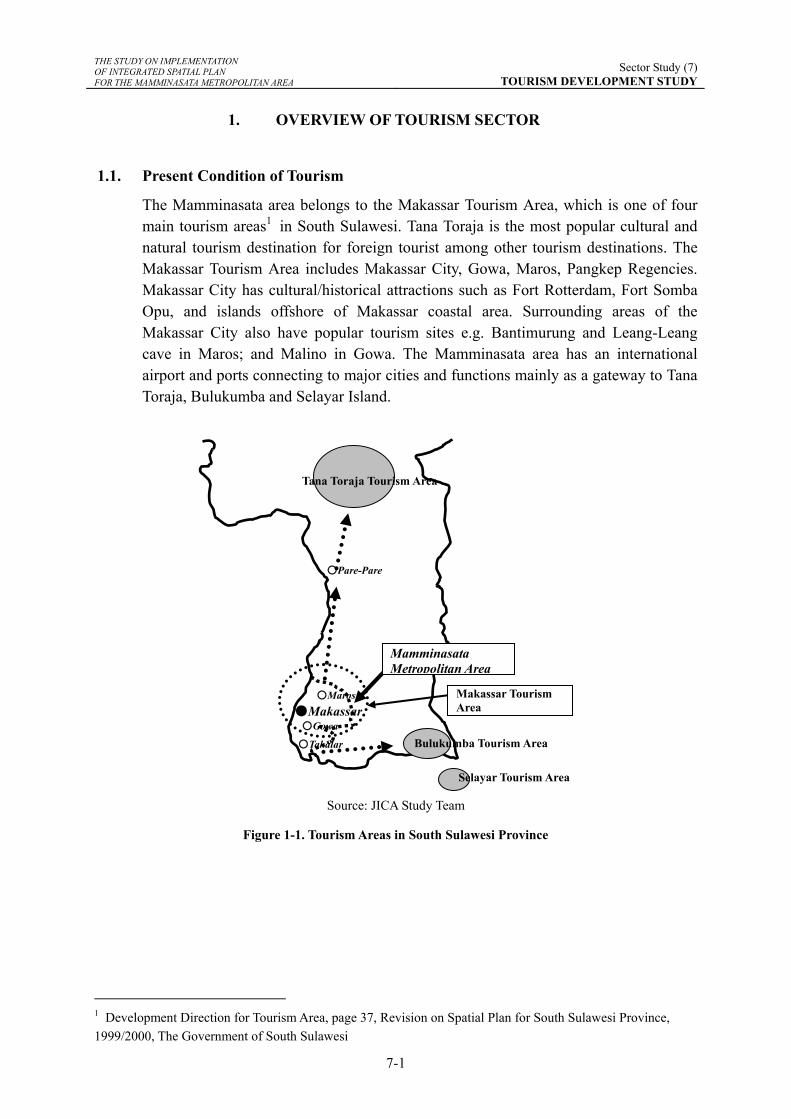
The Mamminasata area belongs to the Makassar Tourism Area, which is one of four main tourism areas1 in South Sulawesi. Tana Toraja is the most popular cultural and natural tourism destination for foreign tourist among other tourism destinations. The Makassar Tourism Area includes Makassar City, Gowa, Maros, Pangkep Regencies. Makassar City has cultural/historical attractions such as Fort Rotterdam, Fort Somba Opu, and islands offshore of Makassar coastal area. Surrounding areas of the Makassar City also have popular tourism sites e.g. Bantimurung and Leang-Leang cave in Maros; and Malino in Gowa. The Mamminasata area has an international airport and ports connecting to major cities and functions mainly as a gateway to Tana Toraja, Bulukumba and Selayar Island.
Source: JICA Study Team
Figure 1-1. Tourism Areas in South Sulawesi Province
1 Development Direction for Tourism Area, page 37, Revision on Spatial Plan for South Sulawesi Province, 1999/2000, The Government of South Sulawesi
○Takalar
●Makassar ○Maros
○Gowa
Tana Toraja Tourism Area
Bulukumba Tourism Area
○Pare-Pare
Mamminasata Metropolitan Area
Selayar Tourism Area
Makassar Tourism Area
THE STUDY ON IMPLEMENTATION OF INTEGRATED SPATIAL PLAN FOR THE MAMMINASATA METROPOLITAN AREA
Sector Study (7)TOURISM DEVELOPMENT STUDY
7-2
147,402
289,526
387,356
489,765
571,625
102,13810,9979,56312,09410,088
88,337
239,560260,094
622,935
414,841419,213
0
100,000
200,000
300,000
400,000
500,000
600,000
700,000
1996 1997 1998 1999 2000 2001 2002 2003
Foreign
Domestic
Source: Tourism Marketing & Promotion, Culture and Tourism Office, South Sulawesi Province
Figure 1-2 Foreign and Domestic Visitors to South Sulawesi (1999 – 2003)
1.2. Tourism Market Trend in South Sulawesi
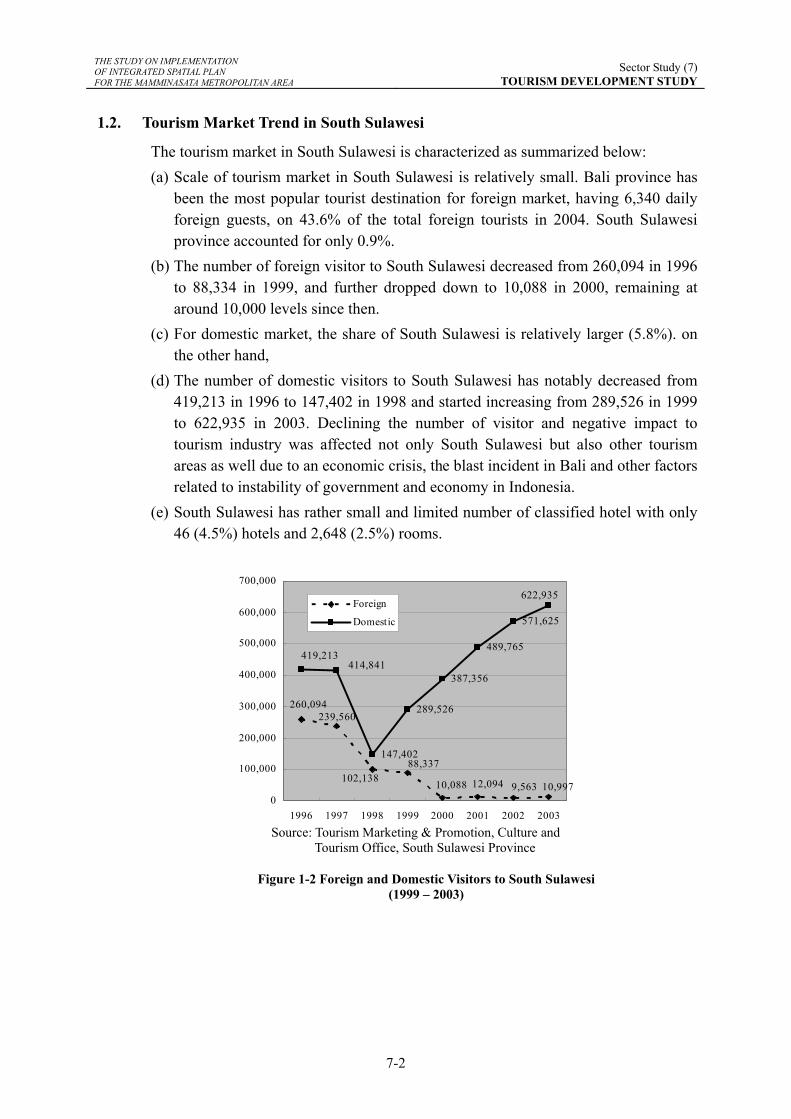
The tourism market in South Sulawesi is characterized as summarized below: (a) Scale of tourism market in South Sulawesi is relatively small. Bali province has
been the most popular tourist destination for foreign market, having 6,340 daily foreign guests, on 43.6% of the total foreign tourists in 2004. South Sulawesi province accounted for only 0.9%.
(b) The number of foreign visitor to South Sulawesi decreased from 260,094 in 1996 to 88,334 in 1999, and further dropped down to 10,088 in 2000, remaining at around 10,000 levels since then.
(c) For domestic market, the share of South Sulawesi is relatively larger (5.8%). on the other hand,
(d) The number of domestic visitors to South Sulawesi has notably decreased from 419,213 in 1996 to 147,402 in 1998 and started increasing from 289,526 in 1999 to 622,935 in 2003. Declining the number of visitor and negative impact to tourism industry was affected not only South Sulawesi but also other tourism areas as well due to an economic crisis, the blast incident in Bali and other factors related to instability of government and economy in Indonesia.
(e) South Sulawesi has rather small and limited number of classified hotel with only 46 (4.5%) hotels and 2,648 (2.5%) rooms.
THE STUDY ON IMPLEMENTATION OF INTEGRATED SPATIAL PLAN FOR THE MAMMINASATA METROPOLITAN AREA
Sector Study (7)TOURISM DEVELOPMENT STUDY
7-3
1.3. Tourism Market Trend in Mamminasata 1) Visitor to Mamminasata
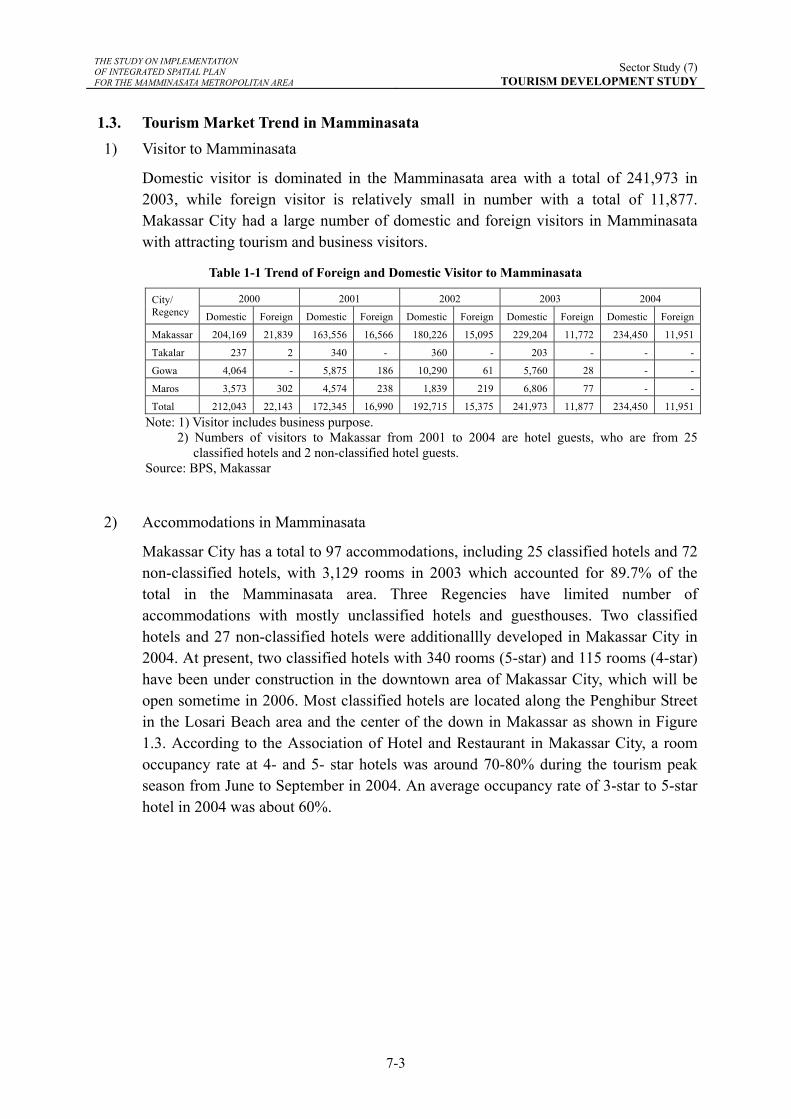
Domestic visitor is dominated in the Mamminasata area with a total of 241,973 in 2003, while foreign visitor is relatively small in number with a total of 11,877. Makassar City had a large number of domestic and foreign visitors in Mamminasata with attracting tourism and business visitors.
Table 1-1 Trend of Foreign and Domestic Visitor to Mamminasata
2000 2001 2002 2003 2004 City/ Regency Domestic Foreign Domestic Foreign Domestic Foreign Domestic Foreign Domestic Foreign
Makassar 204,169 21,839 163,556 16,566 180,226 15,095 229,204 11,772 234,450 11,951
Takalar 237 2 340 - 360 - 203 - - -
Gowa 4,064 - 5,875 186 10,290 61 5,760 28 - -
Maros 3,573 302 4,574 238 1,839 219 6,806 77 - -
Total 212,043 22,143 172,345 16,990 192,715 15,375 241,973 11,877 234,450 11,951Note: 1) Visitor includes business purpose.
2) Numbers of visitors to Makassar from 2001 to 2004 are hotel guests, who are from 25 classified hotels and 2 non-classified hotel guests.
Source: BPS, Makassar
2) Accommodations in Mamminasata
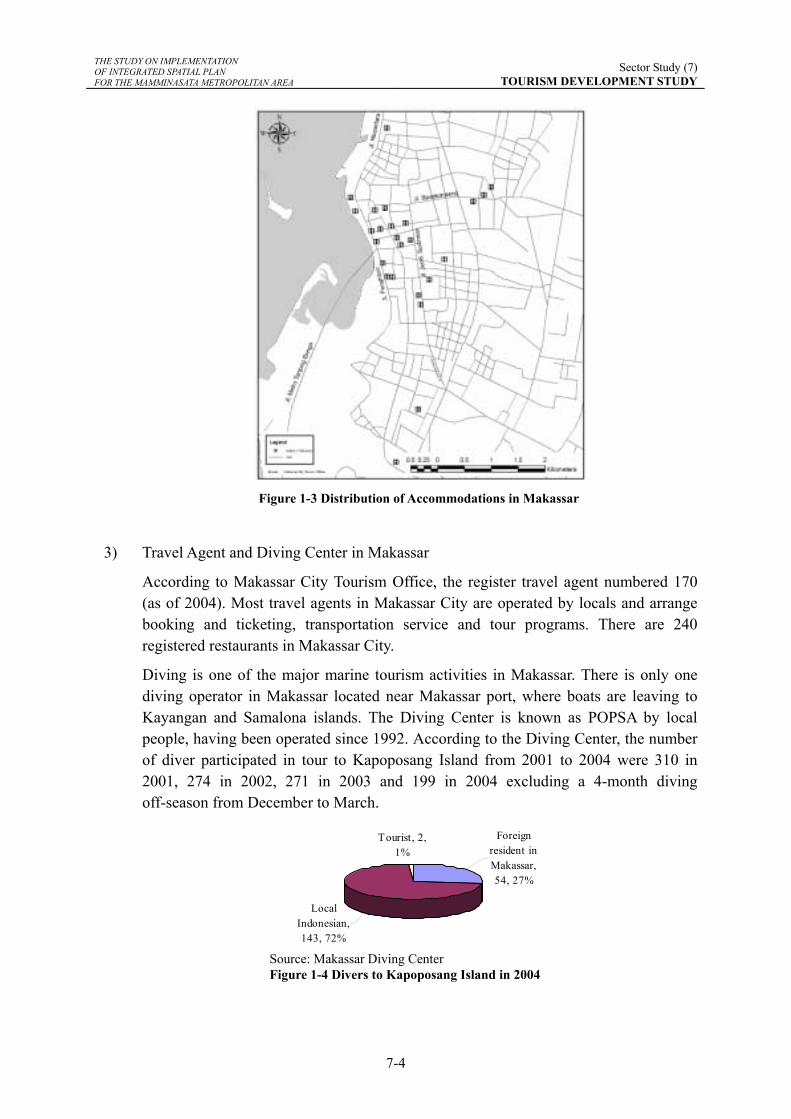
Makassar City has a total to 97 accommodations, including 25 classified hotels and 72 non-classified hotels, with 3,129 rooms in 2003 which accounted for 89.7% of the total in the Mamminasata area. Three Regencies have limited number of accommodations with mostly unclassified hotels and guesthouses. Two classified hotels and 27 non-classified hotels were additionallly developed in Makassar City in 2004. At present, two classified hotels with 340 rooms (5-star) and 115 rooms (4-star) have been under construction in the downtown area of Makassar City, which will be open sometime in 2006. Most classified hotels are located along the Penghibur Street in the Losari Beach area and the center of the down in Makassar as shown in Figure 1.3. According to the Association of Hotel and Restaurant in Makassar City, a room occupancy rate at 4- and 5- star hotels was around 70-80% during the tourism peak season from June to September in 2004. An average occupancy rate of 3-star to 5-star hotel in 2004 was about 60%.
THE STUDY ON IMPLEMENTATION OF INTEGRATED SPATIAL PLAN FOR THE MAMMINASATA METROPOLITAN AREA
Sector Study (7)TOURISM DEVELOPMENT STUDY
7-4
Figure 1-3 Distribution of Accommodations in Makassar
3) Travel Agent and Diving Center in Makassar
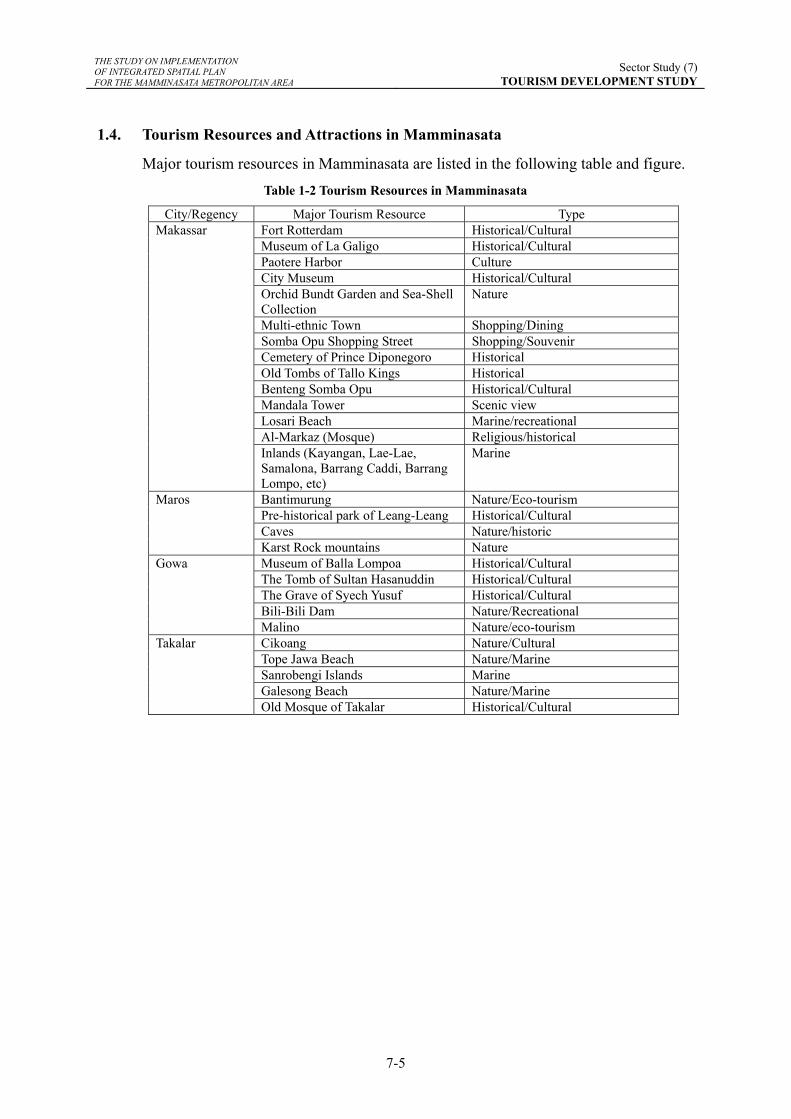
According to Makassar City Tourism Office, the register travel agent numbered 170 (as of 2004). Most travel agents in Makassar City are operated by locals and arrange booking and ticketing, transportation service and tour programs. There are 240 registered restaurants in Makassar City.
Diving is one of the major marine tourism activities in Makassar. There is only one diving operator in Makassar located near Makassar port, where boats are leaving to Kayangan and Samalona islands. The Diving Center is known as POPSA by local people, having been operated since 1992. According to the Diving Center, the number of diver participated in tour to Kapoposang Island from 2001 to 2004 were 310 in 2001, 274 in 2002, 271 in 2003 and 199 in 2004 excluding a 4-month diving off-season from December to March.
Tourist, 2,1%
LocalIndonesian,143, 72%
Foreignresident inMakassar,54, 27%
Source: Makassar Diving Center Figure 1-4 Divers to Kapoposang Island in 2004
THE STUDY ON IMPLEMENTATION OF INTEGRATED SPATIAL PLAN FOR THE MAMMINASATA METROPOLITAN AREA
Sector Study (7)TOURISM DEVELOPMENT STUDY
7-5
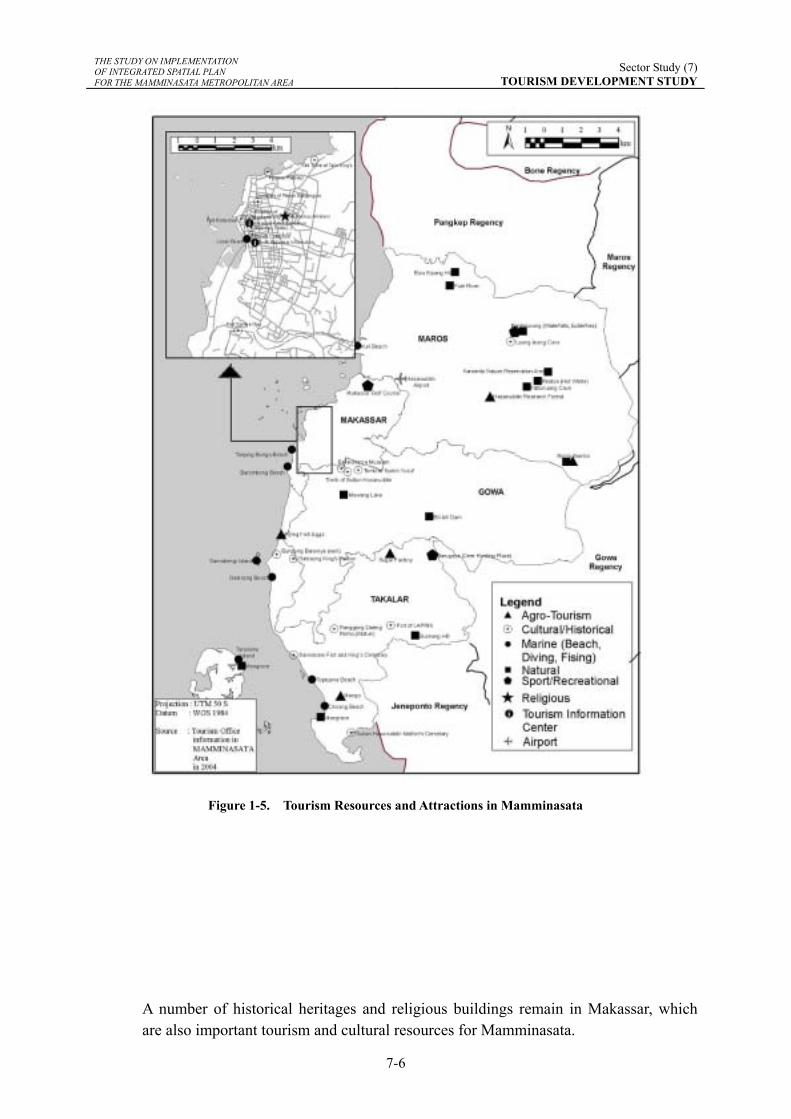
1.4. Tourism Resources and Attractions in Mamminasata
Major tourism resources in Mamminasata are listed in the following table and figure. Table 1-2 Tourism Resources in Mamminasata
City/Regency Major Tourism Resource Type Makassar Fort Rotterdam Historical/Cultural Museum of La Galigo Historical/Cultural Paotere Harbor Culture City Museum Historical/Cultural Orchid Bundt Garden and Sea-Shell
Collection Nature
Multi-ethnic Town Shopping/Dining Somba Opu Shopping Street Shopping/Souvenir Cemetery of Prince Diponegoro Historical Old Tombs of Tallo Kings Historical Benteng Somba Opu Historical/Cultural Mandala Tower Scenic view Losari Beach Marine/recreational Al-Markaz (Mosque) Religious/historical Inlands (Kayangan, Lae-Lae,
Samalona, Barrang Caddi, Barrang Lompo, etc)
Marine
Maros Bantimurung Nature/Eco-tourism Pre-historical park of Leang-Leang Historical/Cultural Caves Nature/historic Karst Rock mountains Nature Gowa Museum of Balla Lompoa Historical/Cultural The Tomb of Sultan Hasanuddin Historical/Cultural The Grave of Syech Yusuf Historical/Cultural Bili-Bili Dam Nature/Recreational Malino Nature/eco-tourism Takalar Cikoang Nature/Cultural Tope Jawa Beach Nature/Marine Sanrobengi Islands Marine Galesong Beach Nature/Marine Old Mosque of Takalar Historical/Cultural
THE STUDY ON IMPLEMENTATION OF INTEGRATED SPATIAL PLAN FOR THE MAMMINASATA METROPOLITAN AREA
Sector Study (7)TOURISM DEVELOPMENT STUDY
7-6
Figure 1-5. Tourism Resources and Attractions in Mamminasata
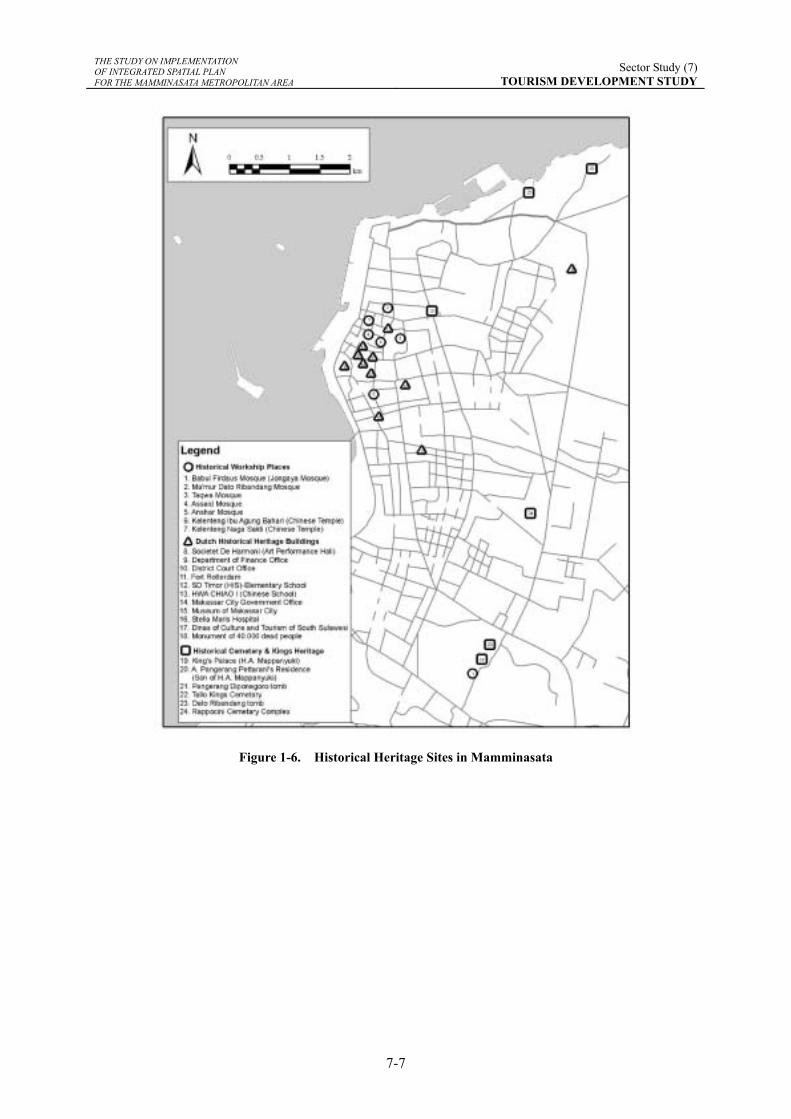
A number of historical heritages and religious buildings remain in Makassar, which are also important tourism and cultural resources for Mamminasata.
THE STUDY ON IMPLEMENTATION OF INTEGRATED SPATIAL PLAN FOR THE MAMMINASATA METROPOLITAN AREA
Sector Study (7)TOURISM DEVELOPMENT STUDY
7-7
Figure 1-6. Historical Heritage Sites in Mamminasata
THE STUDY ON IMPLEMENTATION OF INTEGRATED SPATIAL PLAN FOR THE MAMMINASATA METROPOLITAN AREA
Sector Study (7)TOURISM DEVELOPMENT STUDY
7-8
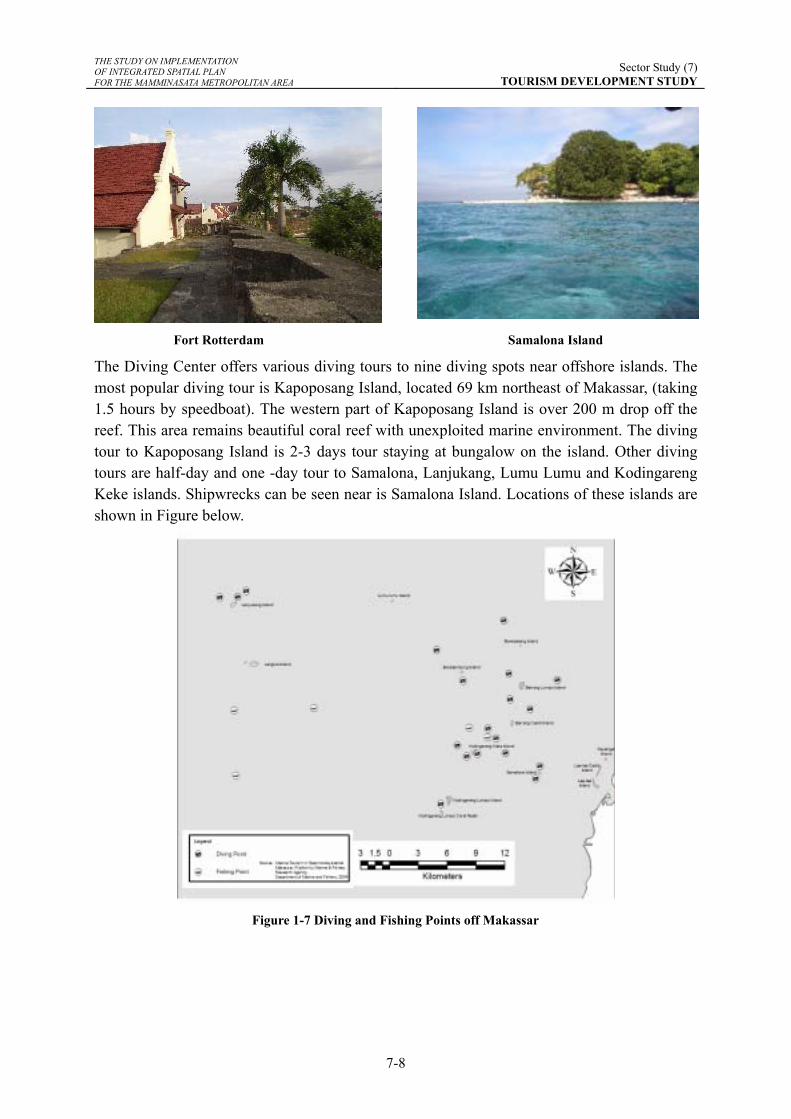
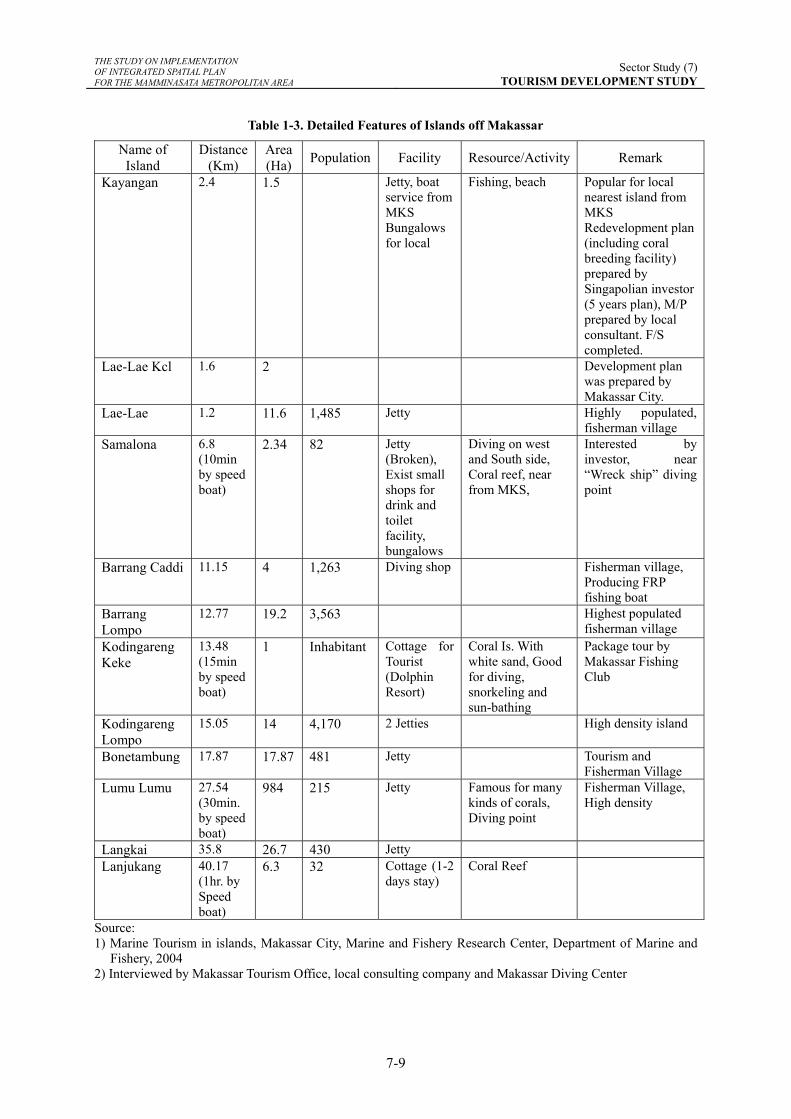
The Diving Center offers various diving tours to nine diving spots near offshore islands. The most popular diving tour is Kapoposang Island, located 69 km northeast of Makassar, (taking 1.5 hours by speedboat). The western part of Kapoposang Island is over 200 m drop off the reef. This area remains beautiful coral reef with unexploited marine environment. The diving tour to Kapoposang Island is 2-3 days tour staying at bungalow on the island. Other diving tours are half-day and one -day tour to Samalona, Lanjukang, Lumu Lumu and Kodingareng Keke islands. Shipwrecks can be seen near is Samalona Island. Locations of these islands are shown in Figure below.
Figure 1-7 Diving and Fishing Points off Makassar
Fort Rotterdam Samalona Island
THE STUDY ON IMPLEMENTATION OF INTEGRATED SPATIAL PLAN FOR THE MAMMINASATA METROPOLITAN AREA
Sector Study (7)TOURISM DEVELOPMENT STUDY
7-9
Table 1-3. Detailed Features of Islands off Makassar
Name of Island
Distance (Km)
Area (Ha) Population Facility Resource/Activity Remark
Kayangan 2.4 1.5 Jetty, boat service from MKS Bungalows for local
Fishing, beach Popular for local nearest island from MKS Redevelopment plan (including coral breeding facility) prepared by Singapolian investor (5 years plan), M/P prepared by local consultant. F/S completed.
Lae-Lae Kcl 1.6 2 Development plan was prepared by Makassar City.
Lae-Lae 1.2 11.6 1,485 Jetty Highly populated, fisherman village
Samalona 6.8 (10min by speed boat)
2.34 82 Jetty (Broken), Exist small shops for drink and toilet facility, bungalows
Diving on west and South side, Coral reef, near from MKS,
Interested by investor, near “Wreck ship” diving point
Barrang Caddi 11.15 4 1,263 Diving shop Fisherman village, Producing FRP fishing boat
Barrang Lompo
12.77 19.2 3,563 Highest populated fisherman village
Kodingareng Keke
13.48 (15min by speed boat)
1 Inhabitant Cottage for Tourist (Dolphin Resort)
Coral Is. With white sand, Good for diving, snorkeling and sun-bathing
Package tour by Makassar Fishing Club
Kodingareng Lompo
15.05 14 4,170 2 Jetties High density island
Bonetambung 17.87 17.87 481 Jetty Tourism and Fisherman Village
Lumu Lumu 27.54 (30min. by speed boat)
984 215 Jetty Famous for many kinds of corals, Diving point
Fisherman Village, High density
Langkai 35.8 26.7 430 Jetty Lanjukang 40.17
(1hr. by Speed boat)
6.3 32 Cottage (1-2 days stay)
Coral Reef
Source: 1) Marine Tourism in islands, Makassar City, Marine and Fishery Research Center, Department of Marine and
Fishery, 2004 2) Interviewed by Makassar Tourism Office, local consulting company and Makassar Diving Center
THE STUDY ON IMPLEMENTATION OF INTEGRATED SPATIAL PLAN FOR THE MAMMINASATA METROPOLITAN AREA
Sector Study (7)TOURISM DEVELOPMENT STUDY
7-10
1.5. Tourism-related Products
Tourism-related products in Mamminasata are categorized into handicraft/souvenir, agro-products/fruits, and local cuisine as summarized in the table below.
Table 1-4 Tourism-related Products in Mamminasata
Tourism Products Characteristics Handicraft and Souvenir
Most of souvenir shops are located along Somba Opu Shopping Street. Souvenirs and tourism products sold at shops in Makassar are mostly Tana Toraja products due to the gateway of Tana Toraja. Major souvenirs in Makassar and its surrounding area are shell and wood curving products, silver jewellery, traditional silk cloth and silk woven products, traditional hat woven by palm fibre. Souvenir shops in Makassar also sell products such as wood curving, silver product and T-shirt featuring a traditional ship of Makassar, which is a typical image of Makassar
Agro-products and Fruits
Juice and sweets made from Markisa fruit are very popular agro products in Makassar. Tropical fruits such as mango and avocado are produced in Malino and Takalar Regencies. Tea produced by Nitto Tea Factory in Malino Regency and coffee produced in Tana Toraja are also sold in Makassar
Local cuisine An abundance of seafood is available in Makassar with reasonable price for local and foreign tourists. There is a famous local cuisine in Makassar called coto Makassar, which is a soup made from buffalo innards, although it is suited for local tourists. Grilled river fish is very popular for local people in Makassar and other Regencies.
1.6. Tourism Zones and Network in Mamminasata
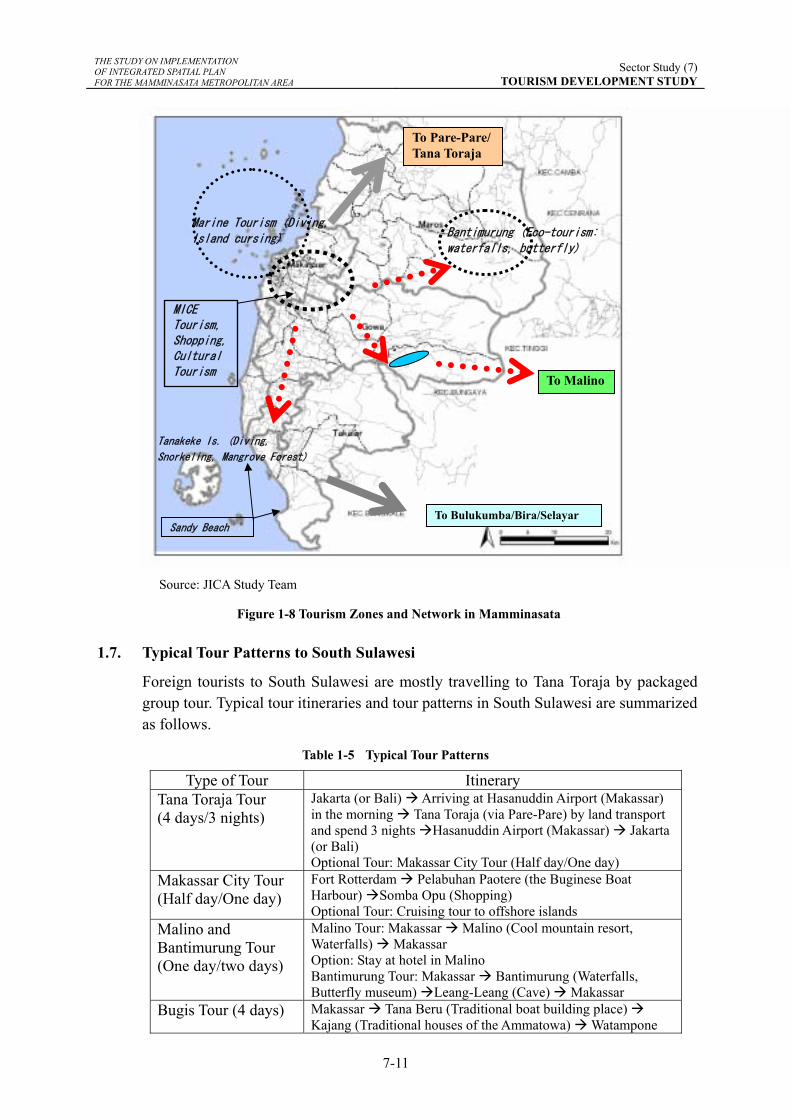
Tourism zones and network in Mamminasata and its surrounding tourism destinations are illustrated in Figure 1.8. Makassar is situated in the centre and connects to major tourism zones in Maros, Gowa and Takalar by road. Many islands and costal beaches are accessible by speedboat or local boat.
THE STUDY ON IMPLEMENTATION OF INTEGRATED SPATIAL PLAN FOR THE MAMMINASATA METROPOLITAN AREA
Sector Study (7)TOURISM DEVELOPMENT STUDY
7-11
Source: JICA Study Team
Figure 1-8 Tourism Zones and Network in Mamminasata
1.7. Typical Tour Patterns to South Sulawesi
Foreign tourists to South Sulawesi are mostly travelling to Tana Toraja by packaged group tour. Typical tour itineraries and tour patterns in South Sulawesi are summarized as follows.
Table 1-5 Typical Tour Patterns
Type of Tour Itinerary Tana Toraja Tour (4 days/3 nights)
Jakarta (or Bali) Arriving at Hasanuddin Airport (Makassar) in the morning Tana Toraja (via Pare-Pare) by land transport and spend 3 nights Hasanuddin Airport (Makassar) Jakarta (or Bali) Optional Tour: Makassar City Tour (Half day/One day)
Makassar City Tour (Half day/One day)
Fort Rotterdam Pelabuhan Paotere (the Buginese Boat Harbour) Somba Opu (Shopping) Optional Tour: Cruising tour to offshore islands
Malino and Bantimurung Tour (One day/two days)
Malino Tour: Makassar Malino (Cool mountain resort, Waterfalls) Makassar Option: Stay at hotel in Malino Bantimurung Tour: Makassar Bantimurung (Waterfalls, Butterfly museum) Leang-Leang (Cave) Makassar
Bugis Tour (4 days) Makassar Tana Beru (Traditional boat building place) Kajang (Traditional houses of the Ammatowa) Watampone
MICE Tourism, Shopping, Cultural Tourism
To Pare-Pare/Tana Toraja
To Malino
Marine Tourism (Diving,
Island cursing)
Tanakeke Is. (Diving,
Snorkeling, Mangrove Forest)
Bantimurung (Eco-tourism:
waterfalls, butterfly)
To Bulukumba/Bira/Selayar Sandy Beach
THE STUDY ON IMPLEMENTATION OF INTEGRATED SPATIAL PLAN FOR THE MAMMINASATA METROPOLITAN AREA
Sector Study (7)TOURISM DEVELOPMENT STUDY
7-12
Sengkang Danau Tempe Pare-Pare Makassar Diving tour to Selayar Island
Option 1: Makassar Bira Harbour (5 hours by bus) Selayar Port Option 2: Makassar Selayar Airport (50 min. by air) Option 3: Makassar Selayar Port (10-11 hours by ferry)
Source: Tour information from travel agents in Makassar City
1.8. Major Constraints on Tourism
For tourism development in Mamminasata, various constraints are observed. Major constraints are:
1) Visitor Trend (a) Domestic visitor dominates tourism to Mamminasata. (b) Makassar is a gateway as well as transit point to Tana Toraja for foreign tourists
and majority of foreign tourists will not stay long at Makassar City.
2) Tourism Resources (a) Existing tourism resources attract more domestic tourists and less foreign tourists. (b) Island resort type is still limited on offshore islands near Makassar. Some islands
do not even have public service facilities such as toilets for visitor. (c) Although there exist many natural, cultural and historical resources in
Mamminasata and its surrounding areas, they are not well managed, developed and promoted to attract foreign and domestic visitors.
3) Tourism Facilities and Infrastructure (a) Existing museums e.g. as Makassar City Museum, La Galigo Museum in Fort
Rotterdam in Makassar and Balla Lompoa in Gowa are outdated in terms of display and presentation. Explanation of display and presentation in these museums are mostly in local language, English explanation is needed as well.
(b) Explanation signboard at major tourism sites are also in local language only, they should be improved.
(c) Some sections of access to tourist sites in Gowa, Takalar and Maros are in poor condition due to lack of road maintenance.
(d) Existing tourist information centres (South Sulawesi and Makassar) are inconvenient for tourists to access because of their locations. Visitors to these tourist information centres are quite limited in number.
(e) There is no visitor centre at other major tourism sites, such as Malino and Bantimurung.
(f) Existing pier (boat leaves for Kayangan Island) and its surrounding area are in poor condition and they should be redeveloped.
4) Tourism Products and Attractions (a) A variety of souvenirs and products are sold at souvenir shops in Makassar, but
they are mostly Tana Toraja products. Little local souvenirs from Makassar and its surroundings is made available.
THE STUDY ON IMPLEMENTATION OF INTEGRATED SPATIAL PLAN FOR THE MAMMINASATA METROPOLITAN AREA
Sector Study (7)TOURISM DEVELOPMENT STUDY
7-13
(b) There is no sufficient handicraft centre for tourists to enjoy handicraft demonstration and shopping.
(c) There is no place to show traditional dances and cultural performances to tourists.
5) Tourism Administration and Human Resource Development (a) Tourism statistical data is not properly managed and developed by the local
government. It is difficult to obtain reliable tourism data such as number of tourists (foreign/domestic) from the Statistic Office (BPS), Immigration Office, Makassar City and other Regencies.
(b) Lack of coordination, cooperation and information sharing is observed among divisions at provincial tourism offices.
(c) Allocation of budget is limited for improvements in tourism facilities and infrastructure.
(d) Capacity of human resource in the public and private sector is limited in tourism, and training and re-training of human resource is insufficient.
6) Tourism Information and Promotion (a) Tourism Information Centre (TIC) is not utilized effectively for providing
tourism information and promoting tourism at South Sulawesi and Makassar City. Existing TICs are inconvenience to access and need to have audio-visual presentation and information database.
(b) Limited budget is earmarked for tourism promotion in domestic and international markets at the provincial and local governments.
7) Tourism Industry and Regional/Local Economy Tourism industry in Mamminasata has weak linkages with other economic activities in the region.
1.9. Tourism Development Potential
While tourism in Mamminasata has various constraints as pointed above, it really has potentials as summarized in the table below.
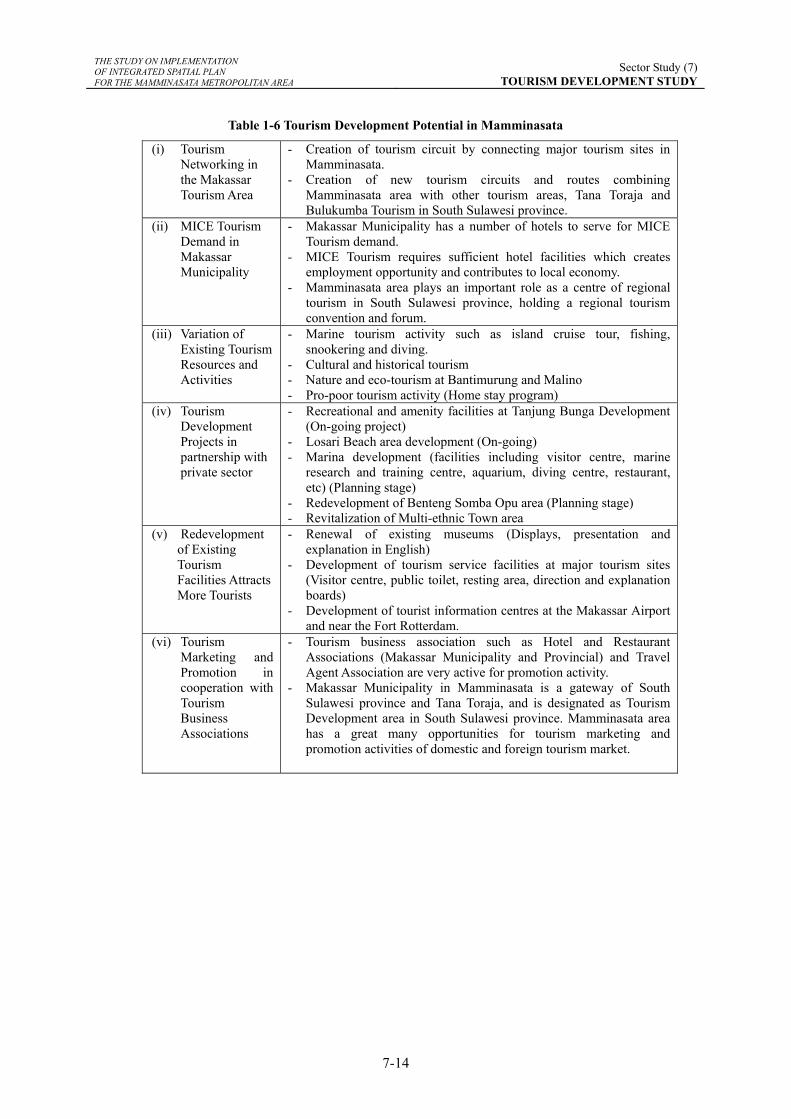
THE STUDY ON IMPLEMENTATION OF INTEGRATED SPATIAL PLAN FOR THE MAMMINASATA METROPOLITAN AREA
Sector Study (7)TOURISM DEVELOPMENT STUDY
7-14
Table 1-6 Tourism Development Potential in Mamminasata
(i) Tourism Networking in the Makassar Tourism Area
- Creation of tourism circuit by connecting major tourism sites in Mamminasata.
- Creation of new tourism circuits and routes combining Mamminasata area with other tourism areas, Tana Toraja and Bulukumba Tourism in South Sulawesi province.
(ii) MICE Tourism Demand in Makassar Municipality
- Makassar Municipality has a number of hotels to serve for MICE Tourism demand.
- MICE Tourism requires sufficient hotel facilities which creates employment opportunity and contributes to local economy.
- Mamminasata area plays an important role as a centre of regional tourism in South Sulawesi province, holding a regional tourism convention and forum.
(iii) Variation of Existing Tourism Resources and Activities
- Marine tourism activity such as island cruise tour, fishing, snookering and diving.
- Cultural and historical tourism - Nature and eco-tourism at Bantimurung and Malino - Pro-poor tourism activity (Home stay program)
(iv) Tourism Development Projects in partnership with private sector
- Recreational and amenity facilities at Tanjung Bunga Development (On-going project)
- Losari Beach area development (On-going) - Marina development (facilities including visitor centre, marine
research and training centre, aquarium, diving centre, restaurant, etc) (Planning stage)
- Redevelopment of Benteng Somba Opu area (Planning stage) - Revitalization of Multi-ethnic Town area
(v) Redevelopment of Existing Tourism Facilities Attracts More Tourists
- Renewal of existing museums (Displays, presentation and explanation in English)
- Development of tourism service facilities at major tourism sites (Visitor centre, public toilet, resting area, direction and explanation boards)
- Development of tourist information centres at the Makassar Airport and near the Fort Rotterdam.
(vi) Tourism Marketing and Promotion in cooperation with Tourism Business Associations
- Tourism business association such as Hotel and Restaurant Associations (Makassar Municipality and Provincial) and Travel Agent Association are very active for promotion activity.
- Makassar Municipality in Mamminasata is a gateway of South Sulawesi province and Tana Toraja, and is designated as Tourism Development area in South Sulawesi province. Mamminasata area has a great many opportunities for tourism marketing and promotion activities of domestic and foreign tourism market.
THE STUDY ON IMPLEMENTATION OF INTEGRATED SPATIAL PLAN FOR THE MAMMINASATA METROPOLITAN AREA
Sector Study (7)TOURISM DEVELOPMENT STUDY
7-15
2. TOURISM DEVELOPMENT PLAN
2.1. Tourism Demand Projection 1) Preliminary Projection of Tourist Demand
For preliminary projection of domestic and foreign tourist arrivals to Mamminasata towards 2020, following data and information have been reviewed. (i) Tourism Marketing and Promotion Report, 2003, Provincial Culture and
Tourism Office, South Sulawesi province. (ii) Tourism Marketing Report for Tourism Industry in Indonesia, 2002 (CETAK
BIRU PEMASARAN PARIWISATA INDONESISA, KEMENTERIAN KEBUDAYAAN DAN PARIWISATA, INDONESIA, 2002).
(iii) Tourist Destination Forecast 2020 in East Asia and the Pacific Region by World Tourism Organization (WTO)
(iv) Tourism statistic, BPS Makassar and Association of the Indonesia Tours & Travel Agencies, South Sulawesi
According to the Tourism Marketing and Promotion Report (2003, South Sulawesi), the projected target number of foreign tourist arrivals to South Sulawesi in 2003 and 2008 were 26,709 and 20,941, respectively, with an average annual growth rate of -4.75%. This projection was based on the Tourism Marketing Report for Tourism Industry in Indonesia, 2002. The number of foreign tourist arrivals to Makassar and South Sulawesi province are slightly increasing in the few years so that these demand projection data are unrealistic figure.
In view of the above situation, a preliminary projection of domestic and foreign tourist arrivals to Mamminasata has been made on the basis of following indicators and scenarios. Foreign Visitor
(a) Growth rates of foreign tourists from 2005 to 2014 are estimated by referring to the pervious growth and recovering period of tourist market in South Sulawesi and Indonesia.
(b) An average growth rate from 2015 to 2020 is assumed by referring to an average annual growth rate in 2010 and 2020 estimated by the tourist destinations forecast in East Asia and the Pacific Region by World Tourism Organization (WTO).
Domestic Visitor (a) Average growth rates between 2005 and 2010 are assumed by referring to the
rates projected for classified and non-classified domestic hotel guests in the Tourism Marketing Report, 2002.
(b) Average growth rates from 2011 to 2020 are assumed to follow an average GRDP growth rate for Trade, Hotel and Restaurant in Mamminasata.
The Table 2.1 shows the result of projections foreign tourist will increase to 40,000 in 2010 and reach to 86,000 until 2020, with annual growth rates of 10.0% and 6.5%, respectively. On the other hand, domestic tourist will increase to 1,189,000 in 2010
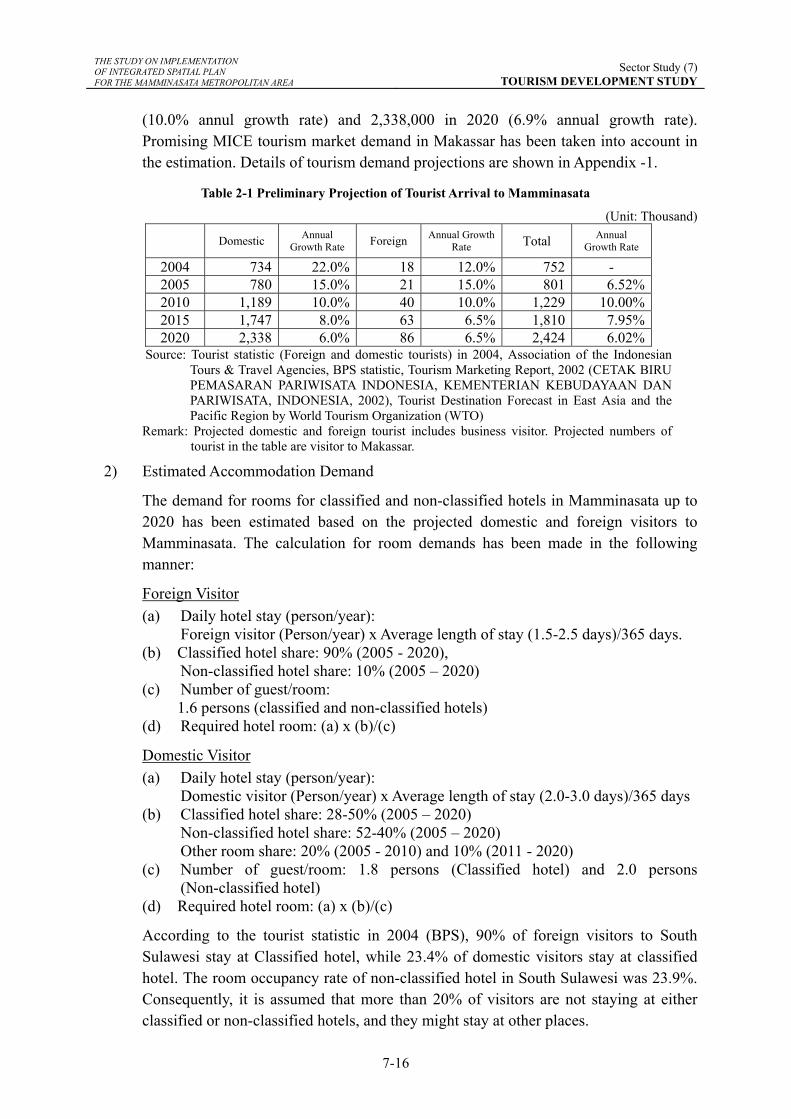
THE STUDY ON IMPLEMENTATION OF INTEGRATED SPATIAL PLAN FOR THE MAMMINASATA METROPOLITAN AREA
Sector Study (7)TOURISM DEVELOPMENT STUDY
7-16
(10.0% annul growth rate) and 2,338,000 in 2020 (6.9% annual growth rate). Promising MICE tourism market demand in Makassar has been taken into account in the estimation. Details of tourism demand projections are shown in Appendix -1.
Table 2-1 Preliminary Projection of Tourist Arrival to Mamminasata
(Unit: Thousand)
Domestic Annual Growth Rate Foreign Annual Growth
Rate Total Annual Growth Rate
2004 734 22.0% 18 12.0% 752 - 2005 780 15.0% 21 15.0% 801 6.52% 2010 1,189 10.0% 40 10.0% 1,229 10.00% 2015 1,747 8.0% 63 6.5% 1,810 7.95% 2020 2,338 6.0% 86 6.5% 2,424 6.02%
Source: Tourist statistic (Foreign and domestic tourists) in 2004, Association of the Indonesian Tours & Travel Agencies, BPS statistic, Tourism Marketing Report, 2002 (CETAK BIRU PEMASARAN PARIWISATA INDONESIA, KEMENTERIAN KEBUDAYAAN DAN PARIWISATA, INDONESIA, 2002), Tourist Destination Forecast in East Asia and the Pacific Region by World Tourism Organization (WTO)
Remark: Projected domestic and foreign tourist includes business visitor. Projected numbers of tourist in the table are visitor to Makassar.
2) Estimated Accommodation Demand
The demand for rooms for classified and non-classified hotels in Mamminasata up to 2020 has been estimated based on the projected domestic and foreign visitors to Mamminasata. The calculation for room demands has been made in the following manner:
Foreign Visitor (a) Daily hotel stay (person/year):
Foreign visitor (Person/year) x Average length of stay (1.5-2.5 days)/365 days. (b) Classified hotel share: 90% (2005 - 2020),
Non-classified hotel share: 10% (2005 – 2020) (c) Number of guest/room:
1.6 persons (classified and non-classified hotels) (d) Required hotel room: (a) x (b)/(c)
Domestic Visitor (a) Daily hotel stay (person/year):
Domestic visitor (Person/year) x Average length of stay (2.0-3.0 days)/365 days (b) Classified hotel share: 28-50% (2005 – 2020)
Non-classified hotel share: 52-40% (2005 – 2020) Other room share: 20% (2005 - 2010) and 10% (2011 - 2020)
(c) Number of guest/room: 1.8 persons (Classified hotel) and 2.0 persons (Non-classified hotel)
(d) Required hotel room: (a) x (b)/(c)
According to the tourist statistic in 2004 (BPS), 90% of foreign visitors to South Sulawesi stay at Classified hotel, while 23.4% of domestic visitors stay at classified hotel. The room occupancy rate of non-classified hotel in South Sulawesi was 23.9%. Consequently, it is assumed that more than 20% of visitors are not staying at either classified or non-classified hotels, and they might stay at other places.
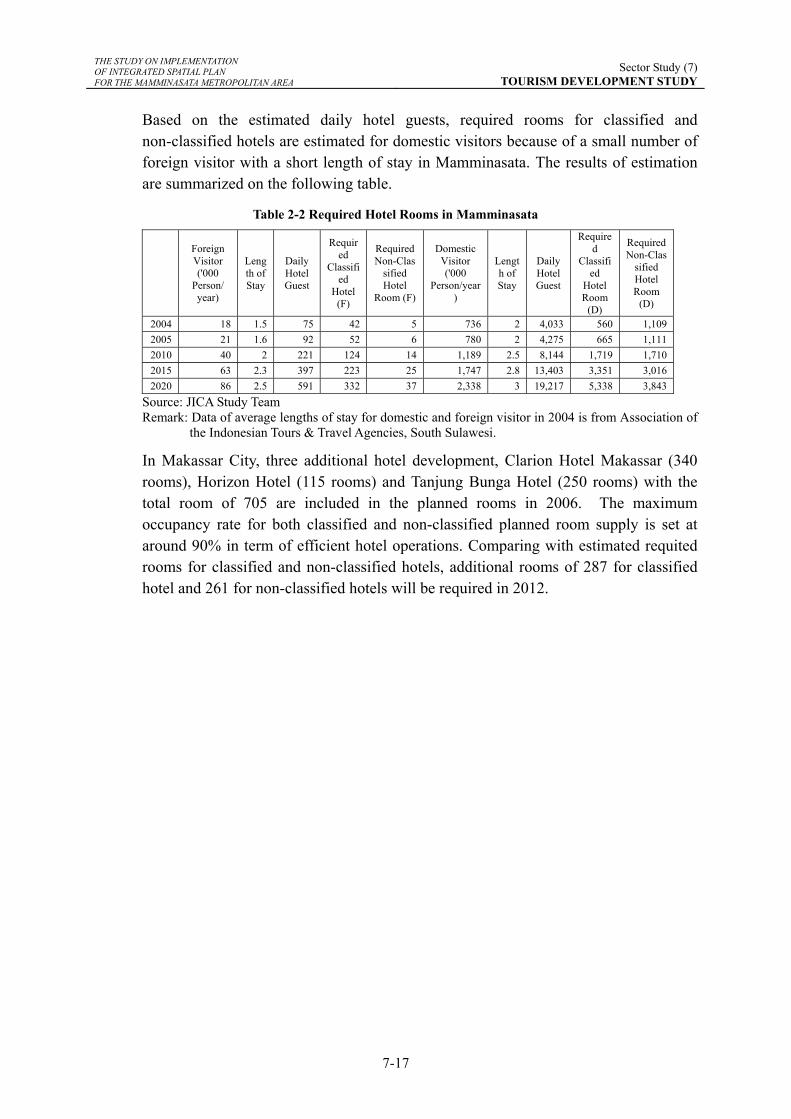
THE STUDY ON IMPLEMENTATION OF INTEGRATED SPATIAL PLAN FOR THE MAMMINASATA METROPOLITAN AREA
Sector Study (7)TOURISM DEVELOPMENT STUDY
7-17
Based on the estimated daily hotel guests, required rooms for classified and non-classified hotels are estimated for domestic visitors because of a small number of foreign visitor with a short length of stay in Mamminasata. The results of estimation are summarized on the following table.
Table 2-2 Required Hotel Rooms in Mamminasata
Foreign Visitor ('000
Person/ year)
Length of Stay
Daily Hotel Guest
Required
Classified
Hotel (F)
Required Non-Clas
sified Hotel
Room (F)
Domestic Visitor ('000
Person/year)
Length of Stay
Daily Hotel Guest
Required
Classified
Hotel Room
(D)
Required Non-Clas
sified Hotel Room
(D)
2004 18 1.5 75 42 5 736 2 4,033 560 1,1092005 21 1.6 92 52 6 780 2 4,275 665 1,1112010 40 2 221 124 14 1,189 2.5 8,144 1,719 1,7102015 63 2.3 397 223 25 1,747 2.8 13,403 3,351 3,0162020 86 2.5 591 332 37 2,338 3 19,217 5,338 3,843
Source: JICA Study Team Remark: Data of average lengths of stay for domestic and foreign visitor in 2004 is from Association of
the Indonesian Tours & Travel Agencies, South Sulawesi.
In Makassar City, three additional hotel development, Clarion Hotel Makassar (340 rooms), Horizon Hotel (115 rooms) and Tanjung Bunga Hotel (250 rooms) with the total room of 705 are included in the planned rooms in 2006. The maximum occupancy rate for both classified and non-classified planned room supply is set at around 90% in term of efficient hotel operations. Comparing with estimated requited rooms for classified and non-classified hotels, additional rooms of 287 for classified hotel and 261 for non-classified hotels will be required in 2012.
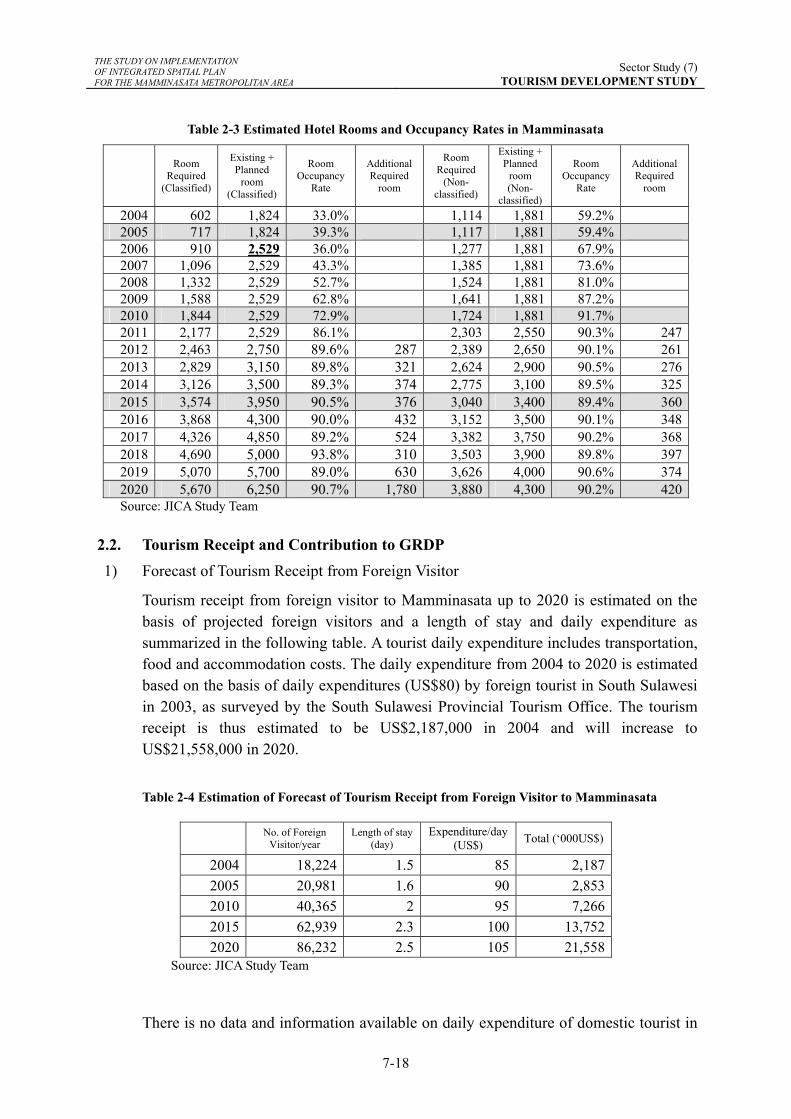
THE STUDY ON IMPLEMENTATION OF INTEGRATED SPATIAL PLAN FOR THE MAMMINASATA METROPOLITAN AREA
Sector Study (7)TOURISM DEVELOPMENT STUDY
7-18
Table 2-3 Estimated Hotel Rooms and Occupancy Rates in Mamminasata
Room
Required (Classified)
Existing + Planned
room (Classified)
Room Occupancy
Rate
Additional Required
room
Room Required
(Non- classified)
Existing + Planned
room (Non-
classified)
Room Occupancy
Rate
Additional Required
room
2004 602 1,824 33.0% 1,114 1,881 59.2% 2005 717 1,824 39.3% 1,117 1,881 59.4% 2006 910 2,529 36.0% 1,277 1,881 67.9% 2007 1,096 2,529 43.3% 1,385 1,881 73.6% 2008 1,332 2,529 52.7% 1,524 1,881 81.0% 2009 1,588 2,529 62.8% 1,641 1,881 87.2% 2010 1,844 2,529 72.9% 1,724 1,881 91.7% 2011 2,177 2,529 86.1% 2,303 2,550 90.3% 2472012 2,463 2,750 89.6% 287 2,389 2,650 90.1% 2612013 2,829 3,150 89.8% 321 2,624 2,900 90.5% 2762014 3,126 3,500 89.3% 374 2,775 3,100 89.5% 3252015 3,574 3,950 90.5% 376 3,040 3,400 89.4% 3602016 3,868 4,300 90.0% 432 3,152 3,500 90.1% 3482017 4,326 4,850 89.2% 524 3,382 3,750 90.2% 3682018 4,690 5,000 93.8% 310 3,503 3,900 89.8% 3972019 5,070 5,700 89.0% 630 3,626 4,000 90.6% 3742020 5,670 6,250 90.7% 1,780 3,880 4,300 90.2% 420
Source: JICA Study Team
2.2. Tourism Receipt and Contribution to GRDP 1) Forecast of Tourism Receipt from Foreign Visitor
Tourism receipt from foreign visitor to Mamminasata up to 2020 is estimated on the basis of projected foreign visitors and a length of stay and daily expenditure as summarized in the following table. A tourist daily expenditure includes transportation, food and accommodation costs. The daily expenditure from 2004 to 2020 is estimated based on the basis of daily expenditures (US$80) by foreign tourist in South Sulawesi in 2003, as surveyed by the South Sulawesi Provincial Tourism Office. The tourism receipt is thus estimated to be US$2,187,000 in 2004 and will increase to US$21,558,000 in 2020.
Table 2-4 Estimation of Forecast of Tourism Receipt from Foreign Visitor to Mamminasata
No. of Foreign Visitor/year
Length of stay (day)
Expenditure/day (US$) Total (‘000US$)
2004 18,224 1.5 85 2,187 2005 20,981 1.6 90 2,853 2010 40,365 2 95 7,266 2015 62,939 2.3 100 13,752 2020 86,232 2.5 105 21,558
Source: JICA Study Team
There is no data and information available on daily expenditure of domestic tourist in
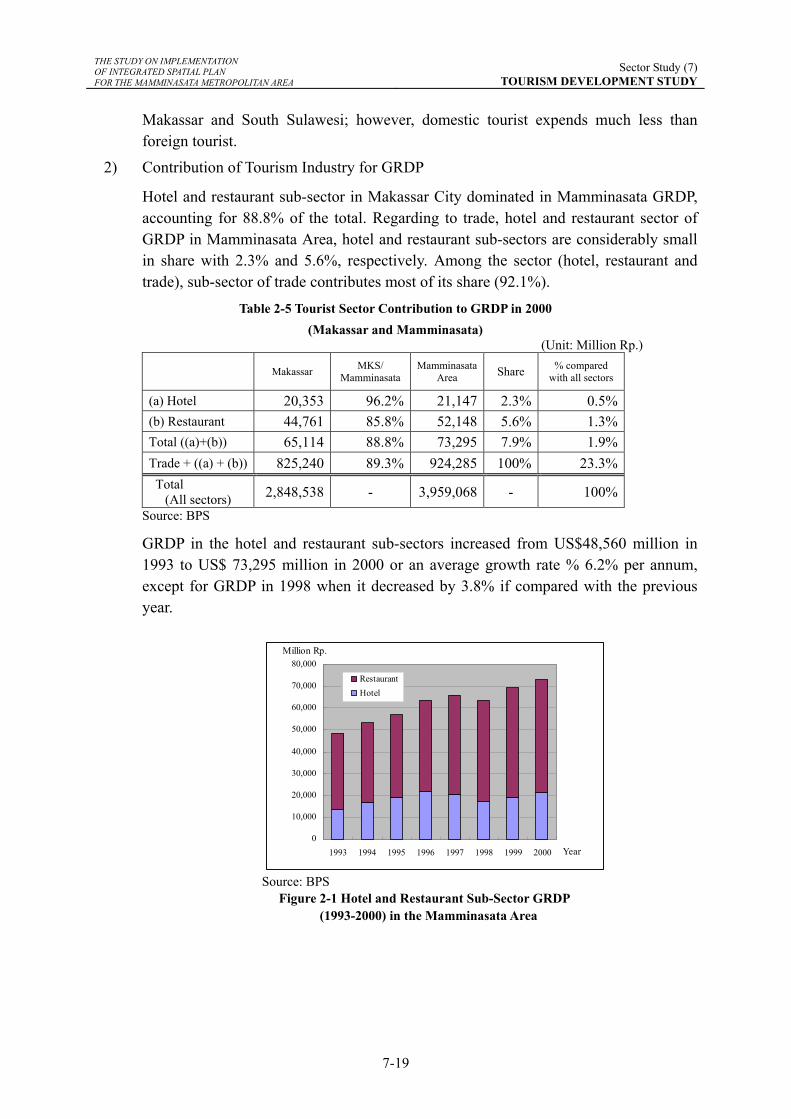
THE STUDY ON IMPLEMENTATION OF INTEGRATED SPATIAL PLAN FOR THE MAMMINASATA METROPOLITAN AREA
Sector Study (7)TOURISM DEVELOPMENT STUDY
7-19
Makassar and South Sulawesi; however, domestic tourist expends much less than foreign tourist.
2) Contribution of Tourism Industry for GRDP
Hotel and restaurant sub-sector in Makassar City dominated in Mamminasata GRDP, accounting for 88.8% of the total. Regarding to trade, hotel and restaurant sector of GRDP in Mamminasata Area, hotel and restaurant sub-sectors are considerably small in share with 2.3% and 5.6%, respectively. Among the sector (hotel, restaurant and trade), sub-sector of trade contributes most of its share (92.1%).
Table 2-5 Tourist Sector Contribution to GRDP in 2000 (Makassar and Mamminasata)
(Unit: Million Rp.)
Makassar MKS/ Mamminasata
Mamminasata Area Share % compared
with all sectors
(a) Hotel 20,353 96.2% 21,147 2.3% 0.5% (b) Restaurant 44,761 85.8% 52,148 5.6% 1.3% Total ((a)+(b)) 65,114 88.8% 73,295 7.9% 1.9% Trade + ((a) + (b)) 825,240 89.3% 924,285 100% 23.3% Total
(All sectors) 2,848,538 - 3,959,068 - 100% Source: BPS
GRDP in the hotel and restaurant sub-sectors increased from US$48,560 million in 1993 to US$ 73,295 million in 2000 or an average growth rate % 6.2% per annum, except for GRDP in 1998 when it decreased by 3.8% if compared with the previous year.
0
10,000
20,000
30,000
40,000
50,000
60,000
70,000
80,000
1993 1994 1995 1996 1997 1998 1999 2000 Year
Million Rp.
RestaurantHotel
Source: BPS
Figure 2-1 Hotel and Restaurant Sub-Sector GRDP (1993-2000) in the Mamminasata Area
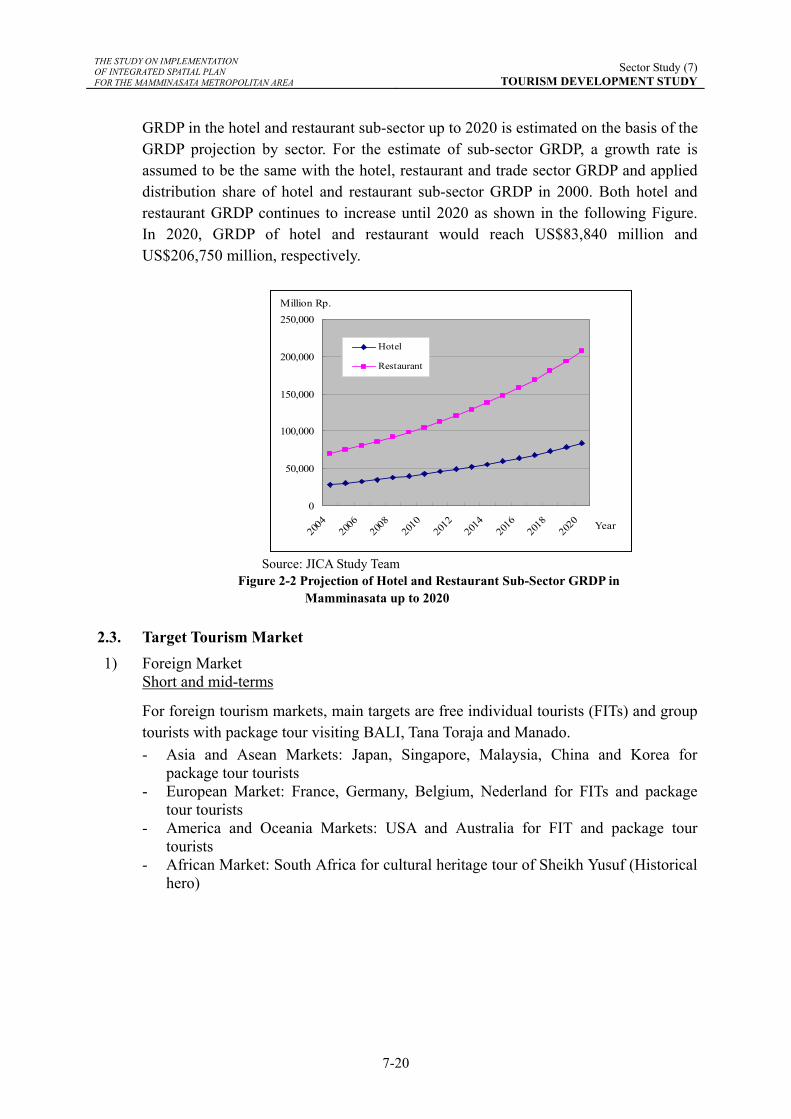
THE STUDY ON IMPLEMENTATION OF INTEGRATED SPATIAL PLAN FOR THE MAMMINASATA METROPOLITAN AREA
Sector Study (7)TOURISM DEVELOPMENT STUDY
7-20
GRDP in the hotel and restaurant sub-sector up to 2020 is estimated on the basis of the GRDP projection by sector. For the estimate of sub-sector GRDP, a growth rate is assumed to be the same with the hotel, restaurant and trade sector GRDP and applied distribution share of hotel and restaurant sub-sector GRDP in 2000. Both hotel and restaurant GRDP continues to increase until 2020 as shown in the following Figure. In 2020, GRDP of hotel and restaurant would reach US$83,840 million and US$206,750 million, respectively.
0
50,000
100,000
150,000
200,000
250,000
2004
2006
2008
2010
2012
2014
2016
2018
2020 Year
Million Rp.
Hotel
Restaurant
Source: JICA Study Team
Figure 2-2 Projection of Hotel and Restaurant Sub-Sector GRDP in Mamminasata up to 2020
2.3. Target Tourism Market 1) Foreign Market
Short and mid-terms
For foreign tourism markets, main targets are free individual tourists (FITs) and group tourists with package tour visiting BALI, Tana Toraja and Manado. - Asia and Asean Markets: Japan, Singapore, Malaysia, China and Korea for
package tour tourists - European Market: France, Germany, Belgium, Nederland for FITs and package
tour tourists - America and Oceania Markets: USA and Australia for FIT and package tour
tourists - African Market: South Africa for cultural heritage tour of Sheikh Yusuf (Historical
hero)
THE STUDY ON IMPLEMENTATION OF INTEGRATED SPATIAL PLAN FOR THE MAMMINASATA METROPOLITAN AREA
Sector Study (7)TOURISM DEVELOPMENT STUDY
7-21
According to the Ministry of Culture and Tourism, three overseas tourism information centres will reopen in Japan, China and Australia in 2005. It is expected that these three market will strongly promote tourism not only in Bali but also in other areas especially for package tour tourists, and tourists from these countries would increase to major tourist destinations in Indonesia including South Sulawesi.
Long-term
Asian and European markets are targeted for MICE tourism, eco-tourism and marine tourism, in addition to FITs and group tour markets.
2) Domestic Market
Short and mid-terms
For domestic tourism market, targets are mainly private sector for MICE tourism, and middle and high-income tourist groups for shopping, cultural and marine tourism. In addition, the South Sulawesi originated people living outside South Sulawesi are potential targets for promotion during religious holidays, New Year holiday, and events in Makassar City and its surrounding. Long-term
In addition to marketing segments under the short-mid term, tourist groups will cover all income levels. Makassar City tour, excursion to tourism sites in Maros, Gowa and Takalar and study tours for student and eco-tourism will be promoted in accordance with domestic marketing strategies.
2.4. Development Scenario
The tourism sector is expected to be one of driving forces for accelerating economic and social development in Mamminasata. As mentioned previously, Makassar City is a provincial capital and a main gateway of major tourism destinations such as Tana Toraja, Bira and Bulukumba in South Sulawesi. Makassar City is situated on geographically and strategically on an important position in tourism networks in South Sulawesi, Eastern Indonesia and the whole country. Moreover, Makassar City is a centre of provincial tourism administration and tourism business with a number of hotels and other commercial businesses.
At present, Makassar City and its surrounding areas are well known to domestic tourist for shopping, culture and marine tourism areas. Especially, Makassar is a MICE tourism destination for domestic market. On the other hand, Makassar is a transit tourism destination for foreign tourists visiting Tana Toraja, Bulukumba and Bira. For foreign tourist market, Makassar City is relatively small in terms of the number of tourist and the length of stay.
Based on the foregoing, the overall goal of tourism sector development in Mamminasata is set as follows:
THE STUDY ON IMPLEMENTATION OF INTEGRATED SPATIAL PLAN FOR THE MAMMINASATA METROPOLITAN AREA
Sector Study (7)TOURISM DEVELOPMENT STUDY
7-22
A tourism development plan in the Mamminasata is proposed in pursuit of the development policy and direction set in the Regional Spatial Plan of Mamminasata Metropolitan Area, 2003-2012.
In order to achieve the aforementioned overall tourism sector development goal, a development scenario is proposed as follows:
1) Short-and Mid-term Scenario (- 2015)
- The priority development area is Makassar City by promoting “MICE Tourism” for domestic market. Major cultural and historical sites, such as Fort Rotterdam, Somba Opu and coastal areas are to be improved to accommodate foreign tourists.
- Existing tourism services and facilities, such as tourism information centres and museums in Makassar and other regencies, should be improved and upgraded for attracting more tourists to Mamminasata.
- Outside of Makassar, Bantimurung area in Maros and Bili-Bili Dam and its surrounding areas in Gowa are potential tourism sites. These area need to be improved and developed by either public or private initiative.
- Local tourism products should be improved and developed, utilizing local resources. Cultural performance for domestic and foreign tourists should also be promoted.
- Marine tourism along the costal areas and offshore islands in Makassar is further promoted as optional tour programs by improvement of coastal environment and providing sufficient passenger cruising boats connecting Makassar to major islands.
- South Sulawesi Tourism Office and Makassar Tourism Office should focus on promoting Tana Toraja and Bali package tourists to stay in Makassar or increase the length of stay in Makassar by creating attractive tour options and attractions in cooperation with tourism organizations such as Association of the Indonesian Tours & Travel Agencies and Makassar Hotel & Restaurant Association.
- It is necessary to establish and strengthen a public and private partnership for tourism development and promotion of tourism destinations in Mamminasata.
To develop and promote Mamminasata as a main gateway tourism destination in South Sulawesi to attract more domestic and foreign tourists and tourism business by improving and developing tourism resources and facilities, as well as by strengtheningregional and inter-regional tourism linkages for supporting the regional economy
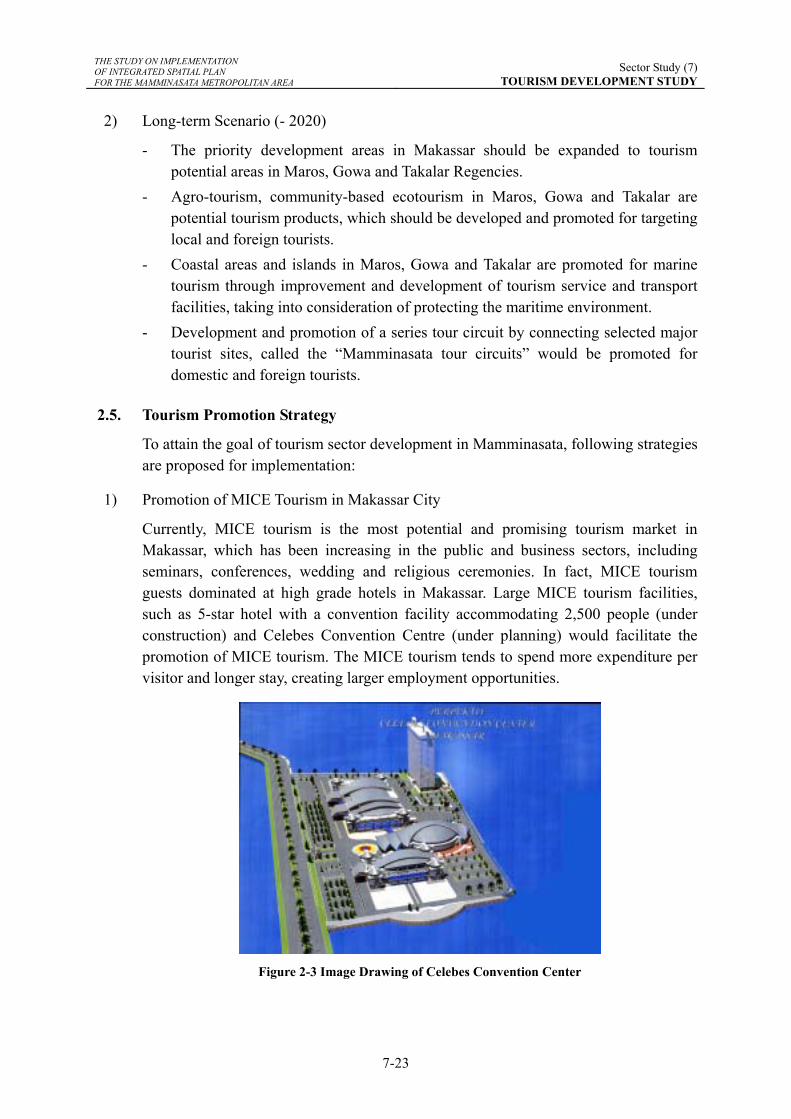
THE STUDY ON IMPLEMENTATION OF INTEGRATED SPATIAL PLAN FOR THE MAMMINASATA METROPOLITAN AREA
Sector Study (7)TOURISM DEVELOPMENT STUDY
7-23
2) Long-term Scenario (- 2020)
- The priority development areas in Makassar should be expanded to tourism potential areas in Maros, Gowa and Takalar Regencies.
- Agro-tourism, community-based ecotourism in Maros, Gowa and Takalar are potential tourism products, which should be developed and promoted for targeting local and foreign tourists.
- Coastal areas and islands in Maros, Gowa and Takalar are promoted for marine tourism through improvement and development of tourism service and transport facilities, taking into consideration of protecting the maritime environment.
- Development and promotion of a series tour circuit by connecting selected major tourist sites, called the “Mamminasata tour circuits” would be promoted for domestic and foreign tourists.
2.5. Tourism Promotion Strategy
To attain the goal of tourism sector development in Mamminasata, following strategies are proposed for implementation:
1) Promotion of MICE Tourism in Makassar City
Currently, MICE tourism is the most potential and promising tourism market in Makassar, which has been increasing in the public and business sectors, including seminars, conferences, wedding and religious ceremonies. In fact, MICE tourism guests dominated at high grade hotels in Makassar. Large MICE tourism facilities, such as 5-star hotel with a convention facility accommodating 2,500 people (under construction) and Celebes Convention Centre (under planning) would facilitate the promotion of MICE tourism. The MICE tourism tends to spend more expenditure per visitor and longer stay, creating larger employment opportunities.
Figure 2-3 Image Drawing of Celebes Convention Center
THE STUDY ON IMPLEMENTATION OF INTEGRATED SPATIAL PLAN FOR THE MAMMINASATA METROPOLITAN AREA
Sector Study (7)TOURISM DEVELOPMENT STUDY
7-24
Mamminasata, therefore, should jointly promote MICE tourism in South Sulawesi and East Indonesia in the short-and mid-terms, and further promote in Indonesia ad ASEAN countries. In order to increase a length of stay for MICE tourism visitors in Makassar and Mamminasata, optional tours such as Makassar City tour, boat cruising tour to islands and one-day excursion tour to surrounding tourism sites should better be combined with MICE tourism package in cooperation with local travel agents.
2) Enhancement of Cultural and Historical Values
A number of cultural and historical tourism resources remain in Makassar and other regencies in Mamminasata. Fort Rotterdam, Paotere Harbour, the Old tombs of King Tallo, the Cemetery of Prince Diponegoro, Mandala Monument, Fort Somba Opu and the grave of Syech Yusuf are not only important tourism resources but also unique cultural and historical assets in Mamminasata. Dutch historical buildings and old mosques still exist in the centre of Makassar City.
Fort Rotterdam is the most important historical asset and of potential tourism attractions in Makassar. It enhances cultural and historical values of the city as well. At present, it is surrounded by public commercial and private buildings, except for the front gate along the main street. It is recommended that Fort Rotterdam and its surrounding area be designated as “Cultural and Historical Area” or “Fort Rotterdam Historical Park” for enhancement of such historical values to attract more tourists in the short- and mid-terms.
Fort of Somba Opu located in Gowa, close to the border with Makassar, has traditional houses of various regencies in South Sulawesi and a museum. It is currently limited to local tourists. Visitors and tourists are enjoying during the Exhibition in August. It is necessary to improve existing houses and museum, and develop as “Somba Opu Traditional Cultural Park” holding traditional cultural performance and attractions for domestic and foreign tourists. A plan for development of Fort of Somba Opu was proposed by the Dinas of Spatial Plan and Settlement in November 2004. The revitalization of Port of Somba Opu Area is considered as an important tourism development plan and the existing plan should be reviewed and implemented, taking into consideration of its operation and management.
Other cultural and historical assets such as the Old tombs of King Tallo, Museum of Balla Lompoa, the grave of Syech Yusuf, the tomb of Sultan Hasanuddin should also be improved to attract domestic and foreign visitors as well.
3) Improvement of Tourism Information Service, Facilities and Infrastructure
Existing tourism information centres (TICs) for Makassar and South Sulawesi are not effectively utilized and inconvenient for tourist to access. Considering the easy access to tourists, both Makassar City Tourism Office and South Sulawesi Provincial Tourism Office should establish TICs at new locations such as at the airport and at the downstream area of Makassar and Fort Rotterdam with self-search tourism information and database system. TICs are required to operate during weekend and
THE STUDY ON IMPLEMENTATION OF INTEGRATED SPATIAL PLAN FOR THE MAMMINASATA METROPOLITAN AREA
Sector Study (7)TOURISM DEVELOPMENT STUDY
7-25
holidays. Tourism offices in Gowa, Maros and Takalar should also establish TICs to provide domestic and foreign tourists with local tourism information.
Museums, such as Makassar City Museum, La Galigo Museum in Fort Rotterdam and Balla Lompoa in Gowa are relatively outdated, having poor display and presentation. These museums should be improved by upgrading the presentation system and explanation in English in order to attract more tourists.
Tourism signage and explanation boards are limited at major tourism sites. They are only in local language. They are important for access to tourist sites and provision of information for target tourism resource/site. The tourism offices in Mamminasata should be responsible for installing at major tourism sites, tour routes, in the short- and mid-terms and all tourist sites and tour routes in the long-term.
Tourist service facilities such as visitor centre, resting facilities and toilets have not been developed at most. It is necessary to develop such tourist service facilities at major tourism sites in Mamminasata specially for receiving foreign visitors.
Some sections of access road to tourist sites in Gowa, Takalar and Maros are to be improved with proper maintenance for efficient and safety access of tourist transportation.
4) Development and Promotion of Marine Tourism
There are many beaches and islands in and along the coastal area in Mamminasata except for Gowa. Marine tourism is of the potential tourism resources with sandy beaches, coral reefs and various types of tropical fishes. Present marine tourism activities are mainly island cruising to offshore islands arranged by local travel agents or rental boat, and scuba diving tour arranged by Makassar Diving Shop, which has not developed yet like other marine tourism destinations such as Bali and Manado. Marine tourism market in Mamminasata is mostly for domestic tourists due to the limited number of foreign tourists in Makassar.
Marine tourism in Mamminasata is recommended to focus on the following prioritized areas and development terms.
(1) Coastal area and offshore island in Makassar (Short-mid terms)
- Losari Beach area and existing piers near the Fort Rotterdam should be the first priority area for improvement and development.
- Kayangan and Lae-Lae Kcl Island should be developed with improvement of tourist service facilities and protection of the marine environment.
- Existing Makassar Diving Centre needs renovation of its building and improvement of facilities.
- Jetty and tourist service facilities such as toilet and restaurants should be improved and developed on tourist visiting islands.
- Fishing village island tour is developed and promoted combining with island cursing tour. Target fishing village islands are selected from existing fishing village islands such as Lae-Lae, Barrang Caddi, Barrang Lompo and
THE STUDY ON IMPLEMENTATION OF INTEGRATED SPATIAL PLAN FOR THE MAMMINASATA METROPOLITAN AREA
Sector Study (7)TOURISM DEVELOPMENT STUDY
7-26
Lumu-Lumu. - Resort type of islands with white sandy beach and cottage such as
Kodingareng Keke and Lanjukkang islands should be properly managed and promoted for package tours for foreign tourist.
(2) Coastal area and offshore island in Maros and Takalar (Long-term)
- Kuri Beach in Maros, Galesong and Topejawa Beaches in Takalar should be improved and developed with adequate visitor service facilities such as resting place, toilets and accommodation.
- Cikoang Beach and Tanakeke Island in Takalar are rich in mangrove forests so that mangrove ecotourism tour will be an attractive optional tour for domestic and foreign tourists.
- Tanakeke and Sanrobengi islands in Takalar are unspoiled island with coral reefs and white sandy beach. These islands are promoted for marine tourism activities including diving and snorkelling, with development of necessity tourism service facilities and accommodations. Cursing tour along the coastal areas in Maros and Takalar should be promoted for optional tour for foreign and domestic tourists.
5) Creation of Attractive Local Tourism Products
Handicrafts and souvenirs in Mamminasata are wood carving products, silver products, silk cloth and silk woven products and traditional hat woven by palm fibre. These handicrafts and souvenirs are not so attractive and unique for foreign tourists in terms of design and quality. Agro-products for tourists are very limited, except for Markisa fruit juice. It is indispensable to develop handicraft utilizing local resource and agro-products by local communities produced in Mamminasata. Local tourism products are also important revenue sources for local communities, generating income for local communities. There is no place to see handicraft making for tourist in Makassar and its surrounding areas. It is essential to develop a handicraft centre in Makassar or its surrounding area showing handicraft demonstration and providing a place to sell various handicrafts for tourists.
A famous local cuisine in Makassar, called coto Makassar, which is popular for local tourists, but it is not suited for foreign tourists. Many kind of seafood are available at local fish market, so that special seafood menu should be created and served at restaurants along the Losari Beach area and Hotels in Makassar for attracting local and foreign tourists.
Various traditional dances and performances such as Pakarena dance, Pepe-pepeka Ri Makka dance, Pattennung dance, Pammasari dance, Tunrung Rinci still exist in Makassar and Gowa, then are performed only at special events. It is recommended that these traditional dances and other local cultural dances be performed at restaurants, hotels and the Fort of Somba Opu Area as a night attraction combined with dinner in Makassar. In addition, various cultural events and festivals are held in Makassar and other regencies. Provincial and local tourism attractions and events in cooperation
THE STUDY ON IMPLEMENTATION OF INTEGRATED SPATIAL PLAN FOR THE MAMMINASATA METROPOLITAN AREA
Sector Study (7)TOURISM DEVELOPMENT STUDY
7-27
with the private sectors.
6) Linkage and Network of Inter-regional and Regional Tourism
Present tourism administration and development in Mamminasata are separately conducted by Makassar City and regencies (Maros, Gowa and Takalar). It is essential that all concerned tourism offices, agencies and private tourism sectors should cooperate and work together in term of diversification if tour routing, regional tourism development and prioritization of tourism development areas and projects in Mamminasata.
As mentioned previously, Makassar City is a gateway to Tana Toraja, Bulukumba and Bira, especially for foreign tourism markets. In view of this fact, tourism development and promotion for Mamminasata should take into consideration of inter-regional and regional tourism networks. Therefore, South Sulawesi Provincial tourism office and Dinas of Spatial Planning should coordinate with local tourism offices and relevant agencies in Mamminasata in order to improve and develop the inter-regional and regional tourism networks. It will contribute to increase the number of tourist and the length of stay both in Mamminasata and other tourism destinations in South Sulawesi province.
7) Improvement in Tourism Administration and Capacity Development
Major constraints on provincial and local tourism offices in South Sulawesi have been already pointed out, and the following improvements are needed for effective operation and management in the public sector.
- Statistics are the most important tool for planning of tourism development; however, tourism statistics and information are insufficient at provincial and local tourism offices. It is urgently needed to improve the statistics system in cooperation with Statistic Office (BPS), Immigration Office and relevant associations such as Hotel and Restaurant Association.
- Provincial and local tourism offices lack coordination, cooperation and sharing information among divisions and departments. It is recommended that coordination, cooperation and sharing information be strengthened among divisions and departments for tourism planning and development.
- It is also important to strengthen training of staff at the provincial and local levels in cooperation with the ministry of Culture and Tourism.
8) Public-Private Partnership for Tourism Development
Many tourism projects planned and proposed by the public sector in Mamminasata have not been implemented due to the limited budget of the central and local government, while a large commercial and tourism development, Tanjung Bunga has been developed by the private sector. Other tourism related projects such as hotel development, Celebes Convention Centre project and Losari Beach area revitalization project have been planned and implemented by the private sector. Private sector and
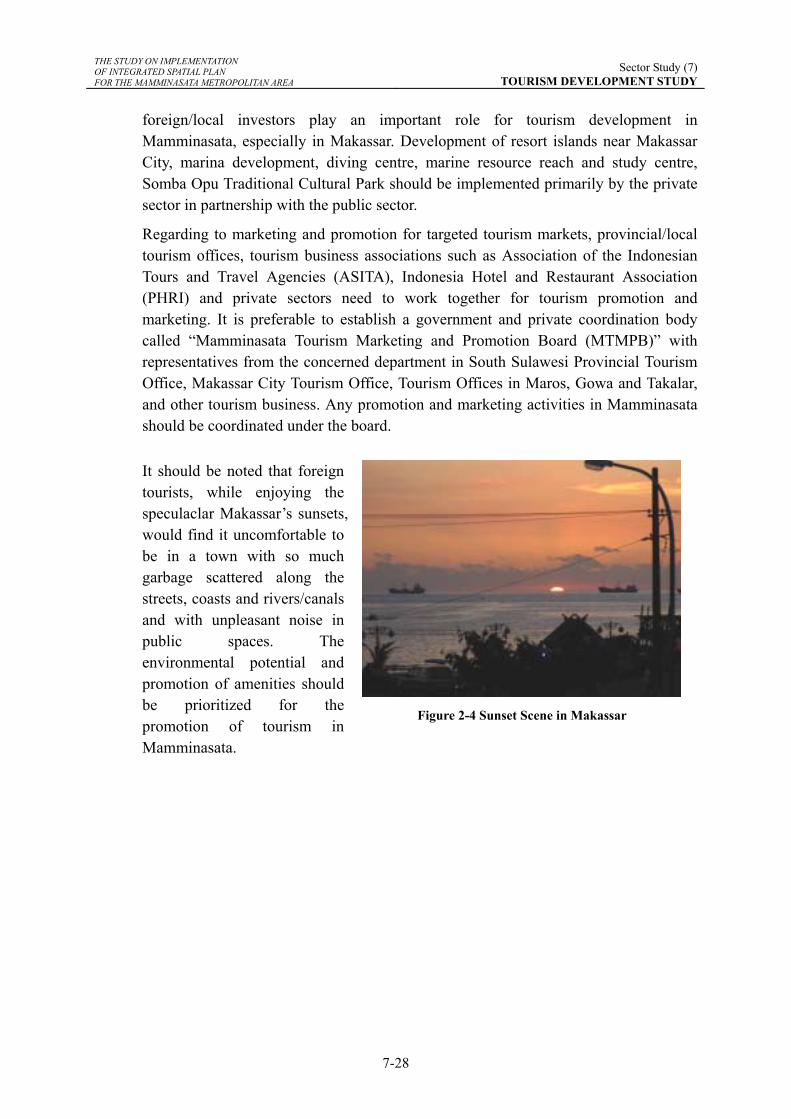
THE STUDY ON IMPLEMENTATION OF INTEGRATED SPATIAL PLAN FOR THE MAMMINASATA METROPOLITAN AREA
Sector Study (7)TOURISM DEVELOPMENT STUDY
7-28
foreign/local investors play an important role for tourism development in Mamminasata, especially in Makassar. Development of resort islands near Makassar City, marina development, diving centre, marine resource reach and study centre, Somba Opu Traditional Cultural Park should be implemented primarily by the private sector in partnership with the public sector.
Regarding to marketing and promotion for targeted tourism markets, provincial/local tourism offices, tourism business associations such as Association of the Indonesian Tours and Travel Agencies (ASITA), Indonesia Hotel and Restaurant Association (PHRI) and private sectors need to work together for tourism promotion and marketing. It is preferable to establish a government and private coordination body called “Mamminasata Tourism Marketing and Promotion Board (MTMPB)” with representatives from the concerned department in South Sulawesi Provincial Tourism Office, Makassar City Tourism Office, Tourism Offices in Maros, Gowa and Takalar, and other tourism business. Any promotion and marketing activities in Mamminasata should be coordinated under the board.
It should be noted that foreign tourists, while enjoying the speculaclar Makassar’s sunsets, would find it uncomfortable to be in a town with so much garbage scattered along the streets, coasts and rivers/canals and with unpleasant noise in public spaces. The environmental potential and promotion of amenities should be prioritized for the promotion of tourism in Mamminasata.
Figure 2-4 Sunset Scene in Makassar
THE STUDY ON IMPLEMENTATION OF INTEGRATED SPATIAL PLAN FOR THE MAMMINASATA METROPOLITAN AREA
Sector Study (7)TOURISM DEVELOPMENT STUDY
7-29
2.6. Proposed Projects/Programs
<Short- and mid-terms> Project 1: Improvement of Fort Rotterdam Area - Upgrading of museum - Tourism information centre (New) - Installation of signage - Designate the area and its surroundings as “Fort Rotterdam Historical Area” - Improvement of front gate area and sidewalk pavement along the wall
Implementation Agency: South Sulawesi Province (Culture & Tourism), Makassar City, M. of Culture & Tourism
Project 2: Somba Opu Traditional Culture Park - Improvement of existing traditional houses and museums - Place for cultural performances/events - Handicraft centre - Installation of explanation signage
Implementation Agency: South Sulawesi Province (Culture & Tourism) and Makassar City in cooperation with Indonesia Hotel and Restaurant Association and Private sector
Project 3: Improvement of Beach Area in front of Fort Rotterdam - Beautification of beach area - Improvement of the square for multi-purpose event - Jetty for inland cruising boat
Implementation Agency: Makassar, Association of Hotel and Reasturant and private sector
Project 4: Improvement of Tourism Information Service - Provide User-friendly information service - Upgrading information presentation system - Establish TIC (Tourism Information Centre) at the Airport and downtown area - Establish TIC in other regencies
Implementation Agency: South Sulawesi Tourism Office, Makassar Tourism Office, Tourism Offices in Gowa, Maros and Takalar
Project 5: Improvement of Existing Tourism Facilities - Inventory survey of existing tourism survey in the Study Area - Preparation of improvement plan for tourism facilities - Prioritization of improvement projects - Implementation of improvement projects

THE STUDY ON IMPLEMENTATION OF INTEGRATED SPATIAL PLAN FOR THE MAMMINASATA METROPOLITAN AREA
Sector Study (7)TOURISM DEVELOPMENT STUDY
7-30
Implementation Agency: Tourism and project related departments in Provincial Gov., Makassar, regencies in Mamminasata
<Mid- and Long-terms> Project 6: Promotion of Marine Tourism - Island cursing - Sunset cursing - Visiting islands - Diving, snorkelling, fishing
Implementation Agency: South Sulawesi Tourism Office, Makassar Tourism Office, Takalar, Gowa and Maros Tourism Office in cooperation with Hotel & Restaurant Association and Indonesian Tours and Travel Agent Association
Project 7: Development of Nature and Community-based Tourism
Location: Bantimurung Area, Tallo River basin area, and Bili-Bili Dam and its surrounding area. - Field survey - Preparation of development plan - Preparation of implementation plan - Public awareness program for nature and community-based tourism - Training and Capacity building plan for local tourism business
Implementation Agency: Local tourism offices, NGOs and Indonesian Tours and Travel Agent Association
Study on Implementation of
Integrated Spatial Plan for
The Mamminasata Metropolitan Area
SECTOR STUDY (8)
RIVER FLOOD CONTROL & URBAN DRAINAGE STUDY
KRI International Corp.
Nippon Koei Co., Ltd.
THE STUDY ON IMPLEMENTATION OF INTEGRATED SPATIAL PLAN FOR THE MAMMINASATA METROPOLITAN AREA
Sector Study (8) RIVER FLOOD CONTROL and
URBAN DRAINAGE STUDY
Table of Contents
1. RIVER FLOOD CONTROL............................................................................................ 1
1.1. Present Condition ................................................................................................... 1
1.2. Issues to be Addressed............................................................................................ 2
1.3. Planning Focuses.................................................................................................... 2
1.4. Planning Scale ........................................................................................................ 3
1.5. River Flood Control Plan ....................................................................................... 3
1.6. Assessment of Increases in Flood Risks due to Land Reclamation in the Lower Reaches of the Tallo River ..................................................................................... 5
1.7. Project Components and Implementation .............................................................. 8
2. URBAN DRAINAGE...................................................................................................... 10
2.1. Present Condition ................................................................................................. 10
2.2. Issues to be Addressed...........................................................................................11
2.3. Planning Focuses...................................................................................................11
2.4. Target Area and Design Level of Urban Drainage Improvement ........................ 12
2.5. Structural Measures.............................................................................................. 12
2.6. Non-structural Measures ...................................................................................... 15
2.7. Project Components and Implementation ............................................................ 18
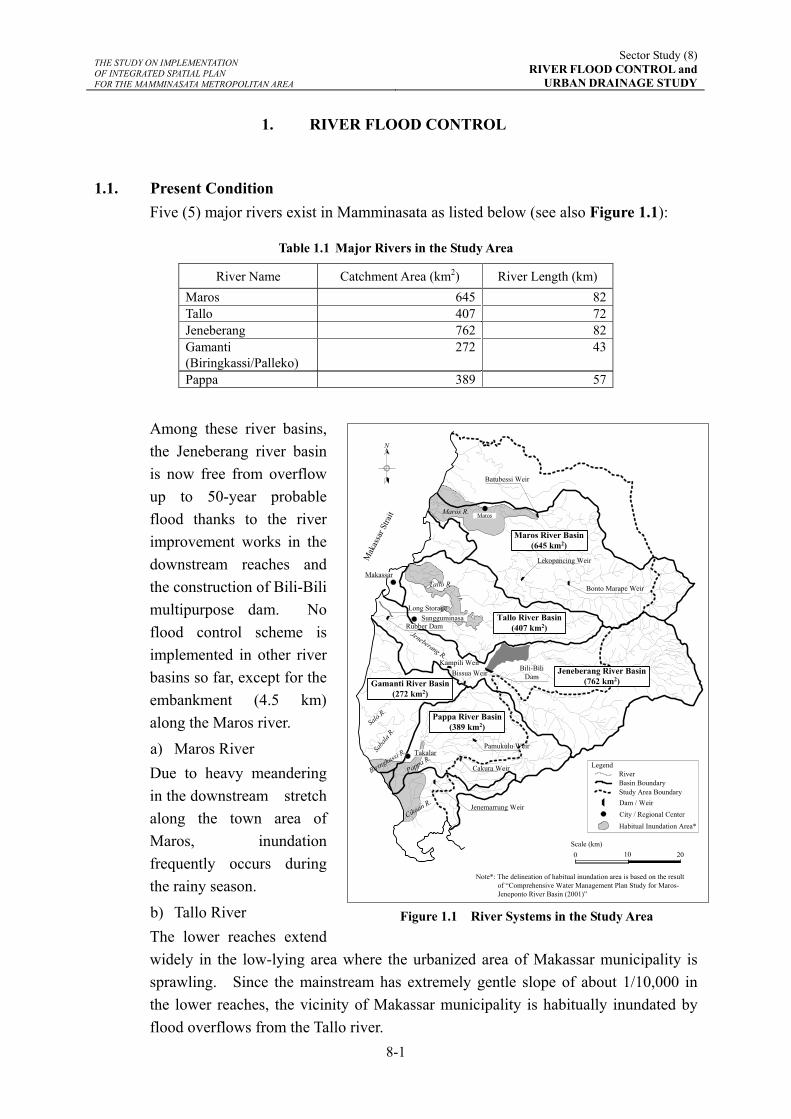
THE STUDY ON IMPLEMENTATION OF INTEGRATED SPATIAL PLAN FOR THE MAMMINASATA METROPOLITAN AREA
Sector Study (8) RIVER FLOOD CONTROL and
URBAN DRAINAGE STUDY
8-1
1. RIVER FLOOD CONTROL
1.1. Present Condition Five (5) major rivers exist in Mamminasata as listed below (see also Figure 1.1):
Table 1.1 Major Rivers in the Study Area
River Name Catchment Area (km2) River Length (km) Maros 645 82 Tallo 407 72 Jeneberang 762 82 Gamanti (Biringkassi/Palleko)
272 43
Pappa 389 57
Among these river basins, the Jeneberang river basin is now free from overflow up to 50-year probable flood thanks to the river improvement works in the downstream reaches and the construction of Bili-Bili multipurpose dam. No flood control scheme is implemented in other river basins so far, except for the embankment (4.5 km) along the Maros river. a) Maros River Due to heavy meandering in the downstream stretch along the town area of Maros, inundation frequently occurs during the rainy season. b) Tallo River The lower reaches extend widely in the low-lying area where the urbanized area of Makassar municipality is sprawling. Since the mainstream has extremely gentle slope of about 1/10,000 in the lower reaches, the vicinity of Makassar municipality is habitually inundated by flood overflows from the Tallo river.
Maros R.
Tallo R.
Jeneberang R.
Pappa R.
Biringkassi R
.
Cikoan R.
Saba
la R.
Batubessi Weir
Lekopancing Weir
Bonto Marape Weir
Long Storage
Rubber Dam
Bili-BiliDam
Kampili WeirBissua Weir
Pamukulu Weir
Cakura Weir
Jenemarrung Weir
Maros River Basin(645 km2)
Tallo River Basin(407 km2)
Jeneberang River Basin(762 km2)
Pappa River Basin(389 km2)
Gamanti River Basin(272 km2)
Makassar
Sungguminasa
Maros
Takalar
N
Scale (km)0 10 20
RiverBasin Boundary
Dam / WeirCity / Regional Center
Legend
Mak
assa
r Stra
it
Study Area Boundary
Salo R.
Habitual Inundation Area*
Note*: The delineation of habitual inundation area is based on the result of “Comprehensive Water Management Plan Study for Maros- Jeneponto River Basin (2001)”
Figure 1.1 River Systems in the Study Area
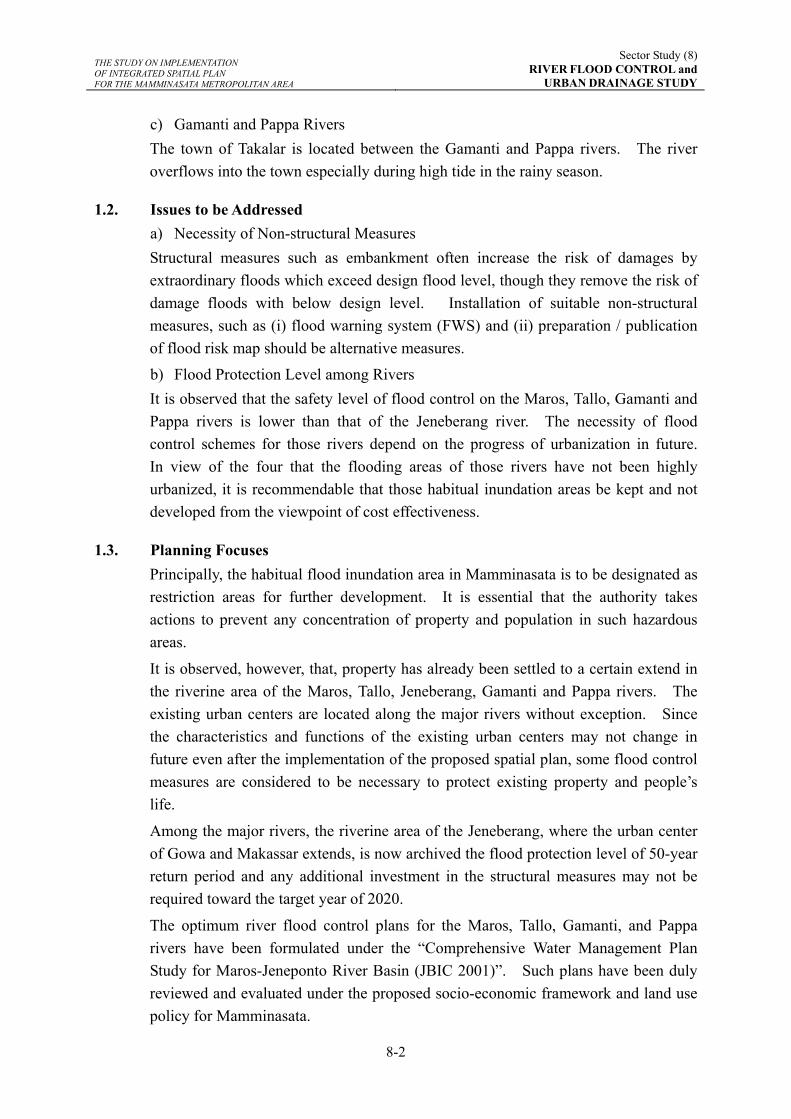
THE STUDY ON IMPLEMENTATION OF INTEGRATED SPATIAL PLAN FOR THE MAMMINASATA METROPOLITAN AREA
Sector Study (8) RIVER FLOOD CONTROL and
URBAN DRAINAGE STUDY
8-2
c) Gamanti and Pappa Rivers The town of Takalar is located between the Gamanti and Pappa rivers. The river overflows into the town especially during high tide in the rainy season.
1.2. Issues to be Addressed a) Necessity of Non-structural Measures Structural measures such as embankment often increase the risk of damages by extraordinary floods which exceed design flood level, though they remove the risk of damage floods with below design level. Installation of suitable non-structural measures, such as (i) flood warning system (FWS) and (ii) preparation / publication of flood risk map should be alternative measures.
b) Flood Protection Level among Rivers It is observed that the safety level of flood control on the Maros, Tallo, Gamanti and Pappa rivers is lower than that of the Jeneberang river. The necessity of flood control schemes for those rivers depend on the progress of urbanization in future. In view of the four that the flooding areas of those rivers have not been highly urbanized, it is recommendable that those habitual inundation areas be kept and not developed from the viewpoint of cost effectiveness.
1.3. Planning Focuses Principally, the habitual flood inundation area in Mamminasata is to be designated as restriction areas for further development. It is essential that the authority takes actions to prevent any concentration of property and population in such hazardous areas.
It is observed, however, that, property has already been settled to a certain extend in the riverine area of the Maros, Tallo, Jeneberang, Gamanti and Pappa rivers. The existing urban centers are located along the major rivers without exception. Since the characteristics and functions of the existing urban centers may not change in future even after the implementation of the proposed spatial plan, some flood control measures are considered to be necessary to protect existing property and people’s life.
Among the major rivers, the riverine area of the Jeneberang, where the urban center of Gowa and Makassar extends, is now archived the flood protection level of 50-year return period and any additional investment in the structural measures may not be required toward the target year of 2020.
The optimum river flood control plans for the Maros, Tallo, Gamanti, and Pappa rivers have been formulated under the “Comprehensive Water Management Plan Study for Maros-Jeneponto River Basin (JBIC 2001)”. Such plans have been duly reviewed and evaluated under the proposed socio-economic framework and land use policy for Mamminasata.
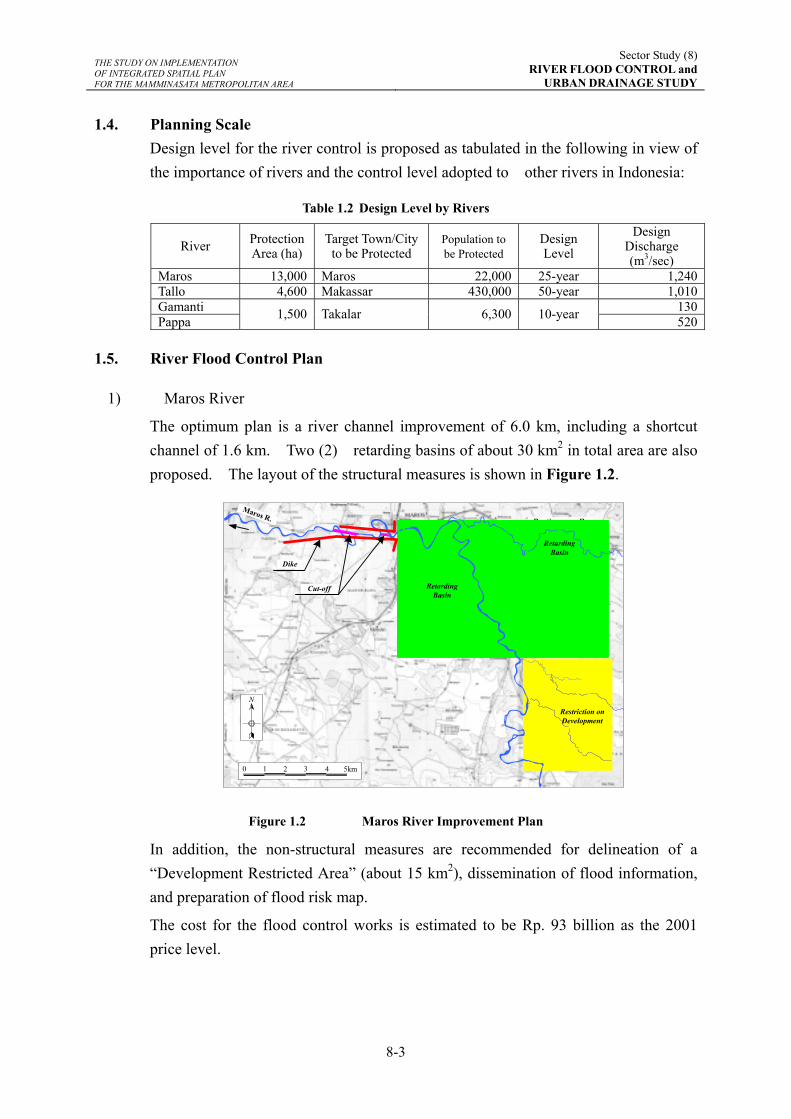
THE STUDY ON IMPLEMENTATION OF INTEGRATED SPATIAL PLAN FOR THE MAMMINASATA METROPOLITAN AREA
Sector Study (8) RIVER FLOOD CONTROL and
URBAN DRAINAGE STUDY
8-3
1.4. Planning Scale Design level for the river control is proposed as tabulated in the following in view of the importance of rivers and the control level adopted to other rivers in Indonesia:
Table 1.2 Design Level by Rivers
River Protection Area (ha)
Target Town/City to be Protected
Population to be Protected
Design Level
Design Discharge (m3/sec)
Maros 13,000 Maros 22,000 25-year 1,240Tallo 4,600 Makassar 430,000 50-year 1,010Gamanti 130Pappa 1,500 Takalar 6,300 10-year 520
1.5. River Flood Control Plan
1) Maros River
The optimum plan is a river channel improvement of 6.0 km, including a shortcut channel of 1.6 km. Two (2) retarding basins of about 30 km2 in total area are also proposed. The layout of the structural measures is shown in Figure 1.2.
Maros R. Bantimurung R.
Arparang R.
0 1 2 3 4 5km
RetardingBasin
Restriction onDevelopment
Dike
Cut-off
N
RetardingBasin
Figure 1.2 Maros River Improvement Plan
In addition, the non-structural measures are recommended for delineation of a “Development Restricted Area” (about 15 km2), dissemination of flood information, and preparation of flood risk map.
The cost for the flood control works is estimated to be Rp. 93 billion as the 2001 price level.
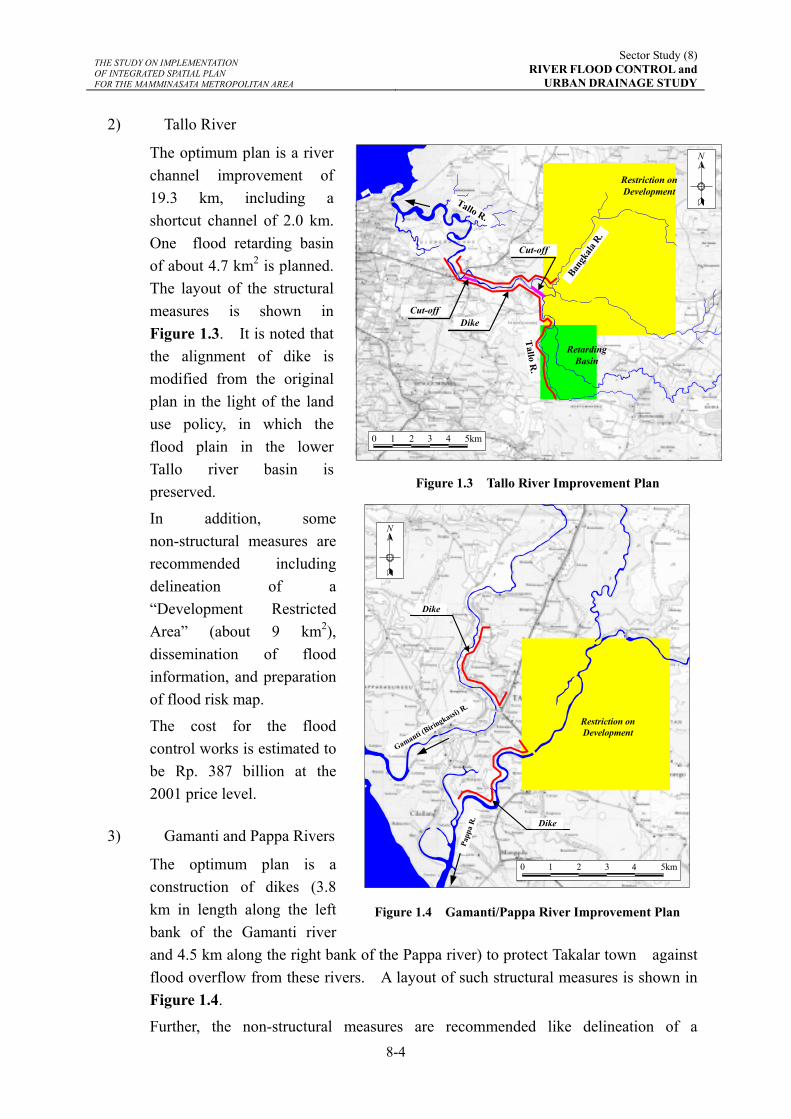
THE STUDY ON IMPLEMENTATION OF INTEGRATED SPATIAL PLAN FOR THE MAMMINASATA METROPOLITAN AREA
Sector Study (8) RIVER FLOOD CONTROL and
URBAN DRAINAGE STUDY
8-4
2) Tallo River
The optimum plan is a river channel improvement of 19.3 km, including a shortcut channel of 2.0 km. One flood retarding basin of about 4.7 km2 is planned. The layout of the structural measures is shown in Figure 1.3. It is noted that the alignment of dike is modified from the original plan in the light of the land use policy, in which the flood plain in the lower Tallo river basin is preserved.
In addition, some non-structural measures are recommended including delineation of a “Development Restricted Area” (about 9 km2), dissemination of flood information, and preparation of flood risk map.
The cost for the flood control works is estimated to be Rp. 387 billion at the 2001 price level.
3) Gamanti and Pappa Rivers
The optimum plan is a construction of dikes (3.8 km in length along the left bank of the Gamanti river and 4.5 km along the right bank of the Pappa river) to protect Takalar town against flood overflow from these rivers. A layout of such structural measures is shown in Figure 1.4.
Further, the non-structural measures are recommended like delineation of a
5km43210
Restriction onDevelopment
Dike
Dike
Gamanti (Biringkassi)
R.
Papp
a R
.
N
Figure 1.4 Gamanti/Pappa River Improvement Plan
5km43210
N
RetardingBasin
Restriction onDevelopment
Tallo R.
DikeCut-off
Cut-offTallo R
.
Bangk
ala R
.
Figure 1.3 Tallo River Improvement Plan
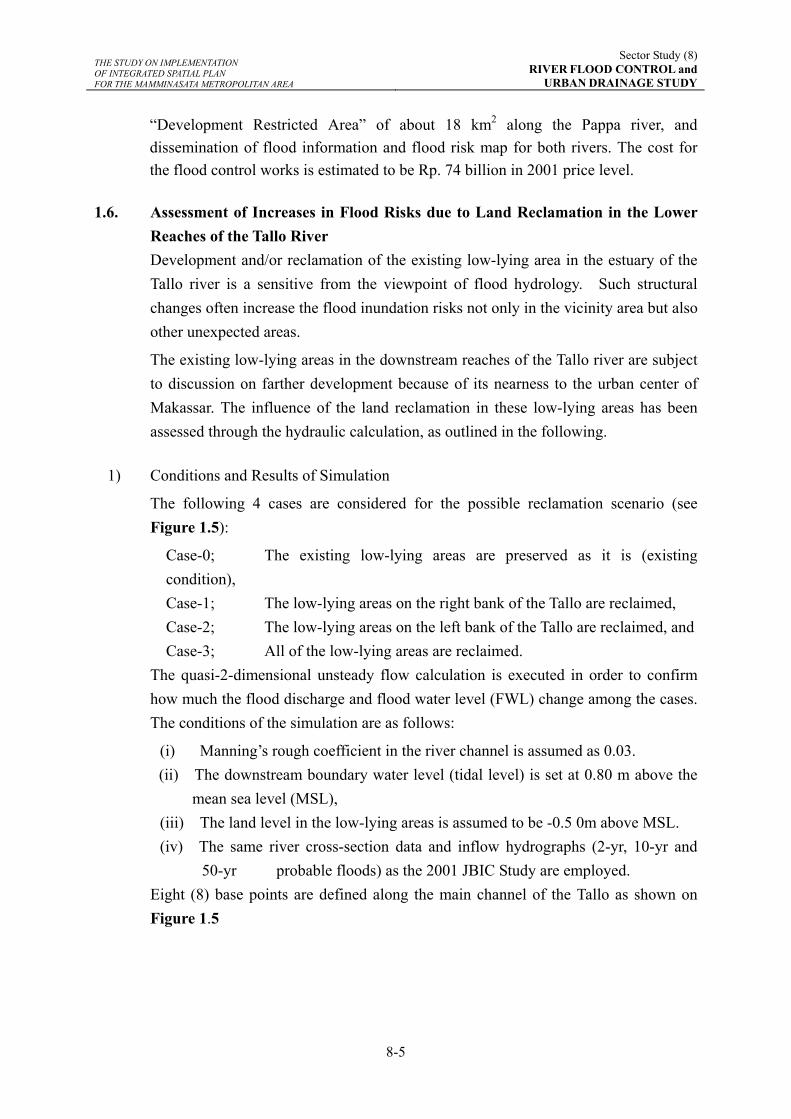
THE STUDY ON IMPLEMENTATION OF INTEGRATED SPATIAL PLAN FOR THE MAMMINASATA METROPOLITAN AREA
Sector Study (8) RIVER FLOOD CONTROL and
URBAN DRAINAGE STUDY
8-5
“Development Restricted Area” of about 18 km2 along the Pappa river, and dissemination of flood information and flood risk map for both rivers. The cost for the flood control works is estimated to be Rp. 74 billion in 2001 price level.
1.6. Assessment of Increases in Flood Risks due to Land Reclamation in the Lower Reaches of the Tallo River Development and/or reclamation of the existing low-lying area in the estuary of the Tallo river is a sensitive from the viewpoint of flood hydrology. Such structural changes often increase the flood inundation risks not only in the vicinity area but also other unexpected areas.
The existing low-lying areas in the downstream reaches of the Tallo river are subject to discussion on farther development because of its nearness to the urban center of Makassar. The influence of the land reclamation in these low-lying areas has been assessed through the hydraulic calculation, as outlined in the following.
1) Conditions and Results of Simulation
The following 4 cases are considered for the possible reclamation scenario (see Figure 1.5):
Case-0; The existing low-lying areas are preserved as it is (existing condition), Case-1; The low-lying areas on the right bank of the Tallo are reclaimed, Case-2; The low-lying areas on the left bank of the Tallo are reclaimed, and Case-3; All of the low-lying areas are reclaimed.
The quasi-2-dimensional unsteady flow calculation is executed in order to confirm how much the flood discharge and flood water level (FWL) change among the cases. The conditions of the simulation are as follows:
(i) Manning’s rough coefficient in the river channel is assumed as 0.03. (ii) The downstream boundary water level (tidal level) is set at 0.80 m above the
mean sea level (MSL), (iii) The land level in the low-lying areas is assumed to be -0.5 0m above MSL. (iv) The same river cross-section data and inflow hydrographs (2-yr, 10-yr and
50-yr probable floods) as the 2001 JBIC Study are employed. Eight (8) base points are defined along the main channel of the Tallo as shown on Figure 1.5
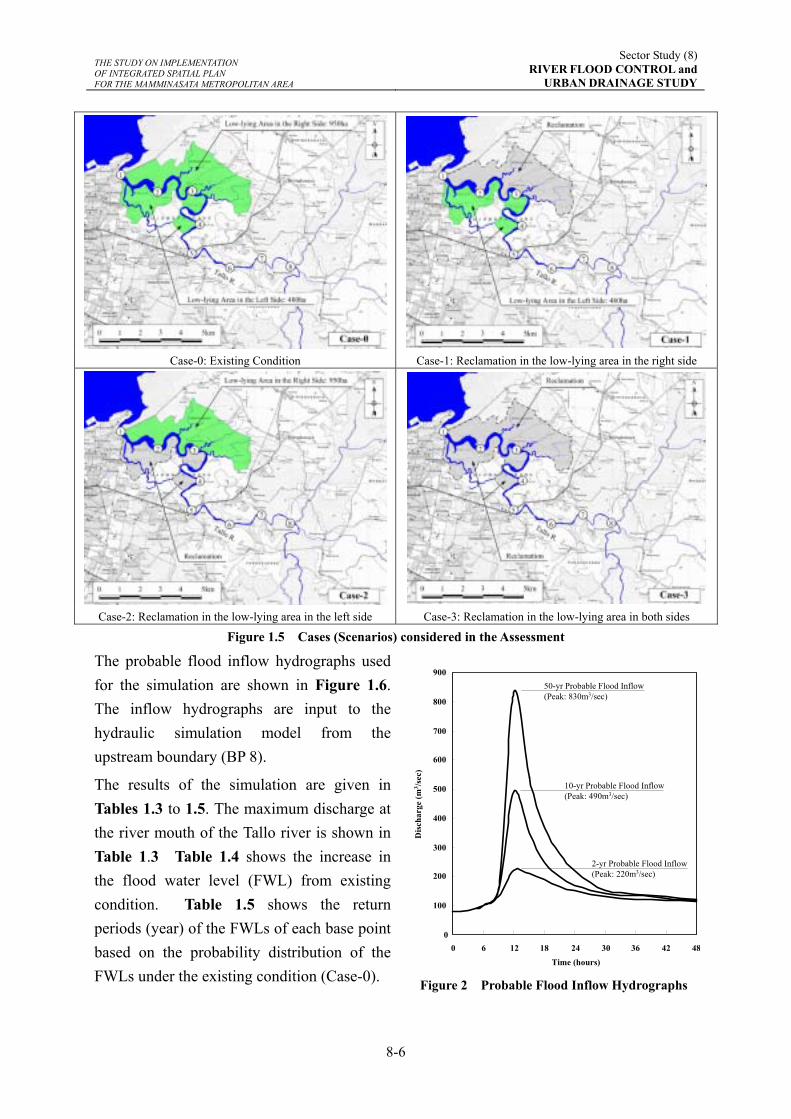
THE STUDY ON IMPLEMENTATION OF INTEGRATED SPATIAL PLAN FOR THE MAMMINASATA METROPOLITAN AREA
Sector Study (8) RIVER FLOOD CONTROL and
URBAN DRAINAGE STUDY
8-6
Case-0: Existing Condition Case-1: Reclamation in the low-lying area in the right side
Case-2: Reclamation in the low-lying area in the left side Case-3: Reclamation in the low-lying area in both sides
Figure 1.5 Cases (Scenarios) considered in the Assessment
The probable flood inflow hydrographs used for the simulation are shown in Figure 1.6. The inflow hydrographs are input to the hydraulic simulation model from the upstream boundary (BP 8).
The results of the simulation are given in Tables 1.3 to 1.5. The maximum discharge at the river mouth of the Tallo river is shown in Table 1.3 Table 1.4 shows the increase in the flood water level (FWL) from existing condition. Table 1.5 shows the return periods (year) of the FWLs of each base point based on the probability distribution of the FWLs under the existing condition (Case-0).
0
100
200
300
400
500
600
700
800
900
Dis
char
ge (m
3 /sec
)
50-yr Probable Flood Inflow(Peak: 830m3/sec)
10-yr Probable Flood Inflow(Peak: 490m3/sec)
2-yr Probable Flood Inflow(Peak: 220m3/sec)
0 6 12 18 24 30 36 42 48Time (hours)
Figure 2 Probable Flood Inflow Hydrographs
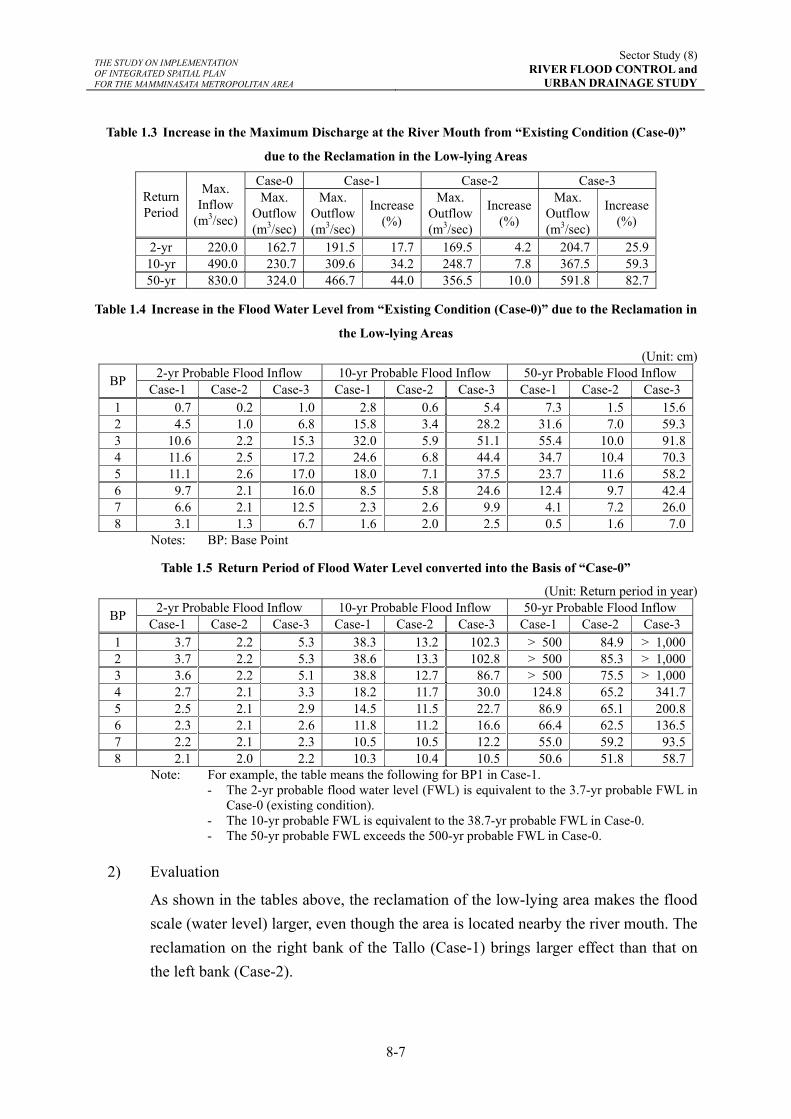
THE STUDY ON IMPLEMENTATION OF INTEGRATED SPATIAL PLAN FOR THE MAMMINASATA METROPOLITAN AREA
Sector Study (8) RIVER FLOOD CONTROL and
URBAN DRAINAGE STUDY
8-7
Table 1.3 Increase in the Maximum Discharge at the River Mouth from “Existing Condition (Case-0)”
due to the Reclamation in the Low-lying Areas
Case-0 Case-1 Case-2 Case-3 Return Period
Max. Inflow
(m3/sec)
Max. Outflow (m3/sec)
Max. Outflow(m3/sec)
Increase(%)
Max. Outflow(m3/sec)
Increase(%)
Max. Outflow (m3/sec)
Increase (%)
2-yr 220.0 162.7 191.5 17.7 169.5 4.2 204.7 25.9 10-yr 490.0 230.7 309.6 34.2 248.7 7.8 367.5 59.3 50-yr 830.0 324.0 466.7 44.0 356.5 10.0 591.8 82.7
Table 1.4 Increase in the Flood Water Level from “Existing Condition (Case-0)” due to the Reclamation in
the Low-lying Areas
(Unit: cm) 2-yr Probable Flood Inflow 10-yr Probable Flood Inflow 50-yr Probable Flood Inflow BP Case-1 Case-2 Case-3 Case-1 Case-2 Case-3 Case-1 Case-2 Case-3
1 0.7 0.2 1.0 2.8 0.6 5.4 7.3 1.5 15.62 4.5 1.0 6.8 15.8 3.4 28.2 31.6 7.0 59.33 10.6 2.2 15.3 32.0 5.9 51.1 55.4 10.0 91.84 11.6 2.5 17.2 24.6 6.8 44.4 34.7 10.4 70.35 11.1 2.6 17.0 18.0 7.1 37.5 23.7 11.6 58.26 9.7 2.1 16.0 8.5 5.8 24.6 12.4 9.7 42.47 6.6 2.1 12.5 2.3 2.6 9.9 4.1 7.2 26.08 3.1 1.3 6.7 1.6 2.0 2.5 0.5 1.6 7.0
Notes: BP: Base Point
Table 1.5 Return Period of Flood Water Level converted into the Basis of “Case-0”
(Unit: Return period in year) 2-yr Probable Flood Inflow 10-yr Probable Flood Inflow 50-yr Probable Flood Inflow BP Case-1 Case-2 Case-3 Case-1 Case-2 Case-3 Case-1 Case-2 Case-3
1 3.7 2.2 5.3 38.3 13.2 102.3 > 500 84.9 > 1,0002 3.7 2.2 5.3 38.6 13.3 102.8 > 500 85.3 > 1,0003 3.6 2.2 5.1 38.8 12.7 86.7 > 500 75.5 > 1,0004 2.7 2.1 3.3 18.2 11.7 30.0 124.8 65.2 341.75 2.5 2.1 2.9 14.5 11.5 22.7 86.9 65.1 200.86 2.3 2.1 2.6 11.8 11.2 16.6 66.4 62.5 136.57 2.2 2.1 2.3 10.5 10.5 12.2 55.0 59.2 93.58 2.1 2.0 2.2 10.3 10.4 10.5 50.6 51.8 58.7
Note: For example, the table means the following for BP1 in Case-1. - The 2-yr probable flood water level (FWL) is equivalent to the 3.7-yr probable FWL in
Case-0 (existing condition). - The 10-yr probable FWL is equivalent to the 38.7-yr probable FWL in Case-0. - The 50-yr probable FWL exceeds the 500-yr probable FWL in Case-0.
2) Evaluation
As shown in the tables above, the reclamation of the low-lying area makes the flood scale (water level) larger, even though the area is located nearby the river mouth. The reclamation on the right bank of the Tallo (Case-1) brings larger effect than that on the left bank (Case-2).
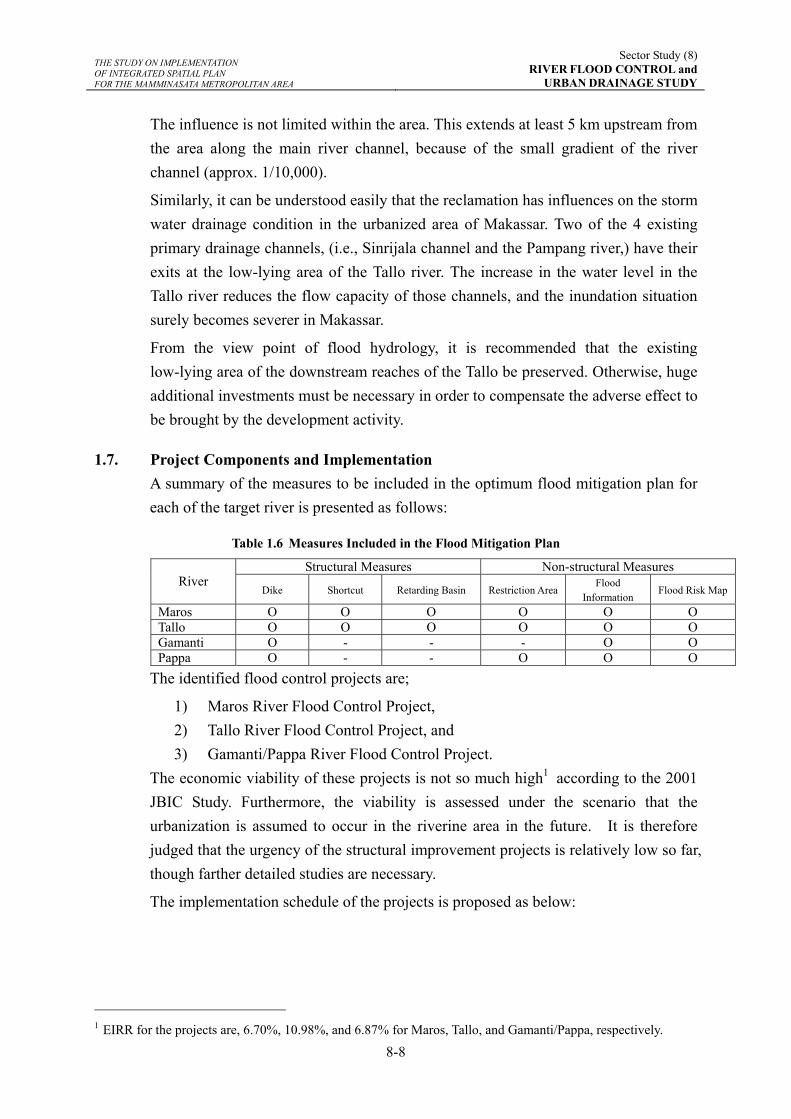
THE STUDY ON IMPLEMENTATION OF INTEGRATED SPATIAL PLAN FOR THE MAMMINASATA METROPOLITAN AREA
Sector Study (8) RIVER FLOOD CONTROL and
URBAN DRAINAGE STUDY
8-8
The influence is not limited within the area. This extends at least 5 km upstream from the area along the main river channel, because of the small gradient of the river channel (approx. 1/10,000).
Similarly, it can be understood easily that the reclamation has influences on the storm water drainage condition in the urbanized area of Makassar. Two of the 4 existing primary drainage channels, (i.e., Sinrijala channel and the Pampang river,) have their exits at the low-lying area of the Tallo river. The increase in the water level in the Tallo river reduces the flow capacity of those channels, and the inundation situation surely becomes severer in Makassar.
From the view point of flood hydrology, it is recommended that the existing low-lying area of the downstream reaches of the Tallo be preserved. Otherwise, huge additional investments must be necessary in order to compensate the adverse effect to be brought by the development activity.
1.7. Project Components and Implementation A summary of the measures to be included in the optimum flood mitigation plan for each of the target river is presented as follows:
Table 1.6 Measures Included in the Flood Mitigation Plan
Structural Measures Non-structural Measures River
Dike Shortcut Retarding Basin Restriction AreaFlood
Information Flood Risk Map
Maros O O O O O O Tallo O O O O O O Gamanti O - - - O O Pappa O - - O O O
The identified flood control projects are;
1) Maros River Flood Control Project, 2) Tallo River Flood Control Project, and 3) Gamanti/Pappa River Flood Control Project. The economic viability of these projects is not so much high1 according to the 2001 JBIC Study. Furthermore, the viability is assessed under the scenario that the urbanization is assumed to occur in the riverine area in the future. It is therefore judged that the urgency of the structural improvement projects is relatively low so far, though farther detailed studies are necessary.
The implementation schedule of the projects is proposed as below:
1 EIRR for the projects are, 6.70%, 10.98%, and 6.87% for Maros, Tallo, and Gamanti/Pappa, respectively.
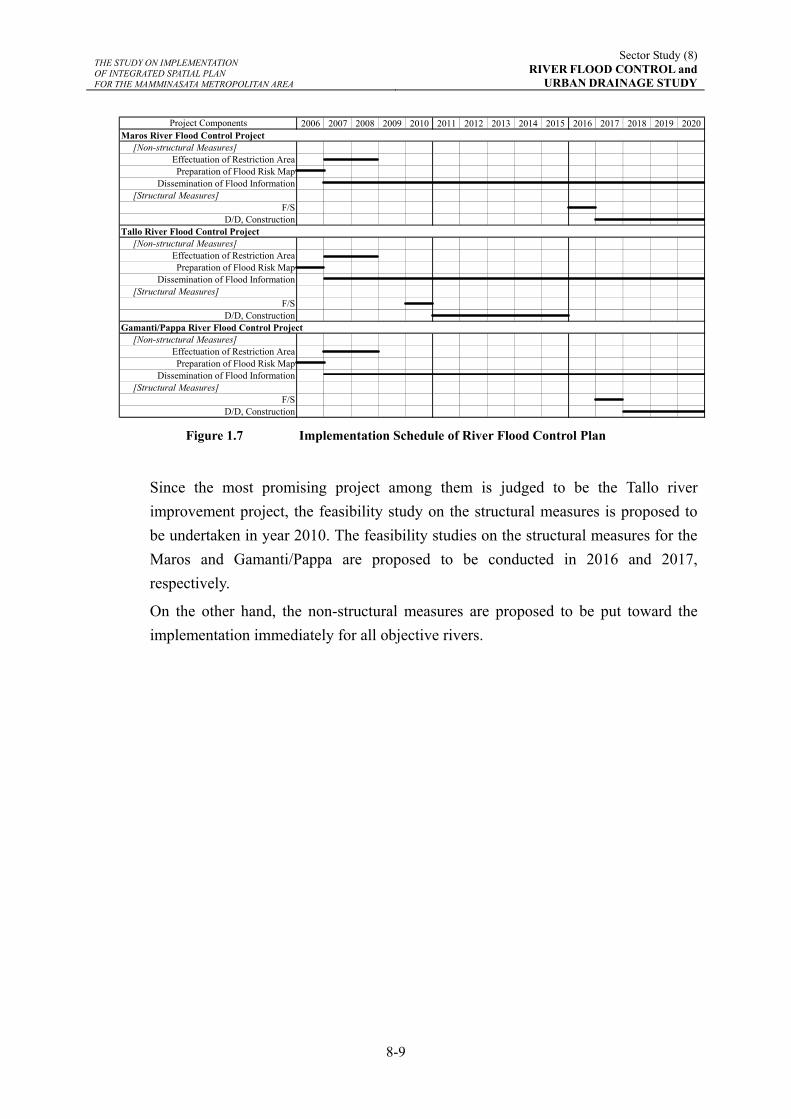
THE STUDY ON IMPLEMENTATION OF INTEGRATED SPATIAL PLAN FOR THE MAMMINASATA METROPOLITAN AREA
Sector Study (8) RIVER FLOOD CONTROL and
URBAN DRAINAGE STUDY
8-9
2006 2007 2008 2009 2010 2011 2012 2013 2014 2015 2016 2017 2018 2019 2020Maros River Flood Control Project
[Non-structural Measures]Effectuation of Restriction AreaPreparation of Flood Risk Map
Dissemination of Flood Information[Structural Measures]
F/SD/D, Construction
Tallo River Flood Control Project[Non-structural Measures]
Effectuation of Restriction AreaPreparation of Flood Risk Map
Dissemination of Flood Information[Structural Measures]
F/SD/D, Construction
Gamanti/Pappa River Flood Control Project[Non-structural Measures]
Effectuation of Restriction AreaPreparation of Flood Risk Map
Dissemination of Flood Information[Structural Measures]
F/SD/D, Construction
Project Components
Figure 1.7 Implementation Schedule of River Flood Control Plan
Since the most promising project among them is judged to be the Tallo river improvement project, the feasibility study on the structural measures is proposed to be undertaken in year 2010. The feasibility studies on the structural measures for the Maros and Gamanti/Pappa are proposed to be conducted in 2016 and 2017, respectively.
On the other hand, the non-structural measures are proposed to be put toward the implementation immediately for all objective rivers.
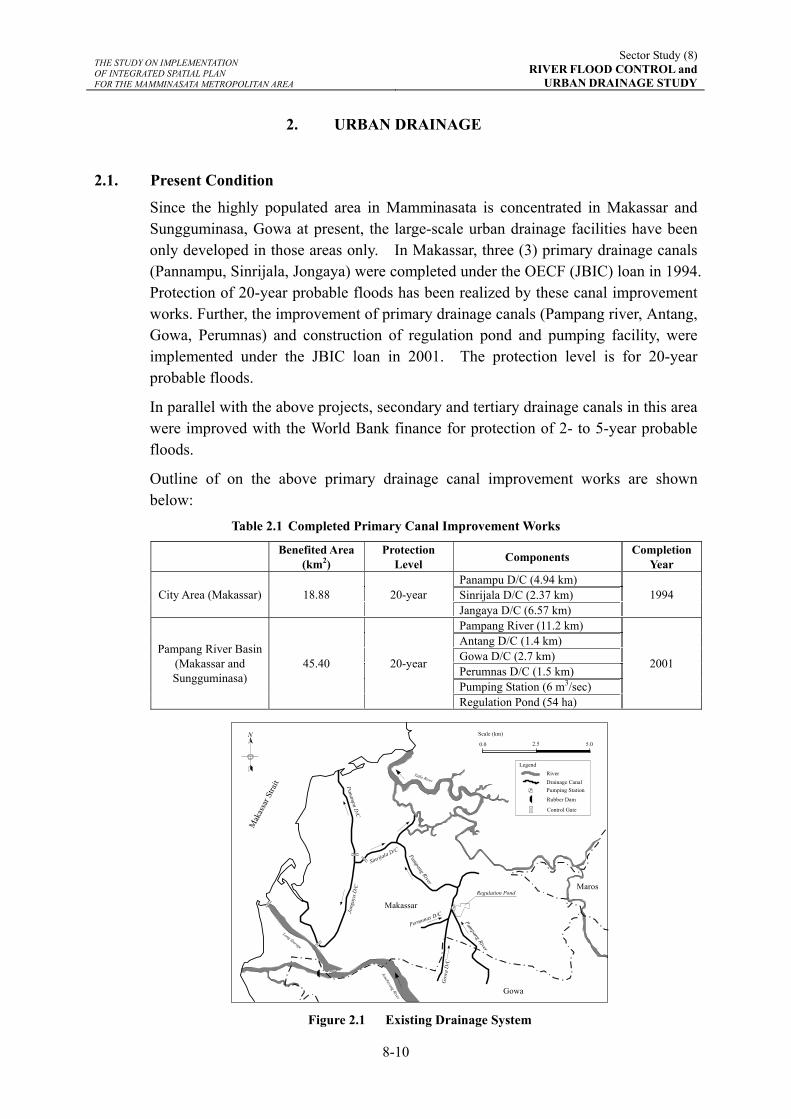
THE STUDY ON IMPLEMENTATION OF INTEGRATED SPATIAL PLAN FOR THE MAMMINASATA METROPOLITAN AREA
Sector Study (8) RIVER FLOOD CONTROL and
URBAN DRAINAGE STUDY
8-10
2. URBAN DRAINAGE
2.1. Present Condition
Since the highly populated area in Mamminasata is concentrated in Makassar and Sungguminasa, Gowa at present, the large-scale urban drainage facilities have been only developed in those areas only. In Makassar, three (3) primary drainage canals (Pannampu, Sinrijala, Jongaya) were completed under the OECF (JBIC) loan in 1994. Protection of 20-year probable floods has been realized by these canal improvement works. Further, the improvement of primary drainage canals (Pampang river, Antang, Gowa, Perumnas) and construction of regulation pond and pumping facility, were implemented under the JBIC loan in 2001. The protection level is for 20-year probable floods.
In parallel with the above projects, secondary and tertiary drainage canals in this area were improved with the World Bank finance for protection of 2- to 5-year probable floods.
Outline of on the above primary drainage canal improvement works are shown below:
Table 2.1 Completed Primary Canal Improvement Works
Benefited Area (km2)
Protection Level Components Completion
Year Panampu D/C (4.94 km) Sinrijala D/C (2.37 km) City Area (Makassar) 18.88 20-year Jangaya D/C (6.57 km)
1994
Pampang River (11.2 km) Antang D/C (1.4 km) Gowa D/C (2.7 km) Perumnas D/C (1.5 km) Pumping Station (6 m3/sec)
Pampang River Basin (Makassar and Sungguminasa)
45.40 20-year
Regulation Pond (54 ha)
2001
N Scale (km)
0.0 2.5 5.0
Panampu D
/C
Sinrijala D/C
Jong
aya
D/C
Pampang River
Pampang River
Permunas D/C
Gow
a D
/C
Jeneberang River
Long Storage
Tallo River
P
Mak
assa
r Stra
it
Makassar
Gowa
Maros
P
Regulation Pond
RiverDrainage CanalPumping Station
Rubber Dam
Control Gate
Legend
Figure 2.1 Existing Drainage System
THE STUDY ON IMPLEMENTATION OF INTEGRATED SPATIAL PLAN FOR THE MAMMINASATA METROPOLITAN AREA
Sector Study (8) RIVER FLOOD CONTROL and
URBAN DRAINAGE STUDY
8-11
According to the interviews with relevant authorities, some local inundation problems still remain in the area. Reportedly, overflows of the existing drainage canals occur several times in a rainy season and the inundation occurs when heavy rainfall comes during high tide hours in the river mouths. Duration of the inundation is 2 to 3 hours at the longest.
2.2. Issues to be Addressed Issues on the urban drainage system can be summarized as follows:
a) Inadequate Maintenance of Existing Drainage Canals
Maintenance of the existing drainage canals, especially secondary and tertiary canals, has not been undertaken properly. Sedimentations and garbages in canals often become the bottlenecks for smooth drain of storm water.
b) Introduction of Drainage Method other than Natural Drainage System
Since the land level of the local inundation area is low, the natural drainage system developed so far does not always function well. The introduction of other countermeasures against local inundation such as (i) introduction of forced drainage method (pumping facility, etc.) or (ii) runoff regulation system, are conceivable.
2.3. Planning Focuses The most important issue on the urban drainage in the Study Area is inadequate maintenance of the existing drainage channels and ditches. Most local inundations are caused by the insufficient flow capacity of ditches mainly due to disposed garbages and sediments. It is observed in many places that water is stagnated in ditches with no current.
Periodical cleaning activities are currently undertaken by the local authorities for primary canals and by communities for secondary and tertiary canals. However, those activities seldom show the effectiveness, because only a single bottleneck located in poorly maintained section often causes the inundation in the upstream area even if the ditches within the inundated area are properly maintained.
It is recommended that intensive efforts be made to repair and maintaning the existing ditches and canals so as to reacquire the function a flow path before implementing large scale investments such as new drainage canal construction.
Urban drainage improvement plan proposed below, is mainly based on the “Master Plan and Feasibility Study of Urban Drainage for the City of Ujung Pandang” in 1996 funded by IBRD and the 2001 JBIC Study, suggesting proper repair and maintenance routine of the existing ditches and canals.
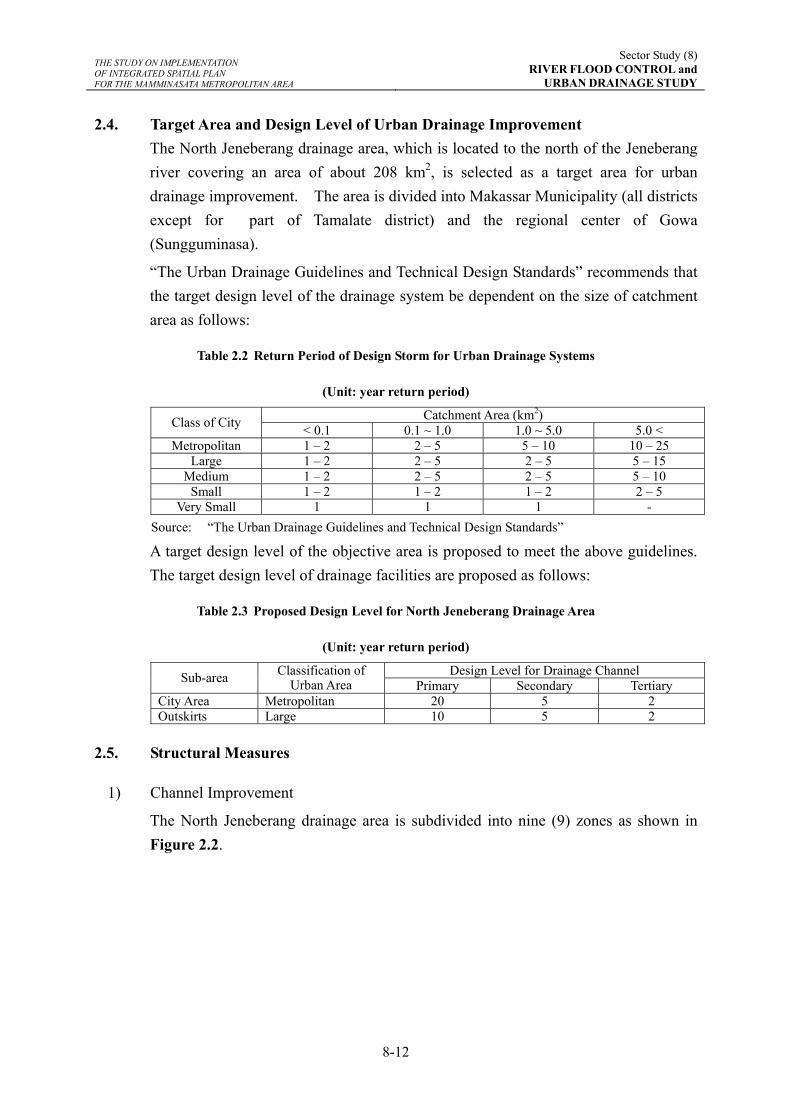
THE STUDY ON IMPLEMENTATION OF INTEGRATED SPATIAL PLAN FOR THE MAMMINASATA METROPOLITAN AREA
Sector Study (8) RIVER FLOOD CONTROL and
URBAN DRAINAGE STUDY
8-12
2.4. Target Area and Design Level of Urban Drainage Improvement The North Jeneberang drainage area, which is located to the north of the Jeneberang river covering an area of about 208 km2, is selected as a target area for urban drainage improvement. The area is divided into Makassar Municipality (all districts except for part of Tamalate district) and the regional center of Gowa (Sungguminasa).
“The Urban Drainage Guidelines and Technical Design Standards” recommends that the target design level of the drainage system be dependent on the size of catchment area as follows:
Table 2.2 Return Period of Design Storm for Urban Drainage Systems
(Unit: year return period)
Catchment Area (km2) Class of City < 0.1 0.1 ~ 1.0 1.0 ~ 5.0 5.0 < Metropolitan 1 – 2 2 – 5 5 – 10 10 – 25
Large 1 – 2 2 – 5 2 – 5 5 – 15 Medium 1 – 2 2 – 5 2 – 5 5 – 10
Small 1 – 2 1 – 2 1 – 2 2 – 5 Very Small 1 1 1 -
Source: “The Urban Drainage Guidelines and Technical Design Standards”
A target design level of the objective area is proposed to meet the above guidelines. The target design level of drainage facilities are proposed as follows:
Table 2.3 Proposed Design Level for North Jeneberang Drainage Area
(Unit: year return period)
Design Level for Drainage Channel Sub-area Classification of Urban Area Primary Secondary Tertiary
City Area Metropolitan 20 5 2 Outskirts Large 10 5 2
2.5. Structural Measures
1) Channel Improvement
The North Jeneberang drainage area is subdivided into nine (9) zones as shown in Figure 2.2.
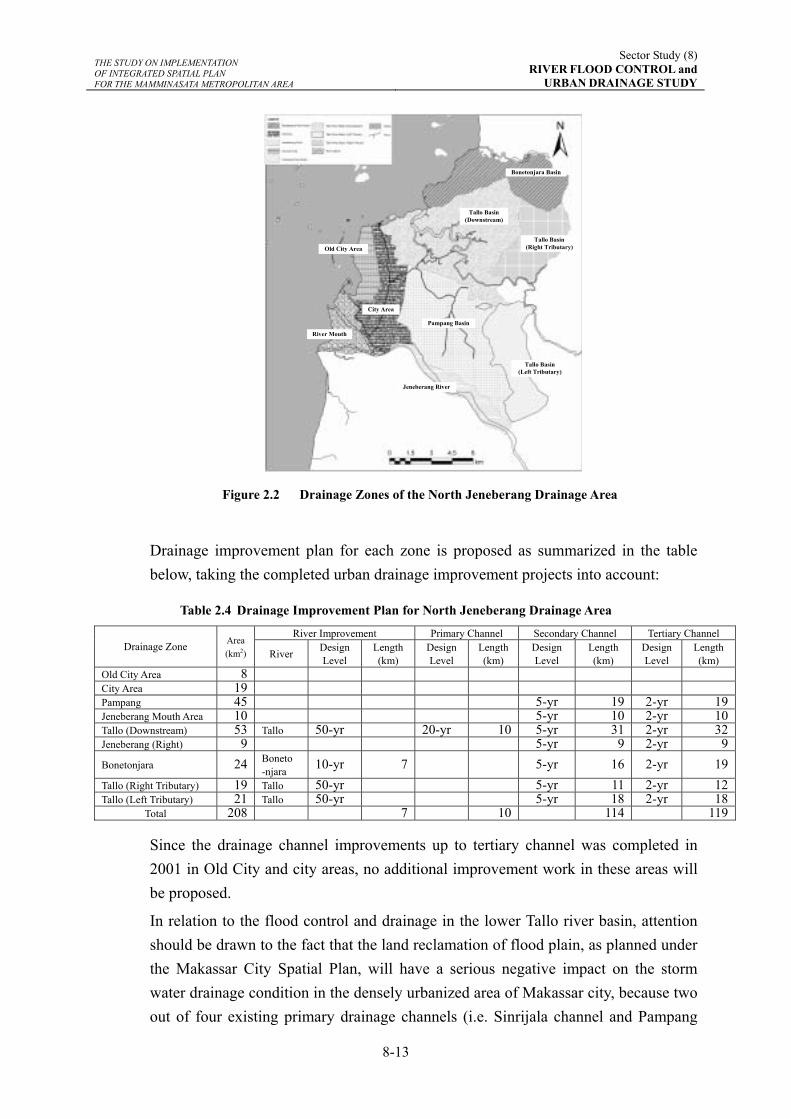
THE STUDY ON IMPLEMENTATION OF INTEGRATED SPATIAL PLAN FOR THE MAMMINASATA METROPOLITAN AREA
Sector Study (8) RIVER FLOOD CONTROL and
URBAN DRAINAGE STUDY
8-13
Bonetonjara Basin
Tallo Basin(Downstream)
Tallo Basin(Right Tributary)
Tallo Basin(Left Tributary)
Pampang Basin
City Area
Old City Area
River Mouth
Jeneberang River
Figure 2.2 Drainage Zones of the North Jeneberang Drainage Area
Drainage improvement plan for each zone is proposed as summarized in the table below, taking the completed urban drainage improvement projects into account:
Table 2.4 Drainage Improvement Plan for North Jeneberang Drainage Area
River Improvement Primary Channel Secondary Channel Tertiary Channel Drainage Zone Area
(km2) River Design Level
Length (km)
Design Level
Length (km)
Design Level
Length (km)
Design Level
Length (km)
Old City Area 8 City Area 19 Pampang 45 5-yr 19 2-yr 19Jeneberang Mouth Area 10 5-yr 10 2-yr 10Tallo (Downstream) 53 Tallo 50-yr 20-yr 10 5-yr 31 2-yr 32Jeneberang (Right) 9 5-yr 9 2-yr 9Bonetonjara 24 Boneto
-njara 10-yr 7 5-yr 16 2-yr 19Tallo (Right Tributary) 19 Tallo 50-yr 5-yr 11 2-yr 12Tallo (Left Tributary) 21 Tallo 50-yr 5-yr 18 2-yr 18
Total 208 7 10 114 119
Since the drainage channel improvements up to tertiary channel was completed in 2001 in Old City and city areas, no additional improvement work in these areas will be proposed.
In relation to the flood control and drainage in the lower Tallo river basin, attention should be drawn to the fact that the land reclamation of flood plain, as planned under the Makassar City Spatial Plan, will have a serious negative impact on the storm water drainage condition in the densely urbanized area of Makassar city, because two out of four existing primary drainage channels (i.e. Sinrijala channel and Pampang
THE STUDY ON IMPLEMENTATION OF INTEGRATED SPATIAL PLAN FOR THE MAMMINASATA METROPOLITAN AREA
Sector Study (8) RIVER FLOOD CONTROL and
URBAN DRAINAGE STUDY
8-14
river) have their outlets at the low-lying area of the Tallo river. The simulation analysis by means of the quasi-2-dimentional unsteady flow calculation also indicates that such land reclamation will make flood scale larger and its influence will extend to the upstream basin for more than 5 km. It is therefore not recommended that the lower Tallo river basin be reclaimed for industrial and other uses.
2) Other Structural Measures
Physical countermeasures against local inundations can be largely classified into (i) flowing down concept (e.g. channel improvement and pumping), and (ii) storage concept (e.g. retarding basin).
Since the ground elevation of the target area is quite low, the drainage through gravity (i.e improvement of drainage channel), has limitation in its effectiveness especially during the high tide or high water level situation at the outlets. One of the promising measures is to install a forced drainage scheme like a pumping system. However, such a system requires huge investment and OMR costs. Moreover, the system also requires high skills in the OMR.
On the other hand, construction of a flood retarding basin is another promising measure to support the channel drainage system, but it has constrain on the acquisition of extensive spaces in a highly urbanized area.
In view of the above, an idea is proposed to mitigate the local inundation through a “small scale storage concept” in the following manner.
a) Temporary storage of the storm water in public space
Some part of storm water in the channel is to be introduced into the public spaces such as park, schoolyard, or government owned land. The ground of the spaces is excavated 20 to 50 cm lower than the high water level (HWL) of the drainage channel, and storm water in the channel will flow into such spaces through the simple inlet/outlet facility. The stored water is naturally drained out to the drainage channel when the water level in the channel becomes lower than the ground elevation of these space.
b) Temporary storage of storm rainfall on the roof of buildings
The initial rainfall on the roof of buildings or houses is temporarily stored in tanks set on the ground through the gutter. Water stored in tanks is discharged after the water level in the channel become low enough.
Although these schemes may not show enough effectiveness individually, the ability of the urban drainage is enhanced as the number of spaces and/or buildings to
THE STUDY ON IMPLEMENTATION OF INTEGRATED SPATIAL PLAN FOR THE MAMMINASATA METROPOLITAN AREA
Sector Study (8) RIVER FLOOD CONTROL and
URBAN DRAINAGE STUDY
8-15
participate in increases, they also provide chances for community participation in the urban drainage sector.
2.6. Non-structural Measures
1) Risks Anticipated due to Development Activities
Non-structural measures such as land use regulation do not require large investment, while structural measures usually require huge investments and long time for implementation. The structural measures should be supported by non-structural measures for the effective implementation of the drainage improvement.
The land use change through the reclamation of low-lying area causes decrease in retarding and peak-cut effect of the storm runoff. It may change a flow regime of the basin and sometimes engenders new habitual inundation area. Again, large investments will be required for the countermeasures to be taken for the new inundation areas. It is clear that uncontrolled urbanization, especially in the low-lying area, does not have any advantage in view of the mitigation of inundation risks and cost effectiveness of disaster management.
Another remarkable aspect is an increase in flood risks due to changes in land cover from the natural soil (e.g. agricultural area) to the impervious surface (e.g. housing complex). The run-off response to the rainfall becomes quicker and the flood peak discharge becomes larger after the urbanization of agricultural areas. It should be reminded that urban development in the upstream area increases the risk of flood in the downstream area.
2) Conceivable Legal Arrangements
To avoid such unfavorable situation, the introduction of legal arrangements is recommended for the development of the new urban areas, they will include, but not limited, the following:
1) Development (filling-up) of the existing low-lying area shall be strictly restricted to reduce the inundation risk.
2) River basin adjustment in the course of development shall be prohibited in principle.
3) The facility for the retention of storm water should be installed according to the scale of development (refer to the section 3) hereinafter).
4) Developers should bear the responsibility for survey, analysis, planning, design and construction of storm water storage facility (e.g. regulation pond) at their own costs in the area to be developed. After the completion of construction, ownership and responsibility for OMR of such facilities are transferred to the
THE STUDY ON IMPLEMENTATION OF INTEGRATED SPATIAL PLAN FOR THE MAMMINASATA METROPOLITAN AREA
Sector Study (8) RIVER FLOOD CONTROL and
URBAN DRAINAGE STUDY
8-16
local government.
5) Developers should not commence the land improvement works before completion of the storm water retention facility.
3) Case Study on Determination of Storm Water Retention Facility to be Installed by Developer
The scale of retention pond should be determined based on the hydrological and hydraulic calculation reflecting the topographic condition of the objective area and retarding process of the facilities.
In Japan, although the scale of the facility is determined through the hydrological/hydraulic calculation in principle, the following formulas are also widely applied because of its simplicity:
V = 61
2⋅⋅⋅⋅
− cci
ci Afrr t
rc = Qccc Af ⋅
⋅360
where,
V: Necessary volume of the retention pond2 (m3)
fc: Runoff coefficient after the development (-)
Ac: Drainage area of the retention pond (ha)
rc: Rainfall intensity equivalent to the allowable runoff to the downstream reaches (mm/hr)
ri: Design rainfall intensity (mm/hr)
ti: Duration of the design rainfall (minutes)
Qc: Allowable runoff to the downstream reaches3
Some trial calculations for the necessary retention volume per 1 ha have been made taking the hydrometeorological conditions in the Mamminasata area into account and varying the parameters as follows:
Table 2.5 Sample Calculations for Determinations of Volume of Retention Pond No. V(m3) fc(-) Ac(ha) rc(mm/hr) ri(mm/hr) ti(min.) Qi(m3/sec)1 1,350 0.9 1 20 60 180 0.052 1,170 0.8 1 20 60 180 0.053 1,080 0.9 1 40 60 180 0.104 1,620 0.9 1 20 70 180 0.055 900 0.9 1 20 60 120 0.05
2 Sedimentation volume Vs should be added to V actually. According to the Japanese standard, Vs varies 1.5 to 150 m3/ha/yr in accordance with the stage of land improvement and land surface after the completion of land improvement. 3 The allowable runoff to the downstream area (Qc) should be determined based on the flow capacity of the downstream channels.
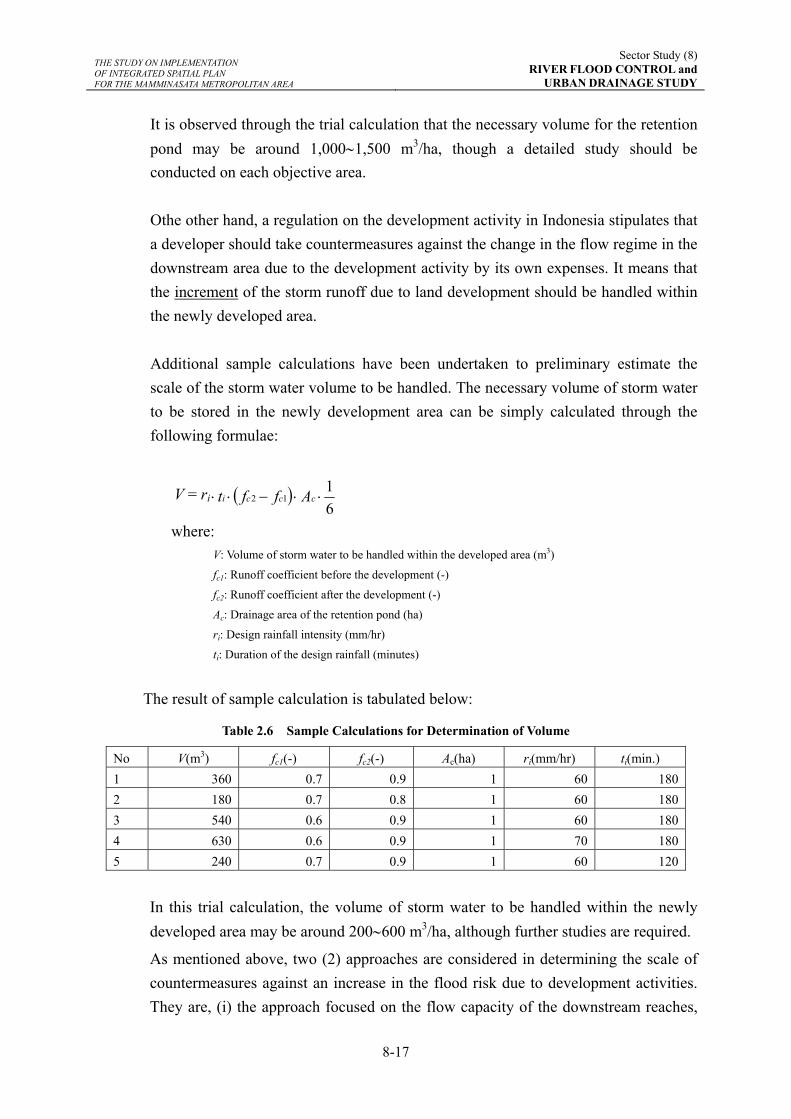
THE STUDY ON IMPLEMENTATION OF INTEGRATED SPATIAL PLAN FOR THE MAMMINASATA METROPOLITAN AREA
Sector Study (8) RIVER FLOOD CONTROL and
URBAN DRAINAGE STUDY
8-17
It is observed through the trial calculation that the necessary volume for the retention pond may be around 1,000∼1,500 m3/ha, though a detailed study should be conducted on each objective area. Othe other hand, a regulation on the development activity in Indonesia stipulates that a developer should take countermeasures against the change in the flow regime in the downstream area due to the development activity by its own expenses. It means that the increment of the storm runoff due to land development should be handled within the newly developed area. Additional sample calculations have been undertaken to preliminary estimate the scale of the storm water volume to be handled. The necessary volume of storm water to be stored in the newly development area can be simply calculated through the following formulae:
V = ri ( )61
12 ⋅⋅−⋅⋅ ccci Afft
where: V: Volume of storm water to be handled within the developed area (m3)
fc1: Runoff coefficient before the development (-)
fc2: Runoff coefficient after the development (-)
Ac: Drainage area of the retention pond (ha)
ri: Design rainfall intensity (mm/hr)
ti: Duration of the design rainfall (minutes)
The result of sample calculation is tabulated below:
Table 2.6 Sample Calculations for Determination of Volume
No V(m3) fc1(-) fc2(-) Ac(ha) ri(mm/hr) ti(min.) 1 360 0.7 0.9 1 60 1802 180 0.7 0.8 1 60 1803 540 0.6 0.9 1 60 1804 630 0.6 0.9 1 70 1805 240 0.7 0.9 1 60 120
In this trial calculation, the volume of storm water to be handled within the newly developed area may be around 200∼600 m3/ha, although further studies are required.
As mentioned above, two (2) approaches are considered in determining the scale of countermeasures against an increase in the flood risk due to development activities. They are, (i) the approach focused on the flow capacity of the downstream reaches,
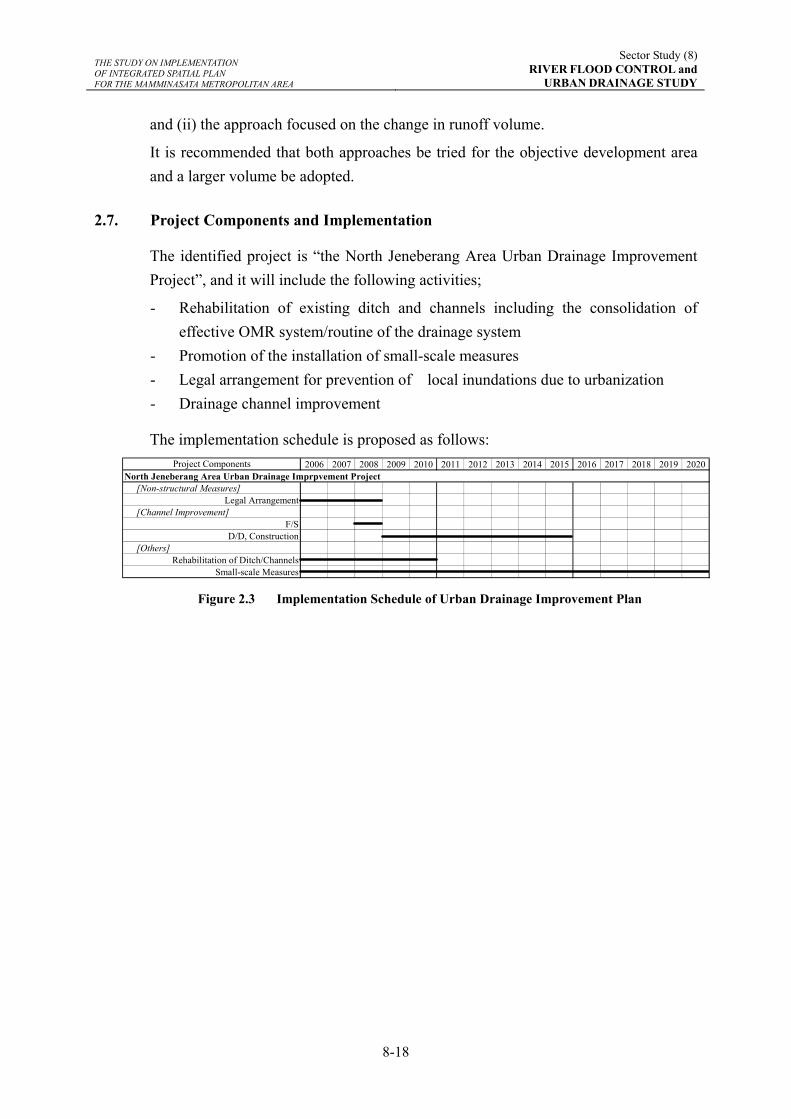
THE STUDY ON IMPLEMENTATION OF INTEGRATED SPATIAL PLAN FOR THE MAMMINASATA METROPOLITAN AREA
Sector Study (8) RIVER FLOOD CONTROL and
URBAN DRAINAGE STUDY
8-18
and (ii) the approach focused on the change in runoff volume.
It is recommended that both approaches be tried for the objective development area and a larger volume be adopted.
2.7. Project Components and Implementation
The identified project is “the North Jeneberang Area Urban Drainage Improvement Project”, and it will include the following activities;
- Rehabilitation of existing ditch and channels including the consolidation of effective OMR system/routine of the drainage system
- Promotion of the installation of small-scale measures - Legal arrangement for prevention of local inundations due to urbanization - Drainage channel improvement
The implementation schedule is proposed as follows:
Figure 2.3 Implementation Schedule of Urban Drainage Improvement Plan
2006 2007 2008 2009 2010 2011 2012 2013 2014 2015 2016 2017 2018 2019 2020North Jeneberang Area Urban Drainage Imprpvement Project
[Non-structural Measures]Legal Arrangement
[Channel Improvement]F/S
D/D, Construction[Others]
Rehabilitation of Ditch/ChannelsSmall-scale Measures
Project Components
Study on Implementation of
Integrated Spatial Plan for
The Mamminasata Metropolitan Area
SECTOR STUDY (9)
WATER SUPPLY AND SEWERAGE STUDY
KRI International Corp.
Nippon Koei Co., Ltd.
THE STUDY ON IMPLEMENTATION OF INTEGRATED SPATIAL PLAN FOR THE MAMMINASATA METROPOLITAN AREA
Sector Study (9) WATER SUPPLY AND SEWERAGE STUDY
Table of Contents
1. WATER SUPPLY .............................................................................................................. 1
1.1 Present Condition ................................................................................................. 1
1.3 Future Plans of PDAMs ....................................................................................... 5
1.4 Planning Focuses.................................................................................................. 6
1.5 Municipal Water Demand Projection ................................................................... 6
1.6 Confirmation of the Availability of Water Source................................................ 8
1.7 Stagewise Municipal Water Supply Development Plan......................................11
1.8 Countermeasures against Unaccounted-for-water (UFW) ................................. 13
1.9 Preliminary Cost Estimate for Water Supply Development Plan....................... 14
1.10 Private Sector Participation in the Water Supply Sector .................................... 14
1.11 Project Components and Implementation Schedule........................................... 16
2. WASTEWATER MANAGEMENT ............................................................................... 18
2.1 Present Condition................................................................................................ 18
2.2 Issues on the Wastewater Management in Mamminasata................................... 19
2.3 Existing Improvement Plan ................................................................................ 20
2.4 Planning Focuses ................................................................................................ 20
2.5 Wastewater Generation ....................................................................................... 21
2.6 Wastewater Management Plan............................................................................ 22
2.7 Wastewater Management Plan for Makassar...................................................... 25
2.8 Project Components and Implementation Schedule ........................................... 27
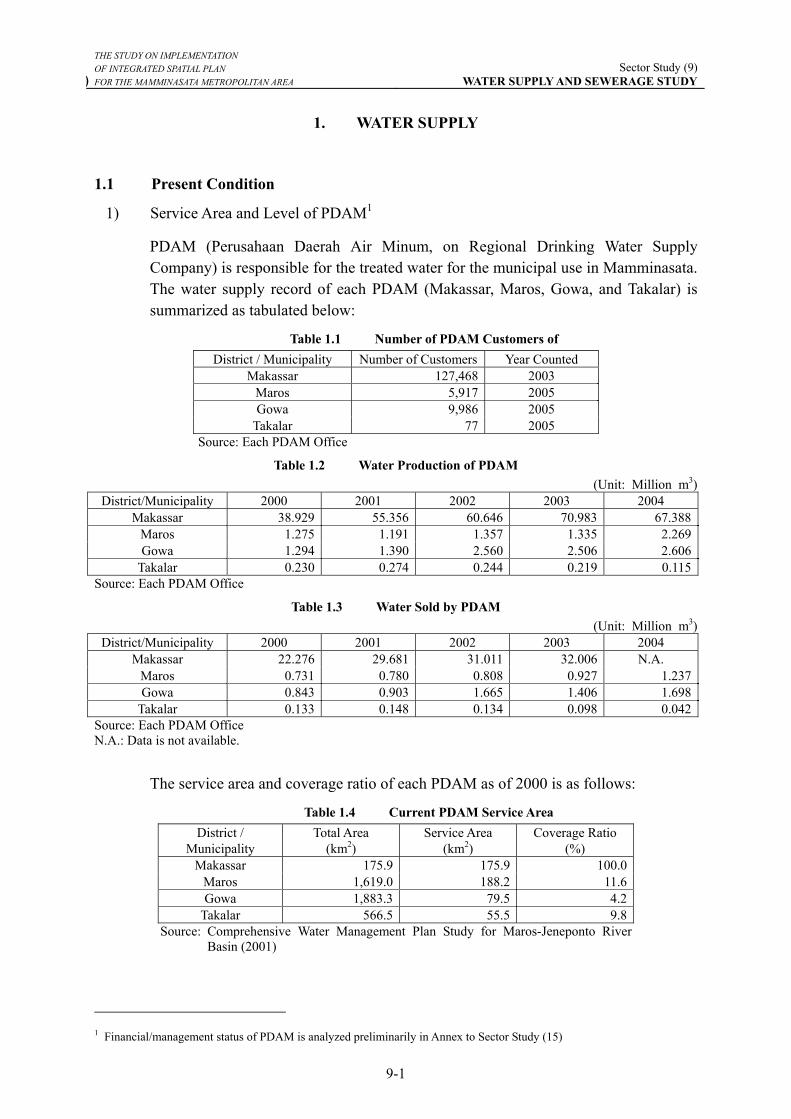
THE STUDY ON IMPLEMENTATION OF INTEGRATED SPATIAL PLAN
) FOR THE MAMMINASATA METROPOLITAN AREA Sector Study (9)
WATER SUPPLY AND SEWERAGE STUDY
9-1
1. WATER SUPPLY
1.1 Present Condition
1) Service Area and Level of PDAM1
PDAM (Perusahaan Daerah Air Minum, on Regional Drinking Water Supply Company) is responsible for the treated water for the municipal use in Mamminasata. The water supply record of each PDAM (Makassar, Maros, Gowa, and Takalar) is summarized as tabulated below:
Table 1.1 Number of PDAM Customers of District / Municipality Number of Customers Year Counted
Makassar 127,468 2003 Maros 5,917 2005 Gowa 9,986 2005
Takalar 77 2005 Source: Each PDAM Office
Table 1.2 Water Production of PDAM (Unit: Million m3)
District/Municipality 2000 2001 2002 2003 2004 Makassar 38.929 55.356 60.646 70.983 67.388
Maros 1.275 1.191 1.357 1.335 2.269Gowa 1.294 1.390 2.560 2.506 2.606
Takalar 0.230 0.274 0.244 0.219 0.115Source: Each PDAM Office
Table 1.3 Water Sold by PDAM (Unit: Million m3)
District/Municipality 2000 2001 2002 2003 2004 Makassar 22.276 29.681 31.011 32.006 N.A.
Maros 0.731 0.780 0.808 0.927 1.237Gowa 0.843 0.903 1.665 1.406 1.698
Takalar 0.133 0.148 0.134 0.098 0.042Source: Each PDAM Office N.A.: Data is not available.
The service area and coverage ratio of each PDAM as of 2000 is as follows:
Table 1.4 Current PDAM Service Area District /
Municipality Total Area
(km2) Service Area
(km2) Coverage Ratio
(%) Makassar 175.9 175.9 100.0
Maros 1,619.0 188.2 11.6 Gowa 1,883.3 79.5 4.2
Takalar 566.5 55.5 9.8 Source: Comprehensive Water Management Plan Study for Maros-Jeneponto River
Basin (2001)
1 Financial/management status of PDAM is analyzed preliminarily in Annex to Sector Study (15)
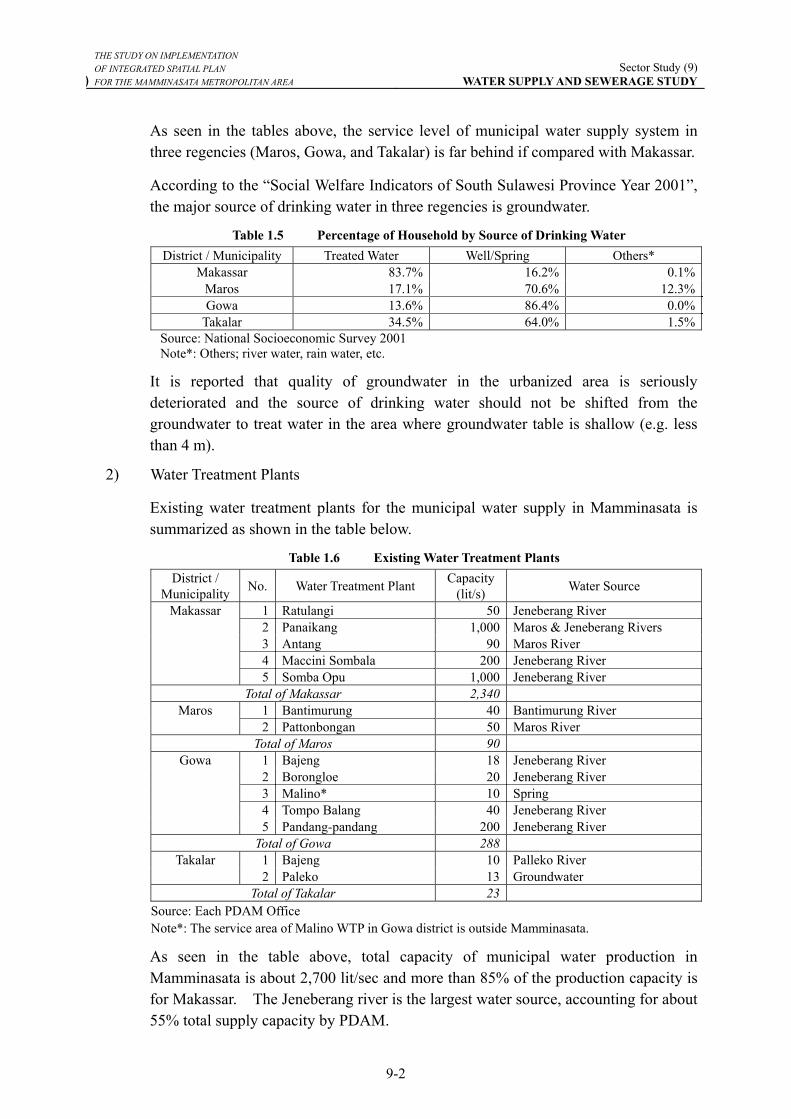
THE STUDY ON IMPLEMENTATION OF INTEGRATED SPATIAL PLAN
) FOR THE MAMMINASATA METROPOLITAN AREA Sector Study (9)
WATER SUPPLY AND SEWERAGE STUDY
9-2
As seen in the tables above, the service level of municipal water supply system in three regencies (Maros, Gowa, and Takalar) is far behind if compared with Makassar.
According to the “Social Welfare Indicators of South Sulawesi Province Year 2001”, the major source of drinking water in three regencies is groundwater.
Table 1.5 Percentage of Household by Source of Drinking Water District / Municipality Treated Water Well/Spring Others*
Makassar 83.7% 16.2% 0.1%Maros 17.1% 70.6% 12.3%Gowa 13.6% 86.4% 0.0%
Takalar 34.5% 64.0% 1.5%Source: National Socioeconomic Survey 2001 Note*: Others; river water, rain water, etc.
It is reported that quality of groundwater in the urbanized area is seriously deteriorated and the source of drinking water should not be shifted from the groundwater to treat water in the area where groundwater table is shallow (e.g. less than 4 m).
2) Water Treatment Plants
Existing water treatment plants for the municipal water supply in Mamminasata is summarized as shown in the table below.
Table 1.6 Existing Water Treatment Plants District /
Municipality No. Water Treatment Plant Capacity (lit/s) Water Source
1 Ratulangi 50 Jeneberang River 2 Panaikang 1,000 Maros & Jeneberang Rivers 3 Antang 90 Maros River 4 Maccini Sombala 200 Jeneberang River
Makassar
5 Somba Opu 1,000 Jeneberang River Total of Makassar 2,340
1 Bantimurung 40 Bantimurung River Maros 2 Pattonbongan 50 Maros River
Total of Maros 90 1 Bajeng 18 Jeneberang River 2 Borongloe 20 Jeneberang River 3 Malino* 10 Spring 4 Tompo Balang 40 Jeneberang River
Gowa
5 Pandang-pandang 200 Jeneberang River Total of Gowa 288
1 Bajeng 10 Palleko River Takalar 2 Paleko 13 Groundwater
Total of Takalar 23 Source: Each PDAM Office Note*: The service area of Malino WTP in Gowa district is outside Mamminasata.
As seen in the table above, total capacity of municipal water production in Mamminasata is about 2,700 lit/sec and more than 85% of the production capacity is for Makassar. The Jeneberang river is the largest water source, accounting for about 55% total supply capacity by PDAM.
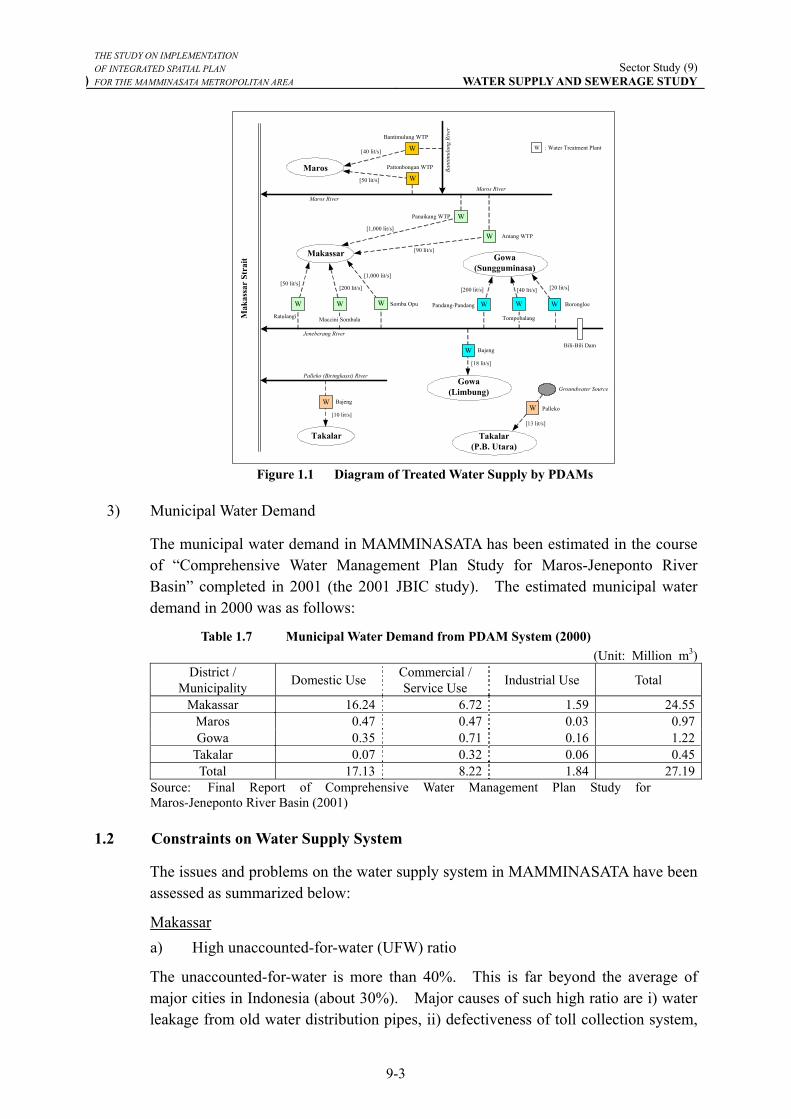
THE STUDY ON IMPLEMENTATION OF INTEGRATED SPATIAL PLAN
) FOR THE MAMMINASATA METROPOLITAN AREA Sector Study (9)
WATER SUPPLY AND SEWERAGE STUDY
9-3
Maros
WBantimulung WTP
WPattonbongan WTP
W
W
Panaikang WTP
Antang WTP
Makassar
W W W Somba Opu
Ratulangi Maccini Sombala
Gowa(Sungguminasa)
Pandang-Pandang Borongloe
Gowa(Limbung)
W
W W W
Tompobalang
Bajeng
Takalar
W Bajeng
Takalar(P.B. Utara)
W Palleko
Maros River
Maros River
Bant
imul
ung
Rive
r
Jeneberang River
Palleko (Biringkassi) River
Groundwater Source
Mak
assa
r St
rait
[10 lit/s][13 lit/s]
[18 lit/s]
[20 lit/s][40 lit/s][200 lit/s]
[1,000 lit/s]
[200 lit/s][50 lit/s]
[90 lit/s]
[1,000 lit/s]
[40 lit/s]
[50 lit/s]
W : Water Treatment Plant
Bili-Bili Dam
Figure 1.1 Diagram of Treated Water Supply by PDAMs
3) Municipal Water Demand
The municipal water demand in MAMMINASATA has been estimated in the course of “Comprehensive Water Management Plan Study for Maros-Jeneponto River Basin” completed in 2001 (the 2001 JBIC study). The estimated municipal water demand in 2000 was as follows:
Table 1.7 Municipal Water Demand from PDAM System (2000) (Unit: Million m3)
District / Municipality Domestic Use Commercial /
Service Use Industrial Use Total
Makassar 16.24 6.72 1.59 24.55Maros 0.47 0.47 0.03 0.97Gowa 0.35 0.71 0.16 1.22
Takalar 0.07 0.32 0.06 0.45Total 17.13 8.22 1.84 27.19
Source: Final Report of Comprehensive Water Management Plan Study for Maros-Jeneponto River Basin (2001)
1.2 Constraints on Water Supply System
The issues and problems on the water supply system in MAMMINASATA have been assessed as summarized below:
Makassar a) High unaccounted-for-water (UFW) ratio
The unaccounted-for-water is more than 40%. This is far beyond the average of major cities in Indonesia (about 30%). Major causes of such high ratio are i) water leakage from old water distribution pipes, ii) defectiveness of toll collection system,
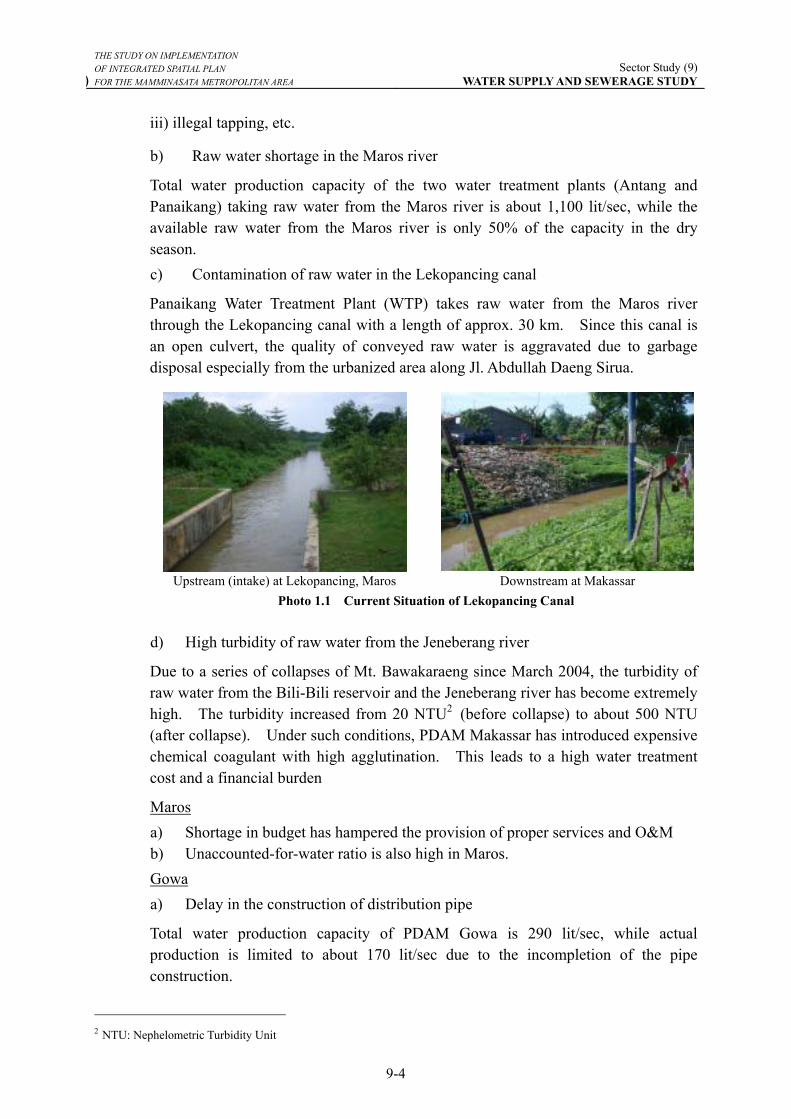
THE STUDY ON IMPLEMENTATION OF INTEGRATED SPATIAL PLAN
) FOR THE MAMMINASATA METROPOLITAN AREA Sector Study (9)
WATER SUPPLY AND SEWERAGE STUDY
9-4
iii) illegal tapping, etc.
b) Raw water shortage in the Maros river
Total water production capacity of the two water treatment plants (Antang and Panaikang) taking raw water from the Maros river is about 1,100 lit/sec, while the available raw water from the Maros river is only 50% of the capacity in the dry season. c) Contamination of raw water in the Lekopancing canal
Panaikang Water Treatment Plant (WTP) takes raw water from the Maros river through the Lekopancing canal with a length of approx. 30 km. Since this canal is an open culvert, the quality of conveyed raw water is aggravated due to garbage disposal especially from the urbanized area along Jl. Abdullah Daeng Sirua.
Upstream (intake) at Lekopancing, Maros Downstream at Makassar
Photo 1.1 Current Situation of Lekopancing Canal d) High turbidity of raw water from the Jeneberang river
Due to a series of collapses of Mt. Bawakaraeng since March 2004, the turbidity of raw water from the Bili-Bili reservoir and the Jeneberang river has become extremely high. The turbidity increased from 20 NTU2 (before collapse) to about 500 NTU (after collapse). Under such conditions, PDAM Makassar has introduced expensive chemical coagulant with high agglutination. This leads to a high water treatment cost and a financial burden
Maros a) Shortage in budget has hampered the provision of proper services and O&M b) Unaccounted-for-water ratio is also high in Maros. Gowa a) Delay in the construction of distribution pipe
Total water production capacity of PDAM Gowa is 290 lit/sec, while actual production is limited to about 170 lit/sec due to the incompletion of the pipe construction.
2 NTU: Nephelometric Turbidity Unit
THE STUDY ON IMPLEMENTATION OF INTEGRATED SPATIAL PLAN
) FOR THE MAMMINASATA METROPOLITAN AREA Sector Study (9)
WATER SUPPLY AND SEWERAGE STUDY
9-5
b) High unaccounted-for-water ratio c) High turbidity of raw water from the Jeneberang river Takalar a) Raw water shortage
Due to shortage in raw water, the municipal water in serviceable only for 6 to 7 hours per day. b) Shortage in budget has hampered the provision of proper services and O&M
1.3 Future Plans of PDAMs
PDAMs hae the following plans for improvement of water supply in MAMMINASATA.
Makassar a) Expansion of Water Production Capacity at Somba Opu WTP
PDAM Makassar is now planning to expand the capacity of Somba Opu WTP from the existing 1,000 lit/sec to 3,000 lit/sec3 in order to cope with the water shortage. This was originally planned for completion in 2002 as the phase 2 work of the “Ujung Pandang Water Supply Development Project”. However, this expansion project has not been realized yet. b) Reduction of Unaccounted-for-water
The “Euro-Promocap-IWAT project for capacity building in water utilities” funded by the European Union (EU) is underway. An area of about 1,300 house connections located in the old city of Makassar has been selected as a pilot area against the water leakage from the water distribution pipes. According to PDAM Makassar, detailed action plan and the contents of the pilot project will be finalized soon.
Maros
No concrete plan has been prepared by PDAM.
Gowa a) Construction of New WTPs
The construction of four (4) new WTPs4 with distribution pipe has been planned. Total water production capacity added by these WTPs is 200 lit/sec. The Jeneberang river will be the raw water source.
Takalar a) Construction of New WTPs
3 The flow capacity of the raw water intake pipe of Somba Opu WTP is 3,300 lit/sec. 4 These 4 WTPs are planned to be located in Kecamatans 1) Bontomarannu, 2) Pattallassang, 3) Bonto Nompo, and 4)
Parangloe.
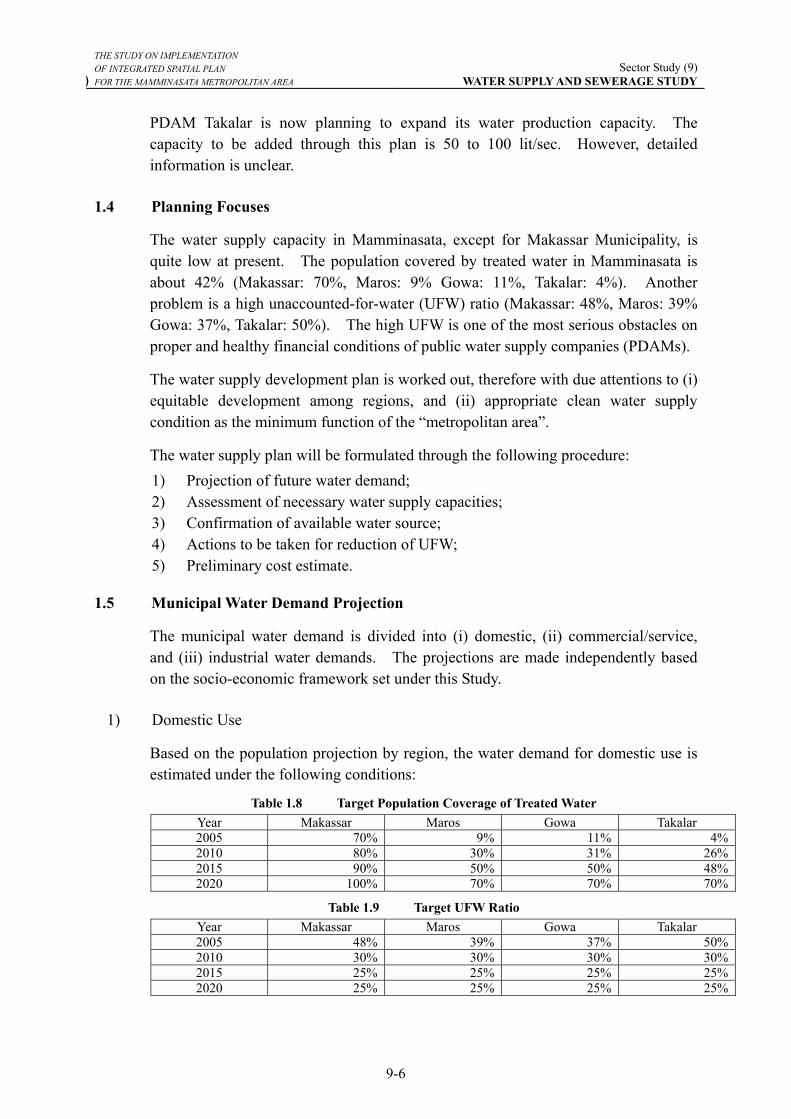
THE STUDY ON IMPLEMENTATION OF INTEGRATED SPATIAL PLAN
) FOR THE MAMMINASATA METROPOLITAN AREA Sector Study (9)
WATER SUPPLY AND SEWERAGE STUDY
9-6
PDAM Takalar is now planning to expand its water production capacity. The capacity to be added through this plan is 50 to 100 lit/sec. However, detailed information is unclear.
1.4 Planning Focuses
The water supply capacity in Mamminasata, except for Makassar Municipality, is quite low at present. The population covered by treated water in Mamminasata is about 42% (Makassar: 70%, Maros: 9% Gowa: 11%, Takalar: 4%). Another problem is a high unaccounted-for-water (UFW) ratio (Makassar: 48%, Maros: 39% Gowa: 37%, Takalar: 50%). The high UFW is one of the most serious obstacles on proper and healthy financial conditions of public water supply companies (PDAMs).
The water supply development plan is worked out, therefore with due attentions to (i) equitable development among regions, and (ii) appropriate clean water supply condition as the minimum function of the “metropolitan area”.
The water supply plan will be formulated through the following procedure: 1) Projection of future water demand; 2) Assessment of necessary water supply capacities; 3) Confirmation of available water source; 4) Actions to be taken for reduction of UFW; 5) Preliminary cost estimate.
1.5 Municipal Water Demand Projection
The municipal water demand is divided into (i) domestic, (ii) commercial/service, and (iii) industrial water demands. The projections are made independently based on the socio-economic framework set under this Study.
1) Domestic Use
Based on the population projection by region, the water demand for domestic use is estimated under the following conditions:
Table 1.8 Target Population Coverage of Treated Water Year Makassar Maros Gowa Takalar 2005 70% 9% 11% 4%2010 80% 30% 31% 26%2015 90% 50% 50% 48%2020 100% 70% 70% 70%
Table 1.9 Target UFW Ratio Year Makassar Maros Gowa Takalar 2005 48% 39% 37% 50%2010 30% 30% 30% 30%2015 25% 25% 25% 25%2020 25% 25% 25% 25%
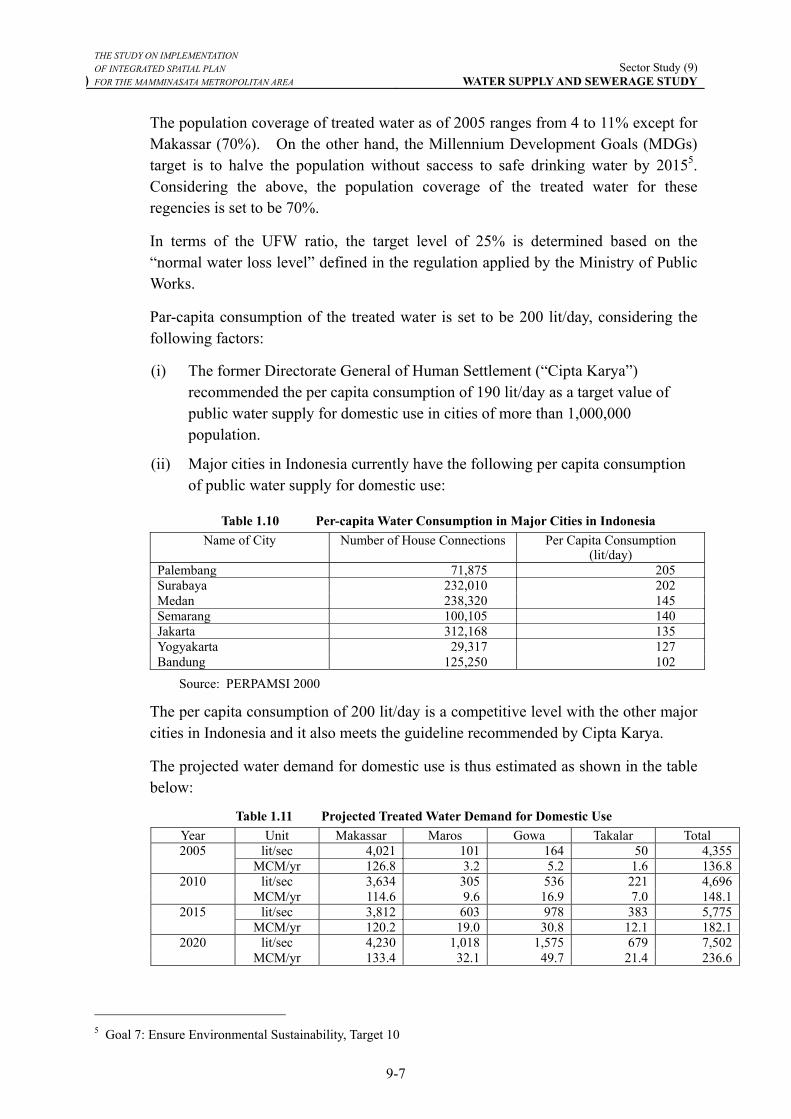
THE STUDY ON IMPLEMENTATION OF INTEGRATED SPATIAL PLAN
) FOR THE MAMMINASATA METROPOLITAN AREA Sector Study (9)
WATER SUPPLY AND SEWERAGE STUDY
9-7
The population coverage of treated water as of 2005 ranges from 4 to 11% except for Makassar (70%). On the other hand, the Millennium Development Goals (MDGs) target is to halve the population without saccess to safe drinking water by 20155. Considering the above, the population coverage of the treated water for these regencies is set to be 70%.
In terms of the UFW ratio, the target level of 25% is determined based on the “normal water loss level” defined in the regulation applied by the Ministry of Public Works.
Par-capita consumption of the treated water is set to be 200 lit/day, considering the following factors:
(i) The former Directorate General of Human Settlement (“Cipta Karya”) recommended the per capita consumption of 190 lit/day as a target value of public water supply for domestic use in cities of more than 1,000,000 population.
(ii) Major cities in Indonesia currently have the following per capita consumption of public water supply for domestic use:
Table 1.10 Per-capita Water Consumption in Major Cities in Indonesia
Name of City Number of House Connections Per Capita Consumption (lit/day)
Palembang 71,875 205 Surabaya 232,010 202 Medan 238,320 145 Semarang 100,105 140 Jakarta 312,168 135 Yogyakarta 29,317 127 Bandung 125,250 102
Source: PERPAMSI 2000
The per capita consumption of 200 lit/day is a competitive level with the other major cities in Indonesia and it also meets the guideline recommended by Cipta Karya.
The projected water demand for domestic use is thus estimated as shown in the table below:
Table 1.11 Projected Treated Water Demand for Domestic Use Year Unit Makassar Maros Gowa Takalar Total
lit/sec 4,021 101 164 50 4,3552005 MCM/yr 126.8 3.2 5.2 1.6 136.8
lit/sec 3,634 305 536 221 4,6962010 MCM/yr 114.6 9.6 16.9 7.0 148.1
lit/sec 3,812 603 978 383 5,7752015 MCM/yr 120.2 19.0 30.8 12.1 182.1
lit/sec 4,230 1,018 1,575 679 7,5022020 MCM/yr 133.4 32.1 49.7 21.4 236.6
5 Goal 7: Ensure Environmental Sustainability, Target 10
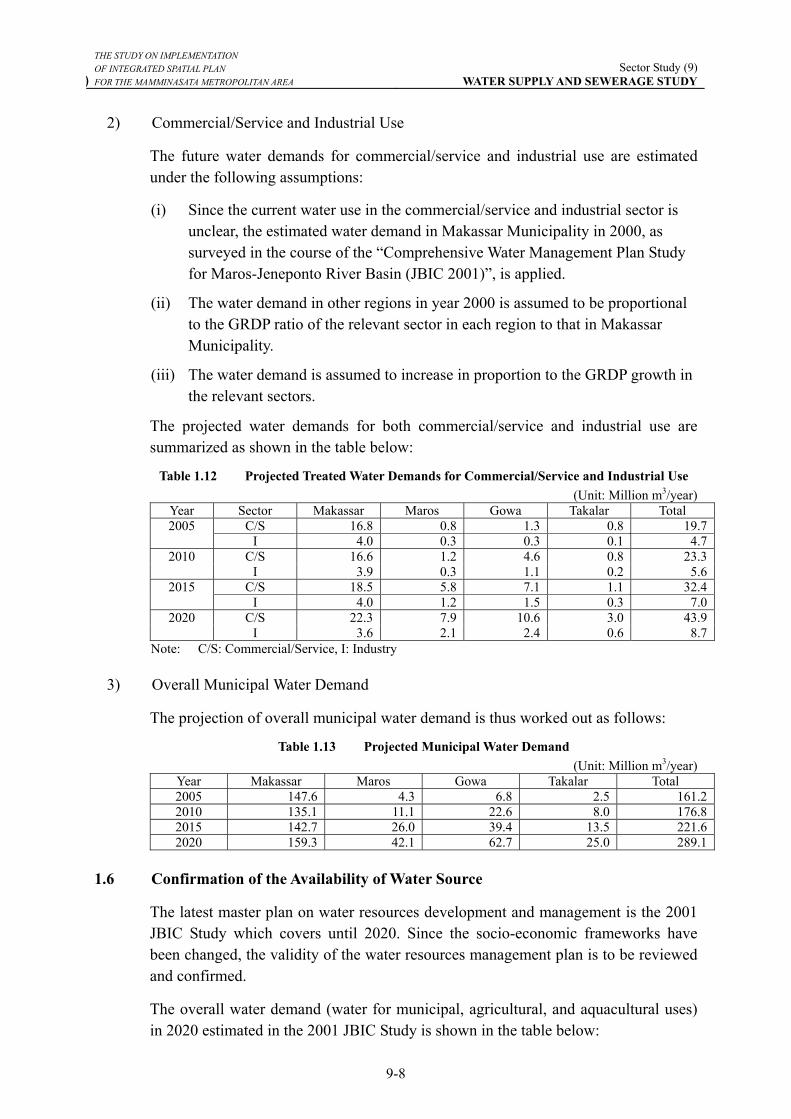
THE STUDY ON IMPLEMENTATION OF INTEGRATED SPATIAL PLAN
) FOR THE MAMMINASATA METROPOLITAN AREA Sector Study (9)
WATER SUPPLY AND SEWERAGE STUDY
9-8
2) Commercial/Service and Industrial Use
The future water demands for commercial/service and industrial use are estimated under the following assumptions:
(i) Since the current water use in the commercial/service and industrial sector is unclear, the estimated water demand in Makassar Municipality in 2000, as surveyed in the course of the “Comprehensive Water Management Plan Study for Maros-Jeneponto River Basin (JBIC 2001)”, is applied.
(ii) The water demand in other regions in year 2000 is assumed to be proportional to the GRDP ratio of the relevant sector in each region to that in Makassar Municipality.
(iii) The water demand is assumed to increase in proportion to the GRDP growth in the relevant sectors.
The projected water demands for both commercial/service and industrial use are summarized as shown in the table below:
Table 1.12 Projected Treated Water Demands for Commercial/Service and Industrial Use (Unit: Million m3/year)
Year Sector Makassar Maros Gowa Takalar Total C/S 16.8 0.8 1.3 0.8 19.72005
I 4.0 0.3 0.3 0.1 4.7C/S 16.6 1.2 4.6 0.8 23.32010
I 3.9 0.3 1.1 0.2 5.6C/S 18.5 5.8 7.1 1.1 32.42015
I 4.0 1.2 1.5 0.3 7.0C/S 22.3 7.9 10.6 3.0 43.92020
I 3.6 2.1 2.4 0.6 8.7Note: C/S: Commercial/Service, I: Industry
3) Overall Municipal Water Demand
The projection of overall municipal water demand is thus worked out as follows:
Table 1.13 Projected Municipal Water Demand (Unit: Million m3/year)
Year Makassar Maros Gowa Takalar Total 2005 147.6 4.3 6.8 2.5 161.22010 135.1 11.1 22.6 8.0 176.82015 142.7 26.0 39.4 13.5 221.62020 159.3 42.1 62.7 25.0 289.1
1.6 Confirmation of the Availability of Water Source
The latest master plan on water resources development and management is the 2001 JBIC Study which covers until 2020. Since the socio-economic frameworks have been changed, the validity of the water resources management plan is to be reviewed and confirmed.
The overall water demand (water for municipal, agricultural, and aquacultural uses) in 2020 estimated in the 2001 JBIC Study is shown in the table below:
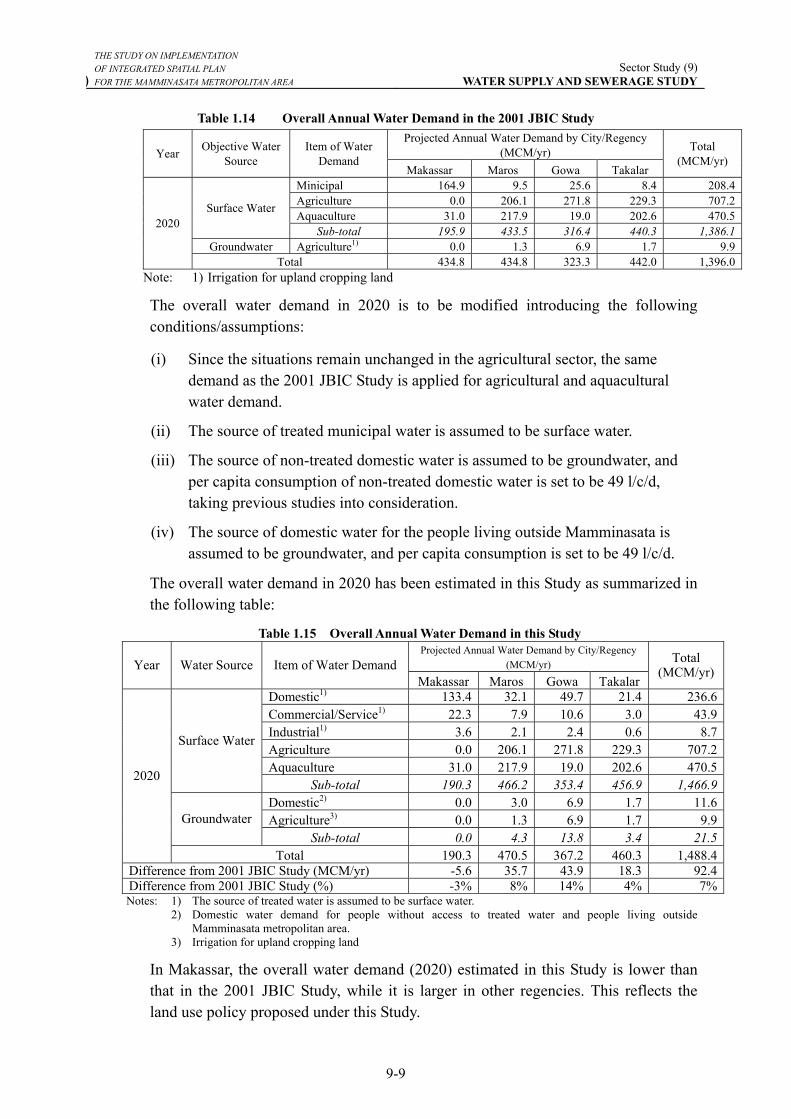
THE STUDY ON IMPLEMENTATION OF INTEGRATED SPATIAL PLAN
) FOR THE MAMMINASATA METROPOLITAN AREA Sector Study (9)
WATER SUPPLY AND SEWERAGE STUDY
9-9
Table 1.14 Overall Annual Water Demand in the 2001 JBIC Study Projected Annual Water Demand by City/Regency
(MCM/yr) Year Objective Water Source
Item of Water Demand
Makassar Maros Gowa Takalar
Total (MCM/yr)
Minicipal 164.9 9.5 25.6 8.4 208.4Agriculture 0.0 206.1 271.8 229.3 707.2Aquaculture 31.0 217.9 19.0 202.6 470.5
Surface Water
Sub-total 195.9 433.5 316.4 440.3 1,386.1Groundwater Agriculture1) 0.0 1.3 6.9 1.7 9.9
2020
Total 434.8 434.8 323.3 442.0 1,396.0Note: 1) Irrigation for upland cropping land
The overall water demand in 2020 is to be modified introducing the following conditions/assumptions:
(i) Since the situations remain unchanged in the agricultural sector, the same demand as the 2001 JBIC Study is applied for agricultural and aquacultural water demand.
(ii) The source of treated municipal water is assumed to be surface water.
(iii) The source of non-treated domestic water is assumed to be groundwater, and per capita consumption of non-treated domestic water is set to be 49 l/c/d, taking previous studies into consideration.
(iv) The source of domestic water for the people living outside Mamminasata is assumed to be groundwater, and per capita consumption is set to be 49 l/c/d.
The overall water demand in 2020 has been estimated in this Study as summarized in the following table:
Table 1.15 Overall Annual Water Demand in this Study Projected Annual Water Demand by City/Regency
(MCM/yr) Year Water Source Item of Water DemandMakassar Maros Gowa Takalar
Total (MCM/yr)
Domestic1) 133.4 32.1 49.7 21.4 236.6Commercial/Service1) 22.3 7.9 10.6 3.0 43.9Industrial1) 3.6 2.1 2.4 0.6 8.7Agriculture 0.0 206.1 271.8 229.3 707.2Aquaculture 31.0 217.9 19.0 202.6 470.5
Surface Water
Sub-total 190.3 466.2 353.4 456.9 1,466.9Domestic2) 0.0 3.0 6.9 1.7 11.6Agriculture3) 0.0 1.3 6.9 1.7 9.9Groundwater
Sub-total 0.0 4.3 13.8 3.4 21.5
2020
Total 190.3 470.5 367.2 460.3 1,488.4Difference from 2001 JBIC Study (MCM/yr) -5.6 35.7 43.9 18.3 92.4Difference from 2001 JBIC Study (%) -3% 8% 14% 4% 7%Notes: 1) The source of treated water is assumed to be surface water. 2) Domestic water demand for people without access to treated water and people living outside
Mamminasata metropolitan area. 3) Irrigation for upland cropping land
In Makassar, the overall water demand (2020) estimated in this Study is lower than that in the 2001 JBIC Study, while it is larger in other regencies. This reflects the land use policy proposed under this Study.
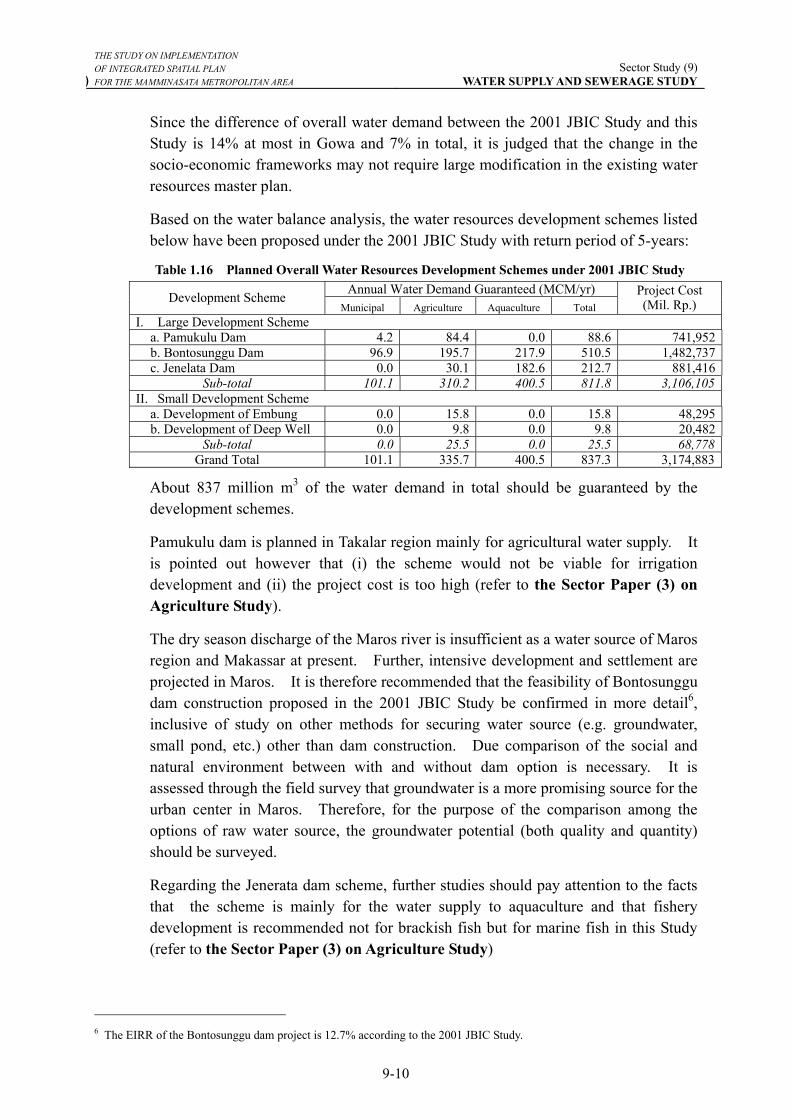
THE STUDY ON IMPLEMENTATION OF INTEGRATED SPATIAL PLAN
) FOR THE MAMMINASATA METROPOLITAN AREA Sector Study (9)
WATER SUPPLY AND SEWERAGE STUDY
9-10
Since the difference of overall water demand between the 2001 JBIC Study and this Study is 14% at most in Gowa and 7% in total, it is judged that the change in the socio-economic frameworks may not require large modification in the existing water resources master plan.
Based on the water balance analysis, the water resources development schemes listed below have been proposed under the 2001 JBIC Study with return period of 5-years:
Table 1.16 Planned Overall Water Resources Development Schemes under 2001 JBIC Study Annual Water Demand Guaranteed (MCM/yr) Development Scheme
Municipal Agriculture Aquaculture Total Project Cost (Mil. Rp.)
I. Large Development Scheme a. Pamukulu Dam 4.2 84.4 0.0 88.6 741,952 b. Bontosunggu Dam 96.9 195.7 217.9 510.5 1,482,737 c. Jenelata Dam 0.0 30.1 182.6 212.7 881,416
Sub-total 101.1 310.2 400.5 811.8 3,106,105II. Small Development Scheme a. Development of Embung 0.0 15.8 0.0 15.8 48,295 b. Development of Deep Well 0.0 9.8 0.0 9.8 20,482
Sub-total 0.0 25.5 0.0 25.5 68,778Grand Total 101.1 335.7 400.5 837.3 3,174,883
About 837 million m3 of the water demand in total should be guaranteed by the development schemes.
Pamukulu dam is planned in Takalar region mainly for agricultural water supply. It is pointed out however that (i) the scheme would not be viable for irrigation development and (ii) the project cost is too high (refer to the Sector Paper (3) on Agriculture Study).
The dry season discharge of the Maros river is insufficient as a water source of Maros region and Makassar at present. Further, intensive development and settlement are projected in Maros. It is therefore recommended that the feasibility of Bontosunggu dam construction proposed in the 2001 JBIC Study be confirmed in more detail6, inclusive of study on other methods for securing water source (e.g. groundwater, small pond, etc.) other than dam construction. Due comparison of the social and natural environment between with and without dam option is necessary. It is assessed through the field survey that groundwater is a more promising source for the urban center in Maros. Therefore, for the purpose of the comparison among the options of raw water source, the groundwater potential (both quality and quantity) should be surveyed.
Regarding the Jenerata dam scheme, further studies should pay attention to the facts that the scheme is mainly for the water supply to aquaculture and that fishery development is recommended not for brackish fish but for marine fish in this Study (refer to the Sector Paper (3) on Agriculture Study)
6 The EIRR of the Bontosunggu dam project is 12.7% according to the 2001 JBIC Study.
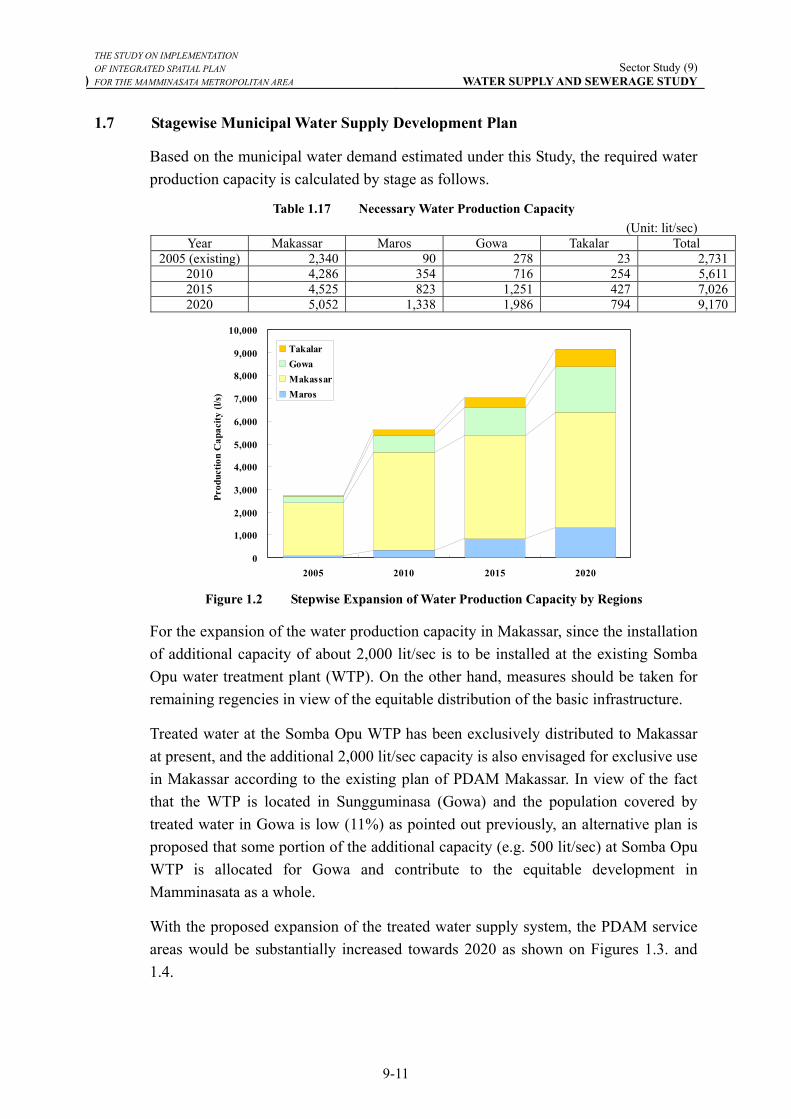
THE STUDY ON IMPLEMENTATION OF INTEGRATED SPATIAL PLAN
) FOR THE MAMMINASATA METROPOLITAN AREA Sector Study (9)
WATER SUPPLY AND SEWERAGE STUDY
9-11
1.7 Stagewise Municipal Water Supply Development Plan
Based on the municipal water demand estimated under this Study, the required water production capacity is calculated by stage as follows.
Table 1.17 Necessary Water Production Capacity (Unit: lit/sec)
Year Makassar Maros Gowa Takalar Total 2005 (existing) 2,340 90 278 23 2,731
2010 4,286 354 716 254 5,6112015 4,525 823 1,251 427 7,0262020 5,052 1,338 1,986 794 9,170
0
1,000
2,000
3,000
4,000
5,000
6,000
7,000
8,000
9,000
10,000
2005 2010 2015 2020
Prod
uctio
n C
apac
ity (l
/s)
TakalarGowaMakassarMaros
Figure 1.2 Stepwise Expansion of Water Production Capacity by Regions
For the expansion of the water production capacity in Makassar, since the installation of additional capacity of about 2,000 lit/sec is to be installed at the existing Somba Opu water treatment plant (WTP). On the other hand, measures should be taken for remaining regencies in view of the equitable distribution of the basic infrastructure.
Treated water at the Somba Opu WTP has been exclusively distributed to Makassar at present, and the additional 2,000 lit/sec capacity is also envisaged for exclusive use in Makassar according to the existing plan of PDAM Makassar. In view of the fact that the WTP is located in Sungguminasa (Gowa) and the population covered by treated water in Gowa is low (11%) as pointed out previously, an alternative plan is proposed that some portion of the additional capacity (e.g. 500 lit/sec) at Somba Opu WTP is allocated for Gowa and contribute to the equitable development in Mamminasata as a whole.
With the proposed expansion of the treated water supply system, the PDAM service areas would be substantially increased towards 2020 as shown on Figures 1.3. and 1.4.
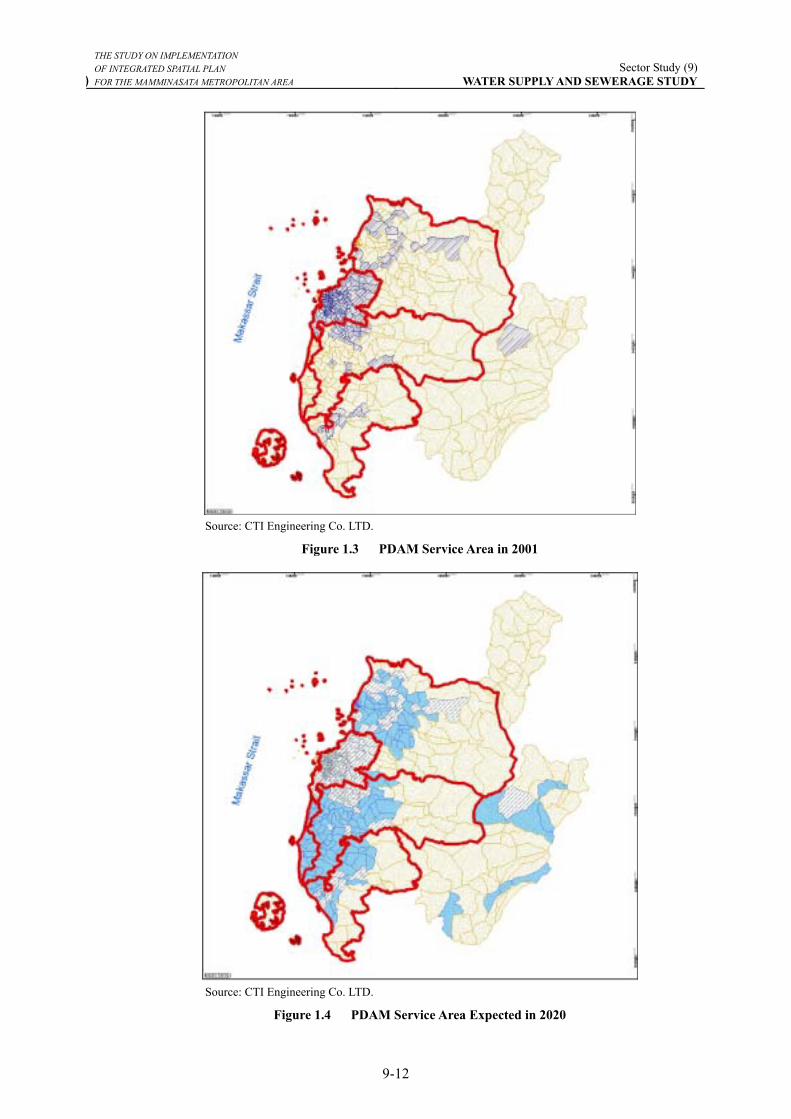
THE STUDY ON IMPLEMENTATION OF INTEGRATED SPATIAL PLAN
) FOR THE MAMMINASATA METROPOLITAN AREA Sector Study (9)
WATER SUPPLY AND SEWERAGE STUDY
9-12
Source: CTI Engineering Co. LTD.
Figure 1.3 PDAM Service Area in 2001
Source: CTI Engineering Co. LTD.
Figure 1.4 PDAM Service Area Expected in 2020
THE STUDY ON IMPLEMENTATION OF INTEGRATED SPATIAL PLAN
) FOR THE MAMMINASATA METROPOLITAN AREA Sector Study (9)
WATER SUPPLY AND SEWERAGE STUDY
9-13
1.8 Countermeasures against Unaccounted-for-water (UFW)
As noted previously, countermeasure against UFW is one of the most essential matters for the improvement of the service level and financial conditions of PDAMs in Mamminasata. Although PDAMs have already recognized it, only a few attempts for water loss overcoming (WLO) have been executed so far.
In parallel with the development of the additional water production capacity, countermeasures against UFW should be implemented by all means. The results of a ilot project for WLO in Makassar, entitled the “Bantuan Teknik Penurunan Kebocoran PDAM Kota Makassar (Technical Aid on Leakage Reduction in the Service Area of PDAM Makassar)” completed in November 2004 will give valuable suggestions7. Although the objective of this pilot project was the reduction of UFW in PDAM Makassar, the same concept would be applicable for other PDAMs. Based on the result of the pilot project, it is recommended that the following action programs be launched immediately:
It is recommended that the following actions be launched immediately:
Short-term Plan • Target Year : 2010 • Target UFW Ratio : 30% • Estimated Cost : Rp. 23.5 billion (for Makassar area only) • Main Contents:
- Establishment or re-arrangement of WLO team, giving reward and punishment and to select a capable team leader.
- Establishment of several pilot zones in each of regions to correct the result/conclusion of the 2004 WLO Project so that all service area can be represented (the area with pressure in network of 1 Bar to be selected).
- Repairing all main meters to know how much is the actual distribution capacity.
- Preparation of the inventory of customer meter
- Pulling out and re-install all customer meters which are more than 5 years old and/or recorded water usage per month of less than 5m3/month.
- Updating customer data by execution of customer sweeping survey and recording all data in the format of database, graphic data, and GIS.
Mid-term Plan • Target Year : 2015 • Target UFW Ratio : 25%
7 It was reported that the initial water loss of about 45% was reduced to about 23% through the project. The physical WLO (repairing leakages) at pilot zones reduced 4% of water loss, while non-physical WLO (replacement of meters etc.) could reduce 18.2% of water loss.
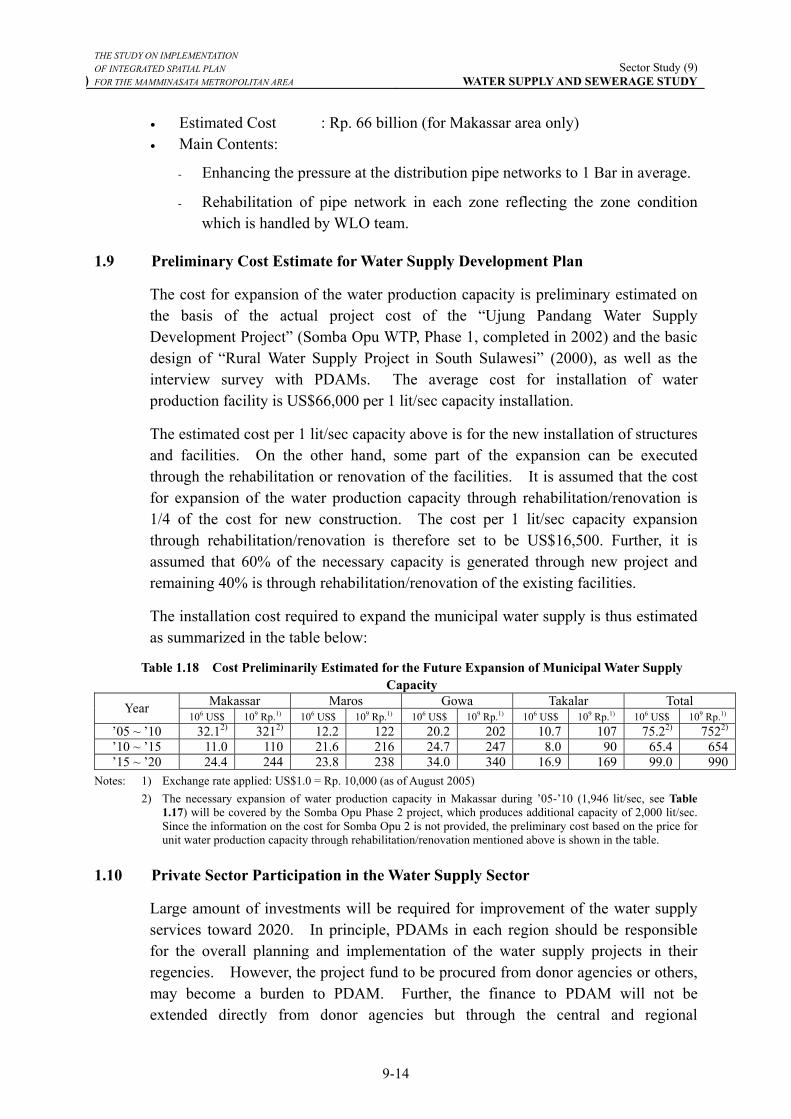
THE STUDY ON IMPLEMENTATION OF INTEGRATED SPATIAL PLAN
) FOR THE MAMMINASATA METROPOLITAN AREA Sector Study (9)
WATER SUPPLY AND SEWERAGE STUDY
9-14
• Estimated Cost : Rp. 66 billion (for Makassar area only) • Main Contents:
- Enhancing the pressure at the distribution pipe networks to 1 Bar in average.
- Rehabilitation of pipe network in each zone reflecting the zone condition which is handled by WLO team.
1.9 Preliminary Cost Estimate for Water Supply Development Plan
The cost for expansion of the water production capacity is preliminary estimated on the basis of the actual project cost of the “Ujung Pandang Water Supply Development Project” (Somba Opu WTP, Phase 1, completed in 2002) and the basic design of “Rural Water Supply Project in South Sulawesi” (2000), as well as the interview survey with PDAMs. The average cost for installation of water production facility is US$66,000 per 1 lit/sec capacity installation.
The estimated cost per 1 lit/sec capacity above is for the new installation of structures and facilities. On the other hand, some part of the expansion can be executed through the rehabilitation or renovation of the facilities. It is assumed that the cost for expansion of the water production capacity through rehabilitation/renovation is 1/4 of the cost for new construction. The cost per 1 lit/sec capacity expansion through rehabilitation/renovation is therefore set to be US$16,500. Further, it is assumed that 60% of the necessary capacity is generated through new project and remaining 40% is through rehabilitation/renovation of the existing facilities.
The installation cost required to expand the municipal water supply is thus estimated as summarized in the table below:
Table 1.18 Cost Preliminarily Estimated for the Future Expansion of Municipal Water Supply Capacity
Makassar Maros Gowa Takalar Total Year 106 US$ 109 Rp.1) 106 US$ 109 Rp.1) 106 US$ 109 Rp.1) 106 US$ 109 Rp.1) 106 US$ 109 Rp.1)
’05 ~ ’10 32.12) 3212) 12.2 122 20.2 202 10.7 107 75.22) 7522)
’10 ~ ’15 11.0 110 21.6 216 24.7 247 8.0 90 65.4 654’15 ~ ’20 24.4 244 23.8 238 34.0 340 16.9 169 99.0 990
Notes: 1) Exchange rate applied: US$1.0 = Rp. 10,000 (as of August 2005) 2) The necessary expansion of water production capacity in Makassar during ’05-’10 (1,946 lit/sec, see Table
1.17) will be covered by the Somba Opu Phase 2 project, which produces additional capacity of 2,000 lit/sec. Since the information on the cost for Somba Opu 2 is not provided, the preliminary cost based on the price for unit water production capacity through rehabilitation/renovation mentioned above is shown in the table.
1.10 Private Sector Participation in the Water Supply Sector
Large amount of investments will be required for improvement of the water supply services toward 2020. In principle, PDAMs in each region should be responsible for the overall planning and implementation of the water supply projects in their regencies. However, the project fund to be procured from donor agencies or others, may become a burden to PDAM. Further, the finance to PDAM will not be extended directly from donor agencies but through the central and regional
THE STUDY ON IMPLEMENTATION OF INTEGRATED SPATIAL PLAN
) FOR THE MAMMINASATA METROPOLITAN AREA Sector Study (9)
WATER SUPPLY AND SEWERAGE STUDY
9-15
governments at a high rate of interest than the rate agreed between the donor agencies and the central government.
Promotion of the private sector participation (PSP) is a conceivable solution for reduction of the burden on PDAM and the central/regional government, as well as for provision of attractive service to users. It also corresponds to the government policy to promote the private finance initiative. In general, introduction of the PSP system would resolve such PDAM problems as follows: - Insufficient water supply service, - Poor quality of supplied water, - Poor management of water supply system (leakage etc.), and - Lack of financial sources and financial burden.
In the water supply sector, in general, the PSP system will be categorized into the following types: - Service Contract: A function of the water supply system is partly entrusted to a
private company for a certain fixed period (e.g. collection of water fee, reduction of leakage etc.). The cost of this type is relatively low and the procedure is simple. However, there would be a possibility of political interference.
- Management Contract: Managerial authority of the water supply system is partly or totally transferred to a private company. Capital investment is not usually under the responsibilities of the private sector. This contract type is often adapted when it is difficult to privatize on an equity basis.
- Lease Contract: Facilities owned by the public sector is leased to a private company, and the company takes responsibility for management of the facility. However, capital investment is not usually included responsibility is limited to operation.
- Concession: Managerial authority of the water supply system is totally entrusted to a private company for a certain fixed period. Capital investment is also the responsibilities of the company. To secure efficient management of the system, incentives and penalty regulation are provided, and an independent regulating committee is established.
- Complete Privatization: A corporation owned by the public sector is transferred or sold totally to the private sector. The new owner (private sector) manages and operates the corporation with a license agreement under the public regulations.
- Build, Own, Operate, Transfer (BOOT): Project sponsor builds, owns, and operates new facilities. He sells water obtained through the facilities to the water department. At termination of contract, the facilities are transferred to the government. However, if the major problem is management of existing facilities, BOOT cannot be a good solution.
- Private-Public-Partnership: The public sector has a full partnership with the private sector, holding stock and sharing responsibilities.
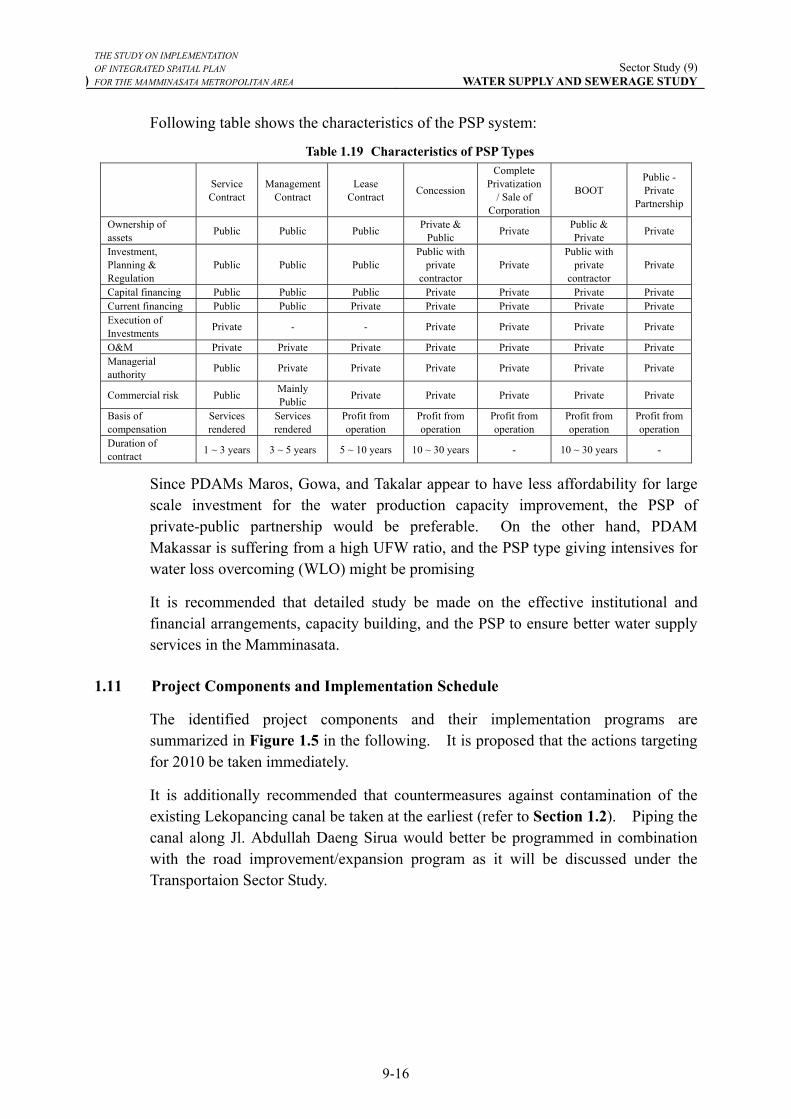
THE STUDY ON IMPLEMENTATION OF INTEGRATED SPATIAL PLAN
) FOR THE MAMMINASATA METROPOLITAN AREA Sector Study (9)
WATER SUPPLY AND SEWERAGE STUDY
9-16
Following table shows the characteristics of the PSP system:
Table 1.19 Characteristics of PSP Types
Service Contract
Management Contract
Lease Contract Concession
Complete Privatization
/ Sale of Corporation
BOOT Public - Private
Partnership
Ownership of assets Public Public Public Private &
Public Private Public & Private Private
Investment, Planning & Regulation
Public Public Public Public with
private contractor
Private Public with
private contractor
Private
Capital financing Public Public Public Private Private Private Private Current financing Public Public Private Private Private Private Private Execution of Investments Private - - Private Private Private Private
O&M Private Private Private Private Private Private Private Managerial authority Public Private Private Private Private Private Private
Commercial risk Public Mainly Public Private Private Private Private Private
Basis of compensation
Services rendered
Services rendered
Profit from operation
Profit from operation
Profit from operation
Profit from operation
Profit from operation
Duration of contract 1 ~ 3 years 3 ~ 5 years 5 ~ 10 years 10 ~ 30 years - 10 ~ 30 years -
Since PDAMs Maros, Gowa, and Takalar appear to have less affordability for large scale investment for the water production capacity improvement, the PSP of private-public partnership would be preferable. On the other hand, PDAM Makassar is suffering from a high UFW ratio, and the PSP type giving intensives for water loss overcoming (WLO) might be promising
It is recommended that detailed study be made on the effective institutional and financial arrangements, capacity building, and the PSP to ensure better water supply services in the Mamminasata.
1.11 Project Components and Implementation Schedule
The identified project components and their implementation programs are summarized in Figure 1.5 in the following. It is proposed that the actions targeting for 2010 be taken immediately.
It is additionally recommended that countermeasures against contamination of the existing Lekopancing canal be taken at the earliest (refer to Section 1.2). Piping the canal along Jl. Abdullah Daeng Sirua would better be programmed in combination with the road improvement/expansion program as it will be discussed under the Transportaion Sector Study.
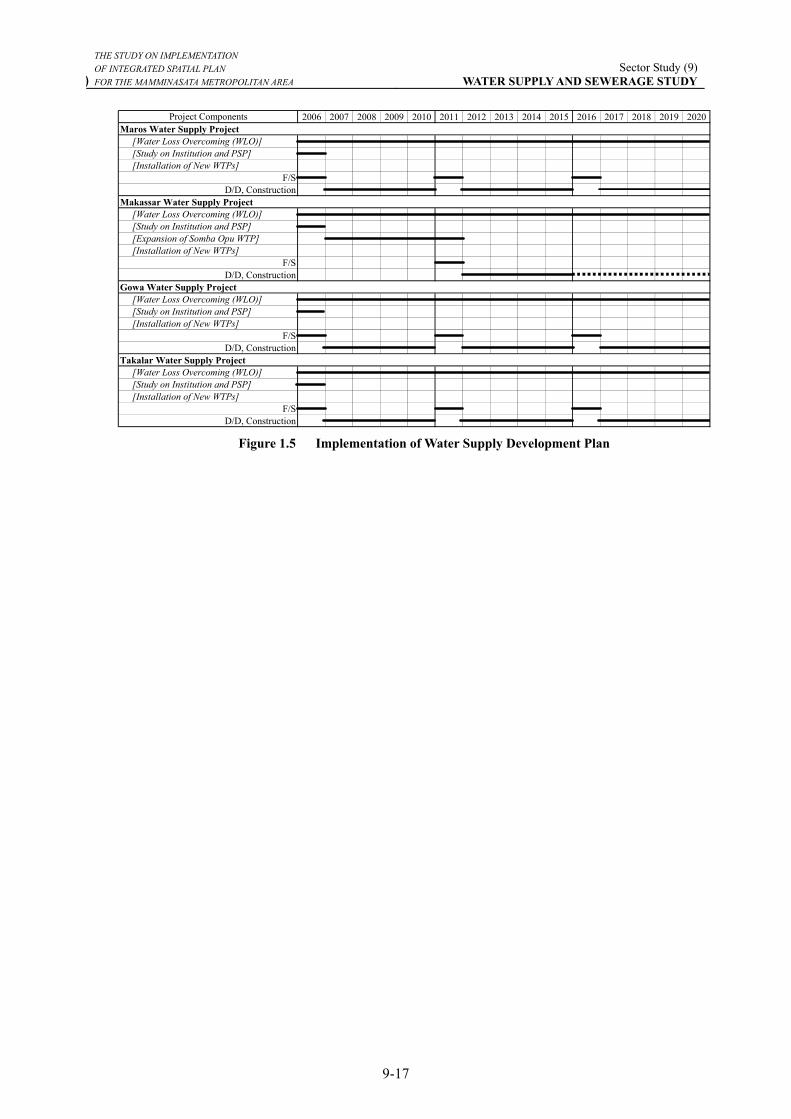
THE STUDY ON IMPLEMENTATION OF INTEGRATED SPATIAL PLAN
) FOR THE MAMMINASATA METROPOLITAN AREA Sector Study (9)
WATER SUPPLY AND SEWERAGE STUDY
9-17
2006 2007 2008 2009 2010 2011 2012 2013 2014 2015 2016 2017 2018 2019 2020Maros Water Supply Project
[Water Loss Overcoming (WLO)][Study on Institution and PSP][Installation of New WTPs]
F/SD/D, Construction
Makassar Water Supply Project[Water Loss Overcoming (WLO)][Study on Institution and PSP][Expansion of Somba Opu WTP][Installation of New WTPs]
F/SD/D, Construction
Gowa Water Supply Project[Water Loss Overcoming (WLO)][Study on Institution and PSP][Installation of New WTPs]
F/SD/D, Construction
Takalar Water Supply Project[Water Loss Overcoming (WLO)][Study on Institution and PSP][Installation of New WTPs]
F/SD/D, Construction
Project Components
Figure 1.5 Implementation of Water Supply Development Plan
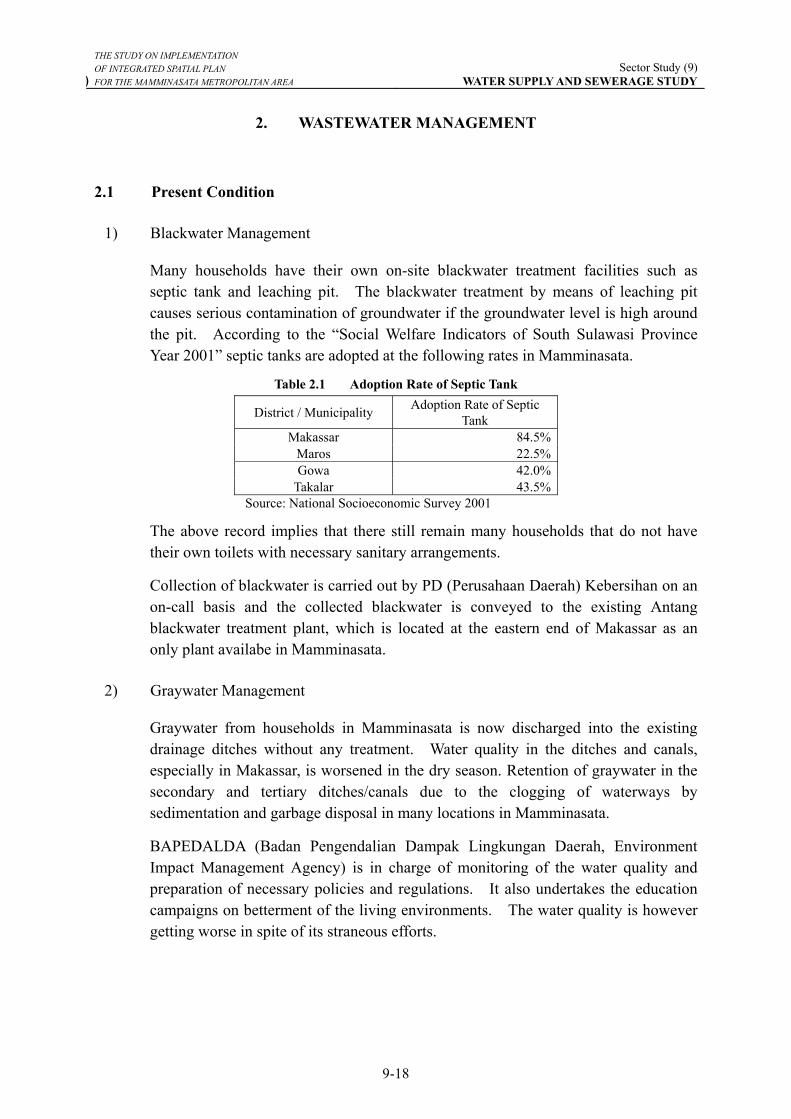
THE STUDY ON IMPLEMENTATION OF INTEGRATED SPATIAL PLAN
) FOR THE MAMMINASATA METROPOLITAN AREA Sector Study (9)
WATER SUPPLY AND SEWERAGE STUDY
9-18
2. WASTEWATER MANAGEMENT
2.1 Present Condition
1) Blackwater Management
Many households have their own on-site blackwater treatment facilities such as septic tank and leaching pit. The blackwater treatment by means of leaching pit causes serious contamination of groundwater if the groundwater level is high around the pit. According to the “Social Welfare Indicators of South Sulawasi Province Year 2001” septic tanks are adopted at the following rates in Mamminasata.
Table 2.1 Adoption Rate of Septic Tank
District / Municipality Adoption Rate of Septic Tank
Makassar 84.5%Maros 22.5%Gowa 42.0%
Takalar 43.5%Source: National Socioeconomic Survey 2001
The above record implies that there still remain many households that do not have their own toilets with necessary sanitary arrangements.
Collection of blackwater is carried out by PD (Perusahaan Daerah) Kebersihan on an on-call basis and the collected blackwater is conveyed to the existing Antang blackwater treatment plant, which is located at the eastern end of Makassar as an only plant availabe in Mamminasata.
2) Graywater Management
Graywater from households in Mamminasata is now discharged into the existing drainage ditches without any treatment. Water quality in the ditches and canals, especially in Makassar, is worsened in the dry season. Retention of graywater in the secondary and tertiary ditches/canals due to the clogging of waterways by sedimentation and garbage disposal in many locations in Mamminasata.
BAPEDALDA (Badan Pengendalian Dampak Lingkungan Daerah, Environment Impact Management Agency) is in charge of monitoring of the water quality and preparation of necessary policies and regulations. It also undertakes the education campaigns on betterment of the living environments. The water quality is however getting worse in spite of its straneous efforts.
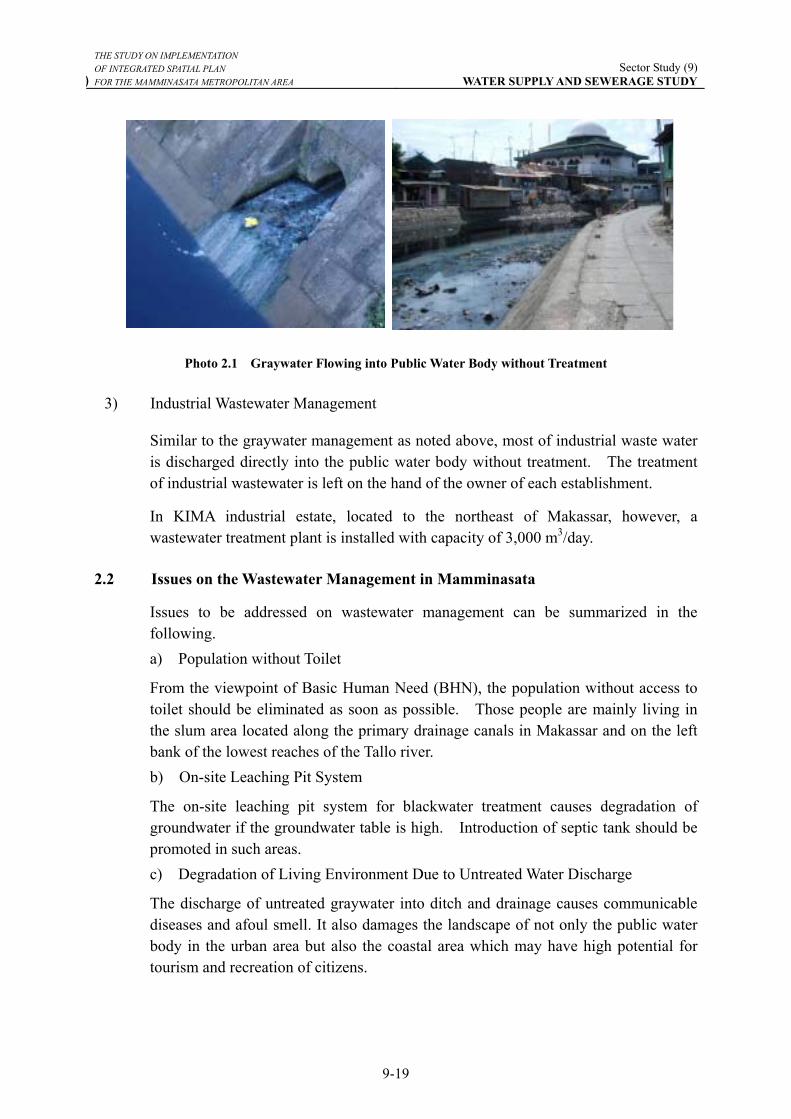
THE STUDY ON IMPLEMENTATION OF INTEGRATED SPATIAL PLAN
) FOR THE MAMMINASATA METROPOLITAN AREA Sector Study (9)
WATER SUPPLY AND SEWERAGE STUDY
9-19
Photo 2.1 Graywater Flowing into Public Water Body without Treatment
3) Industrial Wastewater Management
Similar to the graywater management as noted above, most of industrial waste water is discharged directly into the public water body without treatment. The treatment of industrial wastewater is left on the hand of the owner of each establishment.
In KIMA industrial estate, located to the northeast of Makassar, however, a wastewater treatment plant is installed with capacity of 3,000 m3/day.
2.2 Issues on the Wastewater Management in Mamminasata
Issues to be addressed on wastewater management can be summarized in the following. a) Population without Toilet
From the viewpoint of Basic Human Need (BHN), the population without access to toilet should be eliminated as soon as possible. Those people are mainly living in the slum area located along the primary drainage canals in Makassar and on the left bank of the lowest reaches of the Tallo river. b) On-site Leaching Pit System
The on-site leaching pit system for blackwater treatment causes degradation of groundwater if the groundwater table is high. Introduction of septic tank should be promoted in such areas. c) Degradation of Living Environment Due to Untreated Water Discharge
The discharge of untreated graywater into ditch and drainage causes communicable diseases and afoul smell. It also damages the landscape of not only the public water body in the urban area but also the coastal area which may have high potential for tourism and recreation of citizens.
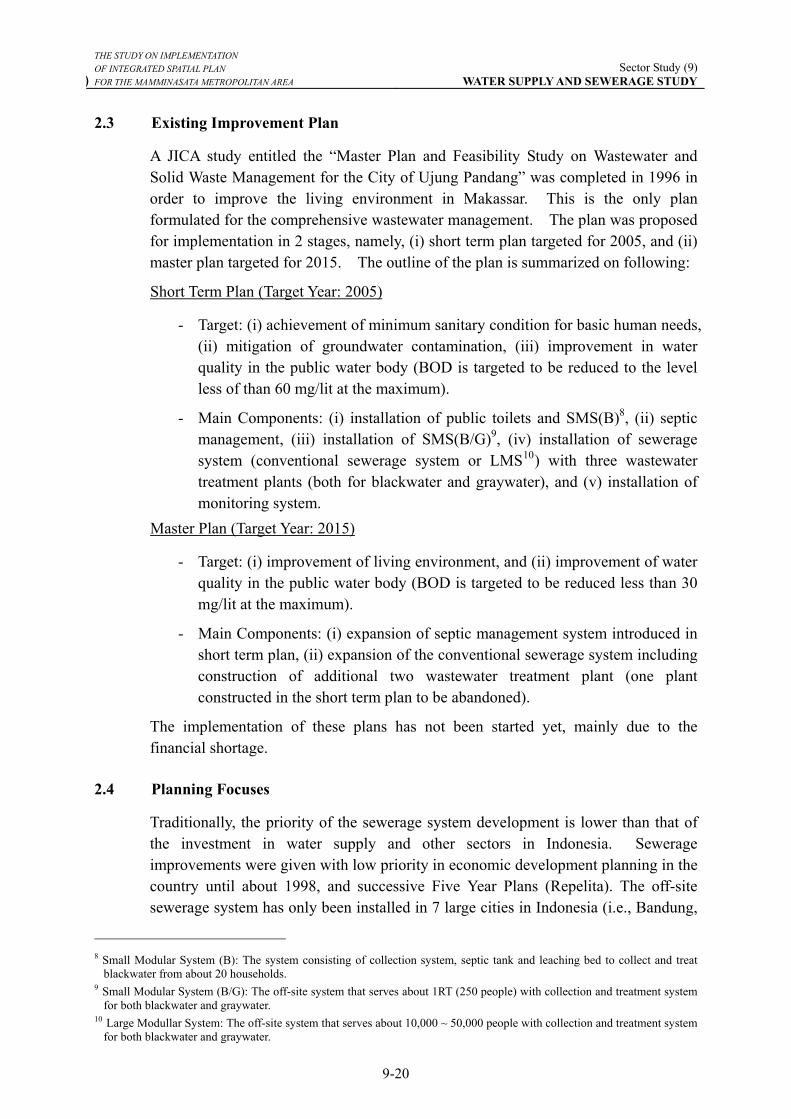
THE STUDY ON IMPLEMENTATION OF INTEGRATED SPATIAL PLAN
) FOR THE MAMMINASATA METROPOLITAN AREA Sector Study (9)
WATER SUPPLY AND SEWERAGE STUDY
9-20
2.3 Existing Improvement Plan
A JICA study entitled the “Master Plan and Feasibility Study on Wastewater and Solid Waste Management for the City of Ujung Pandang” was completed in 1996 in order to improve the living environment in Makassar. This is the only plan formulated for the comprehensive wastewater management. The plan was proposed for implementation in 2 stages, namely, (i) short term plan targeted for 2005, and (ii) master plan targeted for 2015. The outline of the plan is summarized on following:
Short Term Plan (Target Year: 2005)
- Target: (i) achievement of minimum sanitary condition for basic human needs, (ii) mitigation of groundwater contamination, (iii) improvement in water quality in the public water body (BOD is targeted to be reduced to the level less of than 60 mg/lit at the maximum).
- Main Components: (i) installation of public toilets and SMS(B)8, (ii) septic management, (iii) installation of SMS(B/G)9, (iv) installation of sewerage system (conventional sewerage system or LMS10) with three wastewater treatment plants (both for blackwater and graywater), and (v) installation of monitoring system.
Master Plan (Target Year: 2015)
- Target: (i) improvement of living environment, and (ii) improvement of water quality in the public water body (BOD is targeted to be reduced less than 30 mg/lit at the maximum).
- Main Components: (i) expansion of septic management system introduced in short term plan, (ii) expansion of the conventional sewerage system including construction of additional two wastewater treatment plant (one plant constructed in the short term plan to be abandoned).
The implementation of these plans has not been started yet, mainly due to the financial shortage.
2.4 Planning Focuses
Traditionally, the priority of the sewerage system development is lower than that of the investment in water supply and other sectors in Indonesia. Sewerage improvements were given with low priority in economic development planning in the country until about 1998, and successive Five Year Plans (Repelita). The off-site sewerage system has only been installed in 7 large cities in Indonesia (i.e., Bandung,
8 Small Modular System (B): The system consisting of collection system, septic tank and leaching bed to collect and treat
blackwater from about 20 households. 9 Small Modular System (B/G): The off-site system that serves about 1RT (250 people) with collection and treatment system
for both blackwater and graywater. 10 Large Modullar System: The off-site system that serves about 10,000 ~ 50,000 people with collection and treatment system
for both blackwater and graywater.
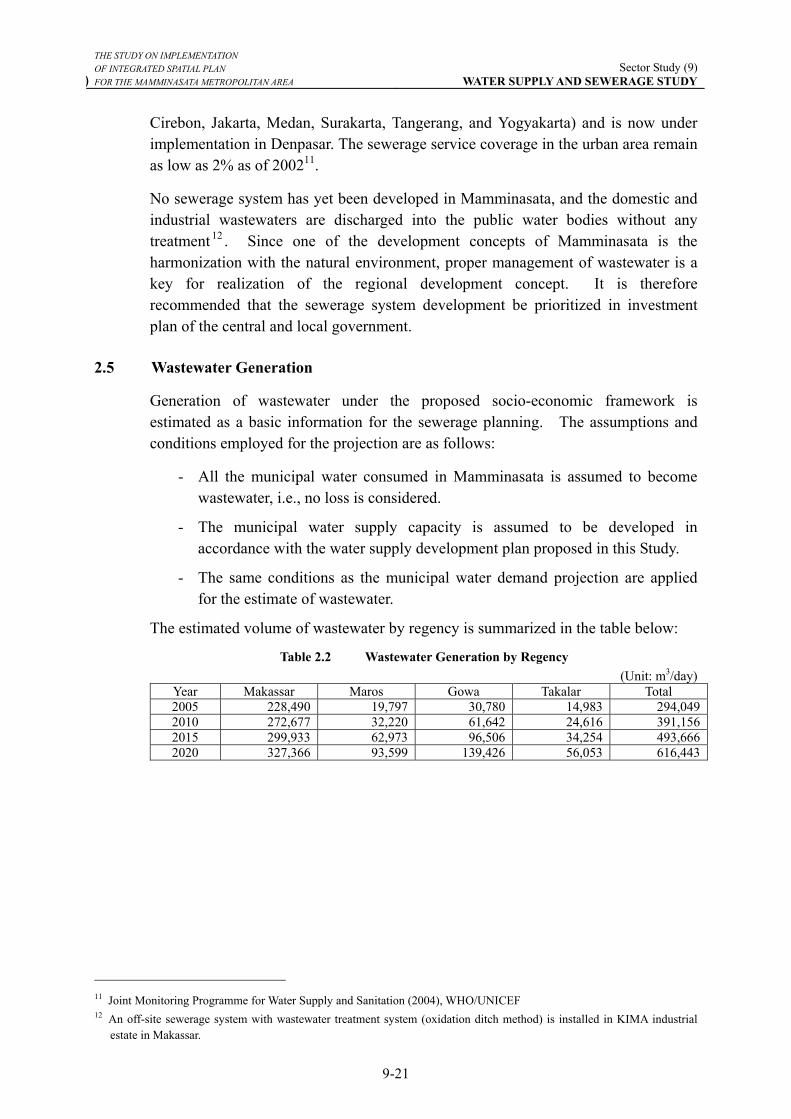
THE STUDY ON IMPLEMENTATION OF INTEGRATED SPATIAL PLAN
) FOR THE MAMMINASATA METROPOLITAN AREA Sector Study (9)
WATER SUPPLY AND SEWERAGE STUDY
9-21
Cirebon, Jakarta, Medan, Surakarta, Tangerang, and Yogyakarta) and is now under implementation in Denpasar. The sewerage service coverage in the urban area remain as low as 2% as of 200211.
No sewerage system has yet been developed in Mamminasata, and the domestic and industrial wastewaters are discharged into the public water bodies without any treatment 12 . Since one of the development concepts of Mamminasata is the harmonization with the natural environment, proper management of wastewater is a key for realization of the regional development concept. It is therefore recommended that the sewerage system development be prioritized in investment plan of the central and local government.
2.5 Wastewater Generation
Generation of wastewater under the proposed socio-economic framework is estimated as a basic information for the sewerage planning. The assumptions and conditions employed for the projection are as follows:
- All the municipal water consumed in Mamminasata is assumed to become wastewater, i.e., no loss is considered.
- The municipal water supply capacity is assumed to be developed in accordance with the water supply development plan proposed in this Study.
- The same conditions as the municipal water demand projection are applied for the estimate of wastewater.
The estimated volume of wastewater by regency is summarized in the table below:
Table 2.2 Wastewater Generation by Regency (Unit: m3/day)
Year Makassar Maros Gowa Takalar Total 2005 228,490 19,797 30,780 14,983 294,0492010 272,677 32,220 61,642 24,616 391,1562015 299,933 62,973 96,506 34,254 493,6662020 327,366 93,599 139,426 56,053 616,443
11 Joint Monitoring Programme for Water Supply and Sanitation (2004), WHO/UNICEF 12 An off-site sewerage system with wastewater treatment system (oxidation ditch method) is installed in KIMA industrial
estate in Makassar.
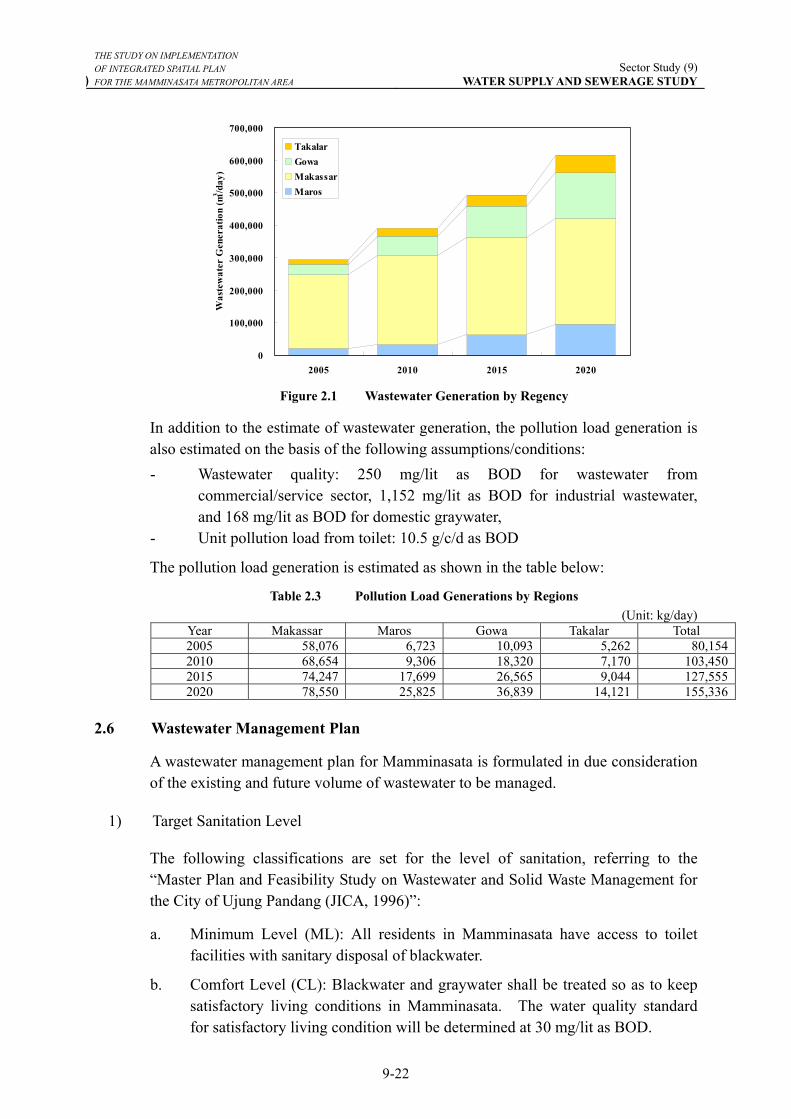
THE STUDY ON IMPLEMENTATION OF INTEGRATED SPATIAL PLAN
) FOR THE MAMMINASATA METROPOLITAN AREA Sector Study (9)
WATER SUPPLY AND SEWERAGE STUDY
9-22
0
100,000
200,000
300,000
400,000
500,000
600,000
700,000
2005 2010 2015 2020
Was
tew
ater
Gen
erat
ion
(m3 /d
ay)
TakalarGowaMakassarMaros
Figure 2.1 Wastewater Generation by Regency
In addition to the estimate of wastewater generation, the pollution load generation is also estimated on the basis of the following assumptions/conditions: - Wastewater quality: 250 mg/lit as BOD for wastewater from
commercial/service sector, 1,152 mg/lit as BOD for industrial wastewater, and 168 mg/lit as BOD for domestic graywater,
- Unit pollution load from toilet: 10.5 g/c/d as BOD
The pollution load generation is estimated as shown in the table below:
Table 2.3 Pollution Load Generations by Regions (Unit: kg/day)
Year Makassar Maros Gowa Takalar Total 2005 58,076 6,723 10,093 5,262 80,1542010 68,654 9,306 18,320 7,170 103,4502015 74,247 17,699 26,565 9,044 127,5552020 78,550 25,825 36,839 14,121 155,336
2.6 Wastewater Management Plan
A wastewater management plan for Mamminasata is formulated in due consideration of the existing and future volume of wastewater to be managed.
1) Target Sanitation Level
The following classifications are set for the level of sanitation, referring to the “Master Plan and Feasibility Study on Wastewater and Solid Waste Management for the City of Ujung Pandang (JICA, 1996)”:
a. Minimum Level (ML): All residents in Mamminasata have access to toilet facilities with sanitary disposal of blackwater.
b. Comfort Level (CL): Blackwater and graywater shall be treated so as to keep satisfactory living conditions in Mamminasata. The water quality standard for satisfactory living condition will be determined at 30 mg/lit as BOD.
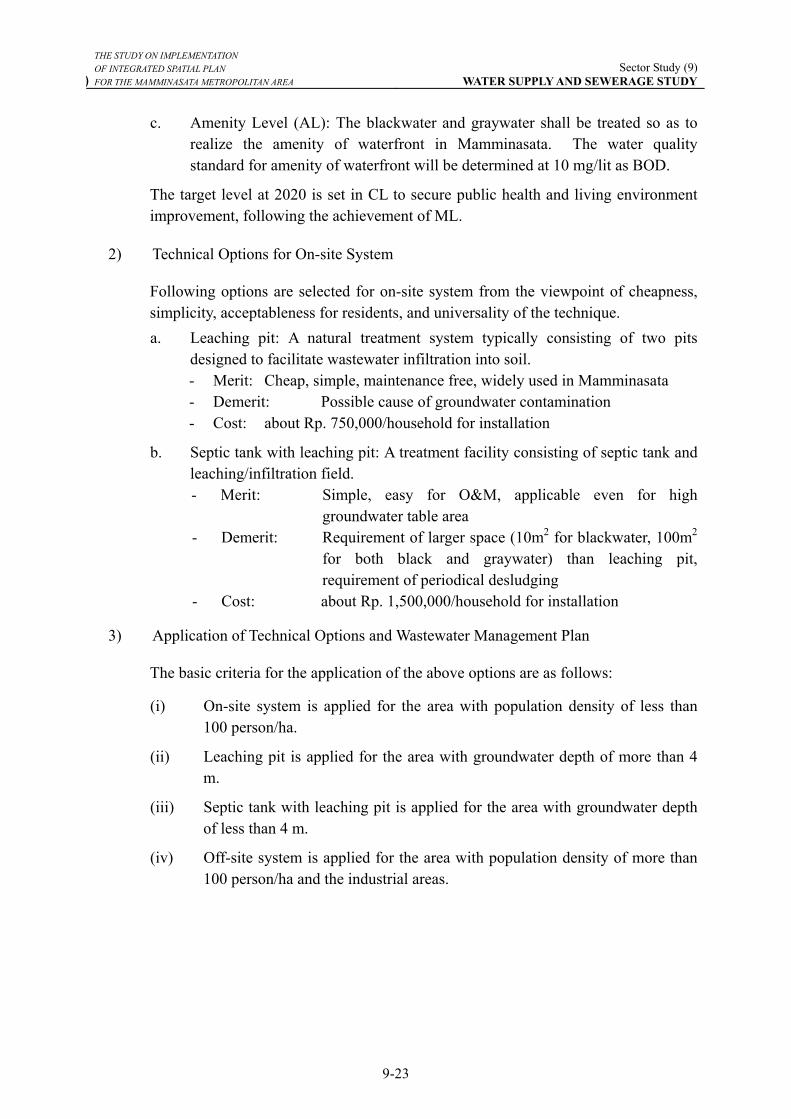
THE STUDY ON IMPLEMENTATION OF INTEGRATED SPATIAL PLAN
) FOR THE MAMMINASATA METROPOLITAN AREA Sector Study (9)
WATER SUPPLY AND SEWERAGE STUDY
9-23
c. Amenity Level (AL): The blackwater and graywater shall be treated so as to realize the amenity of waterfront in Mamminasata. The water quality standard for amenity of waterfront will be determined at 10 mg/lit as BOD.
The target level at 2020 is set in CL to secure public health and living environment improvement, following the achievement of ML.
2) Technical Options for On-site System
Following options are selected for on-site system from the viewpoint of cheapness, simplicity, acceptableness for residents, and universality of the technique. a. Leaching pit: A natural treatment system typically consisting of two pits
designed to facilitate wastewater infiltration into soil. - Merit: Cheap, simple, maintenance free, widely used in Mamminasata - Demerit: Possible cause of groundwater contamination - Cost: about Rp. 750,000/household for installation
b. Septic tank with leaching pit: A treatment facility consisting of septic tank and leaching/infiltration field. - Merit: Simple, easy for O&M, applicable even for high
groundwater table area - Demerit: Requirement of larger space (10m2 for blackwater, 100m2
for both black and graywater) than leaching pit, requirement of periodical desludging
- Cost: about Rp. 1,500,000/household for installation
3) Application of Technical Options and Wastewater Management Plan
The basic criteria for the application of the above options are as follows:
(i) On-site system is applied for the area with population density of less than 100 person/ha.
(ii) Leaching pit is applied for the area with groundwater depth of more than 4 m.
(iii) Septic tank with leaching pit is applied for the area with groundwater depth of less than 4 m.
(iv) Off-site system is applied for the area with population density of more than 100 person/ha and the industrial areas.
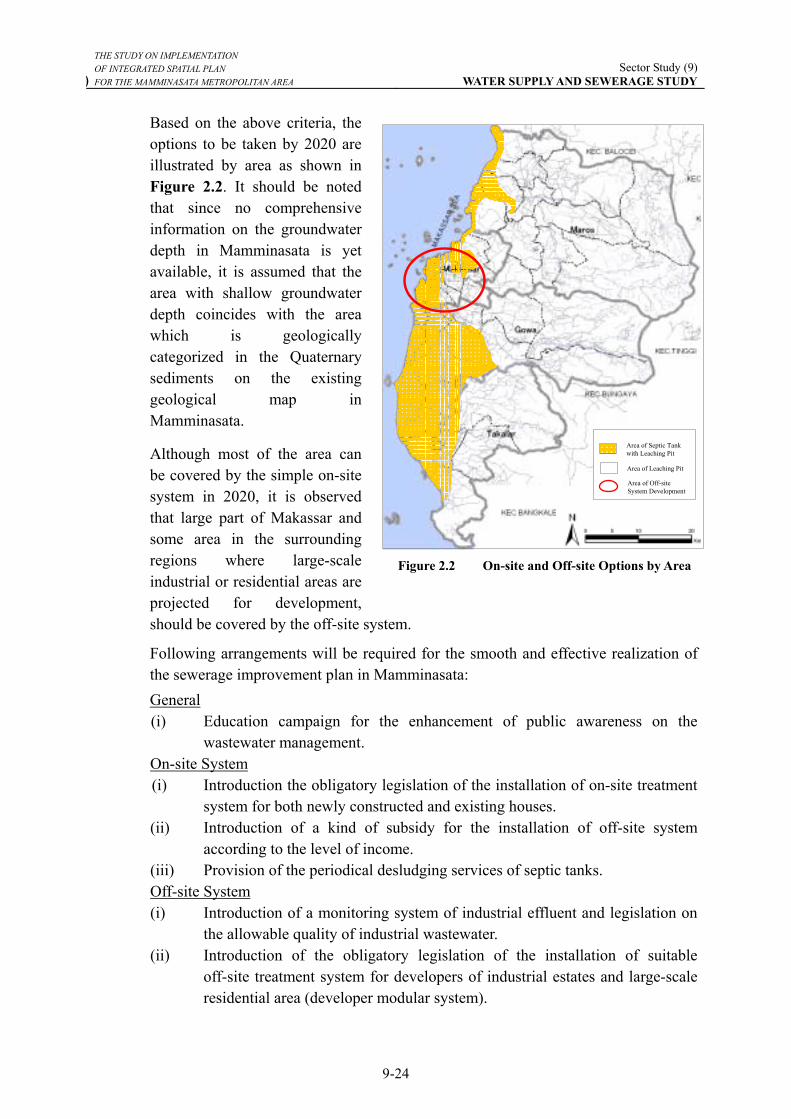
THE STUDY ON IMPLEMENTATION OF INTEGRATED SPATIAL PLAN
) FOR THE MAMMINASATA METROPOLITAN AREA Sector Study (9)
WATER SUPPLY AND SEWERAGE STUDY
9-24
Based on the above criteria, the options to be taken by 2020 are illustrated by area as shown in Figure 2.2. It should be noted that since no comprehensive information on the groundwater depth in Mamminasata is yet available, it is assumed that the area with shallow groundwater depth coincides with the area which is geologically categorized in the Quaternary sediments on the existing geological map in Mamminasata.
Although most of the area can be covered by the simple on-site system in 2020, it is observed that large part of Makassar and some area in the surrounding regions where large-scale industrial or residential areas are projected for development, should be covered by the off-site system.
Following arrangements will be required for the smooth and effective realization of the sewerage improvement plan in Mamminasata: General (i) Education campaign for the enhancement of public awareness on the
wastewater management. On-site System (i) Introduction the obligatory legislation of the installation of on-site treatment
system for both newly constructed and existing houses. (ii) Introduction of a kind of subsidy for the installation of off-site system
according to the level of income. (iii) Provision of the periodical desludging services of septic tanks. Off-site System (i) Introduction of a monitoring system of industrial effluent and legislation on
the allowable quality of industrial wastewater. (ii) Introduction of the obligatory legislation of the installation of suitable
off-site treatment system for developers of industrial estates and large-scale residential area (developer modular system).
Area of Septic Tankwith Leaching Pit
Area of Leaching Pit
Area of Off-siteSystem Development
Figure 2.2 On-site and Off-site Options by Area
THE STUDY ON IMPLEMENTATION OF INTEGRATED SPATIAL PLAN
) FOR THE MAMMINASATA METROPOLITAN AREA Sector Study (9)
WATER SUPPLY AND SEWERAGE STUDY
9-25
4) Estimated Cost of Off-site Sewerage System Development
The cost of off-site sewerage system is preliminary estimated by referring to the result of 1996 JICA Study. The cost (direct construction cost and total project cost) is depended on the service area (ha) and served population (persons). The generated partial regression formulas are as follows:
)543.4549235.0106.31(61.3 −+×= PADCC )251.2495272.0549.34(61.3 −+×= PATPC
Where, DCC: Direct Construction Cost (million Rp. in 2005 price level) TPC: Total Project Cost (million Rp. in 2005 price level) A: Service Area (ha) P: Served Population (persons)
On-going sewerage system development in Denpasar has been planned to cover 1,750 ha and serve for 150,000 people. Total project cost of the project is estimated to be about US$35 million (equivalent to Rp. 350,000 million). In this case, the total cost estimated under the above formulae becomes about Rp. 356,700 million. It is judged that the formulae is acceptable for the use of preliminary cost estimate of off-site sewerage system development.
The cost of installation of off-site system may be remarkably reduced in case that the construction is undertaken in parallel with the preparation of other infrastructures for newly developed industrial or residential areas.
2.7 Wastewater Management Plan for Makassar
It is obvious that the sanitary conditions in Makassar have already been aggravated. The necessity of immediate action for improvement of the water environment in the municipality is often raised at workshops with stakeholders. Major obstacles to the implementation of the previously implemented plan are (i) fund shortage, and (ii) low awareness of the people on the importance of the proper water environment.
In the 1996 JICA Study, an off-site sewerage system development plan was proposed for implementation in phases, i.e., short-term (2005) and long term (2015). The layout of the facilities for both short- and long-term plans are shown in Figures 2.3 and 2.4, respectively.
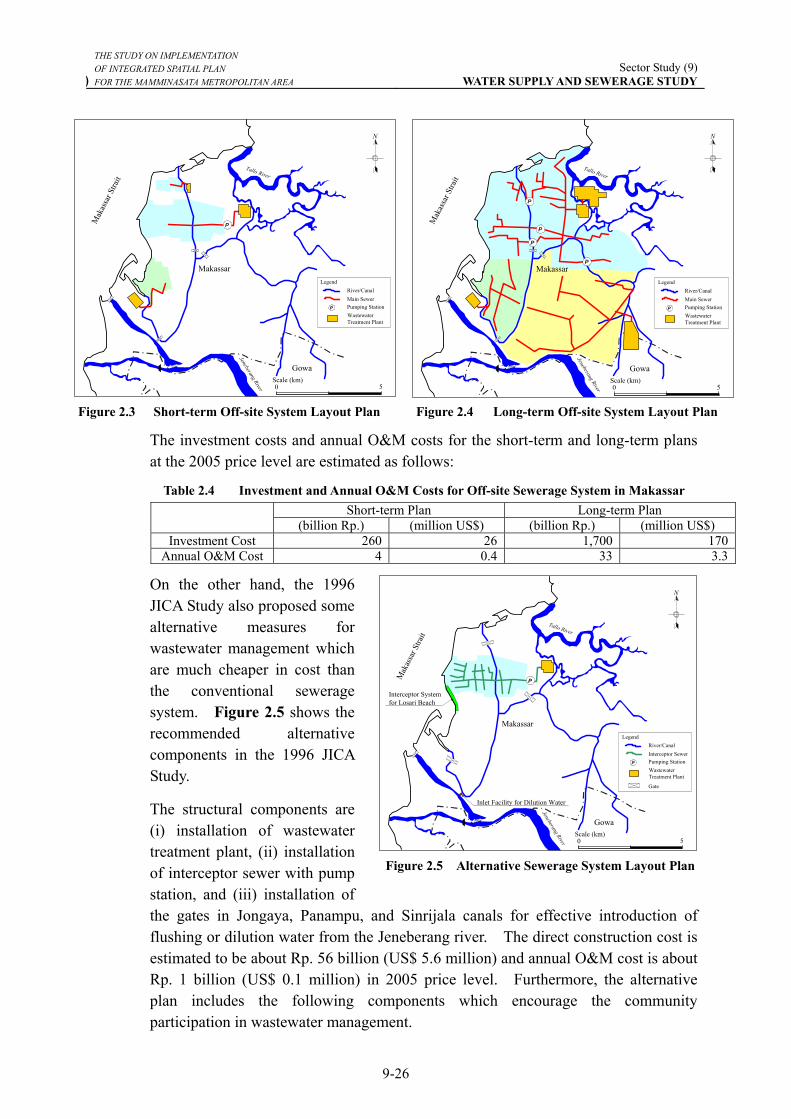
THE STUDY ON IMPLEMENTATION OF INTEGRATED SPATIAL PLAN
) FOR THE MAMMINASATA METROPOLITAN AREA Sector Study (9)
WATER SUPPLY AND SEWERAGE STUDY
9-26
N
Scale (km)0 5
Jeneberang River
Tallo River
Mak
assa
r Stra
it
Makassar
Gowa
P
River/CanalMain SewerPumping StationWastewaterTreatment Plant
Legend
P
N
Scale (km)0 5
Jeneberang River
Tallo River
Mak
assa
r Stra
it
Makassar
Gowa
P
River/CanalMain SewerPumping StationWastewaterTreatment Plant
Legend
P
P
P
P
Figure 2.3 Short-term Off-site System Layout Plan Figure 2.4 Long-term Off-site System Layout Plan
The investment costs and annual O&M costs for the short-term and long-term plans at the 2005 price level are estimated as follows:
Table 2.4 Investment and Annual O&M Costs for Off-site Sewerage System in Makassar Short-term Plan Long-term Plan
(billion Rp.) (million US$) (billion Rp.) (million US$) Investment Cost 260 26 1,700 170
Annual O&M Cost 4 0.4 33 3.3
On the other hand, the 1996 JICA Study also proposed some alternative measures for wastewater management which are much cheaper in cost than the conventional sewerage system. Figure 2.5 shows the recommended alternative components in the 1996 JICA Study.
The structural components are (i) installation of wastewater treatment plant, (ii) installation of interceptor sewer with pump station, and (iii) installation of the gates in Jongaya, Panampu, and Sinrijala canals for effective introduction of flushing or dilution water from the Jeneberang river. The direct construction cost is estimated to be about Rp. 56 billion (US$ 5.6 million) and annual O&M cost is about Rp. 1 billion (US$ 0.1 million) in 2005 price level. Furthermore, the alternative plan includes the following components which encourage the community participation in wastewater management.
N
Scale (km)0 5
Jeneberang River
Tallo River
Mak
assa
r Stra
it
Makassar
Gowa
P
River/CanalInterceptor SewerPumping StationWastewaterTreatment Plant
Legend
P
Gate
Inlet Facility for Dilution Water
Interceptor Systemfor Losari Beach
Figure 2.5 Alternative Sewerage System Layout Plan
THE STUDY ON IMPLEMENTATION OF INTEGRATED SPATIAL PLAN
) FOR THE MAMMINASATA METROPOLITAN AREA Sector Study (9)
WATER SUPPLY AND SEWERAGE STUDY
9-27
Cleansing of ditches and drains (i) Periodical cleansing of ditches and drains with active community
participation on a volunteer basis. (ii) Cleansing of major drains and canals (rivers) need to be carried out by Dinas
Kebersihan. Provision of improvement of ditches and drains (i) The basic improvement and/or repair of ditches/drains will be carried out on
a community basis. (ii) Proper technical guidance concerning the alignment and base elevation of a
ditch will be provided by the public sector. Installation of screens in ditches and drains (i) Screens for trapping coarse material are installed in ditches and drains. (ii) Regular removal of trapped debris is amendable to community participation. (iii) Responsibility of proper maintenance of a screen could be shared equally
among the houses (10 ~ 15) in the neighborhood.
The essential solution of the wastewater problems in Makassar may be the installation of conventional (ordinary) sewerage system. However, in view of the facts that a large instrument is necessary for installation of the conventional sewerage system, and for the public awareness/understanding is still insufficient for recovery of annual O&M cost, it may be practical that the alternative components be implemented first. The public awareness is expected to enhance through the community participation and upgrade the interceptor sewer to the ordinary sewer.
It is recommended that a detailed comparative study be made on the short-term plan (Figure 2.4) and alternative plan (Figure 2.5), and that the optimum option is implemented sooner.
2.8 Project Components and Implementation Schedule
The identified projects are:
(i) Maros Wastewater Management Project,
(ii) Makassar Wastewater Management Project,
(iii) Gowa Wastewater Management Project, and
(iv) Takalar Wastewater Management Project.
The wastewater management projects for Maros, Gowa and Takalar are mainly formed by the following: (i) Community based activities: cleansing of ditch/drain, provision of
improvement of ditch/drain, and installation of screens in ditch/drain. (ii) Law enforcement: introduction of developer modular system, and promotion
of septic tank with leaching pit for the area with high groundwater table (shallow groundwater depth)
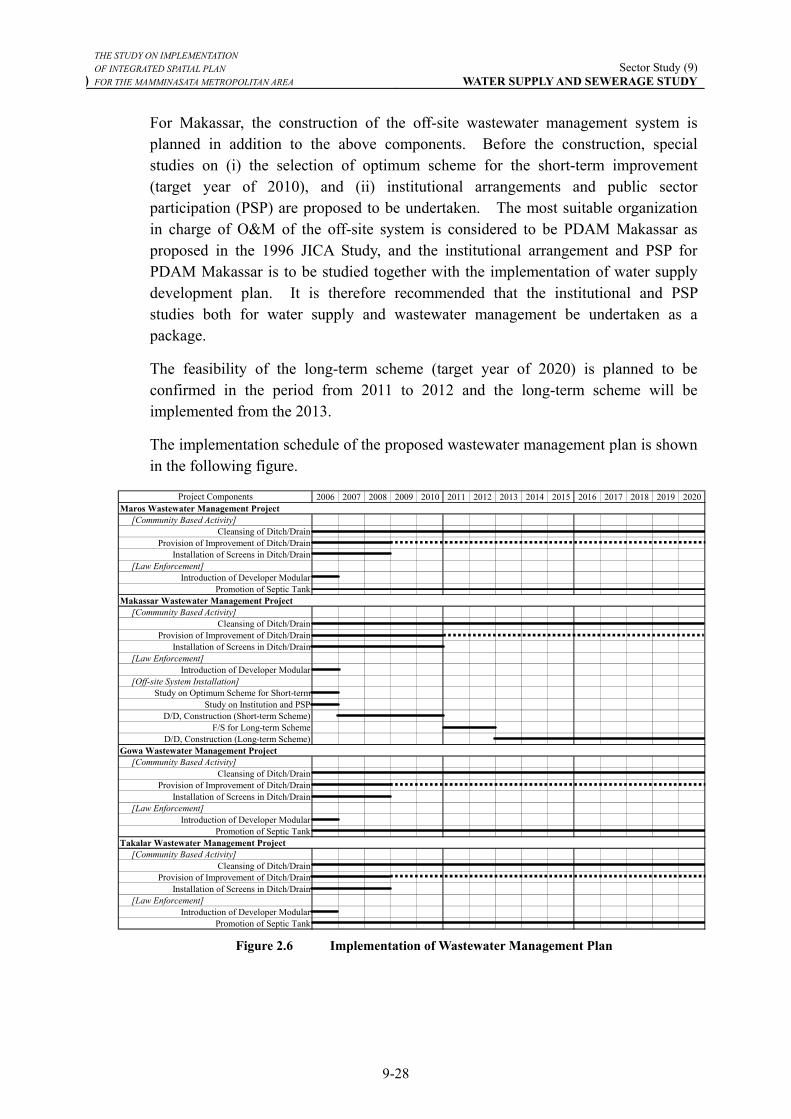
THE STUDY ON IMPLEMENTATION OF INTEGRATED SPATIAL PLAN
) FOR THE MAMMINASATA METROPOLITAN AREA Sector Study (9)
WATER SUPPLY AND SEWERAGE STUDY
9-28
For Makassar, the construction of the off-site wastewater management system is planned in addition to the above components. Before the construction, special studies on (i) the selection of optimum scheme for the short-term improvement (target year of 2010), and (ii) institutional arrangements and public sector participation (PSP) are proposed to be undertaken. The most suitable organization in charge of O&M of the off-site system is considered to be PDAM Makassar as proposed in the 1996 JICA Study, and the institutional arrangement and PSP for PDAM Makassar is to be studied together with the implementation of water supply development plan. It is therefore recommended that the institutional and PSP studies both for water supply and wastewater management be undertaken as a package.
The feasibility of the long-term scheme (target year of 2020) is planned to be confirmed in the period from 2011 to 2012 and the long-term scheme will be implemented from the 2013.
The implementation schedule of the proposed wastewater management plan is shown in the following figure.
2006 2007 2008 2009 2010 2011 2012 2013 2014 2015 2016 2017 2018 2019 2020Maros Wastewater Management Project
[Community Based Activity]Cleansing of Ditch/Drain
Provision of Improvement of Ditch/DrainInstallation of Screens in Ditch/Drain
[Law Enforcement]Introduction of Developer Modular
Promotion of Septic TankMakassar Wastewater Management Project
[Community Based Activity]Cleansing of Ditch/Drain
Provision of Improvement of Ditch/DrainInstallation of Screens in Ditch/Drain
[Law Enforcement]Introduction of Developer Modular
[Off-site System Installation]Study on Optimum Scheme for Short-term
Study on Institution and PSPD/D, Construction (Short-term Scheme)
F/S for Long-term SchemeD/D, Construction (Long-term Scheme)
Gowa Wastewater Management Project[Community Based Activity]
Cleansing of Ditch/DrainProvision of Improvement of Ditch/Drain
Installation of Screens in Ditch/Drain[Law Enforcement]
Introduction of Developer ModularPromotion of Septic Tank
Takalar Wastewater Management Project[Community Based Activity]
Cleansing of Ditch/DrainProvision of Improvement of Ditch/Drain
Installation of Screens in Ditch/Drain[Law Enforcement]
Introduction of Developer ModularPromotion of Septic Tank
Project Components
Figure 2.6 Implementation of Wastewater Management Plan