Embed Size (px)
Citation preview

Section 8.2-1Copyright © 2014, 2012, 2010 Pearson Education, Inc.
Lecture Slides
Elementary Statistics Twelfth Edition
and the Triola Statistics Series
by Mario F. Triola
Section 8.2-2Copyright © 2014, 2012, 2010 Pearson Education, Inc.
Chapter 8Hypothesis Testing
8-1 Review and Preview
8-2 Basics of Hypothesis Testing
8-3 Testing a Claim about a Proportion
8-4 Testing a Claim About a Mean
8-5 Testing a Claim About a Standard Deviation or Variance
Section 8.2-3Copyright © 2014, 2012, 2010 Pearson Education, Inc.
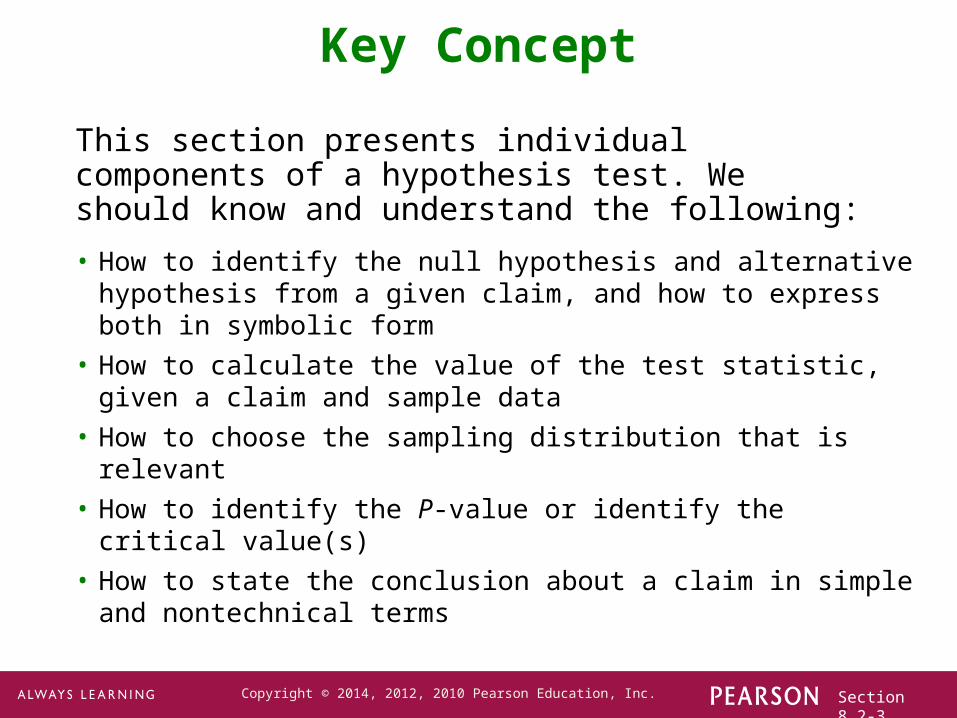
Key Concept
This section presents individual components of a hypothesis test. We should know and understand the following:
• How to identify the null hypothesis and alternative hypothesis from a given claim, and how to express both in symbolic form
• How to calculate the value of the test statistic, given a claim and sample data
• How to choose the sampling distribution that is relevant
• How to identify the P-value or identify the critical value(s)
• How to state the conclusion about a claim in simple and nontechnical terms
Section 8.2-4Copyright © 2014, 2012, 2010 Pearson Education, Inc.
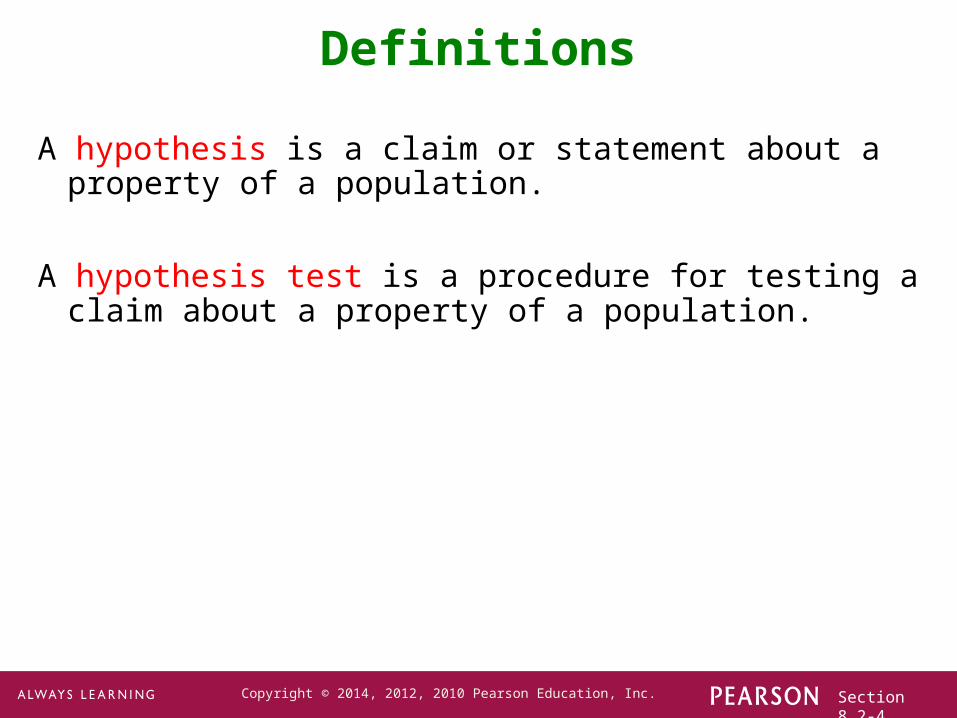
Definitions
A hypothesis is a claim or statement about a property of a population.
A hypothesis test is a procedure for testing a claim about a property of a population.
Section 8.2-5Copyright © 2014, 2012, 2010 Pearson Education, Inc.
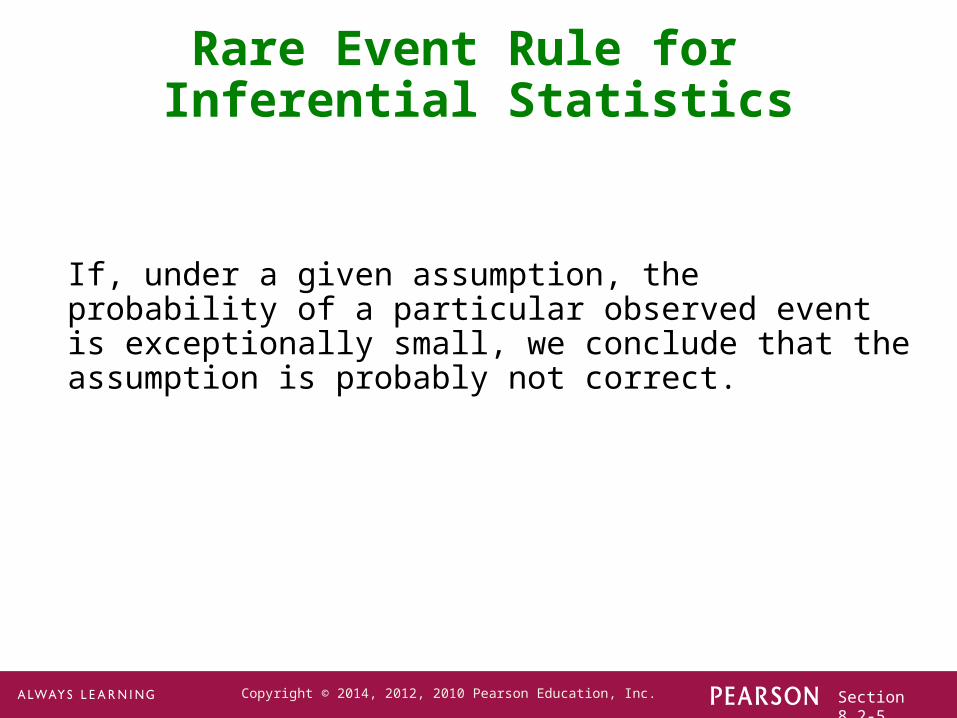
Rare Event Rule for Inferential Statistics
If, under a given assumption, the probability of a particular observed event is exceptionally small, we conclude that the assumption is probably not correct.
Section 8.2-6Copyright © 2014, 2012, 2010 Pearson Education, Inc.
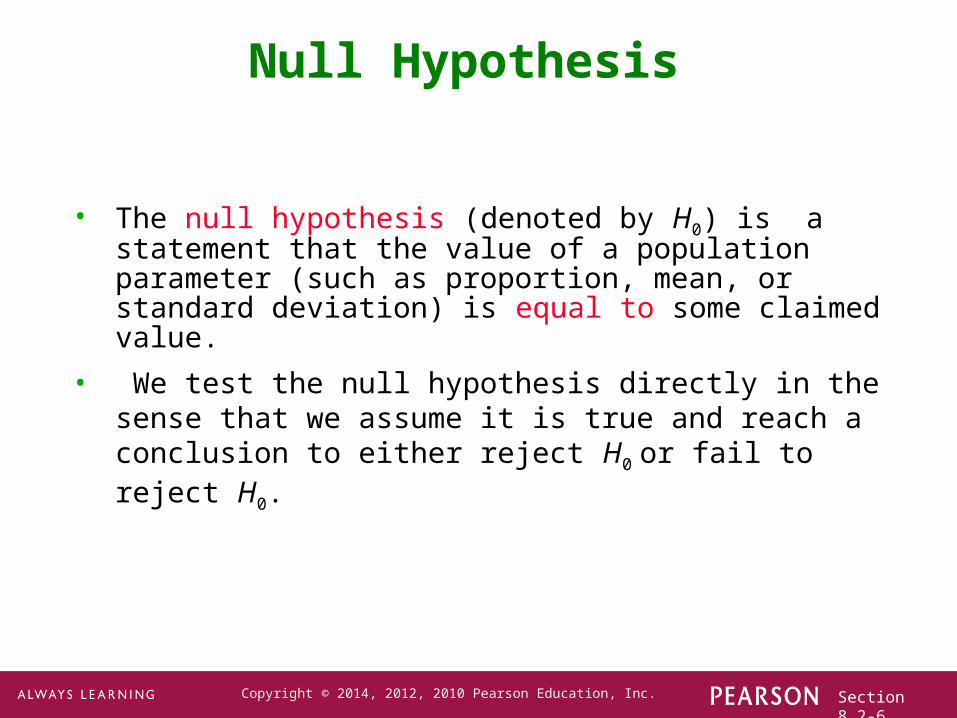
Null Hypothesis
• The null hypothesis (denoted by H0) is a statement that the value of a population parameter (such as proportion, mean, or standard deviation) is equal to some claimed value.
• We test the null hypothesis directly in the sense that we assume it is true and reach a conclusion to either reject H0 or fail to reject H0.
Section 8.2-7Copyright © 2014, 2012, 2010 Pearson Education, Inc.
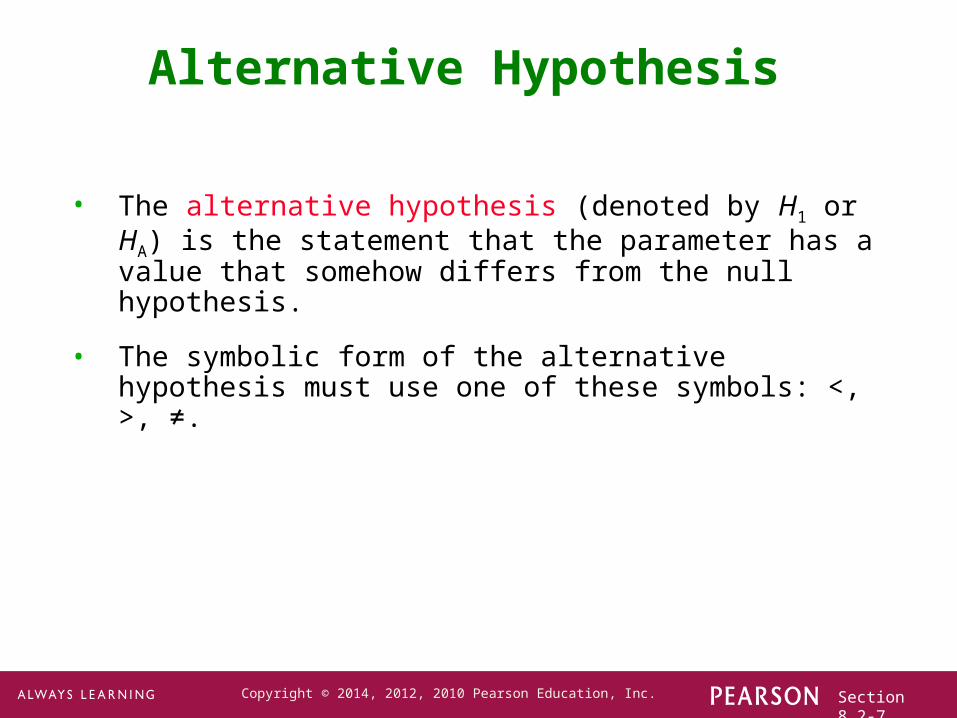
Alternative Hypothesis
• The alternative hypothesis (denoted by H1 or HA) is the statement that the parameter has a value that somehow differs from the null hypothesis.
• The symbolic form of the alternative hypothesis must use one of these symbols: <, >, ≠.
Section 8.2-8Copyright © 2014, 2012, 2010 Pearson Education, Inc.
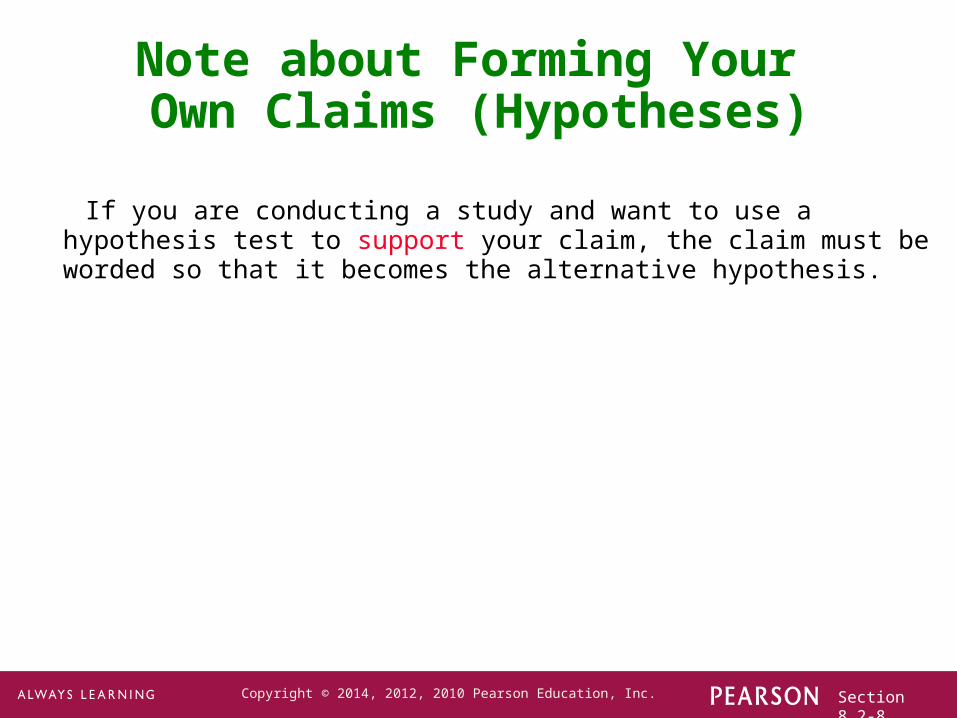
Note about Forming Your Own Claims (Hypotheses)
If you are conducting a study and want to use a hypothesis test to support your claim, the claim must be worded so that it becomes the alternative hypothesis.
Section 8.2-9Copyright © 2014, 2012, 2010 Pearson Education, Inc.
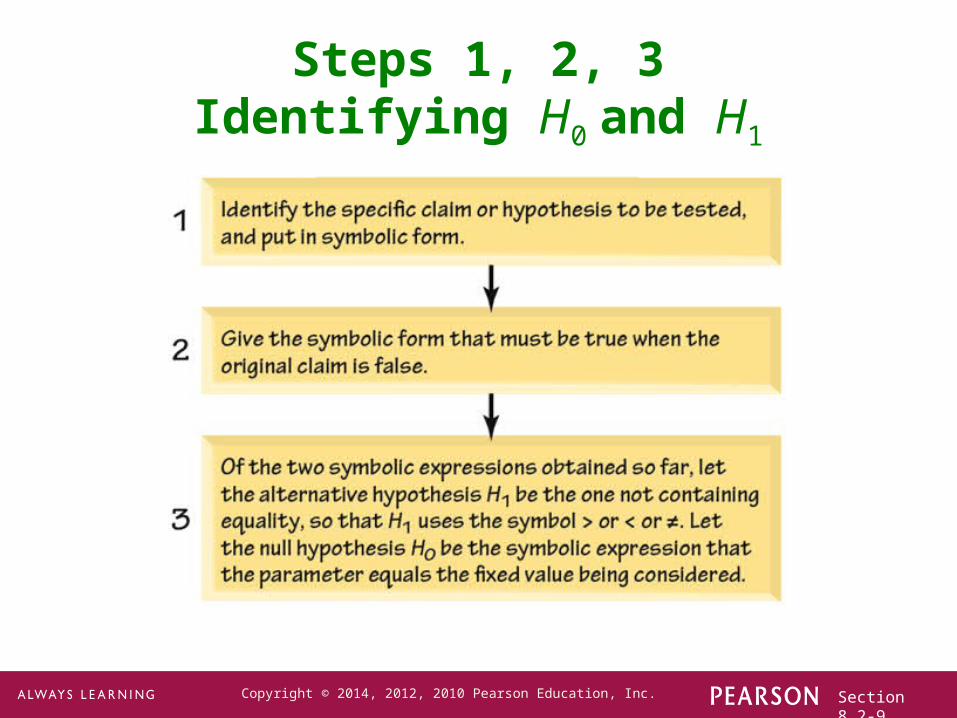
Steps 1, 2, 3Identifying H0 and H1
Section 8.2-10Copyright © 2014, 2012, 2010 Pearson Education, Inc.
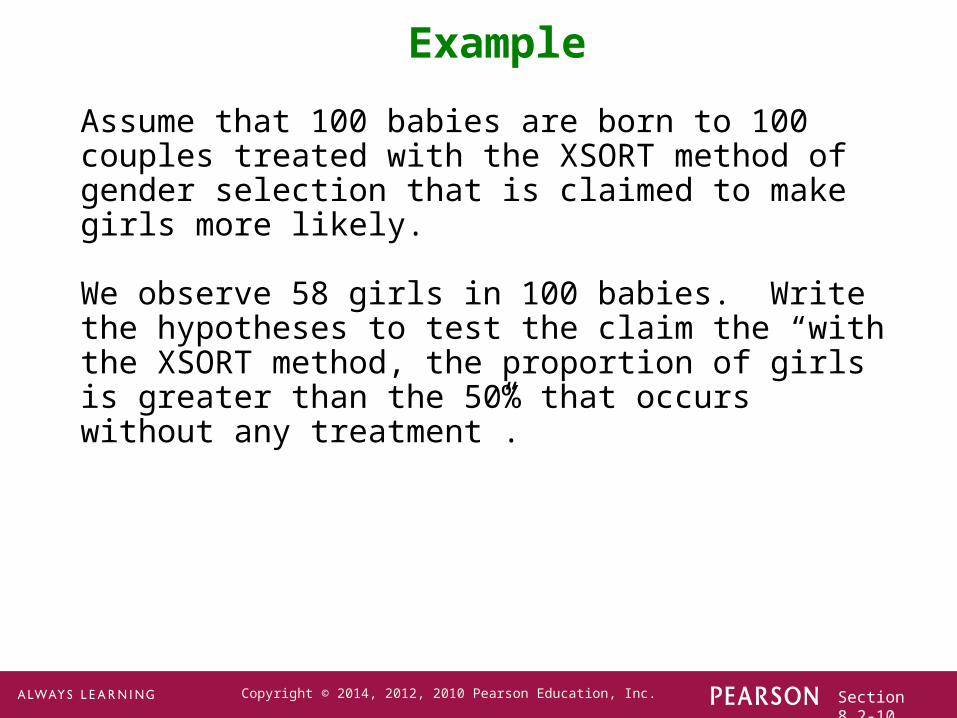
Example
Assume that 100 babies are born to 100 couples treated with the XSORT method of gender selection that is claimed to make girls more likely.
We observe 58 girls in 100 babies. Write the hypotheses to test the claim the “with the XSORT method, the proportion of girls is greater than the 50% that occurs without any treatment”.
Section 8.2-11Copyright © 2014, 2012, 2010 Pearson Education, Inc.
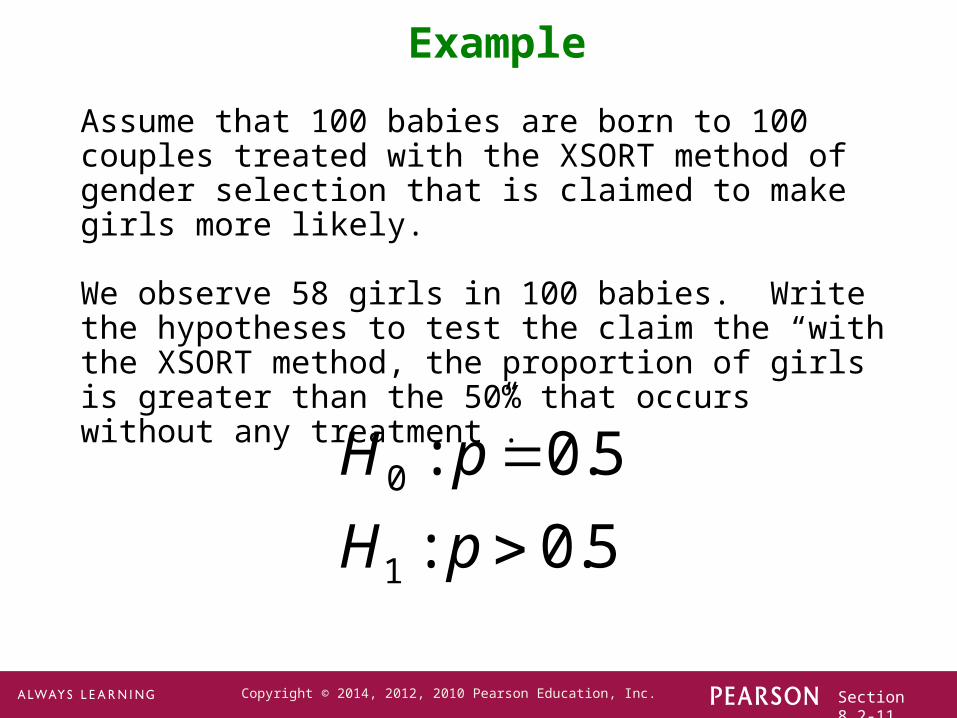
Example
Assume that 100 babies are born to 100 couples treated with the XSORT method of gender selection that is claimed to make girls more likely.
We observe 58 girls in 100 babies. Write the hypotheses to test the claim the “with the XSORT method, the proportion of girls is greater than the 50% that occurs without any treatment”.
0
1
: 0.5
: 0.5
H p
H p
Section 8.2-12Copyright © 2014, 2012, 2010 Pearson Education, Inc.
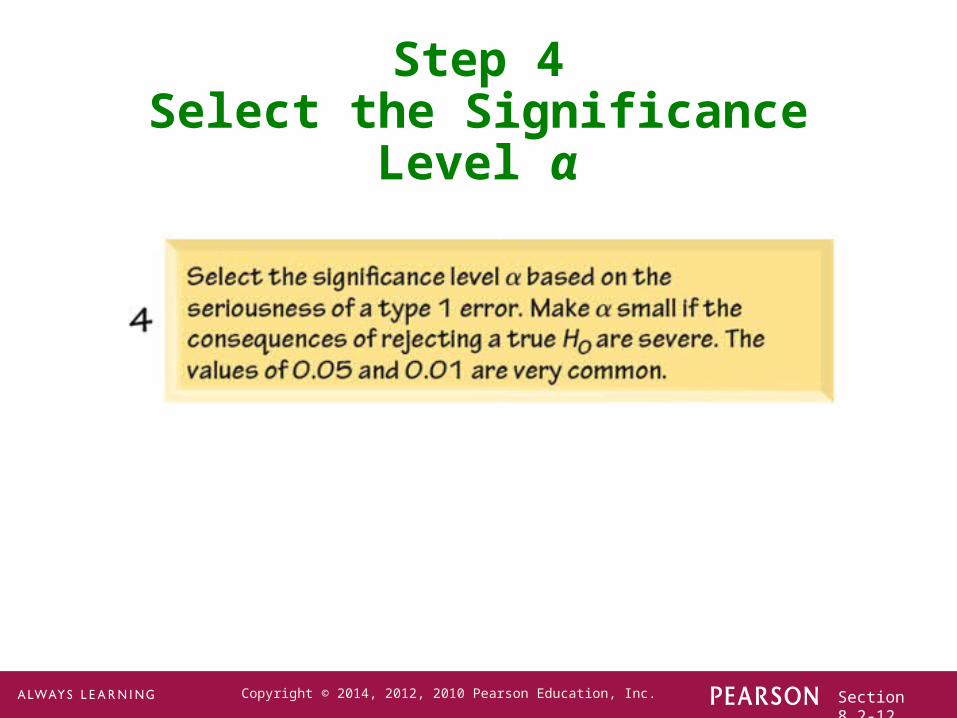
Step 4Select the Significance Level α
Section 8.2-13Copyright © 2014, 2012, 2010 Pearson Education, Inc.
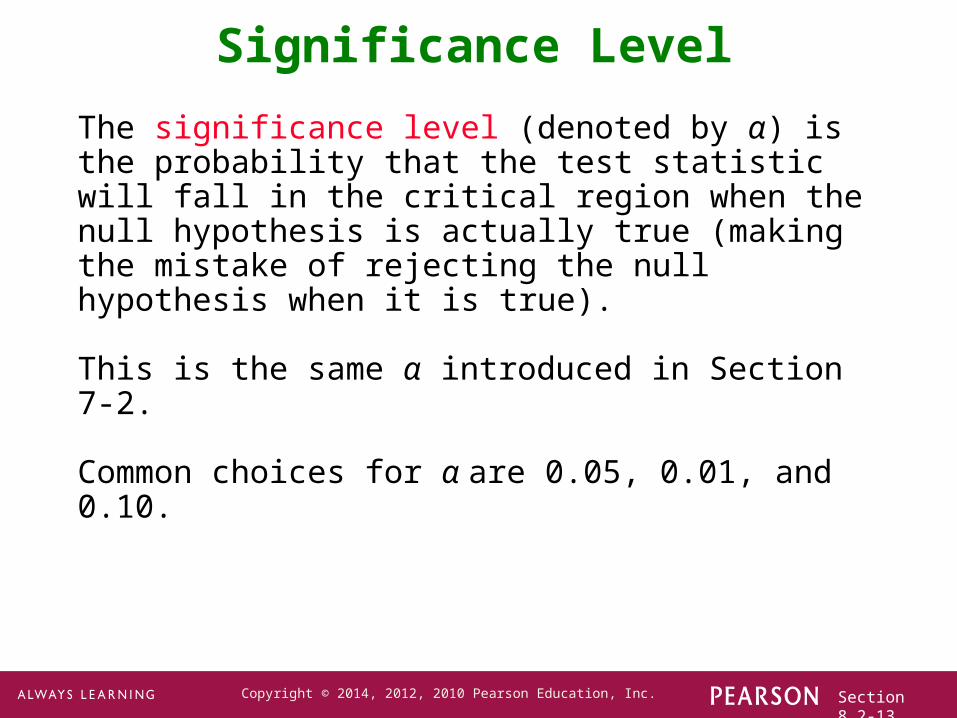
Significance Level
The significance level (denoted by α) is the probability that the test statistic will fall in the critical region when the null hypothesis is actually true (making the mistake of rejecting the null hypothesis when it is true).
This is the same α introduced in Section 7-2.
Common choices for α are 0.05, 0.01, and 0.10.

Section 8.2-14Copyright © 2014, 2012, 2010 Pearson Education, Inc.
Step 5Identify the Test Statistic and
Determine its Sampling Distribution
Section 8.2-15Copyright © 2014, 2012, 2010 Pearson Education, Inc.
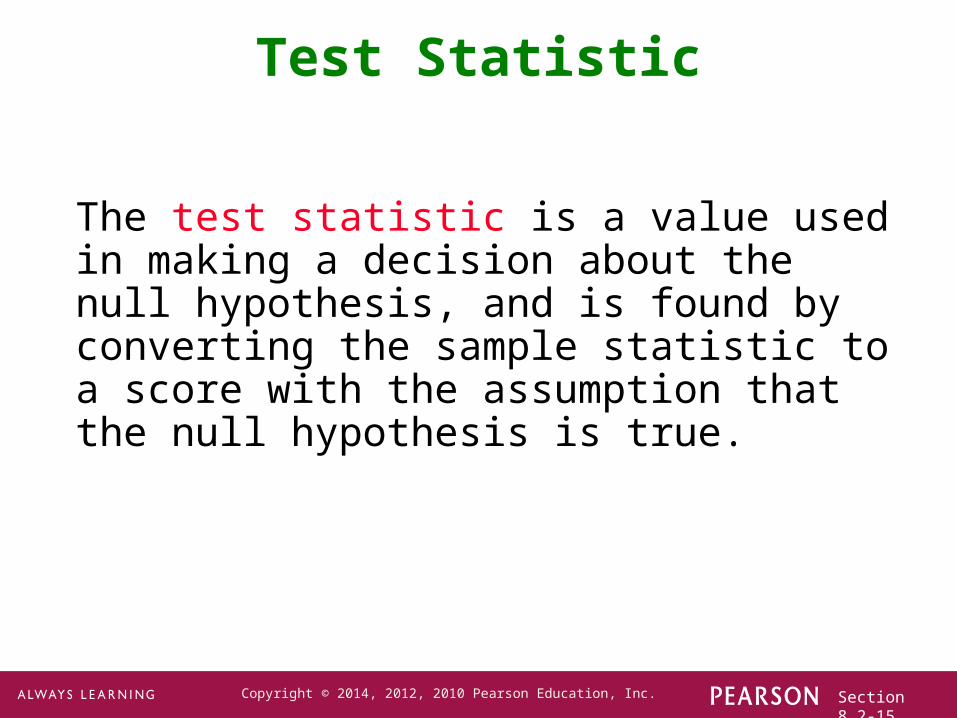
The test statistic is a value used in making a decision about the null hypothesis, and is found by converting the sample statistic to a score with the assumption that the null hypothesis is true.
Test Statistic
Section 8.2-16Copyright © 2014, 2012, 2010 Pearson Education, Inc.
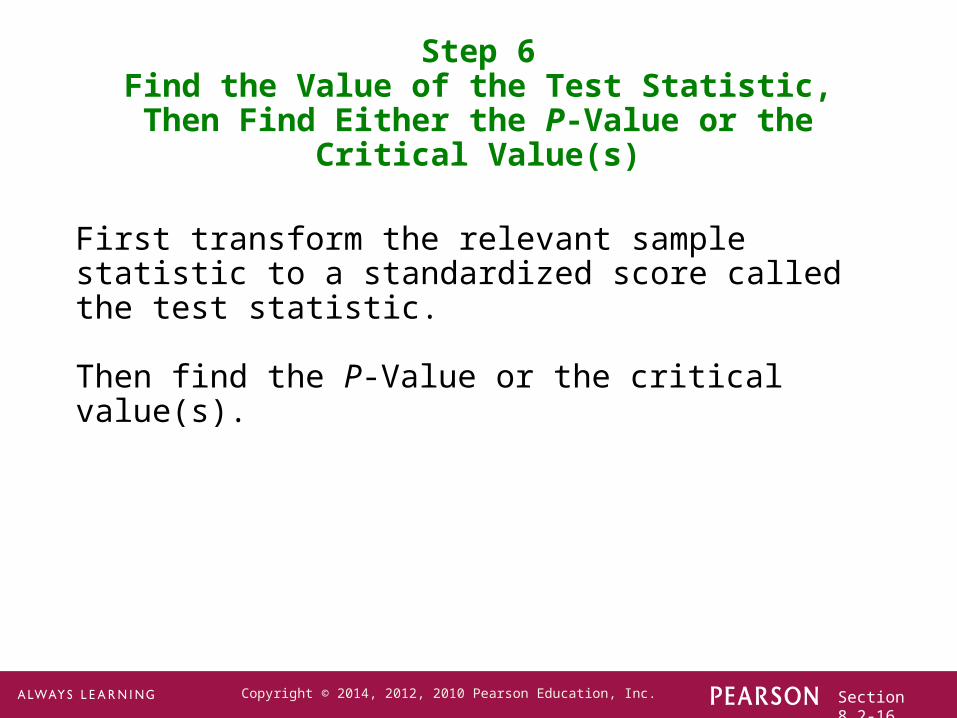
Step 6Find the Value of the Test Statistic, Then Find
Either the P-Value or the Critical Value(s)
First transform the relevant sample statistic to a standardized score called the test statistic.
Then find the P-Value or the critical value(s).
Section 8.2-17Copyright © 2014, 2012, 2010 Pearson Education, Inc.
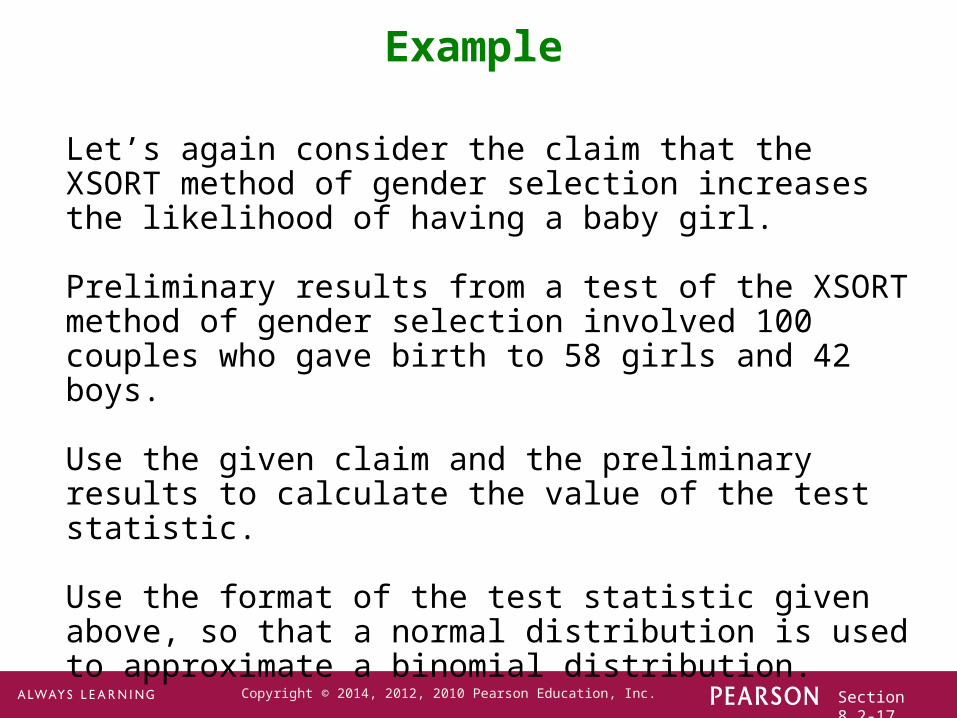
Example
Let’s again consider the claim that the XSORT method of gender selection increases the likelihood of having a baby girl.
Preliminary results from a test of the XSORT method of gender selection involved 100 couples who gave birth to 58 girls and 42 boys.
Use the given claim and the preliminary results to calculate the value of the test statistic.
Use the format of the test statistic given above, so that a normal distribution is used to approximate a binomial distribution.
Section 8.2-18Copyright © 2014, 2012, 2010 Pearson Education, Inc.
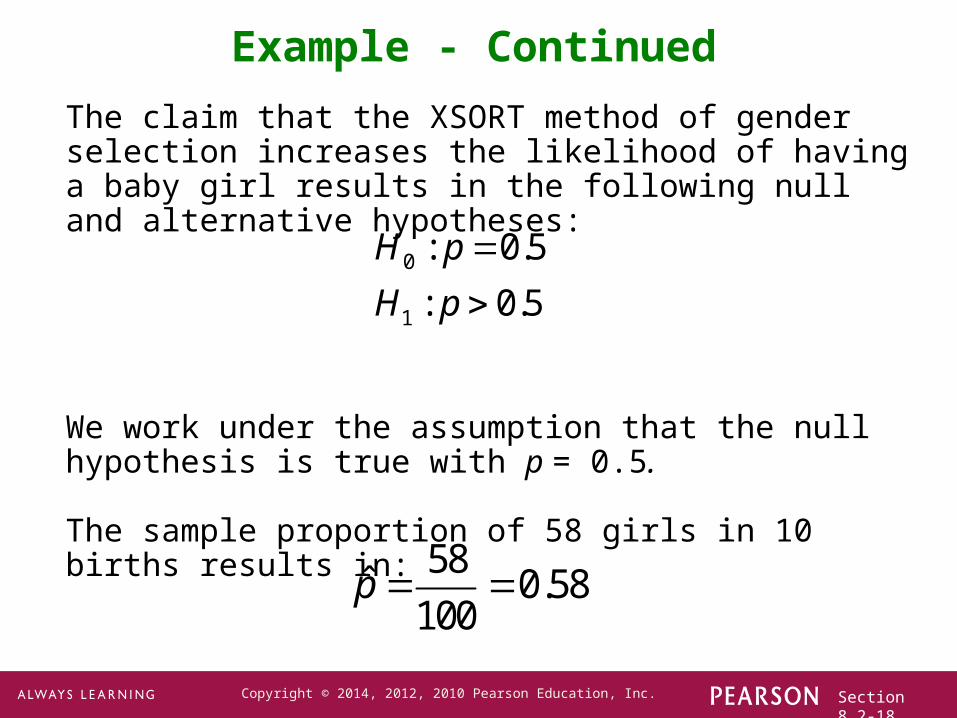
Example - Continued
The claim that the XSORT method of gender selection increases the likelihood of having a baby girl results in the following null and alternative hypotheses:
We work under the assumption that the null hypothesis is true with p = 0.5.
The sample proportion of 58 girls in 10 births results in:
0
1
: 0.5
: 0.5
H p
H p
58ˆ 0.58
100p
Section 8.2-19Copyright © 2014, 2012, 2010 Pearson Education, Inc.
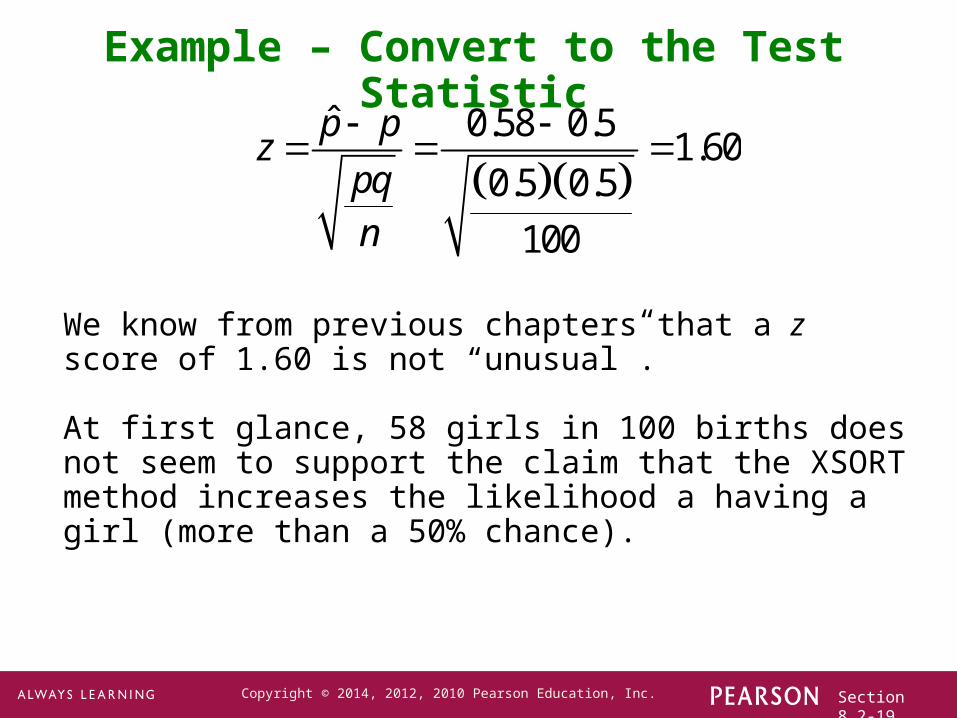
Example – Convert to the Test Statistic
We know from previous chapters that a z score of 1.60 is not “unusual”.
At first glance, 58 girls in 100 births does not seem to support the claim that the XSORT method increases the likelihood a having a girl (more than a 50% chance).
ˆ 0.58 0.5
1.600.5 0.5
100
p pz
pqn
Section 8.2-20Copyright © 2014, 2012, 2010 Pearson Education, Inc.
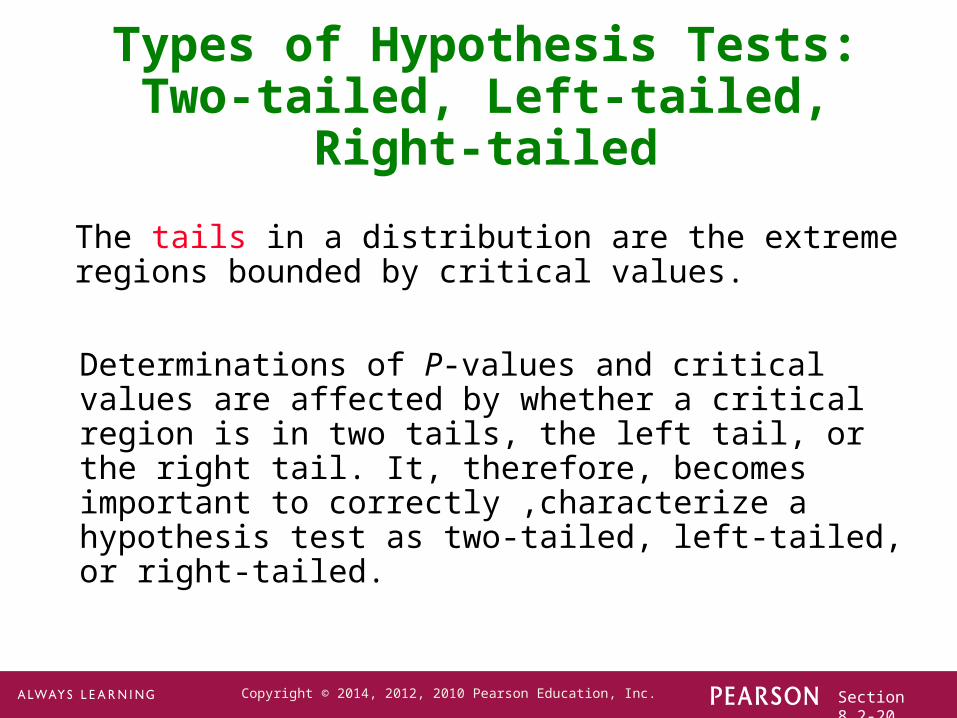
Types of Hypothesis Tests:Two-tailed, Left-tailed, Right-tailed
The tails in a distribution are the extreme regions bounded by critical values.
Determinations of P-values and critical values are affected by whether a critical region is in two tails, the left tail, or the right tail. It, therefore, becomes important to correctly ,characterize a hypothesis test as two-tailed, left-tailed, or right-tailed.
Section 8.2-21Copyright © 2014, 2012, 2010 Pearson Education, Inc.
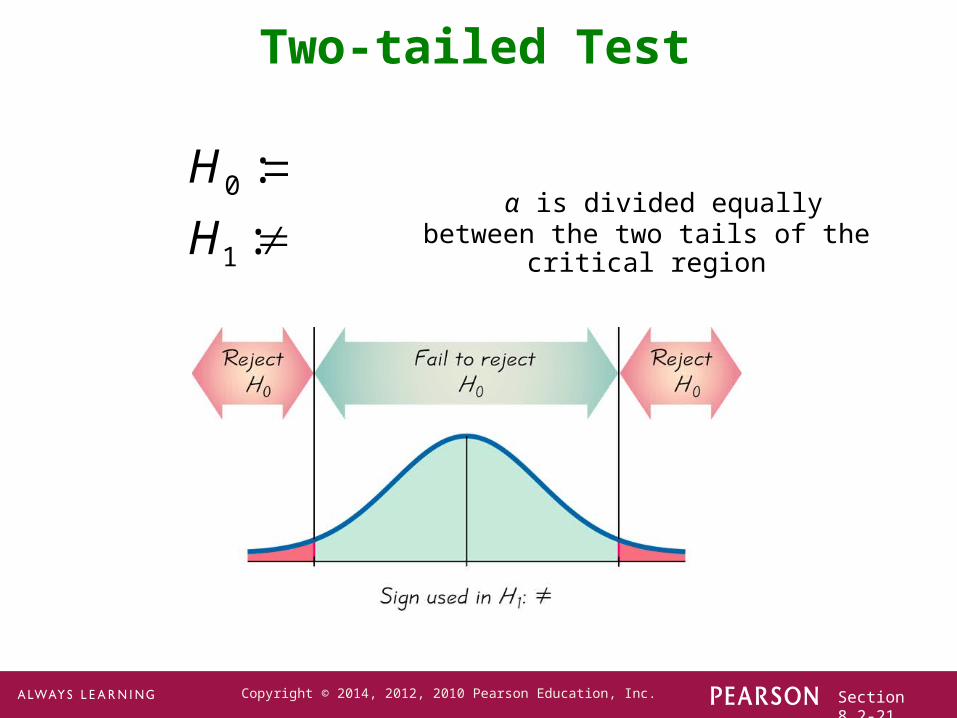
Two-tailed Test
α is divided equally between the two tails of the critical region
0
1
:
:
H
H
Section 8.2-22Copyright © 2014, 2012, 2010 Pearson Education, Inc.
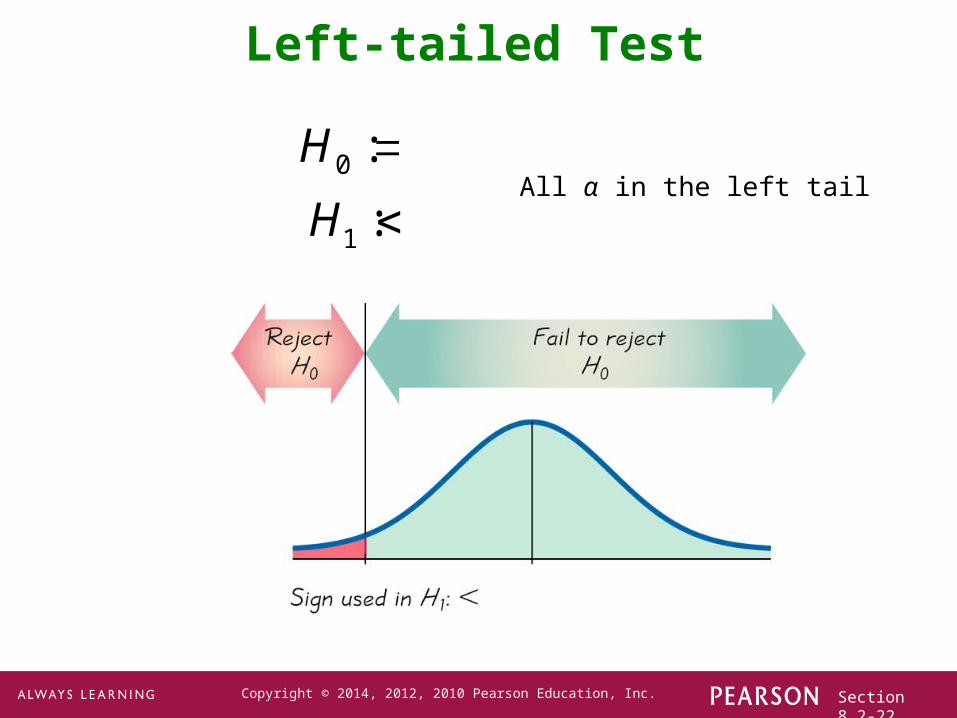
Left-tailed Test
All α in the left tail0 :H
1 :H
Section 8.2-23Copyright © 2014, 2012, 2010 Pearson Education, Inc.
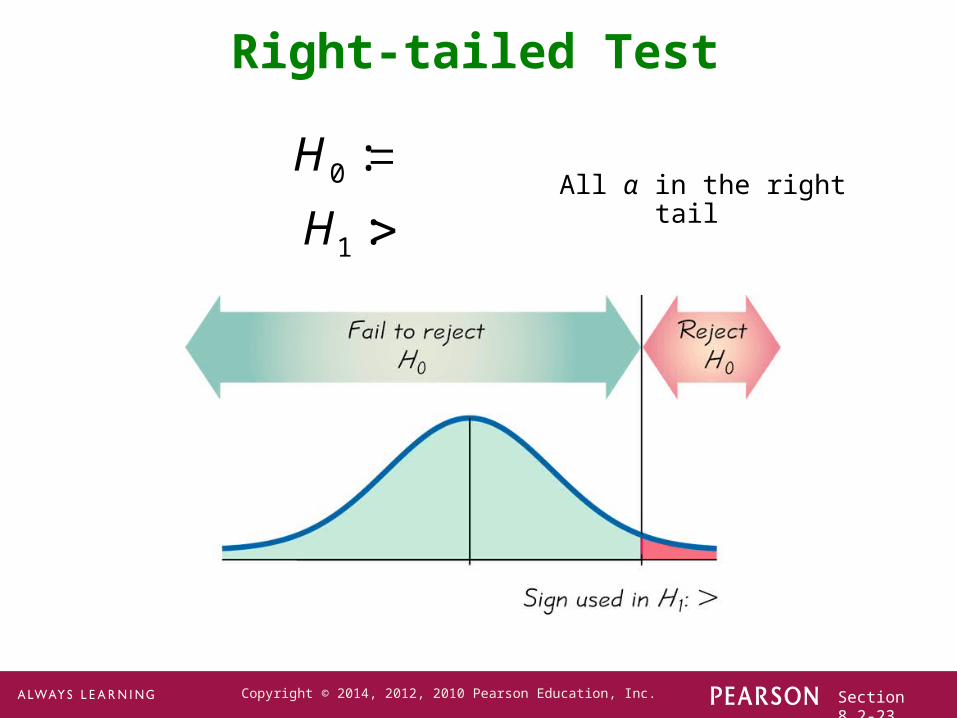
Right-tailed Test
0 :H
1 :H All α in the right tail
Section 8.2-24Copyright © 2014, 2012, 2010 Pearson Education, Inc.
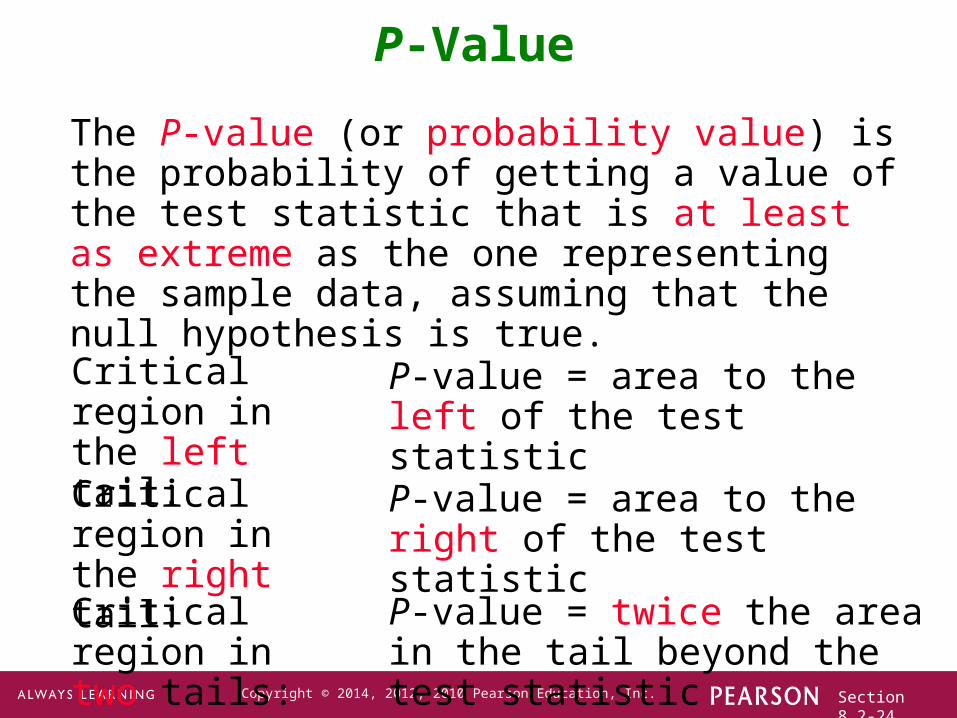
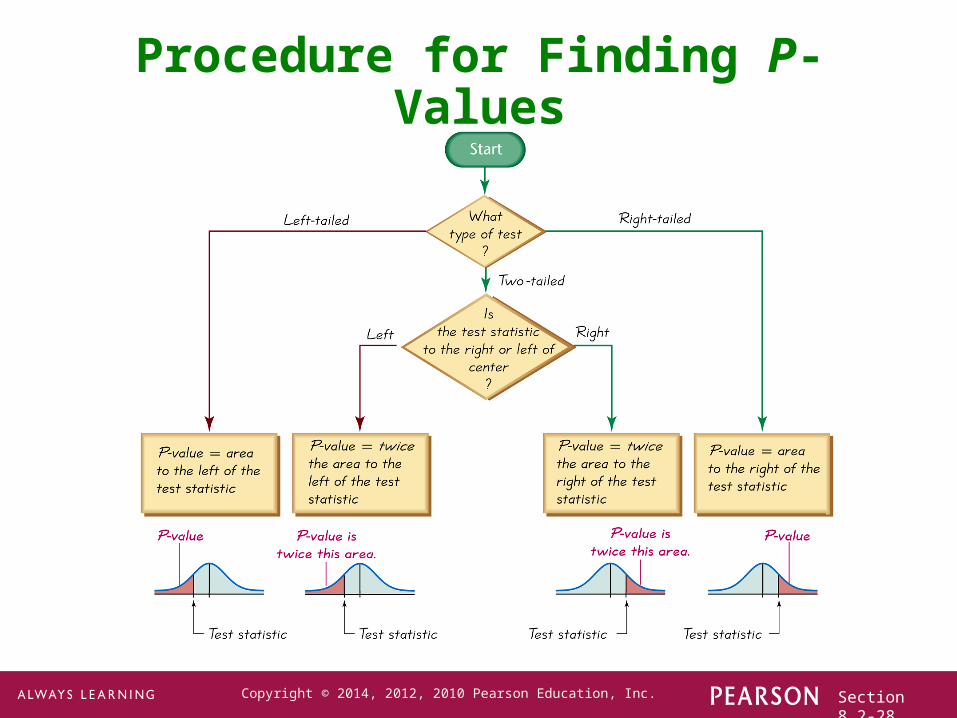
P-Value
The P-value (or probability value) is the probability of getting a value of the test statistic that is at least as extreme as the one representing the sample data, assuming that the null hypothesis is true.
Critical region in the left tail:
Critical region in the right tail:
Critical region in two tails:
P-value = area to the left of the test statistic
P-value = area to the right of the test statistic
P-value = twice the area in the tail beyond the test statistic
Section 8.2-25Copyright © 2014, 2012, 2010 Pearson Education, Inc.
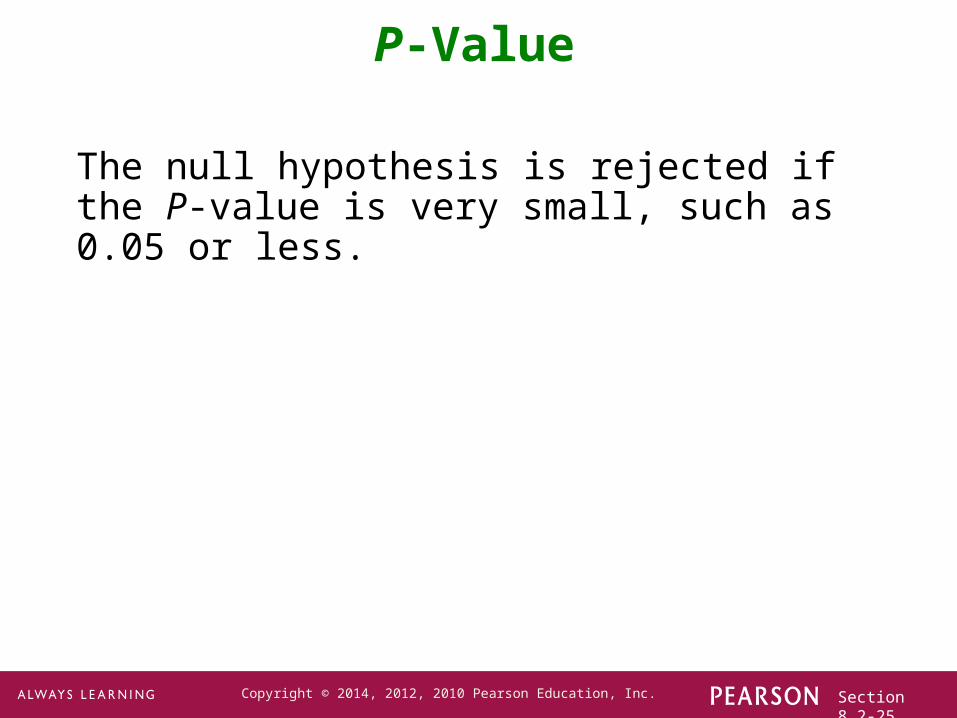
P-Value
The null hypothesis is rejected if the P-value is very small, such as 0.05 or less.
Section 8.2-26Copyright © 2014, 2012, 2010 Pearson Education, Inc.
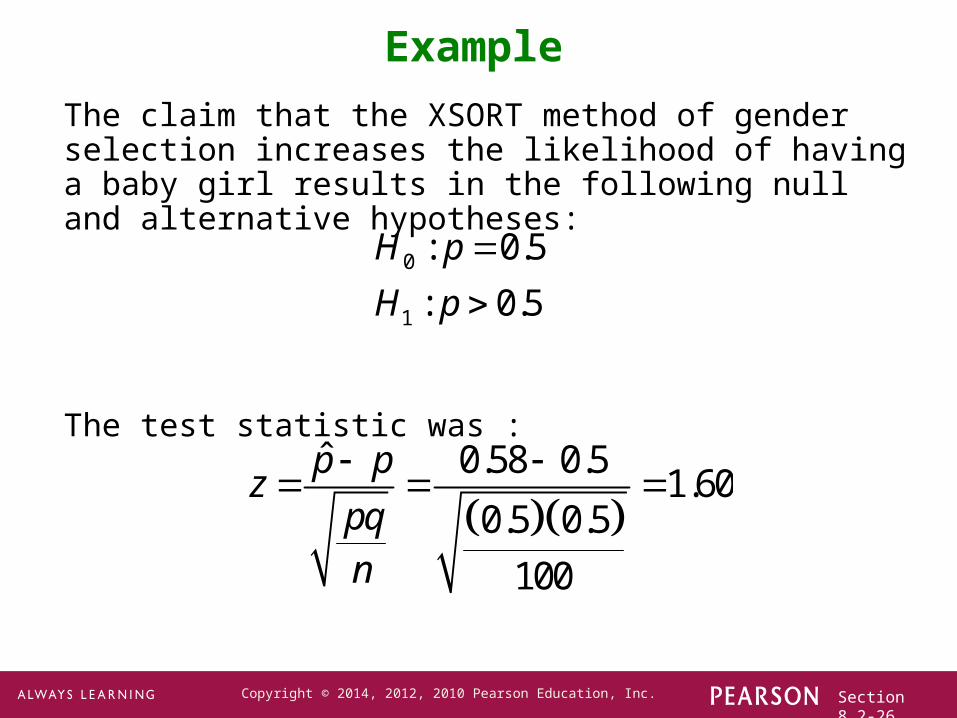
Example
The claim that the XSORT method of gender selection increases the likelihood of having a baby girl results in the following null and alternative hypotheses:
The test statistic was :
0
1
: 0.5
: 0.5
H p
H p
ˆ 0.58 0.5
1.600.5 0.5
100
p pz
pqn
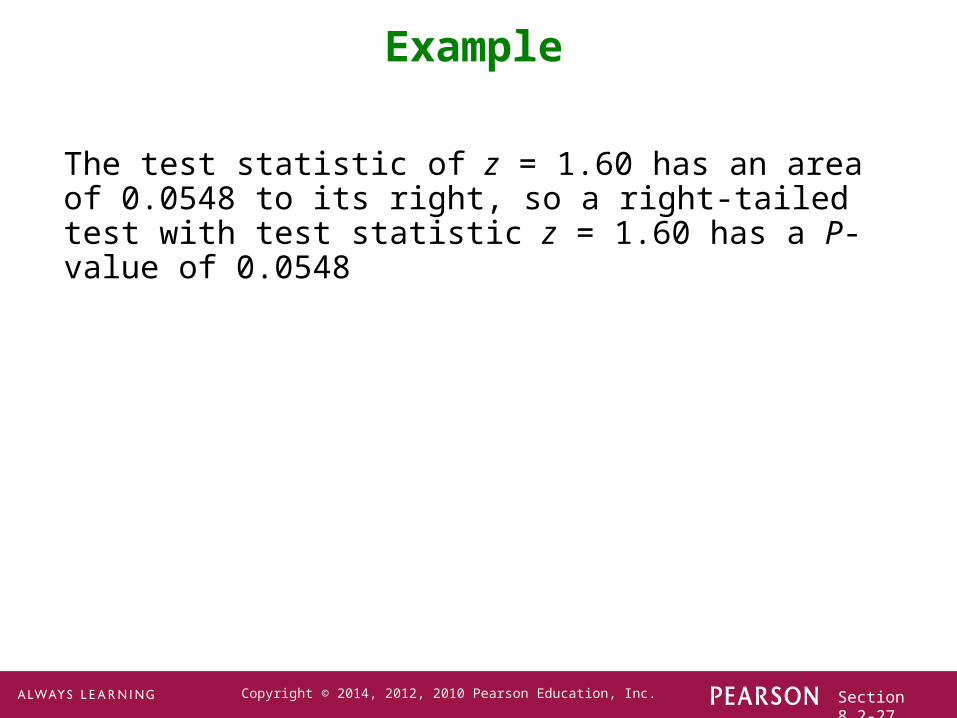
Section 8.2-27Copyright © 2014, 2012, 2010 Pearson Education, Inc.
Example
The test statistic of z = 1.60 has an area of 0.0548 to its right, so a right-tailed test with test statistic z = 1.60 has a P-value of 0.0548
Section 8.2-28Copyright © 2014, 2012, 2010 Pearson Education, Inc.
Procedure for Finding P-Values
Section 8.2-29Copyright © 2014, 2012, 2010 Pearson Education, Inc.
Critical Region
The critical region (or rejection region) is the set of all values of the test statistic that cause us to reject the null hypothesis. For example, see the red-shaded region in the previous figures.
Section 8.2-30Copyright © 2014, 2012, 2010 Pearson Education, Inc.
Critical Value
A critical value is any value that separates the critical region (where we reject the null hypothesis) from the values of the test statistic that do not lead to rejection of the null hypothesis.
The critical values depend on the nature of the null hypothesis, the sampling distribution that applies, and the significance level α.
Section 8.2-31Copyright © 2014, 2012, 2010 Pearson Education, Inc.
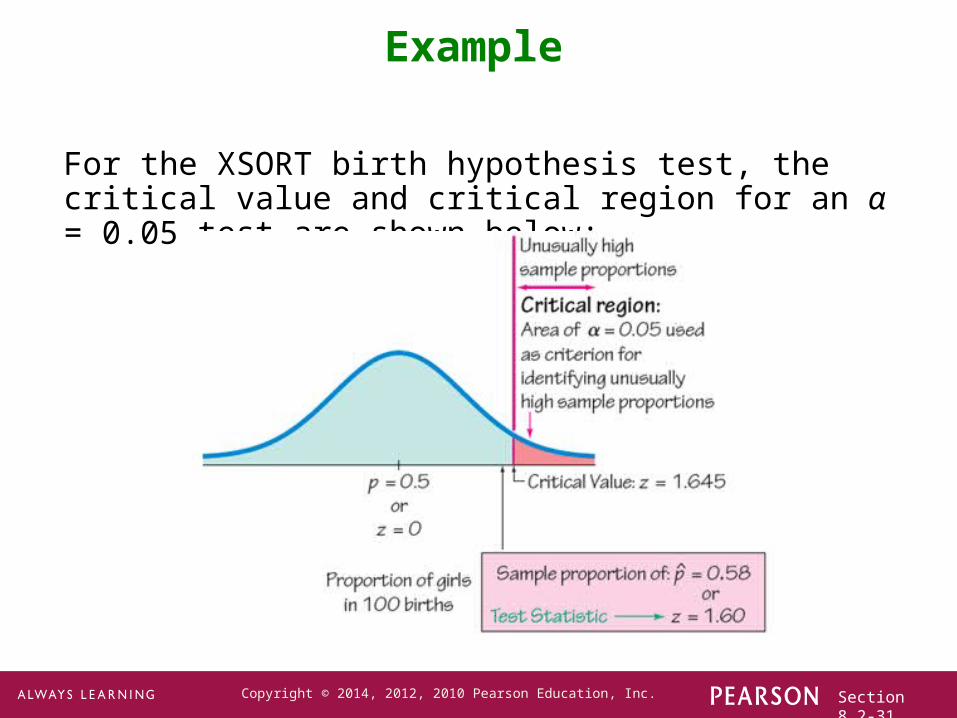
Example
For the XSORT birth hypothesis test, the critical value and critical region for an α = 0.05 test are shown below:
Section 8.2-32Copyright © 2014, 2012, 2010 Pearson Education, Inc.
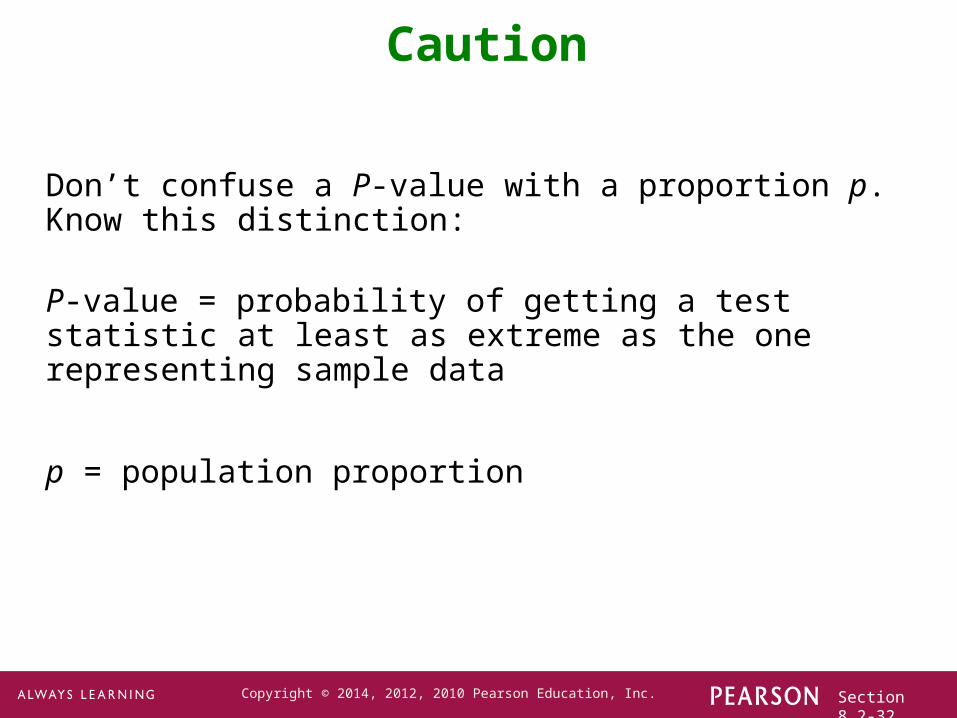
Caution
Don’t confuse a P-value with a proportion p.Know this distinction:
P-value = probability of getting a test statistic at least as extreme as the one representing sample data
p = population proportion
Section 8.2-33Copyright © 2014, 2012, 2010 Pearson Education, Inc.
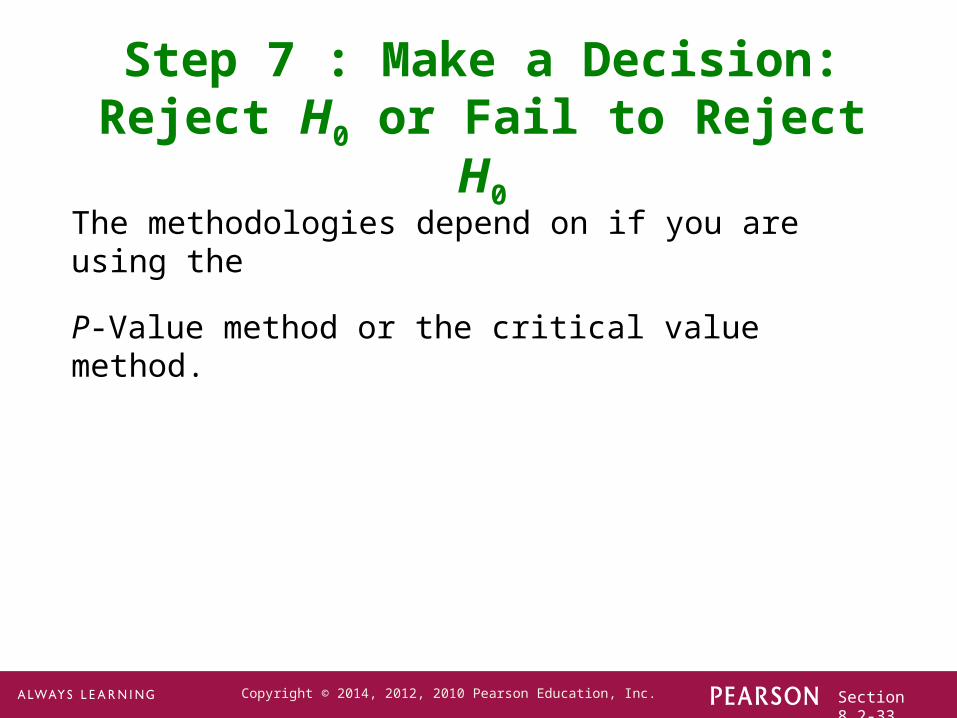
Step 7 : Make a Decision:Reject H0 or Fail to Reject H0
The methodologies depend on if you are using the
P-Value method or the critical value method.
Section 8.2-34Copyright © 2014, 2012, 2010 Pearson Education, Inc.
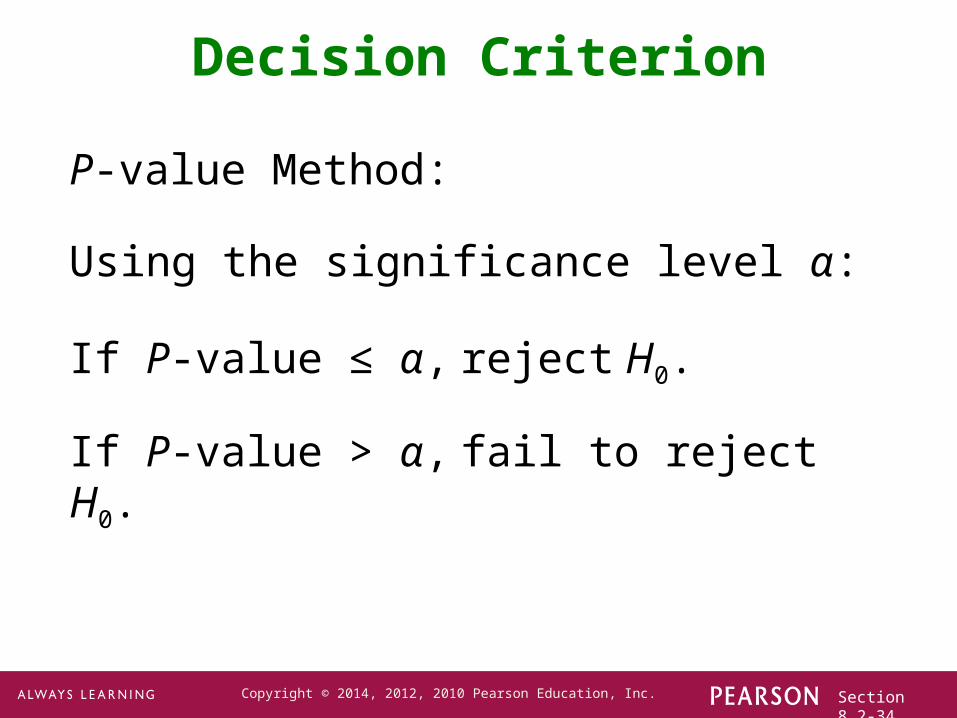
P-value Method:
Using the significance level α:
If P-value ≤ α, reject H0.
If P-value > α, fail to reject H0.
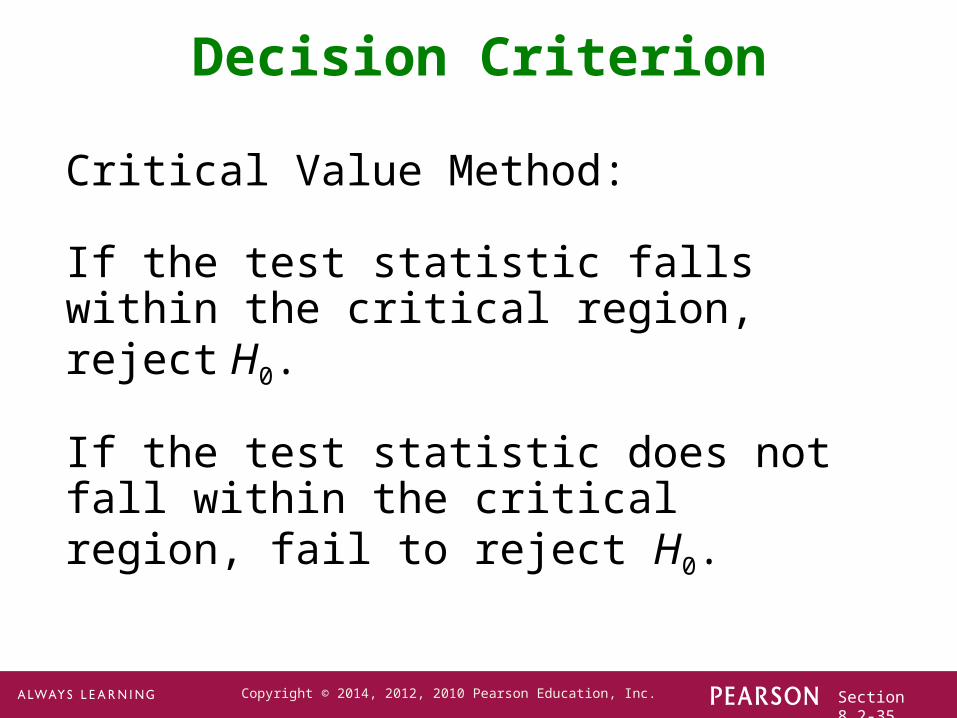
Decision Criterion
Section 8.2-35Copyright © 2014, 2012, 2010 Pearson Education, Inc.
Critical Value Method:
If the test statistic falls within the critical region, reject H0.
If the test statistic does not fall within the critical region, fail to reject H0.
Decision Criterion
Section 8.2-36Copyright © 2014, 2012, 2010 Pearson Education, Inc.
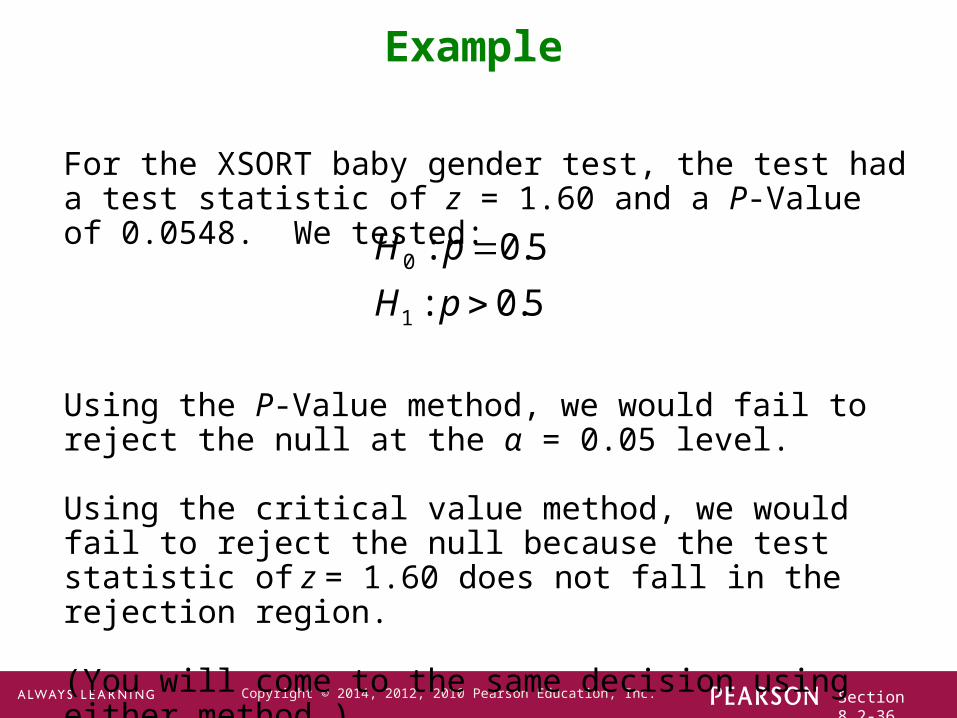
Example
For the XSORT baby gender test, the test had a test statistic of z = 1.60 and a P-Value of 0.0548. We tested:
Using the P-Value method, we would fail to reject the null at the α = 0.05 level.
Using the critical value method, we would fail to reject the null because the test statistic of z = 1.60 does not fall in the rejection region.
(You will come to the same decision using either method.)
0
1
: 0.5
: 0.5
H p
H p

Section 8.2-37Copyright © 2014, 2012, 2010 Pearson Education, Inc.
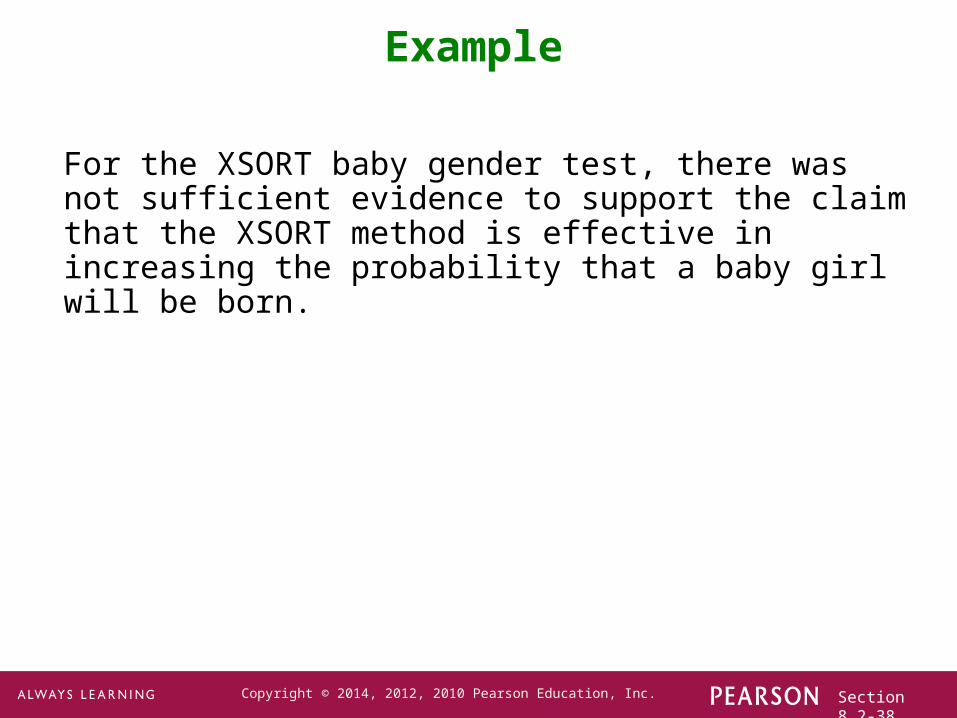
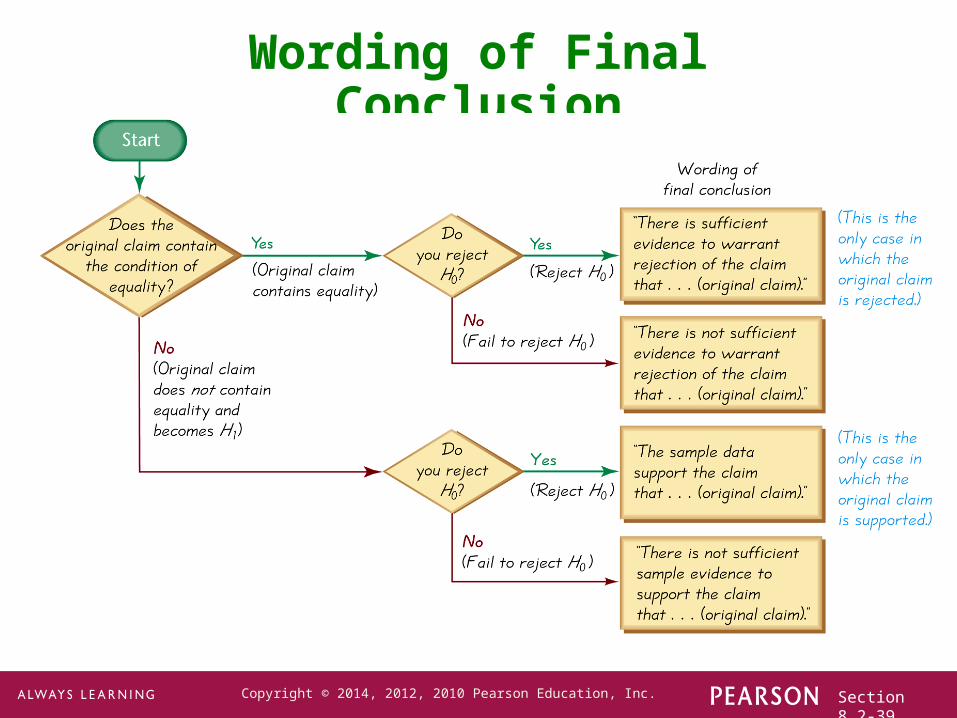
Step 8 : Restate the Decision Using Simple and Nontechnical Terms
State a final conclusion that addresses the original claim with wording that can be understood by those without knowledge of statistical procedures.
Section 8.2-38Copyright © 2014, 2012, 2010 Pearson Education, Inc.
Example
For the XSORT baby gender test, there was not sufficient evidence to support the claim that the XSORT method is effective in increasing the probability that a baby girl will be born.
Section 8.2-39Copyright © 2014, 2012, 2010 Pearson Education, Inc.
Wording of Final Conclusion
Section 8.2-40Copyright © 2014, 2012, 2010 Pearson Education, Inc.
Caution
Never conclude a hypothesis test with a statement of “reject the null hypothesis” or “fail to reject the null hypothesis.”
Always make sense of the conclusion with a statement that uses simple nontechnical wording that addresses the original claim.
Section 8.2-41Copyright © 2014, 2012, 2010 Pearson Education, Inc.
Accept Versus Fail to Reject
• Some texts use “accept the null hypothesis.”
• We are not proving the null hypothesis.
• Fail to reject says more correctly that the available evidence is not strong enough to warrant rejection of the null hypothesis.
Section 8.2-42Copyright © 2014, 2012, 2010 Pearson Education, Inc.
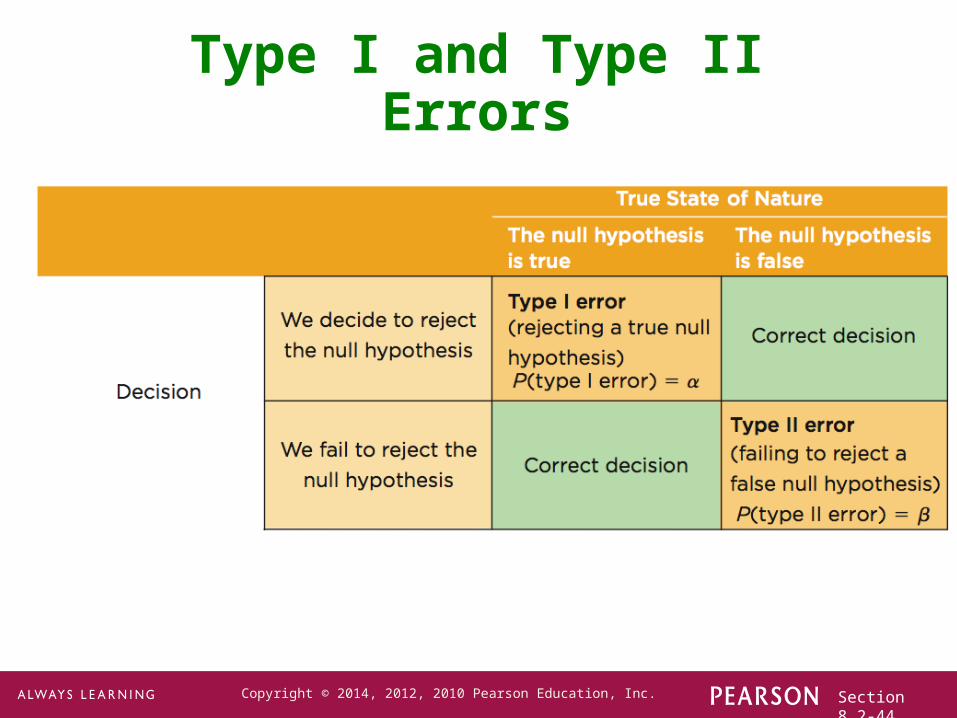
Type I Error
• A Type I error is the mistake of rejecting the null hypothesis when it is actually true.
• The symbol α is used to represent the probability of a type I error.
Section 8.2-43Copyright © 2014, 2012, 2010 Pearson Education, Inc.
Type II Error
• A Type II error is the mistake of failing to reject the null hypothesis when it is actually false.
• The symbol β (beta) is used to represent the probability of a type II error.
Section 8.2-44Copyright © 2014, 2012, 2010 Pearson Education, Inc.
Type I and Type II Errors
Section 8.2-45Copyright © 2014, 2012, 2010 Pearson Education, Inc.
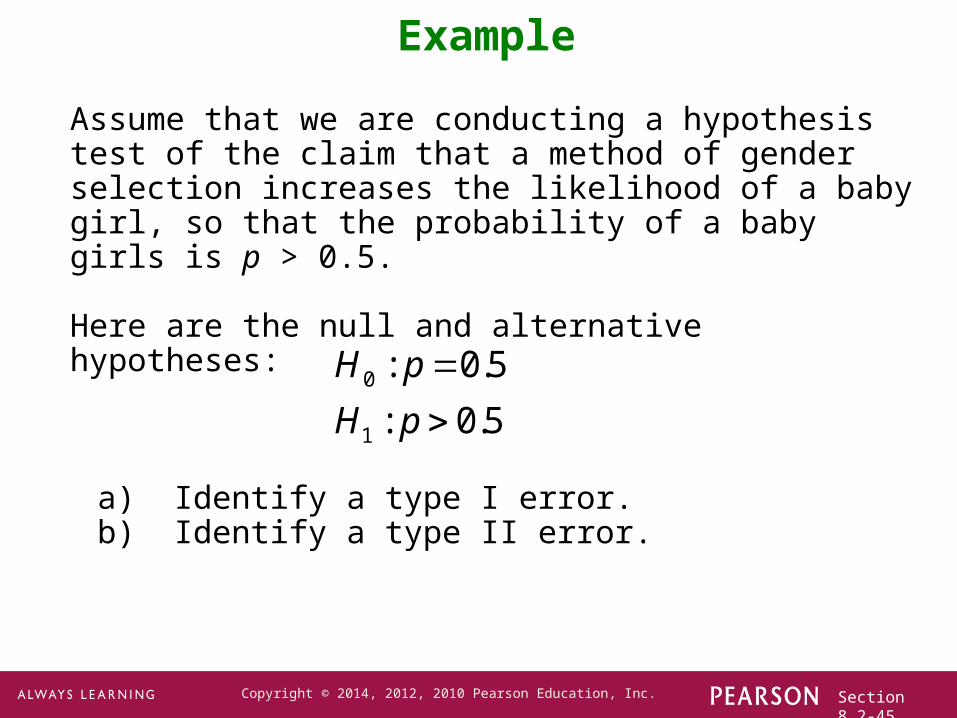
Example
a) Identify a type I error.b) Identify a type II error.
Assume that we are conducting a hypothesis test of the claim that a method of gender selection increases the likelihood of a baby girl, so that the probability of a baby girls is p > 0.5.
Here are the null and alternative hypotheses:
0
1
: 0.5
: 0.5
H p
H p
Section 8.2-46Copyright © 2014, 2012, 2010 Pearson Education, Inc.
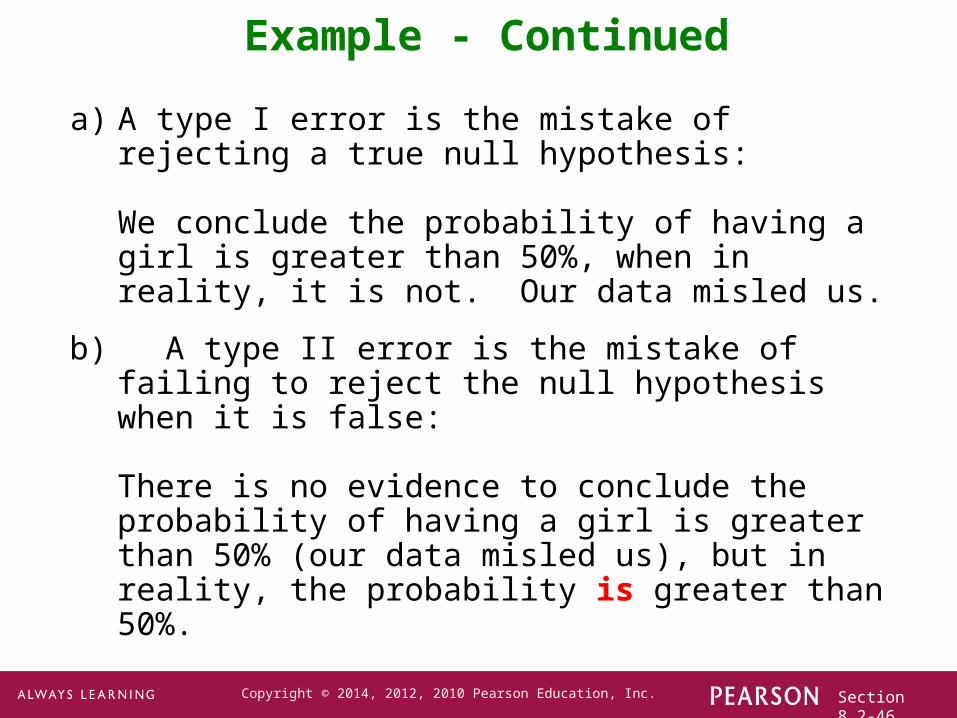
Example - Continued
a) A type I error is the mistake of rejecting a true null hypothesis:
We conclude the probability of having a girl is greater than 50%, when in reality, it is not. Our data misled us.
b) A type II error is the mistake of failing to reject the null hypothesis when it is false:
There is no evidence to conclude the probability of having a girl is greater than 50% (our data misled us), but in reality, the probability is greater than 50%.
Section 8.2-47Copyright © 2014, 2012, 2010 Pearson Education, Inc.
Controlling Type I and Type II Errors
• For any fixed α, an increase in the sample size n will cause a decrease in β
• For any fixed sample size n, a decrease in α will cause an increase in β. Conversely, an increase in α will cause a decrease in β.
• To decrease both αand β, increase the sample size.

Section 8.2-48Copyright © 2014, 2012, 2010 Pearson Education, Inc.
Part 2: Beyond the Basics of Hypothesis Testing:The Power of a Test
Section 8.2-49Copyright © 2014, 2012, 2010 Pearson Education, Inc.
Definition
The power of a hypothesis test is the probability 1 – β of rejecting a false null hypothesis.
The value of the power is computed by using a particular significance level α and a particular value of the population parameter that is an alternative to the value assumed true in the null hypothesis.

Section 8.2-50Copyright © 2014, 2012, 2010 Pearson Education, Inc.
Power and theDesign of Experiments
Just as 0.05 is a common choice for a significance level, a power of at least 0.80 is a common requirement for determining that a hypothesis test is effective. (Some statisticians argue that the power should be higher, such as 0.85 or 0.90.)
When designing an experiment, we might consider how much of a difference between the claimed value of a parameter and its true value is an important amount of difference.
When designing an experiment, a goal of having a power value of at least 0.80 can often be used to determine the minimum required sample size.