Embed Size (px)
Citation preview
Section 12.3-1Copyright © 2014, 2012, 2010 Pearson Education, Inc.
Lecture Slides
Elementary Statistics Twelfth Edition
and the Triola Statistics Series
by Mario F. Triola
Section 12.3-2Copyright © 2014, 2012, 2010 Pearson Education, Inc.
Chapter 12Analysis of Variance
12-1 Review and Preview
12-2 One-Way ANOVA
12-3 Two-Way ANOVA

Section 12.3-3Copyright © 2014, 2012, 2010 Pearson Education, Inc.
Key Concepts
We introduce the method of two-way analysis of variance, which is used with data partitioned into categories according to two factors.
The methods of this section require that we begin by testing for an interaction between the two factors.
Then we test whether the row or column factors have effects.
Section 12.3-4Copyright © 2014, 2012, 2010 Pearson Education, Inc.
Example
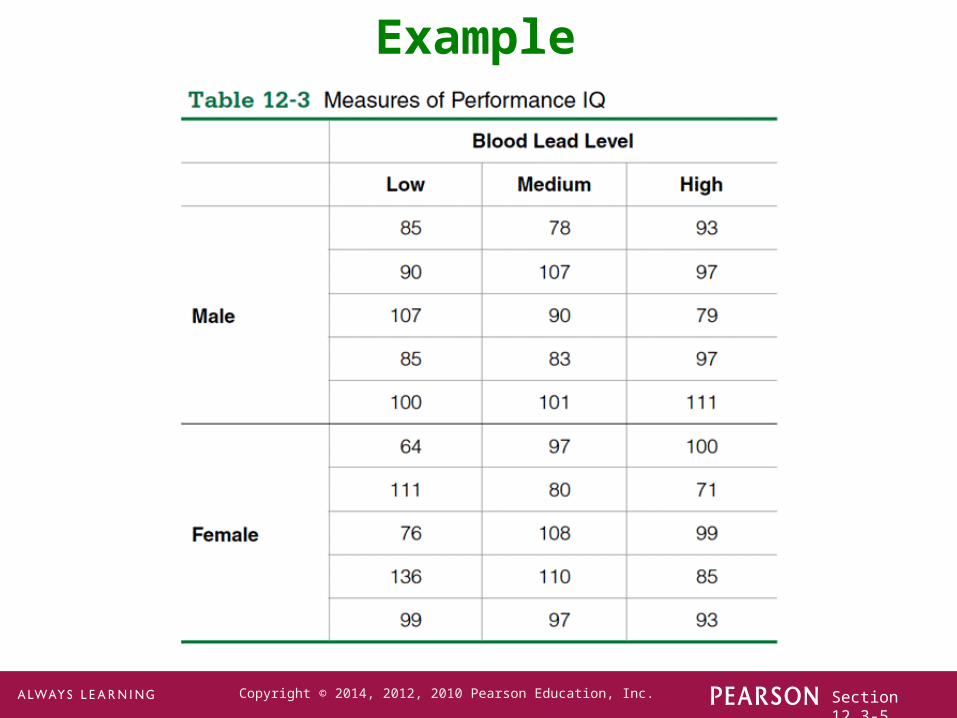
The data in the table are categorized with two factors:
1.Sex: Male or Female
2.Blood Lead Level: Low, Medium, or High
The subcategories are called cells, and the response variable is IQ score.
The data are presented on the next slide:
Section 12.3-5Copyright © 2014, 2012, 2010 Pearson Education, Inc.
Example
Section 12.3-6Copyright © 2014, 2012, 2010 Pearson Education, Inc.
There is an interaction between two factors if the effect of one of the factors changes for different categories of the other factor.
Definition
Section 12.3-7Copyright © 2014, 2012, 2010 Pearson Education, Inc.
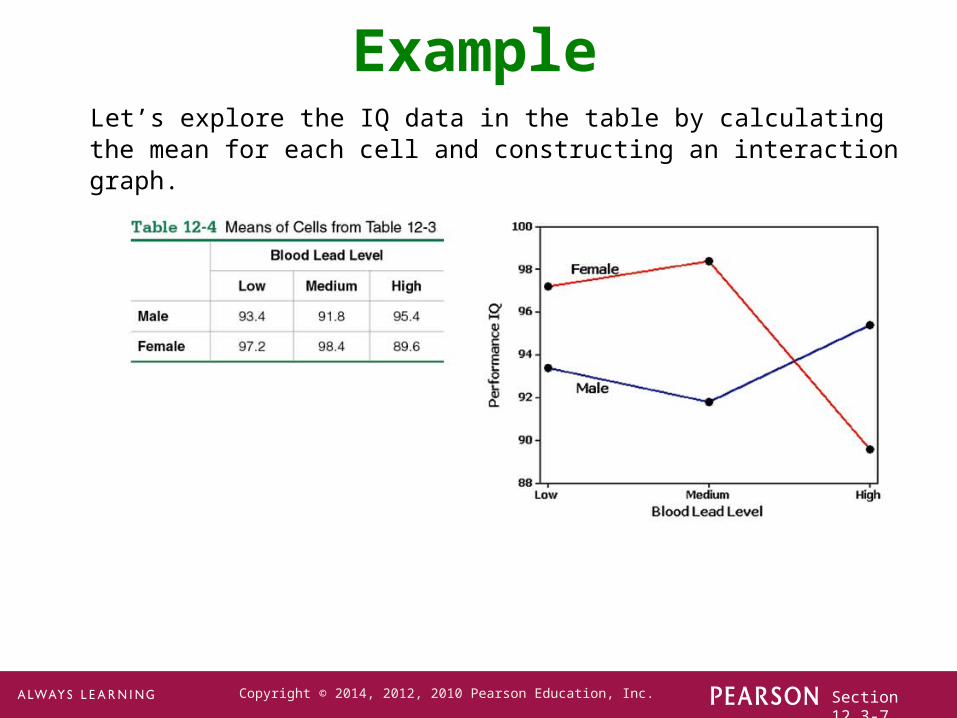
Let’s explore the IQ data in the table by calculating the mean for each cell and constructing an interaction graph.
Example
Section 12.3-8Copyright © 2014, 2012, 2010 Pearson Education, Inc.
An interaction effect is suggested if the line segments are far from being parallel.
No interaction effect is suggested if the line segments are approximately parallel.
For the IQ scores, it appears there is an interaction effect:
•Females with high lead exposure appear to have lower IQ scores, while males with high lead exposure appear to have high IQ scores.
Interpreting an Interaction Graph

Section 12.3-9Copyright © 2014, 2012, 2010 Pearson Education, Inc.
Requirements for Two-Way ANOVA
1. For each cell, the sample values come from a population with a distribution that is approximately normal.
2. The populations have the same variance σ2.
3. The samples are simple random samples.
4. The samples are independent of each other.
5. The sample values are categorized two ways.
6. All of the cells have the same number of sample values (a balanced design – this section does not include methods for a design that is not balanced).

Section 12.3-10Copyright © 2014, 2012, 2010 Pearson Education, Inc.
Technology and Two-Way ANOVA
Two-Way ANOVA calculations are quite involved, so we will assume that a software package is being used.
Minitab, Excel, StatCrunch, TI-83/4, STATDISK, or other software can be used.
Section 12.3-11Copyright © 2014, 2012, 2010 Pearson Education, Inc.
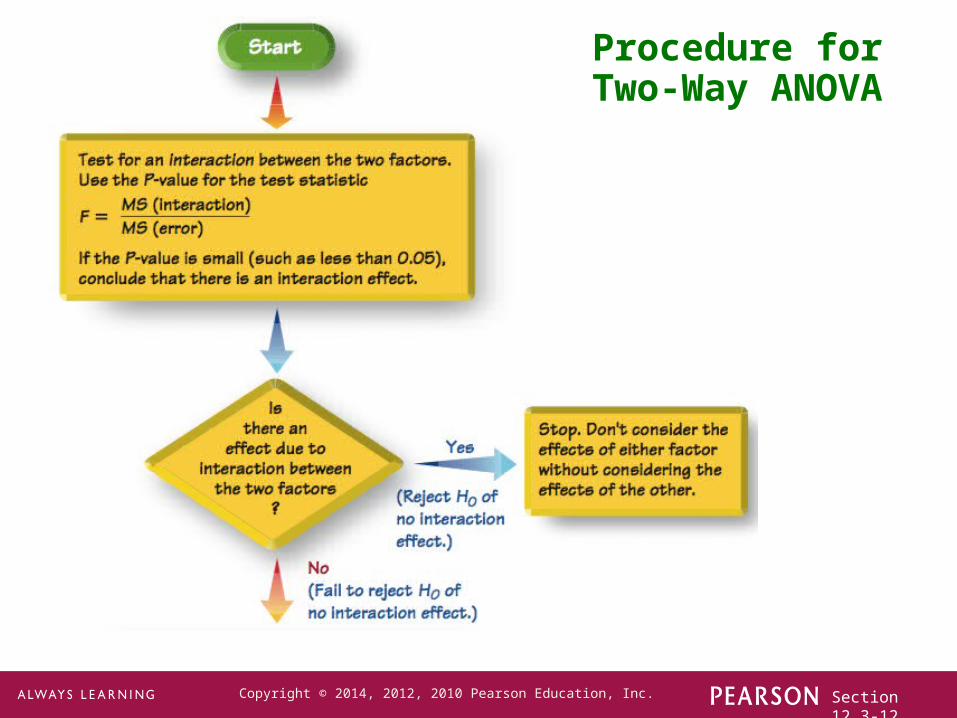
Procedure for Two-Way ANOVA
Step 1: Interaction Effect - test the null hypothesis that there is no interaction
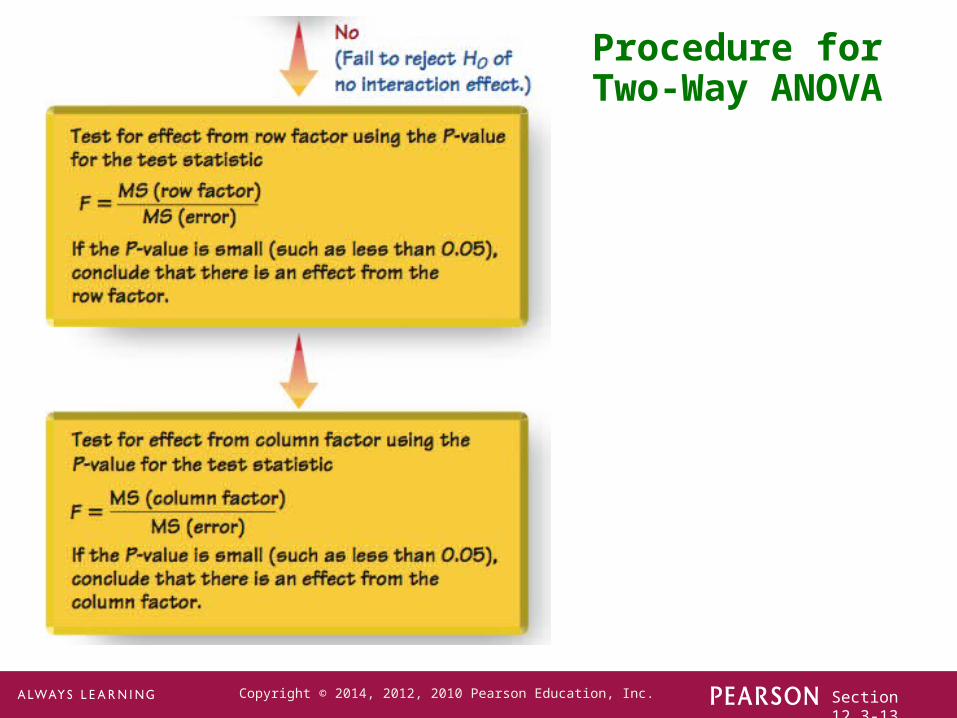
Step 2: Row/Column Effects - if we conclude there is no interaction effect, proceed with these two hypothesis tests
Row Factor: no effects from row
Column Factor: no effects from column
All tests use the F distribution and it is assumed technology will be used.
Section 12.3-12Copyright © 2014, 2012, 2010 Pearson Education, Inc.
Procedure for Two-Way ANOVA
Section 12.3-13Copyright © 2014, 2012, 2010 Pearson Education, Inc.
Procedure for Two-Way ANOVA
Section 12.3-14Copyright © 2014, 2012, 2010 Pearson Education, Inc.
Example
Given the performance IQ scores in the table at the beginning of this section, use two-way ANOVA to test for an interaction effect, an effect from the row factor of gender, and an effect from the column factor of blood lead level.
Use a 0.05 level of significance.
Section 12.3-15Copyright © 2014, 2012, 2010 Pearson Education, Inc.
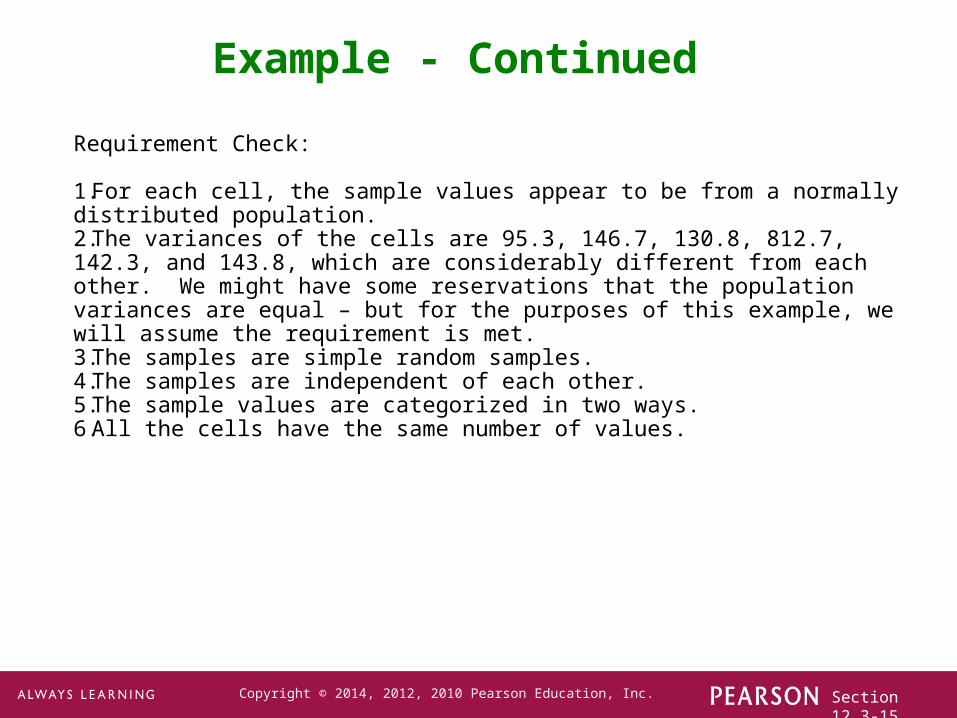
Example - Continued
Requirement Check:
1.For each cell, the sample values appear to be from a normally distributed population.2.The variances of the cells are 95.3, 146.7, 130.8, 812.7, 142.3, and 143.8, which are considerably different from each other. We might have some reservations that the population variances are equal – but for the purposes of this example, we will assume the requirement is met.3.The samples are simple random samples.4.The samples are independent of each other.5.The sample values are categorized in two ways.6.All the cells have the same number of values.

Section 12.3-16Copyright © 2014, 2012, 2010 Pearson Education, Inc.
Example - Continued
The technology output is displayed below:

Section 12.3-17Copyright © 2014, 2012, 2010 Pearson Education, Inc.
Example - Continued
Step 1: Test that there is no interaction between the two factors.
The test statistic is F = 0.43 and the P-value is 0.655, so we fail to reject the null hypothesis.
It does not appear that the performance IQ scores are affected by an interaction between sex and blood lead level.
There does not appear to be an interaction effect, so we proceed to test for row and column effects.

Section 12.3-18Copyright © 2014, 2012, 2010 Pearson Education, Inc.
Example - Continued
Step 2: We now test:
For the row factor, F = 0.07 and the P-value is 0.791. Fail to reject the null hypothesis, there is no evidence that IQ scores are affected by the gender of the subject.
For the column factor, F = 0.10 and the P-value is 0.906. Fail to reject the null hypothesis, there is no evidence that IQ scores are effected by the level of lead exposure.
H0
: There are no effects from the row factor (gender).
H0: There are no effects from the column factor (blood lead level).
Section 12.3-19Copyright © 2014, 2012, 2010 Pearson Education, Inc.
Example - Continued
Interpretation:
Based on the sample data, we conclude that IQ scores do not appear to be affected by sex or blood lead level.

Section 12.3-20Copyright © 2014, 2012, 2010 Pearson Education, Inc.
Caution
Two-way analysis of variance is not one-way analysis of variance done twice.
Be sure to test for an interaction between the two factors.
Section 12.3-21Copyright © 2014, 2012, 2010 Pearson Education, Inc.
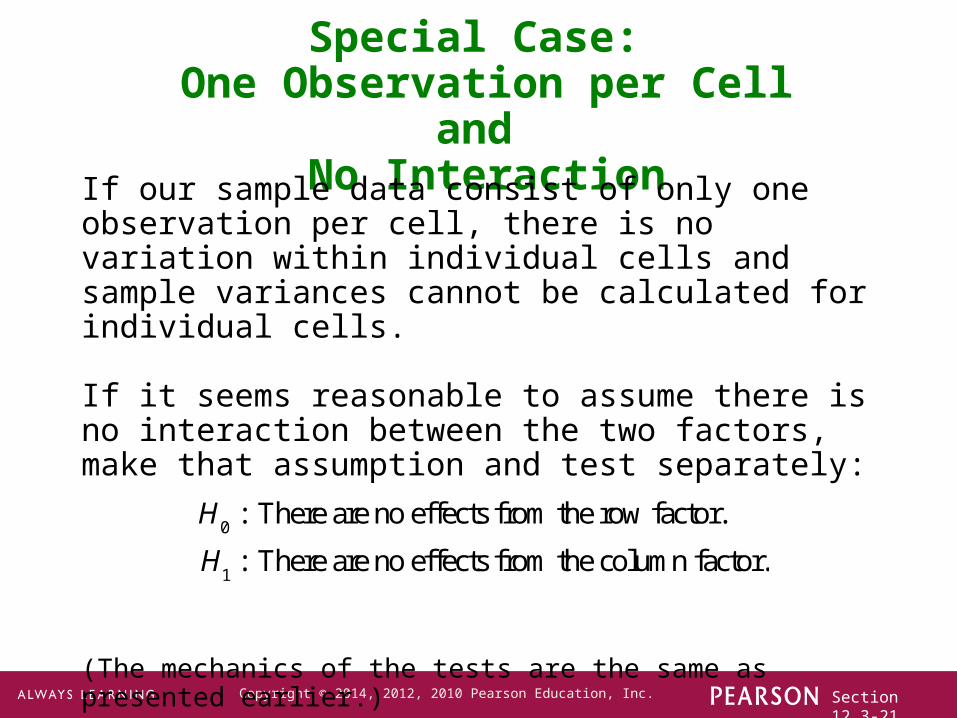
Special Case: One Observation per Cell and
No InteractionIf our sample data consist of only one observation per cell, there is no variation within individual cells and sample variances cannot be calculated for individual cells.
If it seems reasonable to assume there is no interaction between the two factors, make that assumption and test separately:
(The mechanics of the tests are the same as presented earlier.)
H0
: There are no effects from the row factor.
H1
: There are no effects from the column factor.