Embed Size (px)
Citation preview
SECOND QUARTER REPORTFISCAL 2011
2
B C H Y D R O S E C O N D Q U A R T E R R E P O R T – F 2 0 1 1
The Management Discussion and Analysis reports on British Columbia Hydro and Power Authority’s (BC Hydro or the Company) consolidated results and financial position for the three and six months ended September 30, 2010 (fiscal 2011). This section should be read in conjunction with the Management Discussion and Analysis presented in the 2010 Annual Report, the 2010 Annual Consolidated Financial Statements of BC Hydro, and the interim consolidated financial statements of BC Hydro for the three and six months ended September 30, 2010 and 2009. This report contains forward-looking statements, including statements regarding the business and anticipated financial performance of BC Hydro. These statements are subject to a number of risks and uncertainties that may cause actual results to differ from those contemplated in the forward-looking statements.
BC Hydro’s results for the second quarter of fiscal 2011 benefited from lower finance charges and higher energy trading margins than in the same quarter in the prior year. Energy trading margins and overall trade income improved as moderate strengthening of the U.S. dollar in the current fiscal year to date resulted in much smaller foreign exchange losses on U.S. dollar denominated assets as compared to the significant foreign exchange losses experienced in the prior year.
H I G H L I G H T S
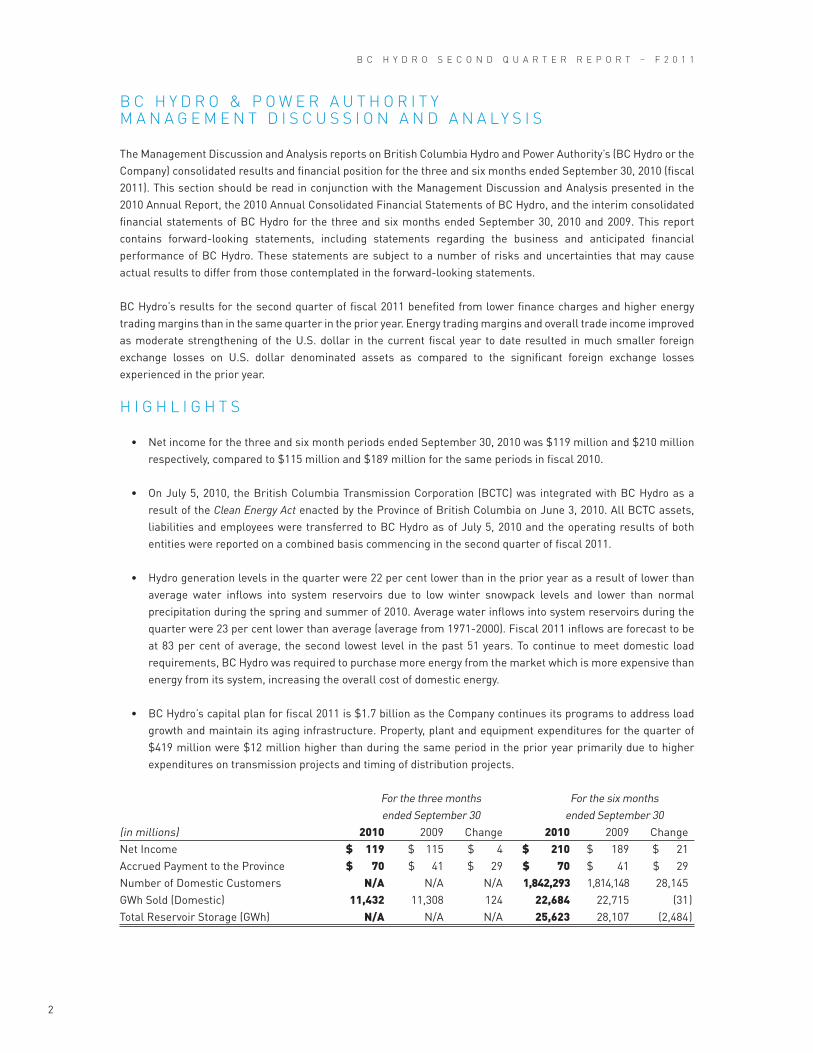
• Net income for the three and six month periods ended September 30, 2010 was $119 million and $210 million respectively, compared to $115 million and $189 million for the same periods in fiscal 2010.
• On July 5, 2010, the British Columbia Transmission Corporation (BCTC) was integrated with BC Hydro as a result of the Clean Energy Act enacted by the Province of British Columbia on June 3, 2010. All BCTC assets, liabilities and employees were transferred to BC Hydro as of July 5, 2010 and the operating results of both entities were reported on a combined basis commencing in the second quarter of fiscal 2011.
• Hydro generation levels in the quarter were 22 per cent lower than in the prior year as a result of lower than average water inflows into system reservoirs due to low winter snowpack levels and lower than normal precipitation during the spring and summer of 2010. Average water inflows into system reservoirs during the quarter were 23 per cent lower than average (average from 1971-2000). Fiscal 2011 inflows are forecast to be at 83 per cent of average, the second lowest level in the past 51 years. To continue to meet domestic load requirements, BC Hydro was required to purchase more energy from the market which is more expensive than energy from its system, increasing the overall cost of domestic energy.
• BC Hydro’s capital plan for fiscal 2011 is $1.7 billion as the Company continues its programs to address load growth and maintain its aging infrastructure. Property, plant and equipment expenditures for the quarter of $419 million were $12 million higher than during the same period in the prior year primarily due to higher expenditures on transmission projects and timing of distribution projects.
For the three months For the six months ended September 30 ended September 30(in millions) 2010 2009 Change 2010 2009 ChangeNet Income $ 119 $ 115 $ 4 $ 210 $ 189 $ 21Accrued Payment to the Province $ 70 $ 41 $ 29 $ 70 $ 41 $ 29Number of Domestic Customers N/A N/A N/A 1,842,293 1,814,148 28,145GWh Sold (Domestic) 11,432 11,308 124 22,684 22,715 (31 )Total Reservoir Storage (GWh) N/A N/A N/A 25,623 28,107 (2,484 )
B C H Y D R O & P O w E R A U T H O R I T YM A N A G E M E N T D I S C U S S I O N A N D A N A L Y S I S
3
B C H Y D R O S E C O N D Q U A R T E R R E P O R T – F 2 0 1 1
CONSOLIDATED RESULTS OF OPERATIONS
As a rate-regulated utility, BC Hydro applies various accounting policies that are acceptable under Canadian generally accepted accounting principles (GAAP) for rate-regulated enterprises but differ from enterprises that do not operate in a rate-regulated environment. These policies allow for the deferral of amounts that under GAAP would otherwise be recorded as expenses or income in the current accounting period. The deferred amounts are either recovered or refunded through future rate adjustments.
Commencing in fiscal 2011, BC Hydro changed its reporting of regulatory account transfers on the Statement of Operations to report individual line items net of transfers to regulatory accounts, as compared to prior years in which net transfers to regulatory accounts were reported as a single separate line item and income was reported both before and after regulatory account transfers. Amounts in the prior year’s comparative statement of operations have been reclassified to conform to the current year’s presentation of changes in regulatory accounts and the current year’s classification of operating expenses. Detail on regulatory account transfers can be found in the MD&A and in Note 4 to the Interim Consolidated Financial Statements.
The transfers to regulatory accounts reflected in net income on the consolidated statement of operations include: variances between forecast amounts from the most recent revenue requirements application and actual results for certain costs, including cost of energy, trade income and finance charges; certain amounts incurred in the current period that are deferred for future recovery in rates (such as demand-side management expenditures and liability provisions); interest accrued on regulatory accounts where allowed; and amortization of regulatory accounts into income.
Effective July 5, 2010, the assets, liabilities and operating results of BCTC and BC Hydro are reported on a consolidated basis. The impact of BCTC’s operations on prior periods was not considered material to the financial statements and therefore BC Hydro’s consolidated financial statements have not been restated to reflect the financial position and results of operations as if the companies had been consolidated since their inception.
Net transfers to regulatory accounts of $190 million for the quarter were mainly to the Heritage Deferral Account (HDA) due to higher than planned market energy purchases due to low water inflows; to the Non-Heritage Deferral Account (NHDA) due to higher purchases for future trade driven by lower market electricity prices, partially offset by lower than planned purchases from Independent Power Producers (IPPs) and higher than planned domestic revenues; additions to the Trade Income Deferral Account (TIDA) for the variance between planned and actual trade income; and expenditures on demand-side management programs (DSM).
Net income for the quarter ended September 30, 2010 was $119 million, an increase of $4 million from the same period in the prior year mainly as a result of higher domestic revenues due to higher average customer rates and an increase in the rate rider, lower operating costs primarily due to lower expenditures for electricity and gas purchases, lower finance charges, and higher trade income. All variances are after the effect of applicable transfers to regulatory accounts.
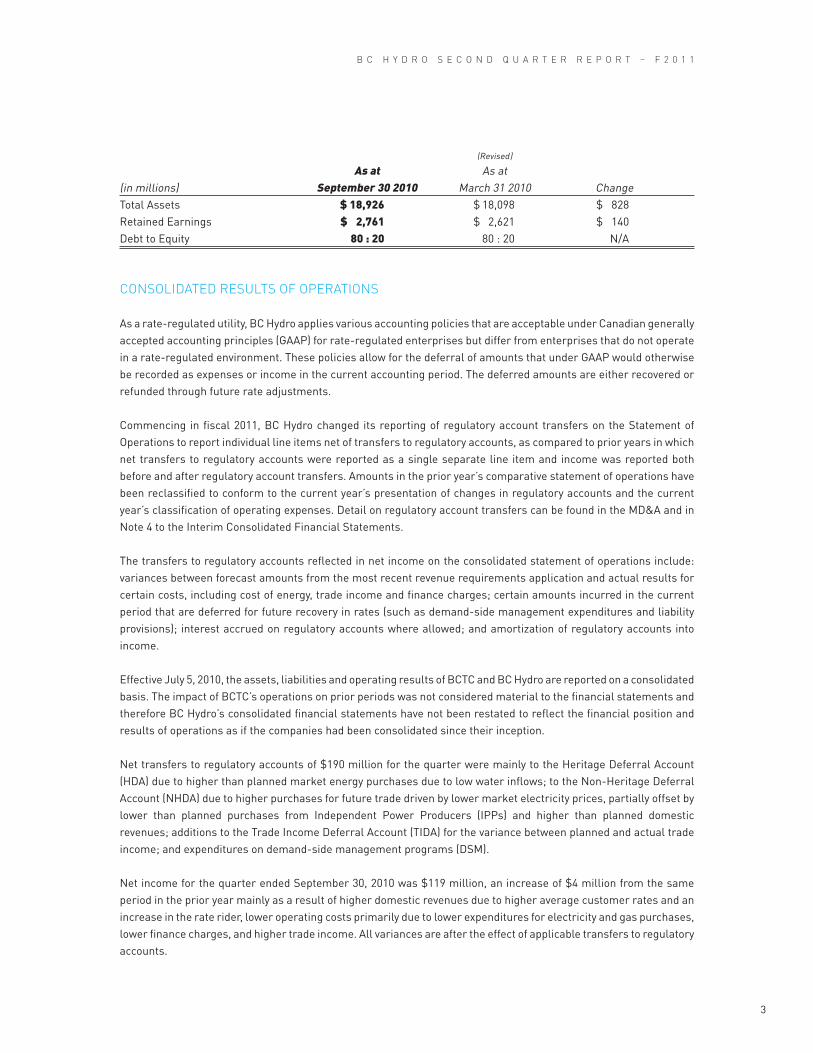
(Revised) As at As at (in millions) September 30 2010 March 31 2010 ChangeTotal Assets $ 18,926 $ 18,098 $ 828Retained Earnings $ 2,761 $ 2,621 $ 140Debt to Equity 80 : 20 80 : 20 N/A
4
B C H Y D R O S E C O N D Q U A R T E R R E P O R T – F 2 0 1 1
For the six months ended September 30, 2010 net transfers to regulatory accounts of $316 million were mainly to the HDA due to higher than planned market energy purchases due to low water inflows; to the NHDA due to lower than planned domestic revenues and higher purchases for future trade driven by lower market electricity prices, partially offset by lower than planned purchases from IPPs; additions to the TIDA for the variance between planned and actual trade income; and expenditures on DSM.
Net income for the six months ended September 30, 2010 was $210 million, an increase of $21 million from the same period in the prior year mainly as a result of higher domestic revenues due to higher average customer rates and an increase in the rate rider, lower operating costs primarily due to lower expenditures for electricity and gas purchases, lower finance charges and higher trade income. All variances are after the effect of applicable transfers to regulatory accounts.
REvENUES
For the three months ended September 30 (in millions) (gigawatt hours) (Revised) (Revised)
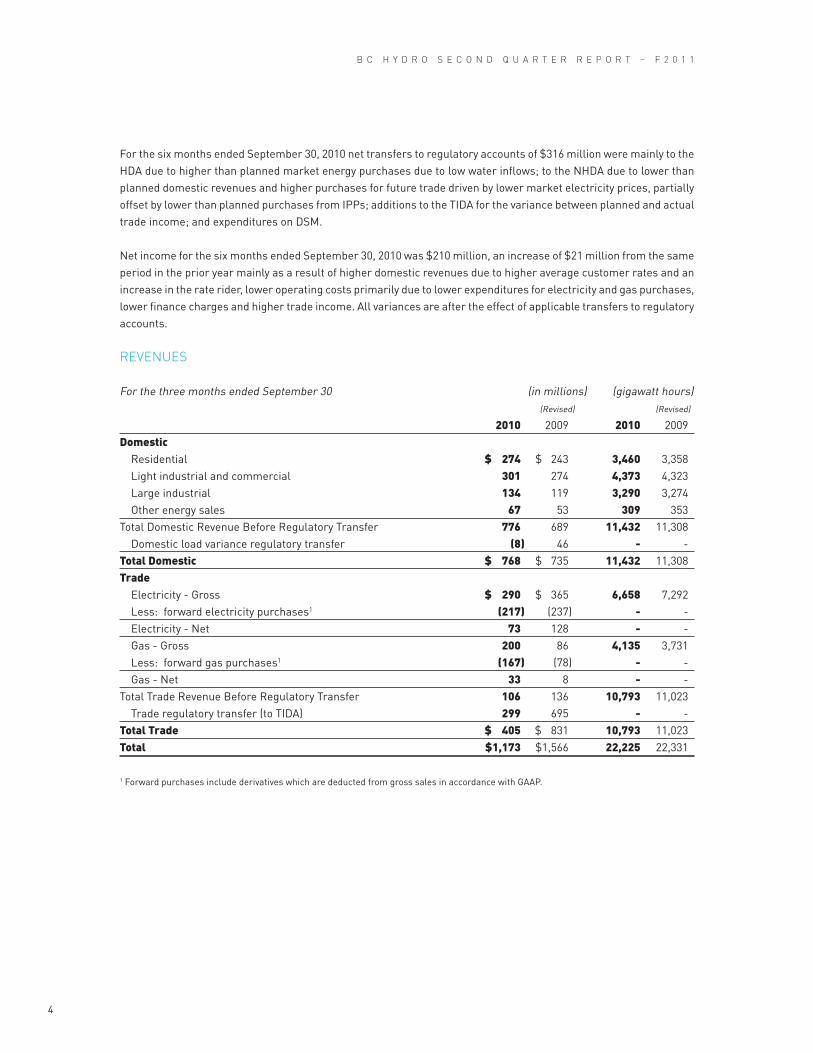
2010 2009 2010 2009Domestic Residential $ 274 $ 243 3,460 3,358 Light industrial and commercial 301 274 4,373 4,323 Large industrial 134 119 3,290 3,274 Other energy sales 67 53 309 353Total Domestic Revenue Before Regulatory Transfer 776 689 11,432 11,308 Domestic load variance regulatory transfer (8 ) 46 - - Total Domestic $ 768 $ 735 11,432 11,308Trade Electricity - Gross $ 290 $ 365 6,658 7,292 Less: forward electricity purchases1 (217 ) (237 ) - - Electricity - Net 73 128 - - Gas - Gross 200 86 4,135 3,731 Less: forward gas purchases1 (167 ) (78 ) - - Gas - Net 33 8 - - Total Trade Revenue Before Regulatory Transfer 106 136 10,793 11,023 Trade regulatory transfer (to TIDA) 299 695 - -Total Trade $ 405 $ 831 10,793 11,023Total $1,173 $1,566 22,225 22,331
1 Forward purchases include derivatives which are deducted from gross sales in accordance with GAAP.
5
B C H Y D R O S E C O N D Q U A R T E R R E P O R T – F 2 0 1 1
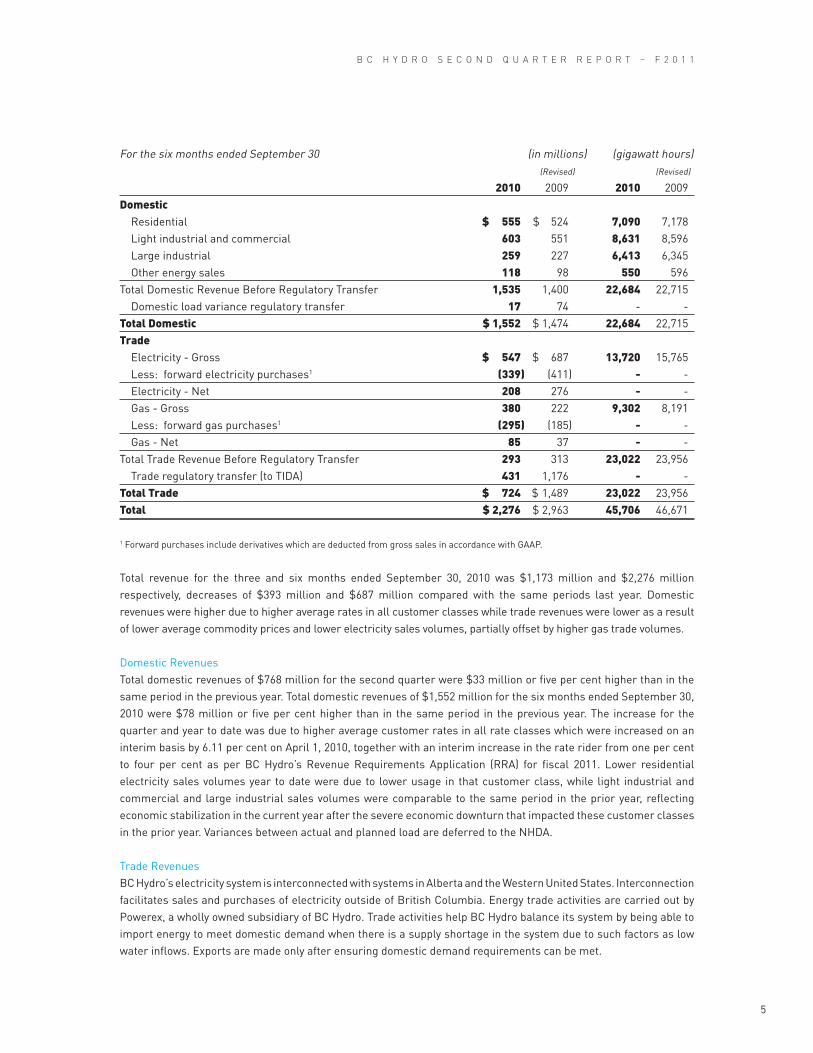
For the six months ended September 30 (in millions) (gigawatt hours) (Revised) (Revised)
2010 2009 2010 2009Domestic Residential $ 555 $ 524 7,090 7,178 Light industrial and commercial 603 551 8,631 8,596 Large industrial 259 227 6,413 6,345 Other energy sales 118 98 550 596Total Domestic Revenue Before Regulatory Transfer 1,535 1,400 22,684 22,715 Domestic load variance regulatory transfer 17 74 - - Total Domestic $ 1,552 $ 1,474 22,684 22,715Trade Electricity - Gross $ 547 $ 687 13,720 15,765 Less: forward electricity purchases1 (339 ) (411 ) - - Electricity - Net 208 276 - - Gas - Gross 380 222 9,302 8,191 Less: forward gas purchases1 (295 ) (185 ) - - Gas - Net 85 37 - - Total Trade Revenue Before Regulatory Transfer 293 313 23,022 23,956 Trade regulatory transfer (to TIDA) 431 1,176 - -Total Trade $ 724 $ 1,489 23,022 23,956Total $ 2,276 $ 2,963 45,706 46,671
1 Forward purchases include derivatives which are deducted from gross sales in accordance with GAAP.
Total revenue for the three and six months ended September 30, 2010 was $1,173 million and $2,276 million respectively, decreases of $393 million and $687 million compared with the same periods last year. Domestic revenues were higher due to higher average rates in all customer classes while trade revenues were lower as a result of lower average commodity prices and lower electricity sales volumes, partially offset by higher gas trade volumes.
Domestic RevenuesTotal domestic revenues of $768 million for the second quarter were $33 million or five per cent higher than in the same period in the previous year. Total domestic revenues of $1,552 million for the six months ended September 30, 2010 were $78 million or five per cent higher than in the same period in the previous year. The increase for the quarter and year to date was due to higher average customer rates in all rate classes which were increased on an interim basis by 6.11 per cent on April 1, 2010, together with an interim increase in the rate rider from one per cent to four per cent as per BC Hydro’s Revenue Requirements Application (RRA) for fiscal 2011. Lower residential electricity sales volumes year to date were due to lower usage in that customer class, while light industrial and commercial and large industrial sales volumes were comparable to the same period in the prior year, reflecting economic stabilization in the current year after the severe economic downturn that impacted these customer classes in the prior year. Variances between actual and planned load are deferred to the NHDA.
Trade Revenues BC Hydro’s electricity system is interconnected with systems in Alberta and the Western United States. Interconnection facilitates sales and purchases of electricity outside of British Columbia. Energy trade activities are carried out by Powerex, a wholly owned subsidiary of BC Hydro. Trade activities help BC Hydro balance its system by being able to import energy to meet domestic demand when there is a supply shortage in the system due to such factors as low water inflows. Exports are made only after ensuring domestic demand requirements can be met.
6
B C H Y D R O S E C O N D Q U A R T E R R E P O R T – F 2 0 1 1
Gross trade revenue for the second quarter ended September 30, 2010 increased by $39 million from the same period in the prior year mainly due to an increase of $114 million in gross gas revenue. The increase in gross gas revenue was primarily due to a 54 per cent increase in average gas prices, resulting from high demand for summer cooling in the eastern U.S., and an 11 per cent increase in gas sales volumes. This increase was partly offset by a decrease of $75 million in gross electricity revenue, driven by a 17 per cent decrease in the average electricity sale price and a nine per cent decrease in electricity sales volumes, both due to low demand in California stemming from the economic downturn and a cool summer along the U.S. west coast. Deducted from the gross trade revenue figures above are forward purchases, which saw a net increase of $69 million over the prior year, driven by an increase of $89 million in forward gas activities, partly offset by a decrease of $20 million in forward electricity activities. Forward purchases are deducted from gross trade revenue, which includes forward sales, in order to report the results of forward transactions on a net basis in accordance with GAAP.
Gross trade revenue for the six months ended September 30, 2010 increased by $18 million from the same period in the prior year due to an increase in gas revenue, partially offset by a decrease in electricity revenue. The increase in gross gas revenue of $158 million was primarily driven by a 29 per cent increase in average gas sales prices. In addition, gas sales volumes increased by 14 per cent over the prior year. The decrease in gross electricity revenue of $140 million was due to a 13 per cent decrease in electricity sales volumes and a 10 per cent decrease in the average electricity sale price. The decrease in electricity volumes and prices was primarily a result of low demand in California due to the economic downturn and a cool summer. Deducted from gross trade revenue are forward purchases, which increased by a net $38 million compared to the prior year, primarily due to an increase in forward gas activities. Forward transactions are reported on a net basis in accordance with GAAP.
OPERATING COSTS
In fiscal 2011, BC Hydro changed its classification of operating expenses to a presentation of costs based on the nature of the expenditures. Amounts previously reported as operations, maintenance and administration are now classified by the nature of the expense as outlined in Note 8 in the Interim Consolidated Financial Statements.
For the three and six months ended September 30, 2010, total operating costs of $941 million and $1,849 million were $380 million and $668 million lower, respectively, than in the same periods in the prior year. The decrease is primarily due to a reduction in the cost of energy as a result of lower electricity and gas market purchases, partially offset by increases in expenditures related to personnel during both the three and six months ended September 30, 2010, and increase in materials and services and lower capitalized overhead costs.
Cost of energyEnergy costs are influenced primarily by the volume of energy consumed by customers, the mix of sources of supply and market prices of energy. The mix of sources of supply is influenced by variables such as the current and forecast market prices of energy, water inflows, reservoir levels, energy demand, and environmental and social impacts.
7
B C H Y D R O S E C O N D Q U A R T E R R E P O R T – F 2 0 1 1
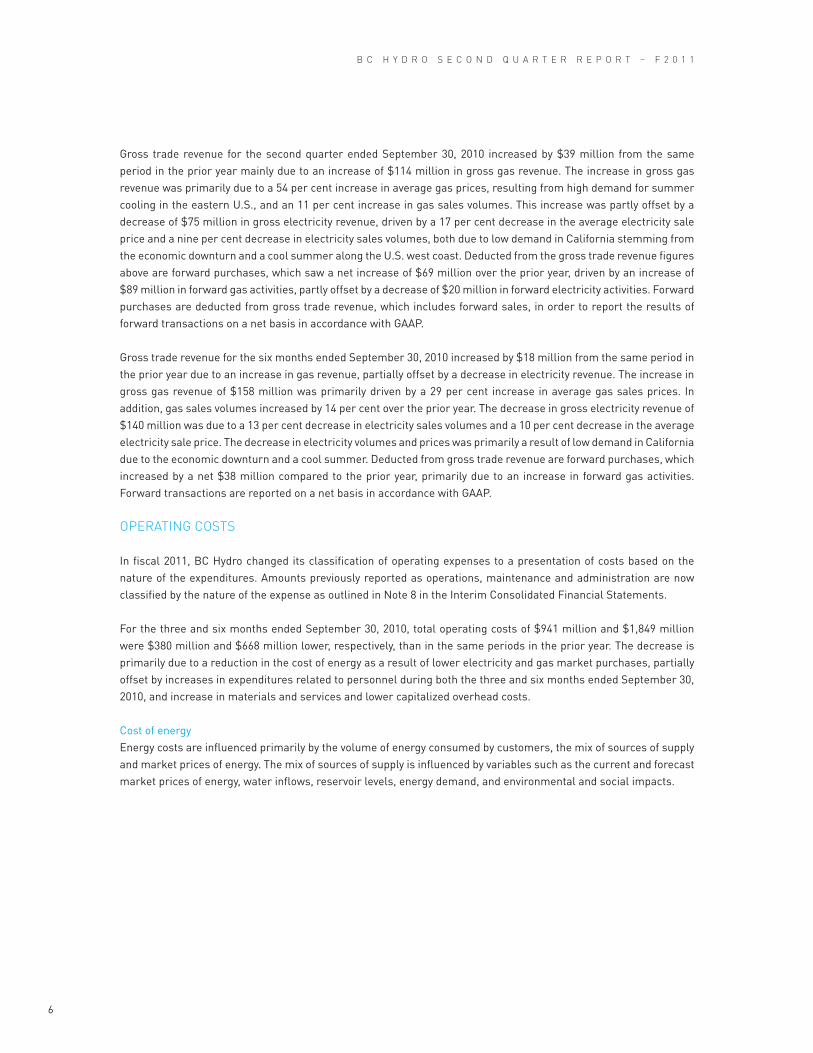
Energy costs are comprised of the following sources of supply:
For the three months ended September 30 (in millions) (gigawatt hours) ($ per MWh) (Revised) (Revised) (Revised)
2010 2009 2010 2009 20102 20092
Domestic Water rental payments $ 56 $ 62 7,138 9,110 $ 7.91 $ 6.67 Purchases from Independent Power Producers 206 115 3,440 2,004 59.77 57.34 Other electricity purchases - Domestic 63 21 1,639 602 38.35 34.74 Gas for thermal generation 11 15 155 194 73.65 77.32 Transmission charges and other expenses 3 25 72 22 - - Allocation to/from trade energy 7 26 133 570 43.86 33.30 Total Domestic Cost of Energy Before RegulatoryTransfers 346 264 12,577 12,502 27.50 21.11 Domestic cost of energy regulatory transfers (111 ) (67 ) - - - - Total Domestic $ 235 $ 197 12,577 12,502 $ 27.50 $ 21.11 Trade Electricity - Gross $ 240 $ 312 8,597 7,668 $ 27.92 $ 40.69 Less: forward electricity purchases1 (217 ) (237 ) - - - - Electricity - Net 23 75 - - - - Remarketed gas - Gross 177 102 4,029 3,968 43.93 25.71 Less: forward gas purchases1 (167 ) (78 ) - - - - Other gas purchases - Trade - Net 10 24 - - - - Transmission charges and other expenses 41 56 - - - - Allocation to/from domestic energy (7 ) (26 ) (133 ) (570 ) 43.86 33.30Total Trade Cost of Energy Before RegulatoryTransfers 67 129 12,493 11,066 29.53 33.13 Trade cost of energy regulatory transfers 262 638 - - - -Total Trade $ 329 $ 767 12,493 11,066 $ 50.49 $ 90.79Total Energy Costs $ 564 $ 964 25,070 23,568 $ 34.54 $ 50.98
1 Other electricity purchases in dollars include purchases for trade activities shown net of derivatives. Gigawatt hours (GWh) and $ per Megawattt hour (MWh) are shown at gross cost.
2 Total cost per MWh includes other electricity purchases at gross cost.
8
B C H Y D R O S E C O N D Q U A R T E R R E P O R T – F 2 0 1 1
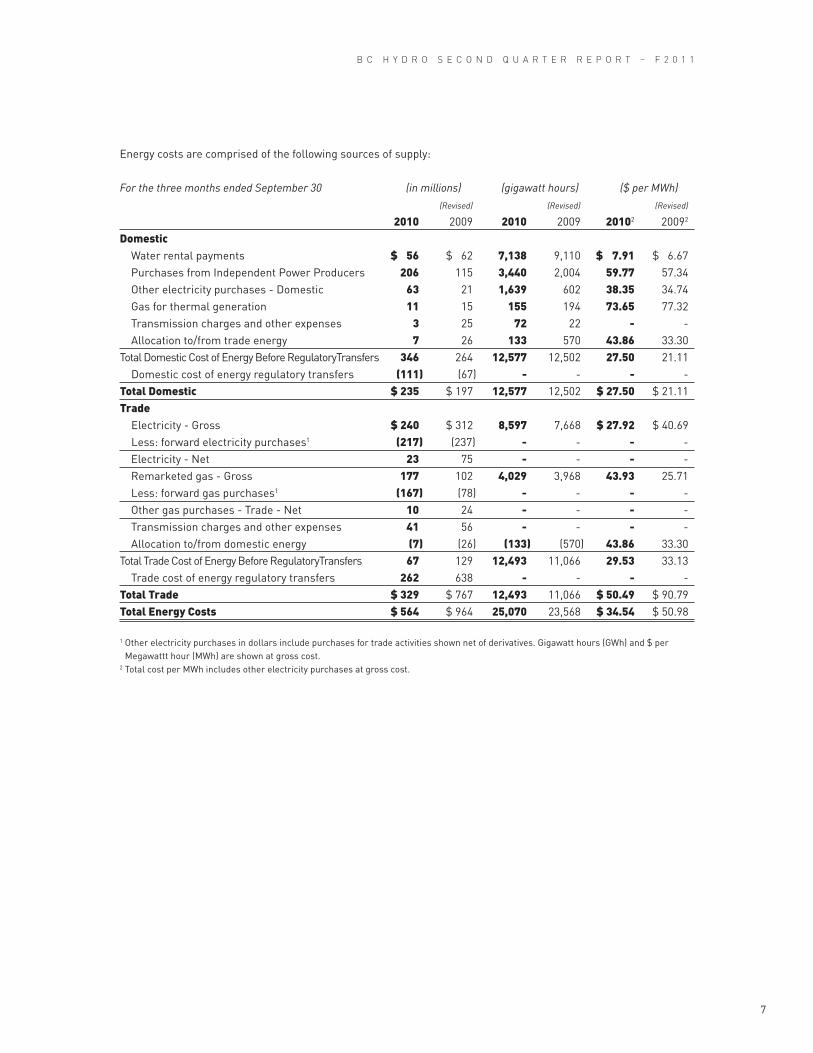
For the six months ended September 30 (in millions) (gigawatt hours) ($ per MWh) (Revised) (Revised) (Revised)
2010 2009 2010 2009 20102 20092
Domestic Water rental payments $ 120 $ 121 15,278 17,830 $ 8.13 $ 6.75 Purchases from Independent Power Producers 354 228 5,964 3,817 59.29 59.73 Other electricity purchases - Domestic 84 46 2,316 1,392 36.21 32.70 Gas for thermal generation 21 25 276 256 77.59 99.33 Transmission charges and other expenses 24 37 557 48 - - Allocation to/from trade energy 32 51 752 1,445 40.84 31.89Total Domestic Cost of Energy Before RegulatoryTransfers 635 508 25,143 24,788 $ 25.25 20.49 Domestic cost of energy regulatory transfers (136 ) (43 ) - - - - Total Domestic $ 499 $ 465 25,143 24,788 $ 19.83 $ 18.75Trade Electricity - Gross $ 440 $ 580 14,176 16,991 $ 31.04 $ 34.14 Less: forward electricity purchases1 (339 ) (411 ) - - - - Electricity - Net 101 169 - - - - Remarketed gas - Gross 348 240 9,279 8,537 37.50 28.11 Less: forward gas purchases1 (295 ) (185 ) - - - - Other gas purchases - Trade - Net 53 55 - - - - Transmission charges and other expenses 94 123 - - - - Allocation to/from domestic energy (32 ) (51 ) (752 ) (1,445 ) 40.84 31.89Total Trade Cost of Energy Before RegulatoryTransfers 216 296 22,703 24,083 $ 32.58 $ 29.37 Trade cost of energy regulatory transfers 367 1,063 - - - -Total Trade $ 583 $ 1,359 22,703 24,083 $ 48.74 $ 73.51Total Energy Costs $ 1,082 $ 1,824 47,846 48,871 $ 33.56 $ 45.74
1 Other electricity purchases in dollars include purchases for trade activities shown net of derivatives. Gigawatt hours (GWh) and $ per Megawattt hour (MWh) are shown at gross cost.
2 Total cost per MWh includes other electricity purchases at gross cost.
Total energy costs, after regulatory account transfers, for the second quarter were $564 million, 41 per cent lower than the same period last year. For the six months ended September 30, 2010 total energy costs after regulatory account transfers were $1,082 million, or 41 per cent lower than the same period last year. The decrease was primarily due to lower purchases of electricity for trade, partially offset by higher domestic energy purchases from Independent Power Producers (IPPs) and increased market energy purchases due to low water inflows in the current year.
Domestic Energy CostsDomestic energy costs before regulatory transfers of $346 million for the second quarter were 31 per cent higher than in the same period in the prior year. Domestic energy costs before regulatory transfers of $635 million for the six months ended September 30, 2010 were 25 per cent higher than in the same period in the prior year. The increases in both the quarter and year to date were mainly due to higher purchases from IPPs, primarily two new bio-energy projects which started in late fiscal 2010, agreements in the current year to purchase additional energy from two existing IPPs, and increased purchases from Alcan that BC Hydro was required to make due to Alcan’s reduced smelter load. Water rental costs were lower in the quarter due to lower generation levels resulting from low inflows, and comparable year to date as an 8.74 per cent increase on water rental fees and additional water rental fees associated with the one-third interest in the Waneta dam and generating facility acquired in March 2010 was offset by the impact of lower generation levels. Market electricity purchases were higher in both the quarter and year to date as the reduced generation levels resulting from lower water inflows required BC Hydro to purchase energy from the market to meet domestic load requirements. Variances between actual and planned domestic cost of energy are transferred to the HDA, NHDA and BCTC Deferral Account (BCTCDA).
9
B C H Y D R O S E C O N D Q U A R T E R R E P O R T – F 2 0 1 1
Trade Energy Costs In the second quarter, gross trade energy costs increased by $7 million from the same period in fiscal 2010, mainly due to an increase of $75 million in gross gas purchases partly offset by a $72 million decrease in gross electricity purchases. The increase in gross gas purchases during the quarter reflects a 70 per cent increase in average gas purchase prices, resulting from high demand for summer cooling in the eastern U.S. The decrease in gross electricity purchases is primarily a result of a 31 per cent decrease in average electricity purchase prices, due to low demand in California stemming from the economic downturn and a cool summer along the U.S. west coast. Included in the figures above is a net increase of $69 million in forward purchases, which are deducted from gross trade energy costs, and netted against forward sales within gross trade revenue in accordance with GAAP.
Gross trade energy costs for the six months ended September 30, 2010 decreased by $42 million from the same period in fiscal 2010 primarily due to a $140 million decrease in gross electricity purchases for trade, partially offset by a $108 million increase in gross gas purchases. Gross electricity purchases reflect a 17 per cent decrease in electricity purchase volumes and a nine per cent decrease in average electricity purchase prices; as with electricity sales, this is primarily due to the economic downturn and a cool summer, which reduced demand in California. The increase in remarketed gas purchase costs was driven by a 33 per cent increase in average gas purchase prices and a nine per cent increase in gas purchase volumes. As with gas sales, the increased average gas purchase price reflects increased demand over the summer period in the eastern U.S. Deducted from gross trade energy costs are forward purchases, which increased by a net $38 million compared to the prior year. Forward purchases are netted against forward sales within gross revenue in accordance with GAAP.
Water InflowsWater inflows into BC Hydro’s reservoirs in the second quarter of fiscal 2011 were 23 per cent below average (average from 1971—2000). Based on the September 2010 energy study, fiscal 2011 inflows are projected to be about 83 per cent of average, the second lowest in the past 51 years.
The BC Hydro reservoirs have been managed such that the combined storage in BC Hydro reservoirs at September 30, 2010 was 94 per cent of average (average 1986—2010), with the Williston reservoir on the Peace River system at 78 per cent of average, and the Kinbasket reservoir on the Columbia River system at 116 per cent of average. There is negligible risk of spill at Williston and Kinbasket reservoirs for the balance of the fiscal year.
Personnel ExpensesPersonnel expenses include labour, benefits and employee future benefits. Personnel costs after net regulatory transfers of $140 million for the quarter and $271 million for the six months ended September 30, 2010 were $22 million and $35 million higher, respectively, than in the same periods in the prior year primarily due to higher non-current pension costs.
Materials and External ServicesMaterials and external services include expenditures for operating and maintenance materials and services provided by third parties. The overall decrease in materials and external services expenditures of $4 million for the second quarter and increase of $8 million for the six months ended September 30, 2010 as compared to the same periods in the prior year are mainly due to changes in levels of maintenance and other operational activities.
Amortization and DepreciationAmortization and depreciation expense includes the depreciation of property, plant and equipment, intangible assets, asset retirement obligation (ARO) assets, amortization of customer contributions and the amortization of certain regulatory assets and liabilities where applicable. For the three and six month periods ended September 30, 2010, amortization and depreciation expense was $128 million and $251 million respectively, compared with $121 million and $240 million in the same periods in the prior year. The increase was primarily due to higher assets in service as a result of BC Hydro’s capital expenditure program, after deferring in the regulatory account the variance in actual amortization of capital asset additions as compared to plan, partially offset by lower net regulatory account amortization due to the changes in the composition of the regulatory accounts.
1 0
B C H Y D R O S E C O N D Q U A R T E R R E P O R T – F 2 0 1 1
Grants and TaxesAs a Crown Corporation, BC Hydro is exempt from paying federal and provincial income taxes, but pays local government taxes and grants in lieu to municipalities and regional districts. Total grants, school taxes and other local taxes of $45 million for the quarter and $90 million for the six months ended September 30, 2010 reflect increases of $2 million and $4 million, respectively, over the same periods in the prior year.
Capitalized CostsCapitalized costs are capital supporting overhead costs transferred from operating costs to property, plant and equipment. Capitalized costs for the three and six month periods ended September 30, 2010 are $76 million and $125 million respectively, compared to $73 million and $142 million for the same periods in the prior year. The differences are primarily due to a change in the allocation of capitalized overhead costs among quarters during a fiscal year. Prior to fiscal 2011, BC Hydro allocated capitalization of overhead costs among quarters during a fiscal year on a straight-line basis. In fiscal 2011, overhead costs are allocated based on actual levels of capital expenditures during each period.
FINANCE CHARGES
Finance charges of $113 million for the second quarter and $217 million for the six months ended September 30, 2010 were $17 million and $40 million lower, respectively, than in the same periods in the prior year. Finance charges before regulatory account transfers were higher in the quarter than in the prior year due to a higher average volume of debt, foreign exchange translation losses on net unhedged U.S. dollar exposures as a result of the strengthening Canadian dollar against the U.S. dollar in the same period in the prior year and higher other finance charges. For the six months ended September 30, 2010 finance charges before regulatory account transfers were higher than the prior year due to foreign exchange translation losses on net unhedged U.S. dollar exposures in the current year due to a weakening of the Canadian dollar against the U.S. dollar as compared with a significant strengthening in the prior year which resulted in translation gains, higher average volume of debt and higher other finance charges. Variances between actual and planned finance charges are transferred to the Foreign Exchange Gains and Losses Regulatory Account and the Finance Charges Regulatory Account.
REGULATORY TRANSFERS
BC Hydro has established various regulatory accounts with the approval of the British Columbia Utilities Commission (BCUC). Regulatory accounts allow BC Hydro to defer certain types of revenue and cost variances through transfers to and from the accounts which have the effect of adjusting net income. The deferred amounts are then included in customer rates in future periods, subject to approval by the BCUC.
The net change in regulatory accounts on the consolidated statement of operations includes: 1) the deferral of differences between planned and actual results for cost of energy (including variances related to load), trade income, finance charges and non-current pension costs; 2) costs deferred for future recovery in rates, such as costs for DSM; and 3) interest accrued on regulatory accounts, where allowed, and amortization of regulatory accounts.
1 1
B C H Y D R O S E C O N D Q U A R T E R R E P O R T – F 2 0 1 1
Regulatory transfers are comprised of the following:
For the three months For the six months ended September 30 ended September 30 (in millions) 2010 2009 2010 2009Variances between forecast and actual costs Energy deferral accounts $ 142 $ 163 $ 223 $ 206 Finance charges (3 ) (39 ) (16 ) (78 ) Non-current pension deferral - 22 - 43 Other (13 ) (36 ) (11 ) (43 ) 126 110 196 128Deferral of costs for future recovery in rates Demand Side Management 25 22 50 43 Return on Equity - 14 - 28 Other 25 23 48 48 50 59 98 119Amortization of regulatory accounts 4 (15 ) 5 (33 )Interest on regulatory accounts 10 9 17 18Net change in regulatory accounts $ 190 $ 163 $ 316 $ 232
For the three and six months ended September 30, 2010, BC Hydro transferred, on a net basis, $190 million and $316 million to regulatory accounts, compared with the transfer of $163 million and $232 million to the regulatory accounts during the same periods last year. The majority of the transfers relate to the cost of energy deferral accounts. The net asset balance in the regulatory asset and liability accounts as at September 30, 2010 was an asset of $2,054 million compared to $1,713 million at March 31, 2010.
The significant transfers to the energy deferral accounts reflect lower than planned domestic revenues due to lower consumption, higher energy purchase costs as purchases for future trade which were increased to take advantage of low market energy prices, higher market energy purchases due to low water inflows, and lower than planned trade income due to low price spreads caused by lower commodity prices for electricity and natural gas. The finance charges deferral reflects a positive variance on short-term interest rates, but to a lesser extent than in the prior year. Non-current pension costs are on plan in the current period as compared to the first half of fiscal 2010 when they were significantly higher than planned due to the net actuarial loss experienced by the BC Hydro pension plan in fiscal 2009. The change in amortization of regulatory accounts reflects the changing composition of the balances subject to amortization.
INTERNATIONAL FINANCIAL REPORTING STANDARDS (IFRS)
On February 13, 2008, the Canadian Accounting Standards Board (AcSB) confirmed the adoption of IFRS in place of Canadian GAAP for publicly accountable enterprises. The new requirements are effective for interim and annual reporting periods beginning on or after January 1, 2011. In October 2009, the Canadian Public Sector Accounting Board (PSAB) confirmed the existing guidance whereby Government Business Enterprises (GBEs), which BC Hydro is classified as, adhere to standards for publicly accountable enterprises in the private sector. The Company is currently evaluating the impact of the transition to IFRS on its consolidated financial statements. Areas with significant differences between IFRS and Canadian GAAP that would impact BC Hydro include: Regulatory Accounting, Property, Plant & Equipment, Provisions and Contingent Liabilities, Employee Benefits, and the overall presentation of financial statements. The initial adoption of IFRS under IFRS 1, First-time Adoption of International Financial Reporting Standards, would also result in a number of significant changes.
1 2
B C H Y D R O S E C O N D Q U A R T E R R E P O R T – F 2 0 1 1
Accounting for rate-regulated activities is currently under consideration by the International Accounting Standards Board (IASB). The IASB has not developed transitional guidance for use by first-time IFRS adopters with rate-regulated activities that would be adopting IFRS in 2011. In 2010, the AcSB issued guidance allowing qualifying entities with rate-regulated activities be permitted, but not required, to continue applying the accounting standards in Part V of the CICA Handbook – Accounting for an additional year rather than adopting IFRS for annual periods beginning on or after January 1, 2011. BC Hydro will use the deferral option.
PAYMENT TO THE PROvINCE
Under a Special Directive from the Province, BC Hydro is required to make an annual payment to the Province (the Payment) on or before June 30 of each year. The Payment is equal to 85 per cent of BC Hydro’s distributable surplus for the most recently completed fiscal year assuming that the debt to equity ratio, as defined by the Province, after deducting the Payment, is not greater than 80:20. If the Payment would result in a debt to equity ratio exceeding 80:20, then the Payment will be based on the greatest amount that can be paid without causing the debt to equity ratio to exceed 80:20. The dividend accrued year to date at September 30, 2010 is $70 million, which is below 85 per cent of the distributable surplus due to the 80:20 cap.
LEGAL PROCEEDINGS
Since 2000, Powerex has been named, along with other energy providers, in lawsuits and U.S. federal regulatory proceedings which seek refunds, damages and/or contract rescissions based on allegations that, during part of 2000 and 2001, the California wholesale electricity markets were unlawfully manipulated and energy prices were not just and reasonable. At September 30, 2010, Powerex was owed US $265 million (CDN $273 million) by the California Power Exchange and the California Independent System Operator related to Powerex’s trade activities in California during the period covered by the lawsuits. It is expected those receivables will be offset against any refunds that Powerex is required to pay.
Due to the ongoing nature of the regulatory and legal proceedings against Powerex, management cannot predict the outcomes of the claims against Powerex. Powerex has recorded provisions for uncollectible amounts and legal costs associated with the California energy crisis. These provisions are based on management’s best estimates, and are intended to adequately provide for any exposure. However, the amounts that are ultimately collected or paid may differ from management’s current estimates. Management has not disclosed the provision amounts or ranges of expected outcomes due to the potentially adverse effect on the process.
REGULATION
Revenue Requirement ApplicationIn the process of regulating and setting rates for BC Hydro, the BCUC must ensure that the rates are sufficient to allow BC Hydro to provide reliable electricity service, meet its financial obligations, comply with government policy and achieve a certain return on equity (ROE). The annual rate of ROE is equal to the pre-income tax annual rate of return allowed by the BCUC to the most comparable investor-owned energy utility regulated under the Utilities Commission Act with a 1.63 per cent adder for the fiscal 2010, 2011 and 2012 years. This is in accordance with Heritage Special Direction No. HC2 as amended by Order in Council No. 074 dated February 17, 2009. The allowed rate of ROE for fiscal 2011 is 14.37 per cent, and is higher than the prior year’s allowed rate of 13.05 per cent due to the higher rate of return allowed for Terasen Gas Inc., upon which BC Hydro’s rate of return is based.
BC Hydro’s fiscal 2011 RRA was filed with the BCUC on March 3, 2010 requesting a 6.11 per cent rate increase. The rate increase is attributable to the ongoing implementation of a significant capital program to refurbish BC Hydro’s aging assets, an increase in the ROE, higher costs associated with BC Hydro’s pension plan reflecting the impact of
1 3
B C H Y D R O S E C O N D Q U A R T E R R E P O R T – F 2 0 1 1
market conditions on the valuation of plan assets, and expected lower trade income due to weaker export market conditions. BC Hydro also requested that the rate rider increase by three per cent to partly recover the net balances of the energy deferral accounts. The rate increases were approved by the BCUC on an interim basis effective April 1, 2010 and are applied to bill customers and recognize revenue in fiscal 2011. An Evidentiary Update was filed with the BCUC on July 9, 2010 proposing to defer recovery in fiscal 2011 of higher than previously forecast energy costs. A Negotiated Settlement Process (NSP) started in September 2010 but failed to reach an agreement. Although the NSP failed to achieve a settlement and the BCUC confirmed an oral hearing would start on December 13, BC Hydro continued informal discussions with NSP participants. This has now resulted in a settlement being achieved, and the oral hearing cancelled. BC Hydro and NSP participants are currently finalizing the wording of the settlement agreement, which will be submitted to the BCUC for approval. Such approval is expected around late November or early December. Until the RRA is approved, BC Hydro bills its customers and recognizes revenue in its consolidated financial statements based on approved interim adjustments to the rates and the rate rider. Any changes in the final approved rates will be accounted for on a prospective basis.
Hugh Keenleyside Spillway Gates ProjectBC Hydro filed an application with the BCUC on July 16, 2010 for acceptance of an estimated $90 million of expenditures associated with the Hugh Keenleyside Spillway Gates project. The spillway gate system needs to be refurbished and upgraded to ensure that it can reliably pass water in a flood event or post-earthquake reservoir drawdown. A written review process concluded on October 15, 2010. A decision by the BCUC is expected in late fall.
Columbia Valley Transmission ProjectAn application for a Certificate of Public Convenience and Necessity (CPCN) was filed by BCTC on January 22, 2010 to construct new transmission lines, a new substation and modifications to existing substations in the upper Columbia Valley region at an estimated cost of $154 million. A written process to review the application was completed at the end of June. The BCUC issued a CPCN on September 3, 2010.
Interior to Lower Mainland Transmission (ILM) ProjectThe BCUC is reconsidering the ILM application for the purpose of determining the adequacy of First Nations consultation on this project from 2006 up to the point when the CPCN was issued in August 2008. Construction on this project has been suspended, pending a decision on this matter.
First Nation groups applied to the British Columbia Supreme Court for judicial review of the decision in June 2009 granting an Environmental Assessment Certificate (EAC) for the project. A formal hearing on this matter has been scheduled for November 29, 2010 and a decision will follow.
BCTC Fiscal 2011 Transmission Revenue Requirement (TRR) and Rate Change ApplicationOn March 4, 2010, BCTC filed an application for approval of its fiscal 2011 rates. A revenue sufficiency was forecast for fiscal 2011 which results in a one per cent reduction from the fiscal 2010 approved TRR. Interim refundable rates were approved by the BCUC effective April 1, 2010.
Following a written process to review the application, on August 19, 2010, the BCUC approved key components of the fiscal 2011 TRR and directed BC Hydro to file finalized Transmission Rates once a decision has been issued regarding BC Hydro’s fiscal 2011 RRA.
1 4
B C H Y D R O S E C O N D Q U A R T E R R E P O R T – F 2 0 1 1
LIQUIDITY AND CAPITAL RESOURCES
Cash flow provided by operating activities for the second quarter was $40 million, compared with cash flow used by operating activities of $69 million for the same period last year. For the six months ended September 30, 2010, cash flow provided by operating activities was $153 million, compared with cash flow used by operating activities of $34 million in the same period last year. The increases in both periods were primarily due to an increase in net income, regulatory account transfers, amortization expense, and unrealized gains on mark-to-market financial instruments and changes in working capital relative to the prior year.
The long-term debt balance net of sinking funds at September 30, 2010 was $11,464 million, compared with $10,705 million at March 31, 2010. The increase was mainly a result of net long-term bond issues totaling $513 million ($520 million par value), an increase in revolving borrowings of $236 million and net foreign exchange revaluation losses of $17 million, partially offset by $8 million for the amortization of premium. The increase in revolving borrowings was due to the funding of capital expenditures and the Payment to the Province.
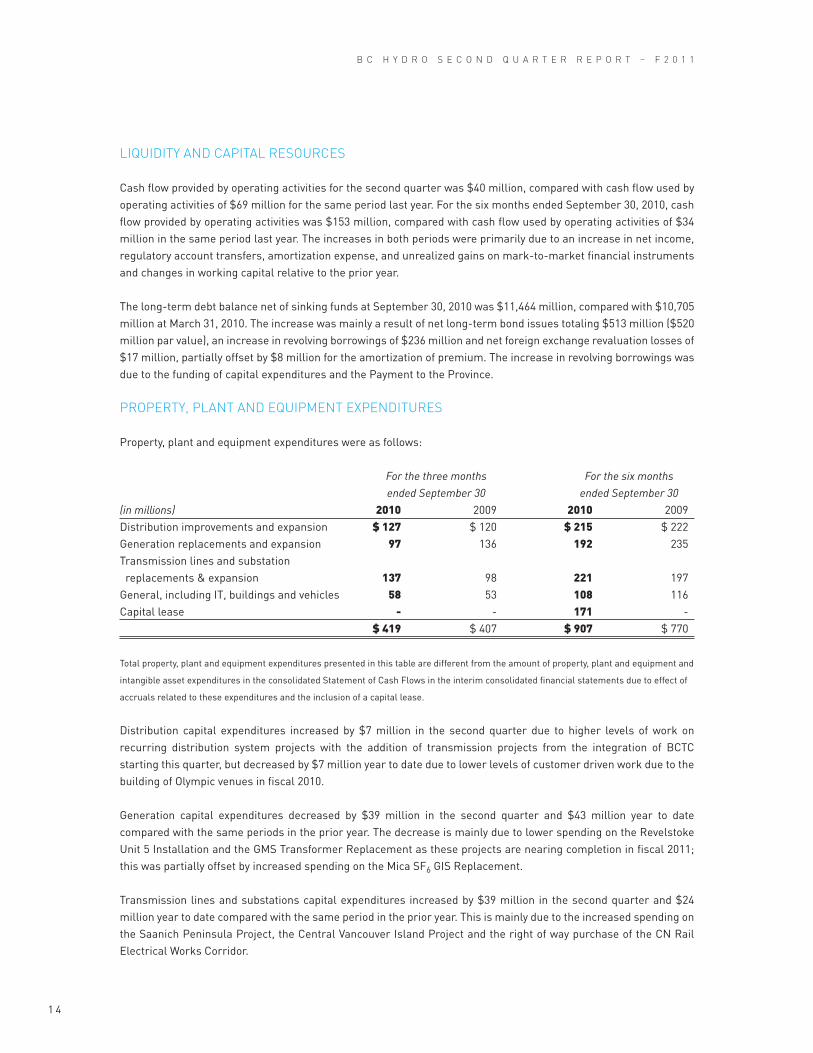
PROPERTY, PLANT AND EQUIPMENT EXPENDITURES
Property, plant and equipment expenditures were as follows:
For the three months For the six months ended September 30 ended September 30 (in millions) 2010 2009 2010 2009Distribution improvements and expansion $ 127 $ 120 $ 215 $ 222 Generation replacements and expansion 97 136 192 235Transmission lines and substation replacements & expansion 137 98 221 197General, including IT, buildings and vehicles 58 53 108 116Capital lease - - 171 - $ 419 $ 407 $ 907 $ 770
Total property, plant and equipment expenditures presented in this table are different from the amount of property, plant and equipment and
intangible asset expenditures in the consolidated Statement of Cash Flows in the interim consolidated financial statements due to effect of
accruals related to these expenditures and the inclusion of a capital lease.
Distribution capital expenditures increased by $7 million in the second quarter due to higher levels of work on recurring distribution system projects with the addition of transmission projects from the integration of BCTC starting this quarter, but decreased by $7 million year to date due to lower levels of customer driven work due to the building of Olympic venues in fiscal 2010.
Generation capital expenditures decreased by $39 million in the second quarter and $43 million year to date compared with the same periods in the prior year. The decrease is mainly due to lower spending on the Revelstoke Unit 5 Installation and the GMS Transformer Replacement as these projects are nearing completion in fiscal 2011; this was partially offset by increased spending on the Mica SF6 GIS Replacement.
Transmission lines and substations capital expenditures increased by $39 million in the second quarter and $24 million year to date compared with the same period in the prior year. This is mainly due to the increased spending on the Saanich Peninsula Project, the Central Vancouver Island Project and the right of way purchase of the CN Rail Electrical Works Corridor.
1 5
B C H Y D R O S E C O N D Q U A R T E R R E P O R T – F 2 0 1 1
In accordance with Canadian GAAP, the costs of the energy purchase agreement (EPA) with Island Co-Generation (ICG) of $171 million are accounted for as a capital lease rather than a procurement of energy from an IPP in fiscal 2011.
RISK MANAGEMENT
BC Hydro faces risks to its business that could significantly impact its ability to achieve its short- and long-term financial, social and environmental goals. The goal of risk management is not to eliminate risks, but rather to mitigate them to levels which are commensurate with the potential benefits to be derived. Similarly, BC Hydro’s risk management strategies aim to mitigate risks through a consistent risk management process that is applied to day-to-day business activities as well as to specific projects and initiatives. BC Hydro’s Chief Risk Officer is responsible for facilitating this risk management process and promoting strong oversight of significant risks by the BC Hydro Risk Management Committee. BC Hydro’s Board of Directors also plays a key role in the oversight of risk management, as the Board must understand the risks being taken by BC Hydro and ensure that processes are in place to appropriately manage the risks. BC Hydro’s operations involve a broad spectrum of risks ranging from those commonly associated with any business to catastrophic societal loss risks that would have severe effects on entire regions.
The generation, transmission and distribution of electricity inherently results in certain safety risks to both BC Hydro workers and the public. To manage worker and public safety, BC Hydro relies on education and training, safe design, safety practice regulations and communication. BC Hydro also prepares emergency response plans to limit injury and loss to life and to restore electric service. The large dams represent a catastrophic loss risk (low probability but high consequence) in terms of life, safety, financial, environmental and reputation. This dam failure risk is managed through a comprehensive dam safety management system involving dam safety professionals and experts.
Significant risks to the reliability of BC Hydro’s system include aging infrastructure and the impact of weather. Reliability risks could also result from either a lack of available generation supply or the associated transmission capacity to meet customer demand. BC Hydro manages these risks through long-term planning, asset maintenance and replacement programs, emergency response programs, a diverse supply of energy options, and through cooperative support arrangements with neighbouring utilities. The fiscal 2011 forecast for system inflow energy is 83 per cent of normal and the system is forecast to be in a significant net deficit energy position for fiscal 2011. Lower market prices and reduced load have partially mitigated the impact of reduced system inflow on cost of energy. Several factors constrain BC Hydro’s ability to use its stored system energy to meet load throughout the year. These factors include generating unit outages at major plants (forced outages and capital projects) as well as water management constraints which limit generation at the major plants during some periods. Even when the system has an annual energy surplus, some electricity purchases may still be required during constrained periods of the year (e.g. fall, winter, early spring), while electricity sales may be needed during other periods to minimize spill from system reservoirs. The value of these purchases and sales is subject to market price risk. Electricity demand is generally increasing as B.C.’s population increases, however this demand can be volatile, particularly from larger customers whose consumption is often driven by export markets and world commodity prices. BC Hydro’s risk mitigation strategy is to achieve energy security, primarily from domestic sources and through energy conservation and efficiency. BC Hydro regularly models the projected supply-demand balance of the system over the short to medium term, in an effort to meet demand in the most cost effective manner.
Legal and regulatory requirements for First Nation consultation, claims of historic grievances, land claims, and service reliability issues pose risks to BC Hydro. These risks are managed through a comprehensive aboriginal relations program. Building mutually-beneficial relationships with First Nations reduces financial, legal and operating risks.
1 6
B C H Y D R O S E C O N D Q U A R T E R R E P O R T – F 2 0 1 1
In meeting its financial performance targets, BC Hydro faces many risks including uncertain economic conditions, variable costs and revenues as driven by energy costs, energy demand, interest and foreign exchange rates, pension obligations and energy trading. Of these, risks associated with energy costs – specifically water inflows and energy market prices – are the largest. Tariff rates are set based upon BC Hydro’s cost forecast and allowed return on deemed equity. Many financial risks (differences between forecast and actual costs) associated with uncontrollable costs are mitigated through regulatory deferral accounts. Increasing costs due to aging infrastructure, the modernization and refurbishment of the electricity system, the need for new supply and the need to manage environmental impacts create challenges for BC Hydro in maintaining a cost advantage.
BC Hydro’s energy trading subsidiary, Powerex, is exposed to the risk of variable market prices and counterparties who might not meet their obligations. Powerex manages these risks by operating through defined limits that are regularly reviewed by both the Powerex and BC Hydro Boards of Directors.
The economic contraction has continued to improve the labour supply of engineers and senior managers and has also improved BC Hydro’s ability to attract and retain staff in a variety of roles. The economic downturn has also had the effect of delaying employee retirements; however this may result in a sudden surge of retirements in the future with shorter notice periods. Apprentice programs and contingent workers partially mitigate this risk. In addition, the return on pension fund assets and the market discount rate at year end can have a significant impact on the cost of providing employee future benefits.
Areas where BC Hydro is exposed to the risk of non-compliance with environmental regulations include the release of hazardous materials into the environment and endangerment of wildlife and their habitats. These risks are managed through a variety of site specific risk management strategies.
Other risks to BC Hydro have not changed materially from the Management Discussion and Analysis in the 2010 Annual Report.
FUTURE OUTLOOK
The Budget Transparency and Accountability Act requires that BC Hydro file a Service Plan each year. BC Hydro’s Service Plan filed in March 2010 forecast a net income of $609 million for fiscal 2011.
BC Hydro’s earnings can fluctuate significantly due to various non-controllable factors such as the level of water inflows, customer load, market prices for electricity and natural gas, weather temperatures, interest rates and foreign exchange rates. The updated forecast for fiscal 2011 assumes lower than average water inflows (83 per cent of average), customer load of 50,623 GWh, average market electricity prices of US $32.35/MWh, short-term interest rates of 0.93 per cent and a U.S. dollar exchange rate of US $0.9646.
BC Hydro filed an updated forecast with the Province in November 2010. The updated net income forecast for fiscal 2011 is $608 million and incorporates the integration of BCTC. The significant changes from the Service Plan for fiscal 2011 include:
• A reduction in forecast Trade Income due to fewer market opportunities as a result of the economic recovery not being as strong as anticipated and lower price spreads in the market.
• Customer sales load of 50,623 GWh, a reduction of 927 GWh from the Service Plan. This decrease is mainly due to a reduction in load in the large industrial and commercial sectors largely a result of a slower than anticipated recovery.
• An increase in the forecast cost of energy resulting mainly from the impact of lower water inflows which is at 83 per cent of average. As a result, hydro generation is forecast to decrease and be partially replaced by market energy purchases. This increase is partially offset by lower prices for energy market purchases.
The impact of the changes described is expected to be deferred in regulatory accounts for future recovery/refund through rates and therefore is expected to have no impact on net income in fiscal 2011.
1 7
B C H Y D R O S E C O N D Q U A R T E R R E P O R T – F 2 0 1 1
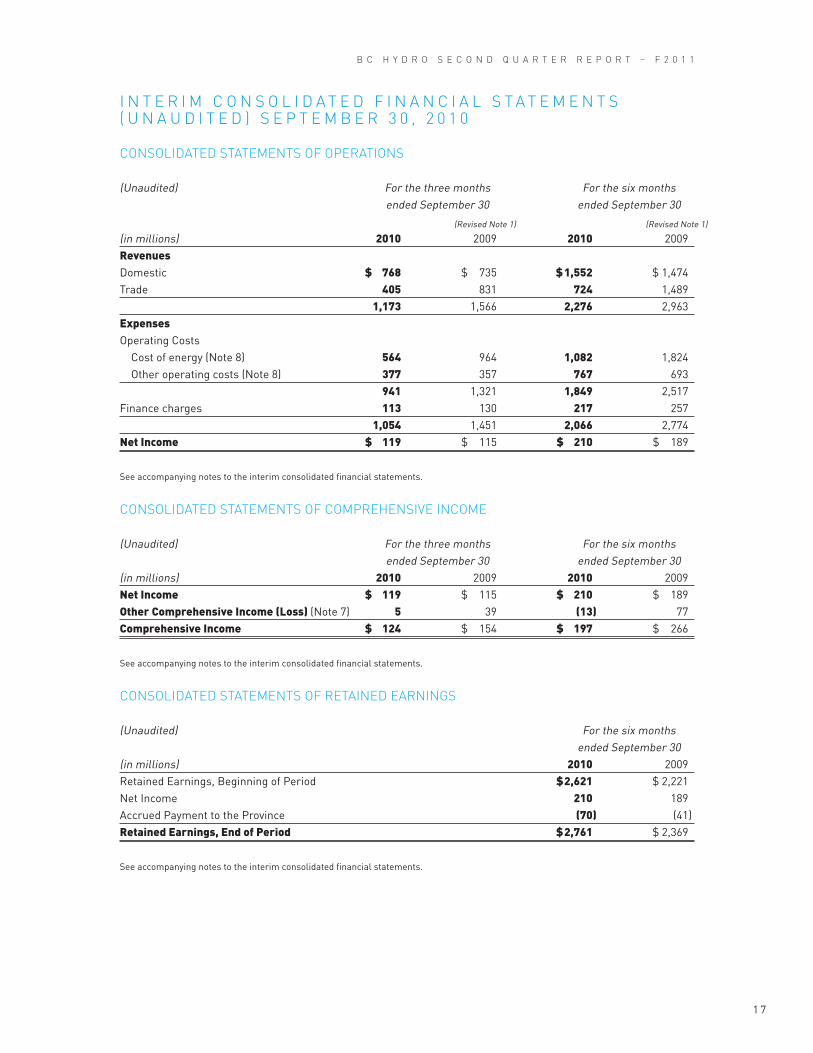
CONSOLIDATED STATEMENTS OF OPERATIONS
(Unaudited) For the three months For the six months ended September 30 ended September 30
(in millions) 2010 2009 2010 2009Revenues Domestic $ 768 $ 735 $ 1,552 $ 1,474Trade 405 831 724 1,489 1,173 1,566 2,276 2,963ExpensesOperating Costs Cost of energy (Note 8) 564 964 1,082 1,824 Other operating costs (Note 8) 377 357 767 693 941 1,321 1,849 2,517Finance charges 113 130 217 257 1,054 1,451 2,066 2,774Net Income $ 119 $ 115 $ 210 $ 189
See accompanying notes to the interim consolidated financial statements.
CONSOLIDATED STATEMENTS OF COMPREHENSIvE INCOME (Unaudited) For the three months For the six months ended September 30 ended September 30(in millions) 2010 2009 2010 2009Net Income $ 119 $ 115 $ 210 $ 189Other Comprehensive Income (Loss) (Note 7) 5 39 (13 ) 77Comprehensive Income $ 124 $ 154 $ 197 $ 266
See accompanying notes to the interim consolidated financial statements.
CONSOLIDATED STATEMENTS OF RETAINED EARNINGS
(Unaudited) For the six months ended September 30(in millions) 2010 2009Retained Earnings, Beginning of Period $ 2,621 $ 2,221Net Income 210 189Accrued Payment to the Province (70 ) (41 )Retained Earnings, End of Period $ 2,761 $ 2,369
See accompanying notes to the interim consolidated financial statements.
I N T E R I M C O N S O L I D A T E D F I N A N C I A L S T A T E M E N T S( U N A U D I T E D ) S E P T E M B E R 3 0 , 2 0 1 0
(Revised Note 1)(Revised Note 1)
1 8
B C H Y D R O S E C O N D Q U A R T E R R E P O R T – F 2 0 1 1
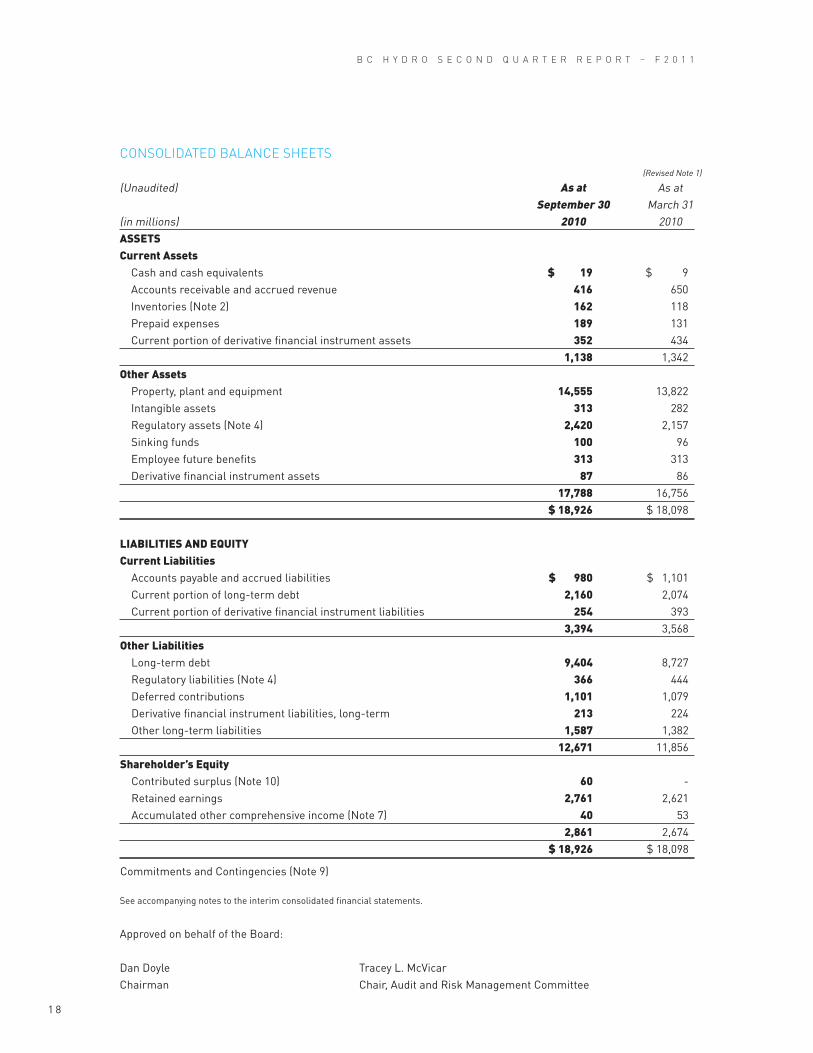
CONSOLIDATED BALANCE SHEETS
(Unaudited) As at As at September 30 March 31(in millions) 2010 2010ASSETSCurrent Assets Cash and cash equivalents $ 19 $ 9 Accounts receivable and accrued revenue 416 650 Inventories (Note 2) 162 118 Prepaid expenses 189 131 Current portion of derivative financial instrument assets 352 434 1,138 1,342Other Assets Property, plant and equipment 14,555 13,822 Intangible assets 313 282 Regulatory assets (Note 4) 2,420 2,157 Sinking funds 100 96 Employee future benefits 313 313 Derivative financial instrument assets 87 86 17,788 16,756 $ 18,926 $ 18,098 LIABILITIES AND EQUITY Current Liabilities Accounts payable and accrued liabilities $ 980 $ 1,101 Current portion of long-term debt 2,160 2,074 Current portion of derivative financial instrument liabilities 254 393 3,394 3,568Other Liabilities Long-term debt 9,404 8,727 Regulatory liabilities (Note 4) 366 444 Deferred contributions 1,101 1,079 Derivative financial instrument liabilities, long-term 213 224 Other long-term liabilities 1,587 1,382 12,671 11,856Shareholder’s Equity Contributed surplus (Note 10) 60 - Retained earnings 2,761 2,621 Accumulated other comprehensive income (Note 7) 40 53 2,861 2,674 $ 18,926 $ 18,098
Commitments and Contingencies (Note 9)
See accompanying notes to the interim consolidated financial statements.
Approved on behalf of the Board:
Dan Doyle Tracey L. McVicarChairman Chair, Audit and Risk Management Committee
(Revised Note 1)
1 9
B C H Y D R O S E C O N D Q U A R T E R R E P O R T – F 2 0 1 1
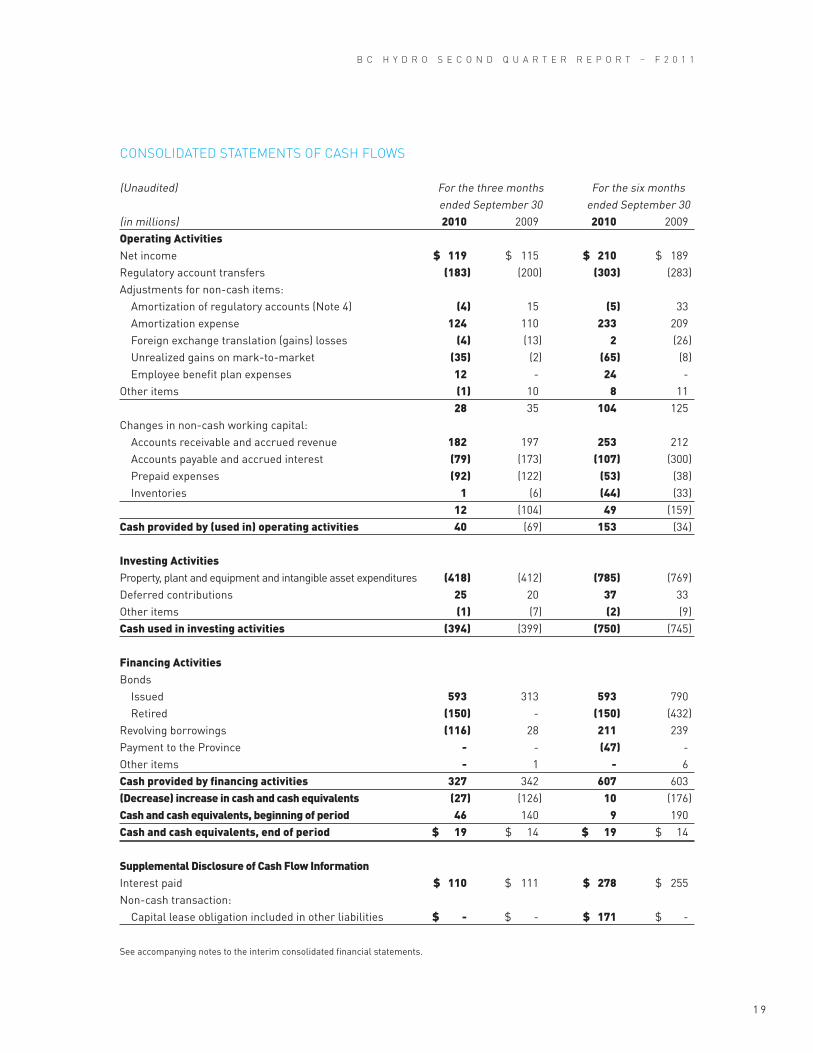
CONSOLIDATED STATEMENTS OF CASH FLOwS
(Unaudited) For the three months For the six months ended September 30 ended September 30(in millions) 2010 2009 2010 2009Operating Activities Net income $ 119 $ 115 $ 210 $ 189 Regulatory account transfers (183 ) (200 ) (303 ) (283 )Adjustments for non-cash items: Amortization of regulatory accounts (Note 4) (4 ) 15 (5 ) 33 Amortization expense 124 110 233 209 Foreign exchange translation (gains) losses (4 ) (13 ) 2 (26 ) Unrealized gains on mark-to-market (35 ) (2 ) (65 ) (8 ) Employee benefit plan expenses 12 - 24 - Other items (1 ) 10 8 11 28 35 104 125 Changes in non-cash working capital: Accounts receivable and accrued revenue 182 197 253 212 Accounts payable and accrued interest (79 ) (173 ) (107 ) (300 ) Prepaid expenses (92 ) (122 ) (53 ) (38 ) Inventories 1 (6 ) (44 ) (33 ) 12 (104 ) 49 (159 )Cash provided by (used in) operating activities 40 (69 ) 153 (34 ) Investing Activities Property, plant and equipment and intangible asset expenditures (418 ) (412 ) (785 ) (769 )Deferred contributions 25 20 37 33 Other items (1 ) (7 ) (2 ) (9 )Cash used in investing activities (394 ) (399 ) (750 ) (745 ) Financing Activities Bonds Issued 593 313 593 790 Retired (150 ) - (150 ) (432 )Revolving borrowings (116 ) 28 211 239 Payment to the Province - - (47 ) - Other items - 1 - 6 Cash provided by financing activities 327 342 607 603 (Decrease) increase in cash and cash equivalents (27 ) (126 ) 10 (176 )Cash and cash equivalents, beginning of period 46 140 9 190 Cash and cash equivalents, end of period $ 19 $ 14 $ 19 $ 14 Supplemental Disclosure of Cash Flow Information Interest paid $ 110 $ 111 $ 278 $ 255 Non-cash transaction: Capital lease obligation included in other liabilities $ - $ - $ 171 $ -
See accompanying notes to the interim consolidated financial statements.

2 0
B C H Y D R O S E C O N D Q U A R T E R R E P O R T – F 2 0 1 1
DESCRIPTION
British Columbia Hydro and Power Authority (BC Hydro or the Company) was established in 1962 as a Crown Corporation of the Province of British Columbia (the Province) by enactment of the Hydro and Power Authority Act. As directed by the Hydro and Power Authority Act, BC Hydro’s mandate is to generate, manufacture, distribute and supply power. BC Hydro’s corporate purpose is to provide “Reliable power, at low cost, for generations.” BC Hydro is subject to regulation (Note 4) by the British Columbia Utilities Commission (BCUC) which, among other things, approves the rates BC Hydro charges for its services.
BC Hydro owns and operates electric generation and distribution facilities in the Province. BC Hydro also owns transmission facilities in the Province that were operated by British Columbia Transmission Corporation (BCTC), an independent Crown Corporation of the Province up to July 5, 2010. As of July 5, 2010, BCTC and BC Hydro were integrated as a single organization as a result of the Clean Energy Act (Note 10).
NOTE 1: ACCOUNTING POLICIES
Basis of PresentationThe interim consolidated financial statements have been prepared by management in accordance with Canadian generally accepted accounting principles (GAAP) for preparation of interim financial statements and do not conform in all respects to the disclosure requirements for annual financial statements. BC Hydro follows certain accounting practices that reflect the effects of regulation, and differ from the accounting practices for enterprises that do not operate in a rate-regulated environment. These interim consolidated financial statements and the notes should be read in conjunction with the Annual Consolidated Financial Statements and accompanying notes in BC Hydro’s 2010 Annual Report.
These interim consolidated financial statements follow the same accounting policies as those described in BC Hydro’s 2010 Annual Report.
Certain amounts in the prior year’s statements related to inventories, prepaid expenses, trade revenue and expense, and regulatory assets and regulatory liabilities have been reclassified to conform to the current year’s presentation. Certain amounts in the prior year’s statement of operations have been reclassified to conform to a change in the current year’s classification of operating expenses to a presentation of costs based on the nature of the expenditures. Amounts previously presented as operations, maintenance and administration costs are now classified by the nature of the expense as outlined in Note 8.
In addition, the Company has changed its presentation of the impact of regulation on its statement of operations. In prior periods the impact of regulatory accounting was shown as a single line item whereas in the current period the impact of regulation is netted against the corresponding expense or revenue line item in the statement of operations. This change results in the Company’s presentation being more consistent with other regulated utilities in Canada. Comparative balances have been reclassified to conform with the current period’s presentation. Detail on regulatory account transfers can be found in Note 4.
Use of EstimatesThe preparation of financial statements in conformity with GAAP requires management to make estimates and assumptions that affect the reported amounts of assets and liabilities and the disclosure of contingent assets, liabilities and commitments at the date of the financial statements and the reported amounts of revenues and expenses during the reporting periods. Significant items subject to management estimates and assumptions include the determination of the allowance for doubtful accounts, the fair value of sinking funds and derivative financial instruments, the actuarial assumptions used to value the employee future benefit plans, the useful lives of property, plant and equipment and intangible assets, amounts for accrued liabilities and contingencies, and the accrual for unbilled revenue at period end. Actual results could differ from these estimates.
N O T E S T O I N T E R I M C O N S O L I D A T E D F I N A N C I A L S T A T E M E N T S ( U N A U D I T E D ) S E P T E M B E R 3 0 , 2 0 1 0
2 1
B C H Y D R O S E C O N D Q U A R T E R R E P O R T – F 2 0 1 1
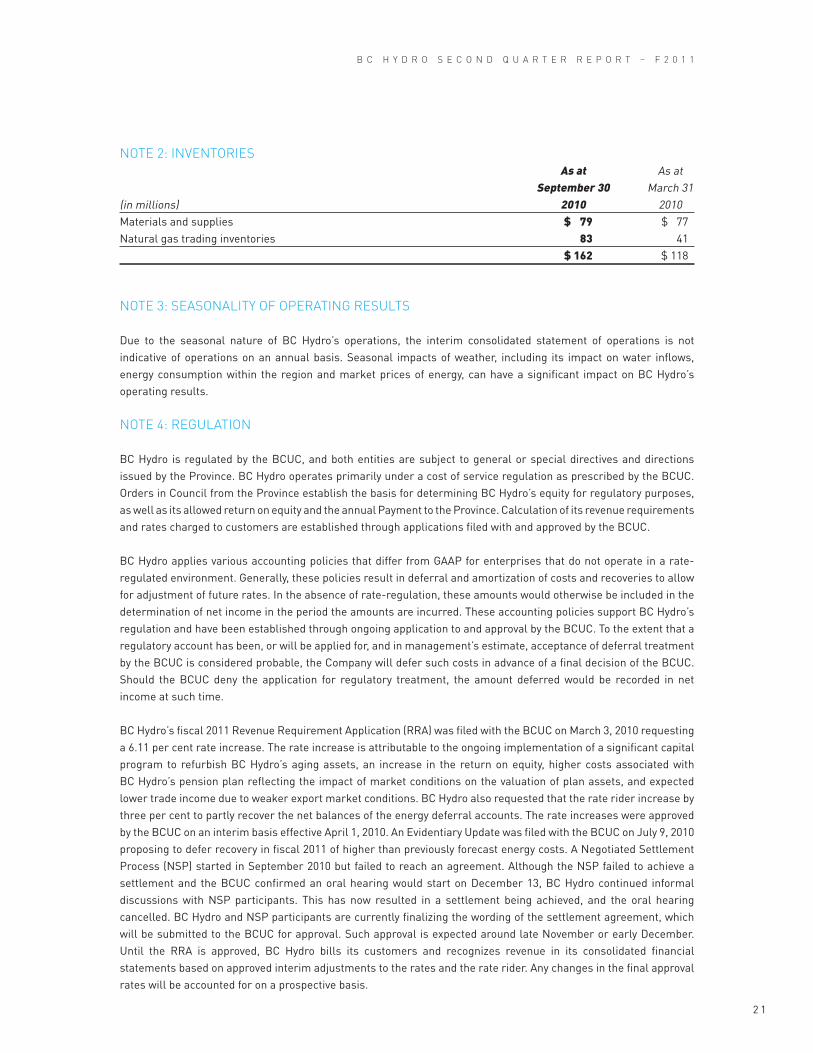
NOTE 2: INvENTORIES As at As at September 30 March 31(in millions) 2010 2010Materials and supplies $ 79 $ 77 Natural gas trading inventories 83 41 $ 162 $ 118
NOTE 3: SEASONALITY OF OPERATING RESULTS
Due to the seasonal nature of BC Hydro’s operations, the interim consolidated statement of operations is not indicative of operations on an annual basis. Seasonal impacts of weather, including its impact on water inflows, energy consumption within the region and market prices of energy, can have a significant impact on BC Hydro’s operating results.
NOTE 4: REGULATION
BC Hydro is regulated by the BCUC, and both entities are subject to general or special directives and directions issued by the Province. BC Hydro operates primarily under a cost of service regulation as prescribed by the BCUC. Orders in Council from the Province establish the basis for determining BC Hydro’s equity for regulatory purposes, as well as its allowed return on equity and the annual Payment to the Province. Calculation of its revenue requirements and rates charged to customers are established through applications filed with and approved by the BCUC.
BC Hydro applies various accounting policies that differ from GAAP for enterprises that do not operate in a rate-regulated environment. Generally, these policies result in deferral and amortization of costs and recoveries to allow for adjustment of future rates. In the absence of rate-regulation, these amounts would otherwise be included in the determination of net income in the period the amounts are incurred. These accounting policies support BC Hydro’s regulation and have been established through ongoing application to and approval by the BCUC. To the extent that a regulatory account has been, or will be applied for, and in management’s estimate, acceptance of deferral treatment by the BCUC is considered probable, the Company will defer such costs in advance of a final decision of the BCUC. Should the BCUC deny the application for regulatory treatment, the amount deferred would be recorded in net income at such time.
BC Hydro’s fiscal 2011 Revenue Requirement Application (RRA) was filed with the BCUC on March 3, 2010 requesting a 6.11 per cent rate increase. The rate increase is attributable to the ongoing implementation of a significant capital program to refurbish BC Hydro’s aging assets, an increase in the return on equity, higher costs associated with BC Hydro’s pension plan reflecting the impact of market conditions on the valuation of plan assets, and expected lower trade income due to weaker export market conditions. BC Hydro also requested that the rate rider increase by three per cent to partly recover the net balances of the energy deferral accounts. The rate increases were approved by the BCUC on an interim basis effective April 1, 2010. An Evidentiary Update was filed with the BCUC on July 9, 2010 proposing to defer recovery in fiscal 2011 of higher than previously forecast energy costs. A Negotiated Settlement Process (NSP) started in September 2010 but failed to reach an agreement. Although the NSP failed to achieve a settlement and the BCUC confirmed an oral hearing would start on December 13, BC Hydro continued informal discussions with NSP participants. This has now resulted in a settlement being achieved, and the oral hearing cancelled. BC Hydro and NSP participants are currently finalizing the wording of the settlement agreement, which will be submitted to the BCUC for approval. Such approval is expected around late November or early December. Until the RRA is approved, BC Hydro bills its customers and recognizes revenue in its consolidated financial statements based on approved interim adjustments to the rates and the rate rider. Any changes in the final approval rates will be accounted for on a prospective basis.
2 2
B C H Y D R O S E C O N D Q U A R T E R R E P O R T – F 2 0 1 1
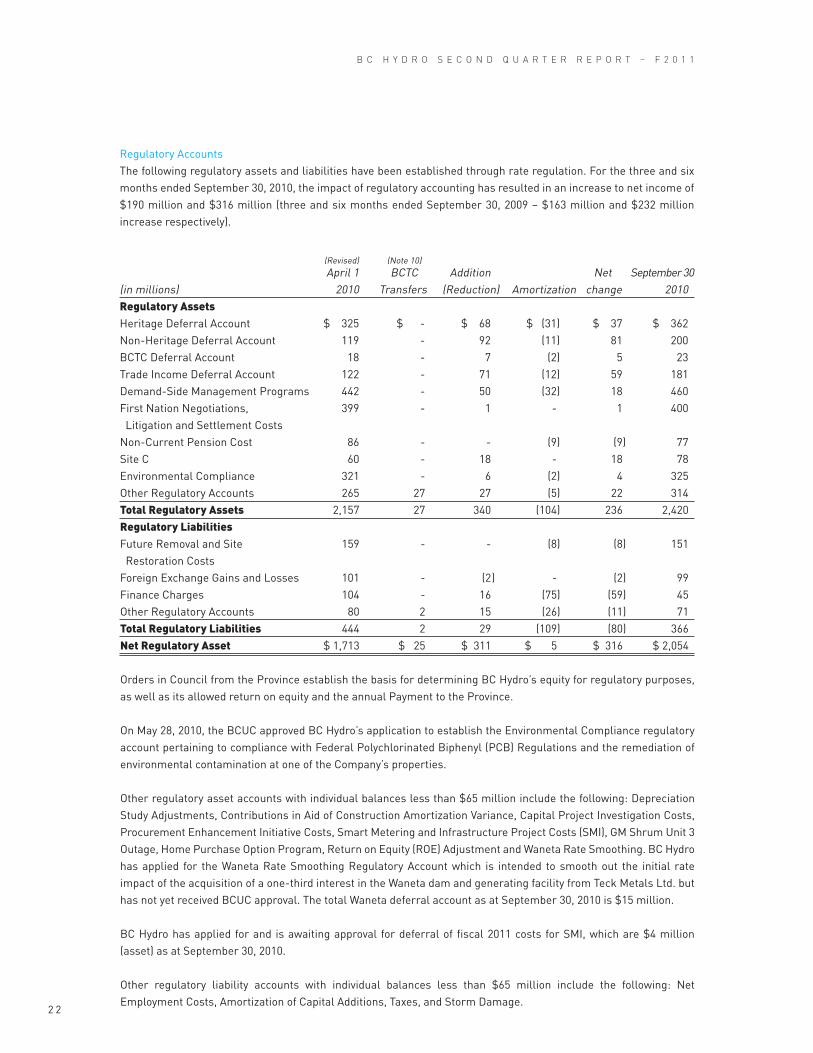
Regulatory AccountsThe following regulatory assets and liabilities have been established through rate regulation. For the three and six months ended September 30, 2010, the impact of regulatory accounting has resulted in an increase to net income of $190 million and $316 million (three and six months ended September 30, 2009 – $163 million and $232 million increase respectively).
(Revised) (Note 10) April 1 BCTC Addition Net September 30(in millions) 2010 Transfers (Reduction) Amortization change 2010Regulatory Assets Heritage Deferral Account $ 325 $ - $ 68 $ (31 ) $ 37 $ 362 Non-Heritage Deferral Account 119 - 92 (11 ) 81 200 BCTC Deferral Account 18 - 7 (2 ) 5 23 Trade Income Deferral Account 122 - 71 (12 ) 59 181 Demand-Side Management Programs 442 - 50 (32 ) 18 460 First Nation Negotiations, 399 - 1 - 1 400 Litigation and Settlement CostsNon-Current Pension Cost 86 - - (9 ) (9 ) 77 Site C 60 - 18 - 18 78 Environmental Compliance 321 - 6 (2 ) 4 325 Other Regulatory Accounts 265 27 27 (5 ) 22 314 Total Regulatory Assets 2,157 27 340 (104 ) 236 2,420 Regulatory Liabilities Future Removal and Site 159 - - (8 ) (8 ) 151 Restoration CostsForeign Exchange Gains and Losses 101 - (2 ) - (2 ) 99 Finance Charges 104 - 16 (75 ) (59 ) 45 Other Regulatory Accounts 80 2 15 (26 ) (11 ) 71 Total Regulatory Liabilities 444 2 29 (109 ) (80 ) 366 Net Regulatory Asset $ 1,713 $ 25 $ 311 $ 5 $ 316 $ 2,054
Orders in Council from the Province establish the basis for determining BC Hydro’s equity for regulatory purposes, as well as its allowed return on equity and the annual Payment to the Province.
On May 28, 2010, the BCUC approved BC Hydro’s application to establish the Environmental Compliance regulatory account pertaining to compliance with Federal Polychlorinated Biphenyl (PCB) Regulations and the remediation of environmental contamination at one of the Company’s properties.
Other regulatory asset accounts with individual balances less than $65 million include the following: Depreciation Study Adjustments, Contributions in Aid of Construction Amortization Variance, Capital Project Investigation Costs, Procurement Enhancement Initiative Costs, Smart Metering and Infrastructure Project Costs (SMI), GM Shrum Unit 3 Outage, Home Purchase Option Program, Return on Equity (ROE) Adjustment and Waneta Rate Smoothing. BC Hydro has applied for the Waneta Rate Smoothing Regulatory Account which is intended to smooth out the initial rate impact of the acquisition of a one-third interest in the Waneta dam and generating facility from Teck Metals Ltd. but has not yet received BCUC approval. The total Waneta deferral account as at September 30, 2010 is $15 million.
BC Hydro has applied for and is awaiting approval for deferral of fiscal 2011 costs for SMI, which are $4 million (asset) as at September 30, 2010.
Other regulatory liability accounts with individual balances less than $65 million include the following: Net Employment Costs, Amortization of Capital Additions, Taxes, and Storm Damage.
2 3
B C H Y D R O S E C O N D Q U A R T E R R E P O R T – F 2 0 1 1
NOTE 5: CAPITAL MANAGEMENT
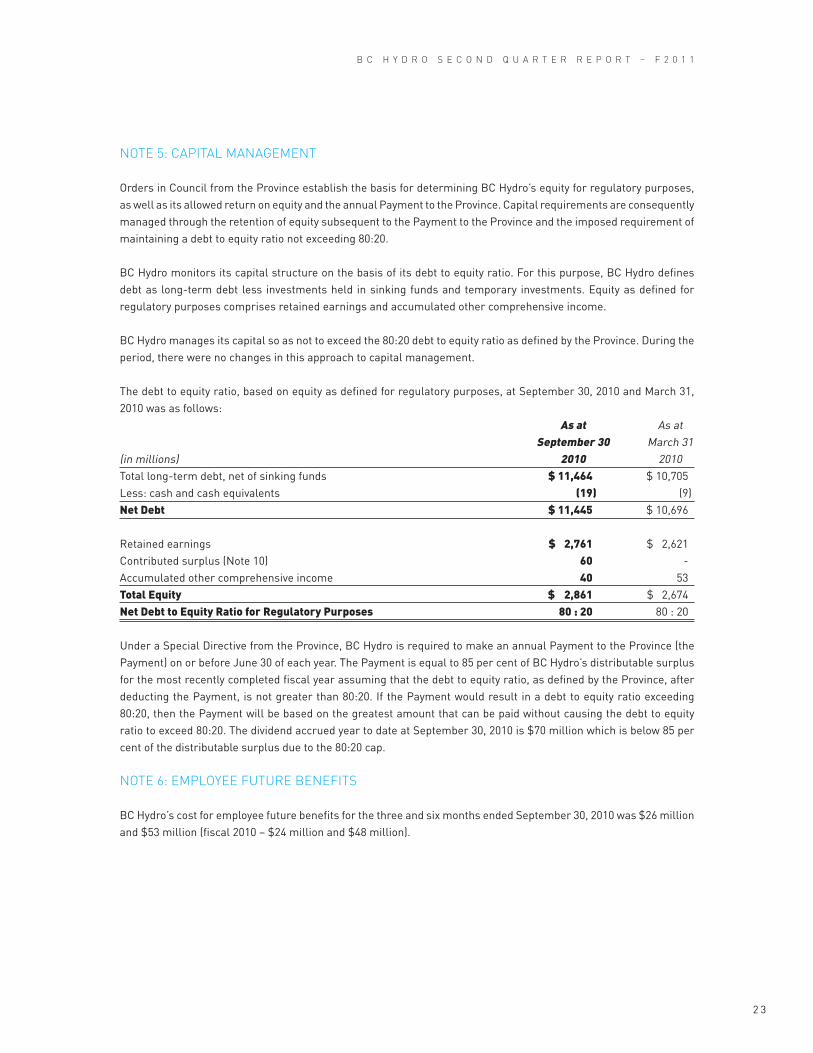
Orders in Council from the Province establish the basis for determining BC Hydro’s equity for regulatory purposes, as well as its allowed return on equity and the annual Payment to the Province. Capital requirements are consequently managed through the retention of equity subsequent to the Payment to the Province and the imposed requirement of maintaining a debt to equity ratio not exceeding 80:20.
BC Hydro monitors its capital structure on the basis of its debt to equity ratio. For this purpose, BC Hydro defines debt as long-term debt less investments held in sinking funds and temporary investments. Equity as defined for regulatory purposes comprises retained earnings and accumulated other comprehensive income.
BC Hydro manages its capital so as not to exceed the 80:20 debt to equity ratio as defined by the Province. During the period, there were no changes in this approach to capital management.
The debt to equity ratio, based on equity as defined for regulatory purposes, at September 30, 2010 and March 31, 2010 was as follows: As at As at September 30 March 31(in millions) 2010 2010Total long-term debt, net of sinking funds $ 11,464 $ 10,705 Less: cash and cash equivalents (19 ) (9 )Net Debt $ 11,445 $ 10,696 Retained earnings $ 2,761 $ 2,621 Contributed surplus (Note 10) 60 - Accumulated other comprehensive income 40 53 Total Equity $ 2,861 $ 2,674 Net Debt to Equity Ratio for Regulatory Purposes 80 : 20 80 : 20
Under a Special Directive from the Province, BC Hydro is required to make an annual Payment to the Province (the Payment) on or before June 30 of each year. The Payment is equal to 85 per cent of BC Hydro’s distributable surplus for the most recently completed fiscal year assuming that the debt to equity ratio, as defined by the Province, after deducting the Payment, is not greater than 80:20. If the Payment would result in a debt to equity ratio exceeding 80:20, then the Payment will be based on the greatest amount that can be paid without causing the debt to equity ratio to exceed 80:20. The dividend accrued year to date at September 30, 2010 is $70 million which is below 85 per cent of the distributable surplus due to the 80:20 cap.
NOTE 6: EMPLOYEE FUTURE BENEFITS
BC Hydro’s cost for employee future benefits for the three and six months ended September 30, 2010 was $26 million and $53 million (fiscal 2010 – $24 million and $48 million).
2 4
B C H Y D R O S E C O N D Q U A R T E R R E P O R T – F 2 0 1 1
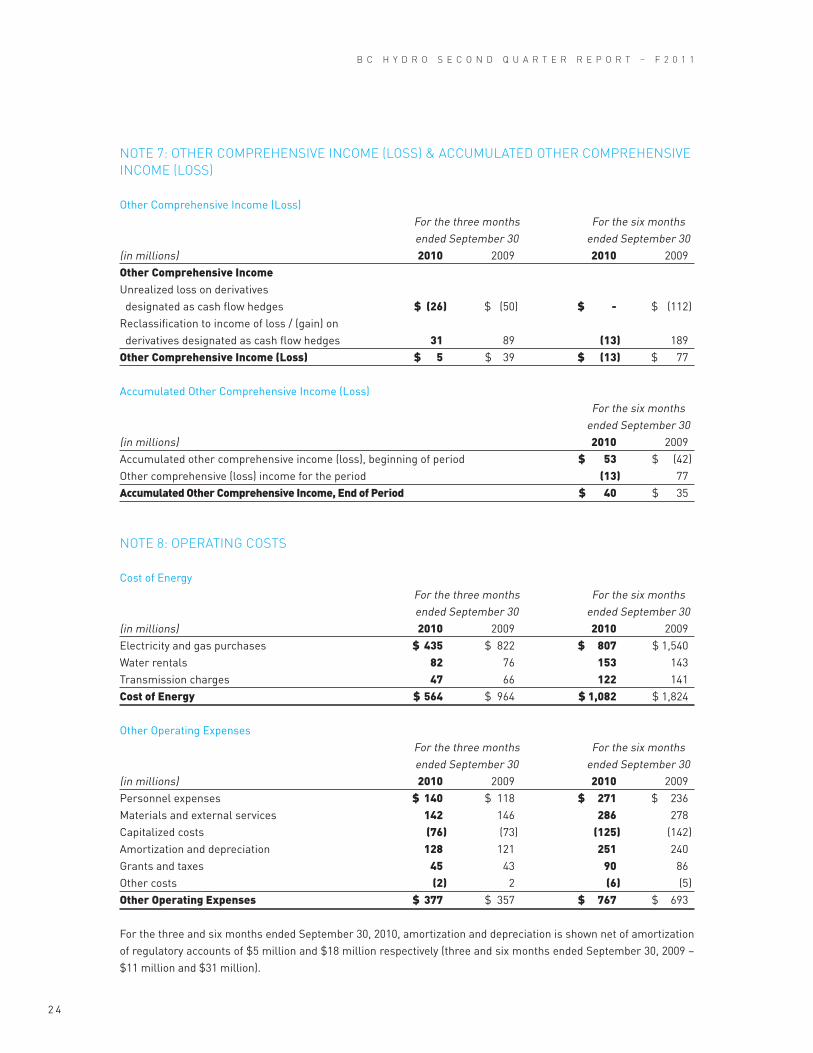
NOTE 7: OTHER COMPREHENSIvE INCOME (LOSS) & ACCUMULATED OTHER COMPREHENSIvE INCOME (LOSS)
Other Comprehensive Income (Loss) For the three months For the six months ended September 30 ended September 30(in millions) 2010 2009 2010 2009Other Comprehensive Income Unrealized loss on derivatives designated as cash flow hedges $ (26 ) $ (50 ) $ - $ (112 ) Reclassification to income of loss / (gain) on derivatives designated as cash flow hedges 31 89 (13 ) 189Other Comprehensive Income (Loss) $ 5 $ 39 $ (13 ) $ 77
Accumulated Other Comprehensive Income (Loss) For the six months ended September 30(in millions) 2010 2009Accumulated other comprehensive income (loss), beginning of period $ 53 $ (42 )Other comprehensive (loss) income for the period (13 ) 77 Accumulated Other Comprehensive Income, End of Period $ 40 $ 35
NOTE 8: OPERATING COSTS
Cost of Energy For the three months For the six months ended September 30 ended September 30(in millions) 2010 2009 2010 2009Electricity and gas purchases $ 435 $ 822 $ 807 $ 1,540 Water rentals 82 76 153 143 Transmission charges 47 66 122 141 Cost of Energy $ 564 $ 964 $ 1,082 $ 1,824
Other Operating Expenses For the three months For the six months ended September 30 ended September 30(in millions) 2010 2009 2010 2009Personnel expenses $ 140 $ 118 $ 271 $ 236 Materials and external services 142 146 286 278 Capitalized costs (76 ) (73 ) (125 ) (142 )Amortization and depreciation 128 121 251 240 Grants and taxes 45 43 90 86 Other costs (2 ) 2 (6 ) (5 )Other Operating Expenses $ 377 $ 357 $ 767 $ 693
For the three and six months ended September 30, 2010, amortization and depreciation is shown net of amortization of regulatory accounts of $5 million and $18 million respectively (three and six months ended September 30, 2009 – $11 million and $31 million).
2 5
B C H Y D R O S E C O N D Q U A R T E R R E P O R T – F 2 0 1 1
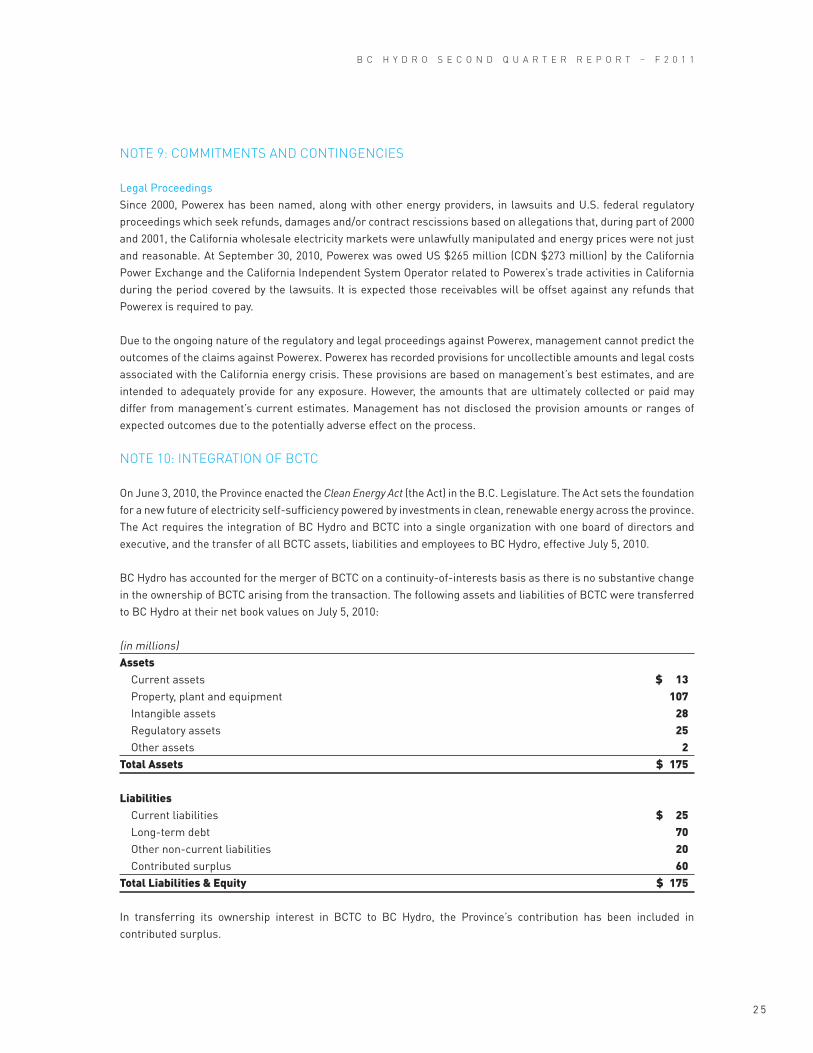
NOTE 9: COMMITMENTS AND CONTINGENCIES
Legal Proceedings Since 2000, Powerex has been named, along with other energy providers, in lawsuits and U.S. federal regulatory proceedings which seek refunds, damages and/or contract rescissions based on allegations that, during part of 2000 and 2001, the California wholesale electricity markets were unlawfully manipulated and energy prices were not just and reasonable. At September 30, 2010, Powerex was owed US $265 million (CDN $273 million) by the California Power Exchange and the California Independent System Operator related to Powerex’s trade activities in California during the period covered by the lawsuits. It is expected those receivables will be offset against any refunds that Powerex is required to pay.
Due to the ongoing nature of the regulatory and legal proceedings against Powerex, management cannot predict the outcomes of the claims against Powerex. Powerex has recorded provisions for uncollectible amounts and legal costs associated with the California energy crisis. These provisions are based on management’s best estimates, and are intended to adequately provide for any exposure. However, the amounts that are ultimately collected or paid may differ from management’s current estimates. Management has not disclosed the provision amounts or ranges of expected outcomes due to the potentially adverse effect on the process.
NOTE 10: INTEGRATION OF BCTC
On June 3, 2010, the Province enacted the Clean Energy Act (the Act) in the B.C. Legislature. The Act sets the foundation for a new future of electricity self-sufficiency powered by investments in clean, renewable energy across the province. The Act requires the integration of BC Hydro and BCTC into a single organization with one board of directors and executive, and the transfer of all BCTC assets, liabilities and employees to BC Hydro, effective July 5, 2010.
BC Hydro has accounted for the merger of BCTC on a continuity-of-interests basis as there is no substantive change in the ownership of BCTC arising from the transaction. The following assets and liabilities of BCTC were transferred to BC Hydro at their net book values on July 5, 2010:
(in millions) Assets Current assets $ 13 Property, plant and equipment 107 Intangible assets 28 Regulatory assets 25 Other assets 2Total Assets $ 175
Liabilities Current liabilities $ 25 Long-term debt 70 Other non-current liabilities 20 Contributed surplus 60Total Liabilities & Equity $ 175
In transferring its ownership interest in BCTC to BC Hydro, the Province’s contribution has been included in contributed surplus.

B C H Y D R O S E C O N D Q U A R T E R R E P O R T – F 2 0 1 1
The operating results of BCTC have been included in BC Hydro’s consolidated statement of operations and comprehensive income from July 5, 2010. The operating results of BCTC for the period from April 1, 2010 to July 4, 2010 were not included in BC Hydro’s consolidated statement of operations and comprehensive income, as management believes that it does not have a material impact on the consolidated financial statements. Comparative amounts presented in these consolidated financial statements have not been restated to reflect the financial position and results of operations as if the companies have been combined since their inception on the basis that the impact is not significant.
GDS10-434