Embed Size (px)
Citation preview
BC Hydro
Electric Distribution System
Cost of Service Study
Reimer Consulting Group Inc.
Arnie Reimer
May 7, 2010
BC Hydro Distribution
Cost of Service Study
2
Table of Contents
1. Executive Summary ........................................................................................................ 3
2. BC Hydro Electric Distribution System ......................................................................... 4
2.1. General Description ............................................................................................ 4
2.1.1 Configuration .............................................................................................. 5
2.1.2 Distribution System Statistics ..................................................................... 8
2.1.3 Cost Information ......................................................................................... 9
2.1.4 Functionalization......................................................................................... 9
2.1.5 Distribution Losses ................................................................................... 10
2.1.6 Rate Design ............................................................................................... 11
3. Distribution System Cost of Service Methods .............................................................. 12
3.1. Zero Intercept Method ...................................................................................... 13
3.2. Minimum System Method ................................................................................ 15
3.3. Direct Assignment of Classification ................................................................. 17
3.4. Primary System – System Additions ................................................................ 18
3.5. Direct Assignment of Costs .............................................................................. 18
4. Distribution System Functions ...................................................................................... 20
4.1. Substation Distribution Asset (SDA) ................................................................ 20
4.2. Primary Distribution System............................................................................. 20
4.3. Transformation .................................................................................................. 26
4.4. Distribution Secondary ..................................................................................... 32
4.5. Metering ............................................................................................................ 36
5. Compilation of BC Hydro System Results ................................................................... 39
6. Appendix A – Service Area Map .................................................................................. 41
7. Appendix B – Bulk Transmission System Map ............................................................ 42
8. Functionalization of Distribution Property ................................................................... 43
BC Hydro Distribution
Cost of Service Study
3
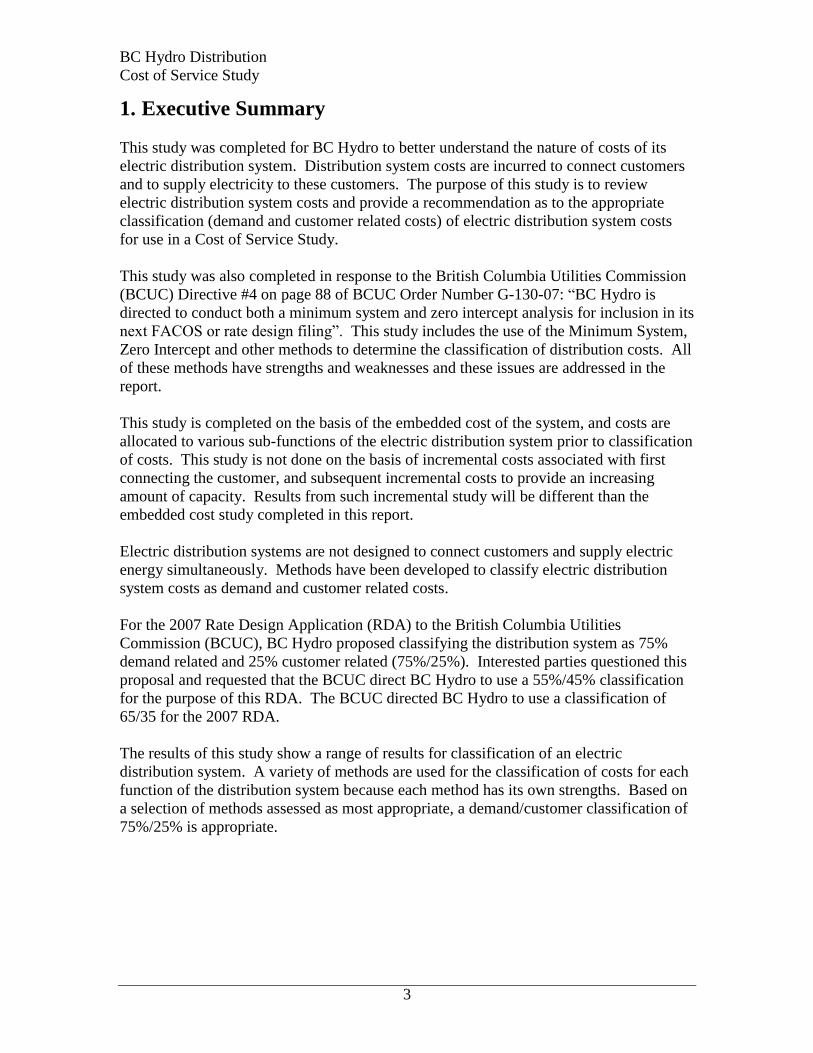
1. Executive Summary
This study was completed for BC Hydro to better understand the nature of costs of its
electric distribution system. Distribution system costs are incurred to connect customers
and to supply electricity to these customers. The purpose of this study is to review
electric distribution system costs and provide a recommendation as to the appropriate
classification (demand and customer related costs) of electric distribution system costs
for use in a Cost of Service Study.
This study was also completed in response to the British Columbia Utilities Commission
(BCUC) Directive #4 on page 88 of BCUC Order Number G-130-07: “BC Hydro is
directed to conduct both a minimum system and zero intercept analysis for inclusion in its
next FACOS or rate design filing”. This study includes the use of the Minimum System,
Zero Intercept and other methods to determine the classification of distribution costs. All
of these methods have strengths and weaknesses and these issues are addressed in the
report.
This study is completed on the basis of the embedded cost of the system, and costs are
allocated to various sub-functions of the electric distribution system prior to classification
of costs. This study is not done on the basis of incremental costs associated with first
connecting the customer, and subsequent incremental costs to provide an increasing
amount of capacity. Results from such incremental study will be different than the
embedded cost study completed in this report.
Electric distribution systems are not designed to connect customers and supply electric
energy simultaneously. Methods have been developed to classify electric distribution
system costs as demand and customer related costs.
For the 2007 Rate Design Application (RDA) to the British Columbia Utilities
Commission (BCUC), BC Hydro proposed classifying the distribution system as 75%
demand related and 25% customer related (75%/25%). Interested parties questioned this
proposal and requested that the BCUC direct BC Hydro to use a 55%/45% classification
for the purpose of this RDA. The BCUC directed BC Hydro to use a classification of
65/35 for the 2007 RDA.
The results of this study show a range of results for classification of an electric
distribution system. A variety of methods are used for the classification of costs for each
function of the distribution system because each method has its own strengths. Based on
a selection of methods assessed as most appropriate, a demand/customer classification of
75%/25% is appropriate.
BC Hydro Distribution
Cost of Service Study
4
2. BC Hydro Electric Distribution System
This study was also completed in response to the British Columbia Utilities Commission
(BCUC) Directive #4 on page 88 of BCUC Order Number G-130-07: “BC Hydro is
directed to conduct both a minimum system and zero intercept analysis for inclusion in its
next FACOS or rate design filing”. This study includes the Minimum System, Zero
Intercept and other methods as appropriate used to determine the classification of
distribution costs.
This report includes a review of BC Hydro’s electric distribution system and the costs
incurred in owning and operating the electric distribution system. The review of the
system includes study of how costs are incurred in the planning, design and construction
of the electric distribution system.
BC Hydro’s service area covers approximately 94% of British Columbia and the
remainder of BC is served by FortisBC as shown in the map of BC Hydro’s service area
in Appendix A. While the service area is large, the majority of the load in BC is located
in the lower mainland. BC Hydro’s electric distribution system is predominately
interconnected to the provincial electric transmission system and this distribution system
is referred to as the integrated area (IA). The integrated area is connected to all of the
larger generators in BC and is also interconnected to Alberta and Washington State.
Communities that are remote to the electric transmission grid may have local generation,
and these areas are referred to as the non integrated areas (NIA). The IA distribution
system is large in comparison to the NIA, and both will simply be referred to as the
distribution system.
2.1. General Description
The electrical transmission system in BC comprises of approximately 18,000 kM of lines
that are energized at 69 kV and above. This transmission system transports electric
energy from generation projects to the load. Some large loads are connected directly to
the transmission system and most of the electricity moves from the transmission system
to the distribution system before being distributed to the end use customers. A map of
the high voltage transmission system in BC is shown in Appendix B. The electric
transmission system includes substations that interconnect generators, provide switching
capability and step down substations to reduce voltage to distribution levels. The
transmission system includes approximately 300 transmission switching and substations,
including 234 substations that are source substations for the distribution system. A
source substation will have at least one distribution feeder, and on average, each
distribution source substation has 6.3 distribution feeders.
BCTC manages the transmission system in BC which includes the step down substations.
However, the costs associated with these step down substations are considered
distribution costs in the BC Hydro Cost of Service Study. For the purpose of this study,
the costs associated with Substation Distribution Asset (SDA) are considered part of the
distribution system.
BC Hydro Distribution
Cost of Service Study
5
BC Hydro’s electric distribution system contains approximately 57,080 kM of primary
distribution circuits that are energized at a voltage less than 60 kV. The most common
primary distribution voltages are 25 kV and 12.5 kV (3 phase L-L voltage where 1 phase
L-N voltage is 14.4 and 7.2 kV respectively). The most common secondary voltage for
single phase service is 120/240 V. Three phase secondary voltage that are commonly
provided by BC Hydro include 120/208 V, 277/480 V and 347/600V.
The electric distribution system and its associated costs are dynamic in order to serve new
load and address changes in load. The system changes over time as capital additions,
rebuilds, reconfiguration and salvage of old facilities occur. This report is based on the
electric distribution system as it existed at January 5, 2010. Forecast cost data for the
fiscal year ending March 31, 2010 is used and is based the recent Revenue Requirements
Application.
2.1.1 Configuration
There are 234 source substations that supply electricity into the electric distribution
system. These source substations provide service to 1482 primary distribution feeders.
On average, a source substation has 6.3 distribution feeders, with an average circuit
length of 38.5 kM. Most primary distribution feeders are energized at 25 kV or 12.5 kV.
Primary distribution voltages can be as high as 34.5 kV and as low as 4 kV.
The distribution system is normally a radially fed system, meaning there is only one line
of supply. Distribution systems are normally designed with a series of switches, so that
in the event of a fault, the fault can be isolated by opening switches, and some of the load
may be restored by closing other switches. Trunk lines have switching capability that
allow for faster restoration of service than branches.
The primary distribution feeders generally consist of three components: feeders, trunks
and branches.
The feeders are defined as the cable or conductor that starts at the circuit breaker in the
step down substation and ends at the first customer, or first protective device on the
primary distribution feeder. Feeders are commonly underground cables of 500 or 750
mcm cable and when feeders are overhead conductor, the minimum size is normally 266
kcmil. All feeders are 3 phase circuits and can provide service to all customers.
The trunk lines are connected to the feeders. The trunk lines are sections of the primary
distribution circuit that can be switched, or fed from one of two different sources. Trunk
lines generally have lighter cables than feeders and include underground cable of 4/0 to
500 mcm and overhead conductor of 266 to 336 kcmil. All trunks are 3 phase circuits
and can provide service to all customers.
The branches are fed from the trunk lines. The branch lines have no switching capability.
In the event of a fault, all loads downstream of the fault will experience an outage until

BC Hydro Distribution
Cost of Service Study
6
the fault is repaired. Branch lines have the smallest conductor and will include
underground cable of #1 or larger and overhead cable of #2 or 1/0. Branches include
both 3 phase and 1 phase lines.
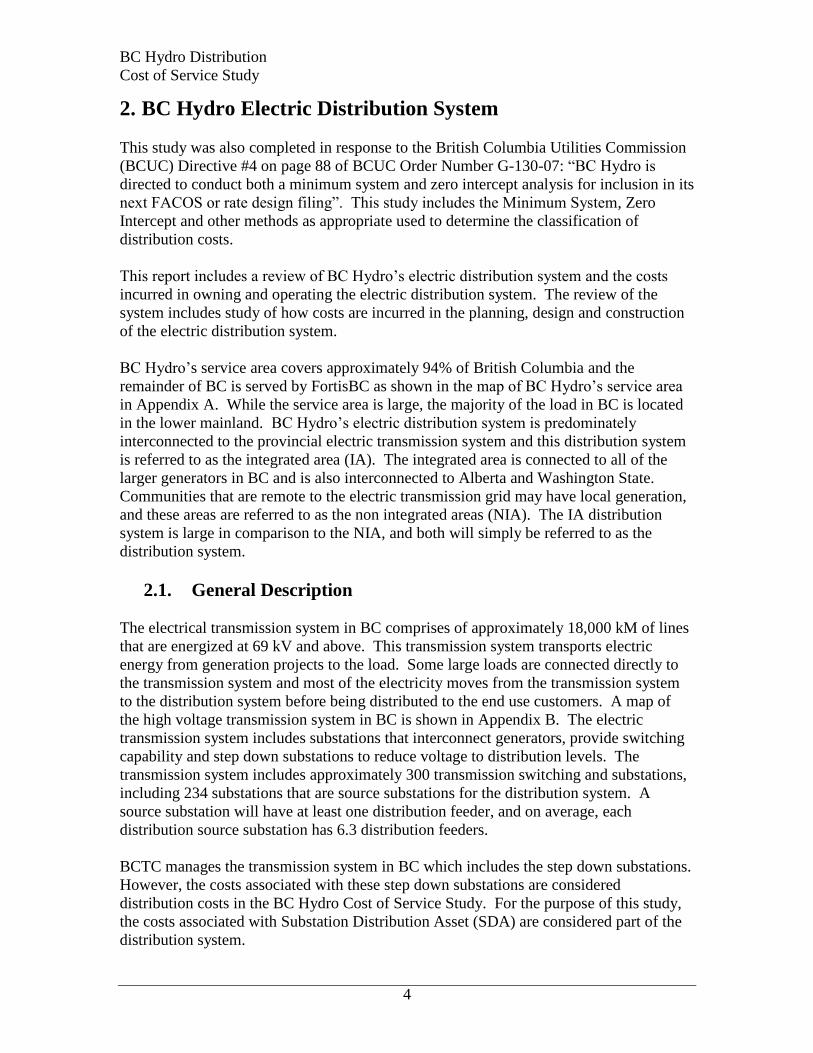
Figure 1 as follows illustrates a typical distribution system layout. The BC Hydro
electric distribution system starts at one source substation, goes through a feeder, a trunk,
a normally open switch, another trunk and feeder and ends at a different source
substation. In cases where this is not practical to end at a different source substation, the
primary feeder may go through a normally open switch and then back to the same source
substation. This configuration allows for faster restoration of service in the event of a
distribution fault, but does not provide for restoration of service in the case of an outage
to the source substation.
BC Hydro Distribution
Cost of Service Study
7
Figure 1 Example BC Hydro Distribution System Layout
BC Hydro Distribution
Cost of Service Study
8
Larger customers may take electric service directly from the primary distribution system
and these customers are known as primary service customers. These customers own
operate and maintain their transformers that transform voltage from primary voltage
down to the voltage used by the customers equipment. These customers may have a
meter on primary side of the transformer (primary metering), or may have a meter on the
secondary side of the transformer (secondary metering) and the meter is owned by BC
Hydro. Metering at lower voltage (secondary metering) is less expensive than primary
metering.
The next component of the electric distribution system is the transformer. Transformers
serve the function of converting the primary voltage (25 or 12.5 kV) down to a secondary
voltage of less than 1000 volts for safe and easy use. BC Hydro provides transformation
for all other distribution connected customers that have a load of 1500 kVA or less.
Transformers connected to overhead systems are generally pole mounted with the
exception of large transformers, which are placed on a concrete pad on the ground.
Transformers connected to underground systems are also placed on a concrete pad (pad
mount), or for large services, the transformer may be placed in a vault or an electrical
room supplied by the customer.
Secondary cables run from the transformer to the customer’s service entrance. Secondary
cables are relatively heavy cables for the amount of load that they carry because the
amperage is high at secondary voltage. The meter is normally located at the customer’s
service entrance, and the customer is responsible for electrical wiring beyond the meter.
2.1.2 Distribution System Statistics
The electric distribution system has 57,080 kM of primary distribution line. 84% of this
line (48,040 kM) is overhead and the remaining 16% (9,040 kM) is underground line. Of
the overhead line, 65% is 1 phase line, 1% is 2 phase and the remaining 34% is 3 phase
line. Of the underground line, 51% of this line is 1 phase while the remaining 49% is 3
phase.
The distribution step down transformers include 240,600 overhead transformers, 53,970
pad mount transformers and 326 vault transformers. A variety of transformers sizes have
been used over the years and standardization of sizes has reduced the number of different
sizes of transformers commonly used to about 8 different pole mounted transformer sizes
and 8 different pad mount transformer sizes. BC Hydro provides other sizes where
standardized sizes do not meet the customers’ needs, up to 1500 kVA. Customers with
loads larger than 1500 kVA are required to provide their own transformers, and BC
Hydro does not carry any spare transformers for these large loads.
BC Hydro provides secondary cables or conductors between the transformer and the
meter.
BC Hydro Distribution
Cost of Service Study
9
The distribution system also includes meters for each service (with the exception of small
unmetered services and street lights). The smallest electric meters commonly used are
the single phase 120/240 V, 200 amp meters that are used for small residential and
commercial loads (maximum of 48 kVA). These maters can be replaced (meter socket is
in place) for $47. The next size of most commonly used meter is the 3 phase meter for up
to 600 V, 200 amp (maximum load of 208 kVA) and this meter can be replace for $890.
Loads with voltage higher than 600 V require PT’s to reduce voltage, or in excess of 200
amps require CT’s to reduce the current in order to meter the load. The largest load
served from a distribution feeder is up to 13,000 kVA, and primary metering (25 kV) is
required for metering at the distribution voltage.
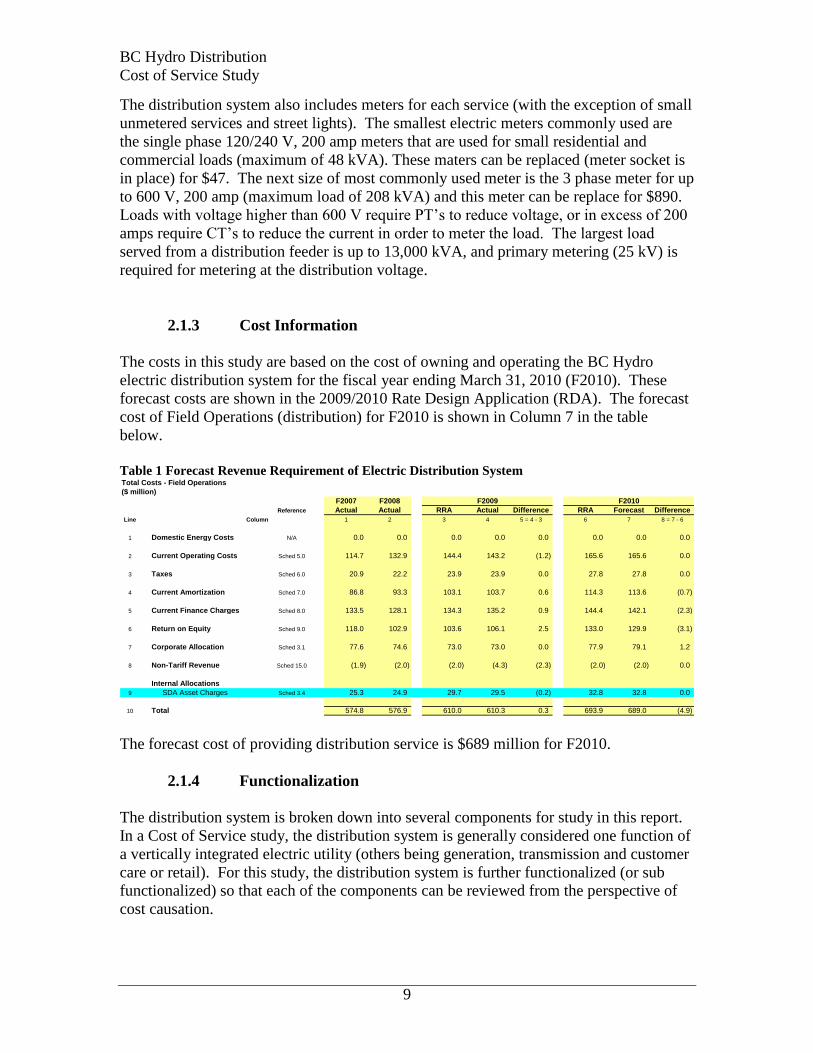
2.1.3 Cost Information
The costs in this study are based on the cost of owning and operating the BC Hydro
electric distribution system for the fiscal year ending March 31, 2010 (F2010). These
forecast costs are shown in the 2009/2010 Rate Design Application (RDA). The forecast
cost of Field Operations (distribution) for F2010 is shown in Column 7 in the table
below.
Table 1 Forecast Revenue Requirement of Electric Distribution System Total Costs - Field Operations
($ million)
F2007 F2008
Reference Actual Actual RRA Actual Difference RRA Forecast Difference
Line Column 1 2 3 4 5 = 4 - 3 6 7 8 = 7 - 6
1 Domestic Energy Costs N/A 0.0 0.0 0.0 0.0 0.0 0.0 0.0 0.0
2 Current Operating Costs Sched 5.0 114.7 132.9 144.4 143.2 (1.2) 165.6 165.6 0.0
3 Taxes Sched 6.0 20.9 22.2 23.9 23.9 0.0 27.8 27.8 0.0
4 Current Amortization Sched 7.0 86.8 93.3 103.1 103.7 0.6 114.3 113.6 (0.7)
5 Current Finance Charges Sched 8.0 133.5 128.1 134.3 135.2 0.9 144.4 142.1 (2.3)
6 Return on Equity Sched 9.0 118.0 102.9 103.6 106.1 2.5 133.0 129.9 (3.1)
7 Corporate Allocation Sched 3.1 77.6 74.6 73.0 73.0 0.0 77.9 79.1 1.2
8 Non-Tariff Revenue Sched 15.0 (1.9) (2.0) (2.0) (4.3) (2.3) (2.0) (2.0) 0.0
Internal Allocations
9 SDA Asset Charges Sched 3.4 25.3 24.9 29.7 29.5 (0.2) 32.8 32.8 0.0
10 Total 574.8 576.9 610.0 610.3 0.3 693.9 689.0 (4.9)
F2009 F2010
The forecast cost of providing distribution service is $689 million for F2010.
2.1.4 Functionalization
The distribution system is broken down into several components for study in this report.
In a Cost of Service study, the distribution system is generally considered one function of
a vertically integrated electric utility (others being generation, transmission and customer
care or retail). For this study, the distribution system is further functionalized (or sub
functionalized) so that each of the components can be reviewed from the perspective of
cost causation.
BC Hydro Distribution
Cost of Service Study
10
Some studies consider the distribution system as one integrated component, and this
approach does not allow for a detailed review of cost causation. For example, a
distribution pole may be considered one asset of the electric distribution system, and all
poles are considered as having the same purpose. However, a distribution pole in a
primary circuit has a different purpose than the pole that supports a secondary service, or
a street light. Therefore, by considering each of the functions of the electric distribution
system separately, a better insight is gained into costs of an electric distribution system.
The electric distribution system is functionalized in the following functions:
- Substation Distribution Asset (SDA)
- Primary,
- Transformers,
- Secondary,
- Meters.
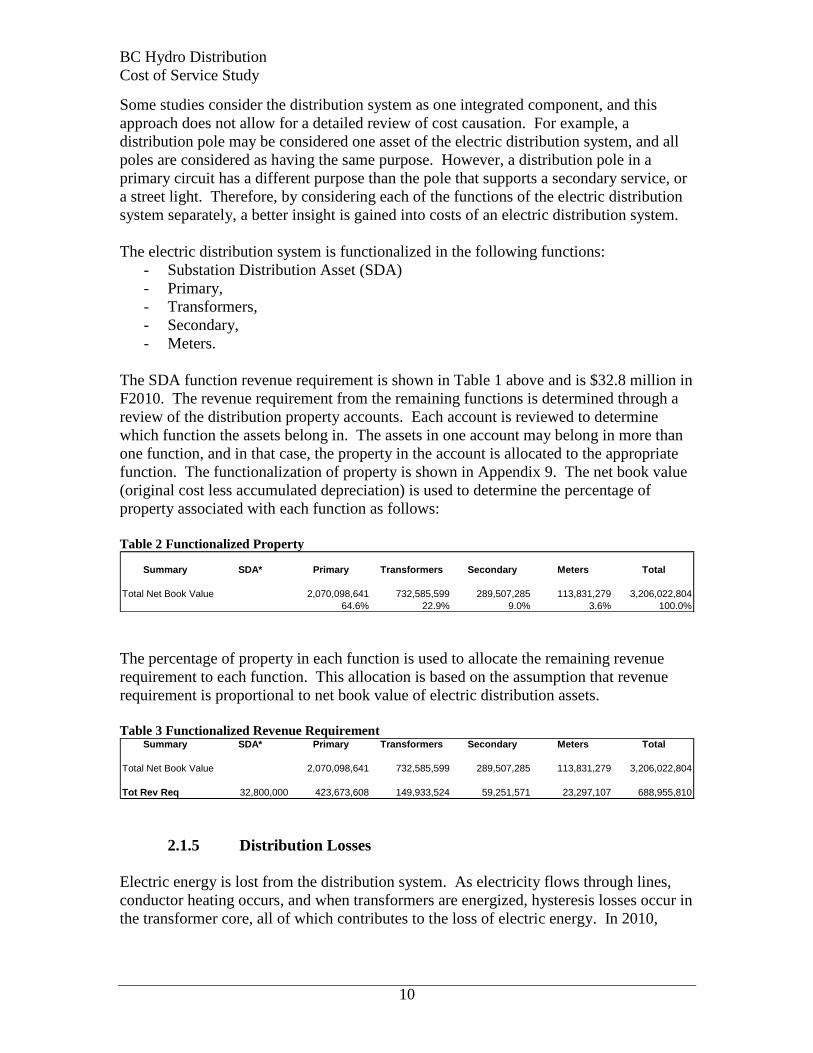
The SDA function revenue requirement is shown in Table 1 above and is $32.8 million in
F2010. The revenue requirement from the remaining functions is determined through a
review of the distribution property accounts. Each account is reviewed to determine
which function the assets belong in. The assets in one account may belong in more than
one function, and in that case, the property in the account is allocated to the appropriate
function. The functionalization of property is shown in Appendix 9. The net book value
(original cost less accumulated depreciation) is used to determine the percentage of
property associated with each function as follows:
Table 2 Functionalized Property
Summary SDA* Primary Transformers Secondary Meters Total
Total Net Book Value 2,070,098,641 732,585,599 289,507,285 113,831,279 3,206,022,804
64.6% 22.9% 9.0% 3.6% 100.0%
The percentage of property in each function is used to allocate the remaining revenue
requirement to each function. This allocation is based on the assumption that revenue
requirement is proportional to net book value of electric distribution assets.
Table 3 Functionalized Revenue Requirement
Summary SDA* Primary Transformers Secondary Meters Total
Total Net Book Value 2,070,098,641 732,585,599 289,507,285 113,831,279 3,206,022,804
Tot Rev Req 32,800,000 423,673,608 149,933,524 59,251,571 23,297,107 688,955,810
2.1.5 Distribution Losses
Electric energy is lost from the distribution system. As electricity flows through lines,
conductor heating occurs, and when transformers are energized, hysteresis losses occur in
the transformer core, all of which contributes to the loss of electric energy. In 2010,
BC Hydro Distribution
Cost of Service Study
11
57,8981 GWh of electric energy was injected into the electric distribution system and
52,6222 GWh was delivered to consumers. The difference of 5,276 GWh is lost in the
transmission and distribution system. The cost of electric energy in F10 is forecast at
$23.3/MWh and the losses are estimated at $123 million. Approximately one half of
these losses occur within the transmission system and the remainder in the distribution
system.
The cost of lost energy in the distribution system is included in the cost of energy in the
BC Hydro Cost of Service study, and therefore, the cost of losses in the distribution
system is not considered part of distribution cost in this report. While the cost of lost
energy is not considered a distribution cost within this report, the cost of distribution line
loss is a material cost and distribution losses are a function of distribution design
(distribution losses can be reduced by increasing capital costs of conductors and
transformers).
2.1.6 Rate Design
This study includes the review of electric distribution costs and classification of these
costs as demand and customer related. Rate design is influenced by several factors
including but not limited to costs. Therefore, rate design may vary from a direct view of
costs to achieve other objectives. For example, if energy conservation is a strong
objective, the fixed costs associated with a distribution system may be recovered on the
basis of an energy charge in order to provide a price signal to conserve energy. Also, if
revenue stability were a high priority for a utility, rates may be designed to vary from the
cost structure such that costs are recovered primarily on the basis of fixed monthly
charges rather than on the basis of demand or energy.
1 RRA - F10 Forecast Total Sources of Supply, Schedule 4.0
2 RRA - F10 Total Domestic Energy Sales, Schedule 14
BC Hydro Distribution
Cost of Service Study
12
3. Distribution System Cost of Service Methods
An embedded cost of service study for a vertically integrated electric utility company
includes three steps; functionalization, classification and allocation. Functionalization
results in the categorization of costs as generation, transmission, distribution and
customer care. Classification includes the categorization of costs as demand, energy or
customer related. Classification of demand related costs also includes a study of the
nature of the demand with respect to cost causation (coincident peak, non coincident
peak, etc). The last step in the process is the allocation of costs to each of the rate classes
on the basis of each rate classes’ contribution to the total demand, energy consumption,
and number of customers.
In this report, the focus is the distribution system, one of the functions of a vertically
integrated utility. This study takes the same approach as a cost of service study in that
the distribution system will be broken down into components, or sub-functions. These
sub-functions (referred to as functions for the purpose of this report) include the SDA,
primary distribution system, transformation, secondary, and meters. The second step of
classification of costs as demand, energy and customer related and is the primary focus of
this report. Classification of each of the distribution functions will be studied using
methods that include the Zero Intercept and Minimum System studies. The last step in
the study is the allocation of distribution costs to the various rate classes.
This study is based on the embedded cost of the distribution system as they occurred in
the fiscal year F2010. In some cases, replacement costs will be used to apportion
embedded costs. This study does not include the review of marginal costs or incremental
costs of electric distribution systems.
The main focus of this report is to study the classification of the electric distribution
system. Costs can be classified as demand, energy or customer related.
Costs that are variable and a function of energy production are classified as energy
related costs. Electric distribution systems do not normally have costs that vary with
energy production or delivery with the exception of losses. Capital costs associated with
reducing losses may also be classified as energy related. There were no capital
expenditures identified that could be associated with project to reduce energy losses on
the distribution system, and therefore no distribution costs are classified as energy
related.
Most distribution system costs are classified as either demand related or customer related.
Demand related costs vary as demand on the distribution system increases, and customer
related costs are proportional to the number of customers connected to the system. The
following sections deal with methods to separate demand and customer related costs.
The classification of the electric distribution system occurs on the system as it exists,
with systems grouped into similar groups. For example, in the study of the primary
distribution system, the review considered overhead, underground and underground duct
BC Hydro Distribution
Cost of Service Study
13
systems separately. A separate minimum system for each of the above systems was
determined to maintain the existing functionality of the primary distribution system.
Another approach would have been to consider the primary distribution system as one
amorphous system, and that the minimum system would have been an overhead system
(lowest cost). This latter approach would skew the results to have a heavier weighting on
demand related costs.
The determination of the minimum system is a challenge because this is a hypothetical
system, and the development of the minimum system has an impact on classification.
The minimum standard system that is constructed by BC Hydro is used to develop the
minimum system. One exception was used, and this occurred in the study of metering
costs. The minimum system for metering is an unmetered service and this would be
adequate for a system where each service notionally is required for 1 kWh per year.
However, such minimum system lacks scalability, and therefore, the minimum system for
metering was a single phase 120/240 V electric meter.
This study uses the concept of separating the distribution system into functions before
applying the various methods of classifying the distribution property. Some studies
consider the distribution system as one homogenous system, and apply various
classification methods to all property within an account such as “poles”. In study of the
electric distribution system, it becomes apparent that poles have different functions
within a distribution system depending on where they are used. For example, a pole
within the primary distribution system is used to deliver large amounts of power to a
large number of customers whereas a pole carrying a service conductor is dedicated to the
service of one customer. Intuitively, the pole in the primary distribution system has its
primary purpose as being demand related, whereas the pole in the secondary system has
its primary purpose as being customer related. Therefore, the distribution system was
studied in functions, in order to more closely study the purpose of the electric distribution
system for classification of the distribution system costs.
The concept of separating electric system costs into demand and customer costs is
somewhat abstract because the system is built to supply both demand and customers, and
one cannot be supplied without affecting the other. Therefore various methods may be
used to separate demand and customer related costs, and judgment is required in the
implementation of these studies. The National Association of Regulatory Utility
Commissioners (NARUC) published a document titled Electric Utility Cost Allocation
Manual in January 1992 that outlines methods for classifying and allocating distribution
plant. Information technology systems have improved since that time, and these
improvements have facilitated the ability to assign costs in addition to allocation
methods. The following sections provide a brief description of some of the methods used
for classifying distribution costs.
3.1. Zero Intercept Method
The zero intercept method is one of two methods identified by NARUC in the Electric
Utility Cost Allocation Manual. The foundation behind the zero intercept method is that
BC Hydro Distribution
Cost of Service Study
14
distribution system components each have a rated capacity and an associated cost. Larger
equipment has a higher rating and also a higher cost.
The Electric Utility Cost Allocation Manual describes this method as follows:3
The minimum-intercept method seeks to identify that portion of plant related to a
hypothetical no-load or zero-intercept situation. This requires considerably more data
and calculation than the minimum size method. In most instances, it is more accurate,
although the differences may be relatively small. The technique is to relate the installed
cost to current carrying capacity or demand rating, create a curve for various sizes of the
equipment involved, using regression techniques, and extend the curve to a no-load
intercept. The cost related to the zero-intercept is the customer component.
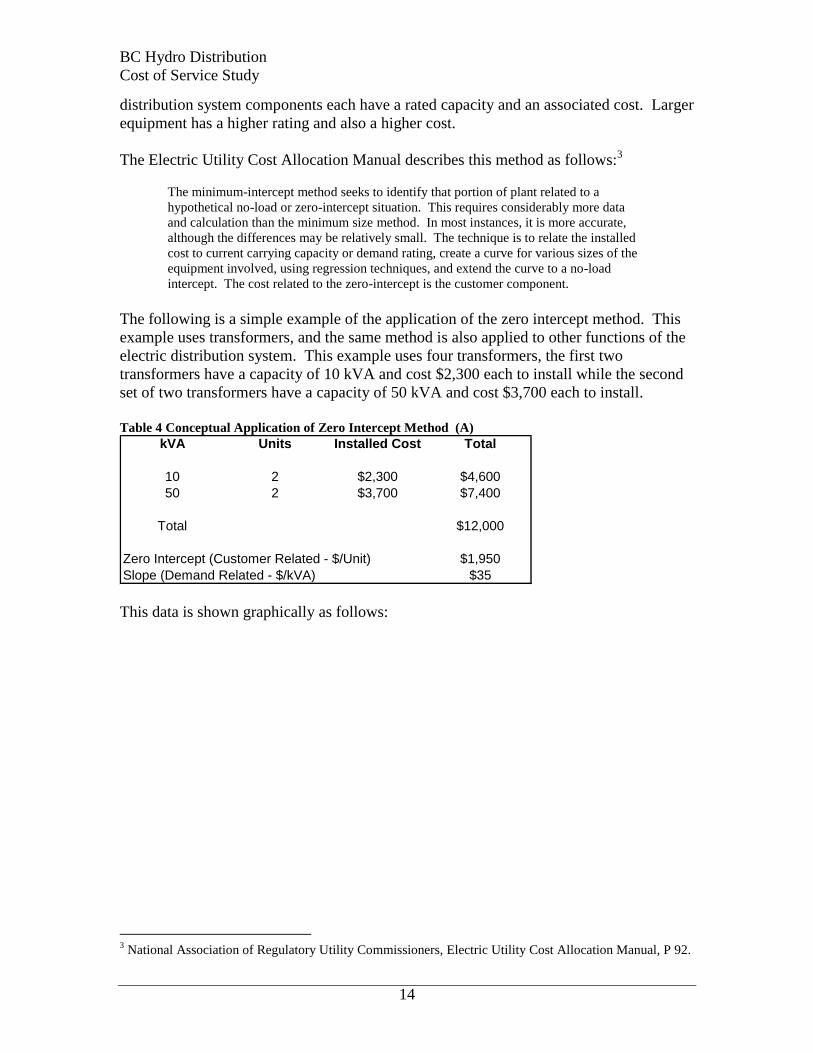
The following is a simple example of the application of the zero intercept method. This
example uses transformers, and the same method is also applied to other functions of the
electric distribution system. This example uses four transformers, the first two
transformers have a capacity of 10 kVA and cost $2,300 each to install while the second
set of two transformers have a capacity of 50 kVA and cost $3,700 each to install.
Table 4 Conceptual Application of Zero Intercept Method (A)
kVA Units Installed Cost Total
10 2 $2,300 $4,600
50 2 $3,700 $7,400
Total $12,000
Zero Intercept (Customer Related - $/Unit) $1,950
Slope (Demand Related - $/kVA) $35
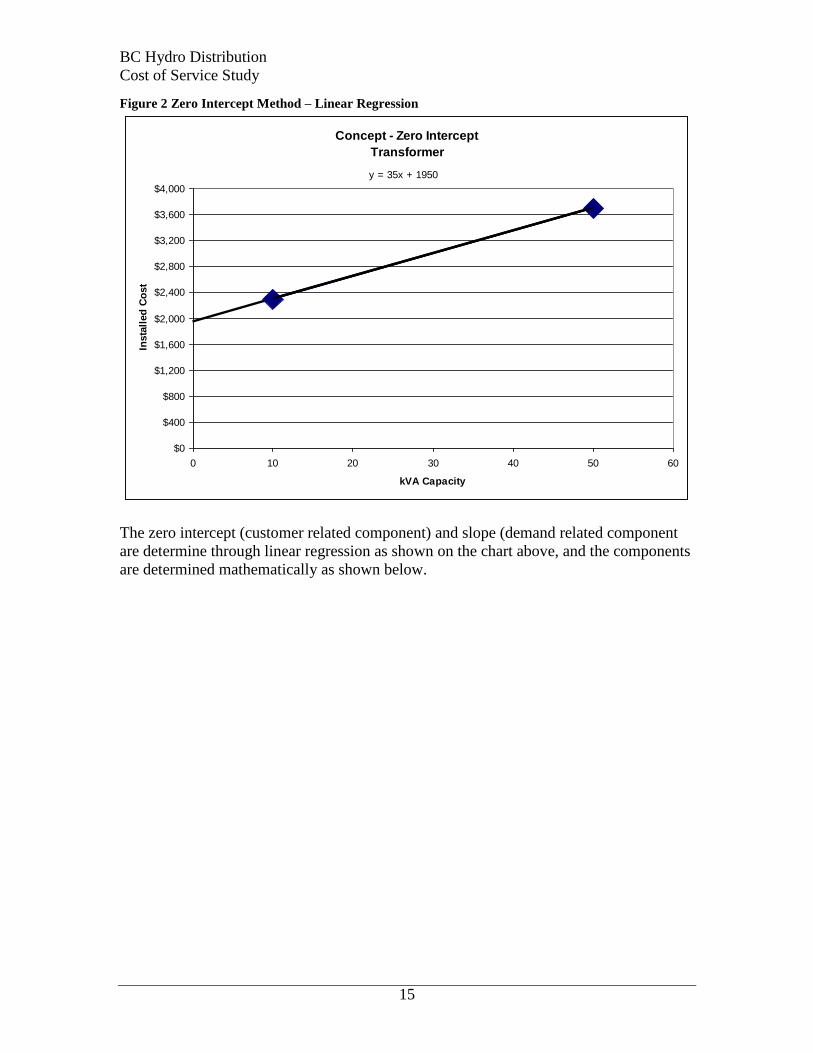
This data is shown graphically as follows:
3 National Association of Regulatory Utility Commissioners, Electric Utility Cost Allocation Manual, P 92.
BC Hydro Distribution
Cost of Service Study
15
Figure 2 Zero Intercept Method – Linear Regression
Concept - Zero Intercept
Transformer
y = 35x + 1950
$0
$400
$800
$1,200
$1,600
$2,000
$2,400
$2,800
$3,200
$3,600
$4,000
0 10 20 30 40 50 60
kVA Capacity
Insta
lled
Co
st
The zero intercept (customer related component) and slope (demand related component
are determine through linear regression as shown on the chart above, and the components
are determined mathematically as shown below.
BC Hydro Distribution
Cost of Service Study
16
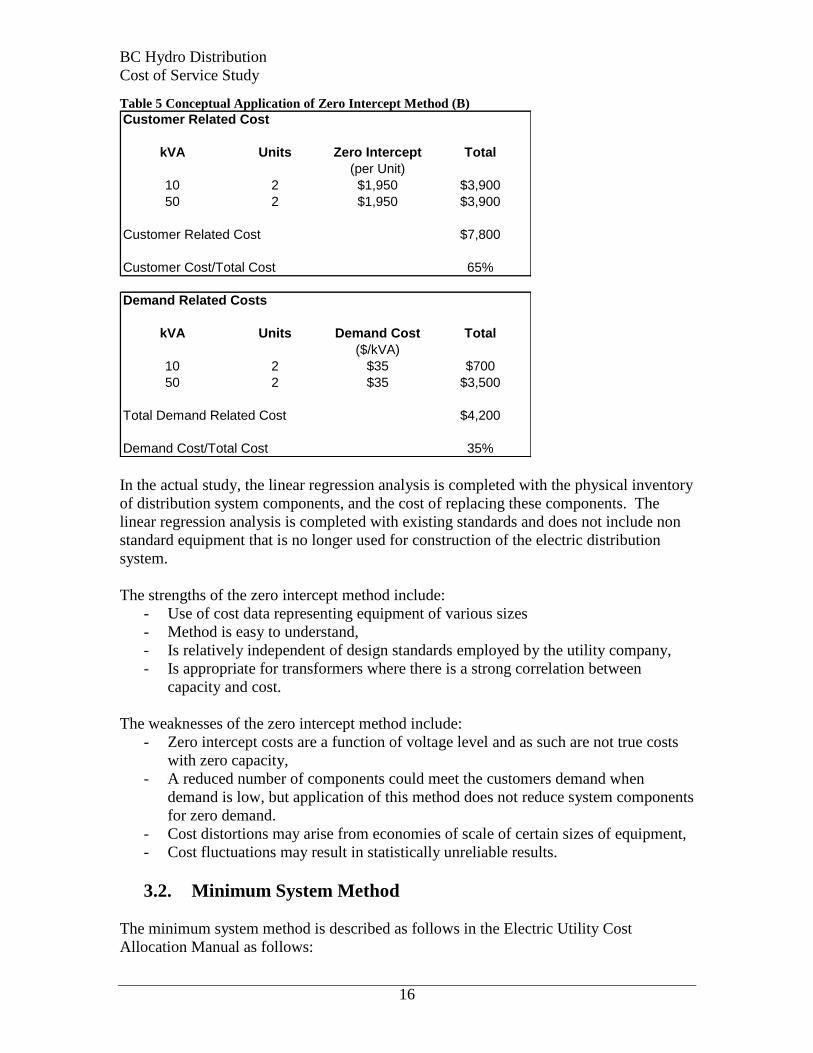
Table 5 Conceptual Application of Zero Intercept Method (B)
Customer Related Cost
kVA Units Zero Intercept Total
(per Unit)
10 2 $1,950 $3,900
50 2 $1,950 $3,900
Customer Related Cost $7,800
Customer Cost/Total Cost 65%
Demand Related Costs
kVA Units Demand Cost Total
($/kVA)
10 2 $35 $700
50 2 $35 $3,500
Total Demand Related Cost $4,200
Demand Cost/Total Cost 35%
In the actual study, the linear regression analysis is completed with the physical inventory
of distribution system components, and the cost of replacing these components. The
linear regression analysis is completed with existing standards and does not include non
standard equipment that is no longer used for construction of the electric distribution
system.
The strengths of the zero intercept method include:
- Use of cost data representing equipment of various sizes
- Method is easy to understand,
- Is relatively independent of design standards employed by the utility company,
- Is appropriate for transformers where there is a strong correlation between
capacity and cost.
The weaknesses of the zero intercept method include:
- Zero intercept costs are a function of voltage level and as such are not true costs
with zero capacity,
- A reduced number of components could meet the customers demand when
demand is low, but application of this method does not reduce system components
for zero demand.
- Cost distortions may arise from economies of scale of certain sizes of equipment,
- Cost fluctuations may result in statistically unreliable results.
3.2. Minimum System Method
The minimum system method is described as follows in the Electric Utility Cost
Allocation Manual as follows:
BC Hydro Distribution
Cost of Service Study
17
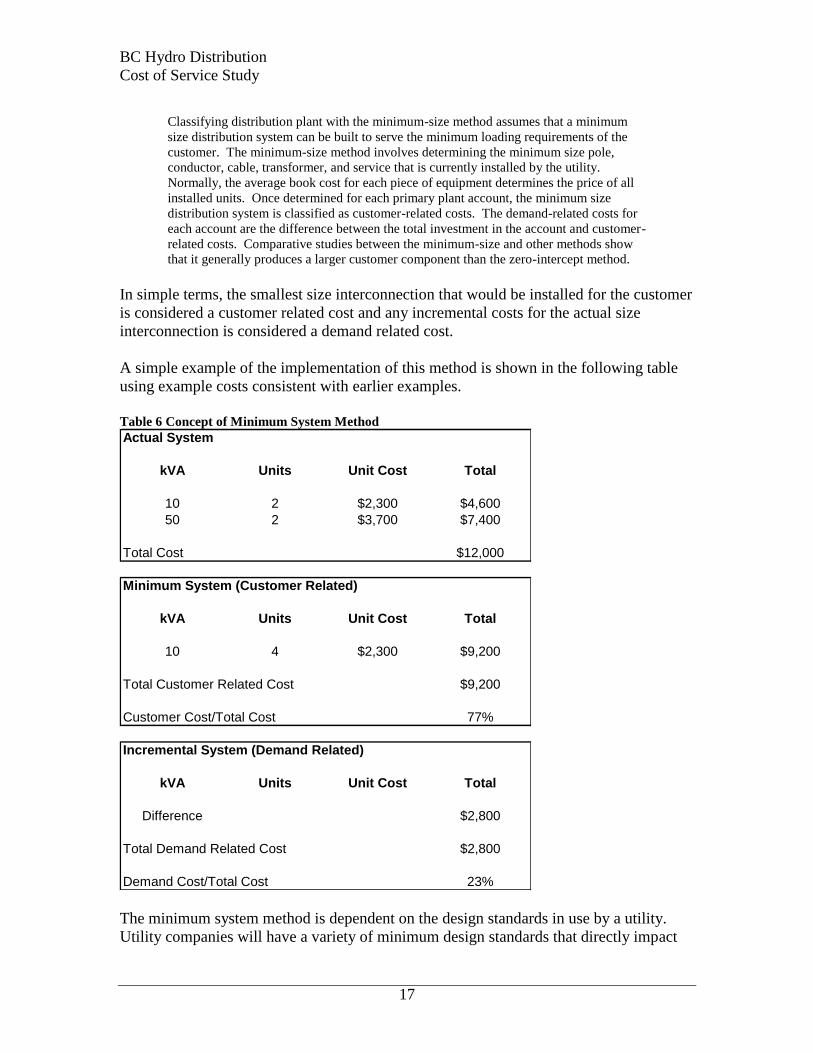
Classifying distribution plant with the minimum-size method assumes that a minimum
size distribution system can be built to serve the minimum loading requirements of the
customer. The minimum-size method involves determining the minimum size pole,
conductor, cable, transformer, and service that is currently installed by the utility.
Normally, the average book cost for each piece of equipment determines the price of all
installed units. Once determined for each primary plant account, the minimum size
distribution system is classified as customer-related costs. The demand-related costs for
each account are the difference between the total investment in the account and customer-
related costs. Comparative studies between the minimum-size and other methods show
that it generally produces a larger customer component than the zero-intercept method.
In simple terms, the smallest size interconnection that would be installed for the customer
is considered a customer related cost and any incremental costs for the actual size
interconnection is considered a demand related cost.
A simple example of the implementation of this method is shown in the following table
using example costs consistent with earlier examples.
Table 6 Concept of Minimum System Method
Actual System
kVA Units Unit Cost Total
10 2 $2,300 $4,600
50 2 $3,700 $7,400
Total Cost $12,000
Minimum System (Customer Related)
kVA Units Unit Cost Total
10 4 $2,300 $9,200
Total Customer Related Cost $9,200
Customer Cost/Total Cost 77%
Incremental System (Demand Related)
kVA Units Unit Cost Total
Difference $2,800
Total Demand Related Cost $2,800
Demand Cost/Total Cost 23%
The minimum system method is dependent on the design standards in use by a utility.
Utility companies will have a variety of minimum design standards that directly impact
BC Hydro Distribution
Cost of Service Study
18
the customer related component. Utility companies have reduced the number of sizes of
equipment in use in order to minimize costs. Invariably, utility company’s most basic
design provides for capacity that matches the load requirements for standard small
services, which is larger than the nominal service of 1 kWh/yr.
The results of the minimum system method will be dependent on the current minimum
standards, and the results of the minimum system method will be volatile when minimum
system standard change. Also, minimum system standards may change as the result of
other external factors that have no relation to the demand or customers that can be served
from the distribution system. For example, if clearance requirements increase, longer
poles are required, and the minimum system cost increases, resulting in a larger
component of costs being customer related.
The minimum system method typically results in a higher portion of costs classified as
customer related than the zero intercept method because the minimum system method
does not extrapolate costs beyond the smallest standard system. This characteristic has
resulted in some cost analysts introducing a load carrying compensation factor that
attempts to offset this customer related cost. This compensation factor, commonly
referred to as a Peak Load Carrying Capability (PLCC) adjustment factor was developed
because the minimum system method has the ability to carry load. The PLCC is an
attempt to reduce the customer related cost that result from the application of the
minimum system method as outlined by NARUC. Another approach to address this issue
would be to change the definition of a minimum system to design a hypothetical system
that does not have the ability to carry demand. The challenge with this alternative
approach is that the precise load must be defined (i.e. 1.0 kWh/yr), and the minimum
system becomes a function of this load. The PLCC also shares this same challenge in
that the load carrying capability must be determined, and each component of the
minimum system has a different load carrying capability. Therefore the quantum of the
PLCC adjustment factor becomes contentious.
The approach in this study is to use the minimum system method without further
adjustments, recognizing that the application of the method may result in a bias towards
customer related costs, depending on the construct of the minimum system.
The strengths of the minimum system method include:
- All of the fixed costs associated with the smallest electric service are considered
customer related costs,
- Easy to understand,
- Is appropriate for customer dedicated facilities such as secondary service cables.
The weaknesses of the minimum system method include:
- Different minimum size standards produce volatile results for customer related
costs,
- Various standards over time produce volatile results for customer related costs,
BC Hydro Distribution
Cost of Service Study
19
- Uses an incremental approach where customer connection is built first with ability
to provide capacity coming in second, which tends to put extra weight on
customer related costs.
- The minimum size system has inherent capacity (and scalability) associated with
it. One could adjust the minimum size standard to compensate, or further
compensation factors such as reduction for load carrying capacity may be used to
try to minimize this effect,
- The current standards for higher distribution voltages result in additional capacity
for minimal systems.
3.3. Direct Assignment of Classification
A simplification may be employed where the primary distribution feeders are considered
demand related, and where all of the service connections including transformers,
secondary conductors and meters are considered customer related. This simplification is
based on the premise that all of the service connections are constructed to connect a
customer to the system, and that primary distribution feeders are constructed only where
there is sufficient load to warrant the extension of a primary distribution line.
The strengths of the Customer Versus System method include:
- Easy to understand,
- Simplicity in that all fixed costs incurred to connect a new customer are
considered customer related costs,
- Can be used as a test against other methods to check for reasonableness.
The weaknesses of the Customer versus System method include:
- Does not take into account that primary distribution feeders may be extended to
connect a new customer,
- Does not take into account that service connections are sized to meet different
sizes of load unless analysis is completed to weight customer costs by size.
3.4. Primary System – System Additions
The primary distribution system is built primarily to serve additional load. The minimum
primary distribution system is a single phase 14.4 kV line with #2 conductor. This
minimum system has a capacity of approximately 3,000 kVA (approximately 1200
average residential customers or 25 million customers assuming 1 kWh/yr). Since it is
the addition of load (demand) that will result in the need for upgrading the primary
distribution system, regardless of the number of customers connected, the primary
distribution system is intuitively demand related. The minimum system and zero
intercept tests do not reflect intuition that the system is primarily demand related.
Therefore, the capital additions to the electric system were reviewed to develop the
classification of the primary distribution system.
Distribution planning engineers were engaged in discussions to determine from their
experience, whether the primary distribution system is built to provide demand, or to
BC Hydro Distribution
Cost of Service Study
20
connect customers. Distribution engineers classify most distribution expansion projects
as either BC Hydro initiated to upgrade capacity to maintain reliability, or customer
initiated to connect new customers. Approximately 37% of total capital additions are
customer initiated.
A review of the existing system indicates that approximately 35% of distribution property
is comprised of all functions except the primary electric distribution system. The
customer initiated capital additions will first be spent on customer related facilities such
as transformers and secondary systems. If new plant is being added in the same
proportion as the existing system, then the first 35% of capital additions will be spent on
customer interconnections, and the remaining 2% will be spent to expand the primary
distribution system.
Therefore, 2% of customer initiated projects are assumed as primary distribution system
related. For this view, the primary distribution system is classified as 98% demand
related, and 2% customer related.
3.5. Direct Assignment of Costs
With the advancements in computer technology, and proliferation of databases that track
distribution assets, a new method of completing a distribution cost of service is becoming
viable. Electric utility companies are tracking assets with computer technology that was
not practical ten to twenty years ago.
It is becoming more practical to assign distribution property and costs directly to various
rate classes for meters, secondary service and transformation. However, the primary
distribution system is shared, and judgment is required to allocate this property to rate
classes. The primary distribution system is the largest function within distribution and
therefore a significant part of the overall distribution system can not be assigned directly
to rate classes.
Distribution companies typically have computer models of the system to allow modeling
for operational purposes. These models may include detailed information on conductors
including length and conductor type for each section of line from the substation to the last
customer in the electric distribution system. Computers may be used to determine the
facilities that are dedicated to one customer (the part of the system closest to the
customer) and assign these facilities to the customer or rate class to which the customer
belongs. As you move further into the distribution system, components are shared, and
these facilities can be allocated to each customer on the basis of each customers load, and
each customers’ portion of shared facilities can be assigned to the customer or rate class
to which the customer belongs. This process continues to the substation where
essentially all of the facilities are shared and the sharing is on the basis of demand.
BC Hydro does not have systems in place to directly assign plant to individual customers,
(and the rate class under which service is provided) at this time.
BC Hydro Distribution
Cost of Service Study
21
Such methods require maintenance of extensive databases to ensure accuracy.
Practically, given the large number of components, it is very difficult to maintain an
accurate database for such a system. While direct assignments are very precise, the
accuracy is often difficult to verify because of the large number of components in a
system and its associated database.
The strengths of the direct assignment method include:
- System is very precise in that each distribution system component is analyzed for
use and assigned directly only to users of that component,
- A systematic approach that can be simply applied and requires very little
judgment,
- Is appropriate for transformers, secondary and metering.
The weaknesses of the direct assignment method include:
- Requires maintenance of databases to ensure accuracy and alignment of database
entries to actual equipment in the field,
- Distribution system databases may become useful for purposes for which they
were not initially intended, and may become unwieldy in cost of service studies,
- The primary distribution system must still be allocated to rate classes.
The direct assignment of costs to rate classes eliminates the need to classify costs for the
purpose of allocating costs across rate classes. Classifying costs may still be completed
for use in design of a rate structure.
BC Hydro Distribution
Cost of Service Study
22
4. Distribution System Functions
This following section will consider each of the distribution functions, and outline the
appropriateness of various methods for the classification of the distribution sub-function.
The five distribution functions that will be reviewed include the SDA, primary system,
transformers, secondary cables and meters.
Generally, the assets closest to the customer (meters, etc) are predominately classified as
customer related because the amount of assets are proportional to the number of
customers. The assets furthest from the customer (moving towards the transmission
system) are predominately classified as demand related because the amount of assets are
proportional to the load or demand put on the system.
4.1. Substation Distribution Asset (SDA)
The SDA is considered 100% demand related because these assets are designed and
constructed to meet the total peak load in the area. The number of customers connected
to the distribution system, down stream of the substation, has no impact on the sizing of
the substation.
4.2. Primary Distribution System
As shown in Table 2, the primary distribution system accounts for 65% of the net book
value of the electric distribution system assets.
The primary distribution system begins with a 3 phase primary distribution feeder at the
transmission step down substation (at the low side circuit breaker). The first section of
the distribution feeder, known as the primary distribution feeder is constructed with
heavy cable (500 or 750 mcm) to ensure that the cable can withstand the peak demand of
the entire load connected to the feeder. The next section of the distribution feeder is
known as the trunk line, and it is also 3 phase and may constructed with conductor that is
lighter than the primary feeder (cable is often referred to in the context of underground
cable and conductor is often referred to in the context of overhead line). The trunk lines
are constructed to meet the forecast peak demand on the trunk and typically use a 336
kcmil conductor. The last section of the primary distribution system is the branch lines,
and this component is sized to meet the total peak demand on the branch. A branch may
be extended to connect new customers. Branch lines will include 1, 2 and 3 phase lines,
and will typically have lighter conductor than primary feeders or trunk lines and will have
a minimum conductor size of #2 AWG.
The systems in place have the ability to consolidate line lengths by number of phases and
by rural and urban, but do not have the ability to consolidate line length by
feeder/trunk/branch.
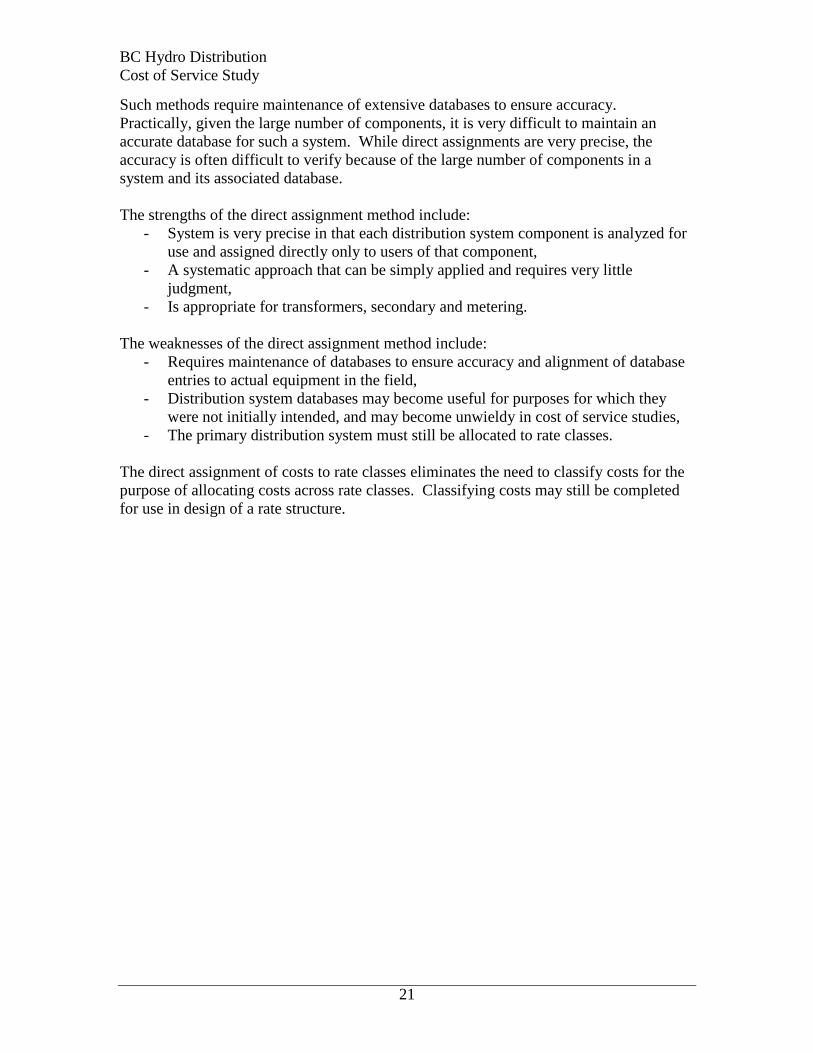
Table 7 below shows the total circuit length of the primary distribution system.
BC Hydro Distribution
Cost of Service Study
23
Table 7 Primary Distribution System Circuit Length (m)
Rural OH 1
Ph
Rural OH 2
Ph
Rural OH 3
Ph
Urban OH 1
Ph
Urban OH 2
Ph
Urban OH 3
Ph U/G 1 Ph U/G 2 Ph U/G 3 Ph
U/G 3 Ph
Feeder
Meter 24,729,437 239,558 11,913,469 6,374,357 116,016 4,670,059 4,613,125 46,777 2,409,046 1,971,879
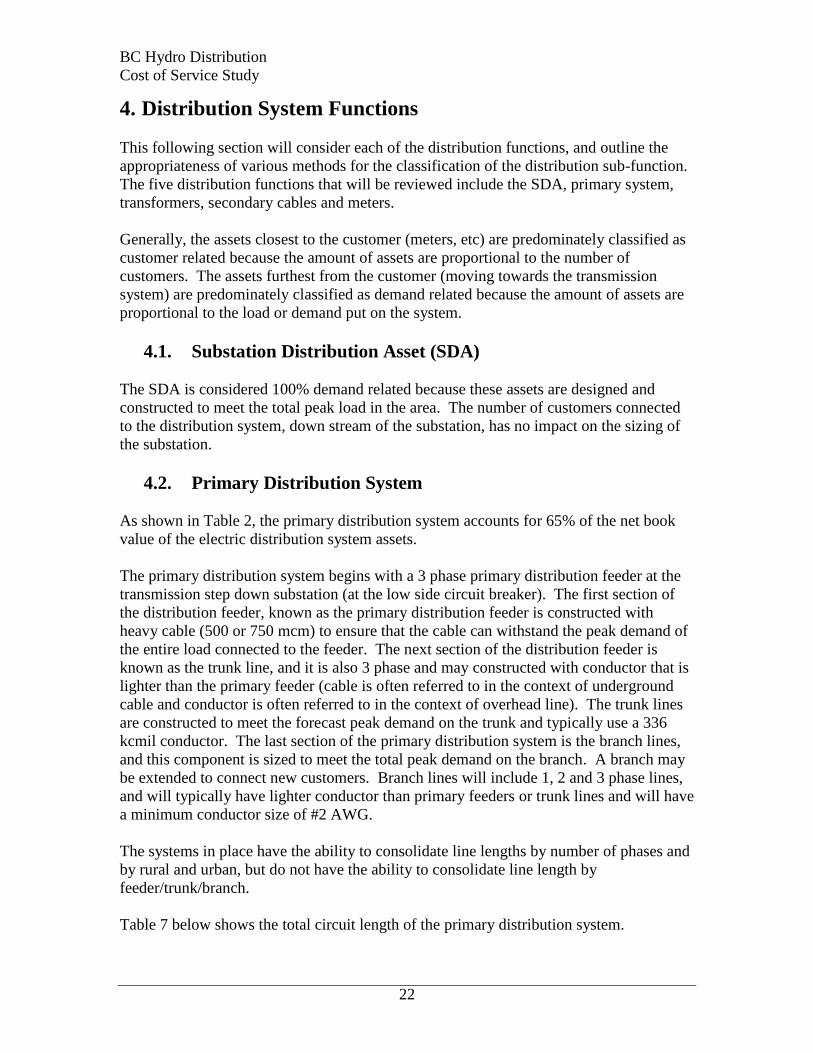
a) Zero Intercept Method
The zero intercept method uses linear regression with data for costs of lines with varying
capacity. The capacity of a line is a function of the voltage on the line, the number of
phases, and the conductor ampacity. There are various conductors, each having a
different ampacity. The following chart shows the zero intercept of overhead one phase
and three phase lines in rural areas.
Figure 3 Overhead Rural Electric Distribution System Zero Intercept
Zero Intercept
Overhead Rural Electric Distribution Liney = $0.91x + $37,301.87
$0
$10,000
$20,000
$30,000
$40,000
$50,000
$60,000
$70,000
0 5,000 10,000 15,000 20,000 25,000 30,000
Line Thermal Capacity (kVA)
Co
st
of
Lin
e /kM
BC Hydro Distribution
Cost of Service Study
24
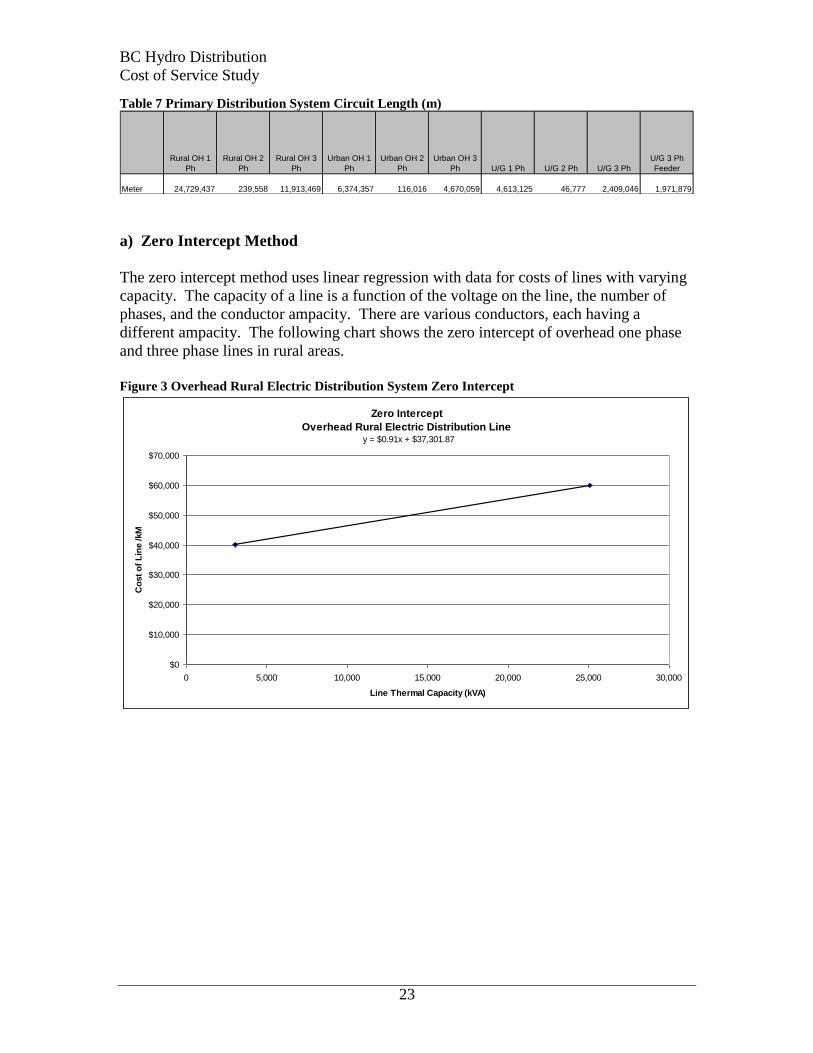
The following charts shows the zero intercept of overhead lines in urban areas.
Figure 4 Overhead Urban Electric Distribution System Zero Intercept
Zero Intercept
Overhead Urban Electric Distribution Line
y = $1.21x + $47,698.67
$0
$10,000
$20,000
$30,000
$40,000
$50,000
$60,000
$70,000
$80,000
$90,000
0 5,000 10,000 15,000 20,000 25,000 30,000
Line Thermal Capacity (kVA)
Co
st
of
Lin
e /
kM
Figure 5 Underground Urban Electric Distribution System Zero Intercept
Zero Intercept
Underground Urban Electric Distribution Line
y = $2.71x + $166,799.32
$0
$50,000
$100,000
$150,000
$200,000
$250,000
0 5,000 10,000 15,000 20,000 25,000 30,000
Line Thermal Capacity (kVA)
Co
st
of
Lin
e /
kM
The calculation of the customer related costs of the primary distribution system on the
basis of zero intercept is shown in the following table.
BC Hydro Distribution
Cost of Service Study
25
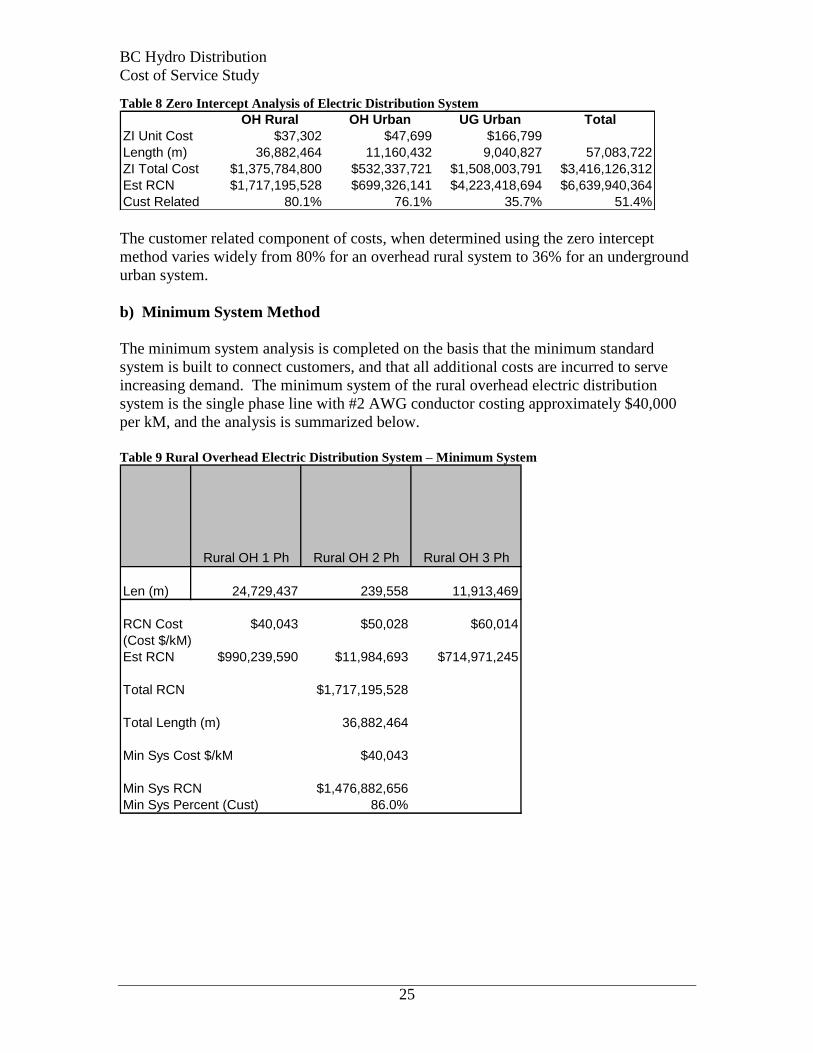
Table 8 Zero Intercept Analysis of Electric Distribution System
OH Rural OH Urban UG Urban Total
ZI Unit Cost $37,302 $47,699 $166,799
Length (m) 36,882,464 11,160,432 9,040,827 57,083,722
ZI Total Cost $1,375,784,800 $532,337,721 $1,508,003,791 $3,416,126,312
Est RCN $1,717,195,528 $699,326,141 $4,223,418,694 $6,639,940,364
Cust Related 80.1% 76.1% 35.7% 51.4%
The customer related component of costs, when determined using the zero intercept
method varies widely from 80% for an overhead rural system to 36% for an underground
urban system.
b) Minimum System Method
The minimum system analysis is completed on the basis that the minimum standard
system is built to connect customers, and that all additional costs are incurred to serve
increasing demand. The minimum system of the rural overhead electric distribution
system is the single phase line with #2 AWG conductor costing approximately $40,000
per kM, and the analysis is summarized below.
Table 9 Rural Overhead Electric Distribution System – Minimum System
Rural OH 1 Ph Rural OH 2 Ph Rural OH 3 Ph
Len (m) 24,729,437 239,558 11,913,469
RCN Cost $40,043 $50,028 $60,014
(Cost $/kM)
Est RCN $990,239,590 $11,984,693 $714,971,245
Total RCN $1,717,195,528
Total Length (m) 36,882,464
Min Sys Cost $/kM $40,043
Min Sys RCN $1,476,882,656
Min Sys Percent (Cust) 86.0%
BC Hydro Distribution
Cost of Service Study
26
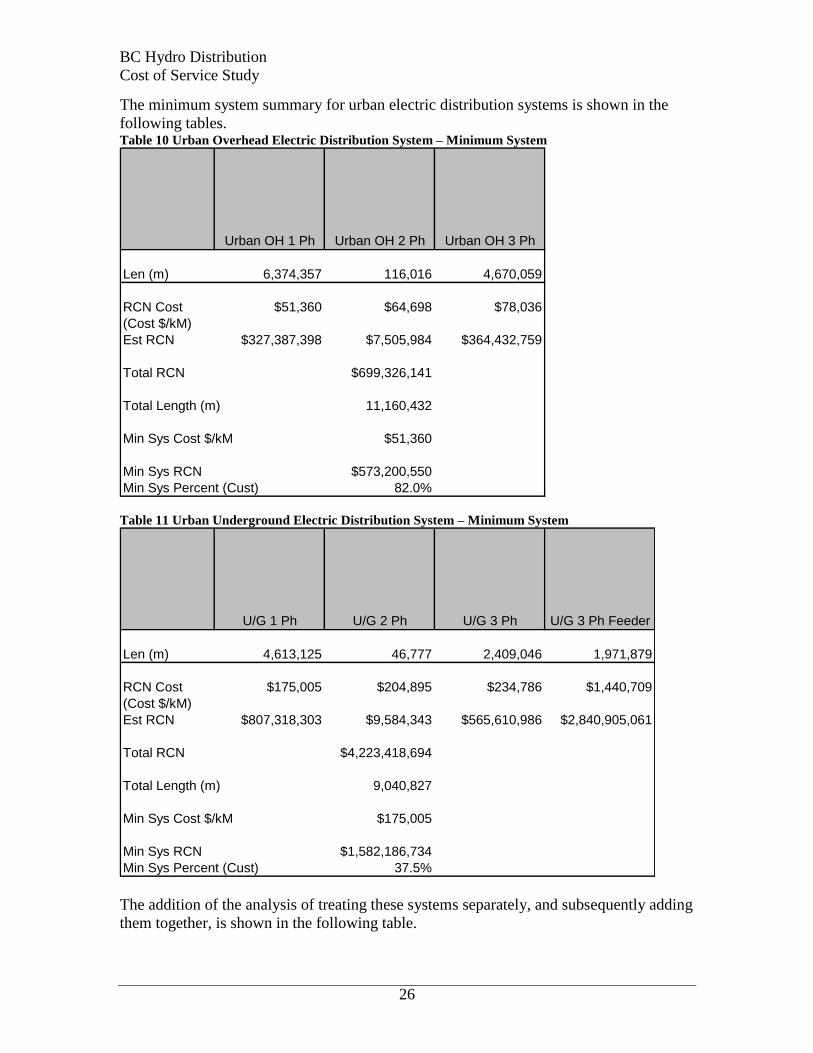
The minimum system summary for urban electric distribution systems is shown in the
following tables. Table 10 Urban Overhead Electric Distribution System – Minimum System
Urban OH 1 Ph Urban OH 2 Ph Urban OH 3 Ph
Len (m) 6,374,357 116,016 4,670,059
RCN Cost $51,360 $64,698 $78,036
(Cost $/kM)
Est RCN $327,387,398 $7,505,984 $364,432,759
Total RCN $699,326,141
Total Length (m) 11,160,432
Min Sys Cost $/kM $51,360
Min Sys RCN $573,200,550
Min Sys Percent (Cust) 82.0%
Table 11 Urban Underground Electric Distribution System – Minimum System
U/G 1 Ph U/G 2 Ph U/G 3 Ph U/G 3 Ph Feeder
Len (m) 4,613,125 46,777 2,409,046 1,971,879
RCN Cost $175,005 $204,895 $234,786 $1,440,709
(Cost $/kM)
Est RCN $807,318,303 $9,584,343 $565,610,986 $2,840,905,061
Total RCN $4,223,418,694
Total Length (m) 9,040,827
Min Sys Cost $/kM $175,005
Min Sys RCN $1,582,186,734
Min Sys Percent (Cust) 37.5%
The addition of the analysis of treating these systems separately, and subsequently adding
them together, is shown in the following table.
BC Hydro Distribution
Cost of Service Study
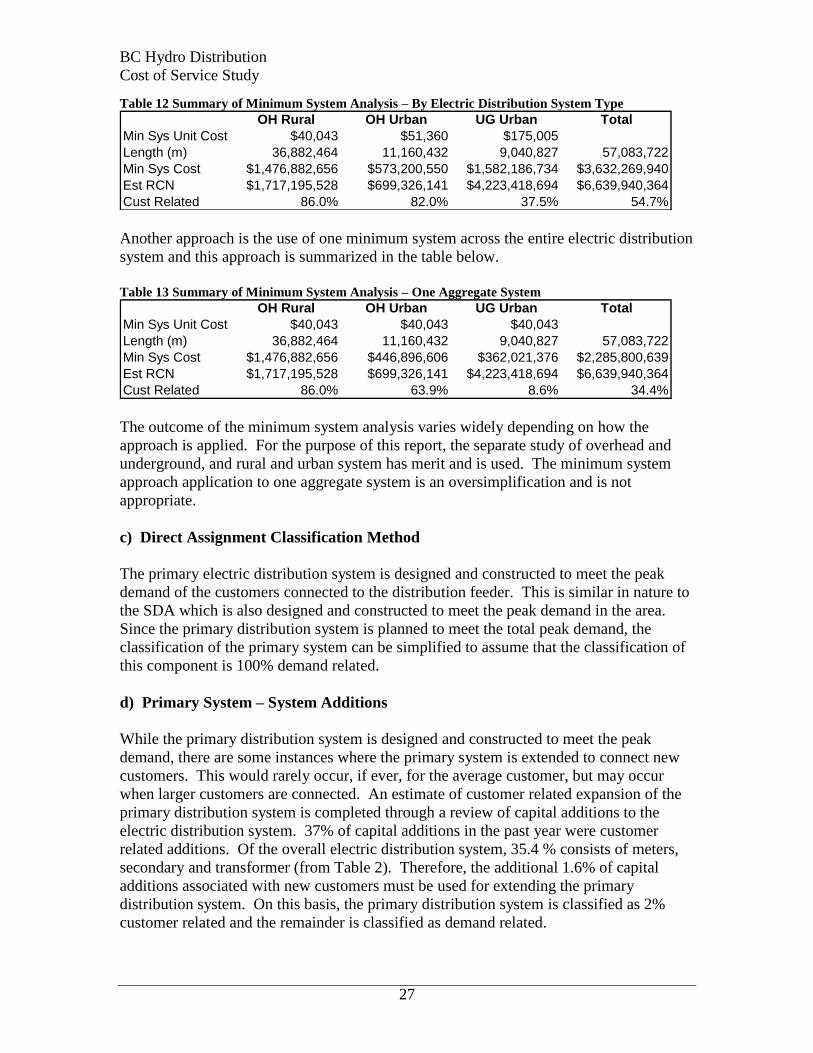
27
Table 12 Summary of Minimum System Analysis – By Electric Distribution System Type
OH Rural OH Urban UG Urban Total
Min Sys Unit Cost $40,043 $51,360 $175,005
Length (m) 36,882,464 11,160,432 9,040,827 57,083,722
Min Sys Cost $1,476,882,656 $573,200,550 $1,582,186,734 $3,632,269,940
Est RCN $1,717,195,528 $699,326,141 $4,223,418,694 $6,639,940,364
Cust Related 86.0% 82.0% 37.5% 54.7%
Another approach is the use of one minimum system across the entire electric distribution
system and this approach is summarized in the table below.
Table 13 Summary of Minimum System Analysis – One Aggregate System
OH Rural OH Urban UG Urban Total
Min Sys Unit Cost $40,043 $40,043 $40,043
Length (m) 36,882,464 11,160,432 9,040,827 57,083,722
Min Sys Cost $1,476,882,656 $446,896,606 $362,021,376 $2,285,800,639
Est RCN $1,717,195,528 $699,326,141 $4,223,418,694 $6,639,940,364
Cust Related 86.0% 63.9% 8.6% 34.4%
The outcome of the minimum system analysis varies widely depending on how the
approach is applied. For the purpose of this report, the separate study of overhead and
underground, and rural and urban system has merit and is used. The minimum system
approach application to one aggregate system is an oversimplification and is not
appropriate.
c) Direct Assignment Classification Method
The primary electric distribution system is designed and constructed to meet the peak
demand of the customers connected to the distribution feeder. This is similar in nature to
the SDA which is also designed and constructed to meet the peak demand in the area.
Since the primary distribution system is planned to meet the total peak demand, the
classification of the primary system can be simplified to assume that the classification of
this component is 100% demand related.
d) Primary System – System Additions
While the primary distribution system is designed and constructed to meet the peak
demand, there are some instances where the primary system is extended to connect new
customers. This would rarely occur, if ever, for the average customer, but may occur
when larger customers are connected. An estimate of customer related expansion of the
primary distribution system is completed through a review of capital additions to the
electric distribution system. 37% of capital additions in the past year were customer
related additions. Of the overall electric distribution system, 35.4 % consists of meters,
secondary and transformer (from Table 2). Therefore, the additional 1.6% of capital
additions associated with new customers must be used for extending the primary
distribution system. On this basis, the primary distribution system is classified as 2%
customer related and the remainder is classified as demand related.
BC Hydro Distribution
Cost of Service Study
28
4.3. Transformation
As shown in Table 2, transformation accounts for 23% of the net book value of the
electric distribution system.
Transformers were grouped into three different types, overhead, pad mount and vault.
Overhead transformers are mounted on poles or platforms above ground level and the
primary lines feeding these transformers are normally overhead lines. Pad mounted
transformers are set on a concrete pad on the ground and are normally fed from
underground primary lines. Pad mounted transformers may also be fed through overhead
lines with a riser near the pad mount transformer that converts the overhead line to an
underground line. Vault transformers are enclosed in a concrete vault and these vaults
are located underground, and are normally fed from underground primary distribution
lines.
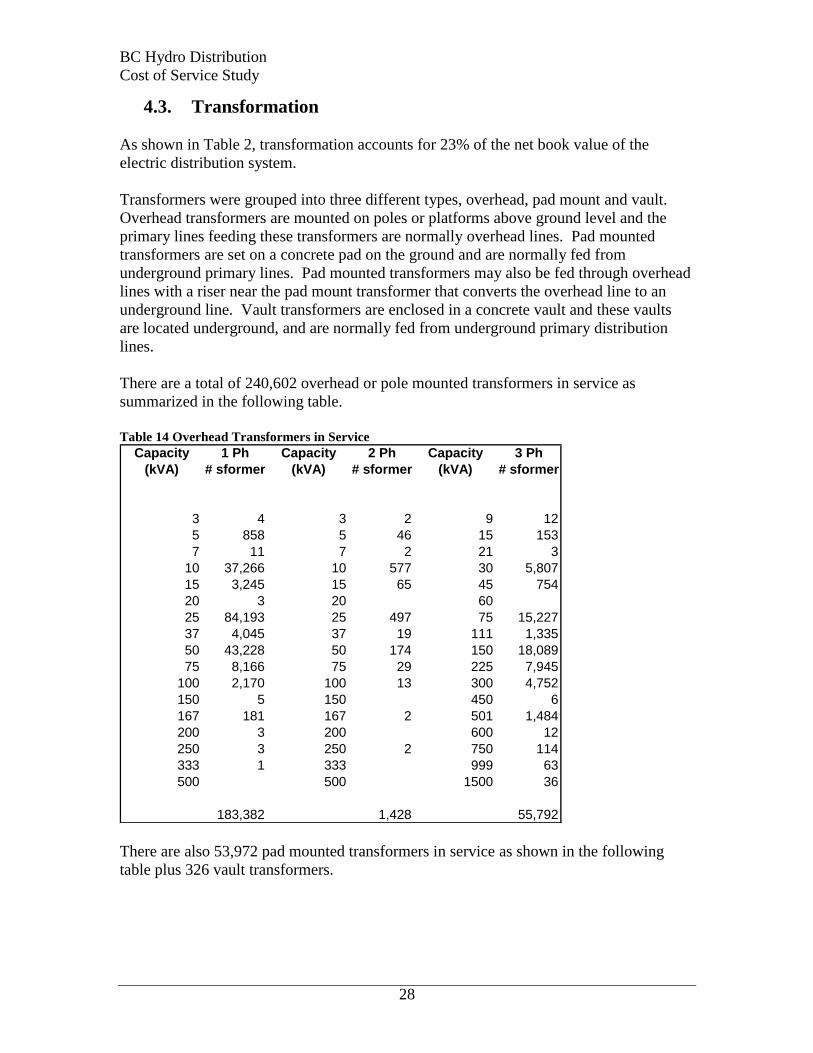
There are a total of 240,602 overhead or pole mounted transformers in service as
summarized in the following table.
Table 14 Overhead Transformers in Service
Capacity 1 Ph Capacity 2 Ph Capacity 3 Ph
(kVA) # sformer (kVA) # sformer (kVA) # sformer
3 4 3 2 9 12
5 858 5 46 15 153
7 11 7 2 21 3
10 37,266 10 577 30 5,807
15 3,245 15 65 45 754
20 3 20 60
25 84,193 25 497 75 15,227
37 4,045 37 19 111 1,335
50 43,228 50 174 150 18,089
75 8,166 75 29 225 7,945
100 2,170 100 13 300 4,752
150 5 150 450 6
167 181 167 2 501 1,484
200 3 200 600 12
250 3 250 2 750 114
333 1 333 999 63
500 500 1500 36
183,382 1,428 55,792
There are also 53,972 pad mounted transformers in service as shown in the following
table plus 326 vault transformers.
BC Hydro Distribution
Cost of Service Study
29
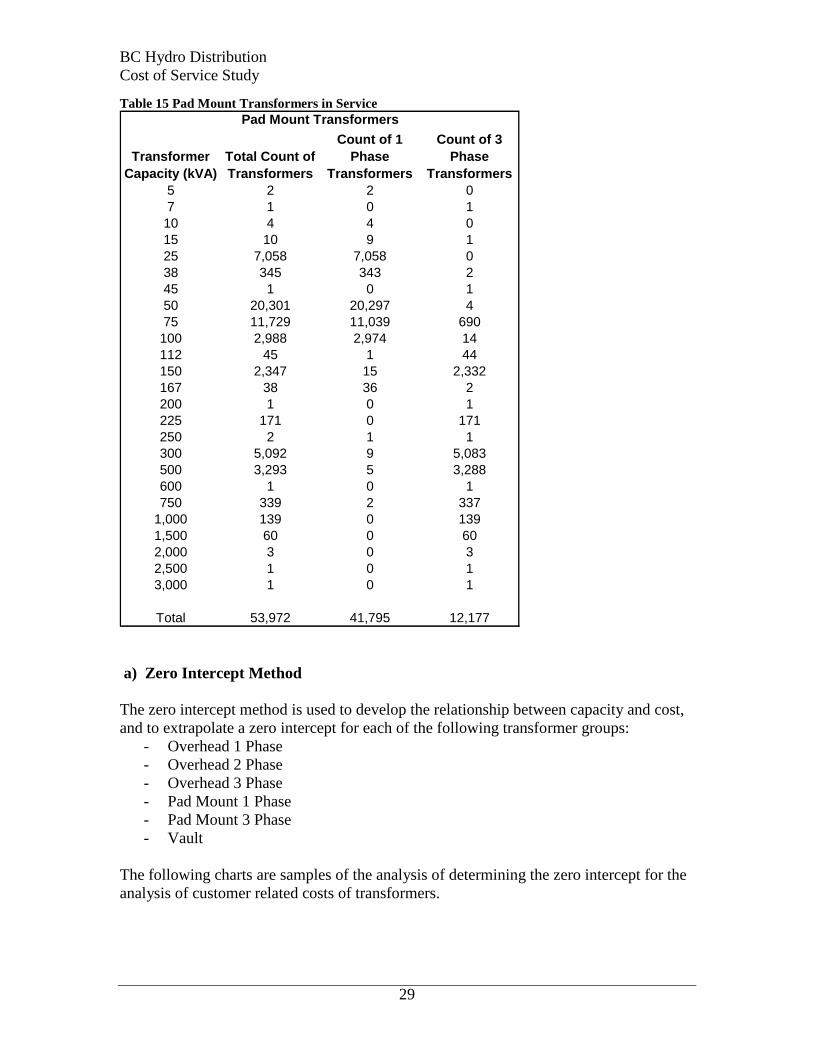
Table 15 Pad Mount Transformers in Service
Transformer
Capacity (kVA)
Total Count of
Transformers
Count of 1
Phase
Transformers
Count of 3
Phase
Transformers
5 2 2 0
7 1 0 1
10 4 4 0
15 10 9 1
25 7,058 7,058 0
38 345 343 2
45 1 0 1
50 20,301 20,297 4
75 11,729 11,039 690
100 2,988 2,974 14
112 45 1 44
150 2,347 15 2,332
167 38 36 2
200 1 0 1
225 171 0 171
250 2 1 1
300 5,092 9 5,083
500 3,293 5 3,288
600 1 0 1
750 339 2 337
1,000 139 0 139
1,500 60 0 60
2,000 3 0 3
2,500 1 0 1
3,000 1 0 1
Total 53,972 41,795 12,177
Pad Mount Transformers
a) Zero Intercept Method
The zero intercept method is used to develop the relationship between capacity and cost,
and to extrapolate a zero intercept for each of the following transformer groups:
- Overhead 1 Phase
- Overhead 2 Phase
- Overhead 3 Phase
- Pad Mount 1 Phase
- Pad Mount 3 Phase
- Vault
The following charts are samples of the analysis of determining the zero intercept for the
analysis of customer related costs of transformers.
BC Hydro Distribution
Cost of Service Study
30
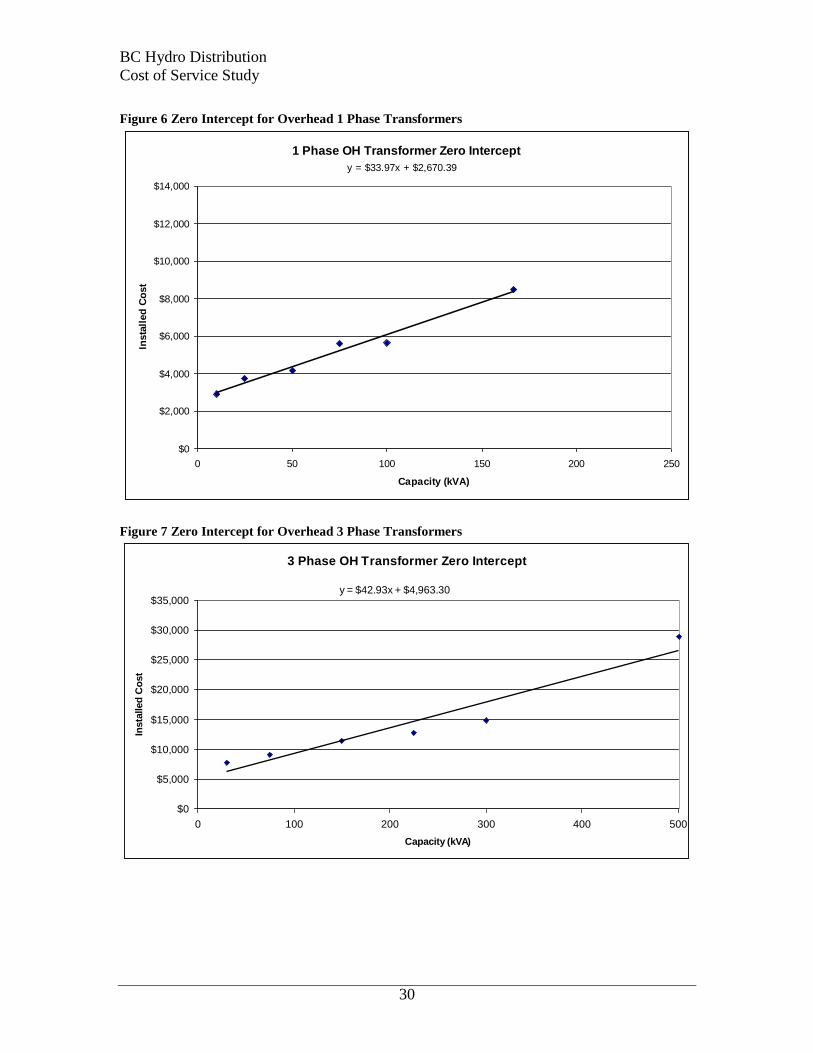
Figure 6 Zero Intercept for Overhead 1 Phase Transformers
1 Phase OH Transformer Zero Intercept
y = $33.97x + $2,670.39
$0
$2,000
$4,000
$6,000
$8,000
$10,000
$12,000
$14,000
0 50 100 150 200 250
Capacity (kVA)
Insta
lled
Co
st
Figure 7 Zero Intercept for Overhead 3 Phase Transformers
3 Phase OH Transformer Zero Intercept
y = $42.93x + $4,963.30
$0
$5,000
$10,000
$15,000
$20,000
$25,000
$30,000
$35,000
0 100 200 300 400 500
Capacity (kVA)
Insta
lled
Co
st
BC Hydro Distribution
Cost of Service Study
31
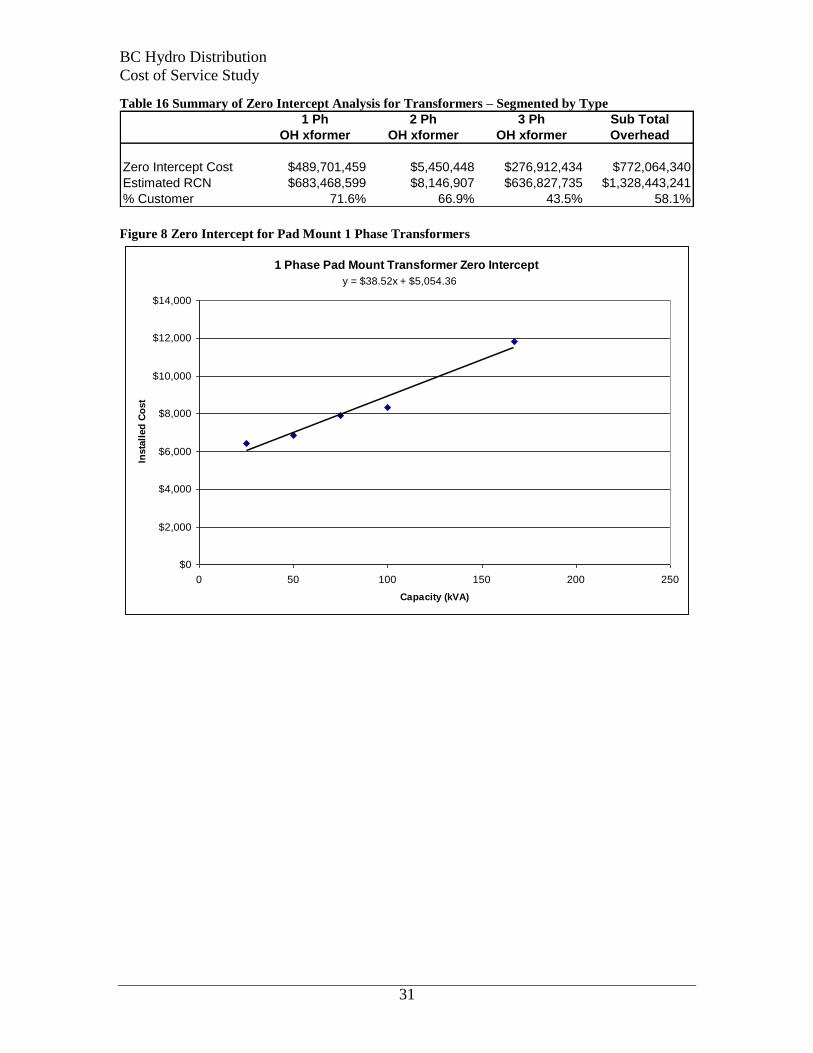
Table 16 Summary of Zero Intercept Analysis for Transformers – Segmented by Type
1 Ph 2 Ph 3 Ph Sub Total
OH xformer OH xformer OH xformer Overhead
Zero Intercept Cost $489,701,459 $5,450,448 $276,912,434 $772,064,340
Estimated RCN $683,468,599 $8,146,907 $636,827,735 $1,328,443,241
% Customer 71.6% 66.9% 43.5% 58.1% Figure 8 Zero Intercept for Pad Mount 1 Phase Transformers
1 Phase Pad Mount Transformer Zero Intercept
y = $38.52x + $5,054.36
$0
$2,000
$4,000
$6,000
$8,000
$10,000
$12,000
$14,000
0 50 100 150 200 250
Capacity (kVA)
Insta
lled
Co
st
BC Hydro Distribution
Cost of Service Study
32
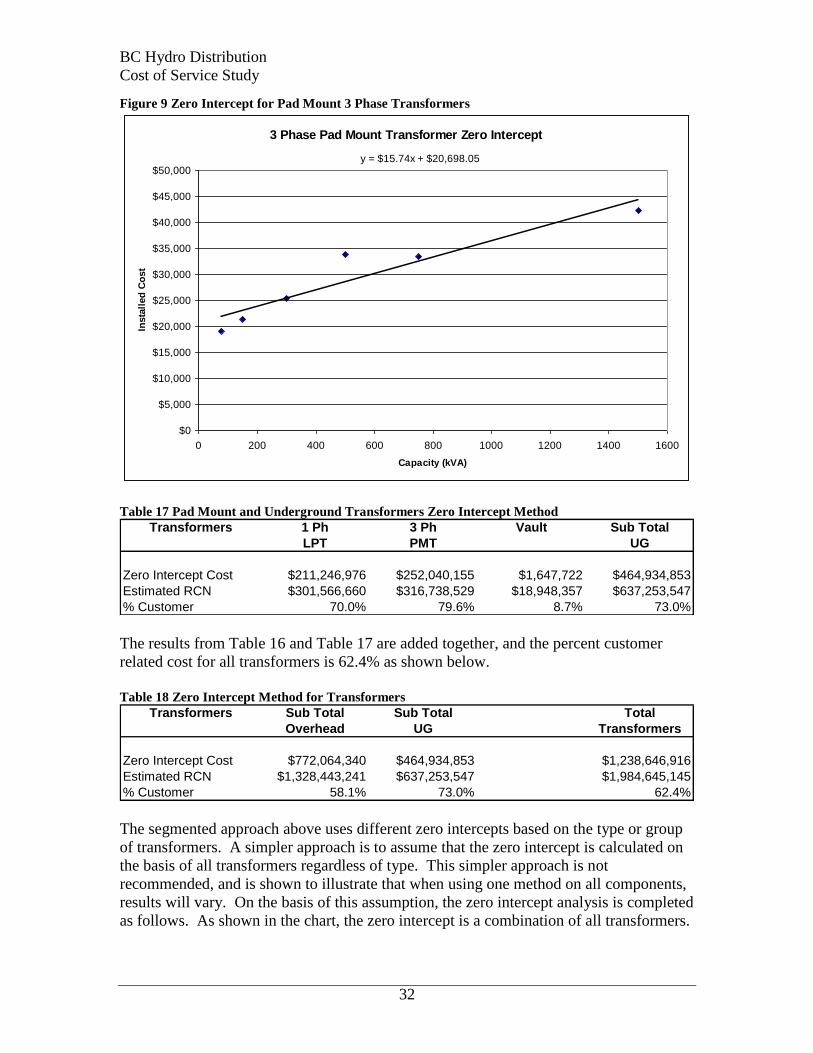
Figure 9 Zero Intercept for Pad Mount 3 Phase Transformers
3 Phase Pad Mount Transformer Zero Intercept
y = $15.74x + $20,698.05
$0
$5,000
$10,000
$15,000
$20,000
$25,000
$30,000
$35,000
$40,000
$45,000
$50,000
0 200 400 600 800 1000 1200 1400 1600
Capacity (kVA)
Insta
lled
Co
st
Table 17 Pad Mount and Underground Transformers Zero Intercept Method
Transformers 1 Ph 3 Ph Vault Sub Total
LPT PMT UG
Zero Intercept Cost $211,246,976 $252,040,155 $1,647,722 $464,934,853
Estimated RCN $301,566,660 $316,738,529 $18,948,357 $637,253,547
% Customer 70.0% 79.6% 8.7% 73.0%
The results from Table 16 and Table 17 are added together, and the percent customer
related cost for all transformers is 62.4% as shown below.
Table 18 Zero Intercept Method for Transformers
Transformers Sub Total Sub Total Total
Overhead UG Transformers
Zero Intercept Cost $772,064,340 $464,934,853 $1,238,646,916
Estimated RCN $1,328,443,241 $637,253,547 $1,984,645,145
% Customer 58.1% 73.0% 62.4%
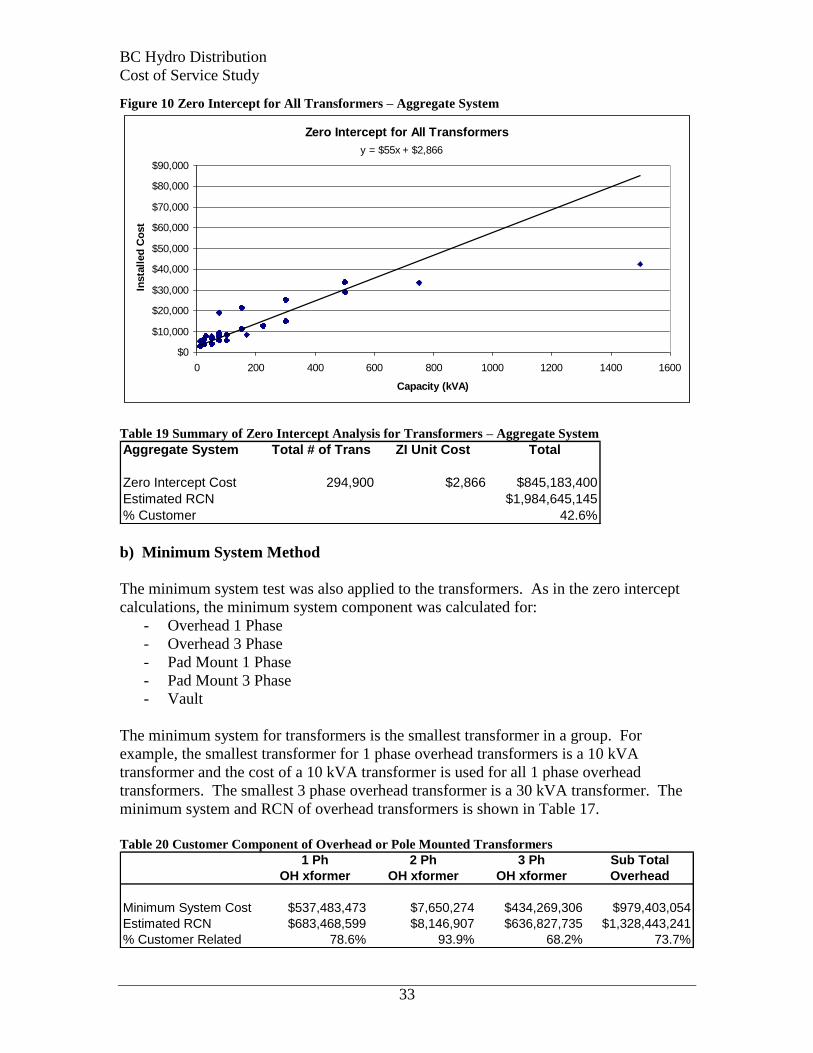
The segmented approach above uses different zero intercepts based on the type or group
of transformers. A simpler approach is to assume that the zero intercept is calculated on
the basis of all transformers regardless of type. This simpler approach is not
recommended, and is shown to illustrate that when using one method on all components,
results will vary. On the basis of this assumption, the zero intercept analysis is completed
as follows. As shown in the chart, the zero intercept is a combination of all transformers.
BC Hydro Distribution
Cost of Service Study
33
Figure 10 Zero Intercept for All Transformers – Aggregate System
Zero Intercept for All Transformers
y = $55x + $2,866
$0
$10,000
$20,000
$30,000
$40,000
$50,000
$60,000
$70,000
$80,000
$90,000
0 200 400 600 800 1000 1200 1400 1600
Capacity (kVA)
Insta
lled
Co
st
Table 19 Summary of Zero Intercept Analysis for Transformers – Aggregate System
Aggregate System Total # of Trans ZI Unit Cost Total
Zero Intercept Cost 294,900 $2,866 $845,183,400
Estimated RCN $1,984,645,145
% Customer 42.6%
b) Minimum System Method
The minimum system test was also applied to the transformers. As in the zero intercept
calculations, the minimum system component was calculated for:
- Overhead 1 Phase
- Overhead 3 Phase
- Pad Mount 1 Phase
- Pad Mount 3 Phase
- Vault
The minimum system for transformers is the smallest transformer in a group. For
example, the smallest transformer for 1 phase overhead transformers is a 10 kVA
transformer and the cost of a 10 kVA transformer is used for all 1 phase overhead
transformers. The smallest 3 phase overhead transformer is a 30 kVA transformer. The
minimum system and RCN of overhead transformers is shown in Table 17.
Table 20 Customer Component of Overhead or Pole Mounted Transformers
1 Ph 2 Ph 3 Ph Sub Total
OH xformer OH xformer OH xformer Overhead
Minimum System Cost $537,483,473 $7,650,274 $434,269,306 $979,403,054
Estimated RCN $683,468,599 $8,146,907 $636,827,735 $1,328,443,241
% Customer Related 78.6% 93.9% 68.2% 73.7%
BC Hydro Distribution
Cost of Service Study
34
The minimum system and RCN for pad mount transformers is shown in Table18. In
comparison with Table 20, the customer related component is similar to that of overhead
transformers.
Table 21 Customer Component of Pad Mount Transformers
1 Ph 3 Ph Sub Total
LPT PMT Pad Mount
Minimum System Cost $267,936,878 $233,799,374 $501,736,252
Estimated RCN $301,566,660 $316,738,529 $618,305,190
% Customer Related 88.8% 73.8% 81.1%
The minimum system and RCN for vault transformers is shown in Table 19. As shown
in this table, the customer related component is smaller than that of overhead or pad
mount transformers and this occurs as a result of the large variation in size seen with
vault transformers.
Table 22 Customer Component of Vault and All Transformers
Vault Total
Transformers
Minimum System Cost $2,089,901 $1,483,229,207
Estimated RCN $18,948,357 $1,965,696,788
% Customer Related 11.0% 75.5%
As shown in the tables above, the configuration of the distribution system, and the
sharing of transformers between customers has an impact on the portion of transformer
costs that are considered customer related. A distribution network makes use of larger
transformers that are shared by a larger group of customers, and this tends to reduce the
customer related component (and conversely increases the demand related component) of
transformer costs.
When the minimum system analysis is completed on transformers as an aggregate basis,
the minimum system becomes the smallest standard overhead transformer, and the
summary data is shown in the following table.
Table 23 Classification of Transformation on an Aggregate Basis.
Aggregate System Total # of Trans Min Cost Total
Minimum System Cost 294,900 $2,931 $864,337,155
Estimated RCN $1,965,696,788
% Customer Related 44.0%
c) Direct Assignment Classification Method
The transformers are designed and installed only when a new customer requests service.
The simplified approach is to classify all of these costs as customer related costs.
BC Hydro Distribution
Cost of Service Study
35
Improvements in databases regarding transformers may allow for direct assignment of
transformers to rate classes, eliminating the need to classify costs for the purpose of
allocating the transformation costs to rate classes. Challenges remain where shared
transformers provide service to more than one rate class.
4.4. Distribution Secondary
The distribution secondary includes the components of the distribution system that are
connected to the low side of the distribution transformer and extend to the customers
service entrance and meter. The voltage on the secondary system is 600 volts and below
and the most common secondary cable is energized at 120/240 volt for residential and
small commercial service.
The secondary system is at low voltage and has relatively high amperage. Therefore,
even though the electrical load may be small, the cables tend to be thick.
BC Hydro tracks secondary service separately from secondary cable and the distinction is
that secondary service may be shared by more than one service and secondary cable is
dedicated to one service.
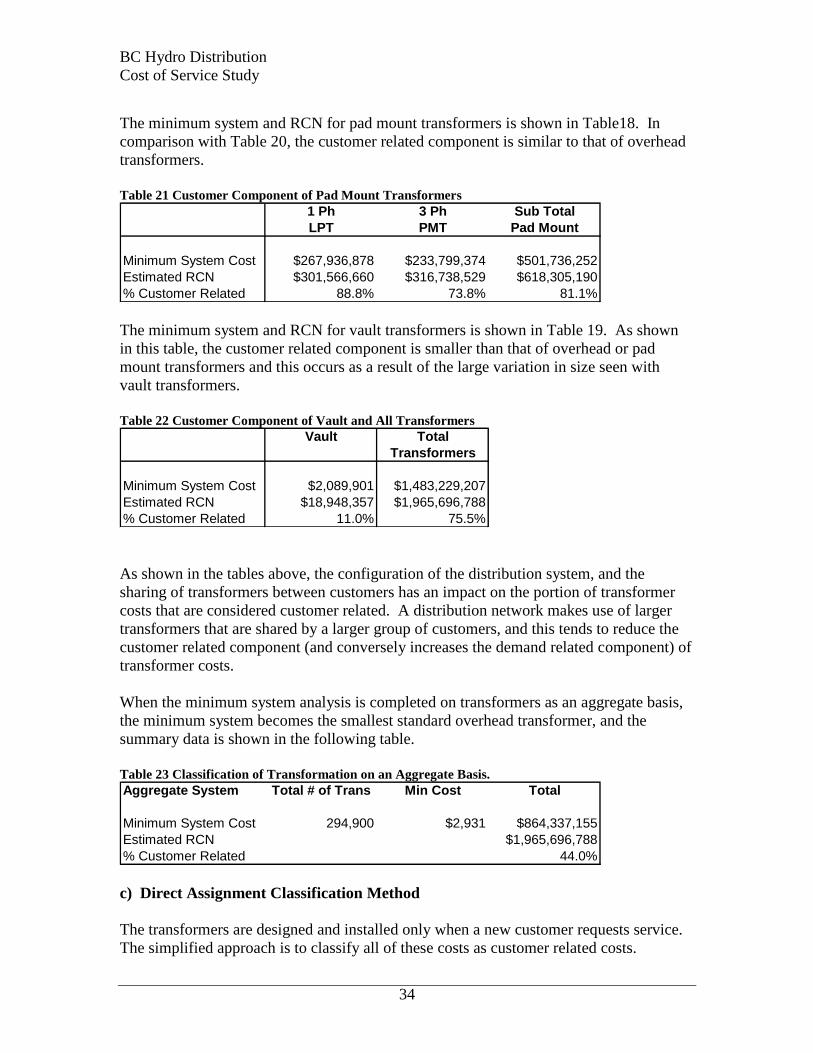
While various methods can be used to classify the secondary system as customer related
and demand related, from a practical perspective, secondary cable and secondary service
is primarily customer related. The secondary cable is installed to connect the customer
and the cable is sized to meet the forecast peak demand of the customer. Secondary
conductor and cable accounts for a small portion of the cost to install the equipment, and
therefore the zero intercept method will indicate that the majority of costs associated with
the secondary cable are customer related. Secondary conductor and cable is standardized
to a large degree, and most installations are the basic minimum system, and therefore this
method also indicates that the majority of secondary costs are customer related.
Standard secondary cable sizes have been developed based on experience. Experience
shows that it is less expensive to provide cables slightly oversized than it is to provide
cables slightly undersized which occasionally necessitates the removal and replacement
of the undersized cables.
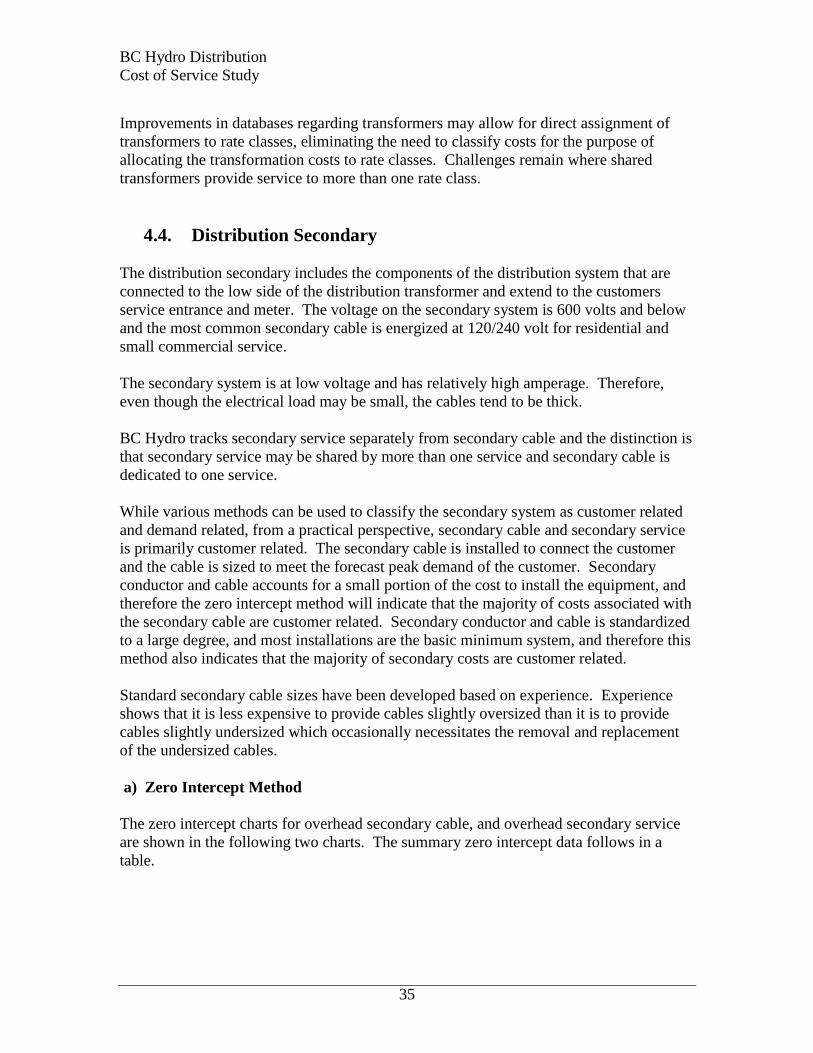
a) Zero Intercept Method
The zero intercept charts for overhead secondary cable, and overhead secondary service
are shown in the following two charts. The summary zero intercept data follows in a
table.
BC Hydro Distribution
Cost of Service Study
36
Figure 11 Zero Intercept of Overhead Secondary
OH Secondary Cable Zero Intercept
y = $184x + $16,704
$0
$5,000
$10,000
$15,000
$20,000
$25,000
$30,000
$35,000
$40,000
$45,000
$50,000
0 20 40 60 80 100 120 140 160
kVA (Capacity)
Co
st
/kM
Figure 12 Zero Intercept of Overhead Service
OH Service Cable Zero Intercept
y = $51x + $58,467
$0
$10,000
$20,000
$30,000
$40,000
$50,000
$60,000
$70,000
0 20 40 60 80 100 120 140 160
kVA (Capacity)
Co
st
/kM
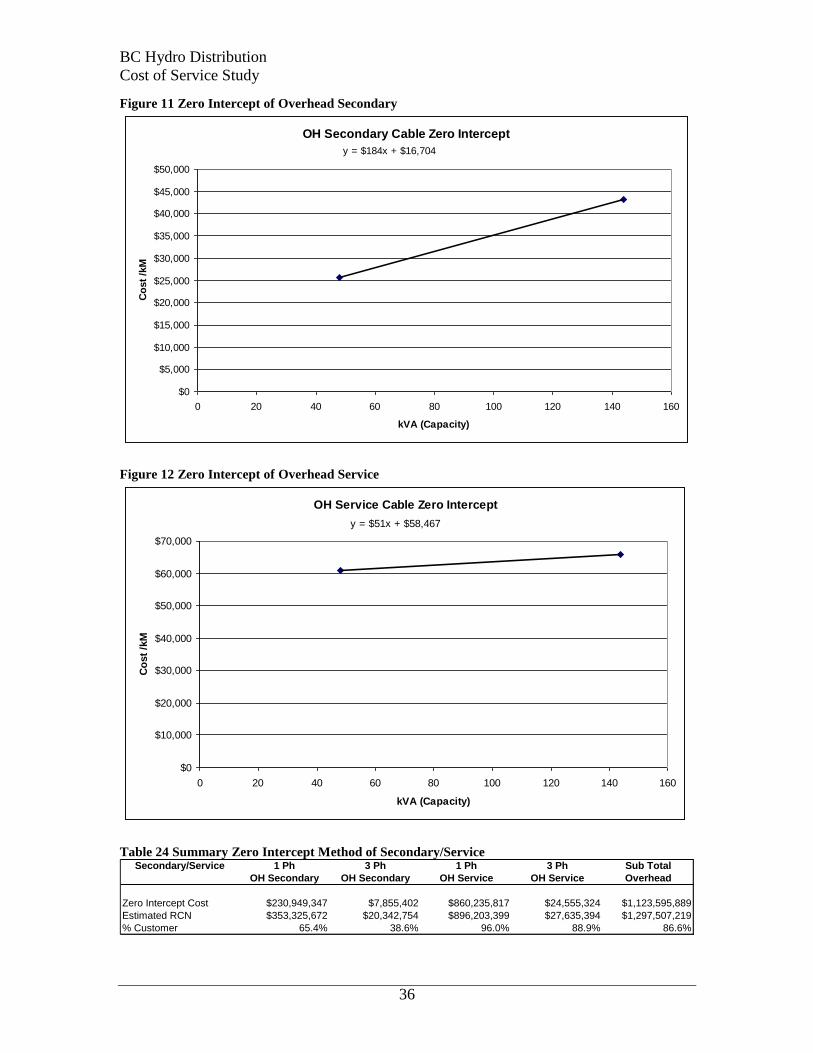
Table 24 Summary Zero Intercept Method of Secondary/Service
Secondary/Service 1 Ph 3 Ph 1 Ph 3 Ph Sub Total
OH Secondary OH Secondary OH Service OH Service Overhead
Zero Intercept Cost $230,949,347 $7,855,402 $860,235,817 $24,555,324 $1,123,595,889
Estimated RCN $353,325,672 $20,342,754 $896,203,399 $27,635,394 $1,297,507,219
% Customer 65.4% 38.6% 96.0% 88.9% 86.6%
BC Hydro Distribution
Cost of Service Study
37
Secondary/Service 1 Ph 3 Ph 1 Ph 3 Ph Sub Total
U/G Secondary U/G Secondary U/G Service U/G Service Underground
Zero Intercept Cost $0 $0 $109,420,994 $17,880,445 $127,301,440
Estimated RCN $179,547,119 $30,948,545 $145,549,737 $35,591,800 $391,637,200
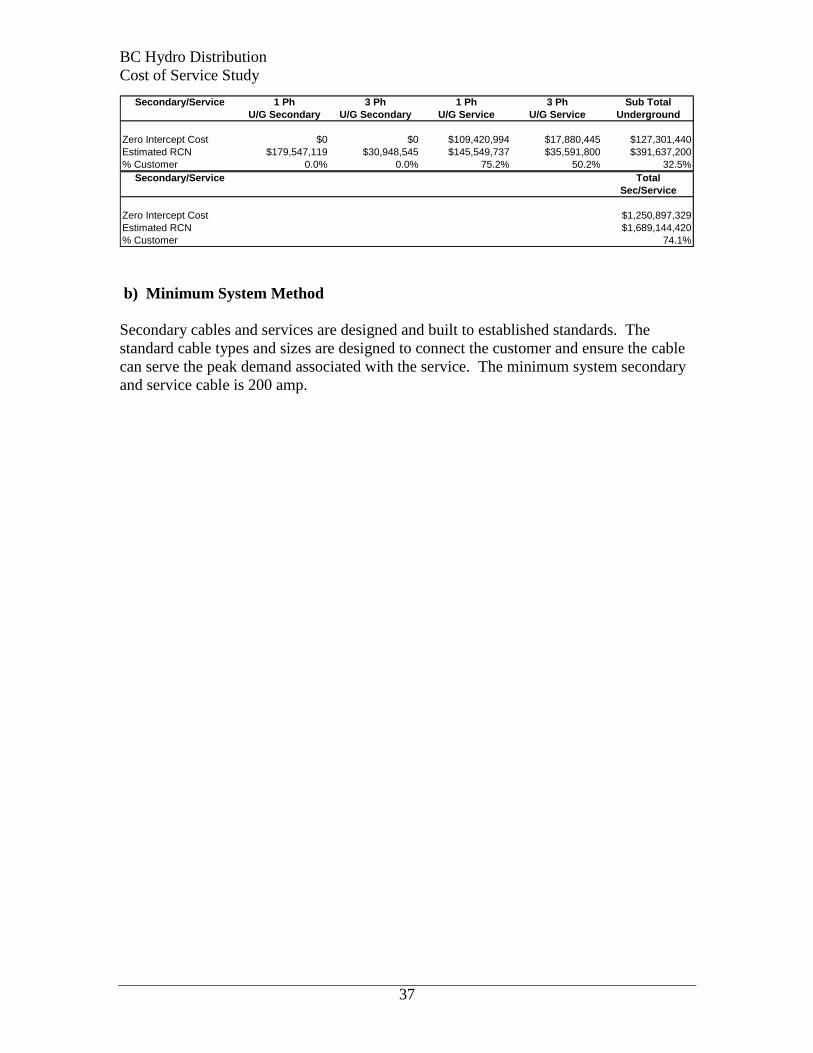
% Customer 0.0% 0.0% 75.2% 50.2% 32.5% Secondary/Service Total
Sec/Service
Zero Intercept Cost $1,250,897,329
Estimated RCN $1,689,144,420
% Customer 74.1%
b) Minimum System Method
Secondary cables and services are designed and built to established standards. The
standard cable types and sizes are designed to connect the customer and ensure the cable
can serve the peak demand associated with the service. The minimum system secondary
and service cable is 200 amp.
BC Hydro Distribution
Cost of Service Study
38
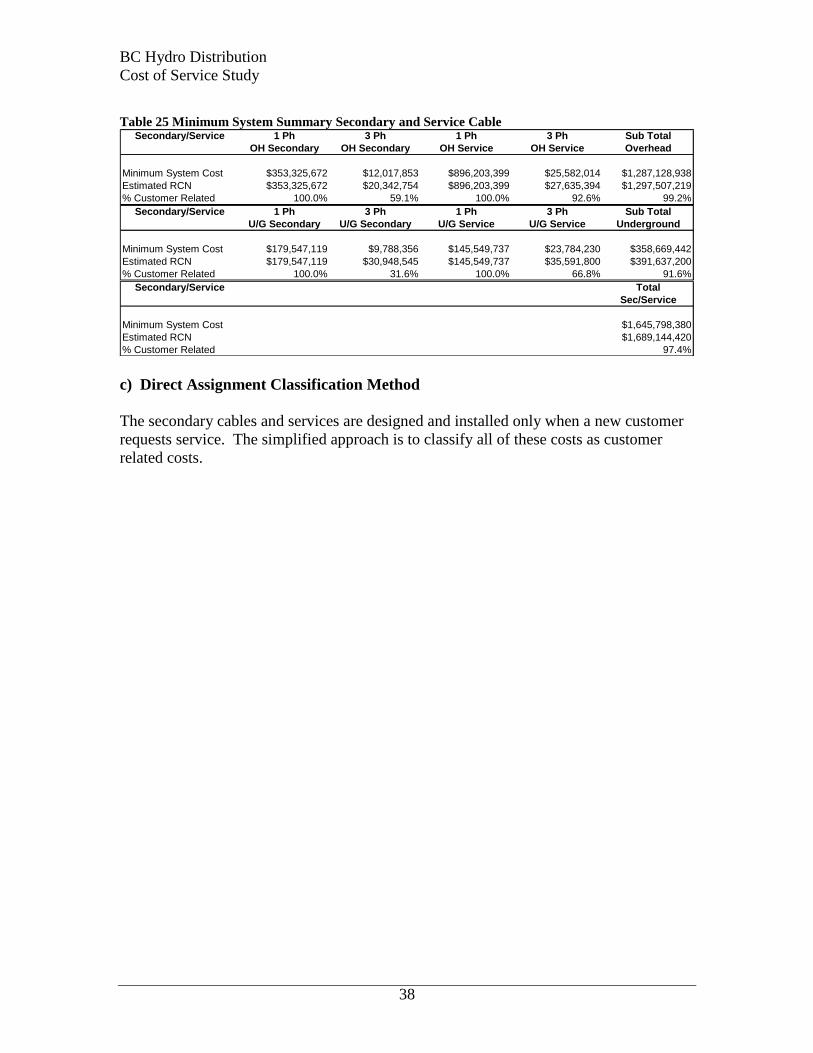
Table 25 Minimum System Summary Secondary and Service Cable
Secondary/Service 1 Ph 3 Ph 1 Ph 3 Ph Sub Total
OH Secondary OH Secondary OH Service OH Service Overhead
Minimum System Cost $353,325,672 $12,017,853 $896,203,399 $25,582,014 $1,287,128,938
Estimated RCN $353,325,672 $20,342,754 $896,203,399 $27,635,394 $1,297,507,219
% Customer Related 100.0% 59.1% 100.0% 92.6% 99.2% Secondary/Service 1 Ph 3 Ph 1 Ph 3 Ph Sub Total
U/G Secondary U/G Secondary U/G Service U/G Service Underground
Minimum System Cost $179,547,119 $9,788,356 $145,549,737 $23,784,230 $358,669,442
Estimated RCN $179,547,119 $30,948,545 $145,549,737 $35,591,800 $391,637,200
% Customer Related 100.0% 31.6% 100.0% 66.8% 91.6% Secondary/Service Total
Sec/Service
Minimum System Cost $1,645,798,380
Estimated RCN $1,689,144,420
% Customer Related 97.4%
c) Direct Assignment Classification Method
The secondary cables and services are designed and installed only when a new customer
requests service. The simplified approach is to classify all of these costs as customer
related costs.
BC Hydro Distribution
Cost of Service Study
39
4.5. Metering
Most electric services in BC Hydro’s service area have an electric meter to meter the
energy consumption and demand for each service. Customers with small and predictable
consumption, including lighting service may have an electric service without a meter, and
in these cases, the invoice for service is based on the estimated consumption. Most
electric services do include a meter. The most common meter is a single phase 120/240
Volt meter and this meter is used for most residential services. The standard 120/240
Volt meter has an ampacity of 200 amps and therefore can meter a load of up to 48 kVA.
Three phase electric meters are more expensive than 1 phase meters and also have a large
range for metered demand and energy. A typical 3 phase 480 volt meter with a capacity
of 200 amps can meter a load from 0 to 230 kVA.
When a service has voltage in excess of 600 volts (primary service) potential
transformers (PT) in a metering tank are required to transform the voltage down to a level
that is practical to meter. When peak current is greater than 200 amp, a current
transformer (CT) is used to lower the current to a lower level that is practical to meter.
The cost of instrument PT’s and CT’s increases as voltage and current increase.
While metering costs are often considered customer related, the zero intercept and
minimum system methods can be used to separate costs into customer and demand
related.
a) Zero Intercept Method
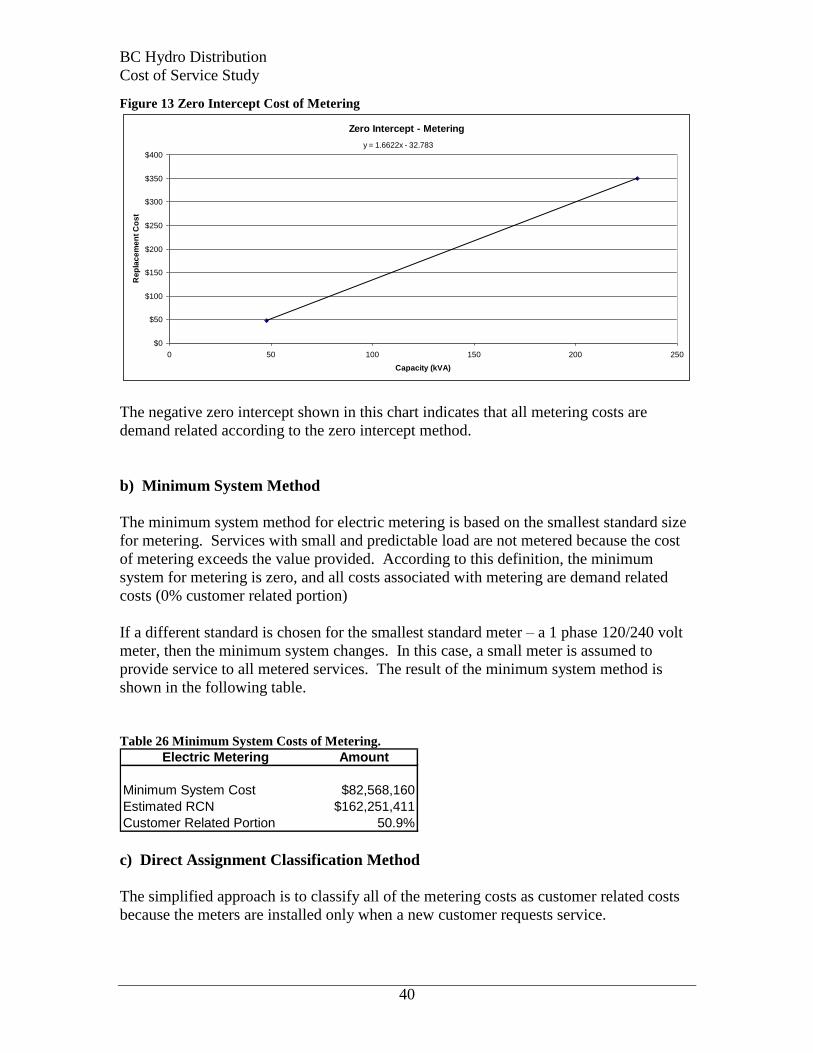
The zero intercept method is applied to meter costs for distribution voltage services as
shown in the following Figure. The zero intercept in this chart is slightly negative, which
is not intuitive. One potential explanation is that the volume of standard 1 phase 200 amp
meters is quite high and economies of scale drives down the cost of these meters, whereas
the volume of 3 phase meters is not as high and the same economies of scale are not
achieved. When a zero intercept is negative, it is set to zero to ensure that negative costs
are not applied to the account of small services. A zero intercept indicates that customer
related costs are zero and all costs are demand related costs.
The conclusion that metering costs are completely demand related is not readily intuitive
since metering costs are typically considered customer related. As shown in this
example, the methodology used can results in a range of results for the classification of
distribution property.
BC Hydro Distribution
Cost of Service Study
40
Figure 13 Zero Intercept Cost of Metering
Zero Intercept - Metering
y = 1.6622x - 32.783
$0
$50
$100
$150
$200
$250
$300
$350
$400
0 50 100 150 200 250
Capacity (kVA)
Re
pla
ce
me
nt
Co
st
The negative zero intercept shown in this chart indicates that all metering costs are
demand related according to the zero intercept method.
b) Minimum System Method
The minimum system method for electric metering is based on the smallest standard size
for metering. Services with small and predictable load are not metered because the cost
of metering exceeds the value provided. According to this definition, the minimum
system for metering is zero, and all costs associated with metering are demand related
costs (0% customer related portion)
If a different standard is chosen for the smallest standard meter – a 1 phase 120/240 volt
meter, then the minimum system changes. In this case, a small meter is assumed to
provide service to all metered services. The result of the minimum system method is
shown in the following table.
Table 26 Minimum System Costs of Metering.
Electric Metering Amount
Minimum System Cost $82,568,160
Estimated RCN $162,251,411
Customer Related Portion 50.9%
c) Direct Assignment Classification Method
The simplified approach is to classify all of the metering costs as customer related costs
because the meters are installed only when a new customer requests service.
BC Hydro Distribution
Cost of Service Study
41
The inventory and usage of electric meters is monitored, and this data can be used to
address the difficulty of classifying metering costs. The meter type (and associated cost)
is tracked for each customer, and therefore metering costs can be directly assigned to
each rate class. This eliminates the need to classify the cost in order to allocate metering
costs on the basis of customer count or demand.
The direct assignment of metering costs to each rate class will be the most precise and
accurate means of ensuring that the costs of meters are to the account of the correct rate
class.
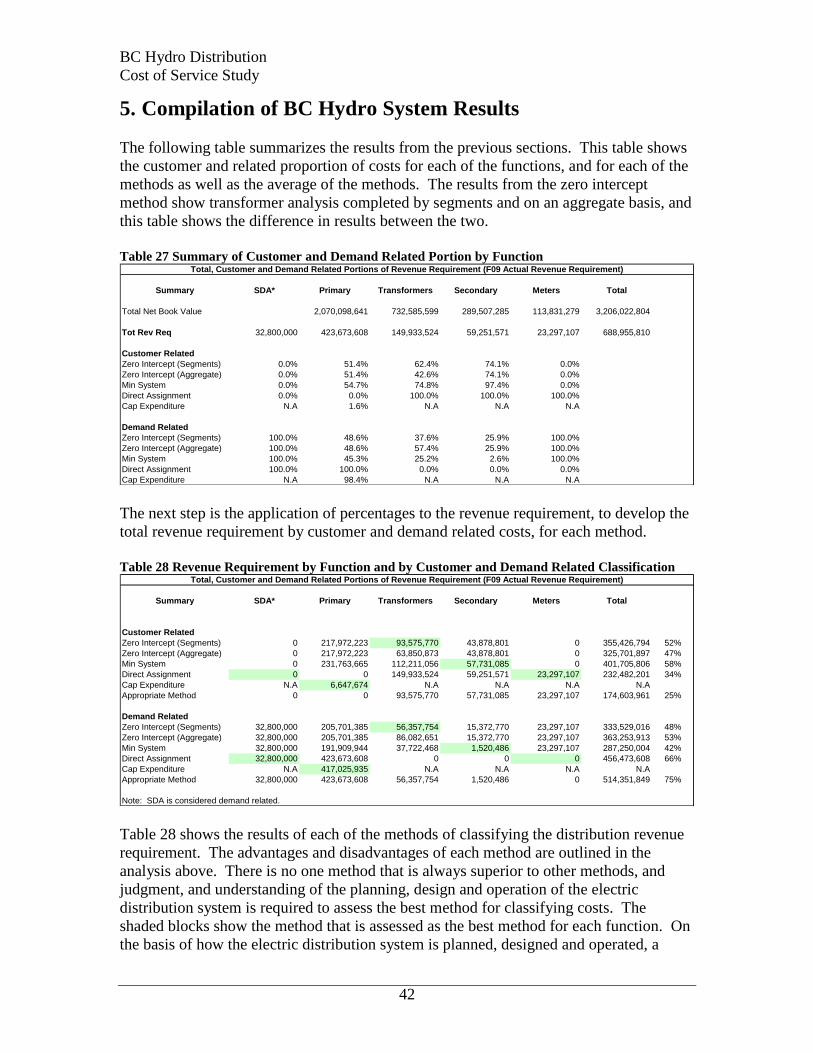
BC Hydro Distribution
Cost of Service Study
42
5. Compilation of BC Hydro System Results
The following table summarizes the results from the previous sections. This table shows
the customer and related proportion of costs for each of the functions, and for each of the
methods as well as the average of the methods. The results from the zero intercept
method show transformer analysis completed by segments and on an aggregate basis, and
this table shows the difference in results between the two.
Table 27 Summary of Customer and Demand Related Portion by Function
Summary SDA* Primary Transformers Secondary Meters Total
Total Net Book Value 2,070,098,641 732,585,599 289,507,285 113,831,279 3,206,022,804
Tot Rev Req 32,800,000 423,673,608 149,933,524 59,251,571 23,297,107 688,955,810
Customer Related
Zero Intercept (Segments) 0.0% 51.4% 62.4% 74.1% 0.0%
Zero Intercept (Aggregate) 0.0% 51.4% 42.6% 74.1% 0.0%
Min System 0.0% 54.7% 74.8% 97.4% 0.0%
Direct Assignment 0.0% 0.0% 100.0% 100.0% 100.0%
Cap Expenditure N.A 1.6% N.A N.A N.A
Demand Related
Zero Intercept (Segments) 100.0% 48.6% 37.6% 25.9% 100.0%
Zero Intercept (Aggregate) 100.0% 48.6% 57.4% 25.9% 100.0%
Min System 100.0% 45.3% 25.2% 2.6% 100.0%
Direct Assignment 100.0% 100.0% 0.0% 0.0% 0.0%
Cap Expenditure N.A 98.4% N.A N.A N.A
Total, Customer and Demand Related Portions of Revenue Requirement (F09 Actual Revenue Requirement)
The next step is the application of percentages to the revenue requirement, to develop the
total revenue requirement by customer and demand related costs, for each method.
Table 28 Revenue Requirement by Function and by Customer and Demand Related Classification
Summary SDA* Primary Transformers Secondary Meters Total
Customer Related
Zero Intercept (Segments) 0 217,972,223 93,575,770 43,878,801 0 355,426,794 52%
Zero Intercept (Aggregate) 0 217,972,223 63,850,873 43,878,801 0 325,701,897 47%
Min System 0 231,763,665 112,211,056 57,731,085 0 401,705,806 58%
Direct Assignment 0 0 149,933,524 59,251,571 23,297,107 232,482,201 34%
Cap Expenditure N.A 6,647,674 N.A N.A N.A N.A
Appropriate Method 0 0 93,575,770 57,731,085 23,297,107 174,603,961 25%
Demand Related
Zero Intercept (Segments) 32,800,000 205,701,385 56,357,754 15,372,770 23,297,107 333,529,016 48%
Zero Intercept (Aggregate) 32,800,000 205,701,385 86,082,651 15,372,770 23,297,107 363,253,913 53%
Min System 32,800,000 191,909,944 37,722,468 1,520,486 23,297,107 287,250,004 42%
Direct Assignment 32,800,000 423,673,608 0 0 0 456,473,608 66%
Cap Expenditure N.A 417,025,935 N.A N.A N.A N.A
Appropriate Method 32,800,000 423,673,608 56,357,754 1,520,486 0 514,351,849 75%
Note: SDA is considered demand related.
Total, Customer and Demand Related Portions of Revenue Requirement (F09 Actual Revenue Requirement)
Table 28 shows the results of each of the methods of classifying the distribution revenue
requirement. The advantages and disadvantages of each method are outlined in the
analysis above. There is no one method that is always superior to other methods, and
judgment, and understanding of the planning, design and operation of the electric
distribution system is required to assess the best method for classifying costs. The
shaded blocks show the method that is assessed as the best method for each function. On
the basis of how the electric distribution system is planned, designed and operated, a
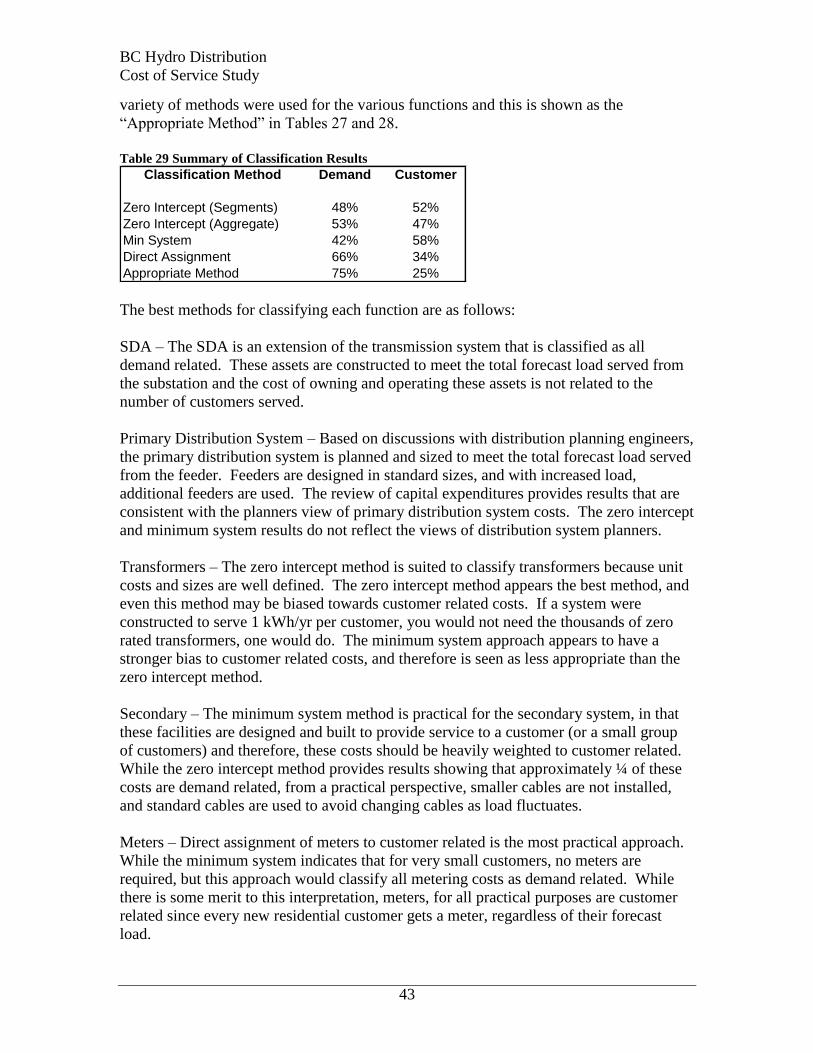
BC Hydro Distribution
Cost of Service Study
43
variety of methods were used for the various functions and this is shown as the
“Appropriate Method” in Tables 27 and 28.
Table 29 Summary of Classification Results
Classification Method Demand Customer
Zero Intercept (Segments) 48% 52%
Zero Intercept (Aggregate) 53% 47%
Min System 42% 58%
Direct Assignment 66% 34%
Appropriate Method 75% 25%
The best methods for classifying each function are as follows:
SDA – The SDA is an extension of the transmission system that is classified as all
demand related. These assets are constructed to meet the total forecast load served from
the substation and the cost of owning and operating these assets is not related to the
number of customers served.
Primary Distribution System – Based on discussions with distribution planning engineers,
the primary distribution system is planned and sized to meet the total forecast load served
from the feeder. Feeders are designed in standard sizes, and with increased load,
additional feeders are used. The review of capital expenditures provides results that are
consistent with the planners view of primary distribution system costs. The zero intercept
and minimum system results do not reflect the views of distribution system planners.
Transformers – The zero intercept method is suited to classify transformers because unit
costs and sizes are well defined. The zero intercept method appears the best method, and
even this method may be biased towards customer related costs. If a system were
constructed to serve 1 kWh/yr per customer, you would not need the thousands of zero
rated transformers, one would do. The minimum system approach appears to have a
stronger bias to customer related costs, and therefore is seen as less appropriate than the
zero intercept method.
Secondary – The minimum system method is practical for the secondary system, in that
these facilities are designed and built to provide service to a customer (or a small group
of customers) and therefore, these costs should be heavily weighted to customer related.
While the zero intercept method provides results showing that approximately ¼ of these
costs are demand related, from a practical perspective, smaller cables are not installed,
and standard cables are used to avoid changing cables as load fluctuates.
Meters – Direct assignment of meters to customer related is the most practical approach.
While the minimum system indicates that for very small customers, no meters are
required, but this approach would classify all metering costs as demand related. While
there is some merit to this interpretation, meters, for all practical purposes are customer
related since every new residential customer gets a meter, regardless of their forecast
load.
BC Hydro Distribution
Cost of Service Study
44
Summary – No one method was found ideal for all functions of the electric distribution
system. Therefore, a method was chosen for each function to best reflect cost causation.
As a result, a variety of methods was used to develop the recommendation for the
classification of the costs of the electric distribution system.
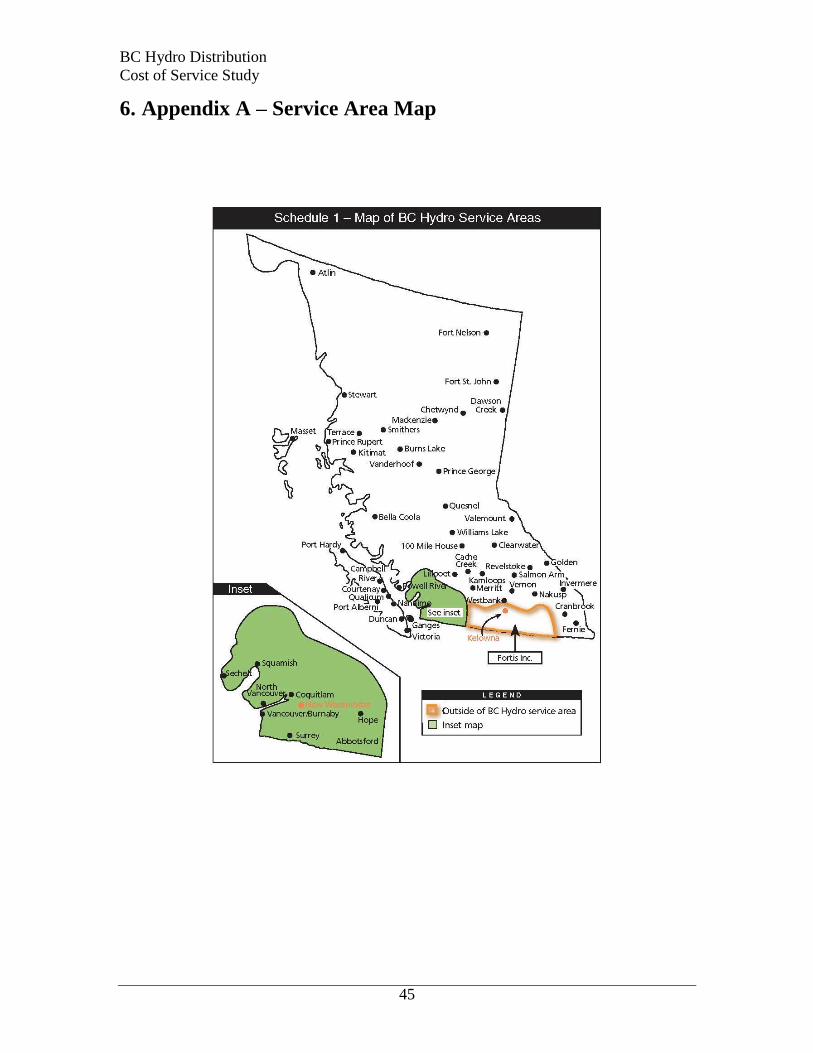
BC Hydro Distribution
Cost of Service Study
45
6. Appendix A – Service Area Map
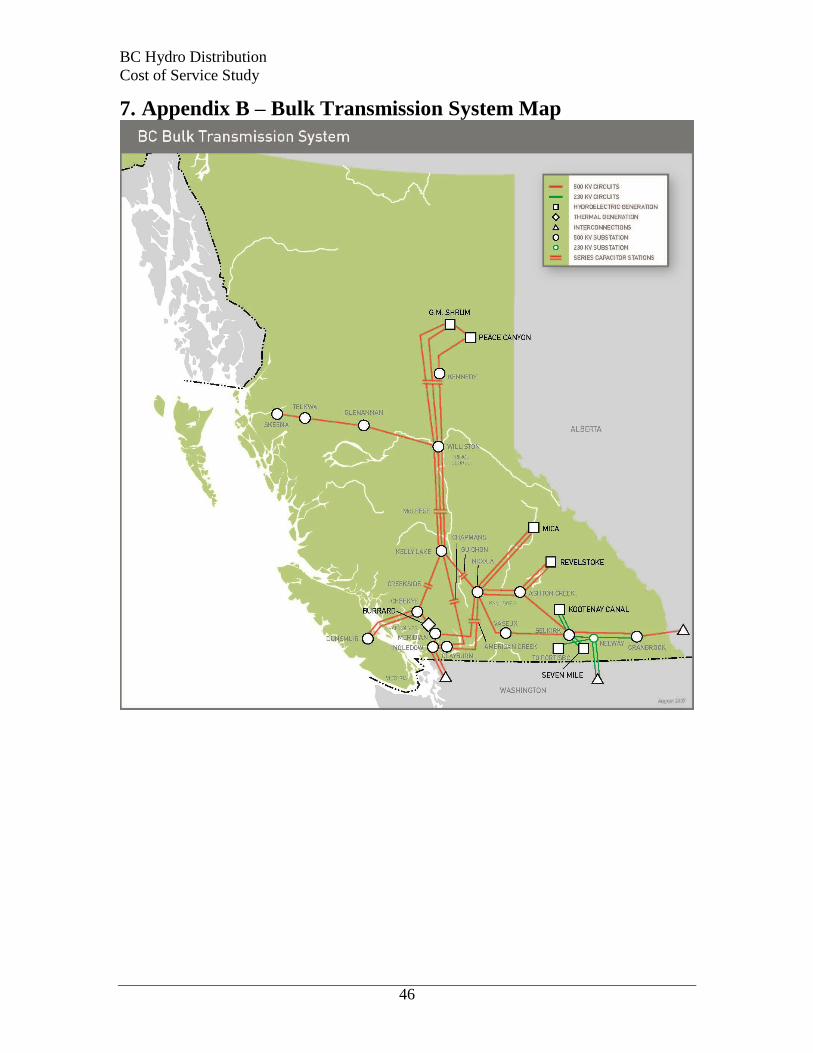
BC Hydro Distribution
Cost of Service Study
46
7. Appendix B – Bulk Transmission System Map
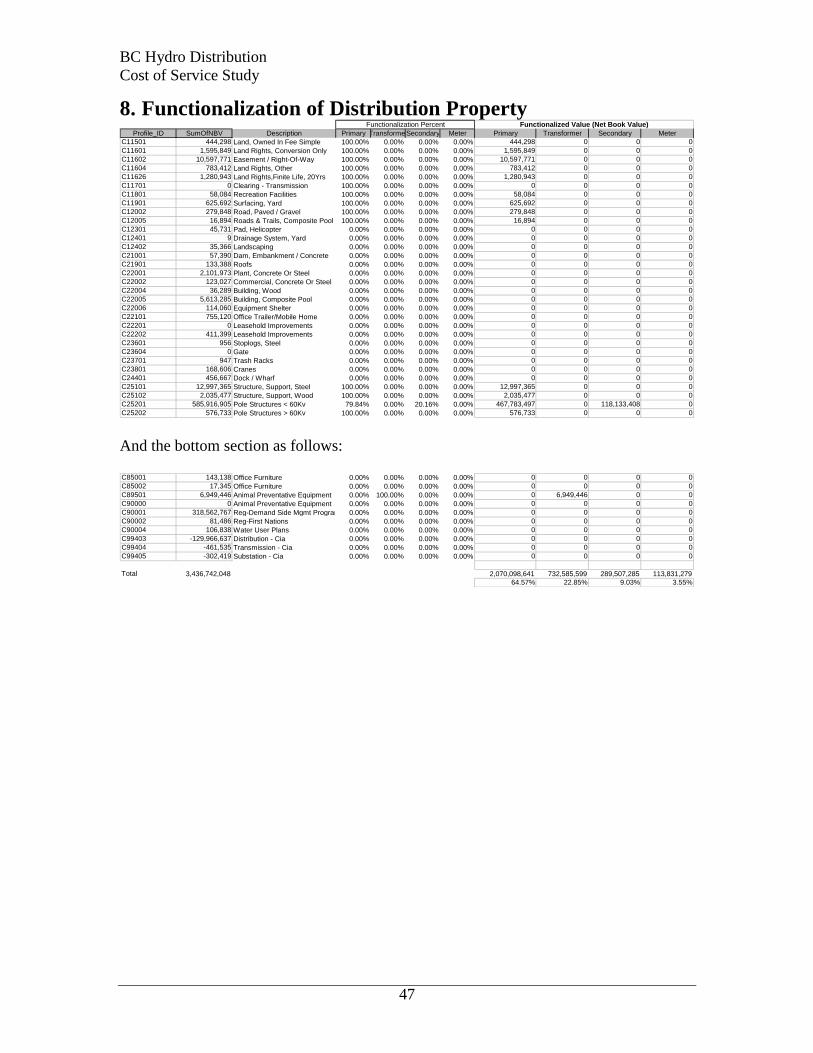
BC Hydro Distribution
Cost of Service Study
47
8. Functionalization of Distribution Property Profile_ID SumOfNBV Description Primary TransformerSecondary Meter Primary Transformer Secondary Meter
C11501 444,298 Land, Owned In Fee Simple 100.00% 0.00% 0.00% 0.00% 444,298 0 0 0
C11601 1,595,849 Land Rights, Conversion Only 100.00% 0.00% 0.00% 0.00% 1,595,849 0 0 0
C11602 10,597,771 Easement / Right-Of-Way 100.00% 0.00% 0.00% 0.00% 10,597,771 0 0 0
C11604 783,412 Land Rights, Other 100.00% 0.00% 0.00% 0.00% 783,412 0 0 0
C11626 1,280,943 Land Rights,Finite Life, 20Yrs 100.00% 0.00% 0.00% 0.00% 1,280,943 0 0 0
C11701 0 Clearing - Transmission 100.00% 0.00% 0.00% 0.00% 0 0 0 0
C11801 58,084 Recreation Facilities 100.00% 0.00% 0.00% 0.00% 58,084 0 0 0
C11901 625,692 Surfacing, Yard 100.00% 0.00% 0.00% 0.00% 625,692 0 0 0
C12002 279,848 Road, Paved / Gravel 100.00% 0.00% 0.00% 0.00% 279,848 0 0 0
C12005 16,894 Roads & Trails, Composite Pool 100.00% 0.00% 0.00% 0.00% 16,894 0 0 0
C12301 45,731 Pad, Helicopter 0.00% 0.00% 0.00% 0.00% 0 0 0 0
C12401 9 Drainage System, Yard 0.00% 0.00% 0.00% 0.00% 0 0 0 0
C12402 35,366 Landscaping 0.00% 0.00% 0.00% 0.00% 0 0 0 0
C21001 57,390 Dam, Embankment / Concrete 0.00% 0.00% 0.00% 0.00% 0 0 0 0
C21901 133,388 Roofs 0.00% 0.00% 0.00% 0.00% 0 0 0 0
C22001 2,101,973 Plant, Concrete Or Steel 0.00% 0.00% 0.00% 0.00% 0 0 0 0
C22002 123,027 Commercial, Concrete Or Steel 0.00% 0.00% 0.00% 0.00% 0 0 0 0
C22004 36,289 Building, Wood 0.00% 0.00% 0.00% 0.00% 0 0 0 0
C22005 5,613,285 Building, Composite Pool 0.00% 0.00% 0.00% 0.00% 0 0 0 0
C22006 114,060 Equipment Shelter 0.00% 0.00% 0.00% 0.00% 0 0 0 0
C22101 755,120 Office Trailer/Mobile Home 0.00% 0.00% 0.00% 0.00% 0 0 0 0
C22201 0 Leasehold Improvements 0.00% 0.00% 0.00% 0.00% 0 0 0 0
C22202 411,399 Leasehold Improvements 0.00% 0.00% 0.00% 0.00% 0 0 0 0
C23601 956 Stoplogs, Steel 0.00% 0.00% 0.00% 0.00% 0 0 0 0
C23604 0 Gate 0.00% 0.00% 0.00% 0.00% 0 0 0 0
C23701 947 Trash Racks 0.00% 0.00% 0.00% 0.00% 0 0 0 0
C23801 168,606 Cranes 0.00% 0.00% 0.00% 0.00% 0 0 0 0
C24401 456,667 Dock / Wharf 0.00% 0.00% 0.00% 0.00% 0 0 0 0
C25101 12,997,365 Structure, Support, Steel 100.00% 0.00% 0.00% 0.00% 12,997,365 0 0 0
C25102 2,035,477 Structure, Support, Wood 100.00% 0.00% 0.00% 0.00% 2,035,477 0 0 0
C25201 585,916,905 Pole Structures < 60Kv 79.84% 0.00% 20.16% 0.00% 467,783,497 0 118,133,408 0
C25202 576,733 Pole Structures > 60Kv 100.00% 0.00% 0.00% 0.00% 576,733 0 0 0
Functionalization Percent Functionalized Value (Net Book Value)
And the bottom section as follows:
C85001 143,138 Office Furniture 0.00% 0.00% 0.00% 0.00% 0 0 0 0
C85002 17,345 Office Furniture 0.00% 0.00% 0.00% 0.00% 0 0 0 0
C89501 6,949,446 Animal Preventative Equipment 0.00% 100.00% 0.00% 0.00% 0 6,949,446 0 0
C90000 0 Animal Preventative Equipment 0.00% 0.00% 0.00% 0.00% 0 0 0 0
C90001 318,562,767 Reg-Demand Side Mgmt Program 0.00% 0.00% 0.00% 0.00% 0 0 0 0
C90002 81,486 Reg-First Nations 0.00% 0.00% 0.00% 0.00% 0 0 0 0
C90004 106,838 Water User Plans 0.00% 0.00% 0.00% 0.00% 0 0 0 0
C99403 -129,966,637 Distribution - Cia 0.00% 0.00% 0.00% 0.00% 0 0 0 0
C99404 -461,535 Transmission - Cia 0.00% 0.00% 0.00% 0.00% 0 0 0 0
C99405 -302,419 Substation - Cia 0.00% 0.00% 0.00% 0.00% 0 0 0 0
Total 3,436,742,048 2,070,098,641 732,585,599 289,507,285 113,831,279
64.57% 22.85% 9.03% 3.55%