Embed Size (px)
Citation preview
Pacific Ocean Atlantic Ocean
S1 Arctic Ocean
United States
Canada
Greenland
Brazil
S2
S3
Algeria Libya
SudanMali
Madagascar
SaudiArabia
Iran
S4
S5
Russia
Mongolia
China Japan
Arctic Ocean
India
Kazakstan
Australia
New Zealand
Philippines
Pacific Ocean
Indian Ocean
S6
Kiribati
Samoa
American Samoa
Cook IslandsFrench Polynesia
Tonga
Inset
See Inset
816
Com
para
tive
Inte
rnat
iona
l Sta
tistic
s
S0
U.S
. Cen
sus
Bur
eau,
the
Offi
cial
Sta
tistic
sTM
S
tatis
tical
Abs
trac
t of t
he U
nite
d S
tate
s: 1
998
S
ep 2
5, 1
998
U.S. Census Bureau, the Official StatisticsTM Statistical Abstract of the United States: 1998 Sep. 25, 1998
Section 30
ComparativeInternational Statistics
This section presents statistics for theworld as a whole and for many countrieson a comparative basis with the UnitedStates. Data are shown for population,births and deaths, social and industrial in-dicators, finances, agriculture, communica-tion, and military affairs.
Statistics of the individual nations may befound primarily in official national publica-tions, generally in the form of yearbooks,issued by most of the nations at variousintervals in their own national languagesand expressed in their own or customaryunits of measure. (For a listing of selectedpublications, see Guide to Sources.) Forhandier reference, especially for interna-tional comparisons, the Statistical Office ofthe United Nations compiles data as sub-mitted by member countries and issues anumber of international summary publica-tions, generally in English and French.Among these are the Statistical Yearbook;the Demographic Yearbook; the Yearbookof International Trade Statistics; the Year-book of National Accounts Statistics: Vol.II, International Tables; Population and VitalStatistics Reports (quarterly); the MonthlyBulletin of Statistics; and the Energy Statis-tics Yearbook. Specialized agencies of theUnited Nations also issue internationalsummary publications on agricultural, labor,health, and education statistics. Amongthese are the Production Yearbook andTrade Yearbook issued by the Food andAgriculture Organization, the Yearbook ofLabour Statistics issued by the Internation-al Labour Office, World Health Statisticsissued by World Health Organization, andthe Statistical Yearbook issued by the Educational, Scientific, and Cultural Organization.
The Bureau of the Census presents estimates and projections of basic demo-graphic measures for countries and regions of the world in the World Popula-tion Profile series. The International Popu-lation Reports (Series IPC, formerly P95)and International Briefs (Series IB) alsopresent population figures for many foreign
In BriefTen most populous countries in 1998:
(million persons)China 1,237India 984United States 270Indonesia 213Brazil 170Russia 147Pakistan 135Bangladesh 128Japan 126Nigeria 111
countries. Detailed population statisticsare also available from the Bureau of theCensus’ International Data Base.
The U.S. Arms Control and DisarmamentAgency and the International MonetaryFund (IMF) also compile data on interna-tional statistics. In its annual World MilitaryExpenditures and Arms Transfers, theArms Control and Disarmament Agencypresents data on various economic indica-tors, as well as basic military data. Amongthe topics presented have been militaryexpenditures, gross national product, im-ports and exports, and armed forces. TheIMF publishes a series of reports relatingto financial data. These include Internation-al Financial Statistics, Direction of Trade,and Balance of Payments Yearbook, pub-lished in English, French, and Spanish.
Statistical coverage, country names,and classifications— Problems of spaceand availability of data limit the number ofcountries and the extent of statistical cov-erage shown. The list of countries includedand the spelling of country names arebased almost entirely on the list of sover-eign nations, dependencies, and areas ofspecial sovereignty provided by the U.S.Department of State.
In recent years, several important changestook place in the status of the world’s na-tions. In 1990, a unified Germany wasformed from the Federal Republic of
818 Comparative International Statistics
U.S. Census Bureau, the Official StatisticsTM Statistical Abstract of the United States: 1998 Sep. 25, 1998
Germany (West) and the German Demo-cratic Republic (East). The Republic ofYemen was formed by union of the YemenArab Republic and the People’s Democrat-ic Republic of Yemen. Also in 1990, Na-mibia, once a United Nations mandate,realized its independence from South Africa.
In 1991, the Soviet Union broke up into 15 independent countries: Armenia, Azerbaijan, Belarus, Estonia, Georgia, Kazakhstan, Kyrgyzstan, Latvia, Lithuania,Moldova, Russia, Tajikistan, Turkmenistan,Ukraine, and Uzbekistan.
In 1992, the Socialist Federal Republic ofYugoslavia dissolved; none of the succes-sor states has been recognized as its con-tinuation. The United States recognizesBosnia and Herzegovina, Croatia, Slove-nia, and The Former Yugoslav Republic ofMacedonia as independent countries. Ser-bia and Montenegro have asserted theformation of a joint independent state, butthis entity has not been formally recog-nized as a state by the United States.
On January 1, 1993, Czechoslovakia wassucceeded by two independent countries:the Czech Republic and Slovakia. Eritreaannounced its independence from Ethiopiain April 1993, and was subsequently re-cognized as an independent nation by theUnited States.
The population estimates and projectionsused in Tables 1343-1345 were preparedby the Census Bureau. For each country,the data on population, by age and sex,fertility, mortality, and international migrationwere evaluated and, where necessary, ad-justed for inconsistencies and errors in thedata. In most instances, comprehensiveprojections were made by the componentmethod, resulting in distributions of thepopulation by age and sex, and requiringan assessment of probable future trends offertility, mortality, and international migra-tion.
Economic associations— The Organiza-tion for European Economic Cooperation(OEEC), a regional grouping of WesternEuropean countries established in 1948 for the purpose of harmonizing nationaleconomic policies and conditions, wassucceeded on September 30, 1961, by
the Organization for Economic Coopera-tion and Development (OECD). The mem-ber nations of the OECD are Australia,Austria, Belgium, Canada, Czech Repub-lic, Denmark, Finland, France, Germany,Greece, Hungary, Iceland, Ireland, Italy,Japan, Luxembourg, Mexico, the Nether-lands, New Zealand, Norway, Poland, Por-tugal, South Korea, Spain, Sweden, Swit-zerland, Turkey, the United Kingdom, andthe United States.
Quality and comparability of the data—The quality and comparability of the datapresented here are affected by a numberof factors:
(1) The year for which data are pre-sented may not be the same for all sub-jects for a particular country, or for a givensubject for different countries, though thedata shown are the most recent available.All such variations have been noted. Thedata shown are for calendar years exceptas otherwise specified.
(2) The bases, methods of estimating,methods of data collection, extent of coverage, precision of definition, scope ofterritory, and margins of error may vary for different items within a particular country,and for like items for different countries. Footnotes and headnotes to the tablesgive a few of the major time-period andcoverage qualifications attached to the fig-ures; considerably more detail is presentedin the source publications. Many of themeasures shown are, at best, merelyrough indicators of magnitude.
(3) Figures shown in this section for the United States may not alwaysagree with figures shown in the precedingsections. Disagreements may be attribut-able to the use of differing original sources,a difference in the definition of geographiclimits (the 50 states, conterminous UnitedStates only, or the United States includingcertain outlying areas and possessions), or to possible adjustments made in theUnited States figures by the United Nations or other sources in order to make them more comparable with figures from other countries.
International comparisons of nationalaccounts data— In order to compare na-tional accounts data for different countries,it is necessary to convert each country’s
819Comparative International Statistics
U.S. Census Bureau, the Official StatisticsTM Statistical Abstract of the United States: 1998 Sep. 25, 1998
data into a common unit of currency, usually the U.S. dollar. The market ex-change rates which are often used in con-verting national currencies do not necessa-rily reflect the relative purchasing power inthe various countries. It is necessary thatthe goods and services produced in differ-ent countries be valued consistently if thedifferences observed are meant to reflectreal differences in the volumes of goodsand services produced. The use of pur-chasing power parities (see Table 1355)instead of exchange rates is intended toachieve this objective.
The method used to present the datashown in Table 1355 is to construct vol-ume measures directly by revaluing thegoods and services sold in different coun-tries at a common set of internationalprices. By dividing the ratio of the grossdomestic products of two countries ex-pressed in their own national currencies bythe corresponding ratio calculated atconstant international prices, it is possibleto derive the implied purchasing powerparity (PPP) between the two currenciesconcerned. PPP s show how many unitsof currency are needed in one country tobuy the same amount of goods and ser-vices which one unit of currency will buy inthe other country. For further information,see National Accounts, Main Aggregates,Volume I, issued annually by the Organiza-tion for Economic Cooperation and Devel-opment, Paris, France.
International Standard Industrial Classi-fication— The original version of the Inter-national Standard Industrial Classificationof All Economic Activities (ISIC) wasadopted in 1948. Wide use has beenmade both nationally and internationally in
classifying data according to kind of eco-nomic activity in the fields of production,employment, national income, and othereconomic statistics. A number of countrieshave utilized the ISIC as the basis for de-vising their industrial classification scheme.
Substantial comparability has been at-tained between the industrial classificationsof many other countries, including the Uni-ted States, and the ISIC by ensuring, asfar as practicable, that the categories atdetailed levels of classification in nationalschemes fitted into only one category ofthe ISIC. For more detail, see Bureau ofthe Census, The International StandardIndustrial Classification and the U.S. Stan-dard Industrial Classification, Technical Paper No. 14 and text, Section 27. TheUnited Nations, the International LabourOrganisation, the Food and Agriculture Or-ganization, and other international bodieshave utilized the ISIC in publishing andanalyzing statistical data. Revisions of theISIC were issued in 1958, 1968, and 1989.
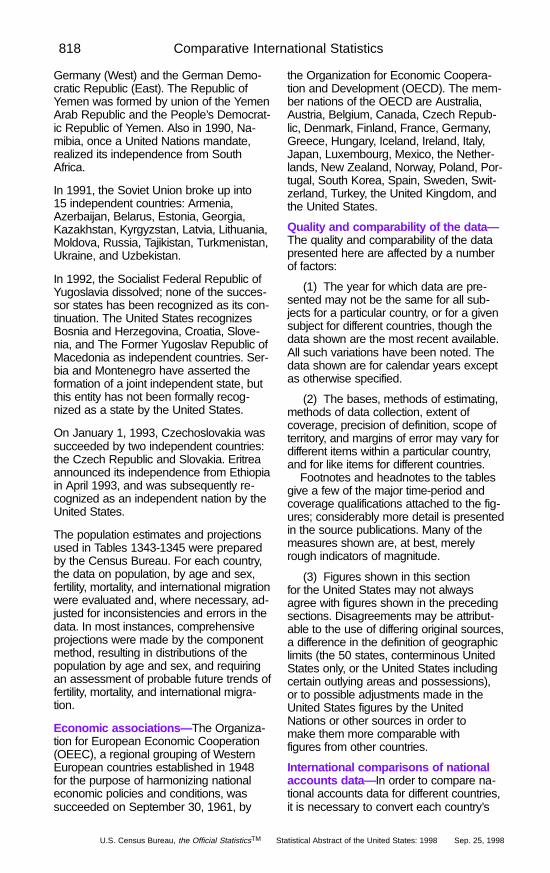
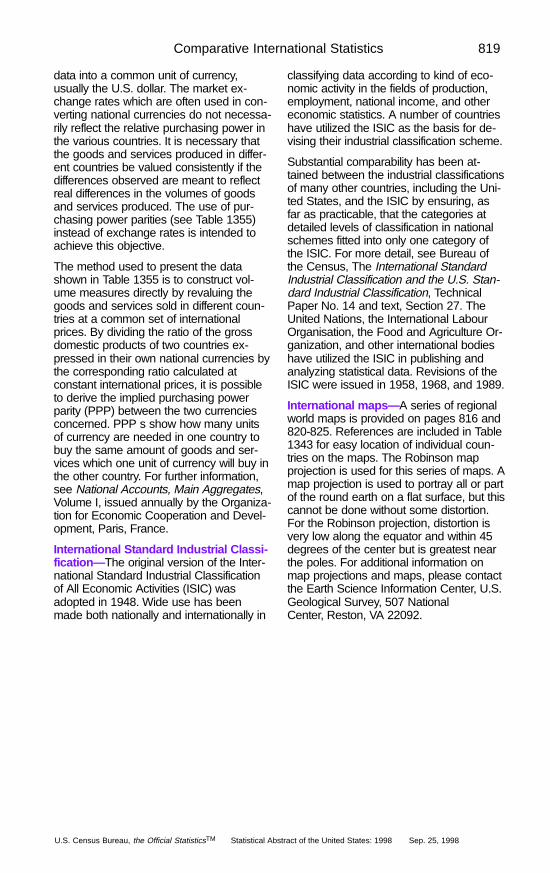
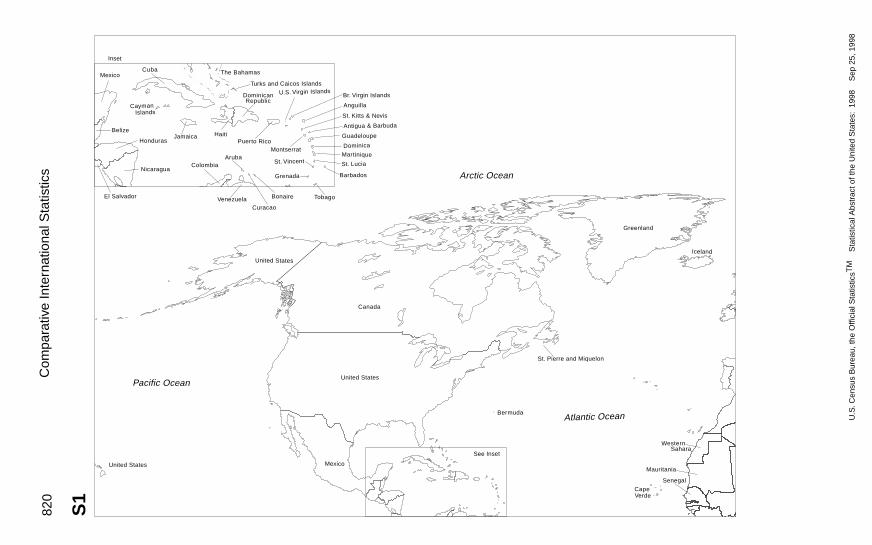
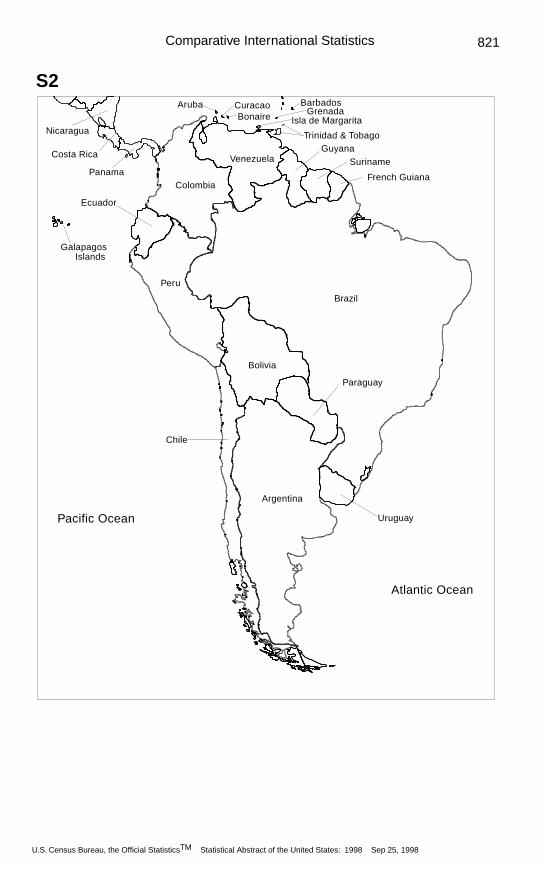
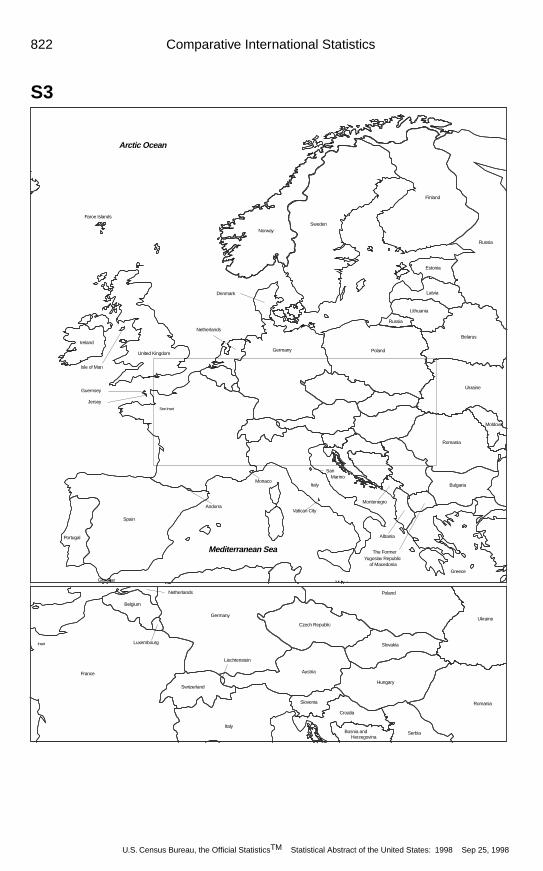
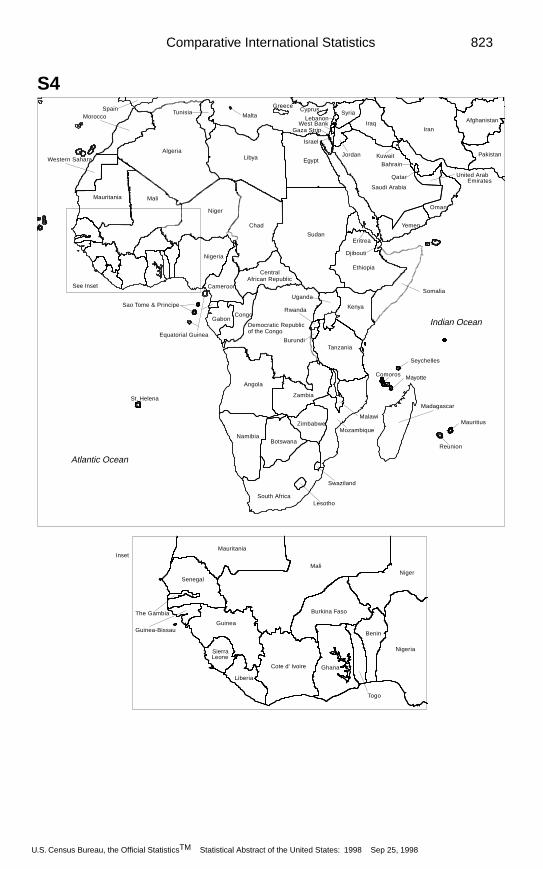
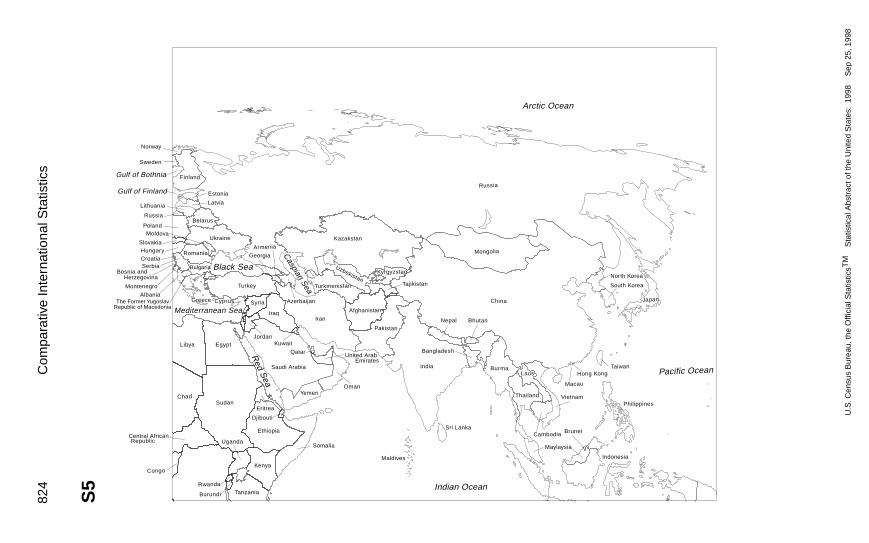
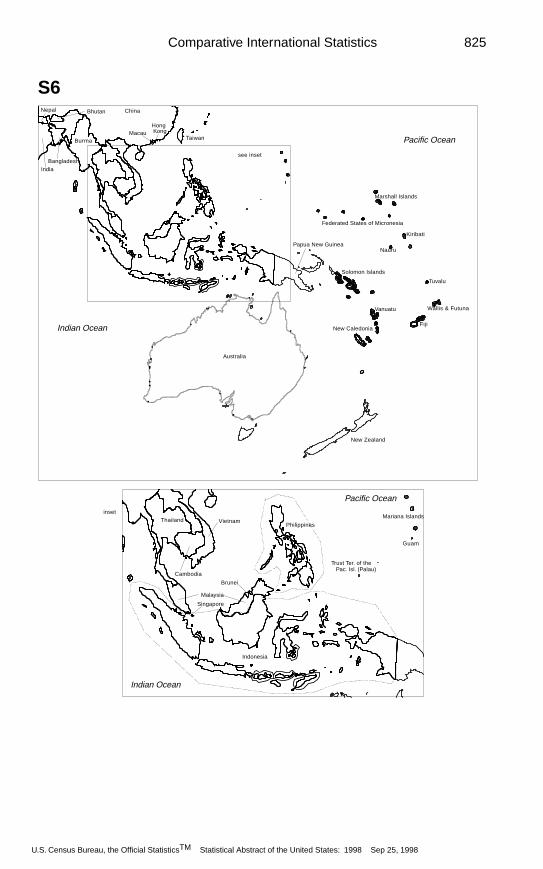
International maps— A series of regionalworld maps is provided on pages 816 and820-825. References are included in Table1343 for easy location of individual coun-tries on the maps. The Robinson mapprojection is used for this series of maps. Amap projection is used to portray all or partof the round earth on a flat surface, but thiscannot be done without some distortion.For the Robinson projection, distortion isvery low along the equator and within 45degrees of the center but is greatest nearthe poles. For additional information onmap projections and maps, please contactthe Earth Science Information Center, U.S.Geological Survey, 507 National Center, Reston, VA 22092.
820
Com
para
tive
Inte
rnat
iona
l Sta
tistic
s
Greenland
Iceland
Senegal
Mauritania
WesternSahara
CapeVerde
Atlantic Ocean
St. Pierre and Miquelon
Bermuda
United States
Canada
Mexico
See Inset
Arctic Ocean
Pacific Ocean
United States
United States
Mexico
Inset
Belize
Honduras
Nicaragua
El Salvador
Cuba
CaymanIslands
Jamaica
The Bahamas
Turks and Caicos Islands
Puerto Rico
Colombia
Venezuela
Aruba
Curacao
Bonaire Tobago
Grenada
St. Vincent
Montserrat
Barbados
St. Lucia
Martinique
Dominica
Guadeloupe
Antigua & Barbuda
St. Kitts & Nevis
Anguilla
Br. Virgin IslandsDominicanRepublic
U.S. Virgin Islands
Haiti
S1
U.S
. Cen
sus
Bur
eau,
the
Offi
cial
Sta
tistic
sTM
S
tatis
tical
Abs
trac
t of t
he U
nite
d S
tate
s: 1
998
S
ep 2
5, 1
998
821
Argentina
Bolivia
Paraguay
Chile
Uruguay
Atlantic Ocean
Pacific Ocean
Peru
Brazil
Ecuador
Colombia
VenezuelaGuyana
Suriname
French Guiana
Aruba
Trinidad & Tobago
CuracaoGrenada
Barbados
Bonaire Isla de Margarita
GalapagosIslands
Nicaragua
Costa Rica
Panama
S2
U.S. Census Bureau, the Official StatisticsTM Statistical Abstract of the United States: 1998 Sep 25, 1998
Comparative International Statistics
822 Comparative International Statistics
S3
Germany
Andorra
Portugal
Spain
Gibraltar
ItalyMonaco
Isle of Man
Ireland
United Kingdom
Faroe Islands
Netherlands
Jersey
Guernsey
Denmark
Norway
Albania
Malta
Greece
Vatican City
Sweden
Poland
Finland
Moldova
Bulgaria
Romania
Estonia
Lithuania
Latvia
Belarus
The FormerYugoslav Republic
of Macedonia
Ukraine
Russia
SanMarino
See Inset
Inset
France
Belgium
Netherlands
Luxembourg
Germany
Switzerland
Italy
Austria
Czech Republic
Slovenia
Croatia
Slovakia
Hungary
SerbiaBosnia andHerzegovina
Poland
Ukraine
Romania
Arctic Ocean
Mediterranean Sea
Russia
Montenegro
Liechtenstein
U.S. Census Bureau, the Official StatisticsTM Statistical Abstract of the United States: 1998 Sep 25, 1998
823Comparative International Statistics
Mauritania
Western Sahara
MoroccoSpain
Algeria
Tunisia
Libya Egypt
Mali
Niger
Nigeria
Chad
Cameroon
CentralAfrican Republic
Malta
GreeceCyprus
LebanonWest Bank
Gaza Strip
Israel
Syria
Jordan
IraqIran
Afghanistan
PakistanKuwaitBahrain
Qatar
Saudi Arabia
United ArabEmirates
Oman
Yemen
Sudan
Ethiopia
Djibouti
Eritrea
SomaliaUganda
Rwanda
Burundi
Kenya
Tanzania
Comoros
Seychelles
Mauritius
Reunion
Madagascar
Mozambique
GabonCongo
Angola
Sao Tome & Principe
Equatorial Guinea
St. Helena Zambia
Zimbabwe
BotswanaNamibia
South AfricaLesotho
Swaziland
Atlantic Ocean
Indian Ocean
Senegal
Mauritania
Mali
The Gambia
Guinea-BissauGuinea
SierraLeone
Liberia
Cote d' Ivoire Ghana
Benin
Togo
Nigeria
Niger
Malawi
Mayotte
See Inset
Inset
of the CongoDemocratic Republic
Burkina Faso
S4
U.S. Census Bureau, the Official StatisticsTM Statistical Abstract of the United States: 1998 Sep 25, 1998
Com
para
tive
Inte
rnat
iona
l Sta
tistic
s
Pacific Ocean
Japan
North Korea
South Korea
Indonesia
Philippines
TaiwanHong Kong
Macau
Maylaysia
Brunei
Vietnam
Cambodia
Thailand
LaosIndia
Bangladesh
Burma
BhutanNepal
Sri Lanka
Maldives
Indian Ocean
China
Mongolia
Russia
Arctic Ocean
Pakistan
Afghanistan
Iran
Tajikistan
KyrgyzstanUzbekistan
Kazakstan
Turkmenistan
Iraq
Syria
Jordan
Saudi Arabia
Turkey
Azerbaijan
GeorgiaArmenia
Caspian Sea
Yemen
Ethiopia
Eritrea
Djibouti
Somalia
Red S
ea
United ArabEmirates
Oman
Kuwait
QatarEgypt
Sudan
Libya
Chad
Kenya
Burundi
Rwanda
UgandaCentral AfricanRepublic
Congo
Black Sea
Ukraine
Belarus
Latvia
Estonia
CyprusGreece
Mediterranean Sea
Romania
Finland
Norway
Gulf of Bothnia
Gulf of Finland
Lithuania
Sweden
Russia
PolandMoldova
SlovakiaHungaryCroatiaSerbia
Bosnia andHerzegovina
Montenegro
AlbaniaThe Former Yugoslav
Republic of Macedonia
Bulgaria
TanzaniaS5
U.S
. Cen
sus
Bur
eau,
the
Offi
cial
Sta
tistic
sTM
S
tatis
tical
Abs
trac
t of t
he U
nite
d S
tate
s: 1
998
S
ep 2
5, 1
998
824
825Comparative International Statistics
BangladeshIndia
BhutanNepal
Burma
China
Taiwan
HongKongMacau
Australia
New Zealand
New Caledonia
Papua New Guinea
Solomon Islands
Vanuatu
Fiji
Wallis & Futuna
Tuvalu
Marshall Islands
Nauru
Kiribati
Federated States of Micronesia
Pacific Ocean
Indian Ocean
Thailand Vietnam
Cambodia
Malaysia
Singapore
Philippines
Indonesia
Indian Ocean
Guam
Pacific Ocean
see inset
inset
Brunei
Mariana Islands
Trust Ter. of thePac. Isl. (Palau)
S6
U.S. Census Bureau, the Official StatisticsTM Statistical Abstract of the United States: 1998 Sep 25, 1998
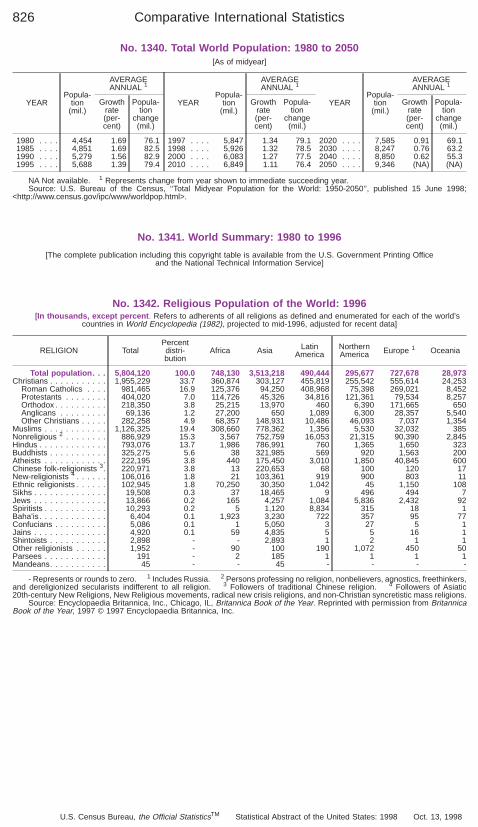
No. 1340. Total World Population: 1980 to 2050[As of midyear]
YEARPopula-
tion(mil.)
AVERAGEANNUAL 1
Growthrate(per-cent)
Popula-tion
change(mil.)
1980 . . . . 4,454 1.69 76.11985 . . . . 4,851 1.69 82.51990 . . . . 5,279 1.56 82.91995 . . . . 5,688 1.39 79.4
YEARPopula-
tion(mil.)
AVERAGEANNUAL 1
Growthrate(per-cent)
Popula-tion
change(mil.)
1997 . . . . 5,847 1.34 79.11998 . . . . 5,926 1.32 78.52000 . . . . 6,083 1.27 77.52010 . . . . 6,849 1.11 76.4
YEARPopula-
tion(mil.)
AVERAGEANNUAL 1
Growthrate(per-cent)
Popula-tion
change(mil.)
2020 . . . . 7,585 0.91 69.12030 . . . . 8,247 0.76 63.22040 . . . . 8,850 0.62 55.32050 . . . . 9,346 (NA) (NA)
NA Not available. 1 Represents change from year shown to immediate succeeding year.Source: U.S. Bureau of the Census, ‘‘Total Midyear Population for the World: 1950-2050’’, published 15 June 1998;
<http://www.census.gov/ipc/www/worldpop.html>.
No. 1341. World Summary: 1980 to 1996
[The complete publication including this copyright table is available from the U.S. Government Printing Officeand the National Technical Information Service]
No. 1342. Religious Population of the World: 1996[In thousands, except percent . Refers to adherents of all religions as defined and enumerated for each of the world’s
countries in World Encyclopedia (1982), projected to mid-1996, adjusted for recent data]
RELIGION TotalPercentdistri-bution
Africa Asia LatinAmerica
NorthernAmerica Europe 1 Oceania
Total population. . . 5,804,120 100.0 748,130 3,513,218 490,444 295,677 727,678 28,973Christians . . . . . . . . . . . 1,955,229 33.7 360,874 303,127 455,819 255,542 555,614 24,253
Roman Catholics . . . . 981,465 16.9 125,376 94,250 408,968 75,398 269,021 8,452Protestants . . . . . . . . 404,020 7.0 114,726 45,326 34,816 121,361 79,534 8,257Orthodox . . . . . . . . . . 218,350 3.8 25,215 13,970 460 6,390 171,665 650Anglicans . . . . . . . . . 69,136 1.2 27,200 650 1,089 6,300 28,357 5,540Other Christians . . . . . 282,258 4.9 68,357 148,931 10,486 46,093 7,037 1,354
Muslims . . . . . . . . . . . . 1,126,325 19.4 308,660 778,362 1,356 5,530 32,032 385Nonreligious 2 . . . . . . . . 886,929 15.3 3,567 752,759 16,053 21,315 90,390 2,845Hindus . . . . . . . . . . . . . 793,076 13.7 1,986 786,991 760 1,365 1,650 323Buddhists . . . . . . . . . . . 325,275 5.6 38 321,985 569 920 1,563 200Atheists . . . . . . . . . . . . 222,195 3.8 440 175,450 3,010 1,850 40,845 600Chinese folk-religionists 3. 220,971 3.8 13 220,653 68 100 120 17New-religionists 4 . . . . . . 106,016 1.8 21 103,361 919 900 803 11Ethnic religionists . . . . . . 102,945 1.8 70,250 30,350 1,042 45 1,150 108Sikhs . . . . . . . . . . . . . . 19,508 0.3 37 18,465 9 496 494 7Jews . . . . . . . . . . . . . . 13,866 0.2 165 4,257 1,084 5,836 2,432 92Spiritists . . . . . . . . . . . . 10,293 0.2 5 1,120 8,834 315 18 1Baha’is . . . . . . . . . . . . . 6,404 0.1 1,923 3,230 722 357 95 77Confucians . . . . . . . . . . 5,086 0.1 1 5,050 3 27 5 1Jains . . . . . . . . . . . . . . 4,920 0.1 59 4,835 5 5 16 1Shintoists . . . . . . . . . . . 2,898 - - 2,893 1 2 1 1Other religionists . . . . . . 1,952 - 90 100 190 1,072 450 50Parsees . . . . . . . . . . . . 191 - 2 185 1 1 1 1Mandeans. . . . . . . . . . . 45 - - 45 - - - -
- Represents or rounds to zero. 1 Includes Russia. 2 Persons professing no religion, nonbelievers, agnostics, freethinkers,and dereligionized secularists indifferent to all religion. 3 Followers of traditional Chinese religion. 4 Followers of Asiatic20th-century New Religions, New Religious movements, radical new crisis religions, and non-Christian syncretistic mass religions.
Source: Encyclopaedia Britannica, Inc., Chicago, IL, Britannica Book of the Year. Reprinted with permission from BritannicaBook of the Year, 1997 © 1997 Encyclopaedia Britannica, Inc.
Comparative International Statistics826
U.S. Census Bureau, the Official StatisticsTM Statistical Abstract of the United States: 1998 Oct. 13, 1998
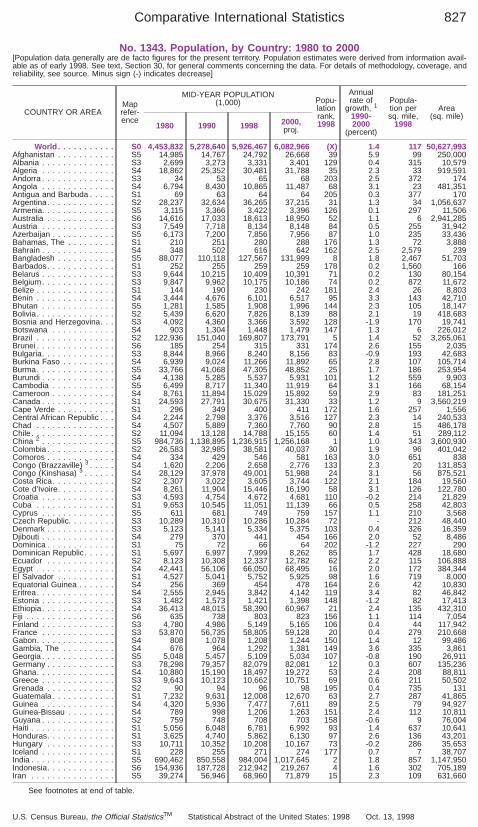
No. 1343. Population, by Country: 1980 to 2000[Population data generally are de facto figures for the present territory. Population estimates were derived from information avail-able as of early 1998. See text, Section 30, for general comments concerning the data. For details of methodology, coverage, andreliability, see source. Minus sign (-) indicates decrease]
COUNTRY OR AREAMaprefer-ence
MID-YEAR POPULATION(1,000) Popu-
lationrank,1998
Annualrate of
growth, 1
1990-2000
(percent)
Popula-tion persq. mile,
1998
Area(sq. mile)
1980 1990 1998 2000,proj.
World . . . . . . . . . . . S0 4,453,832 5,278,640 5,926,467 6,082,966 (X) 1.4 117 50,627,993Afghanistan . . . . . . . . . . . S5 14,985 14,767 24,792 26,668 39 5.9 99 250,000Albania . . . . . . . . . . . . . . S3 2,699 3,273 3,331 3,401 129 0.4 315 10,579Algeria . . . . . . . . . . . . . . S4 18,862 25,352 30,481 31,788 35 2.3 33 919,591Andorra . . . . . . . . . . . . . . S3 34 53 65 68 203 2.5 372 174Angola . . . . . . . . . . . . . . S4 6,794 8,430 10,865 11,487 68 3.1 23 481,351Antigua and Barbuda . . . . . S1 69 63 64 64 205 0.3 377 170Argentina. . . . . . . . . . . . . S2 28,237 32,634 36,265 37,215 31 1.3 34 1,056,637Armenia. . . . . . . . . . . . . . S5 3,115 3,366 3,422 3,396 126 0.1 297 11,506Australia . . . . . . . . . . . . . S6 14,616 17,033 18,613 18,950 52 1.1 6 2,941,285Austria . . . . . . . . . . . . . . S3 7,549 7,718 8,134 8,148 84 0.5 255 31,942Azerbaijan . . . . . . . . . . . . S5 6,173 7,200 7,856 7,956 87 1.0 235 33,436Bahamas, The . . . . . . . . . S1 210 251 280 288 176 1.3 72 3,888Bahrain . . . . . . . . . . . . . . S4 348 502 616 642 162 2.5 2,579 239Bangladesh . . . . . . . . . . . S5 88,077 110,118 127,567 131,999 8 1.8 2,467 51,703Barbados. . . . . . . . . . . . . S1 252 255 259 259 178 0.2 1,560 166Belarus . . . . . . . . . . . . . . S3 9,644 10,215 10,409 10,391 71 0.2 130 80,154Belgium. . . . . . . . . . . . . . S3 9,847 9,962 10,175 10,186 74 0.2 872 11,672Belize . . . . . . . . . . . . . . . S1 144 190 230 242 181 2.4 26 8,803Benin . . . . . . . . . . . . . . . S4 3,444 4,676 6,101 6,517 95 3.3 143 42,710Bhutan . . . . . . . . . . . . . . S5 1,281 1,585 1,908 1,996 144 2.3 105 18,147Bolivia . . . . . . . . . . . . . . . S2 5,439 6,620 7,826 8,139 88 2.1 19 418,683Bosnia and Herzegovina. . . S3 4,092 4,360 3,366 3,592 128 -1.9 170 19,741Botswana . . . . . . . . . . . . S4 903 1,304 1,448 1,479 147 1.3 6 226,012Brazil . . . . . . . . . . . . . . . S2 122,936 151,040 169,807 173,791 5 1.4 52 3,265,061Brunei . . . . . . . . . . . . . . . S6 185 254 315 331 174 2.6 155 2,035Bulgaria. . . . . . . . . . . . . . S3 8,844 8,966 8,240 8,156 83 -0.9 193 42,683Burkina Faso . . . . . . . . . . S4 6,939 9,024 11,266 11,892 65 2.8 107 105,714Burma. . . . . . . . . . . . . . . S5 33,766 41,068 47,305 48,852 25 1.7 186 253,954Burundi . . . . . . . . . . . . . . S4 4,138 5,285 5,537 5,931 101 1.2 559 9,903Cambodia . . . . . . . . . . . . S5 6,499 8,717 11,340 11,919 64 3.1 166 68,154Cameroon . . . . . . . . . . . . S4 8,761 11,894 15,029 15,892 59 2.9 83 181,251Canada . . . . . . . . . . . . . . S1 24,593 27,791 30,675 31,330 33 1.2 9 3,560,219Cape Verde . . . . . . . . . . . S1 296 349 400 411 172 1.6 257 1,556Central African Republic . . . S4 2,244 2,798 3,376 3,516 127 2.3 14 240,533Chad . . . . . . . . . . . . . . . S4 4,507 5,889 7,360 7,760 90 2.8 15 486,178Chile . . . . . . . . . . . . . . . . S2 11,094 13,128 14,788 15,155 60 1.4 51 289,112China 2 . . . . . . . . . . . . . . S5 984,736 1,138,895 1,236,915 1,256,168 1 1.0 343 3,600,930Colombia . . . . . . . . . . . . . S2 26,583 32,985 38,581 40,037 30 1.9 96 401,042Comoros . . . . . . . . . . . . . S4 334 429 546 581 163 3.0 651 838Congo (Brazzaville) 3 . . . . . S4 1,620 2,206 2,658 2,776 133 2.3 20 131,853Congo (Kinshasa) 3 . . . . . . S4 28,129 37,978 49,001 51,988 24 3.1 56 875,521Costa Rica. . . . . . . . . . . . S2 2,307 3,022 3,605 3,744 122 2.1 184 19,560Cote d’Ivoire. . . . . . . . . . . S4 8,261 11,904 15,446 16,190 58 3.1 126 122,780Croatia . . . . . . . . . . . . . . S3 4,593 4,754 4,672 4,681 110 -0.2 214 21,829Cuba . . . . . . . . . . . . . . . S1 9,653 10,545 11,051 11,139 66 0.5 258 42,803Cyprus . . . . . . . . . . . . . . S5 611 681 749 759 157 1.1 210 3,568Czech Republic. . . . . . . . . S3 10,289 10,310 10,286 10,284 72 - 212 48,440Denmark . . . . . . . . . . . . . S3 5,123 5,141 5,334 5,375 103 0.4 326 16,359Djibouti . . . . . . . . . . . . . . S4 279 370 441 454 166 2.0 52 8,486Dominica . . . . . . . . . . . . . S1 75 72 66 64 202 -1.2 227 290Dominican Republic . . . . . . S1 5,697 6,997 7,999 8,262 85 1.7 428 18,680Ecuador . . . . . . . . . . . . . S2 8,123 10,308 12,337 12,782 62 2.2 115 106,888Egypt . . . . . . . . . . . . . . . S4 42,441 56,106 66,050 68,495 16 2.0 172 384,344El Salvador . . . . . . . . . . . S1 4,527 5,041 5,752 5,925 98 1.6 719 8,000Equatorial Guinea . . . . . . . S4 256 369 454 478 164 2.6 42 10,830Eritrea. . . . . . . . . . . . . . . S4 2,555 2,945 3,842 4,142 119 3.4 82 46,842Estonia . . . . . . . . . . . . . . S3 1,482 1,573 1,421 1,398 148 -1.2 82 17,413Ethiopia. . . . . . . . . . . . . . S4 36,413 48,015 58,390 60,967 21 2.4 135 432,310Fiji . . . . . . . . . . . . . . . . . S6 635 738 803 823 156 1.1 114 7,054Finland . . . . . . . . . . . . . . S3 4,780 4,986 5,149 5,165 106 0.4 44 117,942France . . . . . . . . . . . . . . S3 53,870 56,735 58,805 59,128 20 0.4 279 210,668Gabon. . . . . . . . . . . . . . . S4 808 1,078 1,208 1,244 150 1.4 12 99,486Gambia, The . . . . . . . . . . S4 676 964 1,292 1,381 149 3.6 335 3,861Georgia . . . . . . . . . . . . . . S5 5,048 5,457 5,109 5,034 107 -0.8 190 26,911Germany . . . . . . . . . . . . . S3 78,298 79,357 82,079 82,081 12 0.3 607 135,236Ghana. . . . . . . . . . . . . . . S4 10,880 15,190 18,497 19,272 53 2.4 208 88,811Greece . . . . . . . . . . . . . . S3 9,643 10,123 10,662 10,751 69 0.6 211 50,502Grenada . . . . . . . . . . . . . S2 90 94 96 98 195 0.4 735 131Guatemala . . . . . . . . . . . . S1 7,232 9,631 12,008 12,670 63 2.7 287 41,865Guinea . . . . . . . . . . . . . . S4 4,320 5,936 7,477 7,611 89 2.5 79 94,927Guinea-Bissau . . . . . . . . . S4 789 998 1,206 1,263 151 2.4 112 10,811Guyana . . . . . . . . . . . . . . S2 759 748 708 703 158 -0.6 9 76,004Haiti . . . . . . . . . . . . . . . . S1 5,056 6,048 6,781 6,992 93 1.4 637 10,641Honduras. . . . . . . . . . . . . S1 3,625 4,740 5,862 6,130 97 2.6 136 43,201Hungary . . . . . . . . . . . . . S3 10,711 10,352 10,208 10,167 73 -0.2 286 35,653Iceland . . . . . . . . . . . . . . S1 228 255 271 274 177 0.7 7 38,707India . . . . . . . . . . . . . . . . S5 690,462 850,558 984,004 1,017,645 2 1.8 857 1,147,950Indonesia. . . . . . . . . . . . . S6 154,936 187,728 212,942 219,267 4 1.6 302 705,189Iran . . . . . . . . . . . . . . . . S5 39,274 56,946 68,960 71,879 15 2.3 109 631,660
See footnotes at end of table.
Comparative International Statistics 827
U.S. Census Bureau, the Official StatisticsTM Statistical Abstract of the United States: 1998 Oct. 13, 1998
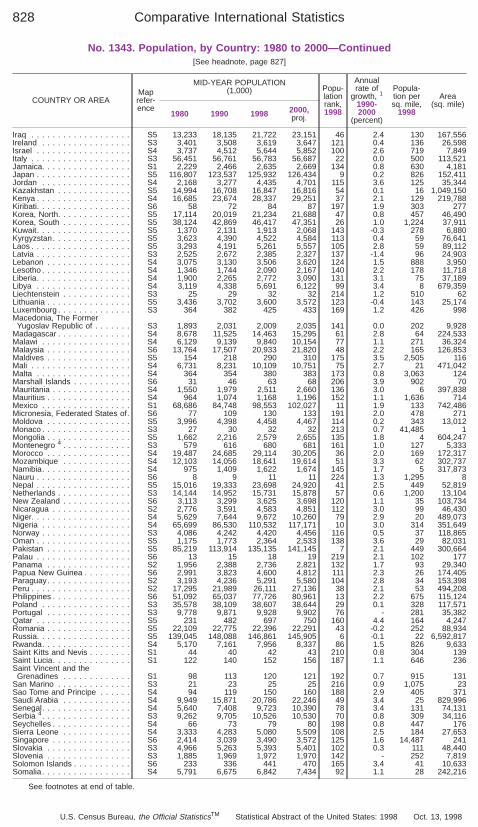
No. 1343. Population, by Country: 1980 to 2000—Continued[See headnote, page 827]
COUNTRY OR AREAMaprefer-ence
MID-YEAR POPULATION(1,000) Popu-
lationrank,1998
Annualrate of
growth, 1
1990-2000
(percent)
Popula-tion persq. mile,
1998
Area(sq. mile)
1980 1990 1998 2000,proj.
Iraq . . . . . . . . . . . . . . . . . . . S5 13,233 18,135 21,722 23,151 46 2.4 130 167,556Ireland . . . . . . . . . . . . . . . . . S3 3,401 3,508 3,619 3,647 121 0.4 136 26,598Israel . . . . . . . . . . . . . . . . . . S4 3,737 4,512 5,644 5,852 100 2.6 719 7,849Italy . . . . . . . . . . . . . . . . . . . S3 56,451 56,761 56,783 56,687 22 0.0 500 113,521Jamaica. . . . . . . . . . . . . . . . . S1 2,229 2,466 2,635 2,669 134 0.8 630 4,181Japan . . . . . . . . . . . . . . . . . . S5 116,807 123,537 125,932 126,434 9 0.2 826 152,411Jordan . . . . . . . . . . . . . . . . . S4 2,168 3,277 4,435 4,701 115 3.6 125 35,344Kazakhstan . . . . . . . . . . . . . . S5 14,994 16,708 16,847 16,816 54 0.1 16 1,049,150Kenya . . . . . . . . . . . . . . . . . . S4 16,685 23,674 28,337 29,251 37 2.1 129 219,788Kiribati. . . . . . . . . . . . . . . . . . S6 58 72 84 87 197 1.9 303 277Korea, North. . . . . . . . . . . . . . S5 17,114 20,019 21,234 21,688 47 0.8 457 46,490Korea, South . . . . . . . . . . . . . S5 38,124 42,869 46,417 47,351 26 1.0 1,224 37,911Kuwait. . . . . . . . . . . . . . . . . . S5 1,370 2,131 1,913 2,068 143 -0.3 278 6,880Kyrgyzstan. . . . . . . . . . . . . . . S5 3,623 4,390 4,522 4,584 113 0.4 59 76,641Laos . . . . . . . . . . . . . . . . . . . S5 3,293 4,191 5,261 5,557 105 2.8 59 89,112Latvia . . . . . . . . . . . . . . . . . . S3 2,525 2,672 2,385 2,327 137 -1.4 96 24,903Lebanon . . . . . . . . . . . . . . . . S4 3,075 3,130 3,506 3,620 124 1.5 888 3,950Lesotho . . . . . . . . . . . . . . . . . S4 1,346 1,744 2,090 2,167 140 2.2 178 11,718Liberia. . . . . . . . . . . . . . . . . . S4 1,900 2,265 2,772 3,090 131 3.1 75 37,189Libya . . . . . . . . . . . . . . . . . . S4 3,119 4,338 5,691 6,122 99 3.4 8 679,359Liechtenstein . . . . . . . . . . . . . S3 25 29 32 32 214 1.2 510 62Lithuania . . . . . . . . . . . . . . . . S5 3,436 3,702 3,600 3,572 123 -0.4 143 25,174Luxembourg . . . . . . . . . . . . . . S3 364 382 425 433 169 1.2 426 998Macedonia, The Former
Yugoslav Republic of . . . . . . . S3 1,893 2,031 2,009 2,035 141 0.0 202 9,928Madagascar . . . . . . . . . . . . . . S4 8,678 11,525 14,463 15,295 61 2.8 64 224,533Malawi . . . . . . . . . . . . . . . . . S4 6,129 9,139 9,840 10,154 77 1.1 271 36,324Malaysia . . . . . . . . . . . . . . . . S6 13,764 17,507 20,933 21,820 48 2.2 165 126,853Maldives . . . . . . . . . . . . . . . . S5 154 218 290 310 175 3.5 2,505 116Mali . . . . . . . . . . . . . . . . . . . S4 6,731 8,231 10,109 10,751 75 2.7 21 471,042Malta . . . . . . . . . . . . . . . . . . S4 364 354 380 383 173 0.8 3,063 124Marshall Islands . . . . . . . . . . . S6 31 46 63 68 206 3.9 902 70Mauritania . . . . . . . . . . . . . . . S4 1,550 1,979 2,511 2,660 136 3.0 6 397,838Mauritius . . . . . . . . . . . . . . . . S4 964 1,074 1,168 1,196 152 1.1 1,636 714Mexico . . . . . . . . . . . . . . . . . S1 68,686 84,748 98,553 102,027 11 1.9 133 742,486Micronesia, Federated States of. S6 77 109 130 133 191 2.0 478 271Moldova . . . . . . . . . . . . . . . . S5 3,996 4,398 4,458 4,467 114 0.2 343 13,012Monaco . . . . . . . . . . . . . . . . . S3 27 30 32 32 213 0.7 41,485 1Mongolia . . . . . . . . . . . . . . . . S5 1,662 2,216 2,579 2,655 135 1.8 4 604,247Montenegro 4 . . . . . . . . . . . . . S3 579 616 680 681 161 1.0 127 5,333Morocco . . . . . . . . . . . . . . . . S4 19,487 24,685 29,114 30,205 36 2.0 169 172,317Mozambique . . . . . . . . . . . . . S4 12,103 14,056 18,641 19,614 51 3.3 62 302,737Namibia. . . . . . . . . . . . . . . . . S4 975 1,409 1,622 1,674 145 1.7 5 317,873Nauru . . . . . . . . . . . . . . . . . . S6 8 9 11 11 224 1.3 1,295 8Nepal . . . . . . . . . . . . . . . . . . S5 15,016 19,333 23,698 24,920 41 2.5 449 52,819Netherlands . . . . . . . . . . . . . . S3 14,144 14,952 15,731 15,878 57 0.6 1,200 13,104New Zealand . . . . . . . . . . . . . S6 3,113 3,299 3,625 3,698 120 1.1 35 103,734Nicaragua . . . . . . . . . . . . . . . S2 2,776 3,591 4,583 4,851 112 3.0 99 46,430Niger. . . . . . . . . . . . . . . . . . . S4 5,629 7,644 9,672 10,260 79 2.9 20 489,073Nigeria . . . . . . . . . . . . . . . . . S4 65,699 86,530 110,532 117,171 10 3.0 314 351,649Norway . . . . . . . . . . . . . . . . . S3 4,086 4,242 4,420 4,456 116 0.5 37 118,865Oman . . . . . . . . . . . . . . . . . . S5 1,175 1,773 2,364 2,533 138 3.6 29 82,031Pakistan . . . . . . . . . . . . . . . . S5 85,219 113,914 135,135 141,145 7 2.1 449 300,664Palau . . . . . . . . . . . . . . . . . . S6 13 15 18 19 219 2.1 102 177Panama . . . . . . . . . . . . . . . . S2 1,956 2,388 2,736 2,821 132 1.7 93 29,340Papua New Guinea . . . . . . . . . S6 2,991 3,823 4,600 4,812 111 2.3 26 174,405Paraguay. . . . . . . . . . . . . . . . S2 3,193 4,236 5,291 5,580 104 2.8 34 153,398Peru . . . . . . . . . . . . . . . . . . . S2 17,295 21,989 26,111 27,136 38 2.1 53 494,208Philippines . . . . . . . . . . . . . . . S6 51,092 65,037 77,726 80,961 13 2.2 675 115,124Poland . . . . . . . . . . . . . . . . . S3 35,578 38,109 38,607 38,644 29 0.1 328 117,571Portugal . . . . . . . . . . . . . . . . S3 9,778 9,871 9,928 9,902 76 - 281 35,382Qatar . . . . . . . . . . . . . . . . . . S5 231 482 697 750 160 4.4 164 4,247Romania . . . . . . . . . . . . . . . . S5 22,109 22,775 22,396 22,291 43 -0.2 252 88,934Russia. . . . . . . . . . . . . . . . . . S5 139,045 148,088 146,861 145,905 6 -0.1 22 6,592,817Rwanda. . . . . . . . . . . . . . . . . S4 5,170 7,161 7,956 8,337 86 1.5 826 9,633Saint Kitts and Nevis . . . . . . . . S1 44 40 42 43 210 0.8 304 139Saint Lucia. . . . . . . . . . . . . . . S1 122 140 152 156 187 1.1 646 236Saint Vincent and the
Grenadines . . . . . . . . . . . . . S1 98 113 120 121 192 0.7 915 131San Marino . . . . . . . . . . . . . . S3 21 23 25 25 216 0.9 1,075 23Sao Tome and Principe . . . . . . S4 94 119 150 160 188 2.9 405 371Saudi Arabia . . . . . . . . . . . . . S4 9,949 15,871 20,786 22,246 49 3.4 25 829,996Senegal. . . . . . . . . . . . . . . . . S4 5,640 7,408 9,723 10,390 78 3.4 131 74,131Serbia 4. . . . . . . . . . . . . . . . . S3 9,262 9,705 10,526 10,530 70 0.8 309 34,116Seychelles . . . . . . . . . . . . . . . S4 66 73 79 80 198 0.8 447 176Sierra Leone . . . . . . . . . . . . . S4 3,333 4,283 5,080 5,509 108 2.5 184 27,653Singapore . . . . . . . . . . . . . . . S6 2,414 3,039 3,490 3,572 125 1.6 14,487 241Slovakia . . . . . . . . . . . . . . . . S3 4,966 5,263 5,393 5,401 102 0.3 111 48,440Slovenia . . . . . . . . . . . . . . . . S3 1,885 1,969 1,972 1,970 142 - 252 7,819Solomon Islands . . . . . . . . . . . S6 233 336 441 470 165 3.4 41 10,633Somalia . . . . . . . . . . . . . . . . . S4 5,791 6,675 6,842 7,434 92 1.1 28 242,216
See footnotes at end of table.
Comparative International Statistics828
U.S. Census Bureau, the Official StatisticsTM Statistical Abstract of the United States: 1998 Oct. 13, 1998
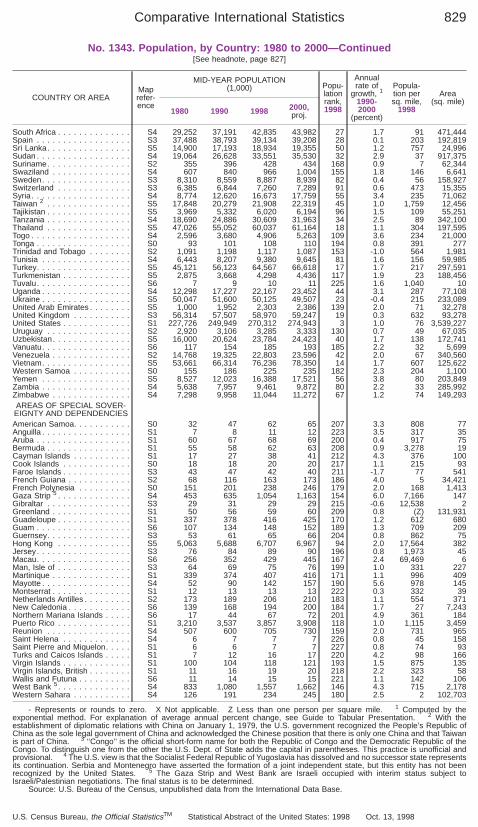
No. 1343. Population, by Country: 1980 to 2000—Continued[See headnote, page 827]
COUNTRY OR AREAMaprefer-ence
MID-YEAR POPULATION(1,000) Popu-
lationrank,1998
Annualrate of
growth, 1
1990-2000
(percent)
Popula-tion persq. mile,
1998
Area(sq. mile)
1980 1990 1998 2000,proj.
South Africa . . . . . . . . . . . . . . S4 29,252 37,191 42,835 43,982 27 1.7 91 471,444Spain . . . . . . . . . . . . . . . . . . S3 37,488 38,793 39,134 39,208 28 0.1 203 192,819Sri Lanka. . . . . . . . . . . . . . . . S5 14,900 17,193 18,934 19,355 50 1.2 757 24,996Sudan . . . . . . . . . . . . . . . . . . S4 19,064 26,628 33,551 35,530 32 2.9 37 917,375Suriname. . . . . . . . . . . . . . . . S2 355 396 428 434 168 0.9 7 62,344Swaziland . . . . . . . . . . . . . . . S4 607 840 966 1,004 155 1.8 146 6,641Sweden. . . . . . . . . . . . . . . . . S3 8,310 8,559 8,887 8,939 82 0.4 56 158,927Switzerland . . . . . . . . . . . . . . S3 6,385 6,844 7,260 7,289 91 0.6 473 15,355Syria . . . . . . . . . . . . . . . . . . . S4 8,774 12,620 16,673 17,759 55 3.4 235 71,062Taiwan 2 . . . . . . . . . . . . . . . . S5 17,848 20,279 21,908 22,319 45 1.0 1,759 12,456Tajikistan . . . . . . . . . . . . . . . . S5 3,969 5,332 6,020 6,194 96 1.5 109 55,251Tanzania . . . . . . . . . . . . . . . . S4 18,690 24,886 30,609 31,963 34 2.5 89 342,100Thailand . . . . . . . . . . . . . . . . S5 47,026 55,052 60,037 61,164 18 1.1 304 197,595Togo . . . . . . . . . . . . . . . . . . . S4 2,596 3,680 4,906 5,263 109 3.6 234 21,000Tonga . . . . . . . . . . . . . . . . . . S0 93 101 108 110 194 0.8 391 277Trinidad and Tobago . . . . . . . . S2 1,091 1,198 1,117 1,087 153 -1.0 564 1,981Tunisia . . . . . . . . . . . . . . . . . S4 6,443 8,207 9,380 9,645 81 1.6 156 59,985Turkey. . . . . . . . . . . . . . . . . . S5 45,121 56,123 64,567 66,618 17 1.7 217 297,591Turkmenistan . . . . . . . . . . . . . S5 2,875 3,668 4,298 4,436 117 1.9 23 188,456Tuvalu. . . . . . . . . . . . . . . . . . S6 7 9 10 11 225 1.6 1,040 10Uganda . . . . . . . . . . . . . . . . . S4 12,298 17,227 22,167 23,452 44 3.1 287 77,108Ukraine . . . . . . . . . . . . . . . . . S5 50,047 51,600 50,125 49,507 23 -0.4 215 233,089United Arab Emirates . . . . . . . . S5 1,000 1,952 2,303 2,386 139 2.0 71 32,278United Kingdom . . . . . . . . . . . S3 56,314 57,507 58,970 59,247 19 0.3 632 93,278United States . . . . . . . . . . . . . S1 227,726 249,949 270,312 274,943 3 1.0 76 3,539,227Uruguay . . . . . . . . . . . . . . . . S2 2,920 3,106 3,285 3,333 130 0.7 49 67,035Uzbekistan. . . . . . . . . . . . . . . S5 16,000 20,624 23,784 24,423 40 1.7 138 172,741Vanuatu. . . . . . . . . . . . . . . . . S6 117 154 185 193 185 2.2 32 5,699Venezuela . . . . . . . . . . . . . . . S2 14,768 19,325 22,803 23,596 42 2.0 67 340,560Vietnam. . . . . . . . . . . . . . . . . S5 53,661 66,314 76,236 78,350 14 1.7 607 125,622Western Samoa . . . . . . . . . . . S0 155 186 225 235 182 2.3 204 1,100Yemen . . . . . . . . . . . . . . . . . S5 8,527 12,023 16,388 17,521 56 3.8 80 203,849Zambia . . . . . . . . . . . . . . . . . S4 5,638 7,957 9,461 9,872 80 2.2 33 285,992Zimbabwe . . . . . . . . . . . . . . . S4 7,298 9,958 11,044 11,272 67 1.2 74 149,293AREAS OF SPECIAL SOVER-EIGNTY AND DEPENDENCIESAmerican Samoa. . . . . . . . . . . S0 32 47 62 65 207 3.3 808 77Anguilla . . . . . . . . . . . . . . . . . S1 7 8 11 12 223 3.5 317 35Aruba . . . . . . . . . . . . . . . . . . S1 60 67 68 69 200 0.4 917 75Bermuda . . . . . . . . . . . . . . . . S1 55 58 62 63 208 0.9 3,278 19Cayman Islands . . . . . . . . . . . S1 17 27 38 41 212 4.3 376 100Cook Islands . . . . . . . . . . . . . S0 18 18 20 20 217 1.1 215 93Faroe Islands . . . . . . . . . . . . . S3 43 47 42 40 211 -1.7 77 541French Guiana . . . . . . . . . . . . S2 68 116 163 173 186 4.0 5 34,421French Polynesia . . . . . . . . . . S0 151 201 238 246 179 2.0 168 1,413Gaza Strip 5 . . . . . . . . . . . . . . S4 453 635 1,054 1,163 154 6.0 7,166 147Gibraltar . . . . . . . . . . . . . . . . S3 29 31 29 29 215 -0.6 12,538 2Greenland . . . . . . . . . . . . . . . S1 50 56 59 60 209 0.8 (Z) 131,931Guadeloupe . . . . . . . . . . . . . . S1 337 378 416 425 170 1.2 612 680Guam . . . . . . . . . . . . . . . . . . S6 107 134 148 152 189 1.3 709 209Guernsey. . . . . . . . . . . . . . . . S3 53 61 65 66 204 0.8 862 75Hong Kong . . . . . . . . . . . . . . S5 5,063 5,688 6,707 6,967 94 2.0 17,564 382Jersey. . . . . . . . . . . . . . . . . . S3 76 84 89 90 196 0.8 1,973 45Macau. . . . . . . . . . . . . . . . . . S6 256 352 429 445 167 2.4 69,469 6Man, Isle of . . . . . . . . . . . . . . S3 64 69 75 76 199 1.0 331 227Martinique . . . . . . . . . . . . . . . S1 339 374 407 416 171 1.1 996 409Mayotte . . . . . . . . . . . . . . . . . S4 52 90 142 157 190 5.6 978 145Montserrat . . . . . . . . . . . . . . . S1 12 13 13 13 222 0.3 332 39Netherlands Antilles . . . . . . . . . S2 173 189 206 210 183 1.1 554 371New Caledonia . . . . . . . . . . . . S6 139 168 194 200 184 1.7 27 7,243Northern Mariana Islands . . . . . S6 17 44 67 72 201 4.9 361 184Puerto Rico . . . . . . . . . . . . . . S1 3,210 3,537 3,857 3,908 118 1.0 1,115 3,459Reunion . . . . . . . . . . . . . . . . S4 507 600 705 730 159 2.0 731 965Saint Helena . . . . . . . . . . . . . S4 6 7 7 7 226 0.8 45 158Saint Pierre and Miquelon. . . . . S1 6 6 7 7 227 0.8 74 93Turks and Caicos Islands . . . . . S1 7 12 16 17 220 4.2 98 166Virgin Islands . . . . . . . . . . . . . S1 100 104 118 121 193 1.5 875 135Virgin Islands, British . . . . . . . . S1 11 16 19 20 218 2.2 323 58Wallis and Futuna . . . . . . . . . . S6 11 14 15 15 221 1.1 142 106West Bank 5. . . . . . . . . . . . . . S4 833 1,080 1,557 1,662 146 4.3 715 2,178Western Sahara . . . . . . . . . . . S4 126 191 234 245 180 2.5 2 102,703
- Represents or rounds to zero. X Not applicable. Z Less than one person per square mile. 1 Computed by theexponential method. For explanation of average annual percent change, see Guide to Tabular Presentation. 2 With theestablishment of diplomatic relations with China on January 1, 1979, the U.S. government recognized the People’s Republic ofChina as the sole legal government of China and acknowledged the Chinese position that there is only one China and that Taiwanis part of China. 3 ‘‘Congo’’ is the official short-form name for both the Republic of Congo and the Democratic Republic of theCongo. To distinguish one from the other the U.S. Dept. of State adds the capital in parentheses. This practice is unofficial andprovisional. 4 The U.S. view is that the Socialist Federal Republic of Yugoslavia has dissolved and no successor state representsits continuation. Serbia and Montenegro have asserted the formation of a joint independent state, but this entity has not beenrecognized by the United States. 5 The Gaza Strip and West Bank are Israeli occupied with interim status subject toIsraeli/Palestinian negotiations. The final status is to be determined.
Source: U.S. Bureau of the Census, unpublished data from the International Data Base.
Comparative International Statistics 829
U.S. Census Bureau, the Official StatisticsTM Statistical Abstract of the United States: 1998 Oct. 13, 1998
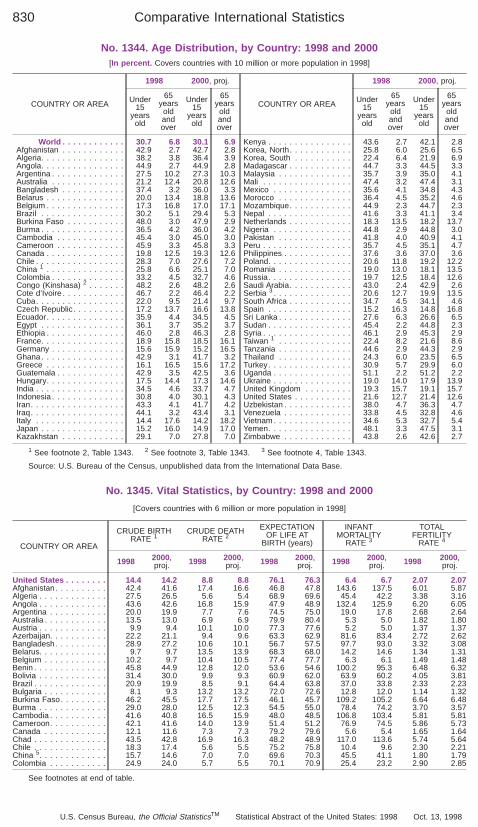
No. 1344. Age Distribution, by Country: 1998 and 2000[In percent. Covers countries with 10 million or more population in 1998]
COUNTRY OR AREA
1998 2000, proj.
Under15
yearsold
65years
oldandover
Under15
yearsold
65years
oldandover
World . . . . . . . . . . . . 30.7 6.8 30.1 6.9Afghanistan . . . . . . . . . . . . 42.9 2.7 42.7 2.8Algeria. . . . . . . . . . . . . . . . 38.2 3.8 36.4 3.9Angola. . . . . . . . . . . . . . . . 44.9 2.7 44.9 2.8Argentina . . . . . . . . . . . . . . 27.5 10.2 27.3 10.3Australia . . . . . . . . . . . . . . 21.2 12.4 20.8 12.6Bangladesh . . . . . . . . . . . . 37.4 3.2 36.0 3.3Belarus . . . . . . . . . . . . . . . 20.0 13.4 18.8 13.6Belgium . . . . . . . . . . . . . . . 17.3 16.8 17.0 17.1Brazil . . . . . . . . . . . . . . . . 30.2 5.1 29.4 5.3Burkina Faso . . . . . . . . . . . 48.0 3.0 47.9 2.9Burma . . . . . . . . . . . . . . . . 36.5 4.2 36.0 4.2Cambodia . . . . . . . . . . . . . 45.4 3.0 45.0 3.0Cameroon . . . . . . . . . . . . . 45.9 3.3 45.8 3.3Canada . . . . . . . . . . . . . . . 19.8 12.5 19.3 12.6Chile . . . . . . . . . . . . . . . . . 28.3 7.0 27.6 7.2China 1 . . . . . . . . . . . . . . . 25.8 6.6 25.1 7.0Colombia . . . . . . . . . . . . . . 33.2 4.5 32.7 4.6Congo (Kinshasa) 2 . . . . . . . 48.2 2.6 48.2 2.6Cote d’Ivoire . . . . . . . . . . . . 46.7 2.2 46.4 2.2Cuba. . . . . . . . . . . . . . . . . 22.0 9.5 21.4 9.7Czech Republic. . . . . . . . . . 17.2 13.7 16.6 13.8Ecuador. . . . . . . . . . . . . . . 35.9 4.4 34.5 4.5Egypt . . . . . . . . . . . . . . . . 36.1 3.7 35.2 3.7Ethiopia . . . . . . . . . . . . . . . 46.0 2.8 46.3 2.8France. . . . . . . . . . . . . . . . 18.9 15.8 18.5 16.1Germany . . . . . . . . . . . . . . 15.6 15.9 15.2 16.5Ghana . . . . . . . . . . . . . . . . 42.9 3.1 41.7 3.2Greece . . . . . . . . . . . . . . . 16.1 16.5 15.6 17.2Guatemala . . . . . . . . . . . . . 42.9 3.5 42.5 3.6Hungary. . . . . . . . . . . . . . . 17.5 14.4 17.3 14.6India . . . . . . . . . . . . . . . . . 34.5 4.6 33.7 4.7Indonesia . . . . . . . . . . . . . . 30.8 4.0 30.1 4.3Iran. . . . . . . . . . . . . . . . . . 43.3 4.1 41.7 4.2Iraq. . . . . . . . . . . . . . . . . . 44.1 3.2 43.4 3.1Italy . . . . . . . . . . . . . . . . . 14.4 17.6 14.2 18.2Japan . . . . . . . . . . . . . . . . 15.2 16.0 14.9 17.0Kazakhstan . . . . . . . . . . . . 29.1 7.0 27.8 7.0
COUNTRY OR AREA
1998 2000, proj.
Under15
yearsold
65years
oldandover
Under15
yearsold
65years
oldandover
Kenya . . . . . . . . . . . . . . . . 43.6 2.7 42.1 2.8Korea, North. . . . . . . . . . . . 25.8 6.0 25.6 6.5Korea, South . . . . . . . . . . . 22.4 6.4 21.9 6.9Madagascar . . . . . . . . . . . . 44.7 3.3 44.5 3.3Malaysia . . . . . . . . . . . . . . 35.7 3.9 35.0 4.1Mali . . . . . . . . . . . . . . . . . 47.4 3.2 47.4 3.1Mexico . . . . . . . . . . . . . . . 35.6 4.1 34.8 4.3Morocco . . . . . . . . . . . . . . 36.4 4.5 35.2 4.6Mozambique. . . . . . . . . . . . 44.9 2.3 44.7 2.3Nepal . . . . . . . . . . . . . . . . 41.6 3.3 41.1 3.4Netherlands . . . . . . . . . . . . 18.3 13.5 18.2 13.7Nigeria . . . . . . . . . . . . . . . 44.8 2.9 44.8 3.0Pakistan . . . . . . . . . . . . . . 41.8 4.0 40.9 4.1Peru . . . . . . . . . . . . . . . . . 35.7 4.5 35.1 4.7Philippines . . . . . . . . . . . . . 37.6 3.6 37.0 3.6Poland. . . . . . . . . . . . . . . . 20.6 11.8 19.2 12.2Romania . . . . . . . . . . . . . . 19.0 13.0 18.1 13.5Russia. . . . . . . . . . . . . . . . 19.7 12.5 18.4 12.6Saudi Arabia. . . . . . . . . . . . 43.0 2.4 42.9 2.6Serbia 3 . . . . . . . . . . . . . . . 20.6 12.7 19.9 13.5South Africa . . . . . . . . . . . . 34.7 4.5 34.1 4.6Spain . . . . . . . . . . . . . . . . 15.2 16.3 14.8 16.8Sri Lanka . . . . . . . . . . . . . . 27.6 6.3 26.6 6.5Sudan . . . . . . . . . . . . . . . . 45.4 2.2 44.8 2.3Syria . . . . . . . . . . . . . . . . . 46.1 2.9 45.3 2.9Taiwan 1 . . . . . . . . . . . . . . 22.4 8.2 21.6 8.6Tanzania . . . . . . . . . . . . . . 44.6 2.9 44.3 2.9Thailand . . . . . . . . . . . . . . 24.3 6.0 23.5 6.5Turkey . . . . . . . . . . . . . . . . 30.9 5.7 29.9 6.0Uganda . . . . . . . . . . . . . . . 51.1 2.2 51.2 2.2Ukraine . . . . . . . . . . . . . . . 19.0 14.0 17.9 13.9United Kingdom . . . . . . . . . 19.3 15.7 19.1 15.7United States . . . . . . . . . . . 21.6 12.7 21.4 12.6Uzbekistan . . . . . . . . . . . . . 38.0 4.7 36.3 4.7Venezuela . . . . . . . . . . . . . 33.8 4.5 32.8 4.6Vietnam . . . . . . . . . . . . . . . 34.6 5.3 32.7 5.4Yemen. . . . . . . . . . . . . . . . 48.1 3.3 47.5 3.1Zimbabwe . . . . . . . . . . . . . 43.8 2.6 42.6 2.7
1 See footnote 2, Table 1343. 2 See footnote 3, Table 1343. 3 See footnote 4, Table 1343.
Source: U.S. Bureau of the Census, unpublished data from the International Data Base.
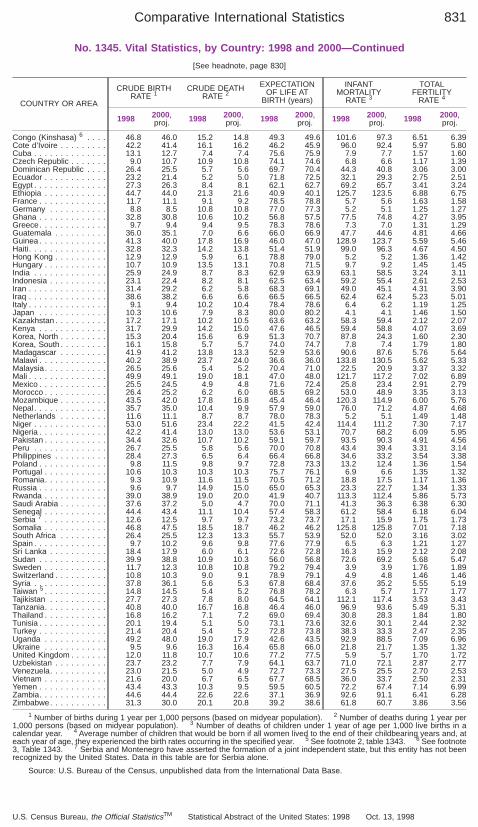
No. 1345. Vital Statistics, by Country: 1998 and 2000
[Covers countries with 6 million or more population in 1998]
COUNTRY OR AREA
CRUDE BIRTHRATE 1
CRUDE DEATHRATE 2
EXPECTATIONOF LIFE AT
BIRTH (years)
INFANTMORTALITY
RATE 3
TOTALFERTILITY
RATE 4
1998 2000,proj. 1998 2000,
proj. 1998 2000,proj. 1998 2000,
proj. 1998 2000,proj.
United States . . . . . . . . 14.4 14.2 8.8 8.8 76.1 76.3 6.4 6.7 2.07 2.07Afghanistan. . . . . . . . . . 42.4 41.6 17.4 16.6 46.8 47.8 143.6 137.5 6.01 5.87Algeria . . . . . . . . . . . . . 27.5 26.5 5.6 5.4 68.9 69.6 45.4 42.2 3.38 3.16Angola . . . . . . . . . . . . . 43.6 42.6 16.8 15.9 47.9 48.9 132.4 125.9 6.20 6.05Argentina . . . . . . . . . . . 20.0 19.9 7.7 7.6 74.5 75.0 19.0 17.8 2.68 2.64Australia . . . . . . . . . . . . 13.5 13.0 6.9 6.9 79.9 80.4 5.3 5.0 1.82 1.80Austria . . . . . . . . . . . . . 9.9 9.4 10.1 10.0 77.3 77.6 5.2 5.0 1.37 1.37Azerbaijan. . . . . . . . . . . 22.2 21.1 9.4 9.6 63.3 62.9 81.6 83.4 2.72 2.62Bangladesh. . . . . . . . . . 28.9 27.2 10.6 10.1 56.7 57.5 97.7 93.0 3.32 3.08Belarus. . . . . . . . . . . . . 9.7 9.7 13.5 13.9 68.3 68.0 14.2 14.6 1.34 1.31Belgium . . . . . . . . . . . . 10.2 9.7 10.4 10.5 77.4 77.7 6.3 6.1 1.49 1.48Benin . . . . . . . . . . . . . . 45.8 44.9 12.8 12.0 53.6 54.6 100.2 95.3 6.48 6.32Bolivia . . . . . . . . . . . . . 31.4 30.0 9.9 9.3 60.9 62.0 63.9 60.2 4.05 3.81Brazil . . . . . . . . . . . . . . 20.9 19.9 8.5 9.1 64.4 63.8 37.0 33.8 2.33 2.23Bulgaria . . . . . . . . . . . . 8.1 9.3 13.2 13.2 72.0 72.6 12.8 12.0 1.14 1.32Burkina Faso. . . . . . . . . 46.2 45.5 17.7 17.5 46.1 45.7 109.2 105.2 6.64 6.48Burma . . . . . . . . . . . . . 29.0 28.0 12.5 12.3 54.5 55.0 78.4 74.2 3.70 3.57Cambodia . . . . . . . . . . . 41.6 40.8 16.5 15.9 48.0 48.5 106.8 103.4 5.81 5.81Cameroon. . . . . . . . . . . 42.1 41.6 14.0 13.9 51.4 51.2 76.9 74.5 5.86 5.73Canada . . . . . . . . . . . . 12.1 11.6 7.3 7.3 79.2 79.6 5.6 5.4 1.65 1.64Chad . . . . . . . . . . . . . . 43.5 42.8 16.9 16.3 48.2 48.9 117.0 113.6 5.74 5.64Chile . . . . . . . . . . . . . . 18.3 17.4 5.6 5.5 75.2 75.8 10.4 9.6 2.30 2.21China 5. . . . . . . . . . . . . 15.7 14.6 7.0 7.0 69.6 70.3 45.5 41.1 1.80 1.79Colombia . . . . . . . . . . . 24.9 24.0 5.7 5.5 70.1 70.9 25.4 23.2 2.90 2.85
See footnotes at end of table.
Comparative International Statistics830
U.S. Census Bureau, the Official StatisticsTM Statistical Abstract of the United States: 1998 Oct. 13, 1998
No. 1345. Vital Statistics, by Country: 1998 and 2000—Continued
[See headnote, page 830]
COUNTRY OR AREA
CRUDE BIRTHRATE 1
CRUDE DEATHRATE 2
EXPECTATIONOF LIFE AT
BIRTH (years)
INFANTMORTALITY
RATE 3
TOTALFERTILITY
RATE 4
1998 2000,proj. 1998 2000,
proj. 1998 2000,proj. 1998 2000,
proj. 1998 2000,proj.
Congo (Kinshasa) 6 . . . . 46.8 46.0 15.2 14.8 49.3 49.6 101.6 97.3 6.51 6.39Cote d’Ivoire . . . . . . . . . 42.2 41.4 16.1 16.2 46.2 45.9 96.0 92.4 5.97 5.80Cuba . . . . . . . . . . . . . . 13.1 12.7 7.4 7.4 75.6 75.9 7.9 7.7 1.57 1.60Czech Republic . . . . . . . 9.0 10.7 10.9 10.8 74.1 74.6 6.8 6.6 1.17 1.39Dominican Republic . . . . 26.4 25.5 5.7 5.6 69.7 70.4 44.3 40.8 3.06 3.00Ecuador . . . . . . . . . . . . 23.2 21.4 5.2 5.0 71.8 72.5 32.1 29.3 2.75 2.51Egypt . . . . . . . . . . . . . . 27.3 26.3 8.4 8.1 62.1 62.7 69.2 65.7 3.41 3.24Ethiopia . . . . . . . . . . . . 44.7 44.0 21.3 21.6 40.9 40.1 125.7 123.5 6.88 6.75France . . . . . . . . . . . . . 11.7 11.1 9.1 9.2 78.5 78.8 5.7 5.6 1.63 1.58Germany . . . . . . . . . . . 8.8 8.5 10.8 10.8 77.0 77.3 5.2 5.1 1.25 1.27Ghana . . . . . . . . . . . . . 32.8 30.8 10.6 10.2 56.8 57.5 77.5 74.8 4.27 3.95Greece. . . . . . . . . . . . . 9.7 9.4 9.4 9.5 78.3 78.6 7.3 7.0 1.31 1.29Guatemala . . . . . . . . . . 36.0 35.1 7.0 6.6 66.0 66.9 47.7 44.6 4.81 4.66Guinea . . . . . . . . . . . . . 41.3 40.0 17.8 16.9 46.0 47.0 128.9 123.7 5.59 5.46Haiti. . . . . . . . . . . . . . . 32.8 32.3 14.2 13.8 51.4 51.9 99.0 96.3 4.67 4.50Hong Kong . . . . . . . . . . 12.9 12.9 5.9 6.1 78.8 79.0 5.2 5.2 1.36 1.42Hungary . . . . . . . . . . . . 10.7 10.9 13.5 13.1 70.8 71.5 9.7 9.2 1.45 1.45India . . . . . . . . . . . . . . 25.9 24.9 8.7 8.3 62.9 63.9 63.1 58.5 3.24 3.11Indonesia . . . . . . . . . . . 23.1 22.4 8.2 8.1 62.5 63.4 59.2 55.4 2.61 2.53Iran . . . . . . . . . . . . . . . 31.4 29.2 6.2 5.8 68.3 69.1 49.0 45.1 4.31 3.90Iraq . . . . . . . . . . . . . . . 38.6 38.2 6.6 6.6 66.5 66.5 62.4 62.4 5.23 5.01Italy . . . . . . . . . . . . . . . 9.1 9.4 10.2 10.4 78.4 78.6 6.4 6.2 1.19 1.25Japan . . . . . . . . . . . . . 10.3 10.6 7.9 8.3 80.0 80.2 4.1 4.1 1.46 1.50Kazakhstan . . . . . . . . . . 17.2 17.1 10.2 10.5 63.6 63.2 58.3 59.4 2.12 2.07Kenya . . . . . . . . . . . . . 31.7 29.9 14.2 15.0 47.6 46.5 59.4 58.8 4.07 3.69Korea, North . . . . . . . . . 15.3 20.4 15.6 6.9 51.3 70.7 87.8 24.3 1.60 2.30Korea, South . . . . . . . . . 16.1 15.8 5.7 5.7 74.0 74.7 7.8 7.4 1.79 1.80Madagascar . . . . . . . . . 41.9 41.2 13.8 13.3 52.9 53.6 90.6 87.6 5.76 5.64Malawi . . . . . . . . . . . . . 40.2 38.9 23.7 24.0 36.6 36.0 133.8 130.5 5.62 5.33Malaysia . . . . . . . . . . . . 26.5 25.6 5.4 5.2 70.4 71.0 22.5 20.9 3.37 3.32Mali . . . . . . . . . . . . . . . 49.9 49.1 19.0 18.1 47.0 48.0 121.7 117.2 7.02 6.89Mexico . . . . . . . . . . . . . 25.5 24.5 4.9 4.8 71.6 72.4 25.8 23.4 2.91 2.79Morocco . . . . . . . . . . . . 26.4 25.2 6.2 6.0 68.5 69.2 53.0 48.9 3.35 3.13Mozambique . . . . . . . . . 43.5 42.0 17.8 16.8 45.4 46.4 120.3 114.9 6.00 5.76Nepal . . . . . . . . . . . . . . 35.7 35.0 10.4 9.9 57.9 59.0 76.0 71.2 4.87 4.68Netherlands . . . . . . . . . 11.6 11.1 8.7 8.7 78.0 78.3 5.2 5.1 1.49 1.48Niger . . . . . . . . . . . . . . 53.0 51.6 23.4 22.2 41.5 42.4 114.4 111.2 7.30 7.17Nigeria . . . . . . . . . . . . . 42.2 41.4 13.0 13.0 53.6 53.1 70.7 68.2 6.09 5.95Pakistan . . . . . . . . . . . . 34.4 32.6 10.7 10.2 59.1 59.7 93.5 90.3 4.91 4.56Peru . . . . . . . . . . . . . . 26.7 25.5 5.8 5.6 70.0 70.8 43.4 39.4 3.31 3.14Philippines . . . . . . . . . . 28.4 27.3 6.5 6.4 66.4 66.8 34.6 33.2 3.54 3.38Poland . . . . . . . . . . . . . 9.8 11.5 9.8 9.7 72.8 73.3 13.2 12.4 1.36 1.54Portugal . . . . . . . . . . . . 10.6 10.3 10.3 10.3 75.7 76.1 6.9 6.6 1.35 1.32Romania. . . . . . . . . . . . 9.3 10.9 11.6 11.5 70.5 71.2 18.8 17.5 1.17 1.36Russia . . . . . . . . . . . . . 9.6 9.7 14.9 15.0 65.0 65.3 23.3 22.7 1.34 1.33Rwanda . . . . . . . . . . . . 39.0 38.9 19.0 20.0 41.9 40.7 113.3 112.4 5.86 5.73Saudi Arabia . . . . . . . . . 37.6 37.2 5.0 4.7 70.0 71.1 41.3 36.3 6.38 6.30Senegal . . . . . . . . . . . . 44.4 43.4 11.1 10.4 57.4 58.3 61.2 58.4 6.18 6.04Serbia 7 . . . . . . . . . . . . 12.6 12.5 9.7 9.7 73.2 73.7 17.1 15.9 1.75 1.73Somalia . . . . . . . . . . . . 46.8 47.5 18.5 18.7 46.2 46.2 125.8 125.8 7.01 7.18South Africa . . . . . . . . . 26.4 25.5 12.3 13.3 55.7 53.9 52.0 52.0 3.16 3.02Spain . . . . . . . . . . . . . . 9.7 10.2 9.6 9.8 77.6 77.9 6.5 6.3 1.21 1.27Sri Lanka . . . . . . . . . . . 18.4 17.9 6.0 6.1 72.6 72.8 16.3 15.9 2.12 2.08Sudan . . . . . . . . . . . . . 39.9 38.8 10.9 10.3 56.0 56.8 72.6 69.2 5.68 5.47Sweden . . . . . . . . . . . . 11.7 12.3 10.8 10.8 79.2 79.4 3.9 3.9 1.76 1.89Switzerland . . . . . . . . . . 10.8 10.3 9.0 9.1 78.9 79.1 4.9 4.8 1.46 1.46Syria . . . . . . . . . . . . . . 37.8 36.1 5.6 5.3 67.8 68.4 37.6 35.2 5.55 5.19Taiwan 5 . . . . . . . . . . . . 14.8 14.5 5.4 5.2 76.8 78.2 6.3 5.7 1.77 1.77Tajikistan . . . . . . . . . . . 27.7 27.3 7.8 8.0 64.5 64.1 112.1 117.4 3.53 3.43Tanzania. . . . . . . . . . . . 40.8 40.0 16.7 16.8 46.4 46.0 96.9 93.6 5.49 5.31Thailand . . . . . . . . . . . . 16.8 16.2 7.1 7.2 69.0 69.4 30.8 28.3 1.84 1.80Tunisia . . . . . . . . . . . . . 20.1 19.4 5.1 5.0 73.1 73.6 32.6 30.1 2.44 2.32Turkey . . . . . . . . . . . . . 21.4 20.4 5.4 5.2 72.8 73.8 38.3 33.3 2.47 2.35Uganda . . . . . . . . . . . . 49.2 48.0 19.0 17.9 42.6 43.5 92.9 88.5 7.09 6.96Ukraine . . . . . . . . . . . . 9.5 9.6 16.3 16.4 65.8 66.0 21.8 21.7 1.35 1.32United Kingdom . . . . . . . 12.0 11.8 10.7 10.6 77.2 77.5 5.9 5.7 1.70 1.72Uzbekistan . . . . . . . . . . 23.7 23.2 7.7 7.9 64.1 63.7 71.0 72.1 2.87 2.77Venezuela. . . . . . . . . . . 23.0 21.5 5.0 4.9 72.7 73.3 27.5 25.5 2.70 2.53Vietnam . . . . . . . . . . . . 21.6 20.0 6.7 6.5 67.7 68.5 36.0 33.7 2.50 2.31Yemen . . . . . . . . . . . . . 43.4 43.3 10.3 9.5 59.5 60.5 72.2 67.4 7.14 6.99Zambia. . . . . . . . . . . . . 44.6 44.4 22.6 22.6 37.1 36.9 92.6 91.1 6.41 6.28Zimbabwe. . . . . . . . . . . 31.3 30.0 20.1 20.8 39.2 38.6 61.8 60.7 3.86 3.56
1 Number of births during 1 year per 1,000 persons (based on midyear population). 2 Number of deaths during 1 year per1,000 persons (based on midyear population). 3 Number of deaths of children under 1 year of age per 1,000 live births in acalendar year. 4 Average number of children that would be born if all women lived to the end of their childbearing years and, ateach year of age, they experienced the birth rates occurring in the specified year. 5 See footnote 2, table 1343. 6 See footnote3, Table 1343. 7 Serbia and Montenegro have asserted the formation of a joint independent state, but this entity has not beenrecognized by the United States. Data in this table are for Serbia alone.
Source: U.S. Bureau of the Census, unpublished data from the International Data Base.
Comparative International Statistics 831
U.S. Census Bureau, the Official StatisticsTM Statistical Abstract of the United States: 1998 Oct. 13, 1998
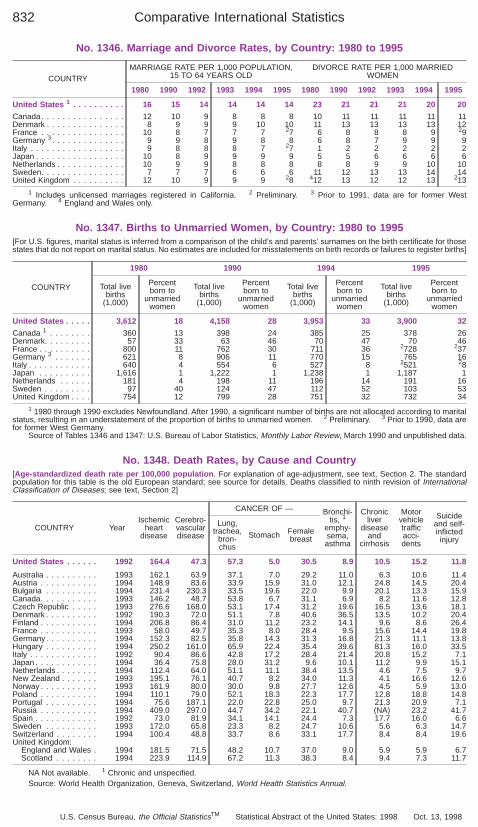
No. 1346. Marriage and Divorce Rates, by Country: 1980 to 1995
COUNTRYMARRIAGE RATE PER 1,000 POPULATION,
15 TO 64 YEARS OLDDIVORCE RATE PER 1,000 MARRIED
WOMEN
1980 1990 1992 1993 1994 1995 1980 1990 1992 1993 1994 1995
United States 1 . . . . . . . . . . 16 15 14 14 14 14 23 21 21 21 20 20
Canada . . . . . . . . . . . . . . . . 12 10 9 8 8 8 10 11 11 11 11 11Denmark . . . . . . . . . . . . . . . 8 9 9 9 10 10 11 13 13 13 13 12France . . . . . . . . . . . . . . . . 10 8 7 7 7 27 6 8 8 8 9 29Germany 3. . . . . . . . . . . . . . 9 9 8 9 8 8 6 8 7 9 9 9Italy . . . . . . . . . . . . . . . . . . 9 8 8 8 7 27 1 2 2 2 2 2Japan . . . . . . . . . . . . . . . . . 10 8 9 9 9 9 5 5 6 6 6 6Netherlands . . . . . . . . . . . . . 10 9 9 8 8 8 8 8 9 9 10 10Sweden. . . . . . . . . . . . . . . . 7 7 7 6 6 6 11 12 13 13 14 14United Kingdom . . . . . . . . . . 12 10 9 9 9 28 412 13 12 12 13 213
1 Includes unlicensed marriages registered in California. 2 Preliminary. 3 Prior to 1991, data are for former WestGermany. 4 England and Wales only.
No. 1347. Births to Unmarried Women, by Country: 1980 to 1995[For U.S. figures, marital status is inferred from a comparison of the child’s and parents’ surnames on the birth certificate for thosestates that do not report on marital status. No estimates are included for misstatements on birth records or failures to register births]
COUNTRY
1980 1990 1994 1995
Total livebirths
(1,000)
Percentborn to
unmarriedwomen
Total livebirths
(1,000)
Percentborn to
unmarriedwomen
Total livebirths
(1,000)
Percentborn to
unmarriedwomen
Total livebirths
(1,000)
Percentborn to
unmarriedwomen
United States . . . . . 3,612 18 4,158 28 3,953 33 3,900 32
Canada 1 . . . . . . . . 360 13 398 24 385 25 378 26Denmark. . . . . . . . . 57 33 63 46 70 47 70 46France . . . . . . . . . . 800 11 762 30 711 36 2728 237Germany 3 . . . . . . . 621 8 906 11 770 15 765 16Italy . . . . . . . . . . . . 640 4 554 6 527 8 2521 28Japan . . . . . . . . . . 1,616 1 1,222 1 1,238 1 1,187 1Netherlands . . . . . . 181 4 198 11 196 14 191 16Sweden . . . . . . . . . 97 40 124 47 112 52 103 53United Kingdom . . . . 754 12 799 28 751 32 732 34
1 1980 through 1990 excludes Newfoundland. After 1990, a significant number of births are not allocated according to maritalstatus, resulting in an understatement of the proportion of births to unmarried women. 2 Preliminary. 3 Prior to 1990, data arefor former West Germany.
Source of Tables 1346 and 1347: U.S. Bureau of Labor Statistics, Monthly Labor Review, March 1990 and unpublished data.
No. 1348. Death Rates, by Cause and Country[Age-standardized death rate per 100,000 population . For explanation of age-adjustment, see text, Section 2. The standardpopulation for this table is the old European standard; see source for details. Deaths classified to ninth revision of InternationalClassification of Diseases; see text, Section 2]
COUNTRY YearIschemic
heartdisease
Cerebro-vasculardisease
CANCER OF — Bronchi-tis, 1
emphy-sema,
asthma
Chronicliver
diseaseand
cirrhosis
Motorvehicletrafficacci-dents
Suicideand self-inflictedinjury
Lung,trachea,
bron-chus
Stomach Femalebreast
United States . . . . . . 1992 164.4 47.3 57.3 5.0 30.5 8.9 10.5 15.2 11.8
Australia . . . . . . . . . . 1993 162.1 63.9 37.1 7.0 29.2 11.0 6.3 10.6 11.4Austria . . . . . . . . . . . 1994 148.9 83.6 33.9 15.9 31.0 12.1 24.8 14.5 20.4Bulgaria . . . . . . . . . . 1994 231.4 230.3 33.5 19.6 22.0 9.9 20.1 13.3 15.9Canada. . . . . . . . . . . 1993 146.2 48.7 53.8 6.7 31.1 6.9 8.2 11.6 12.8Czech Republic . . . . . 1993 276.6 168.0 53.1 17.4 31.2 19.6 16.5 13.6 18.1Denmark . . . . . . . . . . 1992 190.3 72.0 51.1 7.8 40.6 36.5 13.5 10.2 20.4Finland . . . . . . . . . . . 1994 206.8 86.4 31.0 11.2 23.2 14.1 9.6 8.6 26.4France . . . . . . . . . . . 1993 58.0 49.7 35.3 8.0 28.4 9.5 15.6 14.4 19.8Germany. . . . . . . . . . 1994 152.3 82.5 35.8 14.3 31.3 16.8 21.3 11.1 13.8Hungary . . . . . . . . . . 1994 250.2 161.0 65.9 22.4 35.4 39.6 81.3 16.0 33.5Italy . . . . . . . . . . . . . 1992 90.4 86.6 42.8 17.2 28.4 21.4 20.8 15.2 7.1Japan . . . . . . . . . . . . 1994 36.4 75.8 28.0 31.2 9.6 10.1 11.2 9.9 15.1Netherlands . . . . . . . . 1994 112.4 64.0 51.1 11.1 38.4 13.5 4.6 7.5 9.7New Zealand . . . . . . . 1993 195.1 76.1 40.7 8.2 34.0 11.3 4.1 16.6 12.6Norway . . . . . . . . . . . 1993 161.9 80.0 30.0 9.8 27.7 12.6 4.5 5.9 13.0Poland . . . . . . . . . . . 1994 110.1 79.0 52.1 18.3 22.3 17.7 12.8 18.8 14.8Portugal . . . . . . . . . . 1994 75.6 187.1 22.0 22.8 25.0 9.7 21.3 20.9 7.1Russia . . . . . . . . . . . 1994 409.0 297.0 44.7 34.2 22.1 40.7 (NA) 23.2 41.7Spain . . . . . . . . . . . . 1992 73.0 81.9 34.1 14.1 24.4 7.3 17.7 16.0 6.6Sweden . . . . . . . . . . 1993 172.0 65.8 23.3 8.2 24.7 10.6 5.6 6.3 14.7Switzerland . . . . . . . . 1994 100.4 48.8 33.7 8.6 33.1 17.7 8.4 8.4 19.6United Kingdom:
England and Wales . 1994 181.5 71.5 48.2 10.7 37.0 9.0 5.9 5.9 6.7Scotland . . . . . . . . 1994 223.9 114.9 67.2 11.3 38.3 8.4 9.4 7.3 11.7
NA Not available. 1 Chronic and unspecified.Source: World Health Organization, Geneva, Switzerland, World Health Statistics Annual.
Comparative International Statistics832
U.S. Census Bureau, the Official StatisticsTM Statistical Abstract of the United States: 1998 Oct. 13, 1998
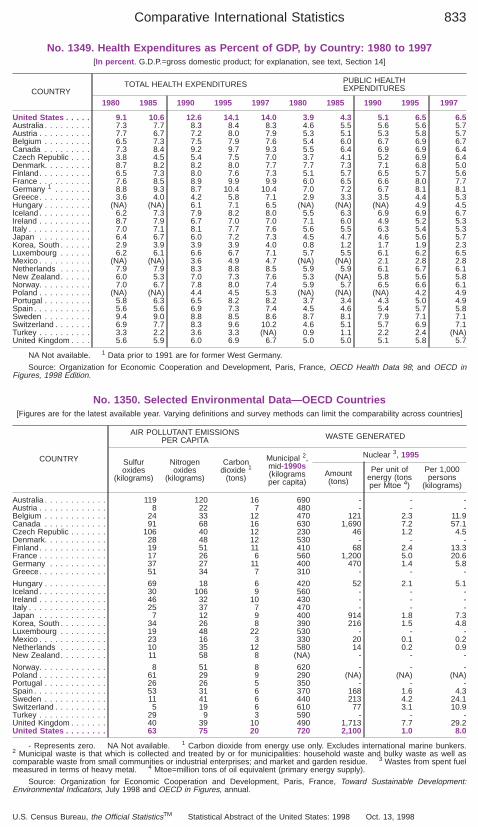
No. 1349. Health Expenditures as Percent of GDP, by Country: 1980 to 1997[In percent . G.D.P.=gross domestic product; for explanation, see text, Section 14]
COUNTRYTOTAL HEALTH EXPENDITURES PUBLIC HEALTH
EXPENDITURES
1980 1985 1990 1995 1997 1980 1985 1990 1995 1997
United States . . . . . 9.1 10.6 12.6 14.1 14.0 3.9 4.3 5.1 6.5 6.5Australia . . . . . . . . . 7.3 7.7 8.3 8.4 8.3 4.6 5.5 5.6 5.6 5.7Austria . . . . . . . . . . 7.7 6.7 7.2 8.0 7.9 5.3 5.1 5.3 5.8 5.7Belgium . . . . . . . . . 6.5 7.3 7.5 7.9 7.6 5.4 6.0 6.7 6.9 6.7Canada . . . . . . . . . 7.3 8.4 9.2 9.7 9.3 5.5 6.4 6.9 6.9 6.4Czech Republic . . . . 3.8 4.5 5.4 7.5 7.0 3.7 4.1 5.2 6.9 6.4Denmark. . . . . . . . . 8.7 8.2 8.2 8.0 7.7 7.7 7.3 7.1 6.8 5.0Finland. . . . . . . . . . 6.5 7.3 8.0 7.6 7.3 5.1 5.7 6.5 5.7 5.6France . . . . . . . . . . 7.6 8.5 8.9 9.9 9.9 6.0 6.5 6.6 8.0 7.7Germany 1 . . . . . . . 8.8 9.3 8.7 10.4 10.4 7.0 7.2 6.7 8.1 8.1Greece. . . . . . . . . . 3.6 4.0 4.2 5.8 7.1 2.9 3.3 3.5 4.4 5.3Hungary . . . . . . . . . (NA) (NA) 6.1 7.1 6.5 (NA) (NA) (NA) 4.9 4.5Iceland . . . . . . . . . . 6.2 7.3 7.9 8.2 8.0 5.5 6.3 6.9 6.9 6.7Ireland . . . . . . . . . . 8.7 7.9 6.7 7.0 7.0 7.1 6.0 4.9 5.2 5.3Italy . . . . . . . . . . . . 7.0 7.1 8.1 7.7 7.6 5.6 5.5 6.3 5.4 5.3Japan . . . . . . . . . . 6.4 6.7 6.0 7.2 7.3 4.5 4.7 4.6 5.6 5.7Korea, South . . . . . . 2.9 3.9 3.9 3.9 4.0 0.8 1.2 1.7 1.9 2.3Luxembourg . . . . . . 6.2 6.1 6.6 6.7 7.1 5.7 5.5 6.1 6.2 6.5Mexico . . . . . . . . . . (NA) (NA) 3.6 4.9 4.7 (NA) (NA) 2.1 2.8 2.8Netherlands . . . . . . 7.9 7.9 8.3 8.8 8.5 5.9 5.9 6.1 6.7 6.1New Zealand. . . . . . 6.0 5.3 7.0 7.3 7.6 5.3 (NA) 5.8 5.6 5.8Norway. . . . . . . . . . 7.0 6.7 7.8 8.0 7.4 5.9 5.7 6.5 6.6 6.1Poland . . . . . . . . . . (NA) (NA) 4.4 4.5 5.3 (NA) (NA) (NA) 4.2 4.9Portugal . . . . . . . . . 5.8 6.3 6.5 8.2 8.2 3.7 3.4 4.3 5.0 4.9Spain . . . . . . . . . . . 5.6 5.6 6.9 7.3 7.4 4.5 4.6 5.4 5.7 5.8Sweden . . . . . . . . . 9.4 9.0 8.8 8.5 8.6 8.7 8.1 7.9 7.1 7.1Switzerland . . . . . . . 6.9 7.7 8.3 9.6 10.2 4.6 5.1 5.7 6.9 7.1Turkey . . . . . . . . . . 3.3 2.2 3.6 3.3 (NA) 0.9 1.1 2.2 2.4 (NA)United Kingdom . . . . 5.6 5.9 6.0 6.9 6.7 5.0 5.0 5.1 5.8 5.7
NA Not available. 1 Data prior to 1991 are for former West Germany.
Source: Organization for Economic Cooperation and Development, Paris, France, OECD Health Data 98; and OECD inFigures, 1998 Edition.
No. 1350. Selected Environmental Data—OECD Countries[Figures are for the latest available year. Varying definitions and survey methods can limit the comparability across countries]
COUNTRY
AIR POLLUTANT EMISSIONSPER CAPITA WASTE GENERATED
Sulfuroxides
(kilograms)
Nitrogenoxides
(kilograms)
Carbondioxide 1
(tons)
Municipal 2,mid-1990s(kilogramsper capita)
Nuclear 3, 1995
Amount(tons)
Per unit ofenergy (tonsper Mtoe 4)
Per 1,000persons
(kilograms)
Australia . . . . . . . . . . . . 119 120 16 690 - - -Austria . . . . . . . . . . . . . 8 22 7 480 - - -Belgium . . . . . . . . . . . . 24 33 12 470 121 2.3 11.9Canada . . . . . . . . . . . . 91 68 16 630 1,690 7.2 57.1Czech Republic . . . . . . . 106 40 12 230 46 1.2 4.5Denmark. . . . . . . . . . . . 28 48 12 530 - - -Finland. . . . . . . . . . . . . 19 51 11 410 68 2.4 13.3France . . . . . . . . . . . . . 17 26 6 560 1,200 5.0 20.6Germany . . . . . . . . . . . 37 27 11 400 470 1.4 5.8Greece. . . . . . . . . . . . . 51 34 7 310 - - -
Hungary . . . . . . . . . . . . 69 18 6 420 52 2.1 5.1Iceland . . . . . . . . . . . . . 30 106 9 560 - - -Ireland . . . . . . . . . . . . . 46 32 10 430 - - -Italy . . . . . . . . . . . . . . . 25 37 7 470 - - -Japan . . . . . . . . . . . . . 7 12 9 400 914 1.8 7.3Korea, South . . . . . . . . . 34 26 8 390 216 1.5 4.8Luxembourg . . . . . . . . . 19 48 22 530 - - -Mexico . . . . . . . . . . . . . 23 16 3 330 20 0.1 0.2Netherlands . . . . . . . . . 10 35 12 580 14 0.2 0.9New Zealand. . . . . . . . . 11 58 8 (NA) - - -
Norway. . . . . . . . . . . . . 8 51 8 620 - - -Poland . . . . . . . . . . . . . 61 29 9 290 (NA) (NA) (NA)Portugal . . . . . . . . . . . . 26 26 5 350 - - -Spain . . . . . . . . . . . . . . 53 31 6 370 168 1.6 4.3Sweden . . . . . . . . . . . . 11 41 6 440 213 4.2 24.1Switzerland . . . . . . . . . . 5 19 6 610 77 3.1 10.9Turkey . . . . . . . . . . . . . 29 9 3 590 - - -United Kingdom . . . . . . . 40 39 10 490 1,713 7.7 29.2United States . . . . . . . . 63 75 20 720 2,100 1.0 8.0
- Represents zero. NA Not available. 1 Carbon dioxide from energy use only. Excludes international marine bunkers.2 Municipal waste is that which is collected and treated by or for municipalities: household waste and bulky waste as well ascomparable waste from small communities or industrial enterprises; and market and garden residue. 3 Wastes from spent fuelmeasured in terms of heavy metal. 4 Mtoe=million tons of oil equivalent (primary energy supply).
Source: Organization for Economic Cooperation and Development, Paris, France, Toward Sustainable Development:Environmental Indicators, July 1998 and OECD in Figures, annual.
Comparative International Statistics 833
U.S. Census Bureau, the Official StatisticsTM Statistical Abstract of the United States: 1998 Oct. 13, 1998
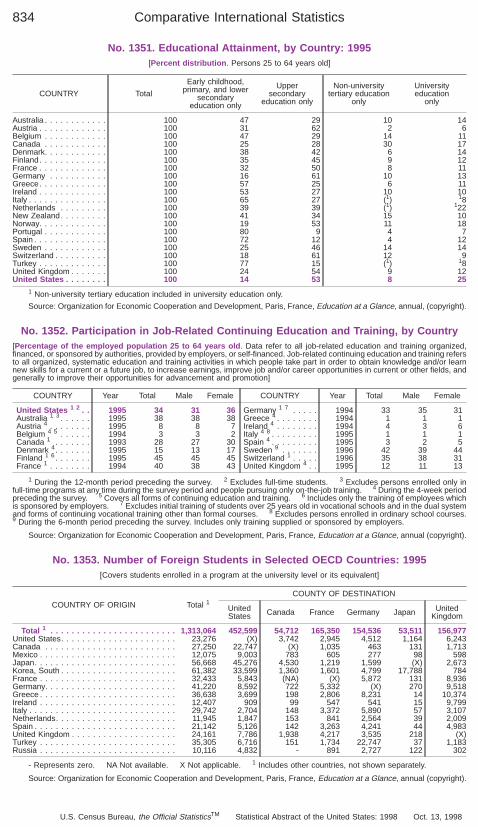
No. 1351. Educational Attainment, by Country: 1995[Percent distribution . Persons 25 to 64 years old]
COUNTRY Total
Early childhood,primary, and lower
secondaryeducation only
Uppersecondary
education only
Non-universitytertiary education
only
Universityeducation
only
Australia . . . . . . . . . . . . 100 47 29 10 14Austria . . . . . . . . . . . . . 100 31 62 2 6Belgium . . . . . . . . . . . . 100 47 29 14 11Canada . . . . . . . . . . . . 100 25 28 30 17Denmark. . . . . . . . . . . . 100 38 42 6 14Finland. . . . . . . . . . . . . 100 35 45 9 12France . . . . . . . . . . . . . 100 32 50 8 11Germany . . . . . . . . . . . 100 16 61 10 13Greece. . . . . . . . . . . . . 100 57 25 6 11Ireland . . . . . . . . . . . . . 100 53 27 10 10Italy . . . . . . . . . . . . . . . 100 65 27 (1) 18Netherlands . . . . . . . . . 100 39 39 (1) 122New Zealand. . . . . . . . . 100 41 34 15 10Norway. . . . . . . . . . . . . 100 19 53 11 18Portugal . . . . . . . . . . . . 100 80 9 4 7Spain . . . . . . . . . . . . . . 100 72 12 4 12Sweden . . . . . . . . . . . . 100 25 46 14 14Switzerland . . . . . . . . . . 100 18 61 12 9Turkey . . . . . . . . . . . . . 100 77 15 (1) 18United Kingdom . . . . . . . 100 24 54 9 12United States . . . . . . . . 100 14 53 8 25
1 Non-university tertiary education included in university education only.
Source: Organization for Economic Cooperation and Development, Paris, France, Education at a Glance, annual, (copyright).
No. 1352. Participation in Job-Related Continuing Education and Training, by Country[Percentage of the employed population 25 to 64 years old . Data refer to all job-related education and training organized,financed, or sponsored by authorities, provided by employers, or self-financed. Job-related continuing education and training refersto all organized, systematic education and training activities in which people take part in order to obtain knowledge and/or learnnew skills for a current or a future job, to increase earnings, improve job and/or career opportunities in current or other fields, andgenerally to improve their opportunities for advancement and promotion]
COUNTRY Year Total Male Female
United States 1 2 . . 1995 34 31 36Australia 1 3 . . . . . . 1995 38 38 38Austria 4 . . . . . . . . 1995 8 8 7Belgium 4 5 . . . . . . 1994 3 3 2Canada 1 . . . . . . . 1993 28 27 30Denmark 4. . . . . . . 1995 15 13 17Finland 1 6 . . . . . . . 1995 45 45 45France 1 . . . . . . . . 1994 40 38 43
COUNTRY Year Total Male Female
Germany 1 7 . . . . . 1994 33 35 31Greece 4 . . . . . . . . 1994 1 1 1Ireland 4 . . . . . . . . 1994 4 3 6Italy 4 8 . . . . . . . . . 1995 1 1 1Spain 4 . . . . . . . . . 1995 3 2 5Sweden 9 . . . . . . . 1996 42 39 44Switzerland 1 . . . . . 1996 35 38 31United Kingdom 4 . . 1995 12 11 13
1 During the 12-month period preceding the survey. 2 Excludes full-time students. 3 Excludes persons enrolled only infull-time programs at any time during the survey period and people pursuing only on-the-job training. 4 During the 4-week periodpreceding the survey. 5 Covers all forms of continuing education and training. 6 Includes only the training of employees whichis sponsored by employers. 7 Excludes initial training of students over 25 years old in vocational schools and in the dual systemand forms of continuing vocational training other than formal courses. 8 Excludes persons enrolled in ordinary school courses.9 During the 6-month period preceding the survey. Includes only training supplied or sponsored by employers.
Source: Organization for Economic Cooperation and Development, Paris, France, Education at a Glance, annual (copyright).
No. 1353. Number of Foreign Students in Selected OECD Countries: 1995[Covers students enrolled in a program at the university level or its equivalent]
COUNTRY OF ORIGIN Total 1COUNTY OF DESTINATION
UnitedStates Canada France Germany Japan United
Kingdom
Total 1 . . . . . . . . . . . . . . . . . . . . . . . . 1,313,064 452,599 54,712 165,350 154,536 53,511 156,977United States. . . . . . . . . . . . . . . . . . . . . . 23,276 (X) 3,742 2,945 4,512 1,164 6,243Canada . . . . . . . . . . . . . . . . . . . . . . . . . 27,250 22,747 (X) 1,035 463 131 1,713Mexico . . . . . . . . . . . . . . . . . . . . . . . . . . 12,075 9,003 783 605 277 98 598Japan. . . . . . . . . . . . . . . . . . . . . . . . . . . 56,668 45,276 4,530 1,219 1,599 (X) 2,673Korea, South . . . . . . . . . . . . . . . . . . . . . . 61,382 33,599 1,360 1,601 4,799 17,788 784France . . . . . . . . . . . . . . . . . . . . . . . . . . 32,433 5,843 (NA) (X) 5,872 131 8,936Germany. . . . . . . . . . . . . . . . . . . . . . . . . 41,220 8,592 722 5,332 (X) 270 9,518Greece . . . . . . . . . . . . . . . . . . . . . . . . . . 36,638 3,699 198 2,806 8,231 14 10,374Ireland . . . . . . . . . . . . . . . . . . . . . . . . . . 12,407 909 99 547 541 15 9,799Italy . . . . . . . . . . . . . . . . . . . . . . . . . . . . 29,742 2,704 148 3,372 5,890 57 3,107Netherlands. . . . . . . . . . . . . . . . . . . . . . . 11,945 1,847 153 841 2,564 39 2,009Spain . . . . . . . . . . . . . . . . . . . . . . . . . . . 21,142 5,126 142 3,263 4,241 44 4,983United Kingdom . . . . . . . . . . . . . . . . . . . . 24,161 7,786 1,938 4,217 3,535 218 (X)Turkey . . . . . . . . . . . . . . . . . . . . . . . . . . 35,305 6,716 151 1,734 22,747 37 1,183Russia . . . . . . . . . . . . . . . . . . . . . . . . . . 10,116 4,832 - 891 2,727 122 302
- Represents zero. NA Not available. X Not applicable. 1 Includes other countries, not shown separately.
Source: Organization for Economic Cooperation and Development, Paris, France, Education at a Glance, annual (copyright).
Comparative International Statistics834
U.S. Census Bureau, the Official StatisticsTM Statistical Abstract of the United States: 1998 Oct. 13, 1998
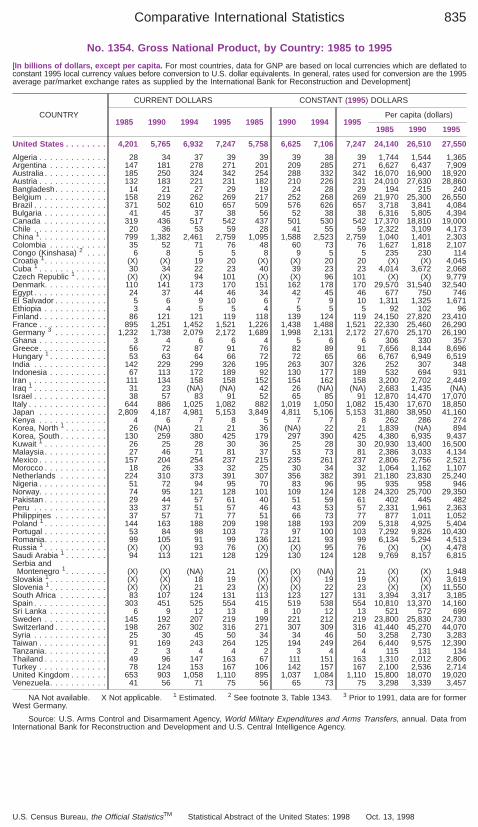
No. 1354. Gross National Product, by Country: 1985 to 1995
[In billions of dollars, except per capita. For most countries, data for GNP are based on local currencies which are deflated toconstant 1995 local currency values before conversion to U.S. dollar equivalents. In general, rates used for conversion are the 1995average par/market exchange rates as supplied by the International Bank for Reconstruction and Development]
COUNTRY
CURRENT DOLLARS CONSTANT (1995) DOLLARS
1985 1990 1994 1995 1985 1990 1994 1995Per capita (dollars)
1985 1990 1995
United States . . . . . . . . 4,201 5,765 6,932 7,247 5,758 6,625 7,106 7,247 24,140 26,510 27,550
Algeria . . . . . . . . . . . . . 28 34 37 39 39 39 38 39 1,744 1,544 1,365Argentina . . . . . . . . . . . 147 181 278 271 201 209 285 271 6,627 6,437 7,909Australia . . . . . . . . . . . . 185 250 324 342 254 288 332 342 16,070 16,900 18,920Austria . . . . . . . . . . . . . 132 183 221 231 182 210 226 231 24,010 27,630 28,860Bangladesh. . . . . . . . . . 14 21 27 29 19 24 28 29 194 215 240Belgium . . . . . . . . . . . . 158 219 262 269 217 252 268 269 21,970 25,300 26,550Brazil . . . . . . . . . . . . . . 371 502 610 657 509 576 626 657 3,718 3,841 4,084Bulgaria . . . . . . . . . . . . 41 45 37 38 56 52 38 38 6,316 5,805 4,394Canada . . . . . . . . . . . . 319 436 517 542 437 501 530 542 17,370 18,810 19,000Chile . . . . . . . . . . . . . . 20 36 53 59 28 41 55 59 2,322 3,109 4,173China 1. . . . . . . . . . . . . 799 1,382 2,461 2,759 1,095 1,588 2,523 2,759 1,040 1,401 2,303Colombia . . . . . . . . . . . 35 52 71 76 48 60 73 76 1,627 1,818 2,107Congo (Kinshasa) 2 . . . . 6 8 5 5 8 9 5 5 235 230 114Croatia 1. . . . . . . . . . . . (X) (X) 19 20 (X) (X) 20 20 (X) (X) 4,045Cuba 1 . . . . . . . . . . . . . 30 34 22 23 40 39 23 23 4,014 3,672 2,068Czech Republic 1 . . . . . . (X) (X) 94 101 (X) (X) 96 101 (X) (X) 9,779Denmark. . . . . . . . . . . . 110 141 173 170 151 162 178 170 29,570 31,540 32,540Egypt . . . . . . . . . . . . . . 24 37 44 46 34 42 45 46 677 750 746El Salvador . . . . . . . . . . 5 6 9 10 6 7 9 10 1,311 1,325 1,671Ethiopia . . . . . . . . . . . . 3 4 5 5 4 5 5 5 92 102 96Finland. . . . . . . . . . . . . 86 121 121 119 118 139 124 119 24,150 27,820 23,410France . . . . . . . . . . . . . 895 1,251 1,452 1,521 1,226 1,438 1,488 1,521 22,330 25,460 26,290Germany 3 . . . . . . . . . . 1,232 1,738 2,079 2,172 1,689 1,998 2,131 2,172 27,670 25,170 26,190Ghana . . . . . . . . . . . . . 3 4 6 6 4 5 6 6 306 330 357Greece. . . . . . . . . . . . . 56 72 87 91 76 82 89 91 7,656 8,144 8,696Hungary 1 . . . . . . . . . . . 53 63 64 66 72 72 65 66 6,767 6,949 6,519India . . . . . . . . . . . . . . 142 229 299 326 195 263 307 326 252 307 348Indonesia . . . . . . . . . . . 67 113 172 189 92 130 177 189 532 694 931Iran . . . . . . . . . . . . . . . 111 134 158 158 152 154 162 158 3,200 2,702 2,449Iraq 1 . . . . . . . . . . . . . . 31 23 (NA) (NA) 42 26 (NA) (NA) 2,683 1,435 (NA)Israel . . . . . . . . . . . . . . 38 57 83 91 52 65 85 91 12,870 14,470 17,070Italy . . . . . . . . . . . . . . . 644 886 1,025 1,082 882 1,019 1,050 1,082 15,430 17,670 18,850Japan . . . . . . . . . . . . . 2,809 4,187 4,981 5,153 3,849 4,811 5,106 5,153 31,880 38,950 41,160Kenya . . . . . . . . . . . . . 4 6 7 8 5 7 7 8 262 286 274Korea, North 1 . . . . . . . . 26 (NA) 21 21 36 (NA) 22 21 1,839 (NA) 894Korea, South . . . . . . . . . 130 259 380 425 179 297 390 425 4,380 6,935 9,437Kuwait 1 . . . . . . . . . . . . 26 25 28 30 36 25 28 30 20,930 13,400 16,500Malaysia . . . . . . . . . . . . 27 46 71 81 37 53 73 81 2,386 3,033 4,134Mexico . . . . . . . . . . . . . 157 204 254 237 215 235 261 237 2,806 2,756 2,521Morocco . . . . . . . . . . . . 18 26 33 32 25 30 34 32 1,064 1,162 1,107Netherlands . . . . . . . . . 224 310 373 391 307 356 382 391 21,180 23,830 25,240Nigeria . . . . . . . . . . . . . 51 72 94 95 70 83 96 95 935 958 946Norway. . . . . . . . . . . . . 74 95 121 128 101 109 124 128 24,320 25,700 29,350Pakistan . . . . . . . . . . . . 29 44 57 61 40 51 59 61 402 445 482Peru . . . . . . . . . . . . . . 33 37 51 57 46 43 53 57 2,331 1,961 2,363Philippines . . . . . . . . . . 37 57 71 77 51 66 73 77 877 1,011 1,052Poland 1 . . . . . . . . . . . . 144 163 188 209 198 188 193 209 5,318 4,925 5,404Portugal . . . . . . . . . . . . 53 84 98 103 73 97 100 103 7,292 9,826 10,430Romania. . . . . . . . . . . . 99 105 91 99 136 121 93 99 6,134 5,294 4,513Russia 1 . . . . . . . . . . . . (X) (X) 93 76 (X) (X) 95 76 (X) (X) 4,478Saudi Arabia 1 . . . . . . . . 94 113 121 128 129 130 124 128 9,769 8,157 6,815Serbia and
Montenegro 1. . . . . . . . (X) (X) (NA) 21 (X) (X) (NA) 21 (X) (X) 1,948Slovakia 1 . . . . . . . . . . . (X) (X) 18 19 (X) (X) 19 19 (X) (X) 3,619Slovenia 1 . . . . . . . . . . . (X) (X) 21 23 (X) (X) 22 23 (X) (X) 11,550South Africa . . . . . . . . . 83 107 124 131 113 123 127 131 3,394 3,317 3,185Spain . . . . . . . . . . . . . . 303 451 525 554 415 519 538 554 10,810 13,370 14,160Sri Lanka . . . . . . . . . . . 6 9 12 13 8 10 12 13 521 572 699Sweden . . . . . . . . . . . . 145 192 207 219 199 221 212 219 23,800 25,830 24,730Switzerland . . . . . . . . . . 198 267 302 316 271 307 309 316 41,440 45,270 44,070Syria . . . . . . . . . . . . . . 25 30 45 50 34 34 46 50 3,258 2,730 3,283Taiwan . . . . . . . . . . . . . 91 169 243 264 125 194 249 264 6,440 9,575 12,390Tanzania. . . . . . . . . . . . 2 3 4 4 2 3 4 4 115 131 134Thailand . . . . . . . . . . . . 49 96 147 163 67 111 151 163 1,310 2,012 2,806Turkey . . . . . . . . . . . . . 78 124 153 167 106 142 157 167 2,100 2,536 2,714United Kingdom . . . . . . . 653 903 1,058 1,110 895 1,037 1,084 1,110 15,800 18,070 19,020Venezuela. . . . . . . . . . . 41 56 71 75 56 65 73 75 3,298 3,339 3,457
NA Not available. X Not applicable. 1 Estimated. 2 See footnote 3, Table 1343. 3 Prior to 1991, data are for formerWest Germany.
Source: U.S. Arms Control and Disarmament Agency, World Military Expenditures and Arms Transfers, annual. Data fromInternational Bank for Reconstruction and Development and U.S. Central Intelligence Agency.
Comparative International Statistics 835
U.S. Census Bureau, the Official StatisticsTM Statistical Abstract of the United States: 1998 Oct. 13, 1998
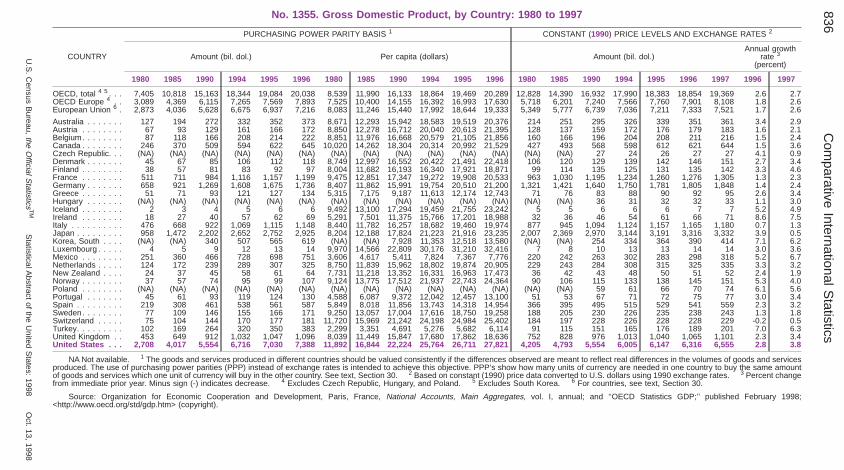
No. 1355. Gross Domestic Product, by Country: 1980 to 1997
COUNTRY
PURCHASING POWER PARITY BASIS 1 CONSTANT (1990) PRICE LEVELS AND EXCHANGE RATES 2
Amount (bil. dol.) Per capita (dollars) Amount (bil. dol.)Annual growth
rate 3
(percent)
1980 1985 1990 1994 1995 1996 1980 1985 1990 1994 1995 1996 1980 1985 1990 1994 1995 1996 1997 1996 1997
OECD, total 4 5 . . . 7,405 10,818 15,163 18,344 19,084 20,038 8,539 11,990 16,133 18,864 19,469 20,289 12,828 14,390 16,932 17,990 18,383 18,854 19,369 2.6 2.7OECD Europe 4 . . 3,089 4,369 6,115 7,265 7,569 7,893 7,525 10,400 14,155 16,392 16,993 17,630 5,718 6,201 7,240 7,566 7,760 7,901 8,108 1.8 2.6European Union 6 . 2,873 4,036 5,628 6,675 6,937 7,216 8,083 11,246 15,440 17,992 18,644 19,333 5,349 5,777 6,739 7,036 7,211 7,333 7,521 1.7 2.6
Australia . . . . . . . 127 194 272 332 352 373 8,671 12,293 15,942 18,583 19,519 20,376 214 251 295 326 339 351 361 3.4 2.9Austria . . . . . . . . 67 93 129 161 166 172 8,850 12,278 16,712 20,040 20,613 21,395 128 137 159 172 176 179 183 1.6 2.1Belgium. . . . . . . . 87 118 166 208 214 222 8,851 11,976 16,668 20,579 21,105 21,856 160 166 196 204 208 211 216 1.5 2.4Canada . . . . . . . . 246 370 509 594 622 645 10,020 14,262 18,304 20,314 20,992 21,529 427 493 568 598 612 621 644 1.5 3.6Czech Republic. . . (NA) (NA) (NA) (NA) (NA) (NA) (NA) (NA) (NA) (NA) (NA) (NA) (NA) (NA) 27 24 26 27 27 4.1 0.9Denmark . . . . . . . 45 67 85 106 112 118 8,749 12,997 16,552 20,422 21,491 22,418 106 120 129 139 142 146 151 2.7 3.4Finland . . . . . . . . 38 57 81 83 92 97 8,004 11,682 16,193 16,340 17,921 18,871 99 114 135 125 131 135 142 3.3 4.6France . . . . . . . . 511 711 984 1,116 1,157 1,199 9,475 12,851 17,347 19,272 19,908 20,533 963 1,030 1,195 1,234 1,260 1,276 1,305 1.3 2.3Germany . . . . . . . 658 921 1,269 1,608 1,675 1,736 8,407 11,862 15,991 19,754 20,510 21,200 1,321 1,421 1,640 1,750 1,781 1,805 1,848 1.4 2.4Greece . . . . . . . . 51 71 93 121 127 134 5,315 7,175 9,187 11,613 12,174 12,743 71 76 83 88 90 92 95 2.6 3.4Hungary . . . . . . . (NA) (NA) (NA) (NA) (NA) (NA) (NA) (NA) (NA) (NA) (NA) (NA) (NA) (NA) 36 31 32 32 33 1.1 3.0Iceland . . . . . . . . 2 3 4 5 6 6 9,492 13,100 17,294 19,459 21,755 23,242 5 5 6 6 6 7 7 5.2 4.9Ireland . . . . . . . . 18 27 40 57 62 69 5,291 7,501 11,375 15,766 17,201 18,988 32 36 46 54 61 66 71 8.6 7.5Italy . . . . . . . . . . 476 668 922 1,069 1,115 1,148 8,440 11,782 16,257 18,682 19,460 19,974 877 945 1,094 1,124 1,157 1,165 1,180 0.7 1.3Japan . . . . . . . . . 958 1,472 2,202 2,652 2,752 2,925 8,204 12,188 17,824 21,223 21,916 23,235 2,007 2,369 2,970 3,144 3,191 3,316 3,332 3.9 0.5Korea, South . . . . (NA) (NA) 340 507 565 619 (NA) (NA) 7,928 11,353 12,518 13,580 (NA) (NA) 254 334 364 390 414 7.1 6.2Luxembourg . . . . . 4 5 9 12 13 14 9,970 14,566 22,809 30,176 31,210 32,416 7 8 10 13 13 14 14 3.0 3.6Mexico . . . . . . . . 251 360 466 728 698 751 3,606 4,617 5,411 7,824 7,367 7,776 220 242 263 302 283 298 318 5.2 6.7Netherlands . . . . . 124 172 239 289 307 325 8,750 11,839 15,962 18,802 19,874 20,905 229 243 284 308 315 325 335 3.3 3.2New Zealand . . . . 24 37 45 58 61 64 7,731 11,218 13,352 16,331 16,963 17,473 36 42 43 48 50 51 52 2.4 1.9Norway . . . . . . . . 37 57 74 95 99 107 9,124 13,775 17,512 21,937 22,743 24,364 90 106 115 133 138 145 151 5.3 4.0Poland . . . . . . . . (NA) (NA) (NA) (NA) (NA) (NA) (NA) (NA) (NA) (NA) (NA) (NA) (NA) (NA) 59 61 66 70 74 6.1 5.6Portugal . . . . . . . 45 61 93 119 124 130 4,588 6,087 9,372 12,042 12,457 13,100 51 53 67 71 72 75 77 3.0 3.4Spain . . . . . . . . . 219 308 461 538 561 587 5,849 8,018 11,856 13,743 14,318 14,954 366 395 495 515 529 541 559 2.3 3.2Sweden. . . . . . . . 77 109 146 155 166 171 9,250 13,057 17,004 17,616 18,750 19,258 188 205 230 226 235 238 243 1.3 1.8Switzerland . . . . . 75 104 144 170 177 181 11,720 15,969 21,242 24,198 24,984 25,402 184 197 228 226 228 228 229 -0.2 0.5Turkey. . . . . . . . . 102 169 264 320 350 383 2,299 3,351 4,691 5,276 5,682 6,114 91 115 151 165 176 189 201 7.0 6.3United Kingdom . . 453 649 912 1,032 1,047 1,096 8,039 11,449 15,847 17,680 17,862 18,636 752 828 976 1,013 1,040 1,065 1,101 2.3 3.4United States . . . 2,708 4,017 5,554 6,716 7,030 7,388 11,892 16,844 22,224 25,764 26,711 27,821 4,205 4,793 5,554 6,005 6,147 6,316 6,555 2.8 3.8
NA Not available. 1 The goods and services produced in different countries should be valued consistently if the differences observed are meant to reflect real differences in the volumes of goods and servicesproduced. The use of purchasing power parities (PPP) instead of exchange rates is intended to achieve this objective. PPP’s show how many units of currency are needed in one country to buy the same amountof goods and services which one unit of currency will buy in the other country. See text, Section 30. 2 Based on constant (1990) price data converted to U.S. dollars using 1990 exchange rates. 3 Percent changefrom immediate prior year. Minus sign (-) indicates decrease. 4 Excludes Czech Republic, Hungary, and Poland. 5 Excludes South Korea. 6 For countries, see text, Section 30.
Source: Organization for Economic Cooperation and Development, Paris, France, National Accounts, Main Aggregates, vol. I, annual; and ‘‘OECD Statistics GDP;’’ published February 1998;<http://www.oecd.org/std/gdp.htm> (copyright).
Com
parativeInternationalS
tatistics836
U.S
.C
ensusB
ureau,the
OfficialS
tatisticsT
MS
tatisticalAbstract
ofthe
United
States:
1998O
ct.13,
1998
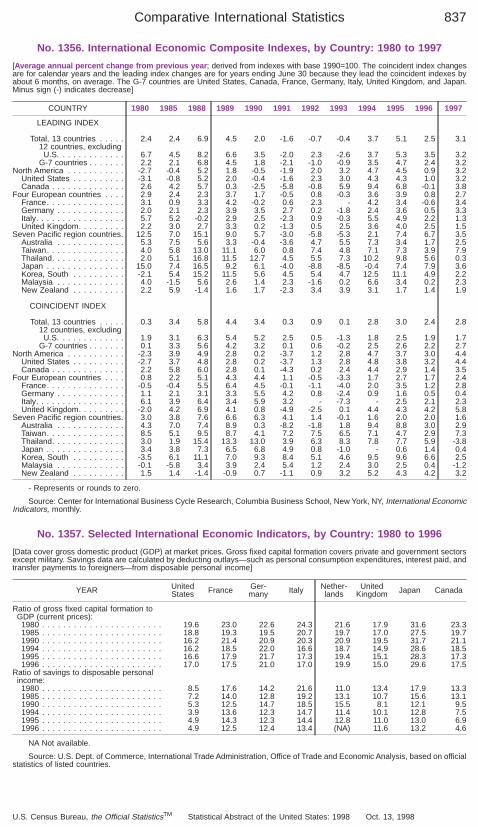
No. 1356. International Economic Composite Indexes, by Country: 1980 to 1997
[Average annual percent change from previous year ; derived from indexes with base 1990=100. The coincident index changesare for calendar years and the leading index changes are for years ending June 30 because they lead the coincident indexes byabout 6 months, on average. The G-7 countries are United States, Canada, France, Germany, Italy, United Kingdom, and Japan.Minus sign (-) indicates decrease]
COUNTRY 1980 1985 1988 1989 1990 1991 1992 1993 1994 1995 1996 1997
LEADING INDEX
Total, 13 countries . . . . . 2.4 2.4 6.9 4.5 2.0 -1.6 -0.7 -0.4 3.7 5.1 2.5 3.112 countries, excluding
U.S. . . . . . . . . . . . . 6.7 4.5 8.2 6.6 3.5 -2.0 2.3 -2.6 3.7 5.3 3.5 3.2G-7 countries . . . . . . . 2.2 2.1 6.8 4.5 1.8 -2.1 -1.0 -0.9 3.5 4.7 2.4 3.2
North America . . . . . . . . . . . -2.7 -0.4 5.2 1.8 -0.5 -1.9 2.0 3.2 4.7 4.5 0.9 3.2United States . . . . . . . . . . -3.1 -0.8 5.2 2.0 -0.4 -1.6 2.3 3.0 4.3 4.3 1.0 3.2Canada . . . . . . . . . . . . . . 2.6 4.2 5.7 0.3 -2.5 -5.8 -0.8 5.9 9.4 6.8 -0.1 3.8
Four European countries . . . . 2.9 2.4 2.3 3.7 1.7 -0.5 0.8 -0.3 3.6 3.9 0.8 2.7France. . . . . . . . . . . . . . . 3.1 0.9 3.3 4.2 -0.2 0.6 2.3 - 4.2 3.4 -0.6 3.4Germany . . . . . . . . . . . . . 2.0 2.1 2.3 3.9 3.5 2.7 0.2 -1.8 2.4 3.6 0.5 3.3Italy. . . . . . . . . . . . . . . . . 5.7 5.2 -0.2 2.9 2.5 -2.3 0.9 -0.3 5.5 4.9 2.2 1.3United Kingdom. . . . . . . . . 2.2 3.0 2.7 3.3 0.2 -1.3 0.5 2.5 3.6 4.0 2.5 1.5
Seven Pacific region countries. 12.5 7.0 15.1 9.0 5.7 -3.0 -5.8 -5.3 2.1 7.4 6.7 3.5Australia . . . . . . . . . . . . . 5.3 7.5 5.6 3.3 -0.4 -3.6 4.7 5.5 7.3 3.4 1.7 2.5Taiwan. . . . . . . . . . . . . . . 4.0 5.8 13.0 11.1 6.0 0.8 7.4 4.8 7.1 7.3 3.9 7.9Thailand. . . . . . . . . . . . . . 2.0 5.1 16.8 11.5 12.7 4.5 5.5 7.3 10.2 9.8 5.6 0.3Japan . . . . . . . . . . . . . . . 15.0 7.4 16.5 9.2 6.1 -4.0 -8.8 -8.5 -0.4 7.4 7.9 3.6Korea, South . . . . . . . . . . -2.1 5.4 15.2 11.5 5.6 4.5 5.4 4.7 12.5 11.1 4.9 2.2Malaysia . . . . . . . . . . . . . 4.0 -1.5 5.6 2.6 1.4 2.3 -1.6 0.2 6.6 3.4 0.2 2.3New Zealand . . . . . . . . . . 2.2 5.9 -1.4 1.6 1.7 -2.3 3.4 3.9 3.1 1.7 1.4 1.9
COINCIDENT INDEX
Total, 13 countries . . . . . 0.3 3.4 5.8 4.4 3.4 0.3 0.9 0.1 2.8 3.0 2.4 2.812 countries, excluding
U.S. . . . . . . . . . . . . 1.9 3.1 6.3 5.4 5.2 2.5 0.5 -1.3 1.8 2.5 1.9 1.7G-7 countries . . . . . . . 0.1 3.3 5.6 4.2 3.2 0.1 0.6 -0.2 2.5 2.6 2.2 2.7
North America . . . . . . . . . . . -2.3 3.9 4.9 2.8 0.2 -3.7 1.2 2.8 4.7 3.7 3.0 4.4United States . . . . . . . . . . -2.7 3.7 4.8 2.8 0.2 -3.7 1.3 2.8 4.8 3.8 3.2 4.4Canada . . . . . . . . . . . . . . 2.2 5.8 6.0 2.8 0.1 -4.3 0.2 2.4 4.4 2.9 1.4 3.5
Four European countries . . . . 0.8 2.2 5.1 4.3 4.4 1.1 -0.5 -3.3 1.7 2.7 1.7 2.4France. . . . . . . . . . . . . . . -0.5 -0.4 5.5 6.4 4.5 -0.1 -1.1 -4.0 2.0 3.5 1.2 2.8Germany . . . . . . . . . . . . . 1.1 2.1 3.1 3.3 5.5 4.2 0.8 -2.4 0.9 1.6 0.5 0.4Italy. . . . . . . . . . . . . . . . . 6.1 3.9 6.4 3.4 5.9 3.2 - -7.3 - 2.5 2.1 2.3United Kingdom. . . . . . . . . -2.0 4.2 6.9 4.1 0.8 -4.9 -2.5 0.1 4.4 4.3 4.2 5.8
Seven Pacific region countries. 3.0 3.8 7.6 6.6 6.3 4.1 1.4 -0.1 1.6 2.0 2.0 1.6Australia . . . . . . . . . . . . . 4.3 7.0 7.4 8.9 0.3 -8.2 -1.8 1.8 9.4 8.8 3.0 2.9Taiwan. . . . . . . . . . . . . . . 8.5 5.1 9.5 8.7 4.1 7.2 7.5 6.5 7.1 4.7 2.9 7.3Thailand. . . . . . . . . . . . . . 3.0 1.9 15.4 13.3 13.0 3.9 6.3 8.3 7.8 7.7 5.9 -3.8Japan . . . . . . . . . . . . . . . 3.4 3.8 7.3 6.5 6.8 4.9 0.8 -1.0 - 0.6 1.4 0.4Korea, South . . . . . . . . . . -3.5 6.1 11.1 7.0 9.3 8.4 5.1 4.6 9.5 9.6 6.6 2.5Malaysia . . . . . . . . . . . . . -0.1 -5.8 3.4 3.9 2.4 5.4 1.2 2.4 3.0 2.5 0.4 -1.2New Zealand . . . . . . . . . . 1.5 1.4 -1.4 -0.9 0.7 -1.1 0.9 3.2 5.2 4.3 4.2 3.2
- Represents or rounds to zero.
Source: Center for International Business Cycle Research, Columbia Business School, New York, NY, International EconomicIndicators, monthly.
No. 1357. Selected International Economic Indicators, by Country: 1980 to 1996
[Data cover gross domestic product (GDP) at market prices. Gross fixed capital formation covers private and government sectorsexcept military. Savings data are calculated by deducting outlays—such as personal consumption expenditures, interest paid, andtransfer payments to foreigners—from disposable personal income]
YEAR UnitedStates France Ger-
many Italy Nether-lands
UnitedKingdom Japan Canada
Ratio of gross fixed capital formation toGDP (current prices):
1980 . . . . . . . . . . . . . . . . . . . . . . . 19.6 23.0 22.6 24.3 21.6 17.9 31.6 23.31985 . . . . . . . . . . . . . . . . . . . . . . . 18.8 19.3 19.5 20.7 19.7 17.0 27.5 19.71990 . . . . . . . . . . . . . . . . . . . . . . . 16.2 21.4 20.9 20.3 20.9 19.5 31.7 21.11994 . . . . . . . . . . . . . . . . . . . . . . . 16.2 18.5 22.0 16.6 18.7 14.9 28.6 18.51995 . . . . . . . . . . . . . . . . . . . . . . . 16.6 17.9 21.7 17.3 19.4 15.1 28.3 17.31996 . . . . . . . . . . . . . . . . . . . . . . . 17.0 17.5 21.0 17.0 19.9 15.0 29.6 17.5
Ratio of savings to disposable personalincome:
1980 . . . . . . . . . . . . . . . . . . . . . . . 8.5 17.6 14.2 21.6 11.0 13.4 17.9 13.31985 . . . . . . . . . . . . . . . . . . . . . . . 7.2 14.0 12.8 19.2 13.1 10.7 15.6 13.11990 . . . . . . . . . . . . . . . . . . . . . . . 5.3 12.5 14.7 18.5 15.5 8.1 12.1 9.51994 . . . . . . . . . . . . . . . . . . . . . . . 3.9 13.6 12.3 14.7 11.4 10.1 12.8 7.51995 . . . . . . . . . . . . . . . . . . . . . . . 4.9 14.3 12.3 14.4 12.8 11.0 13.0 6.91996 . . . . . . . . . . . . . . . . . . . . . . . 4.9 12.5 12.4 13.4 (NA) 11.6 13.2 4.6
NA Not available.
Source: U.S. Dept. of Commerce, International Trade Administration, Office of Trade and Economic Analysis, based on officialstatistics of listed countries.
Comparative International Statistics 837
U.S. Census Bureau, the Official StatisticsTM Statistical Abstract of the United States: 1998 Oct. 13, 1998
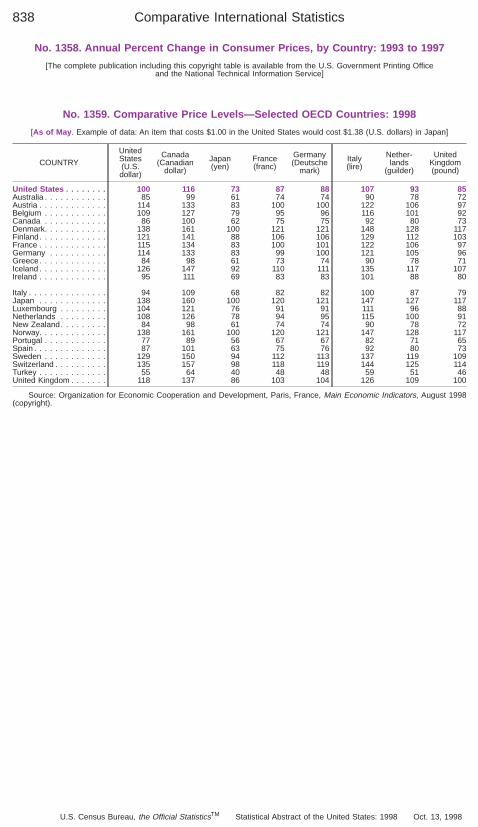
No. 1358. Annual Percent Change in Consumer Prices, by Country: 1993 to 1997
[The complete publication including this copyright table is available from the U.S. Government Printing Officeand the National Technical Information Service]
No. 1359. Comparative Price Levels—Selected OECD Countries: 1998
[As of May . Example of data: An item that costs $1.00 in the United States would cost $1.38 (U.S. dollars) in Japan]
COUNTRY
UnitedStates(U.S.dollar)
Canada(Canadian
dollar)
Japan(yen)
France(franc)
Germany(Deutsche
mark)
Italy(lire)
Nether-lands
(guilder)
UnitedKingdom(pound)
United States . . . . . . . . 100 116 73 87 88 107 93 85Australia . . . . . . . . . . . . 85 99 61 74 74 90 78 72Austria . . . . . . . . . . . . . 114 133 83 100 100 122 106 97Belgium . . . . . . . . . . . . 109 127 79 95 96 116 101 92Canada . . . . . . . . . . . . 86 100 62 75 75 92 80 73Denmark. . . . . . . . . . . . 138 161 100 121 121 148 128 117Finland. . . . . . . . . . . . . 121 141 88 106 106 129 112 103France . . . . . . . . . . . . . 115 134 83 100 101 122 106 97Germany . . . . . . . . . . . 114 133 83 99 100 121 105 96Greece. . . . . . . . . . . . . 84 98 61 73 74 90 78 71Iceland . . . . . . . . . . . . . 126 147 92 110 111 135 117 107Ireland . . . . . . . . . . . . . 95 111 69 83 83 101 88 80
Italy . . . . . . . . . . . . . . . 94 109 68 82 82 100 87 79Japan . . . . . . . . . . . . . 138 160 100 120 121 147 127 117Luxembourg . . . . . . . . . 104 121 76 91 91 111 96 88Netherlands . . . . . . . . . 108 126 78 94 95 115 100 91New Zealand. . . . . . . . . 84 98 61 74 74 90 78 72Norway. . . . . . . . . . . . . 138 161 100 120 121 147 128 117Portugal . . . . . . . . . . . . 77 89 56 67 67 82 71 65Spain . . . . . . . . . . . . . . 87 101 63 75 76 92 80 73Sweden . . . . . . . . . . . . 129 150 94 112 113 137 119 109Switzerland . . . . . . . . . . 135 157 98 118 119 144 125 114Turkey . . . . . . . . . . . . . 55 64 40 48 48 59 51 46United Kingdom . . . . . . . 118 137 86 103 104 126 109 100
Source: Organization for Economic Cooperation and Development, Paris, France, Main Economic Indicators, August 1998(copyright).
Comparative International Statistics838
U.S. Census Bureau, the Official StatisticsTM Statistical Abstract of the United States: 1998 Oct. 13, 1998
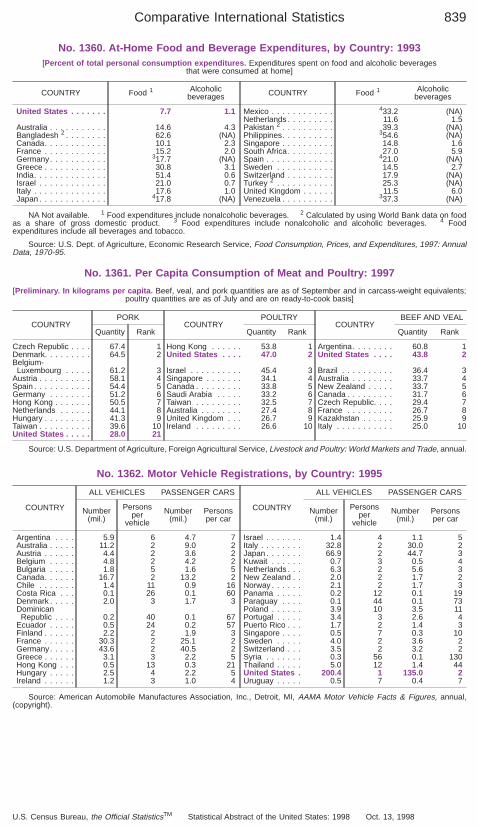
No. 1360. At-Home Food and Beverage Expenditures, by Country: 1993[Percent of total personal consumption expenditures. Expenditures spent on food and alcoholic beverages
that were consumed at home]
COUNTRY Food 1 Alcoholicbeverages
United States . . . . . . . 7.7 1.1
Australia . . . . . . . . . . . 14.6 4.3Bangladesh 2 . . . . . . . . 62.6 (NA)Canada. . . . . . . . . . . . 10.1 2.3France . . . . . . . . . . . . 15.2 2.0Germany. . . . . . . . . . . 317.7 (NA)Greece . . . . . . . . . . . . 30.8 3.1India. . . . . . . . . . . . . . 51.4 0.6Israel . . . . . . . . . . . . . 21.0 0.7Italy . . . . . . . . . . . . . . 17.6 1.0Japan . . . . . . . . . . . . . 417.8 (NA)
COUNTRY Food 1 Alcoholicbeverages
Mexico . . . . . . . . . . . . 433.2 (NA)Netherlands . . . . . . . . . 11.6 1.5Pakistan 2 . . . . . . . . . . 39.3 (NA)Philippines. . . . . . . . . . 354.6 (NA)Singapore . . . . . . . . . . 14.8 1.6South Africa. . . . . . . . . 27.0 5.9Spain . . . . . . . . . . . . . 421.0 (NA)Sweden . . . . . . . . . . . 14.5 2.7Switzerland . . . . . . . . . 17.9 (NA)Turkey 2 . . . . . . . . . . . 25.3 (NA)United Kingdom . . . . . . 11.5 6.0Venezuela . . . . . . . . . . 337.3 (NA)
NA Not available. 1 Food expenditures include nonalcoholic beverages. 2 Calculated by using World Bank data on foodas a share of gross domestic product. 3 Food expenditures include nonalcoholic and alcoholic beverages. 4 Foodexpenditures include all beverages and tobacco.
Source: U.S. Dept. of Agriculture, Economic Research Service, Food Consumption, Prices, and Expenditures, 1997: AnnualData, 1970-95.
No. 1361. Per Capita Consumption of Meat and Poultry: 1997
[Preliminary. In kilograms per capita. Beef, veal, and pork quantities are as of September and in carcass-weight equivalents;poultry quantities are as of July and are on ready-to-cook basis]
COUNTRYPORK
COUNTRYPOULTRY
COUNTRYBEEF AND VEAL
Quantity Rank Quantity Rank Quantity Rank
Czech Republic . . . . 67.4 1 Hong Kong . . . . . . 53.8 1 Argentina. . . . . . . . 60.8 1Denmark. . . . . . . . . 64.5 2 United States . . . . 47.0 2 United States . . . . 43.8 2Belgium-
Luxembourg . . . . . 61.2 3 Israel . . . . . . . . . . 45.4 3 Brazil . . . . . . . . . . 36.4 3Austria . . . . . . . . . . 58.1 4 Singapore . . . . . . . 34.1 4 Australia . . . . . . . . 33.7 4Spain . . . . . . . . . . . 54.4 5 Canada . . . . . . . . . 33.8 5 New Zealand . . . . . 33.7 5Germany . . . . . . . . 51.2 6 Saudi Arabia . . . . . 33.2 6 Canada . . . . . . . . . 31.7 6Hong Kong . . . . . . . 50.5 7 Taiwan . . . . . . . . . 32.5 7 Czech Republic. . . . 29.4 7Netherlands . . . . . . 44.1 8 Australia . . . . . . . . 27.4 8 France . . . . . . . . . 26.7 8Hungary . . . . . . . . . 41.3 9 United Kingdom . . . 26.7 9 Kazakhstan . . . . . . 25.9 9Taiwan . . . . . . . . . . 39.6 10 Ireland . . . . . . . . . 26.6 10 Italy . . . . . . . . . . . 25.0 10United States . . . . . 28.0 21
Source: U.S. Department of Agriculture, Foreign Agricultural Service, Livestock and Poultry: World Markets and Trade, annual.
No. 1362. Motor Vehicle Registrations, by Country: 1995
COUNTRY
ALL VEHICLES PASSENGER CARS
Number(mil.)
Personsper
vehicle
Number(mil.)
Personsper car
Argentina . . . . 5.9 6 4.7 7Australia . . . . . 11.2 2 9.0 2Austria . . . . . . 4.4 2 3.6 2Belgium . . . . . 4.8 2 4.2 2Bulgaria . . . . . 1.8 5 1.6 5Canada. . . . . . 16.7 2 13.2 2Chile . . . . . . . 1.4 11 0.9 16Costa Rica . . . 0.1 26 0.1 60Denmark . . . . . 2.0 3 1.7 3Dominican
Republic . . . . 0.2 40 0.1 67Ecuador . . . . . 0.5 24 0.2 57Finland . . . . . . 2.2 2 1.9 3France . . . . . . 30.3 2 25.1 2Germany. . . . . 43.6 2 40.5 2Greece . . . . . . 3.1 3 2.2 5Hong Kong . . . 0.5 13 0.3 21Hungary . . . . . 2.5 4 2.2 5Ireland . . . . . . 1.2 3 1.0 4
COUNTRY
ALL VEHICLES PASSENGER CARS
Number(mil.)
Personsper
vehicle
Number(mil.)
Personsper car
Israel . . . . . . . 1.4 4 1.1 5Italy . . . . . . . . 32.8 2 30.0 2Japan . . . . . . . 66.9 2 44.7 3Kuwait . . . . . . 0.7 3 0.5 4Netherlands . . . 6.3 2 5.6 3New Zealand . . 2.0 2 1.7 2Norway . . . . . . 2.1 2 1.7 3Panama . . . . . 0.2 12 0.1 19Paraguay . . . . 0.1 44 0.1 73Poland . . . . . . 3.9 10 3.5 11Portugal . . . . . 3.4 3 2.6 4Puerto Rico . . . 1.7 2 1.4 3Singapore . . . . 0.5 7 0.3 10Sweden . . . . . 4.0 2 3.6 2Switzerland . . . 3.5 2 3.2 2Syria . . . . . . . 0.3 56 0.1 130Thailand . . . . . 5.0 12 1.4 44United States . 200.4 1 135.0 2Uruguay . . . . . 0.5 7 0.4 7
Source: American Automobile Manufactures Association, Inc., Detroit, MI, AAMA Motor Vehicle Facts & Figures, annual,(copyright).
Comparative International Statistics 839
U.S. Census Bureau, the Official StatisticsTM Statistical Abstract of the United States: 1998 Oct. 13, 1998
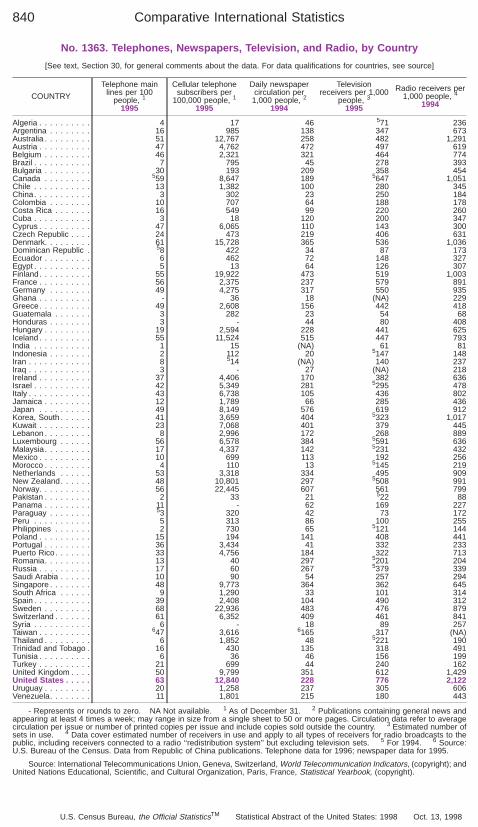
No. 1363. Telephones, Newspapers, Television, and Radio, by Country
[See text, Section 30, for general comments about the data. For data qualifications for countries, see source]
COUNTRY
Telephone mainlines per 100
people, 1
1995
Cellular telephonesubscribers per
100,000 people, 1
1995
Daily newspapercirculation per
1,000 people, 2
1994
Televisionreceivers per 1,000
people, 3
1995
Radio receivers per1,000 people, 4
1994
Algeria . . . . . . . . . . 4 17 46 571 236Argentina . . . . . . . . 16 985 138 347 673Australia . . . . . . . . . 51 12,767 258 482 1,291Austria . . . . . . . . . . 47 4,762 472 497 619Belgium . . . . . . . . . 46 2,321 321 464 774Brazil . . . . . . . . . . . 7 795 45 278 393Bulgaria . . . . . . . . . 30 193 209 358 454Canada . . . . . . . . . 559 8,647 189 5647 1,051Chile . . . . . . . . . . . 13 1,382 100 280 345China. . . . . . . . . . . 3 302 23 250 184Colombia . . . . . . . . 10 707 64 188 178Costa Rica . . . . . . . 16 549 99 220 260Cuba . . . . . . . . . . . 3 18 120 200 347Cyprus . . . . . . . . . . 47 6,065 110 143 300Czech Republic . . . . 24 473 219 406 631Denmark. . . . . . . . . 61 15,728 365 536 1,036Dominican Republic . 58 422 34 87 173Ecuador . . . . . . . . . 6 462 72 148 327Egypt . . . . . . . . . . . 5 13 64 126 307Finland. . . . . . . . . . 55 19,922 473 519 1,003France . . . . . . . . . . 56 2,375 237 579 891Germany . . . . . . . . 49 4,275 317 550 935Ghana . . . . . . . . . . - 36 18 (NA) 229Greece. . . . . . . . . . 49 2,608 156 442 418Guatemala . . . . . . . 3 282 23 54 68Honduras . . . . . . . . 3 - 44 80 408Hungary . . . . . . . . . 19 2,594 228 441 625Iceland . . . . . . . . . . 55 11,524 515 447 793India . . . . . . . . . . . 1 15 (NA) 61 81Indonesia . . . . . . . . 2 112 20 5147 148Iran . . . . . . . . . . . . 8 514 (NA) 140 237Iraq . . . . . . . . . . . . 3 - 27 (NA) 218Ireland . . . . . . . . . . 37 4,406 170 382 636Israel . . . . . . . . . . . 42 5,349 281 5295 478Italy . . . . . . . . . . . . 43 6,738 105 436 802Jamaica . . . . . . . . . 12 1,789 66 285 436Japan . . . . . . . . . . 49 8,149 576 619 912Korea, South . . . . . . 41 3,659 404 5323 1,017Kuwait . . . . . . . . . . 23 7,068 401 379 445Lebanon . . . . . . . . . 8 2,996 172 268 889Luxembourg . . . . . . 56 6,578 384 5591 636Malaysia . . . . . . . . . 17 4,337 142 5231 432Mexico . . . . . . . . . . 10 699 113 192 256Morocco . . . . . . . . . 4 110 13 5145 219Netherlands . . . . . . 53 3,318 334 495 909New Zealand. . . . . . 48 10,801 297 5508 991Norway. . . . . . . . . . 56 22,445 607 561 799Pakistan . . . . . . . . . 2 33 21 522 88Panama . . . . . . . . . 11 - 62 169 227Paraguay . . . . . . . . 53 320 42 73 172Peru . . . . . . . . . . . 5 313 86 100 255Philippines . . . . . . . 2 730 65 5121 144Poland . . . . . . . . . . 15 194 141 408 441Portugal . . . . . . . . . 36 3,434 41 332 233Puerto Rico. . . . . . . 33 4,756 184 322 713Romania. . . . . . . . . 13 40 297 5201 204Russia . . . . . . . . . . 17 60 267 5379 339Saudi Arabia . . . . . . 10 90 54 257 294Singapore . . . . . . . . 48 9,773 364 362 645South Africa . . . . . . 9 1,290 33 101 314Spain . . . . . . . . . . . 39 2,408 104 490 312Sweden . . . . . . . . . 68 22,936 483 476 879Switzerland . . . . . . . 61 6,352 409 461 841Syria . . . . . . . . . . . 6 - 18 89 257Taiwan . . . . . . . . . . 647 3,616 6165 317 (NA)Thailand . . . . . . . . . 6 1,852 48 5221 190Trinidad and Tobago . 16 430 135 318 491Tunisia . . . . . . . . . . 6 36 46 156 199Turkey . . . . . . . . . . 21 699 44 240 162United Kingdom . . . . 50 9,799 351 612 1,429United States . . . . . 63 12,840 228 776 2,122Uruguay . . . . . . . . . 20 1,258 237 305 606Venezuela. . . . . . . . 11 1,801 215 180 443
- Represents or rounds to zero. NA Not available. 1 As of December 31. 2 Publications containing general news andappearing at least 4 times a week; may range in size from a single sheet to 50 or more pages. Circulation data refer to averagecirculation per issue or number of printed copies per issue and include copies sold outside the country. 3 Estimated number ofsets in use. 4 Data cover estimated number of receivers in use and apply to all types of receivers for radio broadcasts to thepublic, including receivers connected to a radio ‘‘redistribution system’’ but excluding television sets. 5 For 1994. 6 Source:U.S. Bureau of the Census. Data from Republic of China publications. Telephone data for 1996; newspaper data for 1995.
Source: International Telecommunications Union, Geneva, Switzerland, World Telecommunication Indicators, (copyright); andUnited Nations Educational, Scientific, and Cultural Organization, Paris, France, Statistical Yearbook, (copyright).
Comparative International Statistics840
U.S. Census Bureau, the Official StatisticsTM Statistical Abstract of the United States: 1998 Oct. 13, 1998
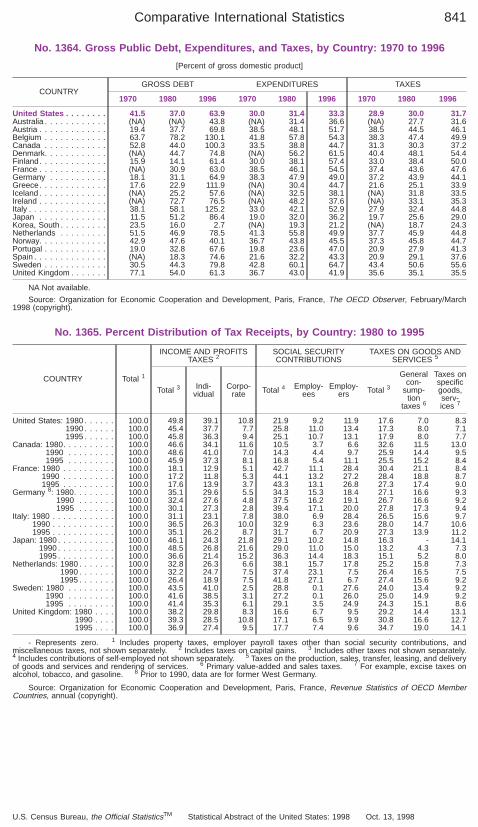
No. 1364. Gross Public Debt, Expenditures, and Taxes, by Country: 1970 to 1996
[Percent of gross domestic product]
COUNTRYGROSS DEBT EXPENDITURES TAXES
1970 1980 1996 1970 1980 1996 1970 1980 1996
United States . . . . . . . . 41.5 37.0 63.9 30.0 31.4 33.3 28.9 30.0 31.7Australia . . . . . . . . . . . . (NA) (NA) 43.8 (NA) 31.4 36.6 (NA) 27.7 31.6Austria . . . . . . . . . . . . . 19.4 37.7 69.8 38.5 48.1 51.7 38.5 44.5 46.1Belgium . . . . . . . . . . . . 63.7 78.2 130.1 41.8 57.8 54.3 38.3 47.4 49.9Canada . . . . . . . . . . . . 52.8 44.0 100.3 33.5 38.8 44.7 31.3 30.3 37.2Denmark. . . . . . . . . . . . (NA) 44.7 74.8 (NA) 56.2 61.5 40.4 48.1 54.4Finland. . . . . . . . . . . . . 15.9 14.1 61.4 30.0 38.1 57.4 33.0 38.4 50.0France . . . . . . . . . . . . . (NA) 30.9 63.0 38.5 46.1 54.5 37.4 43.6 47.6Germany . . . . . . . . . . . 18.1 31.1 64.9 38.3 47.9 49.0 37.2 43.9 44.1Greece. . . . . . . . . . . . . 17.6 22.9 111.9 (NA) 30.4 44.7 21.6 25.1 33.9Iceland . . . . . . . . . . . . . (NA) 25.2 57.6 (NA) 32.5 38.1 (NA) 31.8 33.5Ireland . . . . . . . . . . . . . (NA) 72.7 76.5 (NA) 48.2 37.6 (NA) 33.1 35.3Italy . . . . . . . . . . . . . . . 38.1 58.1 125.2 33.0 42.1 52.9 27.9 32.4 44.8Japan . . . . . . . . . . . . . 11.5 51.2 86.4 19.0 32.0 36.2 19.7 25.6 29.0Korea, South . . . . . . . . . 23.5 16.0 2.7 (NA) 19.3 21.2 (NA) 18.7 24.3Netherlands . . . . . . . . . 51.5 46.9 78.5 41.3 55.8 49.9 37.7 45.9 44.8Norway. . . . . . . . . . . . . 42.9 47.6 40.1 36.7 43.8 45.5 37.3 45.8 44.7Portugal . . . . . . . . . . . . 19.0 32.8 67.6 19.8 23.6 47.0 20.9 27.9 41.3Spain . . . . . . . . . . . . . . (NA) 18.3 74.6 21.6 32.2 43.3 20.9 29.1 37.6Sweden . . . . . . . . . . . . 30.5 44.3 79.8 42.8 60.1 64.7 43.4 50.6 55.6United Kingdom . . . . . . . 77.1 54.0 61.3 36.7 43.0 41.9 35.6 35.1 35.5
NA Not available.
Source: Organization for Economic Cooperation and Development, Paris, France, The OECD Observer, February/March1998 (copyright).
No. 1365. Percent Distribution of Tax Receipts, by Country: 1980 to 1995
COUNTRY Total 1
INCOME AND PROFITSTAXES 2
SOCIAL SECURITYCONTRIBUTIONS
TAXES ON GOODS ANDSERVICES 5
Total 3 Indi-vidual
Corpo-rate Total 4 Employ-
eesEmploy-
ers Total 3
Generalcon-
sump-tion
taxes 6
Taxes onspecificgoods,serv-ices 7
United States: 1980 . . . . . . 100.0 49.8 39.1 10.8 21.9 9.2 11.9 17.6 7.0 8.31990 . . . . . . 100.0 45.4 37.7 7.7 25.8 11.0 13.4 17.3 8.0 7.11995 . . . . . . 100.0 45.8 36.3 9.4 25.1 10.7 13.1 17.9 8.0 7.7
Canada: 1980. . . . . . . . . . 100.0 46.6 34.1 11.6 10.5 3.7 6.6 32.6 11.5 13.01990 . . . . . . . . . 100.0 48.6 41.0 7.0 14.3 4.4 9.7 25.9 14.4 9.51995 . . . . . . . . . 100.0 45.9 37.3 8.1 16.8 5.4 11.1 25.5 15.2 8.4
France: 1980 . . . . . . . . . . 100.0 18.1 12.9 5.1 42.7 11.1 28.4 30.4 21.1 8.41990 . . . . . . . . . . 100.0 17.2 11.8 5.3 44.1 13.2 27.2 28.4 18.8 8.71995 . . . . . . . . . . 100.0 17.6 13.9 3.7 43.3 13.1 26.8 27.3 17.4 9.0
Germany 8: 1980. . . . . . . . 100.0 35.1 29.6 5.5 34.3 15.3 18.4 27.1 16.6 9.31990 . . . . . . . 100.0 32.4 27.6 4.8 37.5 16.2 19.1 26.7 16.6 9.21995 . . . . . . . 100.0 30.1 27.3 2.8 39.4 17.1 20.0 27.8 17.3 9.4
Italy: 1980 . . . . . . . . . . . . 100.0 31.1 23.1 7.8 38.0 6.9 28.4 26.5 15.6 9.71990 . . . . . . . . . . . . 100.0 36.5 26.3 10.0 32.9 6.3 23.6 28.0 14.7 10.61995 . . . . . . . . . . . . 100.0 35.1 26.2 8.7 31.7 6.7 20.9 27.3 13.9 11.2
Japan: 1980 . . . . . . . . . . . 100.0 46.1 24.3 21.8 29.1 10.2 14.8 16.3 - 14.11990 . . . . . . . . . . . 100.0 48.5 26.8 21.6 29.0 11.0 15.0 13.2 4.3 7.31995 . . . . . . . . . . . 100.0 36.6 21.4 15.2 36.3 14.4 18.3 15.1 5.2 8.0
Netherlands: 1980 . . . . . . . 100.0 32.8 26.3 6.6 38.1 15.7 17.8 25.2 15.8 7.31990 . . . . . . . 100.0 32.2 24.7 7.5 37.4 23.1 7.5 26.4 16.5 7.51995 . . . . . . . 100.0 26.4 18.9 7.5 41.8 27.1 6.7 27.4 15.6 9.2
Sweden: 1980 . . . . . . . . . 100.0 43.5 41.0 2.5 28.8 0.1 27.6 24.0 13.4 9.21990 . . . . . . . . . 100.0 41.6 38.5 3.1 27.2 0.1 26.0 25.0 14.9 9.21995 . . . . . . . . . 100.0 41.4 35.3 6.1 29.1 3.5 24.9 24.3 15.1 8.6
United Kingdom: 1980 . . . . 100.0 38.2 29.8 8.3 16.6 6.7 9.5 29.2 14.4 13.11990 . . . . 100.0 39.3 28.5 10.8 17.1 6.5 9.9 30.8 16.6 12.71995 . . . . 100.0 36.9 27.4 9.5 17.7 7.4 9.6 34.7 19.0 14.1
- Represents zero. 1 Includes property taxes, employer payroll taxes other than social security contributions, andmiscellaneous taxes, not shown separately. 2 Includes taxes on capital gains. 3 Includes other taxes not shown separately.4 Includes contributions of self-employed not shown separately. 5 Taxes on the production, sales, transfer, leasing, and deliveryof goods and services and rendering of services. 6 Primary value-added and sales taxes. 7 For example, excise taxes onalcohol, tobacco, and gasoline. 8 Prior to 1990, data are for former West Germany.
Source: Organization for Economic Cooperation and Development, Paris, France, Revenue Statistics of OECD MemberCountries, annual (copyright).
Comparative International Statistics 841
U.S. Census Bureau, the Official StatisticsTM Statistical Abstract of the United States: 1998 Oct. 13, 1998
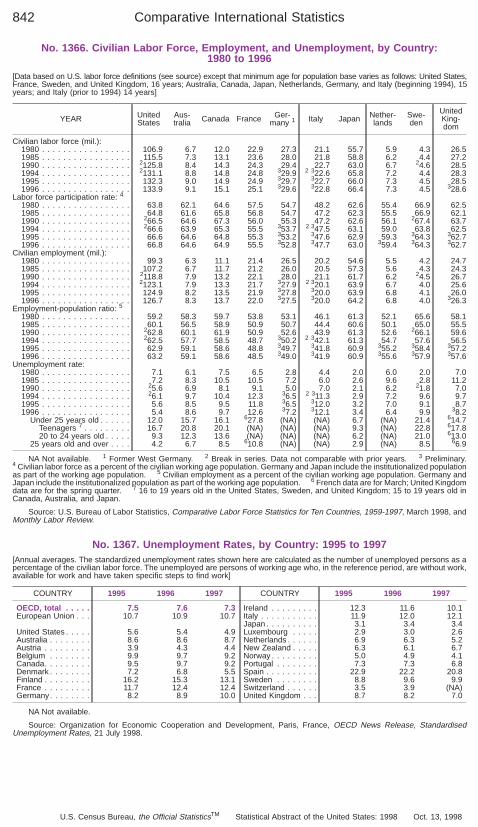
No. 1366. Civilian Labor Force, Employment, and Unemployment, by Country:1980 to 1996
[Data based on U.S. labor force definitions (see source) except that minimum age for population base varies as follows: United States,France, Sweden, and United Kingdom, 16 years; Australia, Canada, Japan, Netherlands, Germany, and Italy (beginning 1994), 15years; and Italy (prior to 1994) 14 years]
YEAR UnitedStates
Aus-tralia Canada France Ger-
many 1 Italy Japan Nether-lands
Swe-den
UnitedKing-dom
Civilian labor force (mil.):1980 . . . . . . . . . . . . . . . . . 106.9 6.7 12.0 22.9 27.3 21.1 55.7 5.9 4.3 26.51985 . . . . . . . . . . . . . . . . . 115.5 7.3 13.1 23.6 28.0 21.8 58.8 6.2 4.4 27.21990 . . . . . . . . . . . . . . . . . 2125.8 8.4 14.3 24.3 29.4 22.7 63.0 6.7 24.6 28.51994 . . . . . . . . . . . . . . . . . 2131.1 8.8 14.8 24.8 329.9 2 322.6 65.8 7.2 4.4 28.31995 . . . . . . . . . . . . . . . . . 132.3 9.0 14.9 24.9 329.7 322.7 66.0 7.3 4.5 28.51996 . . . . . . . . . . . . . . . . . 133.9 9.1 15.1 25.1 329.6 322.8 66.4 7.3 4.5 328.6
Labor force participation rate: 4
1980 . . . . . . . . . . . . . . . . . 63.8 62.1 64.6 57.5 54.7 48.2 62.6 55.4 66.9 62.51985 . . . . . . . . . . . . . . . . . 64.8 61.6 65.8 56.8 54.7 47.2 62.3 55.5 66.9 62.11990 . . . . . . . . . . . . . . . . . 266.5 64.6 67.3 56.0 55.3 47.2 62.6 56.1 267.4 63.71994 . . . . . . . . . . . . . . . . . 266.6 63.9 65.3 55.5 353.7 2 347.5 63.1 59.0 63.8 62.51995 . . . . . . . . . . . . . . . . . 66.6 64.6 64.8 55.3 353.2 347.6 62.9 59.3 364.3 362.71996 . . . . . . . . . . . . . . . . . 66.8 64.6 64.9 55.5 352.8 347.7 63.0 359.4 364.3 362.7
Civilian employment (mil.):1980 . . . . . . . . . . . . . . . . . 99.3 6.3 11.1 21.4 26.5 20.2 54.6 5.5 4.2 24.71985 . . . . . . . . . . . . . . . . . 107.2 6.7 11.7 21.2 26.0 20.5 57.3 5.6 4.3 24.31990 . . . . . . . . . . . . . . . . . 2118.8 7.9 13.2 22.1 28.0 21.1 61.7 6.2 24.5 26.71994 . . . . . . . . . . . . . . . . . 2123.1 7.9 13.3 21.7 327.9 2 320.1 63.9 6.7 4.0 25.61995 . . . . . . . . . . . . . . . . . 124.9 8.2 13.5 21.9 327.8 320.0 63.9 6.8 4.1 26.01996 . . . . . . . . . . . . . . . . . 126.7 8.3 13.7 22.0 327.5 320.0 64.2 6.8 4.0 326.3
Employment-population ratio: 5
1980 . . . . . . . . . . . . . . . . . 59.2 58.3 59.7 53.8 53.1 46.1 61.3 52.1 65.6 58.11985 . . . . . . . . . . . . . . . . . 60.1 56.5 58.9 50.9 50.7 44.4 60.6 50.1 65.0 55.51990 . . . . . . . . . . . . . . . . . 262.8 60.1 61.9 50.9 52.6 43.9 61.3 52.6 266.1 59.61994 . . . . . . . . . . . . . . . . . 262.5 57.7 58.5 48.7 350.2 2 342.1 61.3 54.7 57.6 56.51995 . . . . . . . . . . . . . . . . . 62.9 59.1 58.6 48.8 349.7 341.8 60.9 355.2 358.4 357.21996 . . . . . . . . . . . . . . . . . 63.2 59.1 58.6 48.5 349.0 341.9 60.9 355.6 357.9 357.6
Unemployment rate:1980 . . . . . . . . . . . . . . . . . 7.1 6.1 7.5 6.5 2.8 4.4 2.0 6.0 2.0 7.01985 . . . . . . . . . . . . . . . . . 7.2 8.3 10.5 10.5 7.2 6.0 2.6 9.6 2.8 11.21990 . . . . . . . . . . . . . . . . . 25.6 6.9 8.1 9.1 5.0 7.0 2.1 6.2 21.8 7.01994 . . . . . . . . . . . . . . . . . 26.1 9.7 10.4 12.3 36.5 2 311.3 2.9 7.2 9.6 9.71995 . . . . . . . . . . . . . . . . . 5.6 8.5 9.5 11.8 36.5 312.0 3.2 7.0 9.1 8.71996 . . . . . . . . . . . . . . . . . 5.4 8.6 9.7 12.6 37.2 312.1 3.4 6.4 9.9 38.2
Under 25 years old . . . . . . 12.0 15.7 16.1 627.8 (NA) (NA) 6.7 (NA) 21.4 614.7Teenagers 7 . . . . . . . . . 16.7 20.8 20.1 (NA) (NA) (NA) 9.3 (NA) 22.8 617.820 to 24 years old . . . . . 9.3 12.3 13.6 (NA) (NA) (NA) 6.2 (NA) 21.0 613.0
25 years old and over . . . . 4.2 6.7 8.5 610.8 (NA) (NA) 2.9 (NA) 8.5 66.9
NA Not available. 1 Former West Germany. 2 Break in series. Data not comparable with prior years. 3 Preliminary.4 Civilian labor force as a percent of the civilian working age population. Germany and Japan include the institutionalized populationas part of the working age population. 5 Civilian employment as a percent of the civilian working age population. Germany andJapan include the institutionalized population as part of the working age population. 6 French data are for March; United Kingdomdata are for the spring quarter. 7 16 to 19 years old in the United States, Sweden, and United Kingdom; 15 to 19 years old inCanada, Australia, and Japan.
Source: U.S. Bureau of Labor Statistics, Comparative Labor Force Statistics for Ten Countries, 1959-1997, March 1998, andMonthly Labor Review.
No. 1367. Unemployment Rates, by Country: 1995 to 1997[Annual averages. The standardized unemployment rates shown here are calculated as the number of unemployed persons as apercentage of the civilian labor force. The unemployed are persons of working age who, in the reference period, are without work,available for work and have taken specific steps to find work]
COUNTRY 1995 1996 1997
OECD, total . . . . . 7.5 7.6 7.3European Union . . . 10.7 10.9 10.7
United States . . . . . 5.6 5.4 4.9Australia . . . . . . . . 8.6 8.6 8.7Austria . . . . . . . . . 3.9 4.3 4.4Belgium . . . . . . . . 9.9 9.7 9.2Canada. . . . . . . . . 9.5 9.7 9.2Denmark . . . . . . . . 7.2 6.8 5.5Finland . . . . . . . . . 16.2 15.3 13.1France . . . . . . . . . 11.7 12.4 12.4Germany. . . . . . . . 8.2 8.9 10.0
COUNTRY 1995 1996 1997
Ireland . . . . . . . . . 12.3 11.6 10.1Italy . . . . . . . . . . . 11.9 12.0 12.1Japan . . . . . . . . . . 3.1 3.4 3.4Luxembourg . . . . . 2.9 3.0 2.6Netherlands . . . . . . 6.9 6.3 5.2New Zealand . . . . . 6.3 6.1 6.7Norway . . . . . . . . . 5.0 4.9 4.1Portugal . . . . . . . . 7.3 7.3 6.8Spain . . . . . . . . . . 22.9 22.2 20.8Sweden . . . . . . . . 8.8 9.6 9.9Switzerland . . . . . . 3.5 3.9 (NA)United Kingdom . . . 8.7 8.2 7.0
NA Not available.
Source: Organization for Economic Cooperation and Development, Paris, France, OECD News Release, StandardisedUnemployment Rates, 21 July 1998.
Comparative International Statistics842
U.S. Census Bureau, the Official StatisticsTM Statistical Abstract of the United States: 1998 Oct. 13, 1998
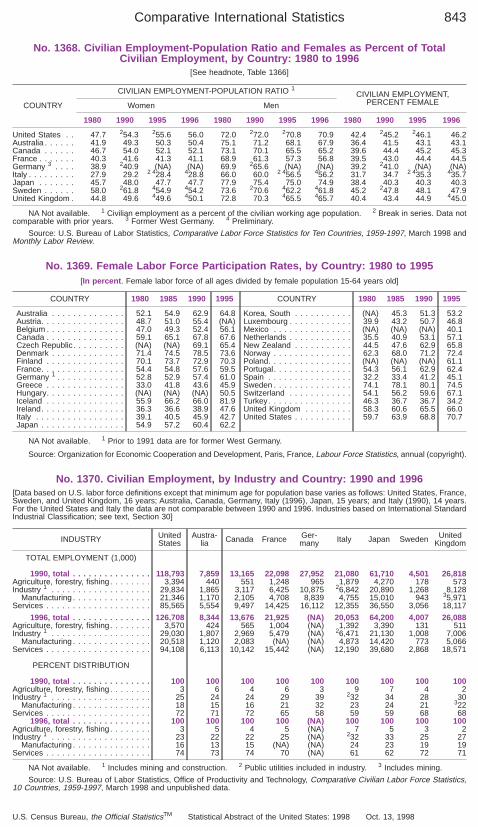
No. 1368. Civilian Employment-Population Ratio and Females as Percent of TotalCivilian Employment, by Country: 1980 to 1996
[See headnote, Table 1366]
COUNTRY
CIVILIAN EMPLOYMENT-POPULATION RATIO 1CIVILIAN EMPLOYMENT,
PERCENT FEMALEWomen Men
1980 1990 1995 1996 1980 1990 1995 1996 1980 1990 1995 1996
United States . . 47.7 254.3 255.6 56.0 72.0 272.0 270.8 70.9 42.4 245.2 246.1 46.2Australia . . . . . . 41.9 49.3 50.3 50.4 75.1 71.2 68.1 67.9 36.4 41.5 43.1 43.1Canada . . . . . . 46.7 54.0 52.1 52.1 73.1 70.1 65.5 65.2 39.6 44.4 45.2 45.3France . . . . . . . 40.3 41.6 41.3 41.1 68.9 61.3 57.3 56.8 39.5 43.0 44.4 44.5Germany 3 . . . . 38.9 240.9 (NA) (NA) 69.9 265.6 (NA) (NA) 39.2 241.0 (NA) (NA)Italy . . . . . . . . . 27.9 29.2 2 428.4 428.8 66.0 60.0 2 456.5 456.2 31.7 34.7 2 435.3 435.7Japan . . . . . . . 45.7 48.0 47.7 47.7 77.9 75.4 75.0 74.9 38.4 40.3 40.3 40.3Sweden . . . . . . 58.0 261.8 454.9 454.2 73.6 270.6 462.2 461.8 45.2 247.8 48.1 47.9United Kingdom . 44.8 49.6 449.6 450.1 72.8 70.3 465.5 465.7 40.4 43.4 44.9 445.0
NA Not available. 1 Civilian employment as a percent of the civilian working age population. 2 Break in series. Data notcomparable with prior years. 3 Former West Germany. 4 Preliminary.
Source: U.S. Bureau of Labor Statistics, Comparative Labor Force Statistics for Ten Countries, 1959-1997, March 1998 andMonthly Labor Review.
No. 1369. Female Labor Force Participation Rates, by Country: 1980 to 1995[In percent . Female labor force of all ages divided by female population 15-64 years old]
COUNTRY 1980 1985 1990 1995
Australia . . . . . . . . . . . . . . 52.1 54.9 62.9 64.8Austria. . . . . . . . . . . . . . . . 48.7 51.0 55.4 (NA)Belgium . . . . . . . . . . . . . . . 47.0 49.3 52.4 56.1Canada . . . . . . . . . . . . . . . 59.1 65.1 67.8 67.6Czech Republic. . . . . . . . . . (NA) (NA) 69.1 65.4Denmark . . . . . . . . . . . . . . 71.4 74.5 78.5 73.6Finland . . . . . . . . . . . . . . . 70.1 73.7 72.9 70.3France. . . . . . . . . . . . . . . . 54.4 54.8 57.6 59.5Germany 1 . . . . . . . . . . . . . 52.8 52.9 57.4 61.0Greece . . . . . . . . . . . . . . . 33.0 41.8 43.6 45.9Hungary. . . . . . . . . . . . . . . (NA) (NA) (NA) 50.5Iceland . . . . . . . . . . . . . . . 55.9 66.2 66.0 81.9Ireland. . . . . . . . . . . . . . . . 36.3 36.6 38.9 47.6Italy . . . . . . . . . . . . . . . . . 39.1 40.5 45.9 42.7Japan . . . . . . . . . . . . . . . . 54.9 57.2 60.4 62.2
COUNTRY 1980 1985 1990 1995
Korea, South . . . . . . . . . . . (NA) 45.3 51.3 53.2Luxembourg . . . . . . . . . . . . 39.9 43.2 50.7 46.8Mexico . . . . . . . . . . . . . . . (NA) (NA) (NA) 40.1Netherlands . . . . . . . . . . . . 35.5 40.9 53.1 57.1New Zealand . . . . . . . . . . . 44.5 47.6 62.9 65.8Norway . . . . . . . . . . . . . . . 62.3 68.0 71.2 72.4Poland. . . . . . . . . . . . . . . . (NA) (NA) (NA) 61.1Portugal. . . . . . . . . . . . . . . 54.3 56.1 62.9 62.4Spain . . . . . . . . . . . . . . . . 32.2 33.4 41.2 45.1Sweden . . . . . . . . . . . . . . . 74.1 78.1 80.1 74.5Switzerland . . . . . . . . . . . . 54.1 56.2 59.6 67.1Turkey . . . . . . . . . . . . . . . . 46.3 36.7 36.7 34.2United Kingdom . . . . . . . . . 58.3 60.6 65.5 66.0United States . . . . . . . . . . . 59.7 63.9 68.8 70.7
NA Not available. 1 Prior to 1991 data are for former West Germany.
Source: Organization for Economic Cooperation and Development, Paris, France, Labour Force Statistics, annual (copyright).
No. 1370. Civilian Employment, by Industry and Country: 1990 and 1996[Data based on U.S. labor force definitions except that minimum age for population base varies as follows: United States, France,Sweden, and United Kingdom, 16 years; Australia, Canada, Germany, Italy (1996), Japan, 15 years; and Italy (1990), 14 years.For the United States and Italy the data are not comparable between 1990 and 1996. Industries based on International StandardIndustrial Classification; see text, Section 30]
INDUSTRY UnitedStates
Austra-lia Canada France Ger-
many Italy Japan Sweden UnitedKingdom
TOTAL EMPLOYMENT (1,000)
1990, total . . . . . . . . . . . . . . . 118,793 7,859 13,165 22,098 27,952 21,080 61,710 4,501 26,818Agriculture, forestry, fishing. . . . . . . . 3,394 440 551 1,248 965 1,879 4,270 178 573Industry 1 . . . . . . . . . . . . . . . . . . . 29,834 1,865 3,117 6,425 10,875 26,842 20,890 1,268 8,128
Manufacturing . . . . . . . . . . . . . . . 21,346 1,170 2,105 4,708 8,839 4,755 15,010 943 35,971Services . . . . . . . . . . . . . . . . . . . . 85,565 5,554 9,497 14,425 16,112 12,355 36,550 3,056 18,117
1996, total . . . . . . . . . . . . . . . 126,708 8,344 13,676 21,925 (NA) 20,053 64,200 4,007 26,088Agriculture, forestry, fishing. . . . . . . . 3,570 424 565 1,004 (NA) 1,392 3,390 131 511Industry 1 . . . . . . . . . . . . . . . . . . . 29,030 1,807 2,969 5,479 (NA) 26,471 21,130 1,008 7,006
Manufacturing . . . . . . . . . . . . . . . 20,518 1,120 2,083 (NA) (NA) 4,873 14,420 773 5,066Services . . . . . . . . . . . . . . . . . . . . 94,108 6,113 10,142 15,442 (NA) 12,190 39,680 2,868 18,571
PERCENT DISTRIBUTION
1990, total . . . . . . . . . . . . . . . 100 100 100 100 100 100 100 100 100Agriculture, forestry, fishing. . . . . . . . 3 6 4 6 3 9 7 4 2Industry 1 . . . . . . . . . . . . . . . . . . . 25 24 24 29 39 232 34 28 30
Manufacturing . . . . . . . . . . . . . . . 18 15 16 21 32 23 24 21 322Services . . . . . . . . . . . . . . . . . . . . 72 71 72 65 58 59 59 68 68
1996, total . . . . . . . . . . . . . . . 100 100 100 100 (NA) 100 100 100 100Agriculture, forestry, fishing. . . . . . . . 3 5 4 5 (NA) 7 5 3 2Industry 1 . . . . . . . . . . . . . . . . . . . 23 22 22 25 (NA) 232 33 25 27
Manufacturing . . . . . . . . . . . . . . . 16 13 15 (NA) (NA) 24 23 19 19Services . . . . . . . . . . . . . . . . . . . . 74 73 74 70 (NA) 61 62 72 71
NA Not available. 1 Includes mining and construction. 2 Public utilities included in industry. 3 Includes mining.
Source: U.S. Bureau of Labor Statistics, Office of Productivity and Technology, Comparative Civilian Labor Force Statistics,10 Countries, 1959-1997, March 1998 and unpublished data.
Comparative International Statistics 843
U.S. Census Bureau, the Official StatisticsTM Statistical Abstract of the United States: 1998 Oct. 13, 1998
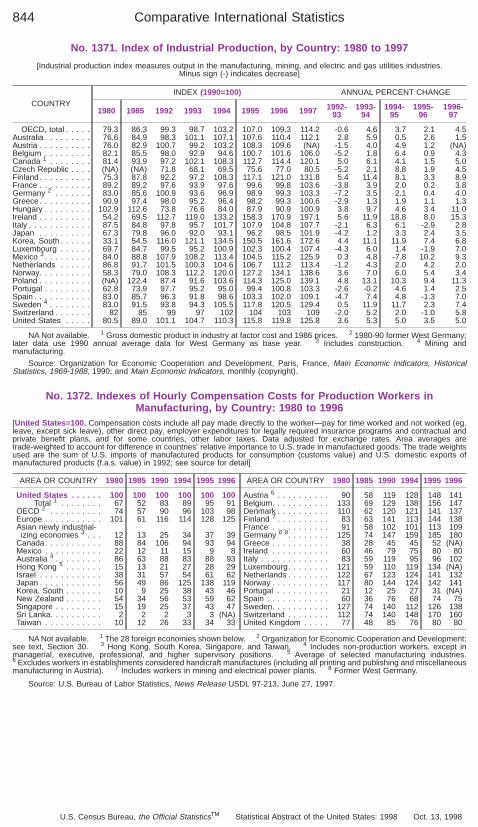
No. 1371. Index of Industrial Production, by Country: 1980 to 1997
[Industrial production index measures output in the manufacturing, mining, and electric and gas utilities industries.Minus sign (-) indicates decrease]
COUNTRYINDEX (1990=100) ANNUAL PERCENT CHANGE
1980 1985 1992 1993 1994 1995 1996 1997 1992-93
1993-94
1994-95
1995-96
1996-97
OECD, total . . . . . 79.3 86.3 99.3 98.7 103.2 107.0 109.3 114.2 -0.6 4.6 3.7 2.1 4.5Australia . . . . . . . . . 76.6 84.9 98.3 101.1 107.1 107.6 110.4 112.1 2.8 5.9 0.5 2.6 1.5Austria . . . . . . . . . . 76.0 82.9 100.7 99.2 103.2 108.3 109.6 (NA) -1.5 4.0 4.9 1.2 (NA)Belgium . . . . . . . . . 82.1 85.5 98.0 92.9 94.6 100.7 101.6 106.0 -5.2 1.8 6.4 0.9 4.3Canada 1 . . . . . . . . 81.4 93.9 97.2 102.1 108.3 112.7 114.4 120.1 5.0 6.1 4.1 1.5 5.0Czech Republic . . . . (NA) (NA) 71.8 68.1 69.5 75.6 77.0 80.5 -5.2 2.1 8.8 1.9 4.5Finland. . . . . . . . . . 75.3 87.8 92.2 97.2 108.3 117.1 121.0 131.8 5.4 11.4 8.1 3.3 8.9France . . . . . . . . . . 89.2 89.2 97.6 93.9 97.6 99.6 99.8 103.6 -3.8 3.9 2.0 0.2 3.8Germany 2 . . . . . . . 83.0 85.6 100.9 93.6 96.9 98.9 99.3 103.3 -7.2 3.5 2.1 0.4 4.0Greece. . . . . . . . . . 90.9 97.4 98.0 95.2 96.4 98.2 99.3 100.6 -2.9 1.3 1.9 1.1 1.3Hungary . . . . . . . . . 102.9 112.6 73.8 76.6 84.0 87.9 90.9 100.9 3.8 9.7 4.6 3.4 11.0Ireland . . . . . . . . . . 54.2 69.5 112.7 119.0 133.2 158.3 170.9 197.1 5.6 11.9 18.8 8.0 15.3Italy . . . . . . . . . . . . 87.5 84.8 97.8 95.7 101.7 107.9 104.8 107.7 -2.1 6.3 6.1 -2.9 2.8Japan . . . . . . . . . . 67.3 79.8 96.0 92.0 93.1 96.2 98.5 101.9 -4.2 1.2 3.3 2.4 3.5Korea, South . . . . . . 33.1 54.5 116.0 121.1 134.5 150.5 161.6 172.6 4.4 11.1 11.9 7.4 6.8Luxembourg . . . . . . 69.7 84.7 99.5 95.2 100.9 102.3 100.4 107.4 -4.3 6.0 1.4 -1.9 7.0Mexico 3 . . . . . . . . . 84.0 88.8 107.9 108.2 113.4 104.5 115.2 125.9 0.3 4.8 -7.8 10.2 9.3Netherlands . . . . . . 86.8 91.7 101.5 100.3 104.6 106.7 111.2 113.4 -1.2 4.3 2.0 4.2 2.0Norway. . . . . . . . . . 58.3 79.0 108.3 112.2 120.0 127.2 134.1 138.6 3.6 7.0 6.0 5.4 3.4Poland . . . . . . . . . . (NA) 122.4 87.4 91.6 103.6 114.3 125.0 139.1 4.8 13.1 10.3 9.4 11.3Portugal . . . . . . . . . 62.8 73.9 97.7 95.2 95.0 99.4 100.8 103.3 -2.6 -0.2 4.6 1.4 2.5Spain . . . . . . . . . . . 83.0 85.7 96.3 91.8 98.6 103.3 102.0 109.1 -4.7 7.4 4.8 -1.3 7.0Sweden 4 . . . . . . . . 83.0 91.5 93.8 94.3 105.5 117.8 120.5 129.4 0.5 11.9 11.7 2.3 7.4Switzerland . . . . . . . 82 85 99 97 102 104 103 109 -2.0 5.2 2.0 -1.0 5.8United States . . . . . 80.5 89.0 101.1 104.7 110.3 115.8 119.8 125.8 3.6 5.3 5.0 3.5 5.0
NA Not available. 1 Gross domestic product in industry at factor cost and 1986 prices. 2 1980-90 former West Germany;later data use 1990 annual average data for West Germany as base year. 3 Includes construction. 4 Mining andmanufacturing.
Source: Organization for Economic Cooperation and Development, Paris, France, Main Economic Indicators, HistoricalStatistics, 1969-1988, 1990; and Main Economic Indicators, monthly (copyright).
No. 1372. Indexes of Hourly Compensation Costs for Production Workers inManufacturing, by Country: 1980 to 1996
[United States=100. Compensation costs include all pay made directly to the worker—pay for time worked and not worked (eg.leave, except sick leave), other direct pay, employer expenditures for legally required insurance programs and contractual andprivate benefit plans, and for some countries, other labor taxes. Data adjusted for exchange rates. Area averages aretrade-weighted to account for difference in countries’ relative importance to U.S. trade in manufactured goods. The trade weightsused are the sum of U.S. imports of manufactured products for consumption (customs value) and U.S. domestic exports ofmanufactured products (f.a.s. value) in 1992; see source for detail]
AREA OR COUNTRY 1980 1985 1990 1994 1995 1996
United States . . . . . . 100 100 100 100 100 100Total 1 . . . . . . . . 67 52 83 89 95 91
OECD 2 . . . . . . . . . . 74 57 90 96 103 98Europe . . . . . . . . . . . 101 61 116 114 128 125Asian newly industrial-
izing economies 3 . . . 12 13 25 34 37 39Canada. . . . . . . . . . . 88 84 106 94 93 94Mexico . . . . . . . . . . . 22 12 11 15 9 8Australia 4 . . . . . . . . . 86 63 88 83 88 93Hong Kong 5 . . . . . . . 15 13 21 27 28 29Israel . . . . . . . . . . . . 38 31 57 54 61 62Japan . . . . . . . . . . . . 56 49 86 125 138 119Korea, South . . . . . . . 10 9 25 38 43 46New Zealand . . . . . . . 54 34 56 53 59 62Singapore . . . . . . . . . 15 19 25 37 43 47Sri Lanka. . . . . . . . . . 2 2 2 3 3 (NA)Taiwan . . . . . . . . . . . 10 12 26 33 34 33
AREA OR COUNTRY 1980 1985 1990 1994 1995 1996
Austria 6 . . . . . . . . . . 90 58 119 128 148 141Belgium. . . . . . . . . . . 133 69 129 138 156 147Denmark . . . . . . . . . . 110 62 120 121 141 137Finland 7 . . . . . . . . . . 83 63 141 113 144 138France . . . . . . . . . . . 91 58 102 101 113 109Germany 6 8. . . . . . . . 125 74 147 159 185 180Greece . . . . . . . . . . . 38 28 45 45 52 (NA)Ireland . . . . . . . . . . . 60 46 79 75 80 80Italy . . . . . . . . . . . . . 83 59 119 95 96 102Luxembourg. . . . . . . . 121 59 110 119 134 (NA)Netherlands . . . . . . . . 122 67 123 124 141 132Norway . . . . . . . . . . . 117 80 144 124 142 141Portugal . . . . . . . . . . 21 12 25 27 31 (NA)Spain . . . . . . . . . . . . 60 36 76 68 74 75Sweden. . . . . . . . . . . 127 74 140 112 126 138Switzerland . . . . . . . . 112 74 140 148 170 160United Kingdom . . . . . 77 48 85 76 80 80
NA Not available. 1 The 28 foreign economies shown below. 2 Organization for Economic Cooperation and Development;see text, Section 30. 3 Hong Kong, South Korea, Singapore, and Taiwan. 4 Includes non-production workers, except inmanagerial, executive, professional, and higher supervisory positions. 5 Average of selected manufacturing industries.6 Excludes workers in establishments considered handicraft manufactures (including all printing and publishing and miscellaneousmanufacturing in Austria). 7 Includes workers in mining and electrical power plants. 8 Former West Germany.
Source: U.S. Bureau of Labor Statistics, News Release USDL 97-213, June 27, 1997.
Comparative International Statistics844
U.S. Census Bureau, the Official StatisticsTM Statistical Abstract of the United States: 1998 Oct. 13, 1998
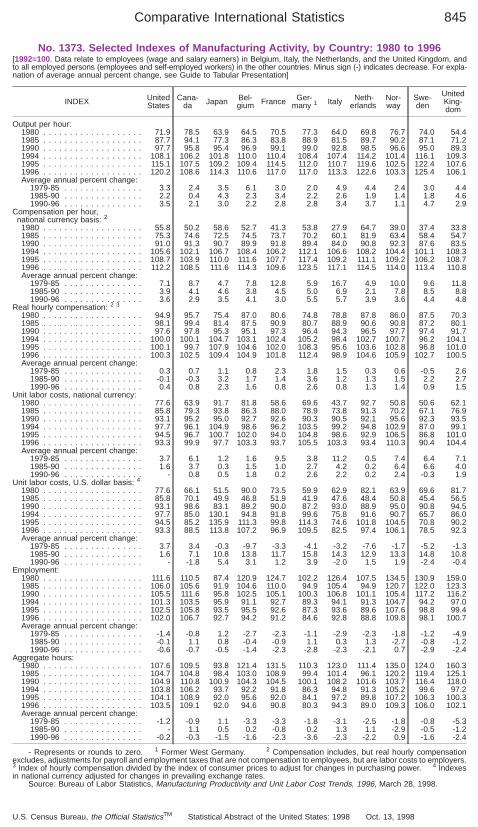
No. 1373. Selected Indexes of Manufacturing Activity, by Country: 1980 to 1996[1992=100. Data relate to employees (wage and salary earners) in Belgium, Italy, the Netherlands, and the United Kingdom, andto all employed persons (employees and self-employed workers) in the other countries. Minus sign (-) indicates decrease. For expla-nation of average annual percent change, see Guide to Tabular Presentation]
INDEX UnitedStates
Cana-da Japan Bel-
gium France Ger-many 1 Italy Neth-
erlandsNor-way
Swe-den
UnitedKing-dom
Output per hour:1980 . . . . . . . . . . . . . . . . . . . 71.9 78.5 63.9 64.5 70.5 77.3 64.0 69.8 76.7 74.0 54.41985 . . . . . . . . . . . . . . . . . . . 87.7 94.1 77.3 86.3 83.8 88.9 81.5 89.7 90.2 87.1 71.21990 . . . . . . . . . . . . . . . . . . . 97.7 95.8 95.4 96.9 99.1 99.0 92.8 98.5 96.6 95.0 89.31994 . . . . . . . . . . . . . . . . . . . 108.1 106.2 101.8 110.0 110.4 108.4 107.4 114.2 101.4 116.1 109.31995 . . . . . . . . . . . . . . . . . . . 115.1 107.5 109.2 109.4 114.5 112.0 110.7 119.6 102.5 122.4 107.61996 . . . . . . . . . . . . . . . . . . . 120.2 108.6 114.3 110.6 117.0 117.0 113.3 122.6 103.3 125.4 106.1Average annual percent change:
1979-85 . . . . . . . . . . . . . . . 3.3 2.4 3.5 6.1 3.0 2.0 4.9 4.4 2.4 3.0 4.41985-90 . . . . . . . . . . . . . . . 2.2 0.4 4.3 2.3 3.4 2.2 2.6 1.9 1.4 1.8 4.61990-96 . . . . . . . . . . . . . . . 3.5 2.1 3.0 2.2 2.8 2.8 3.4 3.7 1.1 4.7 2.9
Compensation per hour,national currency basis: 2
1980 . . . . . . . . . . . . . . . . . . . 55.8 50.2 58.6 52.7 41.3 53.8 27.9 64.7 39.0 37.4 33.81985 . . . . . . . . . . . . . . . . . . . 75.3 74.6 72.5 74.5 73.7 70.2 60.1 81.9 63.4 58.4 54.71990 . . . . . . . . . . . . . . . . . . . 91.0 91.3 90.7 89.9 91.8 89.4 84.0 90.8 92.3 87.6 83.51994 . . . . . . . . . . . . . . . . . . . 105.6 102.1 106.7 108.4 106.2 112.1 106.6 108.2 104.4 101.1 108.31995 . . . . . . . . . . . . . . . . . . . 108.7 103.9 110.0 111.6 107.7 117.4 109.2 111.1 109.2 106.2 108.71996 . . . . . . . . . . . . . . . . . . . 112.2 108.5 111.6 114.3 109.6 123.5 117.1 114.5 114.0 113.4 110.8Average annual percent change:
1979-85 . . . . . . . . . . . . . . . 7.1 8.7 4.7 7.8 12.8 5.9 16.7 4.9 10.0 9.6 11.81985-90 . . . . . . . . . . . . . . . 3.9 4.1 4.6 3.8 4.5 5.0 6.9 2.1 7.8 8.5 8.81990-96 . . . . . . . . . . . . . . . 3.6 2.9 3.5 4.1 3.0 5.5 5.7 3.9 3.6 4.4 4.8
Real hourly compensation: 2 3
1980 . . . . . . . . . . . . . . . . . . . 94.9 95.7 75.4 87.0 80.6 74.8 78.8 87.8 86.0 87.5 70.31985 . . . . . . . . . . . . . . . . . . . 98.1 99.4 81.4 87.5 90.9 80.7 88.9 90.6 90.8 87.2 80.11990 . . . . . . . . . . . . . . . . . . . 97.6 97.8 95.3 95.1 97.3 96.4 94.3 96.5 97.7 97.4 91.71994 . . . . . . . . . . . . . . . . . . . 100.0 100.1 104.7 103.1 102.4 105.2 98.4 102.7 100.7 96.2 104.11995 . . . . . . . . . . . . . . . . . . . 100.1 99.7 107.9 104.6 102.0 108.3 95.6 103.6 102.8 96.8 101.01996 . . . . . . . . . . . . . . . . . . . 100.3 102.5 109.4 104.9 101.8 112.4 98.9 104.6 105.9 102.7 100.5Average annual percent change:
1979-85 . . . . . . . . . . . . . . . 0.3 0.7 1.1 0.8 2.3 1.8 1.5 0.3 0.6 -0.5 2.61985-90 . . . . . . . . . . . . . . . -0.1 -0.3 3.2 1.7 1.4 3.6 1.2 1.3 1.5 2.2 2.71990-96 . . . . . . . . . . . . . . . 0.4 0.8 2.3 1.6 0.8 2.6 0.8 1.3 1.4 0.9 1.5
Unit labor costs, national currency:1980 . . . . . . . . . . . . . . . . . . . 77.6 63.9 91.7 81.8 58.6 69.6 43.7 92.7 50.8 50.6 62.11985 . . . . . . . . . . . . . . . . . . . 85.8 79.3 93.8 86.3 88.0 78.9 73.8 91.3 70.2 67.1 76.91990 . . . . . . . . . . . . . . . . . . . 93.1 95.2 95.0 92.7 92.6 90.3 90.5 92.1 95.6 92.3 93.51994 . . . . . . . . . . . . . . . . . . . 97.7 96.1 104.9 98.6 96.2 103.5 99.2 94.8 102.9 87.0 99.11995 . . . . . . . . . . . . . . . . . . . 94.5 96.7 100.7 102.0 94.0 104.8 98.6 92.9 106.5 86.8 101.01996 . . . . . . . . . . . . . . . . . . . 93.3 99.9 97.7 103.3 93.7 105.5 103.3 93.4 110.3 90.4 104.4Average annual percent change:
1979-85 . . . . . . . . . . . . . . . 3.7 6.1 1.2 1.6 9.5 3.8 11.2 0.5 7.4 6.4 7.11985-90 . . . . . . . . . . . . . . . 1.6 3.7 0.3 1.5 1.0 2.7 4.2 0.2 6.4 6.6 4.01990-96 . . . . . . . . . . . . . . . - 0.8 0.5 1.8 0.2 2.6 2.2 0.2 2.4 -0.3 1.9
Unit labor costs, U.S. dollar basis: 4
1980 . . . . . . . . . . . . . . . . . . . 77.6 66.1 51.5 90.0 73.5 59.9 62.9 82.1 63.9 69.6 81.71985 . . . . . . . . . . . . . . . . . . . 85.8 70.1 49.9 46.8 51.9 41.9 47.6 48.4 50.8 45.4 56.51990 . . . . . . . . . . . . . . . . . . . 93.1 98.6 83.1 89.2 90.0 87.2 93.0 88.9 95.0 90.8 94.51994 . . . . . . . . . . . . . . . . . . . 97.7 85.0 130.1 94.8 91.8 99.6 75.8 91.6 90.7 65.7 86.01995 . . . . . . . . . . . . . . . . . . . 94.5 85.2 135.9 111.3 99.8 114.3 74.6 101.8 104.5 70.8 90.21996 . . . . . . . . . . . . . . . . . . . 93.3 88.5 113.8 107.2 96.9 109.5 82.5 97.4 106.1 78.5 92.3Average annual percent change:
1979-85 . . . . . . . . . . . . . . . 3.7 3.4 -0.3 -9.7 -3.3 -4.1 -3.2 -7.6 -1.7 -5.2 -1.31985-90 . . . . . . . . . . . . . . . 1.6 7.1 10.8 13.8 11.7 15.8 14.3 12.9 13.3 14.8 10.81990-96 . . . . . . . . . . . . . . . - -1.8 5.4 3.1 1.2 3.9 -2.0 1.5 1.9 -2.4 -0.4
Employment:1980 . . . . . . . . . . . . . . . . . . . 111.6 110.5 87.4 120.9 124.7 102.2 126.4 107.5 134.5 130.9 159.01985 . . . . . . . . . . . . . . . . . . . 106.0 105.6 91.9 104.6 110.0 94.9 105.4 94.9 120.7 122.0 123.31990 . . . . . . . . . . . . . . . . . . . 105.5 111.6 95.8 102.5 105.1 100.3 106.8 101.1 105.4 117.2 116.21994 . . . . . . . . . . . . . . . . . . . 101.3 103.5 95.9 91.1 92.7 89.3 94.1 91.3 104.7 94.2 97.01995 . . . . . . . . . . . . . . . . . . . 102.5 105.8 93.5 95.5 92.6 87.3 93.6 89.6 107.6 98.8 99.41996 . . . . . . . . . . . . . . . . . . . 102.0 106.7 92.7 94.2 91.2 84.6 92.8 88.8 109.8 98.1 100.7Average annual percent change:
1979-85 . . . . . . . . . . . . . . . -1.4 -0.8 1.2 -2.7 -2.3 -1.1 -2.9 -2.3 -1.8 -1.2 -4.91985-90 . . . . . . . . . . . . . . . -0.1 1.1 0.8 -0.4 -0.9 1.1 0.3 1.3 -2.7 -0.8 -1.21990-96 . . . . . . . . . . . . . . . -0.6 -0.7 -0.5 -1.4 -2.3 -2.8 -2.3 -2.1 0.7 -2.9 -2.4
Aggregate hours:1980 . . . . . . . . . . . . . . . . . . . 107.6 109.5 93.8 121.4 131.5 110.3 123.0 111.4 135.0 124.0 160.31985 . . . . . . . . . . . . . . . . . . . 104.7 104.8 98.4 103.0 108.9 99.4 101.4 96.1 120.2 119.4 125.11990 . . . . . . . . . . . . . . . . . . . 104.9 110.8 100.9 104.3 104.5 100.1 108.2 101.6 103.7 116.4 118.01994 . . . . . . . . . . . . . . . . . . . 103.8 106.2 93.7 92.2 91.8 86.3 94.8 91.3 105.2 99.6 97.21995 . . . . . . . . . . . . . . . . . . . 104.1 108.9 92.0 95.6 92.0 84.1 97.2 89.8 107.2 106.3 100.31996 . . . . . . . . . . . . . . . . . . . 103.5 109.1 92.0 94.6 90.8 80.3 94.3 89.0 109.3 106.0 102.1Average annual percent change:
1979-85 . . . . . . . . . . . . . . . -1.2 -0.9 1.1 -3.3 -3.3 -1.8 -3.1 -2.5 -1.8 -0.8 -5.31985-90 . . . . . . . . . . . . . . . - 1.1 0.5 0.2 -0.8 0.2 1.3 1.1 -2.9 -0.5 -1.21990-96 . . . . . . . . . . . . . . . -0.2 -0.3 -1.5 -1.6 -2.3 -3.6 -2.3 -2.2 0.9 -1.6 -2.4
- Represents or rounds to zero. 1 Former West Germany. 2 Compensation includes, but real hourly compensationexcludes, adjustments for payroll and employment taxes that are not compensation to employees, but are labor costs to employers.3 Index of hourly compensation divided by the index of consumer prices to adjust for changes in purchasing power. 4 Indexesin national currency adjusted for changes in prevailing exchange rates.
Source: Bureau of Labor Statistics, Manufacturing Productivity and Unit Labor Cost Trends, 1996, March 28, 1998.
Comparative International Statistics 845
U.S. Census Bureau, the Official StatisticsTM Statistical Abstract of the United States: 1998 Oct. 13, 1998
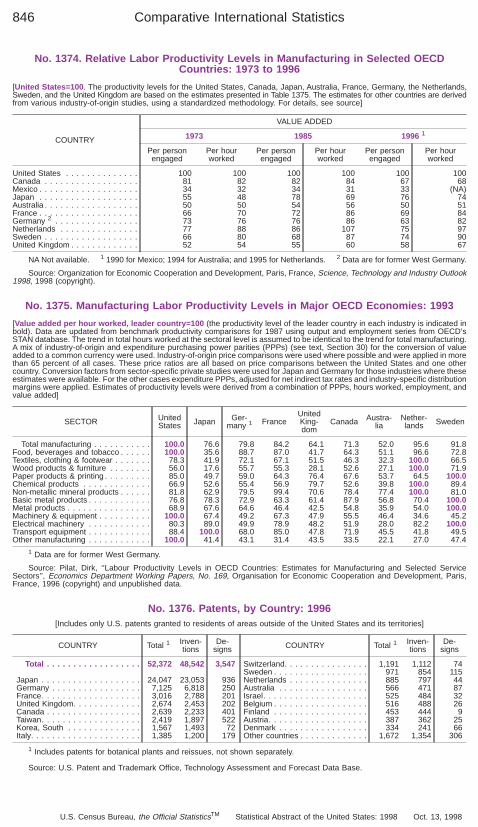
No. 1374. Relative Labor Productivity Levels in Manufacturing in Selected OECDCountries: 1973 to 1996
[United States=100 . The productivity levels for the United States, Canada, Japan, Australia, France, Germany, the Netherlands,Sweden, and the United Kingdom are based on the estimates presented in Table 1375. The estimates for other countries are derivedfrom various industry-of-origin studies, using a standardized methodology. For details, see source]
COUNTRY
VALUE ADDED
1973 1985 1996 1
Per personengaged
Per hourworked
Per personengaged
Per hourworked
Per personengaged
Per hourworked
United States . . . . . . . . . . . . . . 100 100 100 100 100 100Canada . . . . . . . . . . . . . . . . . . 81 82 82 84 67 68Mexico . . . . . . . . . . . . . . . . . . . 34 32 34 31 33 (NA)Japan . . . . . . . . . . . . . . . . . . . 55 48 78 69 76 74Australia . . . . . . . . . . . . . . . . . . 50 50 54 56 50 51France . . . . . . . . . . . . . . . . . . . 66 70 72 86 69 84Germany 2 . . . . . . . . . . . . . . . . 73 76 76 86 63 82Netherlands . . . . . . . . . . . . . . . 77 88 86 107 75 97Sweden . . . . . . . . . . . . . . . . . . 66 80 68 87 74 90United Kingdom . . . . . . . . . . . . . 52 54 55 60 58 67
NA Not available. 1 1990 for Mexico; 1994 for Australia; and 1995 for Netherlands. 2 Data are for former West Germany.
Source: Organization for Economic Cooperation and Development, Paris, France, Science, Technology and Industry Outlook1998, 1998 (copyright).
No. 1375. Manufacturing Labor Productivity Levels in Major OECD Economies: 1993
[Value added per hour worked, leader country=100 (the productivity level of the leader country in each industry is indicated inbold). Data are updated from benchmark productivity comparisons for 1987 using output and employment series from OECD’sSTAN database. The trend in total hours worked at the sectoral level is assumed to be identical to the trend for total manufacturing.A mix of industry-of-origin and expenditure purchasing power parities (PPPs) (see text, Section 30) for the conversion of valueadded to a common currency were used. Industry-of-origin price comparisons were used where possible and were applied in morethan 65 percent of all cases. These price ratios are all based on price comparisons between the United States and one othercountry. Conversion factors from sector-specific private studies were used for Japan and Germany for those industries where theseestimates were available. For the other cases expenditure PPPs, adjusted for net indirect tax rates and industry-specific distributionmargins were applied. Estimates of productivity levels were derived from a combination of PPPs, hours worked, employment, andvalue added]
SECTOR UnitedStates Japan Ger-
many 1 FranceUnitedKing-dom
Canada Austra-lia
Nether-lands Sweden
Total manufacturing . . . . . . . . . . . 100.0 76.6 79.8 84.2 64.1 71.3 52.0 95.6 91.8Food, beverages and tobacco . . . . . . 100.0 35.6 88.7 87.0 41.7 64.3 51.1 96.6 72.8Textiles, clothing & footwear . . . . . . . 78.3 41.9 72.1 67.1 51.5 46.3 32.3 100.0 66.5Wood products & furniture . . . . . . . . 56.0 17.6 55.7 55.3 28.1 52.6 27.1 100.0 71.9Paper products & printing . . . . . . . . . 85.0 49.7 59.0 64.3 76.4 67.6 53.7 64.5 100.0Chemical products . . . . . . . . . . . . . 66.9 52.6 55.4 56.9 79.7 52.6 39.8 100.0 89.4Non-metallic mineral products . . . . . . 81.8 62.9 79.5 99.4 70.6 78.4 77.4 100.0 81.0Basic metal products . . . . . . . . . . . . 76.8 78.3 72.9 63.3 61.4 87.9 56.8 70.4 100.0Metal products . . . . . . . . . . . . . . . . 68.9 67.6 64.6 46.4 42.5 54.8 35.9 54.0 100.0Machinery & equipment . . . . . . . . . . 100.0 67.4 49.2 67.3 47.9 55.5 46.4 34.6 45.2Electrical machinery . . . . . . . . . . . . 80.3 89.0 49.9 78.9 48.2 51.9 28.0 82.2 100.0Transport equipment . . . . . . . . . . . . 88.4 100.0 68.0 85.0 47.8 71.9 45.5 41.8 49.5Other manufacturing . . . . . . . . . . . . 100.0 41.4 43.1 31.4 43.5 33.5 22.1 27.0 47.4
1 Data are for former West Germany.
Source: Pilat, Dirk, ‘‘Labour Productivity Levels in OECD Countries: Estimates for Manufacturing and Selected ServiceSectors’’, Economics Department Working Papers, No. 169, Organisation for Economic Cooperation and Development, Paris,France, 1996 (copyright) and unpublished data.
No. 1376. Patents, by Country: 1996[Includes only U.S. patents granted to residents of areas outside of the United States and its territories]
COUNTRY Total 1 Inven-tions
De-signs
Total . . . . . . . . . . . . . . . . . . 52,372 48,542 3,547
Japan . . . . . . . . . . . . . . . . . . . 24,047 23,053 936Germany . . . . . . . . . . . . . . . . . 7,125 6,818 250France. . . . . . . . . . . . . . . . . . . 3,016 2,788 201United Kingdom. . . . . . . . . . . . . 2,674 2,453 202Canada . . . . . . . . . . . . . . . . . . 2,639 2,233 401Taiwan. . . . . . . . . . . . . . . . . . . 2,419 1,897 522Korea, South . . . . . . . . . . . . . . 1,567 1,493 72Italy. . . . . . . . . . . . . . . . . . . . . 1,385 1,200 179
COUNTRY Total 1 Inven-tions
De-signs
Switzerland. . . . . . . . . . . . . . . . 1,191 1,112 74Sweden . . . . . . . . . . . . . . . . . . 971 854 115Netherlands . . . . . . . . . . . . . . . 885 797 44Australia . . . . . . . . . . . . . . . . . 566 471 87Israel. . . . . . . . . . . . . . . . . . . . 525 484 32Belgium . . . . . . . . . . . . . . . . . . 516 488 26Finland . . . . . . . . . . . . . . . . . . 453 444 9Austria. . . . . . . . . . . . . . . . . . . 387 362 25Denmark . . . . . . . . . . . . . . . . . 334 241 66Other countries . . . . . . . . . . . . . 1,672 1,354 306
1 Includes patents for botanical plants and reissues, not shown separately.
Source: U.S. Patent and Trademark Office, Technology Assessment and Forecast Data Base.
Comparative International Statistics846
U.S. Census Bureau, the Official StatisticsTM Statistical Abstract of the United States: 1998 Oct. 13, 1998
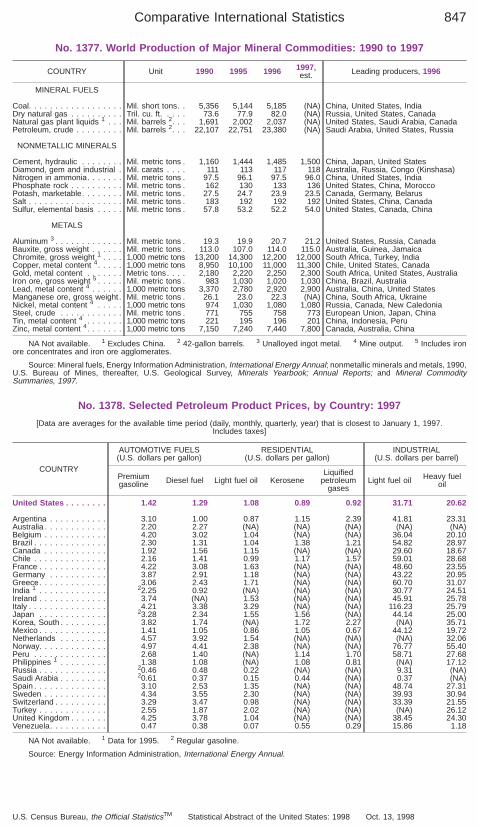
No. 1377. World Production of Major Mineral Commodities: 1990 to 1997
COUNTRY Unit 1990 1995 1996 1997,est. Leading producers, 1996
MINERAL FUELS
Coal. . . . . . . . . . . . . . . . . . Mil. short tons. . 5,356 5,144 5,185 (NA) China, United States, IndiaDry natural gas . . . . . . . . . . Tril. cu. ft. . . . . 73.6 77.9 82.0 (NA) Russia, United States, CanadaNatural gas plant liquids 1 . . . Mil. barrels 2. . . 1,691 2,002 2,037 (NA) United States, Saudi Arabia, CanadaPetroleum, crude . . . . . . . . . Mil. barrels 2. . . 22,107 22,751 23,380 (NA) Saudi Arabia, United States, Russia
NONMETALLIC MINERALS
Cement, hydraulic . . . . . . . . Mil. metric tons . 1,160 1,444 1,485 1,500 China, Japan, United StatesDiamond, gem and industrial . Mil. carats . . . . 111 113 117 118 Australia, Russia, Congo (Kinshasa)Nitrogen in ammonia. . . . . . . Mil. metric tons . 97.5 96.1 97.5 96.0 China, United States, IndiaPhosphate rock . . . . . . . . . . Mil. metric tons . 162 130 133 136 United States, China, MoroccoPotash, marketable. . . . . . . . Mil. metric tons . 27.5 24.7 23.9 23.5 Canada, Germany, BelarusSalt . . . . . . . . . . . . . . . . . . Mil. metric tons . 183 192 192 192 United States, China, CanadaSulfur, elemental basis . . . . . Mil. metric tons . 57.8 53.2 52.2 54.0 United States, Canada, China
METALS
Aluminum 3 . . . . . . . . . . . . . Mil. metric tons . 19.3 19.9 20.7 21.2 United States, Russia, CanadaBauxite, gross weight . . . . . . Mil. metric tons . 113.0 107.0 114.0 115.0 Australia, Guinea, JamaicaChromite, gross weight 1 . . . . 1,000 metric tons 13,200 14,300 12,200 12,000 South Africa, Turkey, IndiaCopper, metal content 4. . . . . 1,000 metric tons 8,950 10,100 11,000 11,300 Chile, United States, CanadaGold, metal content . . . . . . . Metric tons. . . . 2,180 2,220 2,250 2,300 South Africa, United States, AustraliaIron ore, gross weight 5 . . . . . Mil. metric tons . 983 1,030 1,020 1,030 China, Brazil, AustraliaLead, metal content 4 . . . . . . 1,000 metric tons 3,370 2,780 2,920 2,900 Australia, China, United StatesManganese ore, gross weight . Mil. metric tons . 26.1 23.0 22.3 (NA) China, South Africa, UkraineNickel, metal content 4 . . . . . 1,000 metric tons 974 1,030 1,080 1,080 Russia, Canada, New CaledoniaSteel, crude . . . . . . . . . . . . Mil. metric tons . 771 755 758 773 European Union, Japan, ChinaTin, metal content 4 . . . . . . . 1,000 metric tons 221 195 196 201 China, Indonesia, PeruZinc, metal content 4. . . . . . . 1,000 metric tons 7,150 7,240 7,440 7,800 Canada, Australia, China
NA Not available. 1 Excludes China. 2 42-gallon barrels. 3 Unalloyed ingot metal. 4 Mine output. 5 Includes ironore concentrates and iron ore agglomerates.
Source: Mineral fuels, Energy Information Administration, International Energy Annual; nonmetallic minerals and metals, 1990,U.S. Bureau of Mines, thereafter, U.S. Geological Survey, Minerals Yearbook; Annual Reports; and Mineral CommoditySummaries, 1997.
No. 1378. Selected Petroleum Product Prices, by Country: 1997
[Data are averages for the available time period (daily, monthly, quarterly, year) that is closest to January 1, 1997.Includes taxes]
COUNTRY
AUTOMOTIVE FUELS(U.S. dollars per gallon)
RESIDENTIAL(U.S. dollars per gallon)
INDUSTRIAL(U.S. dollars per barrel)
Premiumgasoline Diesel fuel Light fuel oil Kerosene
Liquifiedpetroleum
gasesLight fuel oil Heavy fuel
oil
United States . . . . . . . . 1.42 1.29 1.08 0.89 0.92 31.71 20.62
Argentina . . . . . . . . . . . 3.10 1.00 0.87 1.15 2.39 41.81 23.31Australia . . . . . . . . . . . . 2.20 2.27 (NA) (NA) (NA) (NA) (NA)Belgium . . . . . . . . . . . . 4.20 3.02 1.04 (NA) (NA) 36.04 20.10Brazil . . . . . . . . . . . . . . 2.30 1.31 1.04 1.38 1.21 54.82 28.97Canada . . . . . . . . . . . . 1.92 1.56 1.15 (NA) (NA) 29.60 18.67Chile . . . . . . . . . . . . . . 2.16 1.41 0.99 1.17 1.57 59.01 28.68France . . . . . . . . . . . . . 4.22 3.08 1.63 (NA) (NA) 48.60 23.55Germany . . . . . . . . . . . 3.87 2.91 1.18 (NA) (NA) 43.22 20.95Greece. . . . . . . . . . . . . 3.06 2.43 1.71 (NA) (NA) 60.70 31.07India 1 . . . . . . . . . . . . . 22.25 0.92 (NA) (NA) (NA) 30.77 24.51Ireland . . . . . . . . . . . . . 3.74 (NA) 1.53 (NA) (NA) 45.91 25.78Italy . . . . . . . . . . . . . . . 4.21 3.38 3.29 (NA) (NA) 116.23 25.79Japan . . . . . . . . . . . . . 23.28 2.34 1.55 1.56 (NA) 44.14 25.00Korea, South . . . . . . . . . 3.82 1.74 (NA) 1.72 2.27 (NA) 35.71Mexico . . . . . . . . . . . . . 1.41 1.05 0.86 1.05 0.67 44.12 19.72Netherlands . . . . . . . . . 4.57 3.92 1.54 (NA) (NA) (NA) 32.06Norway. . . . . . . . . . . . . 4.97 4.41 2.38 (NA) (NA) 76.77 55.40Peru . . . . . . . . . . . . . . 2.68 1.40 (NA) 1.14 1.70 58.71 27.68Philippines 1 . . . . . . . . . 1.38 1.08 (NA) 1.08 0.81 (NA) 17.12Russia . . . . . . . . . . . . . 20.46 0.48 0.22 (NA) (NA) 9.31 (NA)Saudi Arabia . . . . . . . . . 20.61 0.37 0.15 0.44 (NA) 0.37 (NA)Spain . . . . . . . . . . . . . . 3.10 2.53 1.35 (NA) (NA) 48.74 27.31Sweden . . . . . . . . . . . . 4.34 3.55 2.30 (NA) (NA) 39.93 30.94Switzerland . . . . . . . . . . 3.29 3.47 0.98 (NA) (NA) 33.39 21.55Turkey . . . . . . . . . . . . . 2.55 1.87 2.02 (NA) (NA) (NA) 26.12United Kingdom . . . . . . . 4.25 3.78 1.04 (NA) (NA) 38.45 24.30Venezuela. . . . . . . . . . . 0.47 0.38 0.07 0.55 0.29 15.86 1.18
NA Not available. 1 Data for 1995. 2 Regular gasoline.
Source: Energy Information Administration, International Energy Annual.
Comparative International Statistics 847
U.S. Census Bureau, the Official StatisticsTM Statistical Abstract of the United States: 1998 Oct. 13, 1998
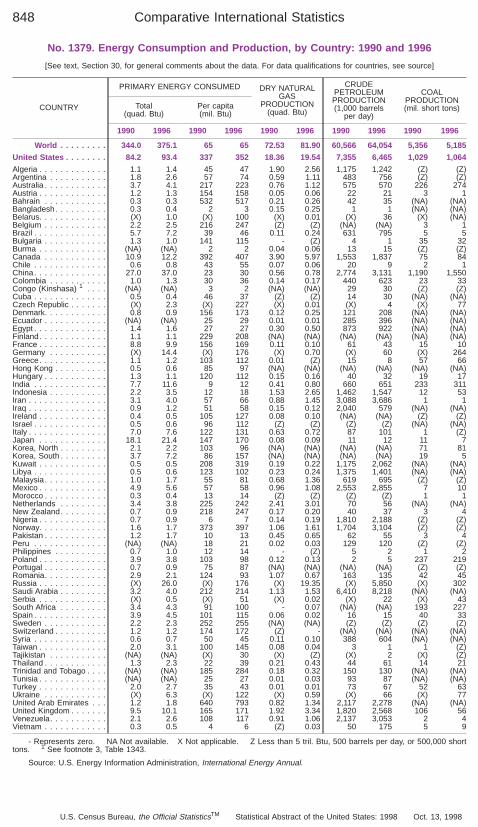
No. 1379. Energy Consumption and Production, by Country: 1990 and 1996
[See text, Section 30, for general comments about the data. For data qualifications for countries, see source]
COUNTRY
PRIMARY ENERGY CONSUMED DRY NATURALGAS
PRODUCTION(quad. Btu)
CRUDEPETROLEUMPRODUCTION(1,000 barrels
per day)
COALPRODUCTION(mil. short tons)Total
(quad. Btu)Per capita(mil. Btu)
1990 1996 1990 1996 1990 1996 1990 1996 1990 1996
World . . . . . . . . . 344.0 375.1 65 65 72.53 81.90 60,566 64,054 5,356 5,185
United States . . . . . . . . 84.2 93.4 337 352 18.36 19.54 7,355 6,465 1,029 1,064
Algeria . . . . . . . . . . . . . 1.1 1.4 45 47 1.90 2.56 1,175 1,242 (Z) (Z)Argentina . . . . . . . . . . . 1.8 2.6 57 74 0.59 1.11 483 756 (Z) (Z)Australia . . . . . . . . . . . . 3.7 4.1 217 223 0.76 1.12 575 570 226 274Austria . . . . . . . . . . . . . 1.2 1.3 154 158 0.05 0.06 22 21 3 1Bahrain . . . . . . . . . . . . 0.3 0.3 532 517 0.21 0.26 42 35 (NA) (NA)Bangladesh. . . . . . . . . . 0.3 0.4 2 3 0.15 0.25 1 1 (NA) (NA)Belarus. . . . . . . . . . . . . (X) 1.0 (X) 100 (X) 0.01 (X) 36 (X) (NA)Belgium . . . . . . . . . . . . 2.2 2.5 216 247 (Z) (Z) (NA) (NA) 3 1Brazil . . . . . . . . . . . . . . 5.7 7.2 39 46 0.11 0.24 631 795 5 5Bulgaria . . . . . . . . . . . . 1.3 1.0 141 115 - (Z) 4 1 35 32Burma . . . . . . . . . . . . . (NA) (NA) 2 2 0.04 0.06 13 15 (Z) (Z)Canada . . . . . . . . . . . . 10.9 12.2 392 407 3.90 5.97 1,553 1,837 75 84Chile . . . . . . . . . . . . . . 0.6 0.8 43 55 0.07 0.06 20 9 2 1China. . . . . . . . . . . . . . 27.0 37.0 23 30 0.56 0.78 2,774 3,131 1,190 1,550Colombia . . . . . . . . . . . 1.0 1.3 30 36 0.14 0.17 440 623 23 33Congo (Kinshasa) 1 . . . . (NA) (NA) 3 2 (NA) (NA) 29 30 (Z) (Z)Cuba . . . . . . . . . . . . . . 0.5 0.4 46 37 (Z) (Z) 14 30 (NA) (NA)Czech Republic . . . . . . . (X) 2.3 (X) 227 (X) 0.01 (X) 4 (X) 77Denmark. . . . . . . . . . . . 0.8 0.9 156 173 0.12 0.25 121 208 (NA) (NA)Ecuador . . . . . . . . . . . . (NA) (NA) 25 29 0.01 0.01 285 396 (NA) (NA)Egypt . . . . . . . . . . . . . . 1.4 1.6 27 27 0.30 0.50 873 922 (NA) (NA)Finland. . . . . . . . . . . . . 1.1 1.1 229 208 (NA) (NA) (NA) (NA) (NA) (NA)France . . . . . . . . . . . . . 8.8 9.9 156 169 0.11 0.10 61 43 15 10Germany . . . . . . . . . . . (X) 14.4 (X) 176 (X) 0.70 (X) 60 (X) 264Greece. . . . . . . . . . . . . 1.1 1.2 103 112 0.01 (Z) 15 8 57 66Hong Kong . . . . . . . . . . 0.5 0.6 85 97 (NA) (NA) (NA) (NA) (NA) (NA)Hungary . . . . . . . . . . . . 1.3 1.1 120 112 0.15 0.16 40 32 19 17India . . . . . . . . . . . . . . 7.7 11.6 9 12 0.41 0.80 660 651 233 311Indonesia . . . . . . . . . . . 2.2 3.5 12 18 1.53 2.65 1,462 1,547 12 53Iran . . . . . . . . . . . . . . . 3.1 4.0 57 66 0.88 1.45 3,088 3,686 1 1Iraq . . . . . . . . . . . . . . . 0.9 1.2 51 58 0.15 0.12 2,040 579 (NA) (NA)Ireland . . . . . . . . . . . . . 0.4 0.5 105 127 0.08 0.10 (NA) (NA) (Z) (Z)Israel . . . . . . . . . . . . . . 0.5 0.6 96 112 (Z) (Z) (Z) (Z) (NA) (NA)Italy . . . . . . . . . . . . . . . 7.0 7.6 122 131 0.63 0.72 87 101 1 (Z)Japan . . . . . . . . . . . . . 18.1 21.4 147 170 0.08 0.09 11 12 11 7Korea, North . . . . . . . . . 2.1 2.2 103 96 (NA) (NA) (NA) (NA) 71 81Korea, South . . . . . . . . . 3.7 7.2 86 157 (NA) (NA) (NA) (NA) 19 5Kuwait . . . . . . . . . . . . . 0.5 0.5 208 319 0.19 0.22 1,175 2,062 (NA) (NA)Libya . . . . . . . . . . . . . . 0.5 0.6 123 102 0.23 0.24 1,375 1,401 (NA) (NA)Malaysia . . . . . . . . . . . . 1.0 1.7 55 81 0.68 1.36 619 695 (Z) (Z)Mexico . . . . . . . . . . . . . 4.9 5.6 57 58 0.96 1.08 2,553 2,855 7 10Morocco . . . . . . . . . . . . 0.3 0.4 13 14 (Z) (Z) (Z) (Z) 1 1Netherlands . . . . . . . . . 3.4 3.8 225 242 2.41 3.01 70 56 (NA) (NA)New Zealand. . . . . . . . . 0.7 0.9 218 247 0.17 0.20 40 37 3 4Nigeria . . . . . . . . . . . . . 0.7 0.9 6 7 0.14 0.19 1,810 2,188 (Z) (Z)Norway. . . . . . . . . . . . . 1.6 1.7 373 397 1.06 1.61 1,704 3,104 (Z) (Z)Pakistan . . . . . . . . . . . . 1.2 1.7 10 13 0.45 0.65 62 55 3 4Peru . . . . . . . . . . . . . . (NA) (NA) 18 21 0.02 0.03 129 120 (Z) (Z)Philippines . . . . . . . . . . 0.7 1.0 12 14 - (Z) 5 2 1 2Poland . . . . . . . . . . . . . 3.9 3.8 103 98 0.12 0.13 2 5 237 219Portugal . . . . . . . . . . . . 0.7 0.9 75 87 (NA) (NA) (NA) (NA) (Z) (Z)Romania. . . . . . . . . . . . 2.9 2.1 124 93 1.07 0.67 163 135 42 45Russia . . . . . . . . . . . . . (X) 26.0 (X) 176 (X) 19.35 (X) 5,850 (X) 302Saudi Arabia . . . . . . . . . 3.2 4.0 212 214 1.13 1.53 6,410 8,218 (NA) (NA)Serbia . . . . . . . . . . . . . (X) 0.5 (X) 51 (X) 0.02 (X) 22 (X) 43South Africa . . . . . . . . . 3.4 4.3 91 100 - 0.07 (NA) (NA) 193 227Spain . . . . . . . . . . . . . . 3.9 4.5 101 115 0.06 0.02 16 15 40 33Sweden . . . . . . . . . . . . 2.2 2.3 252 255 (NA) (NA) (Z) (Z) (Z) (Z)Switzerland . . . . . . . . . . 1.2 1.2 174 172 (Z) - (NA) (NA) (NA) (NA)Syria . . . . . . . . . . . . . . 0.6 0.7 50 45 0.11 0.10 388 604 (NA) (NA)Taiwan . . . . . . . . . . . . . 2.0 3.1 100 145 0.08 0.04 3 1 1 (Z)Tajikistan . . . . . . . . . . . (NA) (NA) (X) 30 (X) (Z) (X) 2 (X) (Z)Thailand . . . . . . . . . . . . 1.3 2.3 22 39 0.21 0.43 44 61 14 21Trinidad and Tobago . . . . (NA) (NA) 185 284 0.18 0.32 150 130 (NA) (NA)Tunisia . . . . . . . . . . . . . (NA) (NA) 25 27 0.01 0.03 93 87 (NA) (NA)Turkey . . . . . . . . . . . . . 2.0 2.7 35 43 0.01 0.01 73 67 52 63Ukraine . . . . . . . . . . . . (X) 6.3 (X) 122 (X) 0.59 (X) 66 (X) 77United Arab Emirates . . . 1.2 1.8 640 793 0.82 1.34 2,117 2,278 (NA) (NA)United Kingdom . . . . . . . 9.5 10.1 165 171 1.92 3.34 1,820 2,568 106 56Venezuela. . . . . . . . . . . 2.1 2.6 108 117 0.91 1.06 2,137 3,053 2 4Vietnam . . . . . . . . . . . . 0.3 0.5 4 6 (Z) 0.03 50 175 5 9
- Represents zero. NA Not available. X Not applicable. Z Less than 5 tril. Btu, 500 barrels per day, or 500,000 shorttons. 1 See footnote 3, Table 1343.
Source: U.S. Energy Information Administration, International Energy Annual.
Comparative International Statistics848
U.S. Census Bureau, the Official StatisticsTM Statistical Abstract of the United States: 1998 Oct. 13, 1998
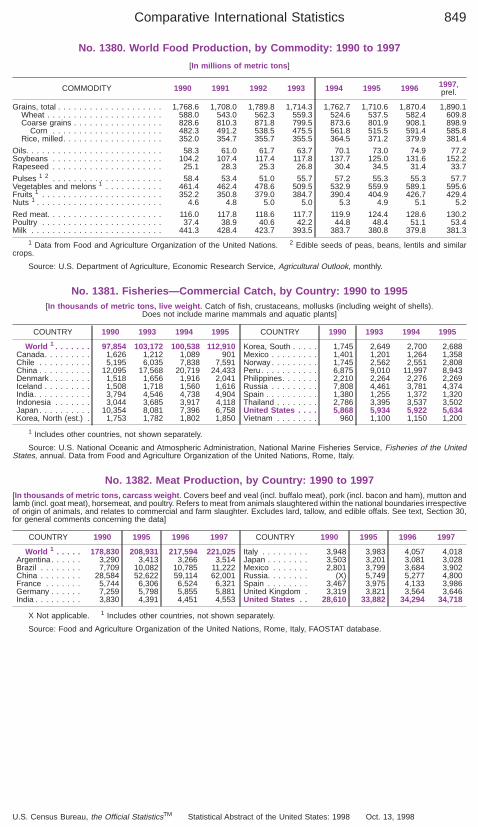
No. 1380. World Food Production, by Commodity: 1990 to 1997
[In millions of metric tons ]
COMMODITY 1990 1991 1992 1993 1994 1995 1996 1997,prel.
Grains, total . . . . . . . . . . . . . . . . . . . . 1,768.6 1,708.0 1,789.8 1,714.3 1,762.7 1,710.6 1,870.4 1,890.1Wheat . . . . . . . . . . . . . . . . . . . . . . 588.0 543.0 562.3 559.3 524.6 537.5 582.4 609.8Coarse grains . . . . . . . . . . . . . . . . . 828.6 810.3 871.8 799.5 873.6 801.9 908.1 898.9
Corn . . . . . . . . . . . . . . . . . . . . . 482.3 491.2 538.5 475.5 561.8 515.5 591.4 585.8Rice, milled. . . . . . . . . . . . . . . . . . . 352.0 354.7 355.7 355.5 364.5 371.2 379.9 381.4
Oils. . . . . . . . . . . . . . . . . . . . . . . . . . 58.3 61.0 61.7 63.7 70.1 73.0 74.9 77.2Soybeans . . . . . . . . . . . . . . . . . . . . . 104.2 107.4 117.4 117.8 137.7 125.0 131.6 152.2Rapeseed . . . . . . . . . . . . . . . . . . . . . 25.1 28.3 25.3 26.8 30.4 34.5 31.4 33.7
Pulses 1 2 . . . . . . . . . . . . . . . . . . . . . 58.4 53.4 51.0 55.7 57.2 55.3 55.3 57.7Vegetables and melons 1 . . . . . . . . . . . 461.4 462.4 478.6 509.5 532.9 559.9 589.1 595.6Fruits 1 . . . . . . . . . . . . . . . . . . . . . . . 352.2 350.8 379.0 384.7 390.4 404.9 426.7 429.4Nuts 1 . . . . . . . . . . . . . . . . . . . . . . . . 4.6 4.8 5.0 5.0 5.3 4.9 5.1 5.2
Red meat. . . . . . . . . . . . . . . . . . . . . . 116.0 117.8 118.6 117.7 119.9 124.4 128.6 130.2Poultry . . . . . . . . . . . . . . . . . . . . . . . 37.4 38.9 40.6 42.2 44.8 48.4 51.1 53.4Milk . . . . . . . . . . . . . . . . . . . . . . . . . 441.3 428.4 423.7 393.5 383.7 380.8 379.8 381.3
1 Data from Food and Agriculture Organization of the United Nations. 2 Edible seeds of peas, beans, lentils and similarcrops.
Source: U.S. Department of Agriculture, Economic Research Service, Agricultural Outlook, monthly.
No. 1381. Fisheries—Commercial Catch, by Country: 1990 to 1995[In thousands of metric tons, live weight. Catch of fish, crustaceans, mollusks (including weight of shells).
Does not include marine mammals and aquatic plants]
COUNTRY 1990 1993 1994 1995
World 1 . . . . . . . 97,854 103,172 100,538 112,910Canada. . . . . . . . . 1,626 1,212 1,089 901Chile . . . . . . . . . . 5,195 6,035 7,838 7,591China . . . . . . . . . . 12,095 17,568 20,719 24,433Denmark . . . . . . . . 1,518 1,656 1,916 2,041Iceland . . . . . . . . . 1,508 1,718 1,560 1,616India. . . . . . . . . . . 3,794 4,546 4,738 4,904Indonesia . . . . . . . 3,044 3,685 3,917 4,118Japan . . . . . . . . . . 10,354 8,081 7,396 6,758Korea, North (est.) . 1,753 1,782 1,802 1,850
COUNTRY 1990 1993 1994 1995
Korea, South . . . . . 1,745 2,649 2,700 2,688Mexico . . . . . . . . . 1,401 1,201 1,264 1,358Norway . . . . . . . . . 1,745 2,562 2,551 2,808Peru. . . . . . . . . . . 6,875 9,010 11,997 8,943Philippines. . . . . . . 2,210 2,264 2,276 2,269Russia . . . . . . . . . 7,808 4,461 3,781 4,374Spain . . . . . . . . . . 1,380 1,255 1,372 1,320Thailand . . . . . . . . 2,786 3,395 3,537 3,502United States . . . . 5,868 5,934 5,922 5,634Vietnam . . . . . . . . 960 1,100 1,150 1,200
1 Includes other countries, not shown separately.
Source: U.S. National Oceanic and Atmospheric Administration, National Marine Fisheries Service, Fisheries of the UnitedStates, annual. Data from Food and Agriculture Organization of the United Nations, Rome, Italy.
No. 1382. Meat Production, by Country: 1990 to 1997[In thousands of metric tons, carcass weight . Covers beef and veal (incl. buffalo meat), pork (incl. bacon and ham), mutton andlamb (incl. goat meat), horsemeat, and poultry. Refers to meat from animals slaughtered within the national boundaries irrespectiveof origin of animals, and relates to commercial and farm slaughter. Excludes lard, tallow, and edible offals. See text, Section 30,for general comments concerning the data]
COUNTRY 1990 1995 1996 1997
World 1 . . . . . 178,830 208,931 217,594 221,025Argentina. . . . . . 3,290 3,413 3,266 3,514Brazil . . . . . . . . 7,709 10,082 10,785 11,222China . . . . . . . . 28,584 52,622 59,114 62,001France . . . . . . . 5,744 6,306 6,524 6,321Germany . . . . . . 7,259 5,798 5,855 5,881India . . . . . . . . . 3,830 4,391 4,451 4,553
COUNTRY 1990 1995 1996 1997
Italy . . . . . . . . . 3,948 3,983 4,057 4,018Japan . . . . . . . . 3,503 3,201 3,081 3,028Mexico . . . . . . . 2,801 3,799 3,684 3,902Russia. . . . . . . . (X) 5,749 5,277 4,800Spain . . . . . . . . 3,467 3,975 4,133 3,986United Kingdom . 3,319 3,821 3,564 3,646United States . . 28,610 33,882 34,294 34,718
X Not applicable. 1 Includes other countries, not shown separately.
Source: Food and Agriculture Organization of the United Nations, Rome, Italy, FAOSTAT database.
Comparative International Statistics 849
U.S. Census Bureau, the Official StatisticsTM Statistical Abstract of the United States: 1998 Oct. 13, 1998
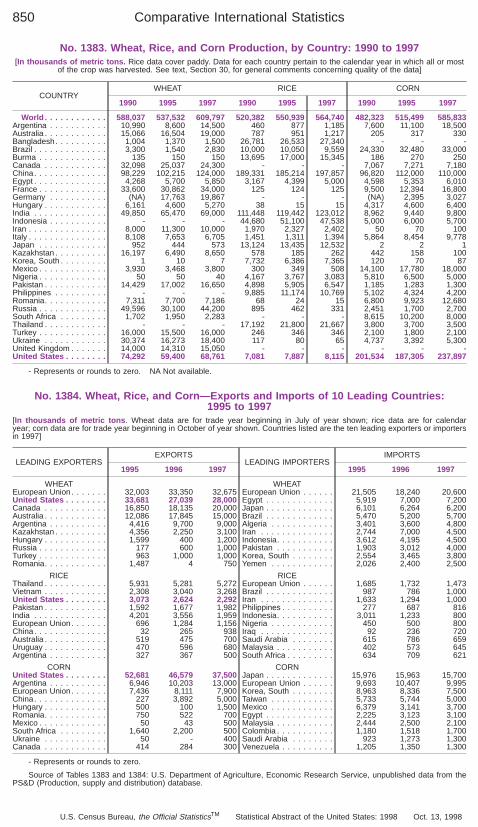
No. 1383. Wheat, Rice, and Corn Production, by Country: 1990 to 1997[In thousands of metric tons. Rice data cover paddy. Data for each country pertain to the calendar year in which all or most
of the crop was harvested. See text, Section 30, for general comments concerning quality of the data]
COUNTRYWHEAT RICE CORN
1990 1995 1997 1990 1995 1997 1990 1995 1997
World . . . . . . . . . . . . 588,037 537,532 609,797 520,382 550,939 564,740 482,323 515,499 585,833Argentina . . . . . . . . . . . 10,990 8,600 14,500 460 877 1,185 7,600 11,100 18,500Australia . . . . . . . . . . . . 15,066 16,504 19,000 787 951 1,217 205 317 330Bangladesh. . . . . . . . . . 1,004 1,370 1,500 26,781 26,533 27,340 - - -Brazil . . . . . . . . . . . . . . 3,300 1,540 2,830 10,000 10,050 9,559 24,330 32,480 33,000Burma . . . . . . . . . . . . . 135 150 150 13,695 17,000 15,345 186 270 250Canada . . . . . . . . . . . . 32,098 25,037 24,300 - - - 7,067 7,271 7,180China. . . . . . . . . . . . . . 98,229 102,215 124,000 189,331 185,214 197,857 96,820 112,000 110,000Egypt . . . . . . . . . . . . . . 4,268 5,700 5,850 3,167 4,399 5,000 4,598 5,353 6,010France . . . . . . . . . . . . . 33,600 30,862 34,000 125 124 125 9,500 12,394 16,800Germany . . . . . . . . . . . (NA) 17,763 19,867 - - - (NA) 2,395 3,027Hungary . . . . . . . . . . . . 6,161 4,600 5,270 38 15 15 4,317 4,600 6,400India . . . . . . . . . . . . . . 49,850 65,470 69,000 111,448 119,442 123,012 8,962 9,440 9,800Indonesia . . . . . . . . . . . - - - 44,680 51,100 47,538 5,000 6,000 5,700Iran . . . . . . . . . . . . . . . 8,000 11,300 10,000 1,970 2,327 2,402 50 70 100Italy . . . . . . . . . . . . . . . 8,108 7,653 6,705 1,451 1,311 1,394 5,864 8,454 9,778Japan . . . . . . . . . . . . . 952 444 573 13,124 13,435 12,532 2 2 1Kazakhstan . . . . . . . . . . 16,197 6,490 8,650 578 185 262 442 158 100Korea, South . . . . . . . . . 1 10 7 7,732 6,386 7,365 120 70 87Mexico . . . . . . . . . . . . . 3,930 3,468 3,800 300 349 508 14,100 17,780 18,000Nigeria . . . . . . . . . . . . . 50 50 40 4,167 3,767 3,083 5,810 6,500 5,000Pakistan . . . . . . . . . . . . 14,429 17,002 16,650 4,898 5,905 6,547 1,185 1,283 1,300Philippines . . . . . . . . . . - - - 9,885 11,174 10,769 5,102 4,324 4,200Romania. . . . . . . . . . . . 7,311 7,700 7,186 68 24 15 6,800 9,923 12,680Russia . . . . . . . . . . . . . 49,596 30,100 44,200 895 462 331 2,451 1,700 2,700South Africa . . . . . . . . . 1,702 1,950 2,283 - - - 8,615 10,200 8,000Thailand . . . . . . . . . . . . - - - 17,192 21,800 21,667 3,800 3,700 3,500Turkey . . . . . . . . . . . . . 16,000 15,500 16,000 246 346 346 2,100 1,800 2,100Ukraine . . . . . . . . . . . . 30,374 16,273 18,400 117 80 65 4,737 3,392 5,300United Kingdom . . . . . . . 14,000 14,310 15,050 - - - - - -United States . . . . . . . . 74,292 59,400 68,761 7,081 7,887 8,115 201,534 187,305 237,897
- Represents or rounds to zero. NA Not available.
No. 1384. Wheat, Rice, and Corn—Exports and Imports of 10 Leading Countries:1995 to 1997
[In thousands of metric tons . Wheat data are for trade year beginning in July of year shown; rice data are for calendaryear; corn data are for trade year beginning in October of year shown. Countries listed are the ten leading exporters or importersin 1997]
LEADING EXPORTERSEXPORTS
LEADING IMPORTERSIMPORTS
1995 1996 1997 1995 1996 1997
WHEAT WHEATEuropean Union. . . . . . . 32,003 33,350 32,675 European Union . . . . . . 21,505 18,240 20,600United States . . . . . . . . 33,681 27,039 28,000 Egypt . . . . . . . . . . . . . 5,919 7,000 7,200Canada . . . . . . . . . . . . 16,850 18,135 20,000 Japan . . . . . . . . . . . . . 6,101 6,264 6,200Australia . . . . . . . . . . . . 12,086 17,845 15,000 Brazil . . . . . . . . . . . . . 5,470 5,200 5,700Argentina . . . . . . . . . . . 4,416 9,700 9,000 Algeria . . . . . . . . . . . . 3,401 3,600 4,800Kazakhstan . . . . . . . . . . 4,356 2,250 3,100 Iran . . . . . . . . . . . . . . 2,744 7,000 4,500Hungary . . . . . . . . . . . . 1,599 400 1,200 Indonesia. . . . . . . . . . . 3,612 4,195 4,500Russia . . . . . . . . . . . . . 177 600 1,000 Pakistan . . . . . . . . . . . 1,903 3,012 4,000Turkey . . . . . . . . . . . . . 963 1,000 1,000 Korea, South . . . . . . . . 2,554 3,465 3,800Romania. . . . . . . . . . . . 1,487 4 750 Yemen . . . . . . . . . . . . 2,026 2,400 2,500
RICE RICEThailand . . . . . . . . . . . . 5,931 5,281 5,272 European Union . . . . . . 1,685 1,732 1,473Vietnam . . . . . . . . . . . . 2,308 3,040 3,268 Brazil . . . . . . . . . . . . . 987 786 1,000United States . . . . . . . . 3,073 2,624 2,292 Iran . . . . . . . . . . . . . . 1,633 1,294 1,000Pakistan . . . . . . . . . . . . 1,592 1,677 1,982 Philippines . . . . . . . . . . 277 687 816India . . . . . . . . . . . . . . 4,201 3,556 1,959 Indonesia. . . . . . . . . . . 3,011 1,233 800European Union. . . . . . . 696 1,284 1,156 Nigeria . . . . . . . . . . . . 450 500 800China. . . . . . . . . . . . . . 32 265 938 Iraq . . . . . . . . . . . . . . 92 236 720Australia . . . . . . . . . . . . 519 475 700 Saudi Arabia . . . . . . . . 615 786 659Uruguay . . . . . . . . . . . . 470 596 680 Malaysia . . . . . . . . . . . 402 573 645Argentina . . . . . . . . . . . 327 367 500 South Africa . . . . . . . . . 634 709 621
CORN CORNUnited States . . . . . . . . 52,681 46,579 37,500 Japan . . . . . . . . . . . . . 15,976 15,963 15,700Argentina . . . . . . . . . . . 6,946 10,203 13,000 European Union . . . . . . 9,693 10,407 9,995European Union. . . . . . . 7,436 8,111 7,900 Korea, South . . . . . . . . 8,963 8,336 7,500China. . . . . . . . . . . . . . 227 3,892 5,000 Taiwan . . . . . . . . . . . . 5,733 5,744 5,000Hungary . . . . . . . . . . . . 500 100 1,500 Mexico . . . . . . . . . . . . 6,379 3,141 3,700Romania. . . . . . . . . . . . 750 522 700 Egypt . . . . . . . . . . . . . 2,225 3,123 3,100Mexico . . . . . . . . . . . . . 50 43 500 Malaysia . . . . . . . . . . . 2,444 2,500 2,100South Africa . . . . . . . . . 1,640 2,200 500 Colombia . . . . . . . . . . . 1,180 1,518 1,700Ukraine . . . . . . . . . . . . 50 - 400 Saudi Arabia . . . . . . . . 923 1,273 1,300Canada . . . . . . . . . . . . 414 284 300 Venezuela . . . . . . . . . . 1,205 1,350 1,300
- Represents or rounds to zero.
Source of Tables 1383 and 1384: U.S. Department of Agriculture, Economic Research Service, unpublished data from thePS&D (Production, supply and distribution) database.
Comparative International Statistics850
U.S. Census Bureau, the Official StatisticsTM Statistical Abstract of the United States: 1998 Oct. 13, 1998
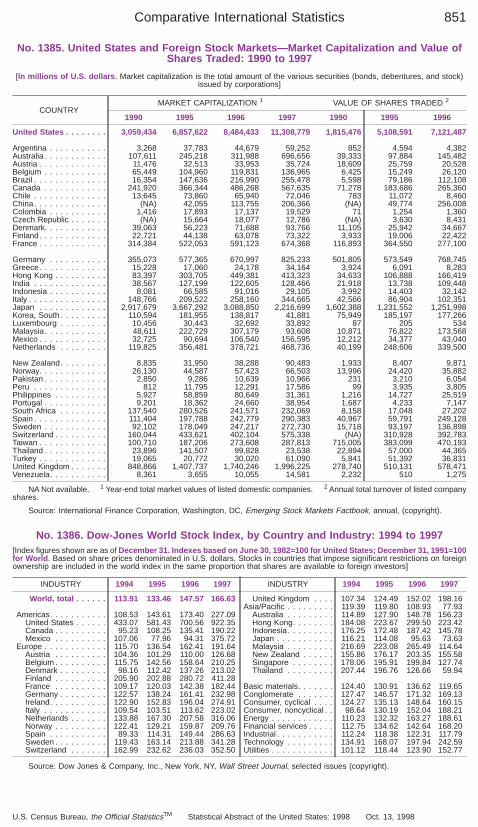
No. 1385. United States and Foreign Stock Markets—Market Capitalization and Value ofShares Traded: 1990 to 1997
[In millions of U.S. dollars . Market capitalization is the total amount of the various securities (bonds, debentures, and stock)issued by corporations]
COUNTRYMARKET CAPITALIZATION 1 VALUE OF SHARES TRADED 2
1990 1995 1996 1997 1990 1995 1996
United States . . . . . . . . 3,059,434 6,857,622 8,484,433 11,308,779 1,815,476 5,108,591 7,121,487
Argentina . . . . . . . . . . . 3,268 37,783 44,679 59,252 852 4,594 4,382Australia . . . . . . . . . . . . 107,611 245,218 311,988 696,656 39,333 97,884 145,482Austria . . . . . . . . . . . . . 11,476 32,513 33,953 35,724 18,609 25,759 20,528Belgium . . . . . . . . . . . . 65,449 104,960 119,831 136,965 6,425 15,249 26,120Brazil . . . . . . . . . . . . . . 16,354 147,636 216,990 255,478 5,598 79,186 112,108Canada . . . . . . . . . . . . 241,920 366,344 486,268 567,635 71,278 183,686 265,360Chile . . . . . . . . . . . . . . 13,645 73,860 65,940 72,046 783 11,072 8,460China. . . . . . . . . . . . . . (NA) 42,055 113,755 206,366 (NA) 49,774 256,008Colombia . . . . . . . . . . . 1,416 17,893 17,137 19,529 71 1,254 1,360Czech Republic . . . . . . . (NA) 15,664 18,077 12,786 (NA) 3,630 8,431Denmark. . . . . . . . . . . . 39,063 56,223 71,688 93,766 11,105 25,942 34,667Finland. . . . . . . . . . . . . 22,721 44,138 63,078 73,322 3,933 19,006 22,422France . . . . . . . . . . . . . 314,384 522,053 591,123 674,368 116,893 364,550 277,100
Germany . . . . . . . . . . . 355,073 577,365 670,997 825,233 501,805 573,549 768,745Greece. . . . . . . . . . . . . 15,228 17,060 24,178 34,164 3,924 6,091 8,283Hong Kong . . . . . . . . . . 83,397 303,705 449,381 413,323 34,633 106,888 166,419India . . . . . . . . . . . . . . 38,567 127,199 122,605 128,466 21,918 13,738 109,448Indonesia . . . . . . . . . . . 8,081 66,585 91,016 29,105 3,992 14,403 32,142Italy . . . . . . . . . . . . . . . 148,766 209,522 258,160 344,665 42,566 86,904 102,351Japan . . . . . . . . . . . . . 2,917,679 3,667,292 3,088,850 2,216,699 1,602,388 1,231,552 1,251,998Korea, South . . . . . . . . . 110,594 181,955 138,817 41,881 75,949 185,197 177,266Luxembourg . . . . . . . . . 10,456 30,443 32,692 33,892 87 205 534Malaysia . . . . . . . . . . . . 48,611 222,729 307,179 93,608 10,871 76,822 173,568Mexico . . . . . . . . . . . . . 32,725 90,694 106,540 156,595 12,212 34,377 43,040Netherlands . . . . . . . . . 119,825 356,481 378,721 468,736 40,199 248,606 339,500
New Zealand. . . . . . . . . 8,835 31,950 38,288 90,483 1,933 8,407 9,871Norway. . . . . . . . . . . . . 26,130 44,587 57,423 66,503 13,996 24,420 35,882Pakistan . . . . . . . . . . . . 2,850 9,286 10,639 10,966 231 3,210 6,054Peru . . . . . . . . . . . . . . 812 11,795 12,291 17,586 99 3,935 3,805Philippines . . . . . . . . . . 5,927 58,859 80,649 31,361 1,216 14,727 25,519Portugal . . . . . . . . . . . . 9,201 18,362 24,660 38,954 1,687 4,233 7,147South Africa . . . . . . . . . 137,540 280,526 241,571 232,069 8,158 17,048 27,202Spain . . . . . . . . . . . . . . 111,404 197,788 242,779 290,383 40,967 59,791 249,128Sweden . . . . . . . . . . . . 92,102 178,049 247,217 272,730 15,718 93,197 136,898Switzerland . . . . . . . . . . 160,044 433,621 402,104 575,338 (NA) 310,928 392,783Taiwan . . . . . . . . . . . . . 100,710 187,206 273,608 287,813 715,005 383,099 470,193Thailand . . . . . . . . . . . . 23,896 141,507 99,828 23,538 22,894 57,000 44,365Turkey . . . . . . . . . . . . . 19,065 20,772 30,020 61,090 5,841 51,392 36,831United Kingdom . . . . . . . 848,866 1,407,737 1,740,246 1,996,225 278,740 510,131 578,471Venezuela. . . . . . . . . . . 8,361 3,655 10,055 14,581 2,232 510 1,275
NA Not available. 1 Year-end total market values of listed domestic companies. 2 Annual total turnover of listed companyshares.
Source: International Finance Corporation, Washington, DC, Emerging Stock Markets Factbook, annual, (copyright).
No. 1386. Dow-Jones World Stock Index, by Country and Industry: 1994 to 1997[Index figures shown are as of December 31. Indexes based on June 30, 1982=100 for United States; December 31, 1991=100for World . Based on share prices denominated in U.S. dollars. Stocks in countries that impose significant restrictions on foreignownership are included in the world index in the same proportion that shares are available to foreign investors]
INDUSTRY 1994 1995 1996 1997
World, total . . . . . . 113.91 133.46 147.57 166.63
Americas. . . . . . . . . . . 108.53 143.61 173.40 227.09United States . . . . . . 433.07 581.43 700.56 922.35Canada . . . . . . . . . . 95.23 108.25 135.41 190.22Mexico . . . . . . . . . . 107.06 77.96 94.31 375.72
Europe . . . . . . . . . . . . 115.70 136.54 162.41 191.64Austria . . . . . . . . . . 104.36 101.29 110.00 126.68Belgium . . . . . . . . . . 115.75 142.56 158.64 210.25Denmark . . . . . . . . . 98.16 112.42 137.26 213.02Finland . . . . . . . . . . 205.90 202.88 280.72 411.28France . . . . . . . . . . 109.17 120.03 142.38 182.44Germany . . . . . . . . . 122.57 138.24 161.41 232.98Ireland. . . . . . . . . . . 122.90 152.83 196.04 274.91Italy . . . . . . . . . . . . 109.54 103.51 113.62 223.02Netherlands . . . . . . . 133.88 167.30 207.58 316.06Norway . . . . . . . . . . 122.41 129.21 159.87 209.76Spain . . . . . . . . . . . 89.33 114.31 149.44 286.63Sweden . . . . . . . . . . 119.43 163.14 213.88 341.28Switzerland . . . . . . . 162.99 232.62 236.03 352.50
INDUSTRY 1994 1995 1996 1997
United Kingdom . . . . 107.34 124.49 152.02 198.16Asia/Pacific . . . . . . . . . 119.39 119.80 108.93 77.93
Australia . . . . . . . . . 114.89 127.90 148.78 156.23Hong Kong. . . . . . . . 184.08 223.67 299.50 223.42Indonesia. . . . . . . . . 176.25 172.48 187.42 145.78Japan . . . . . . . . . . . 116.21 114.08 95.63 73.63Malaysia . . . . . . . . . 216.69 223.08 265.49 114.64New Zealand . . . . . . 155.86 176.17 203.35 155.58Singapore . . . . . . . . 178.06 195.91 199.84 127.74Thailand . . . . . . . . . 207.44 196.76 126.66 59.94
Basic materials. . . . . . . 124.40 130.91 136.62 119.65Conglomerate . . . . . . . 127.47 146.57 171.32 169.13Consumer, cyclical . . . . 124.27 135.13 148.64 160.15Consumer, noncyclical . . 98.64 130.19 152.04 188.21Energy . . . . . . . . . . . . 110.23 132.32 163.27 188.61Financial services . . . . . 112.75 134.62 142.64 168.20Industrial . . . . . . . . . . . 112.24 118.38 122.31 117.79Technology . . . . . . . . . 134.91 168.07 197.94 242.59Utilities . . . . . . . . . . . . 101.12 118.44 123.90 152.77
Source: Dow Jones & Company, Inc., New York, NY, Wall Street Journal, selected issues (copyright).
Comparative International Statistics 851
U.S. Census Bureau, the Official StatisticsTM Statistical Abstract of the United States: 1998 Oct. 13, 1998
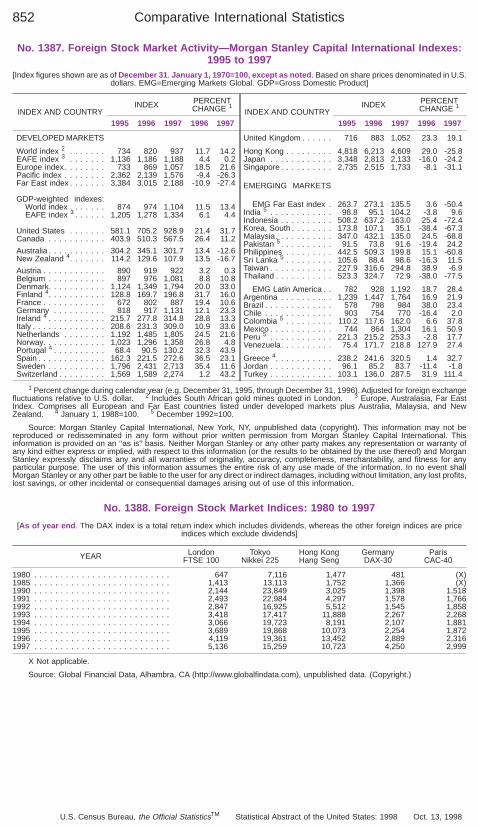
No. 1387. Foreign Stock Market Activity—Morgan Stanley Capital International Indexes:1995 to 1997
[Index figures shown are as of December 31 . January 1, 1970=100, except as noted . Based on share prices denominated in U.S.dollars. EMG=Emerging Markets Global. GDP=Gross Domestic Product]
INDEX AND COUNTRYINDEX PERCENT
CHANGE 1
1995 1996 1997 1996 1997
DEVELOPED MARKETS
World index 2 . . . . . . . 734 820 937 11.7 14.2EAFE index 3 . . . . . . . 1,136 1,186 1,188 4.4 0.2Europe index. . . . . . . . 733 869 1,057 18.5 21.6Pacific index . . . . . . . . 2,362 2,139 1,576 -9.4 -26.3Far East index . . . . . . . 3,384 3,015 2,188 -10.9 -27.4
GDP-weighted indexes:World index . . . . . . . 874 974 1,104 11.5 13.4EAFE index 3 . . . . . . 1,205 1,278 1,334 6.1 4.4
United States . . . . . . . 581.1 705.2 928.9 21.4 31.7Canada . . . . . . . . . . . 403.9 510.3 567.5 26.4 11.2
Australia . . . . . . . . . . . 304.2 345.1 301.7 13.4 -12.6New Zealand 4. . . . . . . 114.2 129.6 107.9 13.5 -16.7
Austria . . . . . . . . . . . . 890 919 922 3.2 0.3Belgium . . . . . . . . . . . 897 976 1,081 8.8 10.8Denmark. . . . . . . . . . . 1,124 1,349 1,794 20.0 33.0Finland 4. . . . . . . . . . . 128.8 169.7 196.8 31.7 16.0France . . . . . . . . . . . . 672 802 887 19.4 10.6Germany . . . . . . . . . . 818 917 1,131 12.1 23.3Ireland 4 . . . . . . . . . . . 215.7 277.8 314.8 28.8 13.3Italy . . . . . . . . . . . . . . 208.6 231.3 309.0 10.9 33.6Netherlands . . . . . . . . 1,192 1,485 1,805 24.5 21.6Norway. . . . . . . . . . . . 1,023 1,296 1,358 26.8 4.8Portugal 4 . . . . . . . . . . 68.4 90.5 130.2 32.3 43.9Spain . . . . . . . . . . . . . 162.3 221.5 272.6 36.5 23.1Sweden . . . . . . . . . . . 1,796 2,431 2,713 35.4 11.6Switzerland . . . . . . . . . 1,569 1,589 2,274 1.2 43.2
INDEX AND COUNTRYINDEX PERCENT
CHANGE 1
1995 1996 1997 1996 1997
United Kingdom . . . . . . 716 883 1,052 23.3 19.1
Hong Kong . . . . . . . . . 4,818 6,213 4,609 29.0 -25.8Japan . . . . . . . . . . . . 3,348 2,813 2,133 -16.0 -24.2Singapore . . . . . . . . . . 2,735 2,515 1,733 -8.1 -31.1
EMERGING MARKETS
EMG Far East index . 263.7 273.1 135.5 3.6 -50.4India 5 . . . . . . . . . . . . 98.8 95.1 104.2 -3.8 9.6Indonesia . . . . . . . . . . 508.2 637.2 163.0 25.4 -72.4Korea, South . . . . . . . . 173.8 107.1 35.1 -38.4 -67.3Malaysia . . . . . . . . . . . 347.0 432.1 135.0 24.5 -68.8Pakistan 5 . . . . . . . . . . 91.5 73.8 91.6 -19.4 24.2Philippines . . . . . . . . . 442.5 509.3 199.8 15.1 -60.8Sri Lanka 5 . . . . . . . . . 105.6 88.4 98.6 -16.3 11.5Taiwan . . . . . . . . . . . . 227.9 316.6 294.8 38.9 -6.9Thailand . . . . . . . . . . . 523.3 324.7 72.9 -38.0 -77.5
EMG Latin America . . 782 928 1,192 18.7 28.4Argentina . . . . . . . . . . 1,239 1,447 1,764 16.9 21.9Brazil . . . . . . . . . . . . . 578 798 984 38.0 23.4Chile . . . . . . . . . . . . . 903 754 770 -16.4 2.0Colombia 5 . . . . . . . . . 110.2 117.6 162.0 6.6 37.8Mexico . . . . . . . . . . . . 744 864 1,304 16.1 50.9Peru 5 . . . . . . . . . . . . 221.3 215.2 253.3 -2.8 17.7Venezuela. . . . . . . . . . 75.4 171.7 218.8 127.9 27.4
Greece 4. . . . . . . . . . . 238.2 241.6 320.5 1.4 32.7Jordan . . . . . . . . . . . . 96.1 85.2 83.7 -11.4 -1.8Turkey . . . . . . . . . . . . 103.1 136.0 287.5 31.9 111.4
1 Percent change during calendar year (e.g. December 31, 1995, through December 31, 1996). Adjusted for foreign exchangefluctuations relative to U.S. dollar. 2 Includes South African gold mines quoted in London. 3 Europe, Australasia, Far EastIndex. Comprises all European and Far East countries listed under developed markets plus Australia, Malaysia, and NewZealand. 4 January 1, 1988=100. 5 December 1992=100.
Source: Morgan Stanley Capital International, New York, NY, unpublished data (copyright). This information may not bereproduced or redisseminated in any form without prior written permission from Morgan Stanley Capital International. Thisinformation is provided on an ‘‘as is’’ basis. Neither Morgan Stanley or any other party makes any representation or warranty ofany kind either express or implied, with respect to this information (or the results to be obtained by the use thereof) and MorganStanley expressly disclaims any and all warranties of originality, accuracy, completeness, merchantability, and fitness for anyparticular purpose. The user of this information assumes the entire risk of any use made of the information. In no event shallMorgan Stanley or any other part be liable to the user for any direct or indirect damages, including without limitation, any lost profits,lost savings, or other incidental or consequential damages arising out of use of this information.
No. 1388. Foreign Stock Market Indices: 1980 to 1997
[As of year end . The DAX index is a total return index which includes dividends, whereas the other foreign indices are priceindices which exclude dividends]
YEAR LondonFTSE 100
TokyoNikkei 225
Hong KongHang Seng
GermanyDAX-30
ParisCAC-40
1980 . . . . . . . . . . . . . . . . . . . . . . . . . . 647 7,116 1,477 481 (X)1985 . . . . . . . . . . . . . . . . . . . . . . . . . . 1,413 13,113 1,752 1,366 (X)1990 . . . . . . . . . . . . . . . . . . . . . . . . . . 2,144 23,849 3,025 1,398 1,5181991 . . . . . . . . . . . . . . . . . . . . . . . . . . 2,493 22,984 4,297 1,578 1,7661992 . . . . . . . . . . . . . . . . . . . . . . . . . . 2,847 16,925 5,512 1,545 1,8581993 . . . . . . . . . . . . . . . . . . . . . . . . . . 3,418 17,417 11,888 2,267 2,2681994 . . . . . . . . . . . . . . . . . . . . . . . . . . 3,066 19,723 8,191 2,107 1,8811995 . . . . . . . . . . . . . . . . . . . . . . . . . . 3,689 19,868 10,073 2,254 1,8721996 . . . . . . . . . . . . . . . . . . . . . . . . . . 4,119 19,361 13,452 2,889 2,3161997 . . . . . . . . . . . . . . . . . . . . . . . . . . 5,136 15,259 10,723 4,250 2,999
X Not applicable.
Source: Global Financial Data, Alhambra, CA (http://www.globalfindata.com), unpublished data. (Copyright.)
Comparative International Statistics852
U.S. Census Bureau, the Official StatisticsTM Statistical Abstract of the United States: 1998 Oct. 13, 1998
No. 1389. Reserve Assets and International Transaction Balances, by Country:1995 to 1997
[The complete publication including this copyright table is available from the U.S. Government Printing Officeand the National Technical Information Service]
Comparative International Statistics 853
U.S. Census Bureau, the Official StatisticsTM Statistical Abstract of the United States: 1998 Oct. 13, 1998
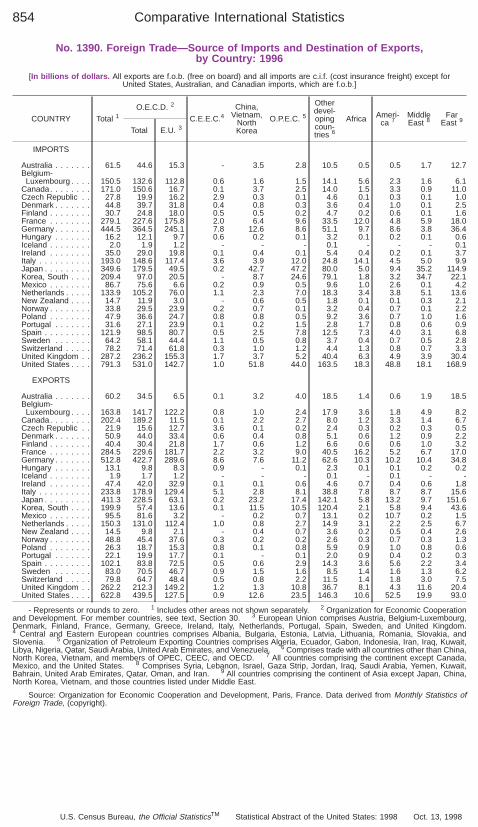
No. 1390. Foreign Trade—Source of Imports and Destination of Exports,by Country: 1996
[In billions of dollars. All exports are f.o.b. (free on board) and all imports are c.i.f. (cost insurance freight) except forUnited States, Australian, and Canadian imports, which are f.o.b.]
COUNTRY Total 1O.E.C.D. 2
C.E.E.C.4China,
Vietnam,NorthKorea
O.P.E.C. 5
Otherdevel-opingcoun-tries 6
Africa Ameri-ca 7
MiddleEast 8
FarEast 9
Total E.U. 3
IMPORTS
Australia . . . . . . . 61.5 44.6 15.3 - 3.5 2.8 10.5 0.5 0.5 1.7 12.7Belgium-
Luxembourg . . . . 150.5 132.6 112.8 0.6 1.6 1.5 14.1 5.6 2.3 1.6 6.1Canada. . . . . . . . 171.0 150.6 16.7 0.1 3.7 2.5 14.0 1.5 3.3 0.9 11.0Czech Republic . . 27.8 19.9 16.2 2.9 0.3 0.1 4.6 0.1 0.3 0.1 1.0Denmark . . . . . . . 44.8 39.7 31.8 0.4 0.8 0.3 3.6 0.4 1.0 0.1 2.5Finland . . . . . . . . 30.7 24.8 18.0 0.5 0.5 0.2 4.7 0.2 0.6 0.1 1.6France . . . . . . . . 279.1 227.6 175.8 2.0 6.4 9.6 33.5 12.0 4.8 5.9 18.0Germany . . . . . . . 444.5 364.5 245.1 7.8 12.6 8.6 51.1 9.7 8.6 3.8 36.4Hungary . . . . . . . 16.2 12.1 9.7 0.6 0.2 0.1 3.2 0.1 0.2 0.1 0.6Iceland . . . . . . . . 2.0 1.9 1.2 - - - 0.1 - - - 0.1Ireland . . . . . . . . 35.0 29.0 19.8 0.1 0.4 0.1 5.4 0.4 0.2 0.1 3.7Italy . . . . . . . . . . 193.0 148.6 117.4 3.6 3.9 12.0 24.8 14.1 4.5 5.0 9.9Japan . . . . . . . . . 349.6 179.5 49.5 0.2 42.7 47.2 80.0 5.0 9.4 35.2 114.9Korea, South . . . . 209.4 97.0 20.5 - 8.7 24.6 79.1 1.8 3.2 34.7 22.1Mexico . . . . . . . . 86.7 75.6 6.6 0.2 0.9 0.5 9.6 1.0 2.6 0.1 4.2Netherlands . . . . . 133.9 105.2 76.0 1.1 2.3 7.0 18.3 3.4 3.8 5.1 13.6New Zealand . . . . 14.7 11.9 3.0 - 0.6 0.5 1.8 0.1 0.1 0.3 2.1Norway . . . . . . . . 33.8 29.5 23.9 0.2 0.7 0.1 3.2 0.4 0.7 0.1 2.2Poland . . . . . . . . 47.9 36.6 24.7 0.8 0.8 0.5 9.2 3.6 0.7 1.0 1.6Portugal . . . . . . . 31.6 27.1 23.9 0.1 0.2 1.5 2.8 1.7 0.8 0.6 0.9Spain . . . . . . . . . 121.9 98.5 80.7 0.5 2.5 7.8 12.5 7.3 4.0 3.1 6.8Sweden . . . . . . . 64.2 58.1 44.4 1.1 0.5 0.8 3.7 0.4 0.7 0.5 2.8Switzerland . . . . . 78.2 71.4 61.8 0.3 1.0 1.2 4.4 1.3 0.8 0.7 3.3United Kingdom . . 287.2 236.2 155.3 1.7 3.7 5.2 40.4 6.3 4.9 3.9 30.4United States . . . . 791.3 531.0 142.7 1.0 51.8 44.0 163.5 18.3 48.8 18.1 168.9
EXPORTS
Australia . . . . . . . 60.2 34.5 6.5 0.1 3.2 4.0 18.5 1.4 0.6 1.9 18.5Belgium-
Luxembourg . . . . 163.8 141.7 122.2 0.8 1.0 2.4 17.9 3.6 1.8 4.9 8.2Canada. . . . . . . . 202.4 189.2 11.5 0.1 2.2 2.7 8.0 1.2 3.3 1.4 6.7Czech Republic . . 21.9 15.6 12.7 3.6 0.1 0.2 2.4 0.3 0.2 0.3 0.5Denmark . . . . . . . 50.9 44.0 33.4 0.6 0.4 0.8 5.1 0.6 1.2 0.9 2.2Finland . . . . . . . . 40.4 30.4 21.8 1.7 0.6 1.2 6.6 0.6 0.6 1.0 3.2France . . . . . . . . 284.5 229.6 181.7 2.2 3.2 9.0 40.5 16.2 5.2 6.7 17.0Germany . . . . . . . 512.8 422.7 289.6 8.6 7.6 11.2 62.6 10.3 10.2 10.4 34.8Hungary . . . . . . . 13.1 9.8 8.3 0.9 - 0.1 2.3 0.1 0.1 0.2 0.2Iceland . . . . . . . . 1.9 1.7 1.2 - - - 0.1 - 0.1 - -Ireland . . . . . . . . 47.4 42.0 32.9 0.1 0.1 0.6 4.6 0.7 0.4 0.6 1.8Italy . . . . . . . . . . 233.8 178.9 129.4 5.1 2.8 8.1 38.8 7.8 8.7 8.7 15.6Japan . . . . . . . . . 411.3 228.5 63.1 0.2 23.2 17.4 142.1 5.8 13.2 9.7 151.6Korea, South . . . . 199.9 57.4 13.6 0.1 11.5 10.5 120.4 2.1 5.8 9.4 43.6Mexico . . . . . . . . 95.5 81.6 3.2 - 0.2 0.7 13.1 0.2 10.7 0.2 1.5Netherlands . . . . . 150.3 131.0 112.4 1.0 0.8 2.7 14.9 3.1 2.2 2.5 6.7New Zealand . . . . 14.5 9.8 2.1 - 0.4 0.7 3.6 0.2 0.5 0.4 2.6Norway . . . . . . . . 48.8 45.4 37.6 0.3 0.2 0.2 2.6 0.3 0.7 0.3 1.3Poland . . . . . . . . 26.3 18.7 15.3 0.8 0.1 0.8 5.9 0.9 1.0 0.8 0.6Portugal . . . . . . . 22.1 19.9 17.7 0.1 - 0.1 2.0 0.9 0.4 0.2 0.3Spain . . . . . . . . . 102.1 83.8 72.5 0.5 0.6 2.9 14.3 3.6 5.6 2.2 3.4Sweden . . . . . . . 83.0 70.5 46.7 0.9 1.5 1.6 8.5 1.4 1.6 1.3 6.2Switzerland . . . . . 79.8 64.7 48.4 0.5 0.8 2.2 11.5 1.4 1.8 3.0 7.5United Kingdom . . 262.2 212.3 149.2 1.2 1.3 10.8 36.7 8.1 4.3 11.6 20.4United States . . . . 622.8 439.5 127.5 0.9 12.6 23.5 146.3 10.6 52.5 19.9 93.0
- Represents or rounds to zero. 1 Includes other areas not shown separately. 2 Organization for Economic Cooperationand Development. For member countries, see text, Section 30. 3 European Union comprises Austria, Belgium-Luxembourg,Denmark, Finland, France, Germany, Greece, Ireland, Italy, Netherlands, Portugal, Spain, Sweden, and United Kingdom.4 Central and Eastern European countries comprises Albania, Bulgaria, Estonia, Latvia, Lithuania, Romania, Slovakia, andSlovenia. 5 Organization of Petroleum Exporting Countries comprises Algeria, Ecuador, Gabon, Indonesia, Iran, Iraq, Kuwait,Libya, Nigeria, Qatar, Saudi Arabia, United Arab Emirates, and Venezuela. 6 Comprises trade with all countries other than China,North Korea, Vietnam, and members of OPEC, CEEC, and OECD. 7 All countries comprising the continent except Canada,Mexico, and the United States. 8 Comprises Syria, Lebanon, Israel, Gaza Strip, Jordan, Iraq, Saudi Arabia, Yemen, Kuwait,Bahrain, United Arab Emirates, Qatar, Oman, and Iran. 9 All countries comprising the continent of Asia except Japan, China,North Korea, Vietnam, and those countries listed under Middle East.
Source: Organization for Economic Cooperation and Development, Paris, France. Data derived from Monthly Statistics ofForeign Trade, (copyright).
Comparative International Statistics854
U.S. Census Bureau, the Official StatisticsTM Statistical Abstract of the United States: 1998 Oct. 13, 1998
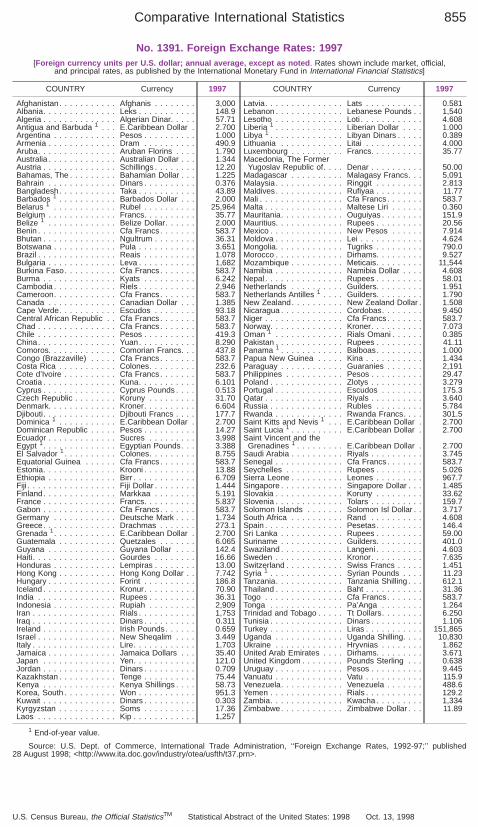
No. 1391. Foreign Exchange Rates: 1997[Foreign currency units per U.S. dollar; annual average, except as noted . Rates shown include market, official,
and principal rates, as published by the International Monetary Fund in International Financial Statistics]
COUNTRY Currency 1997
Afghanistan. . . . . . . . . . . Afghanis . . . . . . . . 3,000Albania. . . . . . . . . . . . . . Leks . . . . . . . . . . . 148.9Algeria . . . . . . . . . . . . . . Algerian Dinar. . . . . 57.71Antigua and Barbuda 1 . . . E.Caribbean Dollar . 2.700Argentina . . . . . . . . . . . . Pesos . . . . . . . . . . 1.000Armenia . . . . . . . . . . . . . Dram . . . . . . . . . . 490.9Aruba. . . . . . . . . . . . . . . Aruban Florins . . . . 1.790Australia . . . . . . . . . . . . . Australian Dollar . . . 1.344Austria . . . . . . . . . . . . . . Schillings . . . . . . . . 12.20Bahamas, The . . . . . . . . . Bahamian Dollar . . . 1.225Bahrain . . . . . . . . . . . . . Dinars . . . . . . . . . . 0.376Bangladesh. . . . . . . . . . . Taka . . . . . . . . . . . 43.89Barbados 1 . . . . . . . . . . . Barbados Dollar . . . 2.000Belarus 1 . . . . . . . . . . . . Rubel . . . . . . . . . . 25,964Belgium . . . . . . . . . . . . . Francs. . . . . . . . . . 35.77Belize 1 . . . . . . . . . . . . . Belize Dollar. . . . . . 2.000Benin . . . . . . . . . . . . . . . Cfa Francs. . . . . . . 583.7Bhutan . . . . . . . . . . . . . . Ngultrum . . . . . . . . 36.31Botswana . . . . . . . . . . . . Pula . . . . . . . . . . . 3.651Brazil . . . . . . . . . . . . . . . Reais . . . . . . . . . . 1.078Bulgaria . . . . . . . . . . . . . Leva . . . . . . . . . . . 1,682Burkina Faso. . . . . . . . . . Cfa Francs. . . . . . . 583.7Burma . . . . . . . . . . . . . . Kyats . . . . . . . . . . 6.242Cambodia . . . . . . . . . . . . Riels . . . . . . . . . . . 2,946Cameroon. . . . . . . . . . . . Cfa Francs. . . . . . . 583.7Canada . . . . . . . . . . . . . Canadian Dollar . . . 1.385Cape Verde. . . . . . . . . . . Escudos . . . . . . . . 93.18Central African Republic . . Cfa Francs. . . . . . . 583.7Chad . . . . . . . . . . . . . . . Cfa Francs. . . . . . . 583.7Chile . . . . . . . . . . . . . . . Pesos . . . . . . . . . . 419.3China. . . . . . . . . . . . . . . Yuan. . . . . . . . . . . 8.290Comoros. . . . . . . . . . . . . Comorian Francs. . . 437.8Congo (Brazzaville) . . . . . Cfa Francs. . . . . . . 583.7Costa Rica . . . . . . . . . . . Colones. . . . . . . . . 232.6Cote d’Ivoire . . . . . . . . . . Cfa Francs. . . . . . . 583.7Croatia . . . . . . . . . . . . . . Kuna. . . . . . . . . . . 6.101Cyprus . . . . . . . . . . . . . . Cyprus Pounds . . . . 0.513Czech Republic . . . . . . . . Koruny . . . . . . . . . 31.70Denmark. . . . . . . . . . . . . Kroner. . . . . . . . . . 6.604Djibouti. . . . . . . . . . . . . . Djibouti Francs . . . . 177.7Dominica 1 . . . . . . . . . . . E.Caribbean Dollar . 2.700Dominican Republic . . . . . Pesos . . . . . . . . . . 14.27Ecuador . . . . . . . . . . . . . Sucres . . . . . . . . . 3,998Egypt 1. . . . . . . . . . . . . . Egyptian Pounds. . . 3.388El Salvador 1 . . . . . . . . . . Colones. . . . . . . . . 8.755Equatorial Guinea . . . . . . Cfa Francs. . . . . . . 583.7Estonia. . . . . . . . . . . . . . Krooni . . . . . . . . . . 13.88Ethiopia . . . . . . . . . . . . . Birr . . . . . . . . . . . . 6.709Fiji . . . . . . . . . . . . . . . . . Fiji Dollar . . . . . . . . 1.444Finland. . . . . . . . . . . . . . Markkaa . . . . . . . . 5.191France . . . . . . . . . . . . . . Francs. . . . . . . . . . 5.837Gabon . . . . . . . . . . . . . . Cfa Francs. . . . . . . 583.7Germany . . . . . . . . . . . . Deutsche Mark . . . . 1.734Greece. . . . . . . . . . . . . . Drachmas . . . . . . . 273.1Grenada 1. . . . . . . . . . . . E.Caribbean Dollar . 2.700Guatemala . . . . . . . . . . . Quetzales . . . . . . . 6.065Guyana . . . . . . . . . . . . . Guyana Dollar . . . . 142.4Haiti. . . . . . . . . . . . . . . . Gourdes . . . . . . . . 16.66Honduras . . . . . . . . . . . . Lempiras . . . . . . . . 13.00Hong Kong . . . . . . . . . . . Hong Kong Dollar . . 7.742Hungary . . . . . . . . . . . . . Forint . . . . . . . . . . 186.8Iceland . . . . . . . . . . . . . . Kronur. . . . . . . . . . 70.90India . . . . . . . . . . . . . . . Rupees . . . . . . . . . 36.31Indonesia . . . . . . . . . . . . Rupiah . . . . . . . . . 2,909Iran . . . . . . . . . . . . . . . . Rials . . . . . . . . . . . 1,753Iraq . . . . . . . . . . . . . . . . Dinars . . . . . . . . . . 0.311Ireland . . . . . . . . . . . . . . Irish Pounds. . . . . . 0.659Israel . . . . . . . . . . . . . . . New Sheqalim . . . . 3.449Italy . . . . . . . . . . . . . . . . Lire. . . . . . . . . . . . 1,703Jamaica . . . . . . . . . . . . . Jamaica Dollars . . . 35.40Japan . . . . . . . . . . . . . . Yen. . . . . . . . . . . . 121.0Jordan . . . . . . . . . . . . . . Dinars . . . . . . . . . . 0.709Kazakhstan . . . . . . . . . . . Tenge . . . . . . . . . . 75.44Kenya . . . . . . . . . . . . . . Kenya Shillings . . . . 58.73Korea, South . . . . . . . . . . Won . . . . . . . . . . . 951.3Kuwait . . . . . . . . . . . . . . Dinars . . . . . . . . . . 0.303Kyrgyzstan . . . . . . . . . . . Soms . . . . . . . . . . 17.36Laos . . . . . . . . . . . . . . . Kip . . . . . . . . . . . . 1,257
COUNTRY Currency 1997
Latvia. . . . . . . . . . . . . . . Lats . . . . . . . . . . . 0.581Lebanon . . . . . . . . . . . . . Lebanese Pounds . . 1,540Lesotho . . . . . . . . . . . . . Loti . . . . . . . . . . . . 4.608Liberia 1 . . . . . . . . . . . . . Liberian Dollar . . . . 1.000Libya 1 . . . . . . . . . . . . . . Libyan Dinars . . . . . 0.389Lithuania . . . . . . . . . . . . Litai . . . . . . . . . . . 4.000Luxembourg . . . . . . . . . . Francs. . . . . . . . . . 35.77Macedonia, The Former
Yugoslav Republic of. . . . Denar . . . . . . . . . . 50.00Madagascar . . . . . . . . . . Malagasy Francs. . . 5,091Malaysia . . . . . . . . . . . . . Ringgit . . . . . . . . . 2.813Maldives. . . . . . . . . . . . . Rufiyaa . . . . . . . . . 11.77Mali . . . . . . . . . . . . . . . . Cfa Francs. . . . . . . 583.7Malta . . . . . . . . . . . . . . . Maltese Liri . . . . . . 0.360Mauritania. . . . . . . . . . . . Ouguiyas . . . . . . . . 151.9Mauritius. . . . . . . . . . . . . Rupees . . . . . . . . . 20.56Mexico . . . . . . . . . . . . . . New Pesos . . . . . . 7.914Moldova . . . . . . . . . . . . . Lei . . . . . . . . . . . . 4.624Mongolia. . . . . . . . . . . . . Tugriks . . . . . . . . . 790.0Morocco . . . . . . . . . . . . . Dirhams. . . . . . . . . 9.527Mozambique . . . . . . . . . . Meticais. . . . . . . . . 11,544Namibia . . . . . . . . . . . . . Namibia Dollar . . . . 4.608Nepal . . . . . . . . . . . . . . . Rupees . . . . . . . . . 58.01Netherlands . . . . . . . . . . Guilders. . . . . . . . . 1.951Netherlands Antilles 1 . . . . Guilders. . . . . . . . . 1.790New Zealand. . . . . . . . . . New Zealand Dollar . 1.508Nicaragua . . . . . . . . . . . . Cordobas. . . . . . . . 9.450Niger . . . . . . . . . . . . . . . Cfa Francs. . . . . . . 583.7Norway. . . . . . . . . . . . . . Kroner. . . . . . . . . . 7.073Oman 1 . . . . . . . . . . . . . Rials Omani . . . . . . 0.385Pakistan . . . . . . . . . . . . . Rupees . . . . . . . . . 41.11Panama 1 . . . . . . . . . . . . Balboas. . . . . . . . . 1.000Papua New Guinea . . . . . Kina . . . . . . . . . . . 1.434Paraguay . . . . . . . . . . . . Guaranies . . . . . . . 2,191Philippines . . . . . . . . . . . Pesos . . . . . . . . . . 29.47Poland . . . . . . . . . . . . . . Zlotys . . . . . . . . . . 3.279Portugal . . . . . . . . . . . . . Escudos . . . . . . . . 175.3Qatar . . . . . . . . . . . . . . . Riyals . . . . . . . . . . 3.640Russia . . . . . . . . . . . . . . Rubles . . . . . . . . . 5.784Rwanda . . . . . . . . . . . . . Rwanda Francs. . . . 301.5Saint Kitts and Nevis 1 . . . E.Caribbean Dollar . 2.700Saint Lucia 1 . . . . . . . . . . E.Caribbean Dollar . 2.700Saint Vincent and the
Grenadines 1 . . . . . . . . . E.Caribbean Dollar . 2.700Saudi Arabia . . . . . . . . . . Riyals . . . . . . . . . . 3.745Senegal . . . . . . . . . . . . . Cfa Francs. . . . . . . 583.7Seychelles . . . . . . . . . . . Rupees . . . . . . . . . 5.026Sierra Leone . . . . . . . . . . Leones . . . . . . . . . 967.7Singapore . . . . . . . . . . . . Singapore Dollar . . . 1.485Slovakia . . . . . . . . . . . . . Koruny . . . . . . . . . 33.62Slovenia . . . . . . . . . . . . . Tolars . . . . . . . . . . 159.7Solomon Islands . . . . . . . Solomon Isl Dollar . . 3.717South Africa . . . . . . . . . . Rand . . . . . . . . . . 4.608Spain . . . . . . . . . . . . . . . Pesetas. . . . . . . . . 146.4Sri Lanka . . . . . . . . . . . . Rupees . . . . . . . . . 59.00Suriname . . . . . . . . . . . . Guilders. . . . . . . . . 401.0Swaziland . . . . . . . . . . . . Langeni . . . . . . . . . 4.603Sweden . . . . . . . . . . . . . Kronor. . . . . . . . . . 7.635Switzerland . . . . . . . . . . . Swiss Francs . . . . . 1.451Syria 1 . . . . . . . . . . . . . . Syrian Pounds . . . . 11.23Tanzania. . . . . . . . . . . . . Tanzania Shilling . . . 612.1Thailand . . . . . . . . . . . . . Baht . . . . . . . . . . . 31.36Togo . . . . . . . . . . . . . . . Cfa Francs. . . . . . . 583.7Tonga . . . . . . . . . . . . . . Pa’Anga . . . . . . . . 1.264Trinidad and Tobago . . . . . Tt Dollars. . . . . . . . 6.250Tunisia . . . . . . . . . . . . . . Dinars . . . . . . . . . . 1.106Turkey . . . . . . . . . . . . . . Liras . . . . . . . . . . . 151,865Uganda . . . . . . . . . . . . . Uganda Shilling. . . . 10,830Ukraine . . . . . . . . . . . . . Hryvnias . . . . . . . . 1.862United Arab Emirates . . . . Dirhams. . . . . . . . . 3.671United Kingdom . . . . . . . . Pounds Sterling . . . 0.638Uruguay . . . . . . . . . . . . . Pesos . . . . . . . . . . 9.445Vanuatu . . . . . . . . . . . . . Vatu . . . . . . . . . . . 115.9Venezuela. . . . . . . . . . . . Venezuela . . . . . . . 488.6Yemen . . . . . . . . . . . . . . Rials . . . . . . . . . . . 129.2Zambia. . . . . . . . . . . . . . Kwacha . . . . . . . . . 1,334Zimbabwe. . . . . . . . . . . . Zimbabwe Dollar . . . 11.89
1 End-of-year value.
Source: U.S. Dept. of Commerce, International Trade Administration, ‘‘Foreign Exchange Rates, 1992-97;’’ published28 August 1998; <http://www.ita.doc.gov/industry/otea/usfth/t37.prn>.
Comparative International Statistics 855
U.S. Census Bureau, the Official StatisticsTM Statistical Abstract of the United States: 1998 Oct. 13, 1998
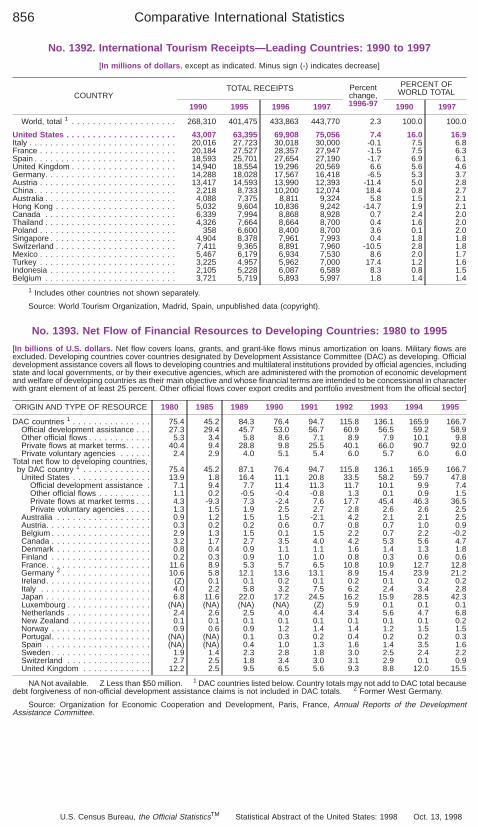
No. 1392. International Tourism Receipts—Leading Countries: 1990 to 1997
[In millions of dollars , except as indicated. Minus sign (-) indicates decrease]
COUNTRYTOTAL RECEIPTS Percent
change,1996-97
PERCENT OFWORLD TOTAL
1990 1995 1996 1997 1990 1997
World, total 1 . . . . . . . . . . . . . . . . . . . . 268,310 401,475 433,863 443,770 2.3 100.0 100.0
United States . . . . . . . . . . . . . . . . . . . . . 43,007 63,395 69,908 75,056 7.4 16.0 16.9Italy . . . . . . . . . . . . . . . . . . . . . . . . . . . . 20,016 27,723 30,018 30,000 -0.1 7.5 6.8France . . . . . . . . . . . . . . . . . . . . . . . . . . 20,184 27,527 28,357 27,947 -1.5 7.5 6.3Spain . . . . . . . . . . . . . . . . . . . . . . . . . . . 18,593 25,701 27,654 27,190 -1.7 6.9 6.1United Kingdom . . . . . . . . . . . . . . . . . . . . 14,940 18,554 19,296 20,569 6.6 5.6 4.6Germany. . . . . . . . . . . . . . . . . . . . . . . . . 14,288 18,028 17,567 16,418 -6.5 5.3 3.7Austria . . . . . . . . . . . . . . . . . . . . . . . . . . 13,417 14,593 13,990 12,393 -11.4 5.0 2.8China . . . . . . . . . . . . . . . . . . . . . . . . . . . 2,218 8,733 10,200 12,074 18.4 0.8 2.7Australia . . . . . . . . . . . . . . . . . . . . . . . . . 4,088 7,375 8,811 9,324 5.8 1.5 2.1Hong Kong . . . . . . . . . . . . . . . . . . . . . . . 5,032 9,604 10,836 9,242 -14.7 1.9 2.1Canada . . . . . . . . . . . . . . . . . . . . . . . . . 6,339 7,994 8,868 8,928 0.7 2.4 2.0Thailand . . . . . . . . . . . . . . . . . . . . . . . . . 4,326 7,664 8,664 8,700 0.4 1.6 2.0Poland . . . . . . . . . . . . . . . . . . . . . . . . . . 358 6,600 8,400 8,700 3.6 0.1 2.0Singapore . . . . . . . . . . . . . . . . . . . . . . . . 4,904 8,378 7,961 7,993 0.4 1.8 1.8Switzerland . . . . . . . . . . . . . . . . . . . . . . . 7,411 9,365 8,891 7,960 -10.5 2.8 1.8Mexico . . . . . . . . . . . . . . . . . . . . . . . . . . 5,467 6,179 6,934 7,530 8.6 2.0 1.7Turkey . . . . . . . . . . . . . . . . . . . . . . . . . . 3,225 4,957 5,962 7,000 17.4 1.2 1.6Indonesia . . . . . . . . . . . . . . . . . . . . . . . . 2,105 5,228 6,087 6,589 8.3 0.8 1.5Belgium . . . . . . . . . . . . . . . . . . . . . . . . . 3,721 5,719 5,893 5,997 1.8 1.4 1.4
1 Includes other countries not shown separately.
Source: World Tourism Organization, Madrid, Spain, unpublished data (copyright).
No. 1393. Net Flow of Financial Resources to Developing Countries: 1980 to 1995
[In billions of U.S. dollars. Net flow covers loans, grants, and grant-like flows minus amortization on loans. Military flows areexcluded. Developing countries cover countries designated by Development Assistance Committee (DAC) as developing. Officialdevelopment assistance covers all flows to developing countries and multilateral institutions provided by official agencies, includingstate and local governments, or by their executive agencies, which are administered with the promotion of economic developmentand welfare of developing countries as their main objective and whose financial terms are intended to be concessional in characterwith grant element of at least 25 percent. Other official flows cover export credits and portfolio investment from the official sector]
ORIGIN AND TYPE OF RESOURCE 1980 1985 1989 1990 1991 1992 1993 1994 1995
DAC countries 1 . . . . . . . . . . . . . . . 75.4 45.2 84.3 76.4 94.7 115.8 136.1 165.9 166.7Official development assistance . . . 27.3 29.4 45.7 53.0 56.7 60.9 56.5 59.2 58.9Other official flows . . . . . . . . . . . . 5.3 3.4 5.8 8.6 7.1 8.9 7.9 10.1 9.8Private flows at market terms. . . . . 40.4 9.4 28.8 9.8 25.5 40.1 66.0 90.7 92.0Private voluntary agencies . . . . . . 2.4 2.9 4.0 5.1 5.4 6.0 5.7 6.0 6.0
Total net flow to developing countries,by DAC country 1 . . . . . . . . . . . . . 75.4 45.2 87.1 76.4 94.7 115.8 136.1 165.9 166.7
United States . . . . . . . . . . . . . . . 13.9 1.8 16.4 11.1 20.8 33.5 58.2 59.7 47.8Official development assistance . 7.1 9.4 7.7 11.4 11.3 11.7 10.1 9.9 7.4Other official flows . . . . . . . . . . 1.1 0.2 -0.5 -0.4 -0.8 1.3 0.1 0.9 1.5Private flows at market terms . . . 4.3 -9.3 7.3 -2.4 7.6 17.7 45.4 46.3 36.5Private voluntary agencies . . . . . 1.3 1.5 1.9 2.5 2.7 2.8 2.6 2.6 2.5
Australia . . . . . . . . . . . . . . . . . . 0.9 1.2 1.5 1.5 -2.1 4.2 2.1 2.1 2.5Austria. . . . . . . . . . . . . . . . . . . . 0.3 0.2 0.2 0.6 0.7 0.8 0.7 1.0 0.9Belgium . . . . . . . . . . . . . . . . . . . 2.9 1.3 1.5 0.1 1.5 2.2 0.7 2.2 -0.2Canada . . . . . . . . . . . . . . . . . . . 3.2 1.7 2.7 3.5 4.0 4.2 5.3 5.6 4.7Denmark . . . . . . . . . . . . . . . . . . 0.8 0.4 0.9 1.1 1.1 1.6 1.4 1.3 1.8Finland . . . . . . . . . . . . . . . . . . . 0.2 0.3 0.9 1.0 1.0 0.8 0.3 0.6 0.6France. . . . . . . . . . . . . . . . . . . . 11.6 8.9 5.3 5.7 6.5 10.8 10.9 12.7 12.8Germany 2 . . . . . . . . . . . . . . . . . 10.6 5.8 12.1 13.6 13.1 8.9 15.4 23.9 21.2Ireland. . . . . . . . . . . . . . . . . . . . (Z) 0.1 0.1 0.2 0.1 0.2 0.1 0.2 0.2Italy . . . . . . . . . . . . . . . . . . . . . 4.0 2.2 5.8 3.2 7.5 6.2 2.4 3.4 2.8Japan . . . . . . . . . . . . . . . . . . . . 6.8 11.6 22.0 17.2 24.5 16.2 15.9 28.5 42.3Luxembourg . . . . . . . . . . . . . . . . (NA) (NA) (NA) (NA) (Z) 5.9 0.1 0.1 0.1Netherlands . . . . . . . . . . . . . . . . 2.4 2.6 2.5 4.0 4.4 3.4 5.6 4.7 6.8New Zealand . . . . . . . . . . . . . . . 0.1 0.1 0.1 0.1 0.1 0.1 0.1 0.1 0.2Norway . . . . . . . . . . . . . . . . . . . 0.9 0.6 0.9 1.2 1.4 1.4 1.2 1.5 1.5Portugal. . . . . . . . . . . . . . . . . . . (NA) (NA) 0.1 0.3 0.2 0.4 0.2 0.2 0.3Spain . . . . . . . . . . . . . . . . . . . . (NA) (NA) 0.4 1.0 1.3 1.6 1.4 3.5 1.6Sweden . . . . . . . . . . . . . . . . . . . 1.9 1.4 2.3 2.8 1.8 3.0 2.5 2.4 2.2Switzerland . . . . . . . . . . . . . . . . 2.7 2.5 1.8 3.4 3.0 3.1 2.9 0.1 0.9United Kingdom . . . . . . . . . . . . . 12.2 2.5 9.5 6.5 5.6 9.3 8.8 12.0 15.5
NA Not available. Z Less than $50 million. 1 DAC countries listed below. Country totals may not add to DAC total becausedebt forgiveness of non-official development assistance claims is not included in DAC totals. 2 Former West Germany.
Source: Organization for Economic Cooperation and Development, Paris, France, Annual Reports of the DevelopmentAssistance Committee.
Comparative International Statistics856
U.S. Census Bureau, the Official StatisticsTM Statistical Abstract of the United States: 1998 Oct. 13, 1998
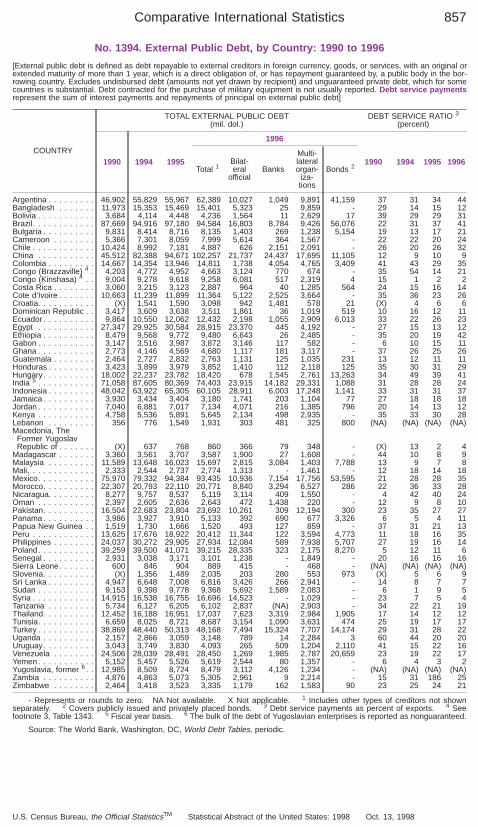
No. 1394. External Public Debt, by Country: 1990 to 1996
[External public debt is defined as debt repayable to external creditors in foreign currency, goods, or services, with an original orextended maturity of more than 1 year, which is a direct obligation of, or has repayment guaranteed by, a public body in the bor-rowing country. Excludes undisbursed debt (amounts not yet drawn by recipient) and unguaranteed private debt, which for somecountries is substantial. Debt contracted for the purchase of military equipment is not usually reported. Debt service paymentsrepresent the sum of interest payments and repayments of principal on external public debt]
COUNTRY
TOTAL EXTERNAL PUBLIC DEBT(mil. dol.)
DEBT SERVICE RATIO 3
(percent)
1990 1994 1995
1996
1990 1994 1995 1996Total 1
Bilat-eral
officialBanks
Multi-lateralorgan-
iza-tions
Bonds 2
Argentina . . . . . . . . . 46,902 55,829 55,967 62,389 10,027 1,049 9,891 41,159 37 31 34 44Bangladesh . . . . . . . 11,973 15,353 15,469 15,401 5,323 25 9,859 - 29 14 15 12Bolivia . . . . . . . . . . . 3,684 4,114 4,448 4,236 1,564 11 2,629 17 39 29 29 31Brazil. . . . . . . . . . . . 87,669 94,916 97,180 94,584 16,803 8,784 9,426 56,076 22 31 37 41Bulgaria . . . . . . . . . . 9,831 8,414 8,716 8,135 1,403 269 1,238 5,154 19 13 17 21Cameroon . . . . . . . . 5,366 7,301 8,059 7,999 5,614 364 1,567 - 22 22 20 24Chile . . . . . . . . . . . . 10,424 8,992 7,181 4,887 626 2,151 2,091 - 26 20 26 32China . . . . . . . . . . . 45,512 82,388 94,671 102,257 21,737 24,437 17,695 11,105 12 9 10 9Colombia . . . . . . . . . 14,667 14,354 13,946 14,811 1,738 4,054 4,765 3,409 41 43 29 35Congo (Brazzaville) 4 . 4,203 4,772 4,952 4,663 3,124 770 674 - 35 54 14 21Congo (Kinshasa) 4 . . 9,004 9,278 9,618 9,258 6,081 517 2,319 4 15 1 2 2Costa Rica . . . . . . . . 3,060 3,215 3,123 2,887 964 40 1,285 564 24 15 16 14Cote d’Ivoire . . . . . . . 10,663 11,239 11,899 11,364 5,122 2,525 3,664 - 35 36 23 26Croatia. . . . . . . . . . . (X) 1,541 1,590 3,098 942 1,481 578 21 (X) 4 6 6Dominican Republic . . 3,417 3,609 3,638 3,511 1,861 36 1,019 519 10 16 12 11Ecuador . . . . . . . . . . 9,864 10,550 12,062 12,432 2,198 1,055 2,909 6,013 33 22 26 23Egypt . . . . . . . . . . . 27,347 29,925 30,584 28,915 23,370 445 4,192 - 27 15 13 12Ethiopia . . . . . . . . . . 8,479 9,568 9,772 9,480 6,643 26 2,485 - 35 20 19 42Gabon . . . . . . . . . . . 3,147 3,516 3,987 3,872 3,146 117 582 - 6 10 15 11Ghana . . . . . . . . . . . 2,773 4,146 4,569 4,680 1,117 181 3,117 - 37 26 25 26Guatemala . . . . . . . . 2,464 2,727 2,832 2,763 1,131 125 1,035 231 13 12 11 11Honduras . . . . . . . . . 3,423 3,899 3,979 3,852 1,410 112 2,118 125 35 30 31 29Hungary. . . . . . . . . . 18,002 22,237 23,782 18,420 678 1,545 2,761 13,263 34 49 39 41India 5 . . . . . . . . . . . 71,058 87,605 80,369 74,403 23,915 14,182 29,331 1,088 31 28 28 24Indonesia . . . . . . . . . 48,042 63,922 65,305 60,105 28,911 6,003 17,248 1,141 33 31 31 37Jamaica . . . . . . . . . . 3,930 3,434 3,404 3,180 1,741 203 1,104 77 27 18 18 18Jordan . . . . . . . . . . . 7,040 6,881 7,017 7,134 4,071 216 1,385 796 20 14 13 12Kenya . . . . . . . . . . . 4,758 5,536 5,891 5,645 2,134 498 2,935 - 35 33 30 28Lebanon . . . . . . . . . 356 776 1,549 1,931 303 481 325 800 (NA) (NA) (NA) (NA)Macedonia, The
Former YugoslavRepublic of . . . . . . . (X) 637 768 860 366 79 348 - (X) 13 2 4
Madagascar . . . . . . . 3,360 3,561 3,707 3,587 1,900 27 1,608 - 44 10 8 9Malaysia . . . . . . . . . 11,589 13,648 16,023 15,697 2,815 3,084 1,403 7,788 13 9 7 8Mali. . . . . . . . . . . . . 2,333 2,544 2,737 2,774 1,313 - 1,461 - 12 18 14 18Mexico. . . . . . . . . . . 75,970 79,332 94,384 93,435 10,936 7,154 17,756 53,595 21 28 28 35Morocco. . . . . . . . . . 22,307 20,793 22,110 20,771 8,840 3,294 6,527 286 22 36 33 28Nicaragua. . . . . . . . . 8,277 9,757 8,537 5,119 3,114 409 1,550 - 4 42 40 24Oman . . . . . . . . . . . 2,397 2,605 2,636 2,643 472 1,438 220 - 12 9 8 10Pakistan. . . . . . . . . . 16,504 22,683 23,804 23,692 10,261 309 12,194 300 23 35 27 27Panama . . . . . . . . . . 3,986 3,927 3,910 5,133 392 690 677 3,326 6 5 4 11Papua New Guinea . . 1,519 1,730 1,666 1,520 493 127 859 - 37 31 21 13Peru . . . . . . . . . . . . 13,625 17,676 18,922 20,412 11,344 122 3,594 4,773 11 18 16 35Philippines . . . . . . . . 24,037 30,272 29,905 27,934 12,084 589 7,938 5,707 27 19 16 14Poland. . . . . . . . . . . 39,259 39,500 41,071 39,215 28,335 323 2,175 8,270 5 12 11 6Senegal . . . . . . . . . . 2,931 3,038 3,171 3,101 1,238 - 1,849 - 20 16 16 16Sierra Leone. . . . . . . 600 846 904 889 415 - 468 - (NA) (NA) (NA) (NA)Slovenia. . . . . . . . . . (X) 1,356 1,489 2,035 203 280 553 973 (X) 5 6 9Sri Lanka . . . . . . . . . 4,947 6,648 7,008 6,816 3,426 266 2,941 - 14 8 7 7Sudan . . . . . . . . . . . 9,153 9,398 9,778 9,368 5,692 1,589 2,083 - 6 1 9 5Syria . . . . . . . . . . . . 14,915 16,538 16,755 16,696 14,523 - 1,029 - 23 7 5 4Tanzania . . . . . . . . . 5,734 6,127 6,205 6,102 2,837 (NA) 2,903 - 34 22 21 19Thailand. . . . . . . . . . 12,452 16,188 16,951 17,037 7,623 3,319 2,984 1,905 17 14 12 12Tunisia. . . . . . . . . . . 6,659 8,025 8,721 8,687 3,154 1,090 3,631 474 25 19 17 17Turkey . . . . . . . . . . . 38,869 48,440 50,313 48,168 7,494 15,324 7,707 14,174 29 31 28 22Uganda . . . . . . . . . . 2,157 2,866 3,059 3,148 789 14 2,284 3 60 44 20 20Uruguay. . . . . . . . . . 3,043 3,749 3,830 4,093 265 509 1,204 2,110 41 15 22 16Venezuela . . . . . . . . 24,506 28,039 28,491 28,450 1,269 1,985 2,787 20,659 23 19 22 17Yemen . . . . . . . . . . . 5,152 5,457 5,526 5,619 2,544 80 1,357 - 6 4 3 2Yugoslavia, former 6 . . 12,985 8,509 8,724 8,479 3,112 4,126 1,234 - (NA) (NA) (NA) (NA)Zambia . . . . . . . . . . 4,876 4,863 5,073 5,305 2,961 9 2,214 - 15 31 186 25Zimbabwe . . . . . . . . 2,464 3,418 3,523 3,335 1,179 162 1,583 90 23 25 24 21
- Represents or rounds to zero. NA Not available. X Not applicable. 1 Includes other types of creditors not shownseparately. 2 Covers publicly issued and privately placed bonds. 3 Debt service payments as percent of exports. 4 Seefootnote 3, Table 1343. 5 Fiscal year basis. 6 The bulk of the debt of Yugoslavian enterprises is reported as nonguaranteed.
Source: The World Bank, Washington, DC, World Debt Tables, periodic.
Comparative International Statistics 857
U.S. Census Bureau, the Official StatisticsTM Statistical Abstract of the United States: 1998 Oct. 13, 1998
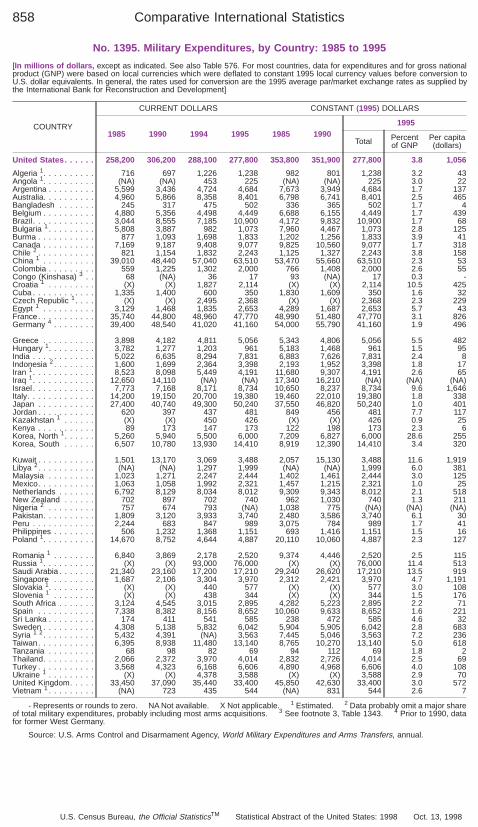
No. 1395. Military Expenditures, by Country: 1985 to 1995
[In millions of dollars, except as indicated. See also Table 576. For most countries, data for expenditures and for gross nationalproduct (GNP) were based on local currencies which were deflated to constant 1995 local currency values before conversion toU.S. dollar equivalents. In general, the rates used for conversion are the 1995 average par/market exchange rates as supplied bythe International Bank for Reconstruction and Development]
COUNTRY
CURRENT DOLLARS CONSTANT (1995) DOLLARS
1985 1990 1994 1995 1985 19901995
Total Percentof GNP
Per capita(dollars)
United States . . . . . . 258,200 306,200 288,100 277,800 353,800 351,900 277,800 3.8 1,056
Algeria 1. . . . . . . . . . 716 697 1,226 1,238 982 801 1,238 3.2 43Angola 1. . . . . . . . . . (NA) (NA) 453 225 (NA) (NA) 225 3.0 22Argentina . . . . . . . . . 5,599 3,436 4,724 4,684 7,673 3,949 4,684 1.7 137Australia. . . . . . . . . . 4,960 5,866 8,358 8,401 6,798 6,741 8,401 2.5 465Bangladesh . . . . . . . 245 317 475 502 336 365 502 1.7 4Belgium . . . . . . . . . . 4,880 5,356 4,498 4,449 6,688 6,155 4,449 1.7 439Brazil. . . . . . . . . . . . 3,044 8,555 7,185 10,900 4,172 9,832 10,900 1.7 68Bulgaria 1 . . . . . . . . . 5,808 3,887 982 1,073 7,960 4,467 1,073 2.8 125Burma . . . . . . . . . . . 877 1,093 1,698 1,833 1,202 1,256 1,833 3.9 41Canada . . . . . . . . . . 7,169 9,187 9,408 9,077 9,825 10,560 9,077 1.7 318Chile 2 . . . . . . . . . . . 821 1,154 1,832 2,243 1,125 1,327 2,243 3.8 158China 1 . . . . . . . . . . 39,010 48,440 57,040 63,510 53,470 55,660 63,510 2.3 53Colombia . . . . . . . . . 559 1,225 1,302 2,000 766 1,408 2,000 2.6 55Congo (Kinshasa) 3 . . 68 (NA) 36 17 93 (NA) 17 0.3 -Croatia 1 . . . . . . . . . (X) (X) 1,827 2,114 (X) (X) 2,114 10.5 425Cuba . . . . . . . . . . . . 1,335 1,400 600 350 1,830 1,609 350 1.6 32Czech Republic 1. . . . (X) (X) 2,495 2,368 (X) (X) 2,368 2.3 229Egypt 1 . . . . . . . . . . 3,129 1,468 1,835 2,653 4,289 1,687 2,653 5.7 43France. . . . . . . . . . . 35,740 44,800 48,960 47,770 48,990 51,480 47,770 3.1 826Germany 4 . . . . . . . . 39,400 48,540 41,020 41,160 54,000 55,790 41,160 1.9 496
Greece . . . . . . . . . . 3,898 4,182 4,811 5,056 5,343 4,806 5,056 5.5 482Hungary 1. . . . . . . . . 3,782 1,277 1,203 961 5,183 1,468 961 1.5 95India . . . . . . . . . . . . 5,022 6,635 8,294 7,831 6,883 7,626 7,831 2.4 8Indonesia 2 . . . . . . . . 1,600 1,699 2,364 3,398 2,193 1,952 3,398 1.8 17Iran 1. . . . . . . . . . . . 8,523 8,098 5,449 4,191 11,680 9,307 4,191 2.6 65Iraq 1. . . . . . . . . . . . 12,650 14,110 (NA) (NA) 17,340 16,210 (NA) (NA) (NA)Israel . . . . . . . . . . . . 7,773 7,168 8,171 8,734 10,650 8,237 8,734 9.6 1,646Italy. . . . . . . . . . . . . 14,200 19,150 20,700 19,380 19,460 22,010 19,380 1.8 338Japan . . . . . . . . . . . 27,400 40,740 49,300 50,240 37,550 46,820 50,240 1.0 401Jordan . . . . . . . . . . . 620 397 437 481 849 456 481 7.7 117Kazakhstan 1 . . . . . . (X) (X) 450 426 (X) (X) 426 0.9 25Kenya . . . . . . . . . . . 89 173 147 173 122 198 173 2.3 6Korea, North 1. . . . . . 5,260 5,940 5,500 6,000 7,209 6,827 6,000 28.6 255Korea, South . . . . . . 6,507 10,780 13,930 14,410 8,919 12,390 14,410 3.4 320
Kuwait . . . . . . . . . . . 1,501 13,170 3,069 3,488 2,057 15,130 3,488 11.6 1,919Libya 2. . . . . . . . . . . (NA) (NA) 1,297 1,999 (NA) (NA) 1,999 6.0 381Malaysia . . . . . . . . . 1,023 1,271 2,247 2,444 1,402 1,461 2,444 3.0 125Mexico. . . . . . . . . . . 1,063 1,058 1,992 2,321 1,457 1,215 2,321 1.0 25Netherlands . . . . . . . 6,792 8,129 8,034 8,012 9,309 9,343 8,012 2.1 518New Zealand . . . . . . 702 897 702 740 962 1,030 740 1.3 211Nigeria 2 . . . . . . . . . 757 674 793 (NA) 1,038 775 (NA) (NA) (NA)Pakistan. . . . . . . . . . 1,809 3,120 3,933 3,740 2,480 3,586 3,740 6.1 30Peru . . . . . . . . . . . . 2,244 683 847 989 3,075 784 989 1.7 41Philippines . . . . . . . . 506 1,232 1,368 1,151 693 1,416 1,151 1.5 16Poland 1. . . . . . . . . . 14,670 8,752 4,644 4,887 20,110 10,060 4,887 2.3 127
Romania 1 . . . . . . . . 6,840 3,869 2,178 2,520 9,374 4,446 2,520 2.5 115Russia 1. . . . . . . . . . (X) (X) 93,000 76,000 (X) (X) 76,000 11.4 513Saudi Arabia . . . . . . . 21,340 23,160 17,200 17,210 29,240 26,620 17,210 13.5 919Singapore . . . . . . . . 1,687 2,106 3,304 3,970 2,312 2,421 3,970 4.7 1,191Slovakia 1. . . . . . . . . (X) (X) 440 577 (X) (X) 577 3.0 108Slovenia 1 . . . . . . . . (X) (X) 438 344 (X) (X) 344 1.5 176South Africa . . . . . . . 3,124 4,545 3,015 2,895 4,282 5,223 2,895 2.2 71Spain . . . . . . . . . . . 7,338 8,382 8,156 8,652 10,060 9,633 8,652 1.6 221Sri Lanka . . . . . . . . . 174 411 541 585 238 472 585 4.6 32Sweden . . . . . . . . . . 4,308 5,138 5,832 6,042 5,904 5,905 6,042 2.8 683Syria 1 2 . . . . . . . . . . 5,432 4,391 (NA) 3,563 7,445 5,046 3,563 7.2 236Taiwan. . . . . . . . . . . 6,395 8,938 11,480 13,140 8,765 10,270 13,140 5.0 618Tanzania . . . . . . . . . 68 98 82 69 94 112 69 1.8 2Thailand. . . . . . . . . . 2,066 2,372 3,970 4,014 2,832 2,726 4,014 2.5 69Turkey . . . . . . . . . . . 3,568 4,323 6,168 6,606 4,890 4,968 6,606 4.0 108Ukraine 1 . . . . . . . . . (X) (X) 4,378 3,588 (X) (X) 3,588 2.9 70United Kingdom. . . . . 33,450 37,090 35,440 33,400 45,850 42,630 33,400 3.0 572Vietnam 1 . . . . . . . . . (NA) 723 435 544 (NA) 831 544 2.6 7
- Represents or rounds to zero. NA Not available. X Not applicable. 1 Estimated. 2 Data probably omit a major shareof total military expenditures, probably including most arms acquisitions. 3 See footnote 3, Table 1343. 4 Prior to 1990, datafor former West Germany.
Source: U.S. Arms Control and Disarmament Agency, World Military Expenditures and Arms Transfers, annual.
Comparative International Statistics858
U.S. Census Bureau, the Official StatisticsTM Statistical Abstract of the United States: 1998 Oct. 13, 1998
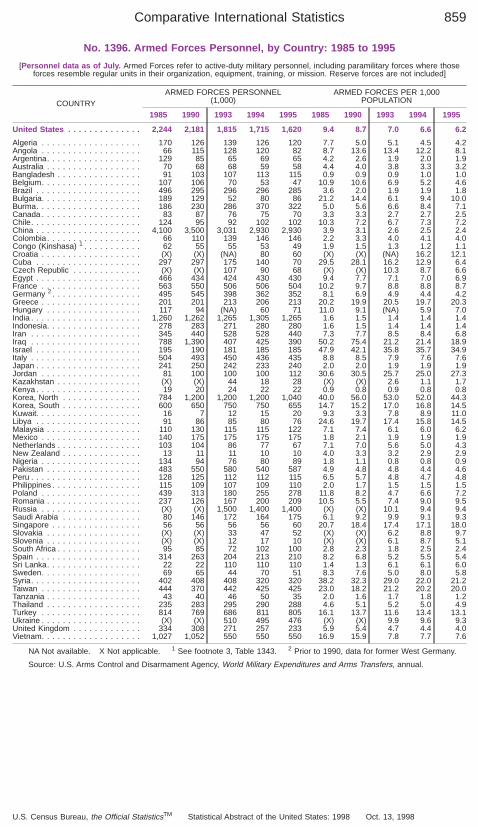
No. 1396. Armed Forces Personnel, by Country: 1985 to 1995
[Personnel data as of July. Armed Forces refer to active-duty military personnel, including paramilitary forces where thoseforces resemble regular units in their organization, equipment, training, or mission. Reserve forces are not included]
COUNTRYARMED FORCES PERSONNEL
(1,000)ARMED FORCES PER 1,000
POPULATION
1985 1990 1993 1994 1995 1985 1990 1993 1994 1995
United States . . . . . . . . . . . . . . 2,244 2,181 1,815 1,715 1,620 9.4 8.7 7.0 6.6 6.2
Algeria . . . . . . . . . . . . . . . . . . . 170 126 139 126 120 7.7 5.0 5.1 4.5 4.2Angola . . . . . . . . . . . . . . . . . . . 66 115 128 120 82 8.7 13.6 13.4 12.2 8.1Argentina. . . . . . . . . . . . . . . . . . 129 85 65 69 65 4.2 2.6 1.9 2.0 1.9Australia . . . . . . . . . . . . . . . . . . 70 68 68 59 58 4.4 4.0 3.8 3.3 3.2Bangladesh . . . . . . . . . . . . . . . . 91 103 107 113 115 0.9 0.9 0.9 1.0 1.0Belgium. . . . . . . . . . . . . . . . . . . 107 106 70 53 47 10.9 10.6 6.9 5.2 4.6Brazil . . . . . . . . . . . . . . . . . . . . 496 295 296 296 285 3.6 2.0 1.9 1.9 1.8Bulgaria. . . . . . . . . . . . . . . . . . . 189 129 52 80 86 21.2 14.4 6.1 9.4 10.0Burma. . . . . . . . . . . . . . . . . . . . 186 230 286 370 322 5.0 5.6 6.6 8.4 7.1Canada . . . . . . . . . . . . . . . . . . . 83 87 76 75 70 3.3 3.3 2.7 2.7 2.5Chile. . . . . . . . . . . . . . . . . . . . . 124 95 92 102 102 10.3 7.2 6.7 7.3 7.2China . . . . . . . . . . . . . . . . . . . . 4,100 3,500 3,031 2,930 2,930 3.9 3.1 2.6 2.5 2.4Colombia . . . . . . . . . . . . . . . . . . 66 110 139 146 146 2.2 3.3 4.0 4.1 4.0Congo (Kinshasa) 1 . . . . . . . . . . . 62 55 55 53 49 1.9 1.5 1.3 1.2 1.1Croatia . . . . . . . . . . . . . . . . . . . (X) (X) (NA) 80 60 (X) (X) (NA) 16.2 12.1Cuba . . . . . . . . . . . . . . . . . . . . 297 297 175 140 70 29.5 28.1 16.2 12.9 6.4Czech Republic . . . . . . . . . . . . . (X) (X) 107 90 68 (X) (X) 10.3 8.7 6.6Egypt . . . . . . . . . . . . . . . . . . . . 466 434 424 430 430 9.4 7.7 7.1 7.0 6.9France . . . . . . . . . . . . . . . . . . . 563 550 506 506 504 10.2 9.7 8.8 8.8 8.7Germany 2 . . . . . . . . . . . . . . . . . 495 545 398 362 352 8.1 6.9 4.9 4.4 4.2Greece . . . . . . . . . . . . . . . . . . . 201 201 213 206 213 20.2 19.9 20.5 19.7 20.3Hungary . . . . . . . . . . . . . . . . . . 117 94 (NA) 60 71 11.0 9.1 (NA) 5.9 7.0India . . . . . . . . . . . . . . . . . . . . . 1,260 1,262 1,265 1,305 1,265 1.6 1.5 1.4 1.4 1.4Indonesia. . . . . . . . . . . . . . . . . . 278 283 271 280 280 1.6 1.5 1.4 1.4 1.4Iran . . . . . . . . . . . . . . . . . . . . . 345 440 528 528 440 7.3 7.7 8.5 8.4 6.8Iraq . . . . . . . . . . . . . . . . . . . . . 788 1,390 407 425 390 50.2 75.4 21.2 21.4 18.9Israel . . . . . . . . . . . . . . . . . . . . 195 190 181 185 185 47.9 42.1 35.8 35.7 34.9Italy . . . . . . . . . . . . . . . . . . . . . 504 493 450 436 435 8.8 8.5 7.9 7.6 7.6Japan . . . . . . . . . . . . . . . . . . . . 241 250 242 233 240 2.0 2.0 1.9 1.9 1.9Jordan . . . . . . . . . . . . . . . . . . . 81 100 100 100 112 30.6 30.5 25.7 25.0 27.3Kazakhstan . . . . . . . . . . . . . . . . (X) (X) 44 18 28 (X) (X) 2.6 1.1 1.7Kenya . . . . . . . . . . . . . . . . . . . . 19 20 24 22 22 0.9 0.8 0.9 0.8 0.8Korea, North . . . . . . . . . . . . . . . 784 1,200 1,200 1,200 1,040 40.0 56.0 53.0 52.0 44.3Korea, South . . . . . . . . . . . . . . . 600 650 750 750 655 14.7 15.2 17.0 16.8 14.5Kuwait. . . . . . . . . . . . . . . . . . . . 16 7 12 15 20 9.3 3.3 7.8 8.9 11.0Libya . . . . . . . . . . . . . . . . . . . . 91 86 85 80 76 24.6 19.7 17.4 15.8 14.5Malaysia . . . . . . . . . . . . . . . . . . 110 130 115 115 122 7.1 7.4 6.1 6.0 6.2Mexico . . . . . . . . . . . . . . . . . . . 140 175 175 175 175 1.8 2.1 1.9 1.9 1.9Netherlands . . . . . . . . . . . . . . . . 103 104 86 77 67 7.1 7.0 5.6 5.0 4.3New Zealand . . . . . . . . . . . . . . . 13 11 11 10 10 4.0 3.3 3.2 2.9 2.9Nigeria . . . . . . . . . . . . . . . . . . . 134 94 76 80 89 1.8 1.1 0.8 0.8 0.9Pakistan . . . . . . . . . . . . . . . . . . 483 550 580 540 587 4.9 4.8 4.8 4.4 4.6Peru . . . . . . . . . . . . . . . . . . . . . 128 125 112 112 115 6.5 5.7 4.8 4.7 4.8Philippines . . . . . . . . . . . . . . . . . 115 109 107 109 110 2.0 1.7 1.5 1.5 1.5Poland . . . . . . . . . . . . . . . . . . . 439 313 180 255 278 11.8 8.2 4.7 6.6 7.2Romania . . . . . . . . . . . . . . . . . . 237 126 167 200 209 10.5 5.5 7.4 9.0 9.5Russia . . . . . . . . . . . . . . . . . . . (X) (X) 1,500 1,400 1,400 (X) (X) 10.1 9.4 9.4Saudi Arabia . . . . . . . . . . . . . . . 80 146 172 164 175 6.1 9.2 9.9 9.1 9.3Singapore . . . . . . . . . . . . . . . . . 56 56 56 56 60 20.7 18.4 17.4 17.1 18.0Slovakia . . . . . . . . . . . . . . . . . . (X) (X) 33 47 52 (X) (X) 6.2 8.8 9.7Slovenia . . . . . . . . . . . . . . . . . . (X) (X) 12 17 10 (X) (X) 6.1 8.7 5.1South Africa . . . . . . . . . . . . . . . . 95 85 72 102 100 2.8 2.3 1.8 2.5 2.4Spain . . . . . . . . . . . . . . . . . . . . 314 263 204 213 210 8.2 6.8 5.2 5.5 5.4Sri Lanka. . . . . . . . . . . . . . . . . . 22 22 110 110 110 1.4 1.3 6.1 6.1 6.0Sweden. . . . . . . . . . . . . . . . . . . 69 65 44 70 51 8.3 7.6 5.0 8.0 5.8Syria. . . . . . . . . . . . . . . . . . . . . 402 408 408 320 320 38.2 32.3 29.0 22.0 21.2Taiwan . . . . . . . . . . . . . . . . . . . 444 370 442 425 425 23.0 18.2 21.2 20.2 20.0Tanzania . . . . . . . . . . . . . . . . . . 43 40 46 50 35 2.0 1.6 1.7 1.8 1.2Thailand . . . . . . . . . . . . . . . . . . 235 283 295 290 288 4.6 5.1 5.2 5.0 4.9Turkey . . . . . . . . . . . . . . . . . . . 814 769 686 811 805 16.1 13.7 11.6 13.4 13.1Ukraine . . . . . . . . . . . . . . . . . . . (X) (X) 510 495 476 (X) (X) 9.9 9.6 9.3United Kingdom . . . . . . . . . . . . . 334 308 271 257 233 5.9 5.4 4.7 4.4 4.0Vietnam. . . . . . . . . . . . . . . . . . . 1,027 1,052 550 550 550 16.9 15.9 7.8 7.7 7.6
NA Not available. X Not applicable. 1 See footnote 3, Table 1343. 2 Prior to 1990, data for former West Germany.
Source: U.S. Arms Control and Disarmament Agency, World Military Expenditures and Arms Transfers, annual.
Comparative International Statistics 859
U.S. Census Bureau, the Official StatisticsTM Statistical Abstract of the United States: 1998 Oct. 13, 1998


![your stay and come back soon! SITE 826 825 823 821 820 # 829 834 ... Sorrento Florida 32776 Lake Coun [Info] ... Where our Shuttle will bring you back](https://img.pdfslide.us/doc/110x75/5ab197977f8b9abc2f8cf237/your-stay-and-come-back-soon-site-826-825-823-821-820-829-834-sorrento-florida.jpg)