Embed Size (px)
Citation preview

A S 0 9 4 - 0 0 0 0 8 8
SEC Registration Number
S M P R I M E H O L D I N G S , I N C . A N D S U B S I
DD I A R I E S
(Company’s Full Name)
B u i l d i N g A , S M C o r p o r a t e O f f i c e s ,
1 0 0 0 J W D i o k n o B o u l e v a r d , M a l l o f
A s i a C o m p l e x , P a s a y C i t y 1 3 0 0
(Business Address: No. Street City/Town/Province)
Mr. Jeffrey C. Lim 831-1000 (Contact Person) (Company Telephone Number)
1 2 3 1 1 7 - A 0 4 2 8
Month Day (Form Type) Month Day (Fiscal Year) (Annual Meeting)
(Secondary License Type, If Applicable)
Dept. Requiring this Doc. Amended Articles Number/Section
Total Amount of Borrowings
Total No. of Stockholders Domestic Foreign
To be accomplished by SEC Personnel concerned
File Number LCU
Document ID Cashier
S T A M P S
Remarks: Please use BLACK ink for scanning purposes.
COVER SHEET�

SECURITIES AND EXCHANGE COMMISSION SRC FORM 17-A
ANNUAL REPORT PURSUANT TO SECTION 17 OF THE SECURITIES REGULATION CODE
1. For the calendar year ended DECEMBER 31, 2008
2. SEC Identification Number AS094-000088
3. BIR Tax Identification No. 003-058-789 4. Exact name of registrant as specified in its charter SM PRIME HOLDINGS, INC.
5. PHILIPPINES 6. (SEC Use Only) Province, Country or other jurisdiction
of incorporation or organization Industry Classification Code: �
7. SM Corporate Offices, Bldg. A, 1000 JW Diokno Boulevard, Mall of Asia Complex, Pasay City 1300 Address of principal office Postal Code
8. (632) 831-1000 Registrant's telephone number, including area code
9. NA Former name, former address, and former fiscal year, if changed since last report.
10. Securities registered pursuant to Sections 4 and 8 of the SRC
Title of Each ClassNumber of Shares of Common Stock
Outstanding and Amount of Debt Outstanding
CAPITAL STOCK, P 1 PAR VALUE
13,329,334,367
11. Are any or all of these securities listed on the Philippine Stock Exchange. Yes [X] No [ ]
12. Check whether the registrant: (a) has filed all reports required to be filed by Section 17 of the Securities Regulations
Code (SRC) and SRC Rule 11(a)-1 thereunder and Sections 26 and 141 of The Corporation Code of the Philippines during the preceding 12 months (or for such shorter period that the registrant was required to file such reports);
Yes [X] No [ ] (b) has been subject to such filing requirements for the past 90 days. Yes [X] No [ ]
13. Aggregate market value of the voting stock held by non-affiliates: P39,129,870,167

TABLE OF CONTENTS
Page No.
PART I - BUSINESS AND GENERAL INFORMATION
Item 1. Business 1 Item 2. Properties 3 Item 3. Legal Proceedings 10 Item 4. Submission of Matters to a Vote of Security Holders 10
PART II - OPERATIONAL AND FINANCIAL INFORMATION
Item 5. Market for Registrant’s Common Equity and Related Stockholder Matters 10 Item 6. Management’s Discussion and Analysis or Plan of Operation 12 Item 7. Financial Statements 24 Item 8. Information on Independent Accountant and Other Related Matters 25
PART III - CONTROL AND COMPENSATION INFORMATION
Item 9. Directors and Executive Officers of the Registrant 25 Item 10. Executive Compensation 32 Item 11. Security Ownership of Certain Beneficial Owners and Management 33 Item 12. Certain Relationships and Related Transactions 34
PART IV - CORPORATE GOVERNANCE 33
PART IV - EXHIBITS AND SCHEDULES
Item 13. a. Exhibits 36 b. Reports on SRC Form 11-C (Current Report) 36
INDEX TO FINANCIAL STATEMENTS AND SUPPLEMENTARY SCHEDULES 37
INDEX TO EXHIBITS 105
SIGNATURES 107
�
1
PART I - BUSINESS AND GENERAL INFORMATION ITEM 1. Business
Business Development and Principal Products or Services
SM Prime Holdings, Inc. (“SMPHI” or the “Company”) was incorporated in the Philippines on January 6, 1994 to develop, conduct, operate and maintain the business of modern commercial shopping centers and all businesses related thereto such as the conduct, operation and maintenance of shopping center spaces for rent, amusement centers, or cinema theaters within the compound of the shopping centers. Its main sources of revenues include rental income from leases in mall and food court, cinema ticket sales and amusement income from bowling and ice skating. The Company currently has 33 SM Supermalls in the country and 3 SM Supermalls in China.
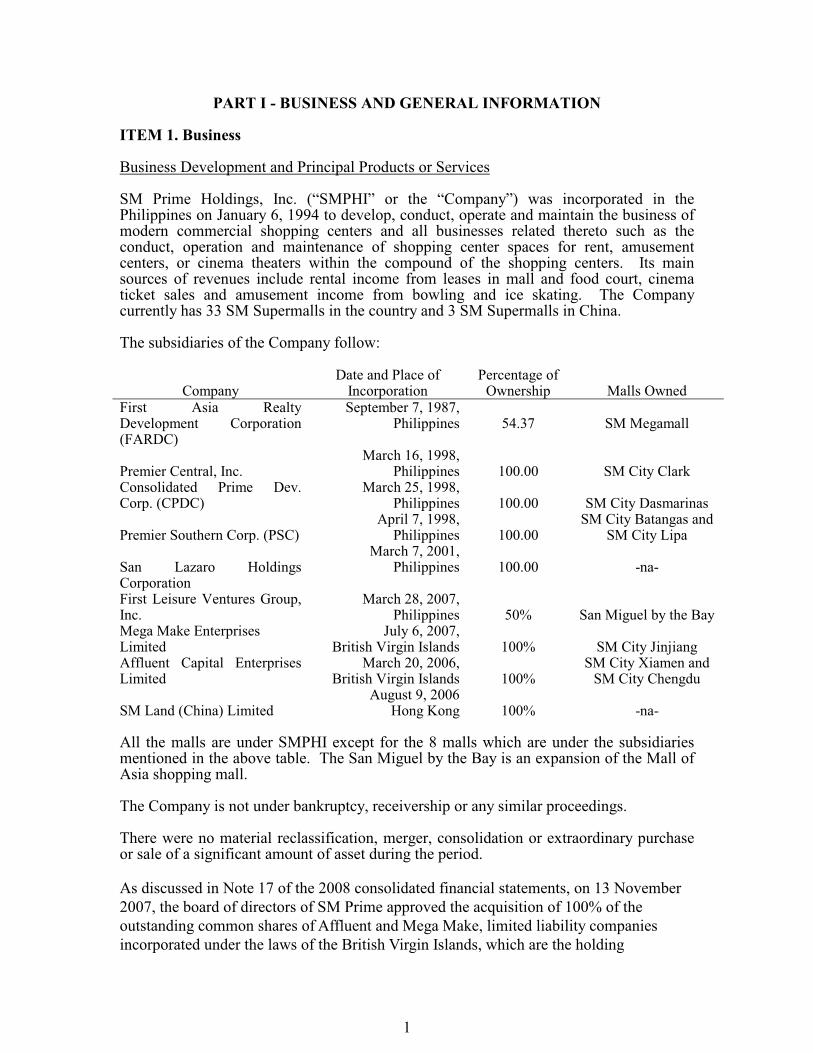
The subsidiaries of the Company follow:
Company Date and Place of
Incorporation Percentage of
Ownership Malls Owned First Asia Realty Development Corporation (FARDC)
September 7, 1987, Philippines 54.37 SM Megamall
Premier Central, Inc. March 16, 1998,
Philippines 100.00 SM City Clark Consolidated Prime Dev. Corp. (CPDC)
March 25, 1998, Philippines 100.00 SM City Dasmarinas
Premier Southern Corp. (PSC) April 7, 1998,
Philippines 100.00 SM City Batangas and
SM City Lipa
San Lazaro Holdings Corporation
March 7, 2001, Philippines 100.00 -na-
First Leisure Ventures Group, Inc.
March 28, 2007, Philippines 50% San Miguel by the Bay
Mega Make Enterprises Limited
July 6, 2007, British Virgin Islands 100% SM City Jinjiang
Affluent Capital Enterprises Limited
March 20, 2006, British Virgin Islands 100%
SM City Xiamen and SM City Chengdu
SM Land (China) Limited August 9, 2006
Hong Kong 100% -na-
All the malls are under SMPHI except for the 8 malls which are under the subsidiaries mentioned in the above table. The San Miguel by the Bay is an expansion of the Mall of Asia shopping mall. The Company is not under bankruptcy, receivership or any similar proceedings.
There were no material reclassification, merger, consolidation or extraordinary purchase or sale of a significant amount of asset during the period.
As discussed in Note 17 of the 2008 consolidated financial statements, on 13 November
2007, the board of directors of SM Prime approved the acquisition of 100% of the
outstanding common shares of Affluent and Mega Make, limited liability companies
incorporated under the laws of the British Virgin Islands, which are the holding
�
2
companies of the three SM Malls in China located in the cities of Xiamen, Jinjiang and
Chengdu.
Last February 18, 2008, the Parent Company executed the subscription agreements with
Grand China International Limited (Grand China) and Oriental Land Development
Limited (Oriental Land) for the exchange of Affluent and Mega Make shares of stock
valued at P=10,827 million equivalent to 913 million shares of the Parent Company’s
common stock. The relevant documents were submitted to the SEC last February 29,
2008.
The transaction was approved by the SEC and the PSE on May 20, 2008. On June 18,
2008, SM Prime new common shares totaling 372,492,882 and 540,404,330 which were
issued to Oriental Land and Grand China, respectively, were listed in the PSE.
Major Risk Areas
The major risk areas of the Company are its marketing and leasing processes, revenue and collections processes, mall administration processes and information technology processing. Marketing and leasing processes pertain to establishing an appropriate mix of tenants which will contribute most to profitability and maintain competitive advantage. Revenue and collections processes pertain to the risk of incomplete or inaccurate capture of revenues and other charges billable to tenants and the related processing of billing statements and collections. Mall administration processes pertain to the risk of ensuring that tenants conform to the rules and regulations of the Company, maintaining safety and security within the area and compliance with governmental regulations such as the MTRCB, DENR, BIR and other local agencies. Information technology processing risk pertain to the risk that information used to support business decisions is not relevant or reliable.
The Company’s Internal Audit Department follows a framework for systematically understanding and identifying the types of business risks threatening the organization as a whole and specific business processes within the organization. A review and evaluation of internal controls to manage the identified risks are done on a regular basis and test ofcontrols is conducted to determine if the said controls are in place. The Internal Audit Department also reports to the Audit Committee quarterly.
The Company also has an Enterprise Risk Management Committee (ERMC) which is an oversight committee created to act as the monitoring body for the individual risk management activities of the Company. The ERMC has the responsibility of developing a formal framework to assist the Company in managing its risks and is mandated to report regularly to the BOD on any risk concerns.
Management is committed in ensuring that business process are clearly defined, aligned with business strategies, perform effectively and efficiently in satisfying customer needs and protect financial, physical and intellectual assets from unacceptable losses, risk taking, misappropriation or misuse.
Competition
The Company competes with other local mall operators for tenants and customers. Although there is increased competition, the Company believes it has certain significant

�
3
competitive advantages which includes, among others, the very good locations of the malls, proven successful tenant mix and selection criteria, and the presence of the dominant SM Department Store and SM Supermarket as anchor tenants.
Some of the major competitors considered by the company are the Ayala Malls and Robinsons Malls.
Transactions With and/or Dependence on Related Parties
As of February 28, 2009, the Company is directly owned by SM Land, Inc. (formerly Shoemart, Inc.) (44.54%) and SM Investments Corporation (20.66%).
The major anchor tenants in the 33 operating malls in the country are the SM Department Stores, SM Supermarkets, SM Hypermarkets, Ace Hardware, National Bookstore, KFC, Jollibee and Watsons (Philippines), among others. (see Item 2, Malls in Operation).
The major anchor tenants in the 3 operating malls in China are Wal-Mart, SM Laiya Department Stores, Wanda Cinema, McDonald’s, KFC, Watsons, among others. (see Item 2, Malls in Operation).
All transactions with related companies are done on commercial terms and at arms length basis (see Note 21 of attached Consolidated Financial Statements).
Governmental regulations and environmental laws
The Company meets all governmental, environment, health and safety requirements. Tenant spaces are regularly inspected and the Company has not experienced significant governmental, environment, health or safety problems.
EmployeesAs at December 31, 2008, the Company had 64 employees and supported by 4,633
officers and employees of the Management Companies. The employees are not subject to
a collective bargaining agreement (CBA).
ITEM 2. Properties
Malls in Operation
SM Megamall
SM Megamall is owned by FARDC (54% owned subsidiary of SMPHI), and has a gross
floor area of 346,789 square meters. It features 12 cinemas with a seating capacity of
10,946, a 46-lane computerized bowling center, an ice skating rink, a food court, a trade
hall and two car park buildings with a total capacity of 2,792 cars. The mall is located on
a 10.5 hectare site in Ortigas Center, Mandaluyong City, Metro Manila. Last November
2008, the mall bridgeway was launched and its expansion spans the whole width of
buildings A and B.
SM City North EDSA
SM City - North EDSA is a four building complex with a gross floor area of 424,691
square meters featuring 12 cinemas with a seating capacity of 12,631, a food court,
amusement centers and a multi-level car park building which provides a total capacity of
�
4
3,511 cars located on a 17.5 hectare site in Diliman, Quezon City. In 2006, The Block at
SM North Edsa opened. It features junior anchor shops such as SM Hypermarket, Toy
Kingdom, Kultura Filipino and SM Appliance Center, among others. In December 2008,
The Annex of SM City – North Edsa, announced its soft opening and with this, GFA
expands to 425,000 square meters and making it the country’s largest shopping mall.
SM Southmall
SM Southmall is a four-level complex with a gross floor area of 205,120 square meters
featuring 10 cinemas with a seating capacity of 9,500, a food court, amusement centers
and a car park located on 20 hectare site in Las Piñas, Metro Manila.
SM City Cebu
SM City Cebu is a multi-level complex with a gross floor area of 268,611 square meters
featuring eight cinemas with a seating capacity of 8,848, a food court, a fully
computerized 26-lane bowling center, a trade hall and a car park with a 1,733 car capacity
located on a 13.8 hectare site in Cebu Port Center, Barrio Mabolo, Cebu City. In
November 2007, the Annex Building was opened with a gross floor area of 107,049
square meters, making it the Company’s largest mall in the Visayas region.
SM City Sta. Mesa
SM Sta. Mesa is a seven-level complex with a gross floor area of 133,327 square meters
featuring ten cinemas with a seating capacity of 9,176, a food court, an amusement center,
a car park on six levels and outdoor parking with a total capacity of 1,176 cars located on
a 3.0 hectare site in Quezon City, Metro Manila.
SM City Bacoor
SM City Bacoor is a four level complex with a gross floor area of 116,892 square meters
located on a 8.8 hectare site in Bacoor, Cavite. The shopping complex features eight
cinemas with a 5,541 seating capacity, and foodcourt and amusement areas.
SM City Fairview
SM City Fairview is a two-building, four level complex with a gross floor area of 154,183
square meters located on a 20 hectare site in Quezon City, Metro Manila. The shopping
complex has a tenant leasable 136,883 square meters. It features 12 cinemas with a
seating capacity of 7,934 and food court and amusement areas. In early 2009, the mall
will again schedule to launch its expansion which will add 28,600 square meters to its
existing GFA.
SM City Iloilo
SM City Iloilo is a 101,735 square meter supermall constructed on a 17.5 hectare property
at the juncture of the Northwest and the Northeast of the Iloilo-Jaro West Diversion Road
in Manduriao, Iloilo City. A quick drive from the airport as it is from the center of the
city, it serves the city’s residents, as well as those of the rest of Panay Island and the
neighboring islands in the Visayas. It is envisioned to revolutionize shopping in the
country’s oldest city, famous for its many educational institutions and luminaries in
business and industry. SM Iloilo has 8 cinemas with a seating capacity of 6,261.

�
5
SM City Manila
SM City Manila is a 5-level mall with a gross floor area of 166,554 square meters. The
Mall is located on a 2.5 hectare site in downtown Manila next to the Manila City Hall. It
has 12 cinemas and a foodcourt. It has become a major destination of shoppers, given its
strategic location and easy accessibility by the Light Railway Transit and other public
transportation.
SM City Pampanga
SM City Pampanga is a 3-level 129,102 square meter shopping mall, straddling the
municipalities of San Fernando and Mexico in Pampanga. It features six state-of-the-art
Cinemas and a food court. The mall is strategically located at the Olongapo-Gapan Road
and serves the city’s residents as well as those in the provinces of Bulacan, Tarlac,
Bataan, Zambales and Nueva Ecija. Last October 2007, Annex 3 was opened with
17,439 square meters of GFA and and 14,025 square meters of leasable area.
SM City Sucat
SM City Sucat is located on a 10.1 hectare site along Dr. A. Santos Ave. (Sucat Road),
Brgy San Dionisio, Parañaque City. The mall has a gross floor area of 98,106 square
meters. The anchor stores are SM Hypermart, a retail concept that combines
supermarket, general merchandise and discount retailing, and the SM Department Store at
the Annex Building. There are 4 cinemas with total seating capacity of 2,036 and a food
court.
SM City Davao
SM City Davao is located on a 13 hectare property along Quimpo Boulevard corner Tulip
and Eco Drives, Brgy. Matina Davao City. The supermall has a gross floor area of
75,440 square meters and a leasable area of 56,065 square meters for fine shopping,
exciting entertainment and wide-variety food outlets. It has 6 cinemas which can
accommodate up to 2,904 movie patrons. The supermall is within walking distance from
some of the biggest schools in Mindanao such as Ateneo de Davao, University of
Mindanao, Philippine Women’s College and the Agro-Industrial Foundation College.
SM City Bicutan
SM City Bicutan is located on a 1.8 hectare property situated along Dona Soledad Ave.
corner West Service Road, Bicutan, Paranaque City. This supermall has a gross floor area
of 112,737 square meters. It has 4 cinemas with a total seating capacity of 1,368. SM
Bicutan serves nearly half a million residents within a 3 kilometer radius.
SM City Cagayan De Oro
SM City Cagayan De Oro, the Company’s second supermall in Mindanao sits on a 52,000
square meter property along Mastersons Avenue corner Gran Via St., Cagayan de Oro
City, Misamis Oriental. The mall has a gross floor area of 56,011 square meters. It has 4
cinemas with a total seating capacity of 1,842. It also has a multi-level carpark building
with 878 parking slots.

�
6
SM City Lucena
SM City Lucena is located on a 79,503 square meter property. Lucena City, is a coastal
city that can be accessed via the Daang Maharlika Highway, the Philippine National
Railway and the Tayabas Bay. Approximately 129 kilometers and 2.5 hours drive from
Metro Manila, Lucena City is known as the “Coco Palm City of Southern Luzon” as it
houses some of the country’s biggest coconut oil mills and desiccated coconut producers.
It is likewise known as the main transshipment point of Southern Luzon with its
Dalahican Fish Port serving as the main harbor for passenger and cargo vessels traveling
to and from Marinduque, Romblon and Samar. This four-level supermall has a gross
floor area of 78,655 square meters. It has 4 cinemas with a total seating capacity of 2,292.
SM City Marilao
SM City Marilao, sits on a 203,000 square meter property along McArthur Highway,
Marilao, Bulacan. This site appears to have all the characteristics defined in the SM
Group’s land development and expansion policy. Aside from being densely populated by
provincial standard, Bulacan is actively pursuing industrialization which has led to the
creation of a number of industrial estates. These have provided job opportunities and
spurred the rapid growth of residential communities. SM City-Marilao is the first major
shopping center to serve this sizeable and growing market. The four-level mall has a
gross floor area of 88,654 square meters.
SM City Baguio
SM City Baguio is situated on a 79,763 square meter property situated along Session
Road in Baguio City. Baguio City is a good site for SM to develop its presence in the
northern part of Luzon. Known for its cool climate, beautiful scenery and historic culture,
the city offers multifold opportunities for entrepreneurs, retailers and service-oriented
establishments. SM City Baguio has a gross floor area of 105,331 square meters. It has 4
cinemas that can accommodate 1,824 movie patrons.
SM City Dasmarinas
SM City Dasmarinas sits on a 123,969 square meter property situated along Governor’s
Drive about 100 meters from the Aguinaldo Highway junction in Dasmarinas, Cavite.
This supermall has a gross floor area of 79,792 square meters and a leasable area of
54,809 square meters. It has 4 cinemas with a seating capacity of 2,140.
SM City Batangas
SM City Batangas is built on a 85,269 square meter property situated along the national
highway, Barangay Pallocan West, Batangas City. The mall is about 3.7 kms from the
Batangas International Port. SM City Batangas has a gross floor area of 76,819 square
meters with a leasable area of 58,012. It has 4 cinemas with a seating capacity of 1,642.
SM City San Lazaro
SM City San Lazaro sits on a 40,000 sq.m. property located at A.H. Lacson Street
(formerly Gov. Forbes Avenue), Sta. Cruz, Manila. At the center of thickly populated
residential area with bustling commercial activities, SM City San Lazaro is the second

�
7
SM supermall in the city of Manila. The four-storey mall has a gross floor area of
178,516 square meters.
SM Supercenter Molino
SM Supercenter Molino is the second SM Supermall in Bacoor, Cavite. Located at the
southern end of Molino road, a 13 kilometer thoroughfare that cuts through Bacoor,
Cavite, SM City Molino has a gross floor area of 48,710 square meters. The mall’s
anchor tenant is the SM Hypermarket.
SM Supercenter Valenzuela
SM Supercenter Valenzuela has a total gross floor area of 70,616 square meters, situated
on a 2.4 hectare property in Bgy. Karuhatan, Valenzuela City. SM Supercenter
Valenzuela caters to the bustling industrial areas that surround the property. Its major
anchor is the SM Hypermarket. The mall features four cinemas with 1,679 seating
capacity.
SM City Sta Rosa
SM City Sta Rosa is the first Supermall in the Laguna province with 79,325 square
meters of gross floor area. Located in Barrio Tagapo, Sta. Rosa, the two-level mall is a
10-minute drive from the Mamplasan exit. SM City Sta. Rosa offers one-stop shopping
convenience as it includes a variety of retail establishments, four cinemas and a
foodcourt.
SM City Clark
The 98,824-square meter of gross floor area, SM City Clark along M.A. Roxas Avenue is
about 80 kilometers north of Manila and 60-kilometers east of Subic Bay Freeport, right
at the doorstep of the Clark Special Economic Zone in Pampanga. The mall has two
levels, six cinemas and 2,667 parking lots. With its unique design resembling a coliseum,
this mall offers tourists and shoppers a host of retail, dining, and entertainment
establishments.
SM Mall of Asia
SM Mall of Asia is the country’s biggest and most ambitious mall project opened to the
public. Located on a 60 hectare property overlooking Manila Bay, the complex consists of
four buildings linked by elevated walkways – Main Mall, the North Parking Building, the
South Parking Building, and the Entertainment Center Building. The giant mall measures
406,961 square meters. Both parking buildings have over 5,000 spaces available for
private vehicles. The Entertainment Building houses the country’s first IMAX theatre, a
special Director’s club screening room for exclusive film showings, seven more state-of-
the art cinemas, 32-lane state of the art bowling facility, a Science Discovery Center and
Planetarium and fine dining restaurants and bars. There is also an Olympic-sized ice rink.
SM Supercenter Pasig
SM Supercenter Pasig is located in Frontera Verde, Pasig City. Its gross floor area is
29,017 square meters which includes a basement parking of 10,222 square meters. The

�
8
mall has its main anchor, the SM Hypermarket which has a balance mix of food and non-
food items.
SM City – Lipa
SM City – Lipa is the second mall in Batangas Province which is strategically located
along Lipa’s Ayala Highway. It occupies 10.3 hectares of land, with 79,832 square
meters of gross floor area. Lipa City boasts natural attractions and is a major commercial,
educational, and industrial destination. The mall features 4 cinemas with 2,496 seating
capacity.
SM City-Bacolod
SM City-Bacolod located in the Reclamation Area has a gross floor area of 61,413 square
meters and leasable area of 46,683 square meters. This is the third mall in the Visayas in
addition to Iloilo and Cebu. The mall has as its main anchors the SM Supermarket and
the SM Department Store and features four cinemas.
SM City Taytay
SM City-Taytay located in Bgy. Dolores, Taytay, Rizal and situated on a 38,525 square
meter lot has a gross floor area of 91,920 square meters including a carpark for 628 cars.
The mall has as its anchor tenants the SM Hypermarket and the SM Department Store and
features three cinemas with 1,250 seating capacity.
SM Supercenter Muntinlupa
SM Supercenter Muntinlupa is situated in Bgy. Putatan, Muntinlupa City. The two level
mall has a gross floor area of 50,431 square meters and a two-level covered parking. The
mall features four cinemas and an entertainment plaza for shows and events located at the
center of the mall.
SM City Marikina
SM City Marikina in Marcos Highway, Barangay Calumpang, Marikina City is situated
on a 60,000 square meter lot and has a gross floor area of about 122,067 square meters.
The mall has as its anchor tenants the SM Supermarket and the SM Department Store and
features eight cinemas with 3,348 seating capacity.
SM City Baliwag
SM City Baliwag in Bgy. Sto Cristo, Bulacan occupied 92,719 square meter lot and has a
gross floor area of 61,554 square meters and open carpark for over 500 vehicles. The
mall has as its anchor tenants the SM Hypermarket and the SM Department Store and
features four cinemas with a combined seating capacity of 1,240.
SM Supercenter Rosales
SM Supercenter Rosales in Bgy. Carmen, Pangasinan stands on a 121,685 square meter
lot and has a gross floor area of 60,989 square meters. The mall has as its anchor tenant
the SM Hypermarket plus several junior anchors and amenities include a foodcourt and
parking slots for over 1,000 cars.
�
9
SM City Xiamen
SM City Xiamen in Xiamen City, Fujian Province is situated on a 72,600 square meter lot
and has a gross floor area of 128,000 square meters plus an open carpark for 1,014 cars.
The mall has as its anchor tenant Wal-Mart and SM Laiya Department Store plus several
junior anchors.
SM City Jinjiang
SM City Jinjiang in Jinjiang City, Fujian Province is situated on a 115,000 square meter
lot and has a gross floor area of 170,000 square meters plus an open carpark for 1,700
cars. The mall has as its anchor tenant Wal-Mart, SM Laiya Department Store and
Wanda Cinema plus several junior anchors.
SM City Chengdu
SM City Chengdu in Chengdu City, Sichuan Province is situated on a 47,000 square
meter lot and has a gross floor area of 170,000 square meters plus an open carpark for
949 cars. The mall has as its anchor tenant Wal-Mart, SM Laiya Department Store and
Wanda Cinema plus several junior anchors.
On the average, 86%, 10% and 4% of consolidated total revenues is composed of rental, cinema ticket sales and amusement and others, respectively.
Malls Under Construction
SM City Naga
SM City Naga located in Central Business District II of Bgy. Triangulo, Naga City is
situated on a 46,801 square meter lot and has a gross floor area of 88,000 square meters
plus a covered carpark for almost 750 cars. The mall has as its anchor tenants the SM
Supermarket and the SM Department Store.
In addition to SM City Naga which will open in May 2009, the Company will also open
within 2009, SM Rosario (Cavite) and SM Pamplona (Las Pinas) with a gross floor area
of 50,000 square meters and 40,000 square meters, respectively. Expansions of existing
malls - - SM North Edsa SkyGarden and SM City Rosales will also open in May 2009.
The Company retains ownership of all the sites on which the SMPH malls are built, with
the exception of SM City Manila, SM City Bacoor, SM Valenzuela, SM Molino, SM
Supercenter Pasig, SM City Clark, SM City Taytay and SM Supercenter Muntinlupa, SM
City Xiamen, SM City Jinjiang and SM City Chengdu, which are held under long term
leases. In addition, the land where Mall of Asia and SM City – Baguio are constructed
are owned by Shoemart, Inc and SM Investments Corporation, respectively, both
companies are also under the SM Group. The land where SM City – San Lazaro is
constructed is owned by San Lazaro Holdings Corporation, a 100%-owned subsidiary.
Rental rates are based on prevailing market rent for the said properties. Lease renewal
options are subject to mutual agreement of the parties. SM Megamall is owned by
FARDC, a 54.4% owned subsidiary and San Miguel by the Bay is owned by FLVI, a 50%
owned subsidiary.

�
10
Other Development Properties�
Size
Location In Sq.M.
Owned
Cabanatuan City 262,617
Pangasinan (Urdaneta) 153,808
Dagupan City 147,699
Parañaque (La Huerta) 109,602
Davao (Lanang) 100,000
Quezon City (Novaliches) 56,119
Antipolo 35,210
865,055
Leased
General Santos City 73,250
Laguna (San Pablo) 68,945
Laguna (Calamba) 54,051
Tarlac City 34,002
Taguig 33,971
Elliptical (GSIS) 29,567
Commonwealth 20,007
313,793
Total – 14 sites 1,178,848
Leased properties intended for future development have lease terms ranging from 15 to
50 years. Some contracts provide for renewal options subject to mutual agreement of the
parties. Rental payments are generally based on a certain percentage of the Company’s
gross rental income or a certain fixed amount. Management believes that the rental rates
are viable for shopping center development.
Other real properties that the Company intends to acquire are still under review
depending on factors such as demographics and accessibility to public transport.
ITEM 3. Legal Proceedings
See Note 26 of attached Consolidated Financial Statements.
ITEM 4. Submission of Matters to a Vote of Security Holders
There were no matters submitted to a vote of security holders during the fourth quarter of
the calendar year covered by this report.
PART II - OPERATIONAL AND FINANCIAL INFORMATION
ITEM 5. Market for Registrant’s Common Equity and Related Stockholder Matters CASH DIVIDEND PER SHARE - P 0.24 in 2008, P 0.22* in 2007 and P 0.20* in 2006.

�
11
2008 2007
Stock Prices High Low High Low
First Quarter P 10.00 P 7.50 P 13.00 P 10.50
Second Quarter 8.50 6.90 15.00 11.00
Third Quarter 9.00 6.30 13.50 9.30
Fourth Quarter 8.60 5.80 12.75 10.00
* Cash dividends per share were retroactively adjusted for stock dividends declared in 2007 and 2006.
The Company’s shares of stock is traded in the Philippine Stock Exchange.
As of February 28, 2009, the closing price of the Company’s shares of stock is
P7.30/share. For the two months ending February 28, 2009, stock prices of SMPHI were
at a high of P8.00 and a low of P7.20.
The number of shareholders of record as of February 28, 2009 was 2,789. Capital stock
issued and outstanding as of February 28, 2009 was 13,329,334,367. As of December 31,
2008, there are no restrictions that would limit the ability of the Company to pay
dividends to the common stockholders, except with respect to Note 17 of the consolidated
financial statements.
The top 20 stockholders as of February 28, 2009 are as follows:
Name No. of Shares Held % to Total
1. SM Land, Inc. (formerly Shoemart, Inc.) 5,945,158,593 44.54
2. PCD Nominee Corp. (Non-Filipino) 4,033,753,418 30.22
3. SM Investments Corp. 2,757,559,722 20.66
4. PCD Nominee Corp. (Filipino) 481,616,874 3.61
5. Sysmart Corporation 29,781,729 0.22
6. SM Prime Holdings, Inc. (treasury shares) 18,857,000 0.14
7. Sybase Equity Investments Corporation 7,035,000 0.05
8. Henry Sy, Sr. 4,394,894 0.03
9. Regina Capital Dev. Corp. 4,257,163 0.03
10. Lucky Securities, Inc. 3,274,259 0.02
11. SM Savings and Loan Association, Inc. 2,852,107 0.02
12. Macario Gaw Jr. 1,726,053 0.01
13. Philippine Air Force Educational Fund, Inc. 1,712,739 0.01
14. Southwood Mindanao Corporation 1,627,739 0.01
15. Elizabeth Sy 1,626,488 0.01
16. Morgan Guaranty Trust Co. 1,589,005 0.01
17. Jorge T. Mendiola 1,000,000 0.01
18. Agaton L. Tiu/ Remington Tiu 1,000,000 0.01
19. Remington Tiu/ Agaton Tiu 1,000,000 0.01
20. Teresita Sy 984,657 0.01
There are no recent sales of unregistered or exempt securities, including recent issuance
of securities constituting an exempt transaction, except with respect to Notes 16 and 17 of
�
12
the 2008 consolidated financial statements. The Company has no registered debt
securities. There are no existing or planned stock options. There are no registered
securities subject to redemption or call. There are no existing or planned stock warrant
offerings.
As discussed in Note 16, the Company issued a P3 billion fixed rate note facility in June
2008. The deal was arranged by First Metro Investment Corporation. The notes issued
are considered as exempt security pursuant to Section 9.2 of R.A. No. 8799 (the
Securities Regulation Code (SRC)).
As discussed in Note 17, on May 20, 2008, the SEC approved the valuation of the share-
for-share swap transaction with Grand China and Oriental Land and confirmed that the
issuance of shares is exempt from registration requirements. On May 28, 2008, the PSE
approved the listing of 912,897,212 new shares which were issued to Grand China and
Oriental Land. The listing of the shares was completed on June 18, 2008
As discussed in Note 17, the BOD and the stockholders approved the declaration of a
25% stock dividend or approximately 2.5 billion shares during the last April 23, 2007
stockholders’ meeting. The stock dividend declaration was approved by the SEC on May
29, 2007 and subsequently issued on July 24, 2007. The securities issued are considered
as exempt security pursuant to Section 10.1 of the SRC.
ITEM 6. Management’s Discussion and Analysis or Plan of Operation
2008
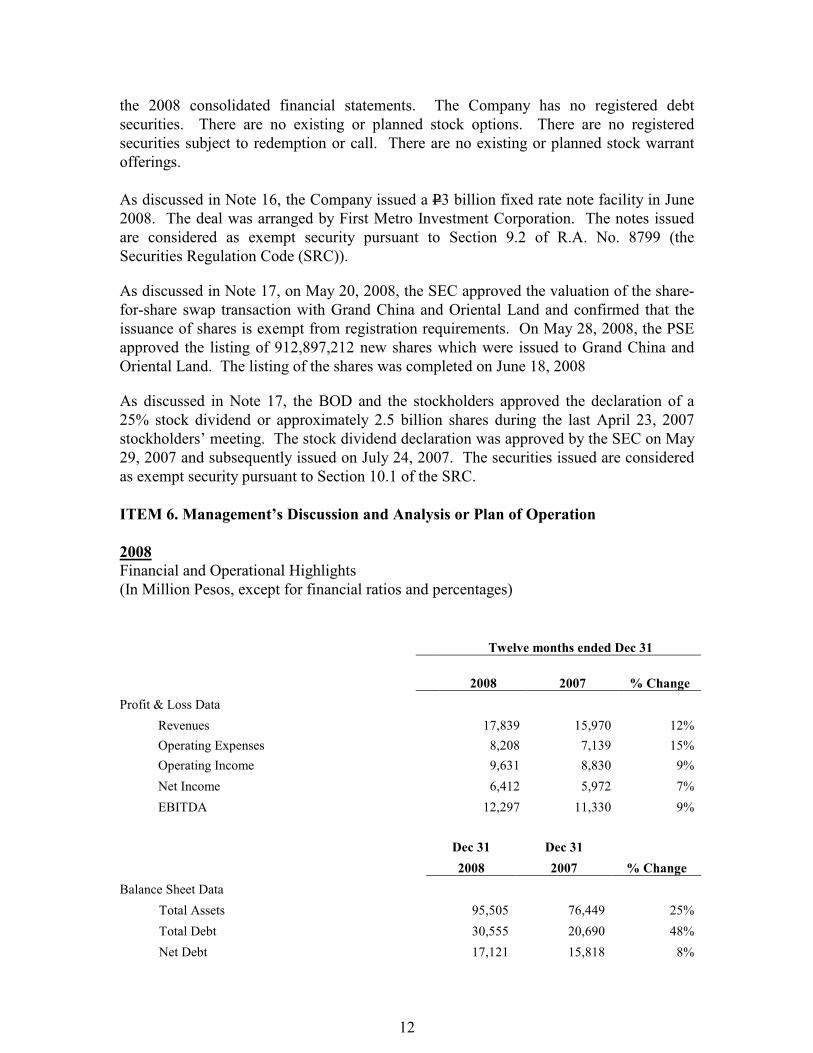
Financial and Operational Highlights
(In Million Pesos, except for financial ratios and percentages)
Twelve months ended Dec 31
2008 2007 % Change
Profit & Loss Data
Revenues 17,839 15,970 12%
Operating Expenses 8,208 7,139 15%
Operating Income 9,631 8,830 9%
Net Income 6,412 5,972 7%
EBITDA 12,297 11,330 9%
Dec 31 Dec 31
2008 2007 % Change
Balance Sheet Data
Total Assets 95,505 76,449 25%
Total Debt 30,555 20,690 48%
Net Debt 17,121 15,818 8%

�
13
Total Stockholders' Equity 46,829 42,518 10%
Financial Ratios
Fixed Assets to Total Assets 0.79 0.86
Current Ratio 1.09 1.01
Debt to Equity 0.39 : 0.61 0.33 : 0.67
Net Debt to Equity 0.27 : 0.73 0.27 : 0.73
Return on Equity 0.14 0.14
Debt to EBITDA 2.48 1.83
EBITDA to Interest Expense 14.33 14.28
Operating Income to Revenues 0.54 0.55
EBITDA Margin 0.69 0.71
Net Income to Revenues 0.36 0.37
SM Prime Holdings, Inc., the country’s leading shopping mall developer and operator
which currently owns 33 malls in the Philippines and 3 malls in China, posts 12%
increase in gross revenues for the year 2008 to P17.84 billion from P15.97 billion in
2007. Rental revenues remain the largest portion, with a growth of 15% amounting to
P15.36 billion from last year’s P13.40 billion. This is largely due to rentals from new SM
Supermalls opened in 2007, namely, SM City Bacolod, SM City Taytay and SM
Supercenter Muntinlupa. In addition, three malls were also expanded in 2007, namely,
SM City Pampanga, SM City Cebu and Mall of Asia. Towards the end of 2008, three
malls were opened -- SM City Marikina, SM City Rosales and SM City Baliwag.
Likewise, the Megamall Atrium and The Annex at SM North Edsa were also opened in
the last quarter of 2008. The new malls and expansions added 705,000 square meters to
total gross floor area. Currently, the new malls have an average occupancy level of 93%.
Same store rental growth is at 5%.
In terms of gross revenues, the three malls in China contributed P0.83 billion in 2008 and
P0.62 billion in 2007, or 5% and 4% of total consolidated operating revenues,
respectively. Likewise, in terms rental revenues, the China operations contributed P0.81
billion in 2008 and P0.60 billion in 2007, or 5% and 4%, respectively, of SM Prime’s
consolidated rental revenue. Rental revenue of these three malls in China increased 35%
in 2008 compared to the same period in 2007. Average occupancy rate for the three malls
is at 88% in 2008 compared to 81% in 2007.
For the year 2008, cinema ticket sales were flat due to fewer movies shown and lack of
blockbuster movies compared to 2007. In 2008, major blockbusters shown were “A Very
Special Love,” “Twilight,” “Iron Man,” “For The First Time,” “Batman: The Dark
Knight,” and “Forbidden Kingdom.” In the same period 2007, major films shown were
“Spiderman 3,” “Transformers,” “Harry Potter 5,” “Ang Cute ng Ina Mo,” “One More
Chance.” In addition, there were also more Filipino movies shown in 2007 compared to
2008.
�
14
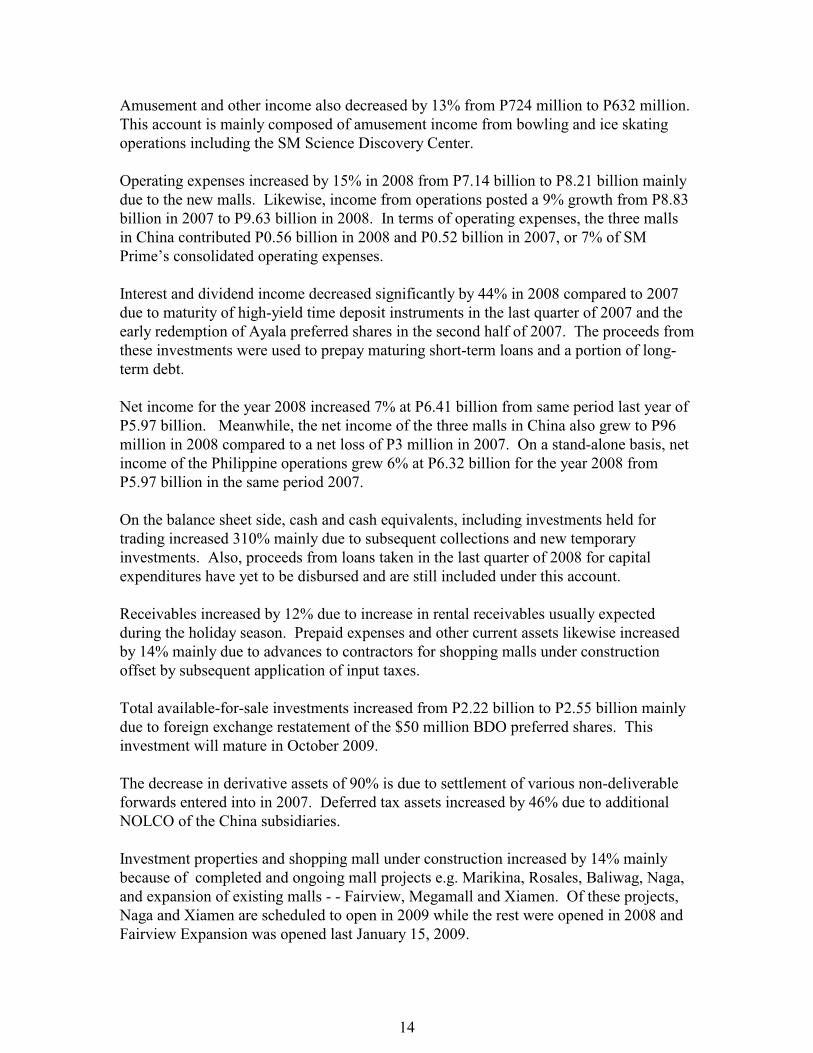
Amusement and other income also decreased by 13% from P724 million to P632 million.
This account is mainly composed of amusement income from bowling and ice skating
operations including the SM Science Discovery Center.
Operating expenses increased by 15% in 2008 from P7.14 billion to P8.21 billion mainly
due to the new malls. Likewise, income from operations posted a 9% growth from P8.83
billion in 2007 to P9.63 billion in 2008. In terms of operating expenses, the three malls
in China contributed P0.56 billion in 2008 and P0.52 billion in 2007, or 7% of SM
Prime’s consolidated operating expenses.
Interest and dividend income decreased significantly by 44% in 2008 compared to 2007
due to maturity of high-yield time deposit instruments in the last quarter of 2007 and the
early redemption of Ayala preferred shares in the second half of 2007. The proceeds from
these investments were used to prepay maturing short-term loans and a portion of long-
term debt.
Net income for the year 2008 increased 7% at P6.41 billion from same period last year of
P5.97 billion. Meanwhile, the net income of the three malls in China also grew to P96
million in 2008 compared to a net loss of P3 million in 2007. On a stand-alone basis, net
income of the Philippine operations grew 6% at P6.32 billion for the year 2008 from
P5.97 billion in the same period 2007.
On the balance sheet side, cash and cash equivalents, including investments held for
trading increased 310% mainly due to subsequent collections and new temporary
investments. Also, proceeds from loans taken in the last quarter of 2008 for capital
expenditures have yet to be disbursed and are still included under this account.
Receivables increased by 12% due to increase in rental receivables usually expected
during the holiday season. Prepaid expenses and other current assets likewise increased
by 14% mainly due to advances to contractors for shopping malls under construction
offset by subsequent application of input taxes.
Total available-for-sale investments increased from P2.22 billion to P2.55 billion mainly
due to foreign exchange restatement of the $50 million BDO preferred shares. This
investment will mature in October 2009.
The decrease in derivative assets of 90% is due to settlement of various non-deliverable
forwards entered into in 2007. Deferred tax assets increased by 46% due to additional
NOLCO of the China subsidiaries.
Investment properties and shopping mall under construction increased by 14% mainly
because of completed and ongoing mall projects e.g. Marikina, Rosales, Baliwag, Naga,
and expansion of existing malls - - Fairview, Megamall and Xiamen. Of these projects,
Naga and Xiamen are scheduled to open in 2009 while the rest were opened in 2008 and
Fairview Expansion was opened last January 15, 2009.

�
15
Other noncurrent assets increased 70% due to additional deposits paid and advances to
contractors for mall construction and deposits paid for leases of real properties.
Loans payable increased 130% due to availments for working capital. Long-term debt
increased mainly due to availment of a Php3 billion long-term facility in June 2008, a
Rmb500 million facility in the third quarter of 2008, and a US$75 million loan in
November 2008 for capital expansion projects.
The decrease in derivative liabilities is due to settlement of various non-deliverable
forwards entered into in 2007 and the continued weakening of the Php against the Usd.
The Company’s performance indicators are measured in terms of the following: (1) Ratio
of investment properties to total assets which measures the ratio of property and
equipment to total assets; (2) current ratio which measures the ratio of total current assets
to total current liabilities; (3) debt to equity which measures the ratio of interest bearing
liabilities to stockholders’ equity; (4) net debt to equity which measures the ratio of
interest bearing liabilities net of cash and cash equivalents and investment securities to
stockholders’ equity; (5) return on equity (ROE) which measures the ratio of net income
to capital provided by stockholders; (6) earnings before interest, income taxes,
depreciation and amortization (EBITDA); (7) debt to EBITDA which measures the ratio
of EBITDA to total interest-bearing liabilities; (8) EBITDA to interest expense which
measures the ratio of EBITDA to interest expense; (9) operating income to revenues
which basically measures the gross profit ratio; (10) EBITDA margin which measures the
ratio of EBITDA to gross revenues and, (11) net income to revenues which measures the
ratio of net income to gross revenues. The following discuss in detail the key
performance indicators of the Company.
The balance sheet remains robust with total investment properties accounting for 79%
and 86% of total assets as of December 31, 2008 and 2007, respectively. The Company’s
current ratio is steady at 1.09:1 and 1.01:1 as of December 31, 2008 and 2007,
respectively.
Interest-bearing debt to stockholders’ equity increased to 0.39:0.61 as of December 31,
2008 from 0.33:0.67 as December 31, 2007 due to additional loans for the period as
mentioned earlier. Net interest-bearing debt to stockholders’ equity remains healthy at
0.27:0.73 as of December 31, 2008 and 2007.
In terms of profitability, ROE remains steady at 14% for both years 2008 and 2007.
EBITDA increased 9% to P12.30 billion in 2008 from P11.33 billion in 2007. Debt to
EBITDA increased to 2.48:1 from 1.83:1 as of December 31, 2008 and 2007,
respectively. Likewise, EBITDA to interest expense slightly increased from 14.28:1 to
14.33:1 for the years ended December 31, 2007 and 2008, respectively. This is due to
additional loans in 2008.

�
16
Consolidated operating income to revenues remains steady at 54% in 2008 and 55% in
2007, despite the opening of new malls due to cost cutting measures implemented. On a
stand-alone basis, operating income margin of the Philippine and China operations is at
55% and 32%, respectively, in 2008.
EBITDA margin remains strong at 69% and 71% for the periods ended December 31,
2008 and 2007, respectively. On a stand-alone basis, EBITDA margin of the Philippines
and China operations is at 69% in 2008.
Likewise, net income to revenues is stable at 36% and 37% for the years ended December
31, 2008 and 2007. On a stand-alone basis, net income margin of the Philippines and
China operations is at 37% and 12%, respectively, in 2008.
The Company has no known direct or contingent financial obligation that is material to
the Company, including any default or acceleration of an obligation. There were no
contingent liabilities or assets in the Company’s balance sheet. The Company has no off-
balance sheet transactions, arrangements, obligations during the reporting year as of
balance sheet date.
There are no known trends, events, material changes, seasonal aspects or uncertainties
that are expected to affect the company’s continuing operations.
SM Prime currently has 33 Supermalls strategically located in the Philippines with a total
gross floor area of 4.3 million square meters. Likewise, the Company also has 3
Supermalls located in the cities of Xiamen, Jinjiang and Chengdu in China with a total
gross floor area of 0.5 million square meters.
In 2008, the Company opened SM City Marikina, SM City Baliwag and SM Supercenter
Rosales. The expansions of SM Megamall Atrium and The Annex at SM City North
Edsa were also opened. Total gross floor area, including the three malls in China, is now
at 4.7 million square meters from 4.4 million square meters as of end-2007.
Last November 13, 2007, the Board of SM Prime approved the acquisition of the three
SM malls in China. The SM malls in China are similar to the SM malls in the Philippines,
and are located in the southern and western parts of China namely, Xiamen, Jinjiang and
Chengdu. The move will allow SM Prime to gain a foothold in China’s fast-growing
economy and use this as a platform for long-term growth outside of the Philippines where
it is already the dominant shopping mall developer. On May 20, 2008, the SEC approved
the valuation of the share-for-share swap transaction with Grand China International
Limited (Grand China) and Oriental Land Development Limited (Oriental Land) and
confirmed that the issuance of shares is exempt from registration requirements. On May
28, 2008, the PSE approved the listing of 912,897,212 new shares which were issued to
Grand China and Oriental Land. Pursuant to the subscription agreements entered into
among SM Prime, Grand China and Oriental Land, the 912,897,212 were exchanged for
1,000 shares (100%) of Affluent Capital Enterprises Limited, holding company of the
malls in Xiamen and Chengdu, and 1 share (100%) of Mega Make Enterprises Limited,

�
17
holding company of the mall in Jinjiang, at a total swap price of P10,826 million. The
listing of the shares was completed on June 18, 2008.
As discussed in the consolidated financial statements, the acquisition of the three malls in
China was accounted for using the pooling of interests method of accounting. This
method of accounting is applied as the transaction involves businesses under common
control. Prior to the acquisition, the three SM malls in China were owned and controlled
by the Sy Family. PFRS 3, Business Combinations, provides for the purchase method in
accounting for business combinations except for business combinations of entities or
businesses under common control. Under the pooling of interests method, the assets and
liabilities of the acquired companies are recorded at book values and comparative
amounts are restated as if the business combination had taken place at the beginning of
the earliest comparative period presented.
2007
Financial and Operational Highlights
(In Million Pesos, except for financial ratios) �
�
Twelve months ended Dec 31
2007 2006 % Change
Profit & Loss Data
Revenues 15,350 13,222 16%
Operating Expenses 6,621 5,565 19%
Operating Income 8,728 7,657 14%
Net Income 5,975 5,449 10%
EBITDA 10,989 9,444 16%
�
Dec 31 Dec 31
2007 2006 % Change
Balance Sheet Data
Total Assets 67,434 70,792 -5%
Total Debt 17,196 25,873 -34%
Net Debt 12,713 12,727 0%
Total Stockholders' Equity 38,858 35,672 9%
Financial Ratios
Fixed Assets to Total Assets 0.85 0.73
Stockholders' Equity to Total Assets 0.58 0.50
Current Ratio 1.24 1.03
Debt to Equity 0.31 : 0.69 0.42 : 0.58
Net Debt to Equity 0.25 : 0.75 0.26 : 0.74
Return on Equity 0.15 0.15
�
18
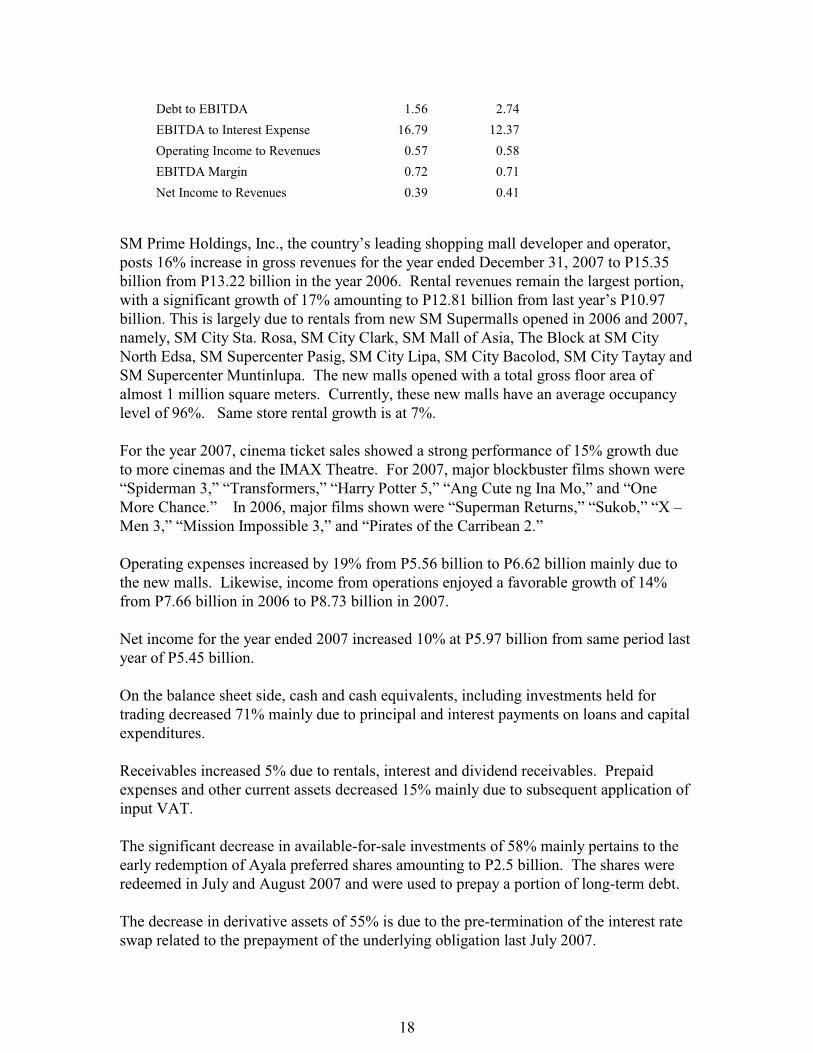
Debt to EBITDA 1.56 2.74
EBITDA to Interest Expense 16.79 12.37
Operating Income to Revenues 0.57 0.58
EBITDA Margin 0.72 0.71
Net Income to Revenues 0.39 0.41
�
�
SM Prime Holdings, Inc., the country’s leading shopping mall developer and operator,
posts 16% increase in gross revenues for the year ended December 31, 2007 to P15.35
billion from P13.22 billion in the year 2006. Rental revenues remain the largest portion,
with a significant growth of 17% amounting to P12.81 billion from last year’s P10.97
billion. This is largely due to rentals from new SM Supermalls opened in 2006 and 2007,
namely, SM City Sta. Rosa, SM City Clark, SM Mall of Asia, The Block at SM City
North Edsa, SM Supercenter Pasig, SM City Lipa, SM City Bacolod, SM City Taytay and
SM Supercenter Muntinlupa. The new malls opened with a total gross floor area of
almost 1 million square meters. Currently, these new malls have an average occupancy
level of 96%. Same store rental growth is at 7%.
For the year 2007, cinema ticket sales showed a strong performance of 15% growth due
to more cinemas and the IMAX Theatre. For 2007, major blockbuster films shown were
“Spiderman 3,” “Transformers,” “Harry Potter 5,” “Ang Cute ng Ina Mo,” and “One
More Chance.” In 2006, major films shown were “Superman Returns,” “Sukob,” “X –
Men 3,” “Mission Impossible 3,” and “Pirates of the Carribean 2.”
Operating expenses increased by 19% from P5.56 billion to P6.62 billion mainly due to
the new malls. Likewise, income from operations enjoyed a favorable growth of 14%
from P7.66 billion in 2006 to P8.73 billion in 2007.
Net income for the year ended 2007 increased 10% at P5.97 billion from same period last
year of P5.45 billion.
On the balance sheet side, cash and cash equivalents, including investments held for
trading decreased 71% mainly due to principal and interest payments on loans and capital
expenditures.
Receivables increased 5% due to rentals, interest and dividend receivables. Prepaid
expenses and other current assets decreased 15% mainly due to subsequent application of
input VAT.
The significant decrease in available-for-sale investments of 58% mainly pertains to the
early redemption of Ayala preferred shares amounting to P2.5 billion. The shares were
redeemed in July and August 2007 and were used to prepay a portion of long-term debt.
The decrease in derivative assets of 55% is due to the pre-termination of the interest rate
swap related to the prepayment of the underlying obligation last July 2007.
�
19
Other noncurrent assets decreased 3% due to subsequent liquidation and application of
deposits paid and advances to contractors.
The increase in investment properties and shopping malls under construction of 11% is
mainly due to completed projects e.g. SM City Bacolod, SM City Taytay, SM City Cebu
Annex, SM Supercenter Muntinlupa, SM City Pampanga Expansion, the Science
Discovery Center at the Mall of Asia, and the San Miguel by the Bay. Included under
shopping malls under construction are SM City Marikina and SM North Edsa Expansion.
Loans payable decreased 93% due to principal payments. Likewise, long-term debt also
decreased 7% due to principal amortization and prepayment of loans amounting to P3.5
billion. In 2007, the Company availed P4 billion used for capital expenditure
requirements and to prepay a portion of long-term debt.
The increase in accounts payable and accrued expenses of 37% is due to construction
activities, accrued operating expenses and liability for purchased land. Tenants’ deposits
and others increased 10% due to the new malls in 2007.
The increase in derivative liabilities is due to the non-deliverable forwards in 2007 with a
notional amount of $160 million and the additional marked-to-market losses arising from
the cross currency swap entered into in 2004 and maturing in 2009.
Unrealized gain on available-for-sale investments included under “Stockholders’ Equity”
account in the balance sheets decreased 73% due to adjustments related to early
redemption of Ayala preferred shares.
The Company’s performance indicators are measured in terms of the following: (1)
Ratio of investment properties to total assets which measures the ratio of property and
equipment to total assets; (2) current ratio which measures the ratio of total current assets
to total current liabilities; (3) debt to equity which measures the ratio of interest bearing
liabilities to stockholders’ equity; (4) net debt to equity which measures the ratio of
interest bearing liabilities net of cash and cash equivalents and investment securities to
stockholders’ equity; (5) return on equity (ROE) which measures the ratio of net income
to capital provided by stockholders; (6) earnings before interest, income taxes,
depreciation and amortization (EBITDA); (7) debt to EBITDA which measures the ratio
of EBITDA to total interest-bearing liabilities; (8) EBITDA to interest expense which
measures the ratio of EBITDA to interest expense; (9) operating income to revenues
which basically measures the gross profit ratio; (10) EBITDA margin which measures the
ratio of EBITDA to gross revenues and, (11) net income to revenues which measures the
ratio of net income to gross revenues. The following discuss in detail the key
performance indicators of the Company.
The balance sheet remains robust with total investment properties accounting for 85%
and 73% of total assets as of December 31, 2007 and 2006, respectively. The Company’s
current ratio is steady at 1.24:1 and 1.03:1 as of December 31, 2007 and 2006,
respectively.

�
20
Interest-bearing debt to stockholders’ equity significantly decreased to 0.31:0.69 from
0.42:0.58 as of December 31, 2007 and 2006, respectively, due to principal amortizations
and debt prepayments. Net interest-bearing debt to stockholders’ equity remains strong at
0.25:0.75 and 0.26:0.74 as of December 31, 2007 and 2006, respectively.
In terms of profitability, ROE remains steady at 15% for the years ended December 31,
2007 and 2006.
EBITDA increased 16% to P10.99 billion for the year 2007 from P9.44 billion in 2006.
Debt to EBITDA decreased at 1.56:1 from 2.74:1 as of December 31, 2007 and 2006,
respectively. Likewise, EBITDA to interest expense increased from 12.37:1 to 16.79:1
for the years ended December 31, 2006 and 2007, respectively.
Operating income to revenues remains steady at 57% and 58% in 2007 and 2006,
respectively, despite the new malls, due to cost cutting measures implemented in the
malls. EBITDA margin remains strong at 72% for the year ended December 31, 2007
and 71% in the year ended December 31, 2006. Likewise, net income to revenues
decreased to 39% for the year ended December 31, 2007 compared to 41% for the year
ended December 31, 2006, mainly due to decrease in dividend income and increase in
provision for income tax.
The Company has no known direct or contingent financial obligation that is material to
the Company, including any default or acceleration of an obligation. There were no
contingent liabilities or assets in the Company’s balance sheet. The Company has no off-
balance sheet transactions, arrangements, obligations during the reporting year as of
balance sheet date.
There are no known trends, events, material changes, seasonal aspects or uncertainties
that are expected to affect the company’s continuing operations.
SM Prime currently has 30 Supermalls strategically located nationwide with a total gross
floor area of 3.9 million square meters.
In 2007, the Company opened SM City Bacolod, SM City Taytay and SM Supercenter
Muntinlupa. Expansion of existing malls -- SM City Cebu – Annex, The Science
Discovery Center in the Mall of Asia, SM City Pampanga and the San Miguel by the Bay
at the Mall of Asia Complex were also completed.
In 2008, the Company is scheduled to open SM City Marikina, SM City Baliuag and SM
Supercenter Rosales. Expansion of SM Megamall and SM City Fairview are also
underway. Total gross floor area will increase to 4.1 million square meters by end 2008
from 3.9 million square meters as of December 31, 2007.
Last November 13, 2007, the Board of SM Prime approved the acquisition of the three
SM malls in China. The SM malls in China are similar to the SM malls in the Philippines,

�
21
and are located in the southern and western parts of China namely, Xiamen, Jinjiang and
Chengdu. The move will allow SM Prime to gain a foothold in China’s fast-growing
economy and use this as a platform for long-term growth outside of the Philippines where
it is already the dominant shopping mall developer.
2006
Financial and Operational Highlights
(In Million Pesos, except for financial ratios)
Twelve months ended Dec 31
2006 2005 % Change
Profit & Loss Data
Operating Revenues 13,222 10,905 21%
Operating Expenses 5,565 4,850 15%
Operating Income 7,657 6,055 26%
Net Income 5,449 4,973 10%
EBITDA 9,444 7,513 26%
Dec 31 Dec 31
2006 2005 % Change
Balance Sheet Data
Total Assets 70,792 59,429 19%
Total Debt 25,873 19,735 31%
Net Debt 12,727 9,392 36%
Total Stockholders' Equity 35,672 32,550 10%
Financial Ratios
Fixed Assets to Total Assets 0.73 0.76
Current Ratio 1.03 1.12
Debt to Equity 0.42:0.58 0.38:0.62
Net Debt to Equity 0.26:0.74 0.22:0.78
Return on Equity 0.15 0.15
Debt to EBITDA 2.74 2.63
EBITDA to Interest Expense 12.37 26.96
Operating Income to Revenues 0.58 0.56
EBITDA Margin 0.71 0.69
Net Income to Revenues 0.41 0.46
SM Prime Holdings, Inc., the country’s leading shopping mall developer and operator,
posts 21% increase in gross revenues for the year 2006 to P13.2 billion from P10.9 billion
in 2005. Rental revenues remain the largest portion, with a significant growth of 22%
amounting to P11.0 billion from last year’s P9.0 billion. This is largely due to rentals
from new SM Supermalls opened in the second half of 2005 and the year 2006, namely,

�
22
SM City San Lazaro, SM Supercenter Valenzuela, SM Supercenter Molino, SM City Sta.
Rosa, SM City Clark, SM Mall of Asia, SM Supercenter Pasig, The Block at SM North
Edsa and SM City Lipa. The new malls opened with a total gross floor area of 1.0
million square meters. Currently, these new malls have an average occupancy level of
95%. Same store rental growth is at 7%.
Cinema ticket sales showed a strong performance of 22% increase due to more
blockbuster films in 2006 compared to the same period in 2005 and the huge success of
the 2006 Metro Manila Film Festival. For the year 2006, major blockbuster films shown
were “Superman Returns,” “Sukob,” “X – Men 3,” “Mission Impossible 3,” and “Pirates
of the Carribean 2.” In 2005, major films shown were “Harry Potter 4,” “King Kong,”
“Dubai,” “D Anothers,” and “Let the Love Begin.”
Operating expenses increased by 15% from P4.85 billion to P5.57 billion mainly due to
the new malls. Income from operations enjoyed a favorable growth of 26% from P6.05
billion in 2005 to P7.66 billion in 2006.
Net income in 2006 increased 10% at P5.45 billion from last year’s P4.97 billion. The
decrease in interest and dividend income is mainly due to the sale of investments held for
trading, while the increase in interest expense is the result of additional borrowings.
Corporate income tax rates were also increased from 32% to 35% effective November 1,
2005 as required by R.A. No. 9337.
On the balance sheet side, cash and cash equivalents, including investments held for
trading increased 52% due to the new malls and proceeds from new loans net of capital
expenditures and principal and interest payments. Receivables increased 32% due to
increase in rent income from the new malls and accruals for interest and dividend income.
The increase in prepaid expenses and other current assets of 79% is mainly due to input
taxes from construction activities. Other noncurrent assets increased 48% due to deposits
paid for leased properties and advances to contractors.
The increase in investment properties of 14% is mainly due to construction activities
related to completed projects like SM City Sta. Rosa, SM City Clark, SM Mall of Asia,
The Block at SM North Edsa, SM Supercenter Pasig, SM City Lipa and SM City
Bacolod. Ongoing projects are SM City Taytay, SM City Cebu Annex, and SM
Supercenter Muntinlupa.
Loans payable increased 151% due to additional short-term, peso-denominated and
dollar-denominated loans amounting to P1.69 billion and $68.05 million, respectively,
availed during 2006, net of principal payments. Likewise, long-term debt also increased
due to the P3 billion floating rate note facility availed from Metrobank in June 2006 and
the P1.2 billion fixed rate note facility from Philamlife in August 2006. The borrowings
were availed to finance capital expenditure requirements.

�
23
The Company’s performance indicators are measured in terms of the following: (1) Ratio
of investment properties to total assets which measures the ratio of property and
equipment to total assets; (2) current ratio which measures the ratio of total current assets
to total current liabilities; (3) debt to equity which measures the ratio of interest bearing
liabilities to stockholders’ equity; (4) net debt to equity which measures the ratio of
interest bearing liabilities net of cash and cash equivalents and investment securities to
stockholders’ equity; (5) return on equity (ROE) which measures the ratio of net income
to capital provided by stockholders; (6) earnings before interest, income taxes,
depreciation and amortization (EBITDA); (7) debt to EBITDA which measures the ratio
of EBITDA to total interest-bearing liabilities; (8) EBITDA to interest expense which
measures the ratio of EBITDA to interest expense; (9) operating income to revenues
which basically measures the gross profit ratio; (10) EBITDA margin which measures the
ratio of EBITDA to gross revenues and, (11) net income to revenues which measures the
ratio of net income to gross revenues. The following discuss in detail the key
performance indicators of the Company.
The balance sheet remains robust with total investment properties accounting for 73%
and 76% of total assets as of December 31, 2006 and 2005, respectively. The Company’s
current ratio is steady at 1.03:1 as of December 31, 2006 and 1.12:1 as of December 31,
2005.
Interest-bearing debt to stockholders’ equity slightly increased to 0.42:0.58 from
0.38:0.62 as of December 31, 2006 and 2005, respectively. Net interest-bearing debt to
stockholders’ equity remains strong at 0.26:0.74 and 0.22:0.78 as of December 31, 2006
and 2005, respectively.
In terms of profitability, ROE remains steady at 15% for both years 2006 and 2005.
EBITDA increased 26% to P9.44 billion for the year 2006 from P7.5 billion in 2005.
Debt to EBITDA slightly increased at 2.74:1 from 2.63:1 as of December 31, 2006 and
2005, respectively. EBITDA to interest expense however decreased from 26.96:1 to
12.37:1 from the year 2005 to 2006 due to increase in interest expense.
Operating income to revenues increased to 58% in 2006 from 56% in 2005. EBITDA
margin remains strong at 71% and 69% for the years ended 2006 and 2005, respectively.
On the other hand, net income to revenues decreased at 41% compared to 46% for the
year ended 2006 and 2005, respectively, mainly due to increase in interest expense and
provision for income tax.
The Company has no known direct or contingent financial obligation that is material to
the Company, including any default or acceleration of an obligation. There were no
contingent liabilities or assets in the Company’s balance sheet. The Company has no off-
balance sheet transactions, arrangements, obligations during the reporting year as of
balance sheet date.

�
24
There are no known trends, events, material changes, seasonal aspects or uncertainties
that are expected to affect the company’s continuing operations.
SM Prime currently has 28 Supermalls strategically located nationwide with a total gross
floor area of 3.6 million square meters.
Last May 21, 2006, the Company opened the Mall of Asia to a huge crowd of close to a
million. Located on a 60 hectare property overlooking Manila Bay, the 386,000 square
meter complex consists of four buildings linked by elevated walkways - Main Mall, the
North Parking Building, the South Parking Building, and the Entertainment Center
Building. Other malls opened in 2006 were SM City Sta. Rosa, SM City Clark, SM
Supercenter Pasig and SM City Lipa.
The Company opened its 28th mall, SM City Bacolod in March 2, 2007. Other malls
scheduled to open in 2007 are SM City Taytay and SM Supercenter Muntinlupa.
Ongoing expansion of existing malls, SM City Cebu – Annex, The Science Discovery
Center in the Mall of Asia and the Sunset Strip at the Espalanade in SM BayCity, SM
City Pampanga and SM City Fairview are also underway. Total gross floor area will
increase to 3.9 million square meters by end 2007 from 3.6 million square meters as of
December 31, 2006.
ITEM 7. Financial Statements
Please see the attached consolidated financial statements and schedules listed in the
accompanying Index to Financial Statements and Supplementary Schedules.
ITEM 8. Information on Independent Accountant and Other Related Matters
Sycip, Gorres, Velayo & Company is the external auditor for the current year. The same external auditor will be recommended for re-appointment at the scheduled annual stockholders’ meeting. Representatives of the said firm are expected to be present at the stockholders’ meeting and they will have the opportunity to make a statement if they desire to do so and are expected to be available to respond to appropriate questions.
Pursuant to SRC Rule 68.1 (Qualification and Reports of Independent Auditors), the Company engaged Mr. Ramon D. Dizon of SGV & Co starting year 2009. Previously, the Company engaged Ms. Melinda G. Manto of SGV & Co for the examination of the Company’s financial statements from 2006 up to 2008.
The Company and its subsidiaries paid SGV & Co P1.6 million and P1.5 million for external audit services for the years 2008 and 2007, respectively. There were no other professional services rendered by SGV & Co during the period. Tax consultancy services are secured from other entities other than the external auditor.
The Audit Committee recommends to the Board of Directors the appointment of the external auditor and the fixing of the audit fees. The BOD and the stockholders approve the Audit Committee’s recommendation.

�
25
PART III- CONTROL AND COMPENSATION INFORMATION
ITEM 9. Directors and Executive Officers of the Registrant
DIRECTORS AND EXECUTIVE OFFICERS
Office Name Citizenship Age
Chairman Henry Sy, Sr. Filipino 84
Vice Chairman Jose L. Cuisia, Jr. Filipino 65
Independent Director Gregorio U. Kilayko Filipino 54
Director and President Hans T. Sy Filipino 53
Director Senen T. Mendiola Filipino 82
Director Henry T. Sy, Jr. Filipino 55
Director Herbert T. Sy Filipino 52
Adviser to the Board of Directors Teresita T. Sy Filipino 58
Executive Vice President and Chief Finance
Officer Jeffrey C. Lim Filipino 47
Senior Vice President – Legal and Corporate
Affairs/ Compliance Officer/ Assistant
Corporate Secretary Corazon I. Morando Filipino 67
Senior Vice President – Marketing Elizabeth T. Sy Filipino 56
Vice President – Market Research and Planning Ronald G. Tumao Filipino 50
Vice President – Internal Audit Head Christopher S. Bautista Filipino 49
Vice President – Information Technology Kelsey Hartigan Y. Go Filipino 43
Vice President – Finance Diana R. Dionisio Filipino 36
Corporate Secretary/ Asst. Compliance Officer Emmanuel C. Paras Filipino 59
Board of Directors
Henry Sy, Sr. has served as Chairman of the Board of Directors of SM Prime since 1994.
He is the founder of the SM Group and is currently Chairman Emeritus of Banco de Oro
Unibank, Inc., Honorary Chairman of China Banking Corporation, Chairman of SM
Land, Inc. (formerly Shoemart, Inc.), SM Investments Corp., Highlands Prime, Inc. and
SM Development Corp. He opened the first ShoeMart store in 1958 and has been at the
fore in SM Group’s diversification into the commercial centers, retail merchandising,
financial services, and real estate development and tourism businesses.
Jose L. Cuisia, Jr.* has served as Vice Chairman of the Board of Directors of SM Prime
since 1994. He is the President and Chief Executive Officer of the Philippine American
Life Insurance Company, and he is concurrently Chairman of the Board of various
companies within the Philamlife Group. He is also a Director of several PHINMA-
managed companies. Previously, he served as Governor of the Bangko Sentral ng
Pilipinas from 1990 to 1993 and Administrator of the Social Security System from 1986
to 1990.
Gregorio U. Kilayko* is the Chairman of ABN Amro’s banking operations in the
Philippines. He was the founding head of ING Baring’s stockbrokerage and investment
banking business in the Philippines and a Philippine Stock Exchange Governor in 1996

�
26
and 2000. He was a director of the demutualized Philippine Stock Exchange in 2003. At
present, he is also an independent director of Highlands Prime, Inc. He was elected as
Independent Director in 2008. �
* Independent director – the Company has complied with the Guidelines set forth by
SRC Rule 38, as amended, regarding the Nomination and Election of Independent
Director. The Company’s By-Laws incorporate the procedures for the nomination and
election of independent director/s in accordance with the requirements of the said Rule.
Hans T. Sy, President, has served as Director since 1994 and was Senior Vice President
for Operations. He holds many key positions in the SM Group. He is First Executive
Vice President of SM Investments Corporation, Director of and Vice Chairman of China
Banking Corporation, Director of Highlands Prime, Inc., SM Land, Inc. (formerly
Shoemart, Inc.) and Belle Corporation. He also holds board positions in several
companies within the Group. He is a mechanical engineering graduate of De La Salle
University.
Senen Mendiola has served as Director since 1994. He is Vice Chairman of a number of
SM Group companies and holds a number of board positions within the Group. A
graduate of the San Beda College with a Bachelor’s degree in commerce, he has worked
closely with Mr. Henry Sy, Sr. for more than four decades.
Henry Sy, Jr. has served as Director since 1994. He is responsible for the real estate
acquisitions and development activities of the SM Group which include the identification,
evaluation and negotiation for potential sites as well as the input of design ideas. At
present, he is also Vice Chairman/President of SM Land, Inc.(formerly Shoemart, Inc.),
Vice Chairman of SM Investments Corporation, SM Development Corporation and
Highlands Prime, Inc., Director in Banco de Oro Unibank, Inc. and Chairman of Pico de
Loro Beach and Country Club Inc. He graduated with a management degree from De La
Salle University.
Herbert T. Sy has served as Director since 1994. He holds a Bachelor’s degree in
management from De La Salle University. At present, he is First Executive Vice
President of SM Investments Corporation, and Director of SM Land, Inc. (formerly
Shoemart, Inc.) and China Banking Corporation. He is actively involved in the SM
Group’s supermarket and hypermarket businesses.
Teresita T. Sy has served as Adviser to the Board since May 2008. She was previously a
Director since 1994 up to April 2008. She has worked with the Group for over 20 years
and has varied experiences in retail merchandising, mall development and banking
businesses. A graduate of Assumption College, she was actively involved in ShoeMart’s
development. At present, she is Chairman of Banco de Oro Unibank, Inc., Vice
Chairman of SM Investments Corporation and Director of SM Land, Inc. (formerly
Shoemart Inc.). She also holds board positions in several companies within the SM
Group.

�
27
Members of the Board of Directors are given a standard per diem of P10,000 per meeting,
except for the Chairman and Vice Chairman which are given P20,000 per meeting.
Senior Management
Jeffrey C. Lim is the Executive Vice President and the Chief Finance Officer. He is a
Certified Public Accountant and holds a Bachelor of Science degree in Accounting from
the University of the East. Prior to joining the Company, he worked for a multi-national
company and SyCip Gorres Velayo & Co.
Elizabeth T. Sy, Senior Vice President for Marketing, is also involved in investor
relations of the Company. She is a Director of SM Development Corporation and SM
Land, Inc. (formerly Shoemart, Inc.), Chairman of Pico de Loro Beach and Country Club
Inc. and Treasurer of SM Investments Corporation. She is also actively involved in the
Group’s other tourism and leisure business endeavors, overseeing operations as well as
other marketing and real estate activities.
Corazon I. Morando is the Senior Vice President for Legal and Corporate Affairs/
Compliance Officer/ and Assistant Corporate Secretary of the Company and SM
Investments Corporation. She is also Corporate Secretary of Highlands Prime, Inc and
China Banking Corporation. She holds a Bachelor of Law degree from the University of
the Philippines and formerly the Director of the Corporate and Legal Department of the
Securities and Exchange Commission in the Philippines.
Ronald G. Tumao is the Vice President for Market Research & Planning. He graduated from De La Salle University with a degree in BSC - Management of Financial Institutions. He later took his MBA at the Ateneo Graduate School in Makati City. He has over 10 years of experience in banking and finance and more than 10 years experience in brand management and consumer marketing. He is in charge of property acquisition for SM. He joined the Company in 2001.
Christopher S. Bautista is the Vice President for Internal Audit (Chief Audit Executive). He was formerly the Chief Finance Officer of a large palm oil manufacturer based in Jakarta, Indonesia and was a partner (principal) for several years of an audit and management consulting firm based also in Jakarta. He started his professional career as staff auditor of SyCip, Gorres, Velayo & Co. He joined the Company in 1998. Kelsey Hartigan Y. Go is the Vice-President for Information Technology. He holds a
Bachelor's Degree in Electronics & Communications Engineering and a Masters of
Science Degree in Computer Science, both from the De La Salle University, Manila. He
was previously a professor of a university in the Philippines and was concurrently the
Director of the Information Systems Center of the same university. He joined the
Company in 1997.
Diana R. Dionisio is the Vice President for Finance. She holds a Bachelor's degree in
Accountancy from the University of Santo Tomas. Prior to joining the company, she was
the accounting manager of a real property company. She started her professional career
as staff auditor of Sycip, Gorres, Velayo & Co. She joined the Company in 1999.

�
28
Emmanuel C. Paras, is the Corporate Secretary and Asst. Compliance Officer of the
Company and other companies in the SM Group. He is a Bachelor of Law graduate of
the Ateneo de Manila and a partner of the SyCip Salazar Hernandez and Gatmaitan Law
Offices.
All the Directors and executive officers of the Company, except those otherwise stated,
have held their positions since the Company started operations in 1994.
The Directors of the Company are elected at the annual stockholders’ meeting to hold
office until the next succeeding annual meeting and until their respective successors have
been appointed or elected and qualified. The same set of directors will be nominated in
the coming regular annual stockholders’ meeting.
Aside from the Directors and Executive Officers enumerated above, there are no other
employees expected to hold significant executive/officer position in the Company.
The following are directorships held by Directors and Executive Officers in other
reporting companies at least, in the last five years:
Henry Sy, Sr.
Name of Corporation Position
SM Investments Corporation.......................................... Chairman
Highlands Prime, Inc. ..................................................... Chairman
SM Development Corporation ....................................... Chairman
China Banking Corporation............................................ Honorary Chairman
Banco de Oro Unibank, Inc... ......................................... Chairman Emeritus
Jose L. Cuisia, Jr.
Name of Corporation Position
The Philippine American Life & General Co.
(Philamlife).....................................................................
President/ CEO/ Director
Philam Care Health Systems, Inc. .................................. Chairman
Philam Asset Management, Inc.. .................................... Chairman
Philam Equitable Life Assurance Co.............................. Chairman
AIG Philam Savings Bank.............................................. Vice Chairman
Philam Plans Inc... .......................................................... Chairman

�
29
Name of Corporation Position
Tower Club, Inc... ........................................................... Chairman
Bacnotan Consolidated Industries, Inc... ........................ Director
Holcim Philippines, Inc.... .............................................. Director
Investment Capital Corporation of the Philippines... ..... Director
Union Galvasteel Corporation........................................ Director
Bauang Private Power Corporation... ............................. Director
Gregorio U. Kilayko
Name of Corporation Position
Highlands Prime, Inc. ..................................................... Director
Belle Corporation. .......................................................... Director
Henry T. Sy, Jr.
Name of Corporation Position
SM Development Corporation ........................................ Director/ Vice Chairman/ Chief
Executive Officer
Highlands Prime, Inc... .................................................... Director/ Vice Chairman
Belle Corporation... ......................................................... Director/ Vice Chairman
SM Investments Corporation........................................... Director/Vice Chairman
Pico de Loro Beach and Country Club Inc...................... Chairman
Banco de Oro Unibank, Inc... .......................................... Director
Hans T. Sy
Name of Corporation Position
China Banking Corporation............................................ Director/ Vice Chairman/
Chairman of ExCom
Belle Corporation ........................................................... Director
Highlands Prime, Inc. ..................................................... Director

�
30
Name of Corporation Position
SM Investments Corporation.......................................... First Executive Vice President
Herbert T. Sy
Name of Corporation Position
China Banking Corporation ........................................... Director
SM Investments Corporation ......................................... First Executive Vice President
Teresita T. Sy
Name of Corporation Position
Banco de Oro Unibank, Inc. ........................................... Chairperson
SM Investments Corp. ..................................................... Director/Vice Chairman
Elizabeth T. Sy
Name of Corporation Position
Pico de Loro Beach and Country Club Inc...................... Chairman
SM Development Corporation ........................................ Director
SM Investments Corporation........................................... Treasurer
Involvement in Legal Proceedings
The Company is not aware of any of the following events having occurred during the past
five years up to the date of this report that are material to an evaluation of the ability or
integrity of any director or any member of senior management of the Company:
(a) any bankruptcy petition filed by or against any business of which such person was
a general partner or executive officer either at the time of the bankruptcy or
within two years prior to that time;
(b) any conviction by final judgment, including the nature of the offense, in a
criminal proceeding, domestic or foreign, or being subject to a pending criminal
proceeding, domestic or foreign, excluding traffic violations and other minor
offenses;
(c) being subject to any order, judgment or decree, not subsequently reversed,
suspended or vacated, of any court of competent jurisdiction, domestic or foreign,
permanently or temporarily enjoining, barring suspending or otherwise limiting

�
31
his involvement in any type of business, securities, commodities or banking
activities; and
(d) being found by a domestic or foreign court of competent jurisdiction (in a civil
action), the SEC or comparable foreign body, or a domestic or foreign exchange
or other organized trading market or self-regulatory organization, to have violated
a securities or commodities law or regulation, and the judgment has not been
reversed, suspended or vacated.
(e) a securities or commodities law or regulation, and the judgment has not been
reversed, suspended or vacated.
The members of the Audit and Corporate Governance Committee are:
Jose L. Cuisia, Jr. - Chairman (Independent Director)
Gregorio U. Kilayko - Member (Independent Director)
Senen T. Mendiola - Member
Jose T. Sio - Member
Serafin U. Salvador - Member Corazon I. Morando - Member
The members of the Compensation Committee are:
Hans T. Sy - Chairman
Gregorio U. Kilayko - Member (Independent Director)
Jose T. Sio - Member
The members of the Nomination Committee are:
Henry Sy, Sr. - Chairman
Jose L. Cuisia, Jr. - Member (Independent Director)
Corazon I. Morando - Member The Nomination Committee created by the Board under its Corporate Governance Manual nominated the following for re-election to the Board of Directors at the forthcoming Annual Stockholders’ Meeting:
Henry Sy, Sr. Jose L. Cuisia, Jr. Gregorio U. Kilayko Henry T. Sy, Jr. Hans T. Sy Herbert T. Sy Senen T. Mendiola
Mr. Jeffrey C. Lim nominated to the Board for inclusion in the Final List of Candidates for Independent Directors the following stockholders:
Jose L. Cuisia, Jr. Gregorio U. Kilayko
Mr. Jeffrey C. Lim is not related to Mr. Jose L. Cuisia and Mr. Gregorio U. Kilayko.
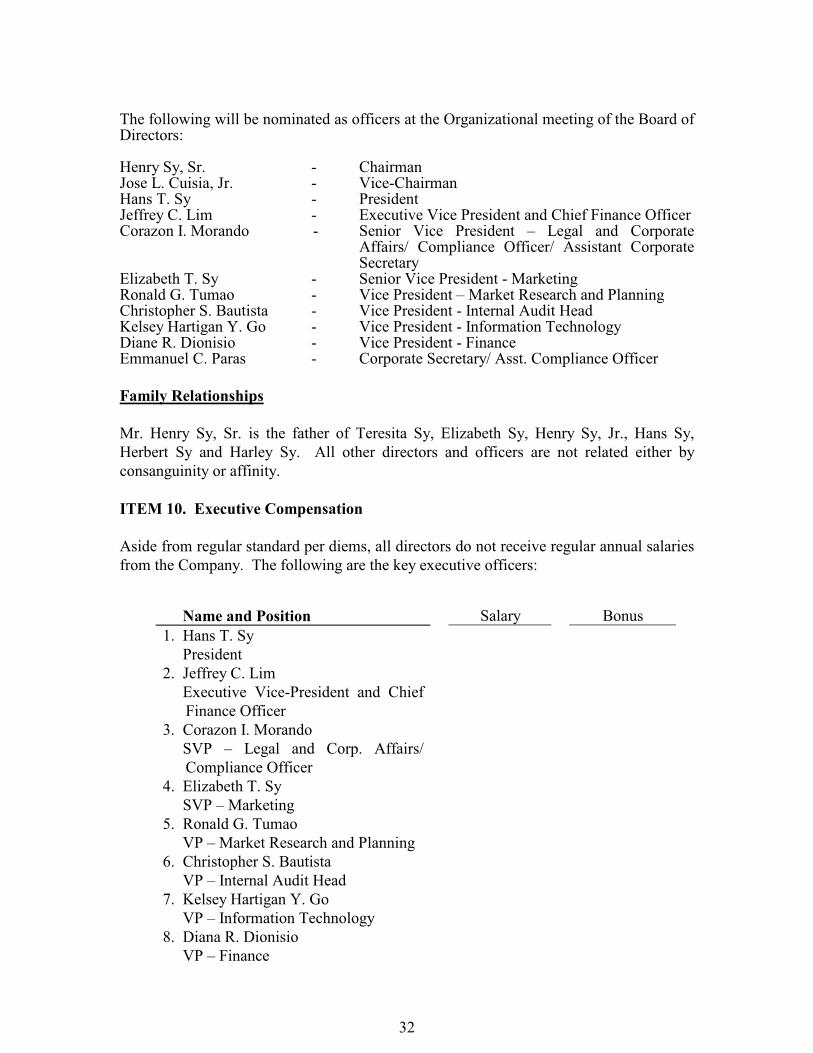
�
32
The following will be nominated as officers at the Organizational meeting of the Board of Directors:
Henry Sy, Sr. - Chairman Jose L. Cuisia, Jr. - Vice-Chairman Hans T. Sy - President Jeffrey C. Lim - Executive Vice President and Chief Finance Officer Corazon I. Morando - Senior Vice President – Legal and Corporate
Affairs/ Compliance Officer/ Assistant Corporate Secretary
Elizabeth T. Sy - Senior Vice President - Marketing Ronald G. Tumao - Vice President – Market Research and Planning Christopher S. Bautista - Vice President - Internal Audit Head Kelsey Hartigan Y. Go - Vice President - Information Technology Diane R. Dionisio - Vice President - Finance Emmanuel C. Paras - Corporate Secretary/ Asst. Compliance Officer
Family Relationships
Mr. Henry Sy, Sr. is the father of Teresita Sy, Elizabeth Sy, Henry Sy, Jr., Hans Sy,
Herbert Sy and Harley Sy. All other directors and officers are not related either by
consanguinity or affinity.
ITEM 10. Executive Compensation
Aside from regular standard per diems, all directors do not receive regular annual salaries
from the Company. The following are the key executive officers:�
�
Name and Position Salary Bonus
1. Hans T. Sy
President
2. Jeffrey C. Lim
Executive Vice-President and Chief
Finance Officer
3. Corazon I. Morando
SVP – Legal and Corp. Affairs/
Compliance Officer
4. Elizabeth T. Sy
SVP – Marketing
5. Ronald G. Tumao
VP – Market Research and Planning
6. Christopher S. Bautista
VP – Internal Audit Head
7. Kelsey Hartigan Y. Go
VP – Information Technology
8. Diana R. Dionisio
VP – Finance

�
33
Summary Compensation Table
Aggregate compensation paid to
all officers and directors as a
group
(estimate) Year 2009
P=20,000,000
P=32,500,000
2008 18,000,000 32,500,000
2007 16,000,000 32,500,000
2006 12,650,000 22,800,000 �
Certain officers of the Company are seconded from SM Investments Corporation.
There are no actions to be taken with regard to election, any bonus or profit-sharing,
change in pension/ retirement plan, granting of or extension of any options, warrants or
rights to purchase any securities.�
�
ITEM 11. Security Ownership of Certain Beneficial Owners and Management
(1) Security Ownership of Certain Record and Beneficial Owners
�
As of February 28, 2009, the following are the owners of SMPHI’s common stock in excess of 5% of total outstanding shares:
Title of
Securities
Name and Address of
Record Owner and Relationship
with Issuer
Name of
Beneficial
Owner and
Relationship
with Record
Owner
Citizenship
Amount and Nature
of Direct
Record/Beneficial
Ownership (“r” or
“b”)
Percent of
Class (%)
Common SM Land, Inc. (formerly
Shoemart, Inc.), (Related
Company)1
OneEcom Center, Harbor Drive,
Mall of Asia Complex, CBP-1A,
Pasay CIty
SM Land,
Inc.
(formerly
Shoemart,
Inc. 2
Filipino 5,945,158,593 (b) 44.54
-do- SM Investments Corporation
(SMIC) (Parent Company)3
OneEcom Center, Harbor Drive,
Mall of Asia Complex, CBP-1A,
Pasay CIty
SMIC4 Filipino
2,757,559,722 (b) 20.66
-do- PCD Nominee Corp. 5
MSE Bldg., Ayala Ave., Makati
City
PCD
Participants5
, 6
Filipino -
3.61%
Non
Filipino -
30.22%
4,515,370,292 (r) 33.83
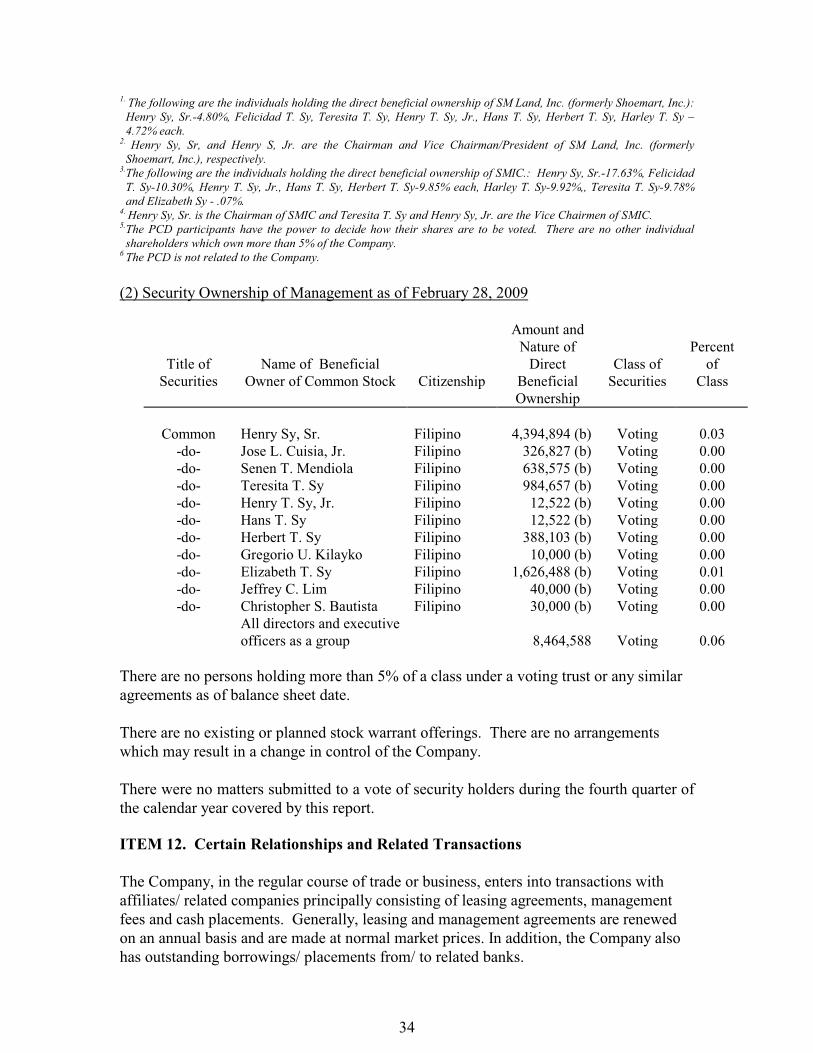
�
34
1. The following are the individuals holding the direct beneficial ownership of SM Land, Inc. (formerly Shoemart, Inc.):
Henry Sy, Sr.-4.80%, Felicidad T. Sy, Teresita T. Sy, Henry T. Sy, Jr., Hans T. Sy, Herbert T. Sy, Harley T. Sy –
4.72% each. 2. Henry Sy, Sr, and Henry S, Jr. are the Chairman and Vice Chairman/President of SM Land, Inc. (formerly
Shoemart, Inc.), respectively. 3.The following are the individuals holding the direct beneficial ownership of SMIC.: Henry Sy, Sr.-17.63%, Felicidad
T. Sy-10.30%, Henry T. Sy, Jr., Hans T. Sy, Herbert T. Sy-9.85% each, Harley T. Sy-9.92%,, Teresita T. Sy-9.78%
and Elizabeth Sy - .07%. 4. Henry Sy, Sr. is the Chairman of SMIC and Teresita T. Sy and Henry Sy, Jr. are the Vice Chairmen of SMIC. 5.The PCD participants have the power to decide how their shares are to be voted. There are no other individual
shareholders which own more than 5% of the Company.6 The PCD is not related to the Company.
(2) Security Ownership of Management as of February 28, 2009
Title of
Securities
Name of Beneficial
Owner of Common Stock Citizenship
Amount and
Nature of
Direct
Beneficial
Ownership
Class of
Securities
Percent
of
Class
Common
-do-
-do-
-do-
-do-
-do-
-do-
-do-
-do-
-do-
-do-
Henry Sy, Sr.
Jose L. Cuisia, Jr.
Senen T. Mendiola
Teresita T. Sy
Henry T. Sy, Jr.
Hans T. Sy
Herbert T. Sy
Gregorio U. Kilayko
Elizabeth T. Sy
Jeffrey C. Lim
Christopher S. Bautista
All directors and executive
officers as a group
Filipino
Filipino
Filipino
Filipino
Filipino
Filipino
Filipino
Filipino
Filipino
Filipino
Filipino
4,394,894 (b)
326,827 (b)
638,575 (b)
984,657 (b)
12,522 (b)
12,522 (b)
388,103 (b)
10,000 (b)
1,626,488 (b)
40,000 (b)
30,000 (b)
8,464,588
Voting
Voting
Voting
Voting
Voting
Voting
Voting
Voting
Voting
Voting
Voting
Voting
0.03
0.00
0.00
0.00
0.00
0.00
0.00
0.00
0.01
0.00
0.00
0.06
There are no persons holding more than 5% of a class under a voting trust or any similar
agreements as of balance sheet date.
There are no existing or planned stock warrant offerings. There are no arrangements
which may result in a change in control of the Company.
There were no matters submitted to a vote of security holders during the fourth quarter of
the calendar year covered by this report.
ITEM 12. Certain Relationships and Related Transactions
The Company, in the regular course of trade or business, enters into transactions with
affiliates/ related companies principally consisting of leasing agreements, management
fees and cash placements. Generally, leasing and management agreements are renewed
on an annual basis and are made at normal market prices. In addition, the Company also
has outstanding borrowings/ placements from/ to related banks.
�
35
There are no other transactions undertaken or to be undertaken by the Company in which
any Director or Executive Officer, nominee for election as Director, or any member of
their immediate family was or will be involved or had or will have a direct or indirect
material interest.
�
Please refer to Note 21 of the attached 2008 consolidated financial statements. �
PART IV - CORPORATE GOVERNANCE
The Board of Directors, officers and staff have committed themselves to the principles
and best practices contained in the Company’s Corporate Governance Manual, in the
belief that good corporate governance is a necessary component of sound strategic
business management.
The Manual establishes the company's compliance system and plan of compliance. It
states that compliance with the principles of good corporate governance starts with the
Board of Directors. To this end, a director must act in a manner characterized by
transparency, accountability and fairness. The Manual further enumerates the general
responsibilities and specific duties and functions of the Board, as well as those of the
Board Committees, Corporate Secretary, and the external and internal auditors.
The Manual mandates the conduct of communication and training programs on corporate
governance. It further provides for the rights of all shareholders and the protection of the
interests of minority stockholders. The Manual likewise sets the penalties for non-
compliance with its provisions.
The Company also undertook several initiatives to strengthen its corporate governance
practices in 2008. At the annual stockholders' meeting in April 2008, Mr. Gregorio U.
Kilayko was elected as independent director. Mr. Kilayko joins Mr. Jose L. Cuisia, Jr. as
the Company's second independent director.
The Company also adopted policies to govern the acceptance of gifts, insider trading and
placement of advertisements. The Company issued a policy to prohibit its directors,
officers and employees from soliciting or accepting gifts in any form from any business
partner, except for corporate give-aways, tokens or promotional items of nominal value.
The Company also adopted guidelines to prohibit its directors, officers and employees
from buying or selling shares of stock of the listed SM companies while in possession of
material and confidential information. The Company further issued a policy to prohibit
the placement of advertisements in publications that solicit for such ad placement prior to
the release of the official results of an awarding process conducted by the publication and
where an SM company or executive is one of the nominees vying for the award. This is
to avoid any misconception that the Company influenced the award in any way through
the payment for the advertisement. These rules supplement the existing corporate
governance policies in the Manual on Corporate Governance and Code of Ethics.

�
36
Key executives also underwent a seminar/workshop on Enterprise Risk Management
conducted by KPMG Manabat Sanagustin & Co. in November 2008. The
seminar/workshop provided the group with the knowledge and skills necessary to
undertake risk assessment. The Company also enhanced its website and annual reports in
line with its thrust of transparency of information and prompt and complete disclosure of
all material facts relating to its business.
��
PART V- EXHIBITS AND SCHEDULES
ITEM 13. Exhibits and Reports on SEC Form 17-C
(a) Exhibits - See accompanying Index to Exhibits
The following exhibit is filed as a separate section of this report:
(22) Account Update
The other exhibits, as indicated in the Index to Exhibits are either not applicable
to the Company or require no answer.
(b) Reports on SEC Form 17-C
Reports on Form 17-C (Current Report) have been filed during 2008.

�
37
SM PRIME HOLDINGS, INC.
INDEX TO FINANCIAL STATEMENTS AND SUPPLEMENTARY SCHEDULES
FORM 17-A, ITEM 7
Consolidated Financial Statements Page No.
Statement of Management’s Responsibility for Financial Statements 38
Report of Independent Public Accountants 40
Consolidated Balance Sheets as of December 31, 2008 and 2007 42
Consolidated Statements of Income
for the Years Ended December 31, 2008, 2007 and 2006 43
Consolidated Statements of Changes in Equity
For the Years Ended December 31, 2008, 2007 and 2006 44
Consolidated Statements of Cash Flows
For the Years Ended December 31, 2008, 2007 and 2006 45
Notes to Consolidated Financial Statements 47
Supplementary Schedules
Report of Independent Public Accountants on Supplementary
Schedules 100
A. Marketable Securities - (Current Marketable Equity Securities and
Other Short-term Cash Investments) 101
B. Amounts Receivable from Directors, Officers, Employees, Related
Parties and Principal Stockholders (Other than Related Parties) *
C. Non-Current Marketable Equity Securities, Other Long-Term
Investments in Stock and Other Investments 102
D. Indebtedness of Unconsolidated Subsidiaries and Related Parties *
E. Intangible Assets and Other Assets *
F. Long-Term Debt *
G. Indebtedness to Related Parties (Long-Term Loans
from Related Companies) *
H. Guarantees of Securities of Other Issuers *
I. Capital Stock 103
Retained Earnings Available for Dividend Declaration 104
_____
* These schedules have been omitted because they are either not required, not applicable or the
information required to be presented is included in the Company’s consolidated financial
statements or the notes to consolidated financial statements.
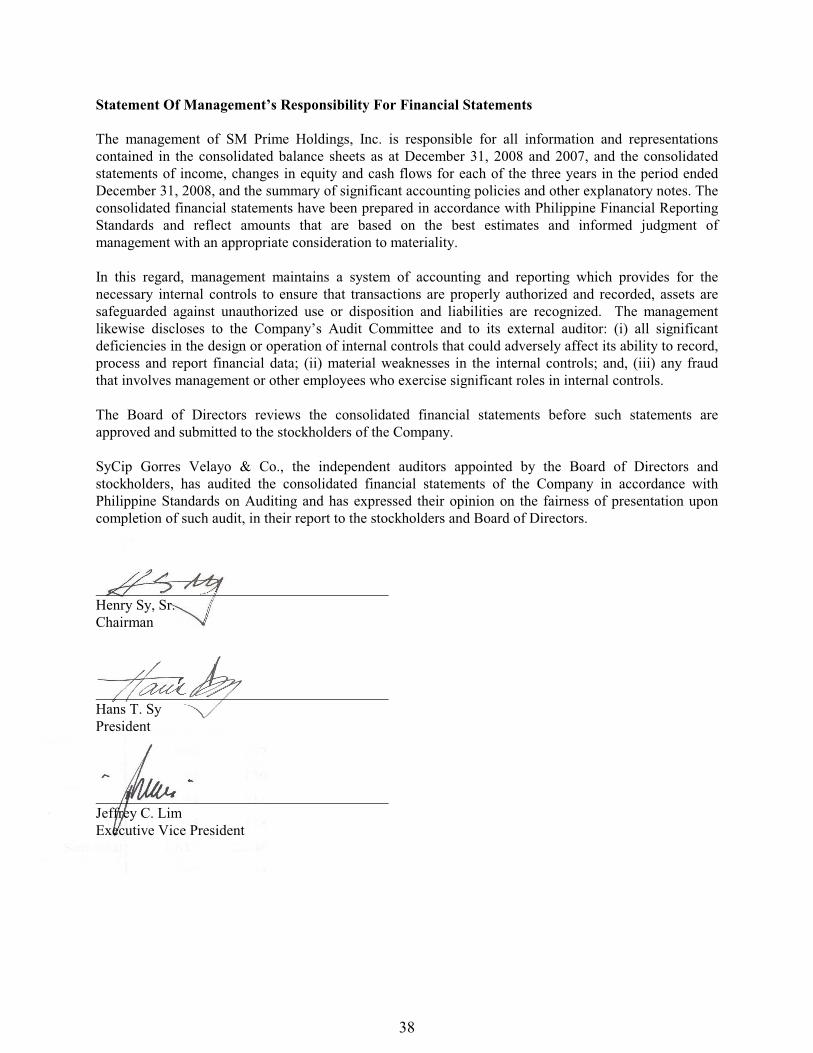
�
38
Statement Of Management’s Responsibility For Financial Statements
The management of SM Prime Holdings, Inc. is responsible for all information and representations
contained in the consolidated balance sheets as at December 31, 2008 and 2007, and the consolidated
statements of income, changes in equity and cash flows for each of the three years in the period ended
December 31, 2008, and the summary of significant accounting policies and other explanatory notes. The
consolidated financial statements have been prepared in accordance with Philippine Financial Reporting
Standards and reflect amounts that are based on the best estimates and informed judgment of
management with an appropriate consideration to materiality.
In this regard, management maintains a system of accounting and reporting which provides for the
necessary internal controls to ensure that transactions are properly authorized and recorded, assets are
safeguarded against unauthorized use or disposition and liabilities are recognized. The management
likewise discloses to the Company’s Audit Committee and to its external auditor: (i) all significant
deficiencies in the design or operation of internal controls that could adversely affect its ability to record,
process and report financial data; (ii) material weaknesses in the internal controls; and, (iii) any fraud
that involves management or other employees who exercise significant roles in internal controls.
The Board of Directors reviews the consolidated financial statements before such statements are
approved and submitted to the stockholders of the Company.
SyCip Gorres Velayo & Co., the independent auditors appointed by the Board of Directors and
stockholders, has audited the consolidated financial statements of the Company in accordance with
Philippine Standards on Auditing and has expressed their opinion on the fairness of presentation upon
completion of such audit, in their report to the stockholders and Board of Directors.
Henry Sy, Sr.
Chairman
Hans T. Sy
President
Jeffrey C. Lim
Executive Vice President
�


*SGVMC212218*
INDEPENDENT AUDITORS’ REPORT
The Stockholders and the Board of Directors SM Prime Holdings, Inc. SM Corporate Offices, Building A J.W. Diokno Boulevard Mall of Asia Complex, Pasay City 1300
We have audited the accompanying financial statements of SM Prime Holdings, Inc. and Subsidiaries, which comprise the consolidated balance sheets as at December 31, 2008 and 2007, and the consolidated statements of income, consolidated statements of changes in stockholders’ equity and consolidated statements of cash flows for each of the three years in the period ended December 31, 2008, and a summary of significant accounting policies and other explanatory notes.
Management’s Responsibility for the Financial Statements
Management is responsible for the preparation and fair presentation of these financial statements in accordance with Philippine Financial Reporting Standards. This responsibility includes: designing, implementing and maintaining internal control relevant to the preparation and fair presentation of financial statements that are free from material misstatement, whether due to fraud or error; selecting and applying appropriate accounting policies; and making accounting estimates that are reasonable in the circumstances.
Auditors’ Responsibility
Our responsibility is to express an opinion on these financial statements based on our audits. We conducted our audits in accordance with Philippine Standards on Auditing. Those standards require that we comply with ethical requirements and plan and perform the audit to obtain reasonable assurance whether the financial statements are free from material misstatement.
An audit involves performing procedures to obtain audit evidence about the amounts and disclosures in the financial statements. The procedures selected depend on the auditor’s judgment, including the assessment of the risks of material misstatement of the financial statements, whether due to fraud or error. In making those risk assessments, the auditor considers internal control relevant to the entity’s preparation and fair presentation of the financial statements in order to design audit procedures that are appropriate in the circumstances, but not for the purpose of expressing an opinion on the effectiveness of the entity’s internal control. An audit also includes evaluating the appropriateness of accounting policies used and the reasonableness of accounting estimates made by management, as well as evaluating the overall presentation of the financial statements.
We believe that the audit evidence we have obtained is sufficient and appropriate to provide a basis for our audit opinion.
SyCip Gorres Velayo & Co.6760 Ayala Avenue 1226 Makati City Philippines
Phone: (632) 891 0307 Fax: (632) 819 0872 www.sgv.com.ph
BOA/PRC Reg. No. 0001 SEC Accreditation No. 0012-FR-1
A member firm of Ernst & Young Global Limited

*SGVMC212218*
- 2 -
Opinion
In our opinion, the consolidated financial statements present fairly, in all material respects, the financial position of SM Prime Holdings, Inc. and Subsidiaries as of December 31, 2008 and 2007, and their financial performance and their cash flows for each of the three years in the period ended December 31, 2008 in accordance with Philippine Financial Reporting Standards.
SYCIP GORRES VELAYO & CO.
Ramon D. Dizon Partner CPA Certificate No. 46047 SEC Accreditation No. 0077-AR-1 Tax Identification No. 102-085-577 PTR No. 1566425, January 5, 2009, Makati City
February 19, 2009

*SGVMC212218*
SM PRIME HOLDINGS, INC. AND SUBSIDIARIES
CONSOLIDATED BALANCE SHEETS
December 31
2008
2007(As restated -
Note 5)
ASSETS
Current Assets
Cash and cash equivalents (Notes 7, 16, 21, 23 and 24) P=10,737,196,836 P=2,504,180,947 Investments held for trading (Notes 8, 16, 21, 23 and 24) 143,857,296 149,688,504 Receivables (Notes 9, 21, 23 and 24) 3,345,742,058 2,984,719,048 Available-for-sale investments (Notes 13, 21, 23 and 24) 2,452,705,199 – Prepaid expenses and other current assets (Note 10) 1,156,139,389 1,014,397,545
Total Current Assets 17,835,640,778 6,652,986,044
Noncurrent Assets
Investment properties - net (Note 11) 66,692,576,399 59,426,888,566 Shopping mall complex under construction (Note 12) 8,481,332,742 6,393,481,283 Available-for-sale investments (Notes 13, 21, 23 and 24) 99,994,541 2,218,254,419 Derivative assets (Notes 23 and 24) 34,130,728 347,248,200 Deferred tax assets (Note 19) 209,171,802 143,590,230 Other noncurrent assets 2,152,342,598 1,266,475,751
Total Noncurrent Assets 77,669,548,810 69,795,938,449
P=95,505,189,588 P=76,448,924,493
LIABILITIES AND STOCKHOLDERS’ EQUITY
Current Liabilities
Loans payable (Notes 14, 21, 23 and 24) P=2,830,000,000 P=1,231,957,791 Accounts payable and other current liabilities
(Notes 14, 15, 21, 23 and 24) 4,141,819,171 3,112,543,834 Current portion of long-term debt (Notes 16, 21, 23 and 24) 7,784,521,000 1,405,645,000 Derivative liability (Notes 23 and 24) 901,634,262 – Income tax payable 763,691,021 862,564,166
Total Current Liabilities 16,421,665,454 6,612,710,791
Noncurrent Liabilities
Long-term debt - net of current portion (Notes 16, 21, 23 and 24) 19,940,459,631 18,052,877,055 Deferred tax liabilities (Note 19) 1,087,254,617 880,296,636 Tenants’ deposits (Notes 22, 23 and 24) 4,865,774,815 4,328,461,010 Derivative liability (Notes 23 and 24) – 1,768,518,516 Other noncurrent liabilities (Notes 21 and 24) 5,330,503,515 1,353,567,855
Total Noncurrent Liabilities 31,223,992,578 26,383,721,072
Equity Attributable to Equity Holders of the Parent (Note 23) Capital stock (Notes 5, 17 and 25) 13,348,191,367 13,348,191,367 Additional paid-in capital - net (Notes 5 and 17) 5,493,656,403 5,493,656,403 Unrealized gain on available-for-sale investments (Notes 13 and 24) 48,346,550 40,736,047 Cumulative translation adjustment 821,103,222 (49,360,101)Retained earnings (Note 17): Appropriated 7,000,000,000 7,000,000,000 Unappropriated 20,218,718,131 16,786,447,729 Treasury stock (Notes 17 and 25) (101,474,705) (101,474,705)
Total Equity Attributable to Equity Holders of the Parent 46,828,540,968 42,518,196,740
Minority Interests 1,030,990,588 934,295,890
Total Stockholders’ Equity 47,859,531,556 43,452,492,630
P=95,505,189,588 P=76,448,924,493
See accompanying Notes to Consolidated Financial Statements.

*SGVMC212218*
SM PRIME HOLDINGS, INC. AND SUBSIDIARIES
CONSOLIDATED STATEMENTS OF INCOME
Years Ended December 31
2008
2007(As restated -
Note 5)
2006(As restated -
Note 5)
REVENUE Rent (Notes 21 and 22) P=15,357,821,624 P=13,402,488,334 P=11,396,823,711 Cinema ticket sales 1,849,312,511 1,843,187,522 1,597,030,599 Interest income from short-term investments
(Notes 7, 8 and 21) 225,499,217 404,134,173 446,910,793 Dividend income (Note 13) 162,709,466 295,088,980 417,816,293 Amusement and others (Notes 8 and 24) 951,528,269 857,885,337 1,628,609,253
18,546,871,087 16,802,784,346 15,487,190,649
COST AND EXPENSES Operating expenses (Notes 18, 20, 21 and 22) (8,208,089,081) (7,139,186,145) (6,045,188,391)Interest expense on short-term and long-term
loans (Notes 14, 16 and 21) (858,356,033) (793,545,467) (832,663,168)
INCOME BEFORE INCOME TAX 9,480,425,973 8,870,052,734 8,609,339,090
PROVISION FOR (BENEFIT FROM)
INCOME TAX (Note 19) Current 2,592,012,734 2,678,694,046 1,921,844,308 Deferred 155,126,540 (91,857,158) 531,847,186
2,747,139,274 2,586,836,888 2,453,691,494
NET INCOME P=6,733,286,699 P=6,283,215,846 P=6,155,647,596
Attributable to: Equity holders of the Parent (Note 25) P=6,412,215,308 P=5,972,394,019 P=5,854,664,702 Minority interests 321,071,391 310,821,827 300,982,894
P=6,733,286,699 P=6,283,215,846 P=6,155,647,596
Basic/Diluted Earnings Per Share (Note 25) P=0.481 P=0.448 P=0.439
See accompanying Notes to Consolidated Financial Statements.
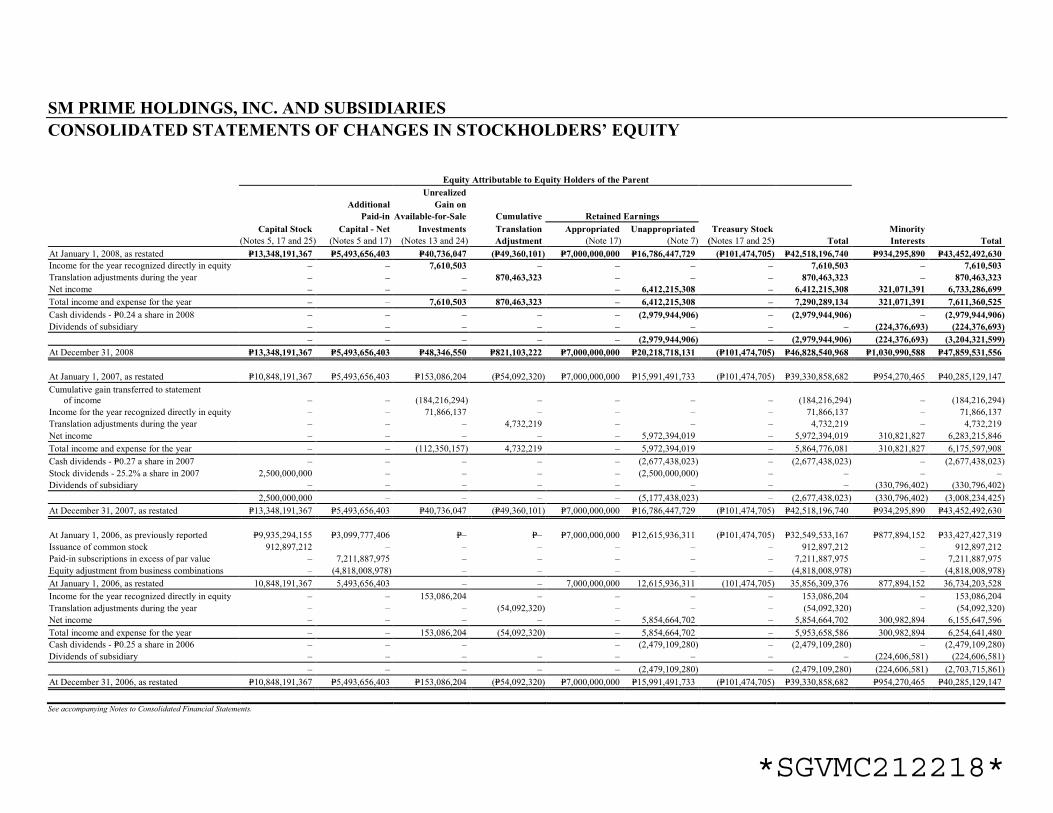
*SGVMC212218*
SM PRIME HOLDINGS, INC. AND SUBSIDIARIES
CONSOLIDATED STATEMENTS OF CHANGES IN STOCKHOLDERS’ EQUITY
Equity Attributable to Equity Holders of the Parent
Unrealized
Additional Gain on
Paid-in Available-for-Sale Cumulative Retained Earnings
Capital Stock Capital - Net Investments Translation Appropriated Unappropriated Treasury Stock Minority
(Notes 5, 17 and 25) (Notes 5 and 17) (Notes 13 and 24) Adjustment (Note 17) (Note 7) (Notes 17 and 25) Total Interests Total
At January 1, 2008, as restated P=13,348,191,367 P=5,493,656,403 P=40,736,047 (P=49,360,101) P=7,000,000,000 P=16,786,447,729 (P=101,474,705) P=42,518,196,740 P=934,295,890 P=43,452,492,630
Income for the year recognized directly in equity – – 7,610,503 – – – – 7,610,503 – 7,610,503
Translation adjustments during the year – – – 870,463,323 – – – 870,463,323 – 870,463,323
Net income – – – – 6,412,215,308 – 6,412,215,308 321,071,391 6,733,286,699
Total income and expense for the year – – 7,610,503 870,463,323 – 6,412,215,308 – 7,290,289,134 321,071,391 7,611,360,525
Cash dividends - P=0.24 a share in 2008 – – – – – (2,979,944,906) – (2,979,944,906) – (2,979,944,906)
Dividends of subsidiary – – – – – – – – (224,376,693) (224,376,693)
– – – – – (2,979,944,906) – (2,979,944,906) (224,376,693) (3,204,321,599)
At December 31, 2008 P=13,348,191,367 P=5,493,656,403 P=48,346,550 P=821,103,222 P=7,000,000,000 P=20,218,718,131 (P=101,474,705) P=46,828,540,968 P=1,030,990,588 P=47,859,531,556
At January 1, 2007, as restated P=10,848,191,367 P=5,493,656,403 P=153,086,204 (P=54,092,320) P=7,000,000,000 P=15,991,491,733 (P=101,474,705) P=39,330,858,682 P=954,270,465 P=40,285,129,147
Cumulative gain transferred to statement of income – – (184,216,294) – – – – (184,216,294) – (184,216,294)
Income for the year recognized directly in equity – – 71,866,137 – – – – 71,866,137 – 71,866,137
Translation adjustments during the year – – – 4,732,219 – – – 4,732,219 – 4,732,219
Net income – – – – – 5,972,394,019 – 5,972,394,019 310,821,827 6,283,215,846
Total income and expense for the year – – (112,350,157) 4,732,219 – 5,972,394,019 – 5,864,776,081 310,821,827 6,175,597,908
Cash dividends - P=0.27 a share in 2007 – – – – – (2,677,438,023) – (2,677,438,023) – (2,677,438,023)
Stock dividends - 25.2% a share in 2007 2,500,000,000 – – – – (2,500,000,000) – – – –
Dividends of subsidiary – – – – – – – – (330,796,402) (330,796,402)
2,500,000,000 – – – – (5,177,438,023) – (2,677,438,023) (330,796,402) (3,008,234,425)
At December 31, 2007, as restated P=13,348,191,367 P=5,493,656,403 P=40,736,047 (P=49,360,101) P=7,000,000,000 P=16,786,447,729 (P=101,474,705) P=42,518,196,740 P=934,295,890 P=43,452,492,630
At January 1, 2006, as previously reported P=9,935,294,155 P=3,099,777,406 P=– P=– P=7,000,000,000 P=12,615,936,311 (P=101,474,705) P=32,549,533,167 P=877,894,152 P=33,427,427,319
Issuance of common stock 912,897,212 – – – – – – 912,897,212 – 912,897,212
Paid-in subscriptions in excess of par value – 7,211,887,975 – – – – – 7,211,887,975 – 7,211,887,975
Equity adjustment from business combinations – (4,818,008,978) – – – – – (4,818,008,978) – (4,818,008,978)
At January 1, 2006, as restated 10,848,191,367 5,493,656,403 – – 7,000,000,000 12,615,936,311 (101,474,705) 35,856,309,376 877,894,152 36,734,203,528
Income for the year recognized directly in equity – – 153,086,204 – – – – 153,086,204 – 153,086,204
Translation adjustments during the year – – – (54,092,320) – – – (54,092,320) – (54,092,320)
Net income – – – – – 5,854,664,702 – 5,854,664,702 300,982,894 6,155,647,596
Total income and expense for the year – – 153,086,204 (54,092,320) – 5,854,664,702 – 5,953,658,586 300,982,894 6,254,641,480
Cash dividends - P=0.25 a share in 2006 – – – – (2,479,109,280) – (2,479,109,280) – (2,479,109,280)
Dividends of subsidiary – – – – – – – – (224,606,581) (224,606,581)
– – – – – (2,479,109,280) – (2,479,109,280) (224,606,581) (2,703,715,861)
At December 31, 2006, as restated P=10,848,191,367 P=5,493,656,403 P=153,086,204 (P=54,092,320) P=7,000,000,000 P=15,991,491,733 (P=101,474,705) P=39,330,858,682 P=954,270,465 P=40,285,129,147
See accompanying Notes to Consolidated Financial Statements.

*SGVMC212218*
SM PRIME HOLDINGS, INC. AND SUBSIDIARIES
CONSOLIDATED STATEMENTS OF CASH FLOWS
Years Ended December 31
2008
2007(As restated -
Note 5)
2006(As restated -
Note 5)
CASH FLOWS FROM OPERATING
ACTIVITIES Income before income tax and minority interest P=9,480,425,973 P=8,870,052,734 P=8,609,339,090 Adjustments for: Depreciation and amortization
(Notes 11 and 18) 2,666,307,523 2,499,137,968 1,972,808,845 Interest expense on short-term and long-term
loans (Notes 14, 16 and 21) 858,356,033 793,545,467 832,663,168 Unrealized marked-to-market loss (gain)
on derivatives - net (Note 24) (608,707,480) 567,691,997 276,560,613 Unrealized foreign exchange loss (gain) - net 417,893,121 (514,303,435) (668,499,763) Interest income from short-term investments
and dividend income (Notes 8, 13 and 21) (388,208,683) (699,223,153) (864,727,086) Realized marked-to-market loss
on derivatives (Note 24) 54,940,698 138,638,574 – Unrealized marked-to-market loss (gain)
on investments held for trading (Note 8) (2,719,321) 1,894,445 (8,264,785)
Operating income before working capital changes 12,478,287,864 11,657,434,597 10,149,880,082 Decrease (increase) in: Receivables (352,682,570) 499,360,286 (418,145,088) Prepaid expenses and other current assets (126,914,174) 195,675,399 (14,136,816)Increase (decrease) in: Accounts payable and other current liabilities 975,885,887 (383,889,774) (1,234,665,345) Tenants’ deposits 499,861,525 285,100,301 878,417,616
Cash generated from operations 13,474,438,532 12,253,680,809 9,361,350,449 Income taxes paid (2,667,843,679) (2,401,184,550) (1,840,635,298)
Net cash provided by operating activities 10,806,594,853 9,852,496,259 7,520,715,151
CASH FLOWS FROM INVESTING
ACTIVITIES Decrease (increase) in: Shopping mall complex under construction
(Note 12) (7,050,623,575) (5,246,410,035) (6,275,498,424) Investment properties (Note 11) (1,965,944,741) (3,129,350,639) (2,863,763,673) Other noncurrent assets (860,897,895) 70,369,776 (363,869,590) Investments held for trading 5,497,479 114,372,281 1,347,832,047 Available-for-sale investments – 2,500,000,000 (100,000,000)Increase in other noncurrent liabilities 3,688,913,847 477,685,553 459,770,909 Interest and dividend received 431,754,596 1,077,981,022 682,508,841
Net cash used in investing activities (5,751,300,289) (4,135,352,042) (7,113,019,890)
(Forward)
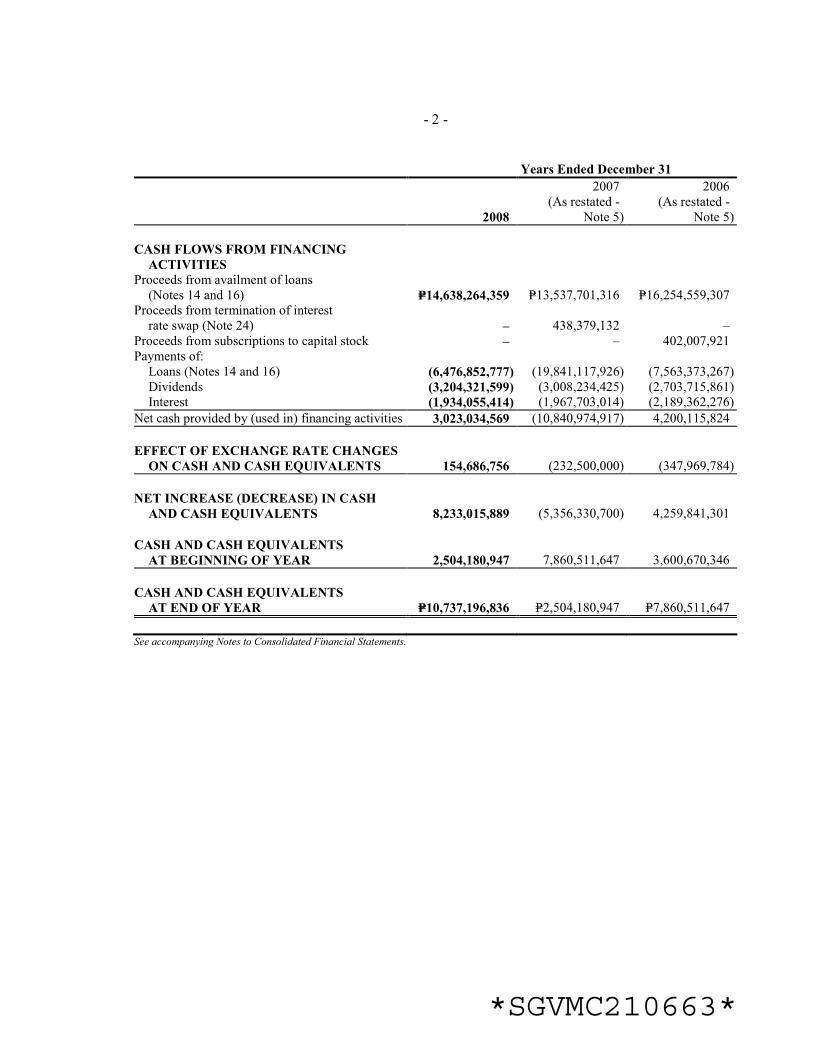
*SGVMC210663*
- 2 -
Years Ended December 31
2008
2007(As restated -
Note 5)
2006(As restated -
Note 5)
CASH FLOWS FROM FINANCING
ACTIVITIES Proceeds from availment of loans
(Notes 14 and 16) P=14,638,264,359 P=13,537,701,316 P=16,254,559,307 Proceeds from termination of interest
rate swap (Note 24) – 438,379,132 – Proceeds from subscriptions to capital stock – – 402,007,921 Payments of: Loans (Notes 14 and 16) (6,476,852,777) (19,841,117,926) (7,563,373,267) Dividends (3,204,321,599) (3,008,234,425) (2,703,715,861) Interest (1,934,055,414) (1,967,703,014) (2,189,362,276)
Net cash provided by (used in) financing activities 3,023,034,569 (10,840,974,917) 4,200,115,824
EFFECT OF EXCHANGE RATE CHANGES
ON CASH AND CASH EQUIVALENTS 154,686,756 (232,500,000) (347,969,784)
NET INCREASE (DECREASE) IN CASH
AND CASH EQUIVALENTS 8,233,015,889 (5,356,330,700) 4,259,841,301
CASH AND CASH EQUIVALENTS
AT BEGINNING OF YEAR 2,504,180,947 7,860,511,647 3,600,670,346
CASH AND CASH EQUIVALENTS
AT END OF YEAR P=10,737,196,836 P=2,504,180,947 P=7,860,511,647
See accompanying Notes to Consolidated Financial Statements.

*SGVMC212218*
SM PRIME HOLDINGS, INC. AND SUBSIDIARIES
NOTES TO CONSOLIDATED FINANCIAL STATEMENTS
1. Corporate Information
SM Prime Holdings, Inc. (SMPH or the Parent Company) was incorporated in the Philippines and registered with the Securities and Exchange Commission (SEC) on January 6, 1994. The Parent Company and its subsidiaries (collectively referred to as “the Company”) develop, conduct, operate and maintain the business of modern commercial shopping centers and all businesses related thereto, such as the conduct, operation and maintenance of shopping center spaces for rent, amusement centers, or cinema theaters within the compound of the shopping centers. Its main sources of revenue include rent income from leases in mall and food court, cinema ticket sales and amusement income from bowling, ice skating and others.
On May 20, 2008, the SEC approved the Parent Company’s acquisition of the 100% ownership of SM Shopping Center (Chengdu) Co. Ltd. (SM Chengdu), Xiamen SM City Co. Ltd and Xiamen SM Mall Management Co. Ltd. (together, SM Xiamen) and SM International Square Jinjiang City Fujian (SM Jinjiang) [collectively, the SM China Companies] through share swap agreements with Grand China International Limited (Grand China) and Oriental Land Development Limited (Oriental Land) (see Notes 5, 11 and 17).
On November 30, 2008, the Parent Company likewise completed the acquisition of 100% ownership of SM Land (China) Limited from Grand China (see Note 5).
The Parent Company’s shares of stock are publicly traded in the Philippine Stock Exchange (PSE).
The Parent Company is 50.52% directly and indirectly-owned by SM Investments Corporation (SMIC). SMIC, the ultimate parent company, is a Philippine corporation which listed its common shares with the PSE in 2005.
The registered office and principal place of business of the Parent Company is SM Corporate Offices, Building A, J.W. Diokno Boulevard, Mall of Asia Complex, Pasay City 1300.
The accompanying consolidated financial statements were authorized for issue in accordance with a resolution by the Board of Directors (BOD) on February 19, 2009.
2. Basis of Preparation
The consolidated financial statements have been prepared on the historical cost basis, except for derivative financial instruments, investments held for trading and available-for-sale (AFS) investments which have been measured at fair value. The consolidated financial statements are presented in Philippine peso, which is the Parent Company’s functional and presentation currency under Philippine Financial Reporting Standards (PFRS). All values are rounded to the nearest peso, except when otherwise indicated.

- 2 -
*SGVMC212218*
Statement of ComplianceThe accompanying consolidated financial statements have been prepared in compliance with PFRS. PFRS includes statements named PFRS and Philippine Accounting Standards (PAS) issued by the Financial Reporting Standards Council.
Changes in Accounting PoliciesThe accounting policies adopted are consistent with those of the previous financial year except for the following new Philippine Interpretations from International Financial Reporting Interpretations Committee (IFRIC) which the Company has adopted during the year:
� Philippine Interpretation IFRIC 11, PFRS 2 - Group and Treasury Share Transactions,requires arrangements whereby an employee is granted rights to an entity’s equity instruments to be accounted for as an equity-settled scheme by the entity even if (a) the entity chooses or is required to buy those equity instruments (e.g., treasury shares) from another party, or (b) the shareholders of the entity provide the equity instruments needed. It also provides guidance on how subsidiaries, in their separate financial statements, account for such schemes when their employees receive rights to the equity instruments of the parent. The adoption of this interpretation has no impact on the consolidated financial statements.
� Philippine Interpretation IFRIC 12, Service Concession Arrangements, covers contractual arrangements arising from public-to-private service concession arrangements if control of the assets remains in public hands but the private sector operator is responsible for construction activities, as well as for operating and maintaining the public sector infrastructure. No member of the Company is an operator and, therefore, this interpretation has no impact on the consolidated financial statements.
� Philippine Interpretation IFRIC 14, PAS 19, The Limit on a Defined Benefit Asset, Minimum
Funding Requirements and their Interaction, provides guidance on how to assess the limit on the amount of surplus in a defined benefit scheme that can be recognized as an asset under PAS 19, Employee Benefits. The Company’s defined benefit plan has been in deficit, therefore the adoption of this interpretation has no impact on its financial position or performance.
Future Changes in Accounting PoliciesThe Company did not early adopt the following standards and Philippine Interpretations that have been approved but are not yet effective:
� PFRS 2, Share-based Payment (Revised), will become effective for financial years beginning on or after January 1, 2009. It restricts the definition of “vesting condition” to a condition that includes an explicit or implicit requirement to provide services. Any other conditions are non-vesting conditions, which have to be taken into account to determine the fair value of the equity instruments granted. In case the award does not vest as result of a failure to meet a non-vesting condition that is within the control of either the entity or the counterparty, it must be accounted for as a cancellation. The revised standard will have no impact on the Company’s financial statements.

- 3 -
*SGVMC212218*
� PFRS 3, Business Combinations (Revised), and PAS 27, Consolidated and Separate Financial
Statements (Revised), will become effective for financial years beginning on or after July 1, 2009. The revised PFRS 3 introduces a number of changes in the accounting for business combinations that will impact the amount of goodwill recognized, the reported results in the period that an acquisition occurs and future reported results. The revised PAS 27 requires that a change in the ownership interest of a subsidiary be accounted for as an equity transaction. Therefore, such a change will have no impact on goodwill, nor will it give rise to a gain or loss. Furthermore, the amended standard changes the accounting for losses incurred by the subsidiary, as well as the loss of control of a subsidiary. The changes introduced by the revised standards must be applied prospectively and will affect future acquisitions and transactions with minority interests. The changes in the standards will have no impact on the Company’s consolidated financial statements.
� PFRS 8, Operating Segments, will replace PAS 14, Segment Reporting, and will become effective for financial years beginning on or after January 1, 2009. It adopts a management approach in reporting segment information. The information reported would be that which management uses internally for evaluating the performance of operating segments and allocating resources to those segments. Such information may be different from that reported in the consolidated balance sheets and consolidated statements of income and companies will need to provide explanations and reconciliations of the differences. The Company is currently assessing the impact of this revised standard.
� PAS 1, Presentation of Financial Statements (Revised), will become effective for financial years beginning on or after January 1, 2009. It separates owner and non-owner changes in equity. The statements of changes in stockholders’ equity will include only details of transactions with owners, with all non-owner changes in equity presented as a single line. In addition, the standard introduces the statement of comprehensive income, which presents all items of income and expense recognized in profit or loss, together with all other items of recognized income and expense, either in one single statement, or in two linked statements. The Company is currently assessing the impact of this revised standard.
� PAS 23, Borrowing Costs (Revised), will become effective for financial years beginning on or after January 1, 2009. The standard has been revised to require capitalization of borrowing costs when such costs relate to a qualifying asset. A qualifying asset is an asset that necessarily takes a substantial period of time to get ready for its intended use or sale. The adoption of this amendment will have no impact on the consolidated financial statements since it is the Company’s current policy to capitalize borrowing costs related to a qualifying asset.
� PAS 32, Financial Instrument: Presentation, and PAS 1, Presentation of Financial Statements – Puttable Financial Instruments and Obligations Arising on Liquidation
(Amendments), will become effective for financial years beginning on or after January 1, 2009. The amendment to PAS 32 requires certain puttable financial instruments and obligations arising on liquidation to be classified as equity if certain criteria are met. The amendment to PAS 1 requires disclosure of certain information relating to puttable instruments classified as equity. The Company expects that the amendments will have no impact on its financial position or performance.
- 4 -
*SGVMC212218*
� PAS 39, Financial Instruments: Recognition and Measurement – Eligible Hedged Items
(Amendment), will become effective for financial years beginning on or after July 1, 2009. The amendment addresses the designation of a one-sided risk in a hedged item, and the designation of inflation as a hedged risk or portion in particular situations. It clarifies that an entity is permitted to designate a portion of the fair value changes or cash flow variability of a financial instrument as a hedged item. The amendment will not have any impact on the consolidated financial statements as the Company has not entered into any such hedges.
� Philippine Interpretation IFRIC 13, Customer Loyalty Programmes, will become effective for financial years beginning on or after July 1, 2008. It requires customer loyalty award credits to be accounted for as a separate component of the sales transaction in which they are granted and therefore, part of the fair value of the consideration received is allocated to the award credits and deferred over the period that the award credits are fulfilled. The Company expects that this interpretation will have no impact on its consolidated financial statements as no such schemes currently exist.
� Philippine Interpretation IFRIC 15, Agreements for the Construction of Real Estate, will become effective for financial years beginning on or after January 1, 2009. The interpretation is to be applied retroactively. It clarifies when and how revenue and related expenses from the sale of real estate should be recognized if an agreement between a developer and a buyer is reached before the construction of the real estate is completed. Furthermore, the interpretation provides guidance on how to determine whether an agreement is within the scope of PAS 11, Construction Contracts, or PAS 18, Revenue. The interpretation will not have an impact on the consolidated financial statements because the Company does not have such activity.
� Philippine Interpretation IFRIC 16, Hedges of a Net Investment in Foreign Operations, will become effective for financial years beginning on or after October 1, 2008. It provides guidance on identifying the foreign currency risks that qualify for hedge accounting in the hedge of a net investment, where within the Company the hedging instruments can be held in the hedge of a net investment and how an entity should determine the amount of foreign currency gain or loss, relating to both the net investment and the hedging instrument, to be recycled on disposal of the net investment. The interpretation will have no impact on the consolidated financial statements.
Improvements to Existing Accounting Standards The Company did not early adopt the following improvements to existing accounting standards that have been approved but are not yet effective. The Company is currently assessing the impact of the following improvements to existing standards but anticipates that the changes will have no material effect on the consolidated financial statements.
� PFRS 7, Financial Instruments: Disclosures, removes the reference to “total interest income” as a component of finance costs.
� PAS 1, Presentation of Financial Statements, provides that assets and liabilities classified as held for trading in accordance with PAS 39, Financial Instruments: Recognition and Measurement, are not automatically classified as current in the balance sheets.
- 5 -
*SGVMC212218*
� PAS 8, Accounting Policies, Changes in Accounting Estimates and Errors, clarifies that only the implementation guidance that is an integral part of a PFRS is mandatory when selecting accounting policies.
� PAS 10, Events after the Balance Sheet Date, clarifies that dividends declared after the end of reporting period are not obligations.
� PAS 16, Property, Plant and Equipment, replaces the term “net selling price” with “fair value less costs to sell”. It further clarifies that items of property, plant and equipment held for rental that are routinely sold in the ordinary course of business after rental are transferred to inventory when rental ceases and they are held for sale.
� PAS 18, Revenue, replaces the term “direct costs” with “transaction costs” as defined in PAS 39, Financial Instruments: Recognition and Measurement.
� PAS 19, Employee Benefits, revises the definition of past service costs, return on plan assets and short-term and long-term employee benefits. Amendments to plans that result in reduction in benefits related to future services are accounted for as curtailment. It deletes the reference to the recognition of contingent liabilities to ensure consistency with PAS 37, Provisions, Contingent Liabilities and Contingent Assets.
� PAS 20, Accounting for Government Grants and Disclosure of Government Assistance, provides that loans granted in the future with no or low interest rates will not be exempt from the requirement to impute interest. The difference between the amount received and the discounted amount is accounted for as government grant. Various terms were revised to be consistent with other PFRS.
� PAS 23, Borrowing Costs, revises the definition of borrowing costs to consolidate the two types of items that are considered components of borrowing costs into one – the interest expense calculated using the effective interest method calculated in accordance with PAS 39, Financial Instruments: Recognition and Measurement.
� PAS 27, Consolidated and Separate Financial Statements, states that when a parent entity accounts for a subsidiary in accordance with PAS 39, Financial Instruments: Recognition and Measurement, in its separate financial statements, this treatment continues when the subsidiary is subsequently classified as held for sale.
� PAS 28, Investment in Associates, establishes that if an associate is accounted for at fair value in accordance with PAS 39, Financial Instruments: Recognition and Measurement, only the requirement of PAS 28 to disclose the nature and extent of any significant restrictions on the ability of the associate to transfer funds to the entity in the form of cash or repayment of loans applies.

- 6 -
*SGVMC212218*
� PAS 29, Financial Reporting in Hyperinflationary Economies, revises the reference to the exception to measure assets and liabilities at historical costs, such that it notes property, plant and equipment as being an example, rather than implying that it is a definitive list. Various terms were revised to be consistent with other PFRS.
� PAS 31, Interest in Joint Ventures, provides that if a joint venture is accounted for at fair value in accordance with PAS 39, Financial Instruments: Recognition and Measurement, only the requirement of PAS 31 to disclose the commitments of the venturer and the joint venture as well as summary financial information about the assets, liabilities, income and expense will apply.
� PAS 34, Interim Financial Reporting, requires that earnings per share be disclosed in interim financial reports if an entity is within the scope of PAS 33, Earnings per Share.
� PAS 36, Impairment of Assets, provides that if discounted cash flows are used to estimate “fair value less costs to sell,” additional disclosure is required about the discount rate, consistent with the disclosures required when the discounted cash flows are used to estimate “value in use.”
� PAS 38, Intangible Assets, requires that expenditure on advertising and promotional activities is recognized as an expense when the Company has either the right to access the goods or has received the services.
� PAS 39, Financial Instruments: Recognition and Measurement, changes in circumstances relating to derivatives are not reclassification and therefore maybe either removed from, or included in, the “fair value through profit or loss” (FVPL) classification after initial recognition. It removes the reference to a segment when determining whether an instrument qualifies as a hedge. It further requires the use of the revised effective interest rate when re-measuring a debt instrument on the cessation of fair value hedge accounting.
� PAS 40, Investment Property, revises the scope such that property under construction or development for future use as an investment property is classified as investment property. If fair value cannot be reliably determined, the investment under construction will be measured at cost until such time that fair value can be determined or construction is complete. It revises the conditions for a voluntary change in accounting policy to be consistent with PAS 8, Accounting Policies, Changes in Accounting Estimates and Errors, and clarifies that the carrying amount of investment property held under lease is the valuation obtained, increased by any recognized liability.
� PAS 41, Agriculture, removes the reference to the use of pre-tax discount rate to determine fair value. It likewise removes the prohibition to take into account cash flows resulting from any additional transformations when estimating fair value. Furthermore, it replaces the term “point-of-sale costs” with “costs to sell”.

- 7 -
*SGVMC212218*
Basis of ConsolidationThe consolidated financial statements include the accounts of the Parent Company and the following subsidiaries:
Company Country of Incorporation Percentage
of Ownership SM Malls/
Properties Owned
First Asia Realty Development Corporation Philippines 54.37 SM Megamall Premier Central, Inc. - do- 100.00 SM City Clark Consolidated Prime Dev. Corp. (CPDC) - do- 100.00 SM City Dasmarinas Premier Southern Corp. (PSC) - do- 100.00 SM City Batangas
and SM City Lipa San Lazaro Holdings Corporation - do- 100.00 – First Leisure Ventures Group Inc. (FLVGI) - do- 50.00 San Miguel by the Bay Affluent Capital Enterprises Limited (Affluent) British Virgin Islands 100.00 SM City Xiamen
and SM City ChengduMega Make Enterprises Limited (Mega Make) - do- 100.00 SM City Jinjiang SM Land (China) Limited (SM Land) Hong Kong 100.00 –
FLVGI is accounted for as a subsidiary by virtue of control, as evidenced by the majority members of the board representing the Parent Company.
The financial statements of the subsidiaries are prepared for the same reporting year as the Parent Company, using consistent accounting policies.
All intracompany balances, transactions, income and expenses resulting from intracompany transactions are eliminated in full.
Subsidiaries are consolidated from the date of acquisition, being the date on which the Company obtains control, and continue to be consolidated until the date that such control ceases.
Minority interests represent the portion of profit or loss and net assets not held by the Company and are presented separately in the consolidated statements of income and within stockholders’ equity in the consolidated balance sheets, separately from equity attributable to parent equity holders.
3. Significant Accounting Judgments, Estimates and Assumptions
JudgmentsIn the process of applying the Company’s accounting policy pertaining to leases, management has determined that it retains all the significant risks and rewards of ownership of the investment properties which are leased out and, accordingly, account for such leases as operating leases.
Operating Lease Commitments - Company as Lessor. The Company has entered into commercial property leases on its investment property portfolio. The Company has determined, based on an evaluation of the terms and conditions of the arrangements, that it retains all the significant risks and rewards of ownership of the properties and, thus, account for the contracts as operating leases.
Rent income amounted to P=15,358 million, P=13,402 million and P=11,397 million for the years ended December 31, 2008, 2007 and 2006, respectively.
- 8 -
*SGVMC212218*
Operating Lease Commitments - Company as Lessee. The Company has entered into various lease agreements as a lessee. Management has determined that all the significant risks and benefits of ownership of the properties, which the Company leases under operating lease arrangements, remain with the lessor. Accordingly, the leases were accounted for as operating leases.
Rent expense amounted to P=368 million, P=321 million and P=221 million for the years ended December 31, 2008, 2007 and 2006, respectively.
Use of EstimatesThe key assumptions that may have significant risks of causing material adjustments to the carrying amounts of assets and liabilities within the next financial year are discussed below.
Allowance for Impairment Losses on Receivables. The Company maintains an allowance for impairment losses at a level considered adequate to provide for potential uncollectible receivables. The level of allowance is evaluated by the Company on the basis of factors that affect the collectibility of the accounts. These factors include, but are not limited to, the length of the Company’s relationship with the customers, average age of accounts and collection experience. The Company performs a regular review of the age and status of these accounts, designed to identify accounts with objective evidence of impairment and provide the appropriate allowance for impairment losses. The review is accomplished using a combination of specific and collective assessment approaches. The amount and timing of recorded expenses for any period would differ if the Company made different judgments or utilized different methodologies. An increase in allowance for impairment losses would increase the recorded operating expenses and decrease current assets.
The carrying amount of receivables amounted to P=3,346 million and P=2,985 million as of December 31, 2008 and 2007, respectively (see Note 9).
Impairment of AFS Investments. The Company treats AFS investments as impaired when there has been a significant or prolonged decline in the fair value below its cost or whether other objective evidence of impairment exists. The determination of what is ‘significant’ or ‘prolonged’ requires judgment. The Company treats ‘significant’ generally as 20% or more of the original cost of investment, and ‘prolonged’ as greater than 12 months. In addition, the Company evaluates other factors, including normal volatility in share price for quoted equities and future cash flows and the discount factors for unquoted equities.
The Company’s AFS investments amounted to P=2,553 million and P=2,218 million as of December 31, 2008 and 2007, respectively.
Estimated Useful Lives of Investment Properties. The useful life of each of the Company’s investment property is estimated based on the period over which the asset is expected to be available for use. Such estimation is based on a collective assessment of industry practice, internal technical evaluation and experience with similar assets. The estimated useful life of each asset is reviewed periodically and updated if expectations differ from previous estimates due to physical wear and tear, technical or commercial obsolescence and legal or other limitations on the use of the asset. It is possible, however, that future results of operations could be materially affected by changes in the amounts and timing of recorded expenses brought about by changes in the factors mentioned above. A reduction in the estimated useful life of any investment property would increase the recorded operating expenses and decrease investment properties.

- 9 -
*SGVMC212218*
The net book value of investment properties amounted to P=66,693 million and P=59,427 million as of December 31, 2008 and 2007, respectively (see Note 11).
Impairment of Nonfinancial Assets. The Company assesses at each reporting date whether there is an indication that investment properties and shopping mall complex under construction may be impaired. An investment property’s recoverable amount is the higher of an investment property’s fair value less costs to sell and its value in use. The recoverable amount of shopping mall complex under construction is the higher of its fair value less estimated costs to complete and sell and its value in use. When the carrying amounts of an investment property and shopping mall complex under construction exceed their recoverable amounts, the investment property and shopping mall complex under construction are considered impaired and are written down to their recoverable amounts.
The aggregate net book value of investment properties and shopping mall complex under construction amounted to P=75,174 million and P=65,820 million as of December 31, 2008 and 2007, respectively (see Notes 11 and 12).
Realizability of Deferred Tax Assets. The Company’s assessment on the recognition of deferred tax assets on deductible temporary differences is based on the projected taxable income in the following periods. This projection is based on the Company’s past and future results of operations.
Deferred tax assets amounted to P=209 million and P=144 million as of December 31, 2008 and 2007, respectively (see Note 19).
Pension. The determination of the Company’s obligation and cost of pension benefits is dependent on the selection of certain assumptions used by actuaries in calculating such amounts. Those assumptions are described in Note 20 and include, among others, discount rate, expected rate of return on plan assets and salary increase rate. In accordance with PFRS, actual results that differ from the assumptions are accumulated and amortized over future periods and therefore, generally affect the recognized expense and recorded obligation in such future periods.
Financial Assets and Liabilities. The Company carries certain financial assets and liabilities at fair value in the consolidated balance sheets. Determining the fair value of financial assets and liabilities requires extensive use of accounting estimates and judgment. The significant components of fair value measurement were determined using verifiable objective evidence (i.e., foreign exchange rates, interest rates, volatility rates). However, the amount of changes in fair value would differ if the Company utilized different valuation methodologies and assumptions. Any changes in the fair value of these financial assets and liabilities would affect profit and loss and equity.
The fair value of financial assets and liabilities are discussed in Note 24.

- 10 -
*SGVMC212218*
Contingencies. The Company has various legal claims. The Company’s estimates of the probable costs for the resolution of these claims have been developed in consultation with in-house as well as outside counsel handling the prosecution and defense of the cases and are based upon an analysis of potential results. The Company currently does not believe these legal claims will have a material adverse effect on its consolidated financial position and results of operations. It is possible, however, that future results of operations could be materially affected by changes in the estimates or in the effectiveness of strategies relating to these proceedings. No accruals were made in relation to these claims (see Note 26).
4. Summary of Significant Accounting and Financial Reporting Policies
Cash and Cash EquivalentsCash includes cash on hand and in banks. Cash equivalents are highly liquid investments that are readily convertible to known amounts of cash and are subject to an insignificant risk of change in value.
Financial Assets and Liabilities
Date of Recognition. The Company recognizes a financial asset or a financial liability in the consolidated balance sheets when it becomes a party to the contractual provisions of the instrument. In the case of a regular way purchase or sale of financial assets, recognition and derecognition, as applicable, is done using settlement date accounting.
Initial Recognition of Financial Instruments. Financial instruments are recognized initially at fair value, which is the fair value of the consideration given (in case of an asset) or received (in case of a liability). The initial measurement of financial instruments, except for those designated at FVPL, includes transaction cost.
Subsequent to initial recognition, the Company classifies its financial instruments in the following categories: financial assets and financial liabilities at FVPL, loans and receivables, held-to-maturity (HTM) investments, AFS investments and other financial liabilities. The classification depends on the purpose for which the instruments are acquired and whether they are quoted in an active market. Management determines the classification at initial recognition and, where allowed and appropriate, re-evaluates this classification at every reporting date.
Determination of Fair Value. The fair value of financial instruments traded in active markets at the balance sheet date is based on their quoted market price or dealer price quotations (bid price for long positions and ask price for short positions), without any deduction for transaction costs. When current bid and asking prices are not available, the price of the most recent transaction provides evidence of the current fair value as long as there has not been a significant change in economic circumstances since the time of the transaction.
For all other financial instruments not listed in an active market, the fair value is determined by using appropriate valuation techniques. Valuation techniques include net present value techniques, comparison to similar instruments for which market observable prices exist, options pricing models, and other relevant valuation models.

- 11 -
*SGVMC212218*
Day 1 Profit. Where the transaction price in a non-active market is different from the fair value of other observable current market transactions in the same instrument or based on a valuation technique whose variables include only data from observable market, the Company recognizes the difference between the transaction price and fair value (a Day 1 profit) in the consolidated statements of income unless it qualifies for recognition as some other type of asset. In cases where use is made of data which is not observable, the difference between the transaction price and model value is only recognized in the consolidated statements of income when the inputs become observable or when the instrument is derecognized. For each transaction, the Company determines the appropriate method of recognizing the ‘Day 1’ profit amount.
Financial Assets
Financial Assets at FVPL. Financial assets at FVPL include financial assets held for trading and financial assets designated upon initial recognition as at FVPL.
Financial assets are classified as held for trading if they are acquired for the purpose of selling in the near term. Gains or losses on investments held for trading are included in the consolidated statements of income under the “Amusement and others” account. Interest income on investments held for trading is included in the consolidated statements of income under the “Interest income from short-term investments” account.
Financial assets may be designated by management at initial recognition as at FVPL when any of the following criteria is met:
� the designation eliminates or significantly reduces the inconsistent treatment that would otherwise arise from measuring the assets or recognizing gains or losses on a different basis; or
� the assets are part of a group of financial assets, financial liabilities or both which are managed and their performance are evaluated on a fair value basis, in accordance with a documented risk management or investment strategy; or
� the financial instrument contains an embedded derivative, unless the embedded derivative does not significantly modify the cash flows or it is clear, with little or no analysis, that it would not be separately recorded.
Classified as financial assets at FVPL are investments held for trading and derivative financial instruments. The carrying values of financial assets under this category amounted to P=178 million and P=497 million as of December 31, 2008 and 2007, respectively (see Note 24).
Loans and Receivables. Loans and receivables are nonderivative financial assets with fixed or determinable payments that are not quoted in an active market. They are not entered into with the intention of immediate or short-term resale and are not designated as AFS investments or financial assets at FVPL. Loans and receivables are carried at cost or amortized cost, less impairment in value. Amortization is determined using the effective interest method. Loans and receivables are included in current assets if maturity is within 12 months from balance sheet date. Otherwise, these are classified as noncurrent assets.

- 12 -
*SGVMC212218*
Classified under this category are the Company’s cash and cash equivalents and receivables. The carrying values of financial assets under this category amounted to P=14,083 million and P=5,489 million as of December 31, 2008 and 2007, respectively (see Note 24).
HTM Investments. HTM investments are quoted nonderivative financial assets with fixed or determinable payments and fixed maturities for which the Company’s management has the positive intention and ability to hold to maturity. Where the Company sells other than an insignificant amount of HTM investments, the entire category would be tainted and reclassified as AFS securities. After initial measurement, these investments are measured at amortized cost using the effective interest method, less impairment in value. Amortized cost is calculated by taking into account any discount or premium on acquisition and fees that are an integral part of the effective interest rate. Gains and losses are recognized in the consolidated statements of income when the HTM investments are derecognized or impaired, as well as through the amortization process. Assets under this category are classified as current assets if maturity is within 12 months from balance sheet date and as noncurrent assets if maturity date is more than a year from balance sheet date.
The Company has no investments classified as HTM as of December 31, 2008 and 2007.
AFS Investments. AFS investments are nonderivative financial assets that are designated in this category or are not classified in any of the other categories. Subsequent to initial recognition, AFSinvestments are carried at fair value in the consolidated balance sheets. Changes in the fair value of such assets are reported as revaluation reserve for AFS investments in the stockholders’ equity section of the consolidated balance sheets until the investment is derecognized or the investment is determined to be impaired. On derecognition or impairment, the cumulative gain or loss previously reported in stockholders’ equity is transferred to the consolidated statements of income. Interest earned on holding AFS investments are recognized in the consolidated statements of income using the effective interest rate. Assets under this category are classified as current assets if maturity is within 12 months from balance sheet date and as noncurrent assets if maturity date is more than a year from balance sheet date.
Classified under this category are the Company’s investments in redeemable preferred shares. The carrying values of financial assets classified under this category amounted to P=2,553 million and P=2,218 million as of December 31, 2008 and 2007, respectively (see Note 24).
Financial Liabilities
Financial Liabilities at FVPL. Financial liabilities are classified in this category if these result from trading activities or derivatives transaction that are not accounted for as accounting hedges, or when the Company elects to designate a financial liability under this category.
Included in this category are the Company’s derivative financial instruments with negative fair values. The carrying values of financial liabilities at FVPL amounted to P=902 million and P=1,769 million as of December 31, 2008 and 2007, respectively (see Note 24).
- 13 -
*SGVMC212218*
Other Financial Liabilities. This category pertains to financial liabilities that are not held for trading or not designated as at FVPL upon the inception of the liability. These include liabilities arising from operations or borrowings.
The financial liabilities are recognized initially at fair value and are subsequently carried at amortized cost, taking into account the impact of applying the effective interest method of amortization (or accretion) for any related premium, discount and any directly attributable transaction costs.
This category includes loans payable, accounts payable and other current liabilities, long-term debt, tenants’ deposits and other noncurrent liabilities. The carrying values of financial liabilities under this category amounted to P=44,388 million and P=29,072 million as of December 31, 2008 and 2007, respectively (see Note 24).
Classification of Financial Instruments Between Debt and EquityA financial instrument is classified as debt if it provides for a contractual obligation to:
� deliver cash or another financial asset to another entity; or
� exchange financial assets or financial liabilities with another entity under conditions that are potentially unfavorable to the Company; or
� satisfy the obligation other than by the exchange of a fixed amount of cash or another financial asset for a fixed number of own equity shares.
If the Company does not have an unconditional right to avoid delivering cash or another financial asset to settle its contractual obligation, the obligation meets the definition of a financial liability.
Debt Issuance CostsDebt issuance costs are deducted against long-term debt and are amortized over the terms of the related borrowings using the effective interest method.
Derivative Financial Instruments and Hedging
Freestanding Derivative. The Company uses derivative financial instruments such as long-term currency swaps, foreign currency call options, interest rate swaps and non-deliverable forwards to hedge the risks associated with foreign currency and interest rate fluctuations. Such derivative financial instruments are initially recognized at fair value on the date on which the derivative contract is entered into and are subsequently re-measured at fair value. Derivatives are carried as assets when the fair value is positive and as liabilities when the fair value is negative.
The Company’s derivative instruments provide economic hedges under the Company’s policies but are not designated as accounting hedges. Consequently, any gains or losses arising from changes in fair value are taken directly to profit or loss for the year.

- 14 -
*SGVMC212218*
Embedded Derivative. An embedded derivative is separated from the host contract and accounted for as a derivative if all of the following conditions are met: a) the economic characteristics and risks of the embedded derivative are not closely related to the economic characteristics and risks of the host contract; b) a separate instrument with the same terms as the embedded derivative would meet the definition of a derivative; and c) the hybrid or combined instrument is not recognized at FVPL.
Subsequent reassessment is prohibited unless there is a change in the terms of the contract that significantly modifies the cash flows that otherwise would be required under the contract, in which case reassessment is required. The Company determines whether a modification to cash flows is significant by considering the extent to which the expected future cash flows associated with the embedded derivative, the host contract or both have changed and whether the change is significant relative to the previously expected cash flow on the contract.
Derecognition of Financial Assets and Liabilities
Financial Assets. A financial asset (or, where applicable a part of a financial asset or part of a group of similar financial assets) is derecognized when:
� the rights to receive cash flows from the asset have expired;
� the Company retains the right to receive cash flows from the asset, but has assumed an obligation to pay them in full without material delay to a third party under a “pass-through” arrangement; or
� the Company has transferred its rights to receive cash flows from the asset and either (a) has transferred substantially all the risks and rewards of the asset, or (b) has neither transferred nor retained substantially all the risks and rewards of the asset, but has transferred control of the asset.
When the Company has transferred its rights to receive cash flows from an asset and has neither transferred nor retained substantially all the risks and rewards of the asset, the asset is recognized to the extent of the Company’s continuing involvement in the asset.
Financial Liabilities. A financial liability is derecognized when the obligation under the liability is discharged or cancelled or expired.
When an existing financial liability is replaced by another from the same lender on substantially different terms, or the terms of an existing liability are substantially modified, such modification is treated as a derecognition of the original liability and the recognition of a new liability, and the difference in the respective carrying amounts is recognized in profit and loss.

- 15 -
*SGVMC212218*
Impairment of Financial AssetsThe Company assesses at each balance sheet date whether a financial asset or a group of financial assets is impaired.
Assets Carried at Amortized Cost. If there is objective evidence that an impairment loss on loans and receivables carried at amortized cost has been incurred, the amount of the loss is measured as the difference between the asset’s carrying amount and the present value of estimated future cash flows (excluding future credit losses that have not been incurred) discounted at the financial asset’s original effective interest rate (i.e., the effective interest rate computed at initial recognition). The carrying amount of the asset shall be reduced through the use of an allowance account. The amount of the loss shall be recognized in the consolidated statements of income.
The Company first assesses whether objective evidence of impairment exists individually for financial assets that are individually significant, and individually or collectively for financial assets that are not individually significant. If it is determined that no objective evidence of impairment exists for an individually assessed financial asset, whether significant or not, the asset is included in a group of financial assets with similar credit risk characteristics and that group of financial assets is collectively assessed for impairment. Assets that are individually assessed for impairment and for which an impairment loss is or continues to be recognized are not included in a collective assessment of impairment.
If, in a subsequent period, the amount of the impairment loss decreases and the decrease can be related objectively to an event occurring after the impairment was recognized, the previously recognized impairment loss is reversed by adjusting the allowance account. The amount of the reversal is recognized in the consolidated statements of income. Interest income continues to be accrued on the reduced carrying amount based on the original effective interest rate of the asset. Loans together with the associated allowance are written off when there is no realistic prospect of future recovery and all collateral, if any, has been realized or has been transferred to the Company. If in a subsequent year, the amount of the estimated impairment loss increases or decreases because of an event occurring after the impairment was recognized, the previously recognized impairment loss is increased or reduced by adjusting the allowance for impairment losses account. If a future write-off is later recovered, the recovery is recognized in the consolidated statements of income under “Amusement and others” account. Any subsequent reversal of an impairment loss is recognized in the consolidated statements of income under “Provision for (reversal of) impairment losses” account, to the extent that the carrying value of the asset does not exceed its amortized cost at reversal date.
Assets Carried at Cost. If there is objective evidence that an impairment loss has been incurred in an unquoted equity instrument that is not carried at fair value because its fair value cannot be reliably measured, or on a derivative asset that is linked to and must be settled by delivery of such an unquoted equity instrument, the amount of the loss is measured as the difference between the asset’s carrying amount and the present value of estimated future cash flows discounted at the current market rate of return for a similar financial asset.
- 16 -
*SGVMC212218*
AFS Investments. If an AFS investment is impaired, an amount comprising the difference between its cost (net of any principal payment and amortization) and its current fair value, less any impairment loss previously recognized in profit or loss, is transferred from equity to the consolidated statements of income. Reversals in respect of equity instruments classified as AFS are not recognized in profit. Reversals of impairment losses on debt instruments are reversed through profit or loss, if the increase in fair value of the instrument can be objectively related to an event occurring after the impairment loss was recognized in profit or loss.
Offsetting Financial InstrumentsFinancial assets and financial liabilities are offset and the net amount is reported in the consolidated balance sheets if, and only if, there is a currently enforceable legal right to offset the recognized amounts and there is an intention to settle on a net basis, or to realize the asset and settle the liability simultaneously. This is not generally the case with master netting agreements, and the related assets and liabilities are presented gross in the consolidated balance sheets.
Business CombinationsBusiness combinations involving companies under common control are accounted for similar to pooling of interest method.
In applying the pooling of interest method, the assets, liabilities and equity of the acquired companies for the reporting period in which the common control business combinations occur, and for any comparative periods presented, are included in the consolidated financial statements of the Parent Company at their carrying amounts as if the combinations had occurred from the date when the acquired companies first became under the control of the Parent Company. The excess of the cost of business combinations over the net carrying amounts of the identifiable assets and liabilities of the acquired companies is considered as “equity adjustment from business combinations”, included under “Additional paid-in capital - net” account in the stockholders’ equity section of the consolidated balance sheets.
Investment PropertiesInvestment properties represent land and land use rights, buildings, structures, equipment and improvements of the shopping malls.
Investment properties, except land, are measured initially at cost, including transaction costs, less accumulated depreciation and amortization and accumulated impairment in value, if any. Land is stated at cost less any impairment in value. The carrying amount includes the cost of replacing part of an existing investment property at the time that cost is incurred if the recognition criteria are met, and excludes the costs of day-to-day servicing of an investment property.
Depreciation and amortization is calculated on a straight-line basis over the following estimated useful lives of the assets:
Land use rights 40–60 years Buildings and improvements 35 years Building equipment, furniture and others 3–15 years

- 17 -
*SGVMC212218*
The residual values, useful lives and method of depreciation and amortization of the assets are reviewed and adjusted, if appropriate, at each financial year-end.
When each major inspection is performed, the cost is recognized in the carrying amount of the investment properties as a replacement, if the recognition criteria are met.
Investment property is derecognized when either it has been disposed or when it is permanently withdrawn from use and no future economic benefit is expected from its disposal. Any gains or losses on the retirement or disposal of an investment property are recognized in the consolidated statements of income in the year of retirement or disposal.
The transfer of shopping mall complex under construction to investment property is made when there is a change in use, evidenced by completion of construction of the shopping mall complex.
Shopping Mall Complex Under ConstructionShopping mall complex under construction is stated at cost and includes the cost of land, construction costs, property and equipment, and other direct costs. Cost also includes interest on borrowed funds incurred during the construction period, provided that the carrying amount does not exceed the amount realizable from the use or sale of the asset. Shopping mall complex under construction is not depreciated until such time that the relevant assets are completed and put into operational use.
Impairment of Nonfinancial AssetsThe carrying value of investment properties and other nonfinancial assets is reviewed for impairment when events or changes in circumstances indicate that the carrying value may not be recoverable. If any such indication exists, and if the carrying value exceeds the estimated recoverable amount, the assets or cash-generating units are written down to their recoverable amounts. The recoverable amount of investment properties and other nonfinancial assets is the greater of fair value less costs to sell or value in use. The fair value less costs to sell is the amount obtainable from the sale of an asset in an arm’s-length transaction less costs to sell. In assessing value in use, the estimated future cash flows are discounted to their present value using a pre-tax discount rate that reflects current market assessments of the time value of money and the risks specific to the asset. For an asset that does not generate largely independent cash inflows, the recoverable amount is determined for the cash-generating unit to which the asset belongs. Impairment losses are recognized in the consolidated statements of income in those expense categories consistent with the function of the impaired asset.
An assessment is made at each reporting date as to whether there is any indication that previously recognized impairment losses may no longer exist or may have decreased. If such indication exists, the recoverable amount is estimated. A previously recognized impairment loss is reversed only if there has been a change in the estimates used to determine the asset’s recoverable amount since the last impairment loss was recognized. If that is the case, the carrying amount of the asset is increased to its recoverable amount. That increased amount cannot exceed the carrying amount that would have been determined, net of depreciation and amortization, had no impairment loss been recognized for the asset in prior years. Such reversal is recognized in profit or loss. After such a reversal, the depreciation charge is adjusted in future periods to allocate the asset’s revised carrying amount, less any residual value, on a systematic basis over its remaining useful life.

- 18 -
*SGVMC212218*
Treasury StockOwn equity instruments which are reacquired are deducted from equity. No gain or loss is recognized in the consolidated statements of income on the purchase, sale, issuance or cancellation of the Company’s own equity instruments.
RevenueRevenue is recognized when it is probable that the economic benefits associated with the transaction will flow to the Company and the amount of the revenue can be reliably measured. The following specific recognition criteria must also be met before revenue is recognized:
Rent. Revenue is recognized on a straight-line basis over the lease term or based on the terms of the lease, as applicable.
Cinema Ticket Sales, Amusement and Others. Revenue is recognized upon receipt of cash from the customer which coincides with the rendering of services.
Interest. Revenue is recognized as the interest accrues, taking into account the effective yield on the asset.
Dividend Income. Revenue is recognized when the right to receive the payment is established.
Management FeesManagement fees are recognized as expense in accordance with the terms of the agreements.
Pension CostThe Parent Company is a participant in the SM Corporate and Management Companies Employer Retirement Plan. The plan is a funded, noncontributory defined benefit retirement plan administered by a Board of Trustees covering all regular full-time employees. The cost of providing benefits under the defined benefit plan is determined using the projected unit credit actuarial valuation method. This method reflects service rendered by employees to the date of valuation and incorporates assumptions concerning the employees’ projected salaries. Pension cost includes current service cost, interest cost, expected return on plan assets, amortization of unrecognized past service costs, recognition of actuarial gains (losses) and effect of any curtailments or settlements. Past service cost is amortized over a period until the benefits become vested. The portion of the actuarial gains and losses is recognized when it exceeds the “corridor” (10% of the greater of the present value of the defined benefit obligation or fair value of the plan assets) at the previous reporting date, divided by the expected average remaining working lives of active plan members.
The amount recognized as defined benefit liability is the net of the present value of the defined benefit obligation at balance sheet date, plus any actuarial gains not recognized minus past service cost not yet recognized minus the fair value of plan assets at balance sheet date out of which the obligations are to be settled directly.

- 19 -
*SGVMC212218*
Foreign Currency TransactionsThe financial statements are presented in Philippine peso, which is the Parent Company’s functional and presentation currency. Transactions in foreign currencies are initially recorded in the functional currency rate at the date of the transaction. Monetary assets and liabilities denominated in foreign currencies are restated at the functional currency rate of exchange at balance sheet date. All differences are taken to the consolidated statements of income. Non-monetary items that are measured in terms of historical cost in a foreign currency are translated using the exchange rates as at the dates of the initial transactions. Non-monetary items measured at fair value in a foreign currency are translated using the exchange rates at the date when the fair value was determined.
Foreign Currency TranslationsThe assets and liabilities of foreign operations are translated into Philippine peso at the rate of exchange ruling at the balance sheet date and their income statements are translated at the weighted average rates for the year. The exchange differences arising on the translation are included in the consolidated statements of changes in stockholders’ equity under “Cumulative translation adjustment” account. On disposal of a foreign entity, the deferred cumulative amount of exchange differences recognized in stockholders’ equity relating to that particular foreign operation is recognized in profit or loss.
LeasesThe determination of whether an arrangement is, or contains a lease is based on the substance of the arrangement at inception date of whether the fulfillment of the arrangement is dependent on the use of a specific asset or assets or the arrangement conveys a right to use the asset.
Company as Lessee. Finance leases, which transfer to the Company substantially all the risks and benefits incidental to ownership of the leased item, are capitalized at the inception of the lease at the fair value of the leased property or, if lower, at the present value of the minimum lease payments. Lease payments are apportioned between the finance charges and reduction of the lease liability so as to achieve a constant rate of interest on the remaining balance of the liability. Finance charges are reflected in the consolidated statements of income.
Capitalized leased assets are depreciated over the shorter of the estimated useful life of the asset and the lease term, if there is no reasonable certainty that the Company will obtain ownership by the end of the lease term.
Leases which do not transfer to the Company substantially all the risks and benefits of ownership of the asset are classified as operating leases. Operating lease payments are recognized as expense in the consolidated statements of income on a straight-line basis over the lease term. Associated costs, such as maintenance and insurance, are expensed as incurred.
Company as Lessor. Leases where the Company does not transfer substantially all the risks and benefits of ownership of the asset are classified as operating leases. Rental income from operating leases are recognized as income on a straight-line basis over the lease term. Initial direct costs incurred in negotiating an operating lease are added to the carrying amount of the leased asset and recognized over the lease term on the same basis as rental income. Contingent rents are recognized as revenue in the period in which they are earned.

- 20 -
*SGVMC212218*
ProvisionsProvisions are recognized when the Company has a present obligation (legal or constructive) as a result of a past event; it is probable that an outflow of resources embodying economic benefits will be required to settle the obligation; and a reliable estimate can be made of the amount of the obligation. If the effect of the time value of money is material, provisions are determined by discounting the expected future cash flows at a pre-tax rate that reflects current market assessments of the time value of money and, where appropriate, the risks specific to the liability. Where discounting is used, the increase in the provision due to the passage of time is recognized as interest expense. Where the Company expects a provision to be reimbursed, the reimbursement is recognized as a separate asset but only when the receipt of the reimbursement is virtually certain.
Borrowing CostsBorrowing costs are generally expensed as incurred. Borrowing costs are capitalized if they are directly attributable to the acquisition or construction of a qualifying asset. Capitalization of borrowing costs commences when the activities to prepare the asset are in progress and expenditures and borrowing costs are being incurred. Borrowing costs are capitalized until the assets are substantially ready for their intended use. If the carrying amount of the asset exceeds its recoverable amount, an impairment loss is recognized. Borrowing costs include interest charges and other costs incurred in connection with the borrowing of funds used to finance the shopping mall complex.
Taxes
Current Tax. Current tax assets and liabilities for the current and prior periods are measured at the amount expected to be recovered from or paid to the taxation authorities. The tax rates and tax laws used to compute the amount are those that are enacted or substantively enacted at balance sheet date.
Deferred Tax. Deferred tax is provided using the balance sheet liability method on temporary differences at the balance sheet date between the tax bases of assets and liabilities and their carrying amounts for financial reporting purposes. Deferred tax liabilities are recognized for all taxable temporary differences, except for those that are stated under the standard.
Deferred tax assets are recognized for all deductible temporary differences, carryforward benefits of minimum corporate income tax (MCIT) and net operating loss carryover (NOLCO), to the extent that it is probable that taxable profit will be available against which the deductible temporary differences, and the carryforward benefits of MCIT and NOLCO can be utilized, except for those that are stated under the standard.
The carrying amount of deferred tax assets is reviewed at each balance sheet date and reduced to the extent that it is no longer probable that sufficient taxable profit will be available to allow all or part of the deferred tax assets to be utilized.
- 21 -
*SGVMC212218*
Deferred tax assets and liabilities are measured at the tax rates that are expected to apply to the year when the asset is realized or the liability is settled, based on tax rates (and tax laws) that have been enacted or substantively enacted at balance sheet date.
Deferred tax assets and deferred tax liabilities are offset, if a legally enforceable right exists to offset current tax assets against current tax liabilities and the deferred taxes relate to the same taxable entity and the same taxation authority.
Sales Tax. Revenue, expenses and assets are recognized net of the amount of sales tax, except:
� where the sales tax incurred on a purchase of assets or services is not recoverable from the taxation authority, in which case the sales tax is recognized as part of the cost of acquisition of the asset or as part of the expense item as applicable; and
� receivables and payables that are stated with the amount of sales tax included.
The net amount of sales tax recoverable from, or payable to, the taxation authority is included as part of receivables or payables in the consolidated balance sheets.
Basic/Diluted Earnings Per Share (EPS)Basic/Diluted EPS is computed by dividing the net income for the year by the weighted average number of issued and outstanding shares of stock during the year, with retroactive adjustments for any stock dividends declared.
Geographical SegmentThe Company’s business of shopping mall development and operations is organized and managed separately according to geographical areas where the Company operates, namely the Philippines and China. This is the basis upon which the Company reports its primary segment information presented in Note 6 to the consolidated financial statements. The Company has only one primary business segment, which is shopping mall operation.
ContingenciesContingent liabilities are not recognized in the consolidated financial statements. They are disclosed unless the possibility of an outflow of resources embodying economic benefits is remote. Contingent assets are not recognized in the consolidated financial statements but are disclosed when an inflow of economic benefits is probable.
Subsequent EventsPost year-end events that provide additional information about the Company’s position at balance sheet date (adjusting events) are reflected in the consolidated financial statements. Post year-end events that are not adjusting events are disclosed in the notes to consolidated financial statements when material.

- 22 -
*SGVMC212218*
5. Business Combinations
Acquisition of the SM China CompaniesOn November 13, 2007, the BOD of SMPH approved the acquisition of 100% of the outstanding shares of the SM China Companies in exchange for SMPH common shares with a valuation based on the 30-day volume weighted average price of SMPH at P=11.86 per share. The acquisition is intended to gain a foothold in China’s high-growth prospects and use it as a platform for long-term growth outside the Philippines.
On February 18, 2008, SMPH executed the subscription agreements with Grand China and Oriental Land for the exchange of the SM China Companies shares of stocks for 912,897,212 shares of SMPH to be issued upon the approval by the SEC and the Philippine Stock Exchange (PSE). Grand China owns Affluent, which is the holding company of SM Xiamen and SM Chengdu, while Oriental Land owns Mega Make, the holding company of SM Jinjiang.
On May 20, 2008, the SEC approved the valuation and confirmed that the issuance of the shares is exempt from the registration requirements of the Securities Regulation Code. Pursuant to the agreements entered into among SMPH, Grand China and Oriental Land, the 912,897,212 shares of SMPH were exchanged for 1,000 shares (100% ownership) of Affluent and 1 share (100% ownership) of Mega Make at a total swap price of P=10,827 million. On May 28, 2008, the PSE approved the listing of 912,897,212 new shares in connection with the share-for-share swap transaction with Grand China and Oriental Land. On June 18, 2008, SMPH’s new shares issued to Grand China and Oriental Land were listed in the PSE. As a result of the acquisition, Affluent and Megamake became wholly-owned subsidiaries of SMPH (see Notes 11 and 17).
For accounting purposes, the acquisition of the SM China Companies was recorded at the fair value of the SMPH shares issued to Grand China and Oriental Land at the date of exchange amounting to P=8,125 million plus directly attributable costs associated with the acquisition.
Acquisition of Affluent and Mega MakeAffluent and Mega Make are unlisted companies which were incorporated under the laws of the British Virgin Islands. Affluent indirectly owns SM Xiamen and SM Chengdu while Mega Make indirectly owns SM Jinjiang. The SM China Companies were incorporated in the People’s Republic of China. The SM China Companies are engaged in mall operations and development and construction of shopping centers and property management.
Below are the details of the cost of the acquisition of Affluent:
Cost: Shares issued, at fair value P=4,809,598,537 Costs associated with the acquisition 24,918,802
P=4,834,517,339
Cash outflow on acquisition: Net cash and cash equivalents acquired
with the subsidiary P=558,441 Cash paid (24,918,802)
Net cash outflow (P=24,360,361)

- 23 -
*SGVMC212218*
The total cost of the acquisition was P=4,835 million, consisting of issuance of equity instruments and costs directly attributable to the acquisition. The Parent Company issued 540,404,330 shares with a fair value of P=8.90 each, the quoted market price of the shares of SMPH on the date of exchange.
Below are the details of the cost of the acquisition of Mega Make:
Cost: Shares issued, at fair value P=3,315,186,650 Costs associated with the acquisition 17,316,456
P=3,332,503,106
Cash outflow on acquisition: Net cash and cash equivalents acquired
with the subsidiary P=17,890 Cash paid (17,316,456)
Net cash outflow (P=17,298,566)
The total cost of the acquisition was P=3,333 million, consisting of issuance of equity instruments and costs directly attributable to the acquisition. The Parent Company issued 372,492,882 shares with a fair value of P=8.90 each, the quoted market price of the shares of SMPH on the date of exchange.
Acquisition of SM LandOn November 30, 2008, the Parent Company likewise completed the acquisition of 100% ownership of SM Land from Grand China for P=11,360 (HK$2,000). As a result of the acquisition, SM Land became a wholly-owned subsidiary of SMPH.
SM Land is an unlisted company which was incorporated in Hong Kong.
Below are the details of the net cash inflow from the acquisition of SM Land:
Cash inflow on acquisition: Net cash and cash equivalents acquired
with the subsidiary P=7,511,421 Cash paid (11,360)
Net cash inflow P=7,500,061
The acquisitions of the SM China Companies and SM Land were considered as business reorganizations of companies under common control. Thus, the acquisitions were accounted for similar to pooling of interest method.
The excess of the cost of business combinations over the net carrying amounts of the identifiable assets and liabilities at the beginning of the earliest period presented of the acquired companies amounting to P=4,818 million is considered as “equity adjustment from business combinations”, included under “Additional paid-in capital - net” account in the stockholders equity section of the consolidated balance sheets (see Note 17).

- 24 -
*SGVMC212218*
The combined assets and liabilities of SMPH, SM China Companies and SM Land as of December 31, 2007 are presented below:
SMPH(As previously
reported)
SM ChinaCompanies
and SM Land Eliminating
Entries Combined
(As restated)
Assets Cash and cash equivalents P=2,114,940,507 P=389,240,440 P=– P=2,504,180,947 Investments held for trading 149,688,504 – – 149,688,504 Receivables 2,896,342,346 223,843,835 (135,467,133) 2,984,719,048 Prepaid expenses and other current
assets 950,480,849 63,916,696 – 1,014,397,545 Investment properties - net 51,985,265,210 7,028,564,871 413,058,485 59,426,888,566 Shopping mall complex
under construction 5,470,043,177 923,438,106 – 6,393,481,283 AFS investments 2,218,254,419 – – 2,218,254,419 Derivative assets 347,248,200 – – 347,248,200 Deferred tax assets 40,081,403 103,508,827 – 143,590,230 Other noncurrent assets 1,262,083,145 4,392,606 – 1,266,475,751
P=67,434,427,760 P=8,736,905,381 P=277,591,352 P=76,448,924,493
Liabilities Loans payable P=590,920,000 P=641,037,791 P=– P=1,231,957,791 Accounts payable and other current
liabilities 2,746,373,228 690,230,696 (324,060,090) 3,112,543,834 Current portion of long-term debt 840,625,000 565,020,000 – 1,405,645,000 Income tax payable 763,157,403 99,406,763 – 862,564,166 Long-term debt - net of current
portion 15,764,546,055 2,288,331,000 – 18,052,877,055 Derivative liability 1,768,518,516 – – 1,768,518,516 Deferred tax liabilities 836,818,110 43,478,526 – 880,296,636 Tenants’ deposits 4,220,538,574 107,922,436 – 4,328,461,010 Other noncurrent liabilities 111,007,844 598,661,960 643,898,051 1,353,567,855
P=27,642,504,730 P=5,034,089,172 P=319,837,961 P=32,996,431,863
As discussed in Note 11, included under “Investment properties - net” account are the 223,474 square meters of real estate properties with a carrying value of P=413 million as of December 31, 2007 and a fair value of P=13,531 million as of August 2007, planned for residential development in accordance with the cooperative contracts entered into by Mega Make and Affluent with Grand China and Oriental Land on March 15, 2007.
The combined revenue and net income for the years ended December 31, 2007 and 2006 are presented below:
2007
SMPH(As previously
reported)
SM China Companies
and SM Land Eliminating
Entries Combined
(As restated)
Revenue P=16,187,161,759 P=615,622,587 P=– P=16,802,784,346Net income 6,285,807,499 (2,591,653) – 6,283,215,846

- 25 -
*SGVMC212218*
2006
SMPH(As previously
reported)
SM China Companies
and SM Land Eliminating
Entries Combined
(As restated)
Revenue P=14,332,094,423 P=1,155,096,226 P=– P=15,487,190,649Net income 5,749,905,449 405,742,147 – 6,155,647,596
6. Segment Information
Geographical SegmentThe geographical segment is determined as the primary segment reporting format as the Company’s risks and rates of return are affected predominantly by differences in economic and political environments in which they operate. Currently, the Company owns thirty three shopping malls in the Philippines and three shopping malls in China. Each geographical area is organized and managed separately and viewed as a distinct strategic business unit that caters to different markets.
The Company has one primary business segment, which is shopping mall operations.
Segment Assets and LiabilitiesSegment assets and segment liabilities do not include deferred tax assets and deferred tax liabilities, respectively.
Inter-segment TransactionsTransfer prices between geographical segments are set on an arm’s length basis similar to transactions with related parties. Such transfers are eliminated in consolidation.
Geographical Segment Data
2008
Philippines China Eliminations Consolidated
(In Thousands)
Revenue P=17,723,164 P=823,707 P=– P=18,546,871
Segment results: Income before income tax P=9,396,548 P=83,878 P=– P=9,480,426
Provision for (benefit from) income tax 2,759,266 (12,127) – 2,747,139
Net income P=6,637,282 P=96,005 P=– P=6,733,287
Net income attributable to: Equity holders of the Parent P=6,316,211 P=96,005 P=– P=6,412,216
Minority interests 321,071 – – 321,071

- 26 -
*SGVMC212218*
2008
Philippines China Eliminations Consolidated
(In Thousands)
Segment assets (excluding deferred tax assets) P=84,537,422 P=12,210,040 (P=1,451,444) P=95,296,018
Segment liabilities (excluding deferred tax liabilities) P=40,315,230 P=7,147,306 (P=904,133) P=46,558,403
Net cash flows provided by (used in): Operating activities P=10,576,204 P=230,391 P=– P=10,806,595
Investing activities (5,762,763) 11,463 – (5,751,300)
Financing activities 3,218,590 (195,555) – 3,023,035
Other information: Depreciation and amortization P=2,362,785 P=303,522 P=– P=2,666,307 Capital expenditures 7,973,086 1,043,482 – 9,016,568
2007
Philippines China Eliminations Consolidated
(In Thousands)
Revenue P=16,187,162 P=615,622 P=– P=16,802,784
Segment results: Income (loss) before income tax P=8,911,052 (P=40,999) P=– P=8,870,053 Provision for (benefit from)
income tax 2,625,244 (38,407) – 2,586,837
Net income (loss) P=6,285,808 (P=2,592) P=– P=6,283,216
Net income attributable to: Equity holders of the Parent P=5,974,986 (P=2,592) P=– P=5,972,394 Minority interests 310,822 – – 310,822
Segment assets (excluding deferred tax assets) P=67,394,350 P=9,046,452 (P=135,468) P=76,305,334
Segment liabilities (excluding deferred tax liabilities) P=26,805,687 P=4,990,611 P=319,837 P=32,116,135
Net cash flows provided by (used in): Operating activities P=9,696,057 P=156,439 P=– P=9,852,496 Investing activities (3,040,152) (1,095,200) – (4,135,352) Financing activities (11,889,772) 1,408,797 – (10,840,975)
Other information: Depreciation and amortization P=2,260,923 P=238,215 P=– P=2,499,138 Capital expenditures 6,914,638 1,461,123 – 8,375,761
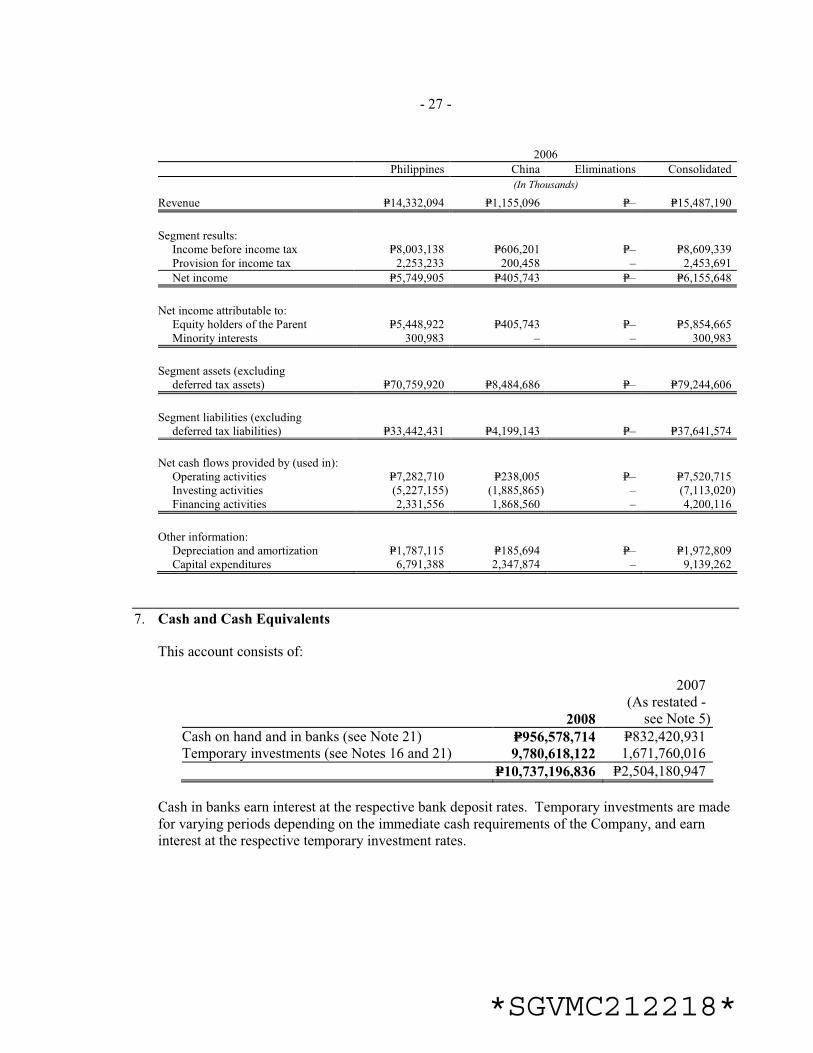
- 27 -
*SGVMC212218*
2006
Philippines China Eliminations Consolidated
(In Thousands)
Revenue P=14,332,094 P=1,155,096 P=– P=15,487,190
Segment results: Income before income tax P=8,003,138 P=606,201 P=– P=8,609,339 Provision for income tax 2,253,233 200,458 – 2,453,691
Net income P=5,749,905 P=405,743 P=– P=6,155,648
Net income attributable to: Equity holders of the Parent P=5,448,922 P=405,743 P=– P=5,854,665 Minority interests 300,983 – – 300,983
Segment assets (excluding deferred tax assets) P=70,759,920 P=8,484,686 P=– P=79,244,606
Segment liabilities (excluding deferred tax liabilities) P=33,442,431 P=4,199,143 P=– P=37,641,574
Net cash flows provided by (used in): Operating activities P=7,282,710 P=238,005 P=– P=7,520,715 Investing activities (5,227,155) (1,885,865) – (7,113,020) Financing activities 2,331,556 1,868,560 – 4,200,116
Other information: Depreciation and amortization P=1,787,115 P=185,694 P=– P=1,972,809 Capital expenditures 6,791,388 2,347,874 – 9,139,262
7. Cash and Cash Equivalents
This account consists of:
2008
2007(As restated -
see Note 5)
Cash on hand and in banks (see Note 21) P=956,578,714 P=832,420,931 Temporary investments (see Notes 16 and 21) 9,780,618,122 1,671,760,016
P=10,737,196,836 P=2,504,180,947
Cash in banks earn interest at the respective bank deposit rates. Temporary investments are made for varying periods depending on the immediate cash requirements of the Company, and earn interest at the respective temporary investment rates.

- 28 -
*SGVMC212218*
8. Investments Held for Trading
This account consists of investments in Philippine government and corporate bonds with fixed interest rates ranging from 8.38% to 12.29%. The investments are U.S. dollar-denominated with various maturities ranging from 2009-2012.
Investments held for trading include unrealized marked-to-market gain amounting to P=3 million in 2008, unrealized marked-to-market loss amounting to P=2 million in 2007 and unrealized marked-to-market gain amounting to P=8 million in 2006, the amounts of which are included under “Amusement and others” account in the consolidated statements of income.
9. Receivables
This account consists of:
2008
2007(As restated -
see Note 5)
Rent (see Note 21) P=2,667,539,796 P=2,215,865,215 Accrued interest and others (see Note 21) 678,202,262 768,853,833
P=3,345,742,058 P=2,984,719,048
Rent receivables generally have terms of 30-90 days.
Accrued interest and others are normally collected throughout the financial year.
As of December 31, the aging analysis of rent receivables is as follows:
2008
2007(As restated -
see Note 5)
Neither past due nor impaired: 1–30 days P=2,347,967,391 P=1,847,169,229 31–60 days 87,654,050 183,543,094 61–90 days 69,055,194 15,297,427 Past due but not impaired - Over 90 days 162,863,161 169,855,465
P=2,667,539,796 P=2,215,865,215
Receivables are assessed by the management of the Company as not impaired, good and collectible.
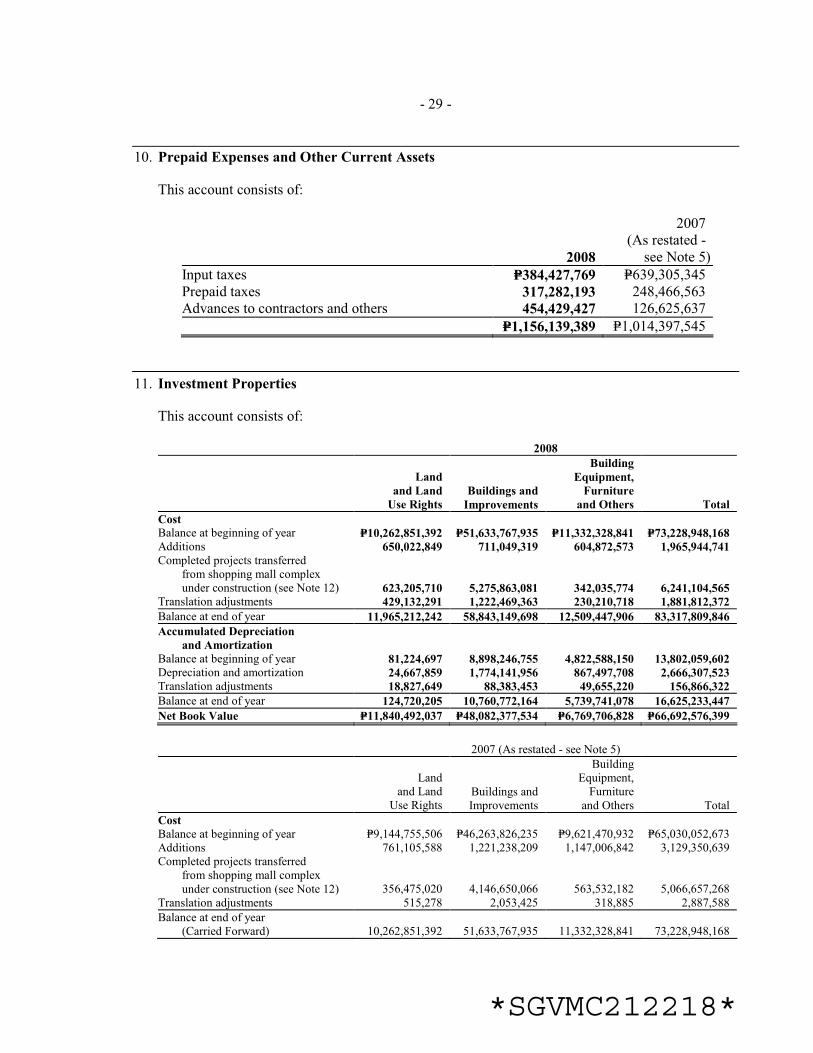
- 29 -
*SGVMC212218*
10. Prepaid Expenses and Other Current Assets
This account consists of:
2008
2007(As restated -
see Note 5)
Input taxes P=384,427,769 P=639,305,345 Prepaid taxes 317,282,193 248,466,563 Advances to contractors and others 454,429,427 126,625,637
P=1,156,139,389 P=1,014,397,545
11. Investment Properties
This account consists of:
2008
Land
and Land
Use Rights
Buildings and
Improvements
Building
Equipment,
Furniture
and Others Total
Cost Balance at beginning of year P=10,262,851,392 P=51,633,767,935 P=11,332,328,841 P=73,228,948,168 Additions 650,022,849 711,049,319 604,872,573 1,965,944,741
Completed projects transferred from shopping mall complex under construction (see Note 12) 623,205,710 5,275,863,081 342,035,774 6,241,104,565
Translation adjustments 429,132,291 1,222,469,363 230,210,718 1,881,812,372
Balance at end of year 11,965,212,242 58,843,149,698 12,509,447,906 83,317,809,846
Accumulated Depreciation
and Amortization
Balance at beginning of year 81,224,697 8,898,246,755 4,822,588,150 13,802,059,602 Depreciation and amortization 24,667,859 1,774,141,956 867,497,708 2,666,307,523 Translation adjustments 18,827,649 88,383,453 49,655,220 156,866,322
Balance at end of year 124,720,205 10,760,772,164 5,739,741,078 16,625,233,447
Net Book Value P=11,840,492,037 P=48,082,377,534 P=6,769,706,828 P=66,692,576,399
2007 (As restated - see Note 5)
Landand Land
Use Rights Buildings andImprovements
BuildingEquipment,
Furnitureand Others Total
Cost Balance at beginning of year P=9,144,755,506 P=46,263,826,235 P=9,621,470,932 P=65,030,052,673 Additions 761,105,588 1,221,238,209 1,147,006,842 3,129,350,639 Completed projects transferred
from shopping mall complex under construction (see Note 12) 356,475,020 4,146,650,066 563,532,182 5,066,657,268
Translation adjustments 515,278 2,053,425 318,885 2,887,588
Balance at end of year (Carried Forward) 10,262,851,392 51,633,767,935 11,332,328,841 73,228,948,168
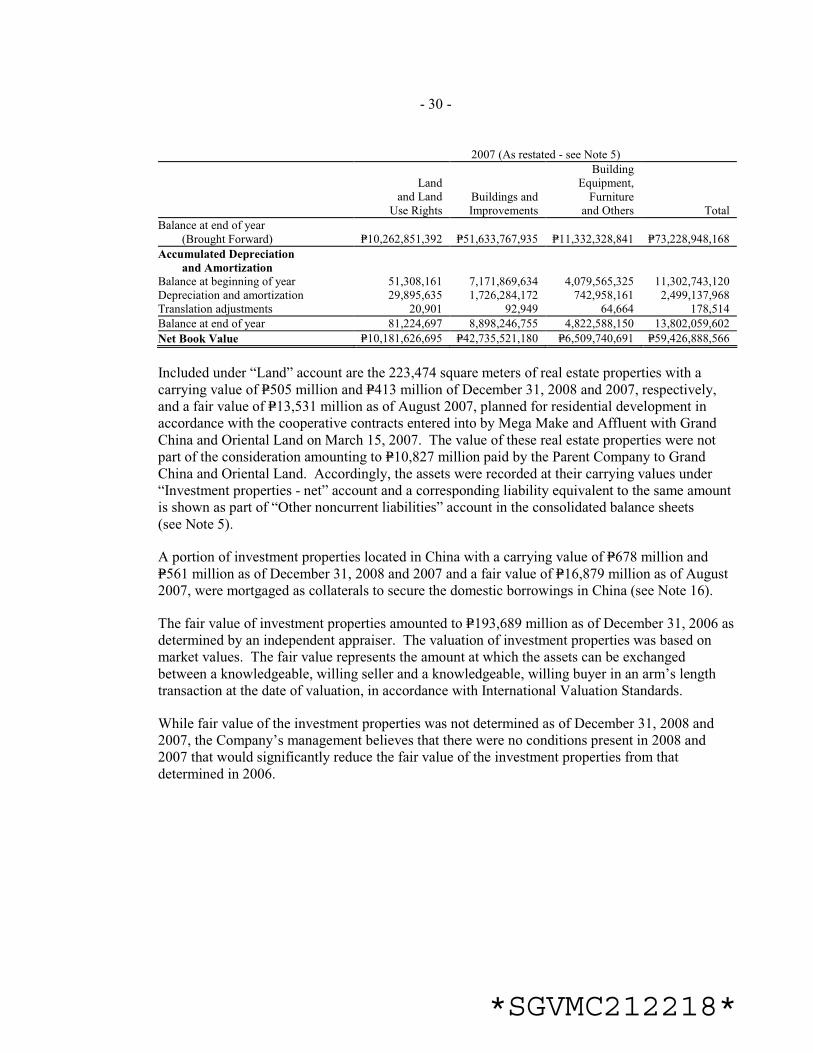
- 30 -
*SGVMC212218*
2007 (As restated - see Note 5)
Landand Land
Use Rights Buildings andImprovements
BuildingEquipment,
Furnitureand Others Total
Balance at end of year (Brought Forward) P=10,262,851,392 P=51,633,767,935 P=11,332,328,841 P=73,228,948,168
Accumulated Depreciation
and Amortization Balance at beginning of year 51,308,161 7,171,869,634 4,079,565,325 11,302,743,120 Depreciation and amortization 29,895,635 1,726,284,172 742,958,161 2,499,137,968 Translation adjustments 20,901 92,949 64,664 178,514
Balance at end of year 81,224,697 8,898,246,755 4,822,588,150 13,802,059,602
Net Book Value P=10,181,626,695 P=42,735,521,180 P=6,509,740,691 P=59,426,888,566
Included under “Land” account are the 223,474 square meters of real estate properties with a carrying value of P=505 million and P=413 million of December 31, 2008 and 2007, respectively, and a fair value of P=13,531 million as of August 2007, planned for residential development in accordance with the cooperative contracts entered into by Mega Make and Affluent with Grand China and Oriental Land on March 15, 2007. The value of these real estate properties were not part of the consideration amounting to P=10,827 million paid by the Parent Company to Grand China and Oriental Land. Accordingly, the assets were recorded at their carrying values under “Investment properties - net” account and a corresponding liability equivalent to the same amount is shown as part of “Other noncurrent liabilities” account in the consolidated balance sheets (see Note 5).
A portion of investment properties located in China with a carrying value of P=678 million and P=561 million as of December 31, 2008 and 2007 and a fair value of P=16,879 million as of August 2007, were mortgaged as collaterals to secure the domestic borrowings in China (see Note 16).
The fair value of investment properties amounted to P=193,689 million as of December 31, 2006 as determined by an independent appraiser. The valuation of investment properties was based on market values. The fair value represents the amount at which the assets can be exchanged between a knowledgeable, willing seller and a knowledgeable, willing buyer in an arm’s length transaction at the date of valuation, in accordance with International Valuation Standards.
While fair value of the investment properties was not determined as of December 31, 2008 and 2007, the Company’s management believes that there were no conditions present in 2008 and 2007 that would significantly reduce the fair value of the investment properties from that determined in 2006.

- 31 -
*SGVMC212218*
12. Shopping Mall Complex Under Construction
The movements of this account follow:
2008
2007(As restated -
see Note 5)
Balance at beginning of year P=6,393,481,283 P=5,006,047,122 Additions 8,114,905,744 6,453,924,129 Completed projects transferred to investment
properties (see Note 11) (6,241,104,565) (5,066,657,268)Translation adjustments 214,050,280 167,300
Balance at end of year P=8,481,332,742 P=6,393,481,283
In 2008, shopping mall complex under construction mainly pertains to costs incurred for the development of SM City Naga, SM North EDSA Expansion and SM Xiamen Expansion.
In 2007, shopping mall complex under construction mainly pertains to costs incurred for the development of SM City Marikina and SM North EDSA Expansion.
Shopping mall under construction includes cost of land amounting to P=2,173 million and P=2,210 million as of December 31, 2008 and 2007, respectively.
Construction contracts with various contractors related to the construction of the above-mentioned projects amounted to P=8,902 million and P=3,048 million as of December 31, 2008 and 2007, respectively, inclusive of overhead, cost of labor and materials and all other costs necessary for the proper execution of the works. The outstanding contracts as of December 31, 2008 and 2007 are valued at P=1,361 million and P=1,303 million, respectively.
Interest capitalized to shopping mall complex under construction amounted to P=1,064 million and P=1,207 million in 2008 and 2007, respectively. Capitalization rates used were 8.67% in 2008 and 9.01% in 2007.
13. Available-for-Sale Investments
This account consists of investments in redeemable preferred shares issued by local entities with annual dividend rates of 6.5% to 8.25%. The preferred shares have preference over the issuer’s common shares in the payment of dividends and in the distribution of assets in case of dissolution and liquidation. The shares are mandatorily redeemable from 2009 up to 2011 at par. Preferred shares amounting to P=1,500 million and P=1,000 million, with an annual dividend rate of 10.46%, were early redeemed in July 2007 and August 2007, respectively.
AFS investments include unrealized gain amounting to P=69 million and P=58 million as of December 31, 2008 and 2007, respectively. The amount is deferred under stockholders’ equity, net of deferred tax liability amounting to P=21 million and P=17 million, respectively.
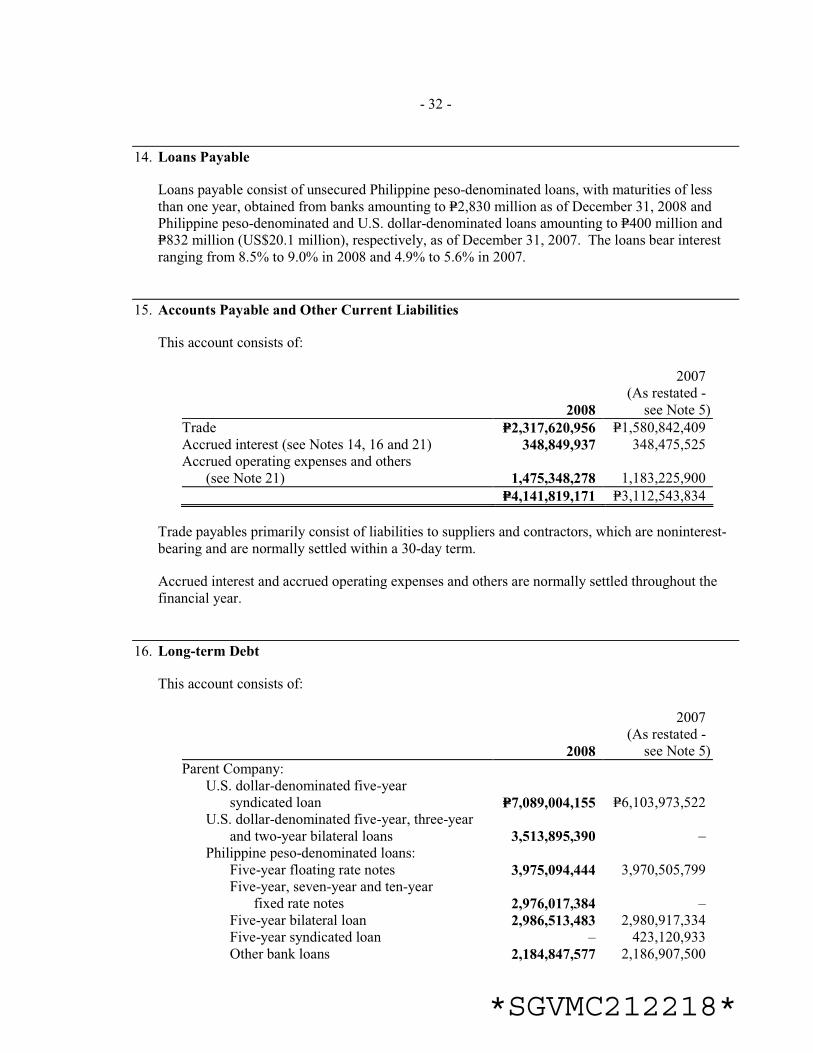
- 32 -
*SGVMC212218*
14. Loans Payable
Loans payable consist of unsecured Philippine peso-denominated loans, with maturities of less than one year, obtained from banks amounting to P=2,830 million as of December 31, 2008 and Philippine peso-denominated and U.S. dollar-denominated loans amounting to P=400 million and P=832 million (US$20.1 million), respectively, as of December 31, 2007. The loans bear interest ranging from 8.5% to 9.0% in 2008 and 4.9% to 5.6% in 2007.
15. Accounts Payable and Other Current Liabilities
This account consists of:
2008
2007(As restated -
see Note 5)
Trade P=2,317,620,956 P=1,580,842,409 Accrued interest (see Notes 14, 16 and 21) 348,849,937 348,475,525 Accrued operating expenses and others
(see Note 21) 1,475,348,278 1,183,225,900
P=4,141,819,171 P=3,112,543,834
Trade payables primarily consist of liabilities to suppliers and contractors, which are noninterest-bearing and are normally settled within a 30-day term.
Accrued interest and accrued operating expenses and others are normally settled throughout the financial year.
16. Long-term Debt
This account consists of:
2008
2007(As restated -
see Note 5)
Parent Company: U.S. dollar-denominated five-year
syndicated loan P=7,089,004,155 P=6,103,973,522 U.S. dollar-denominated five-year, three-year
and two-year bilateral loans 3,513,895,390 – Philippine peso-denominated loans: Five-year floating rate notes 3,975,094,444 3,970,505,799 Five-year, seven-year and ten-year
fixed rate notes 2,976,017,384 – Five-year bilateral loan 2,986,513,483 2,980,917,334 Five-year syndicated loan – 423,120,933 Other bank loans 2,184,847,577 2,186,907,500
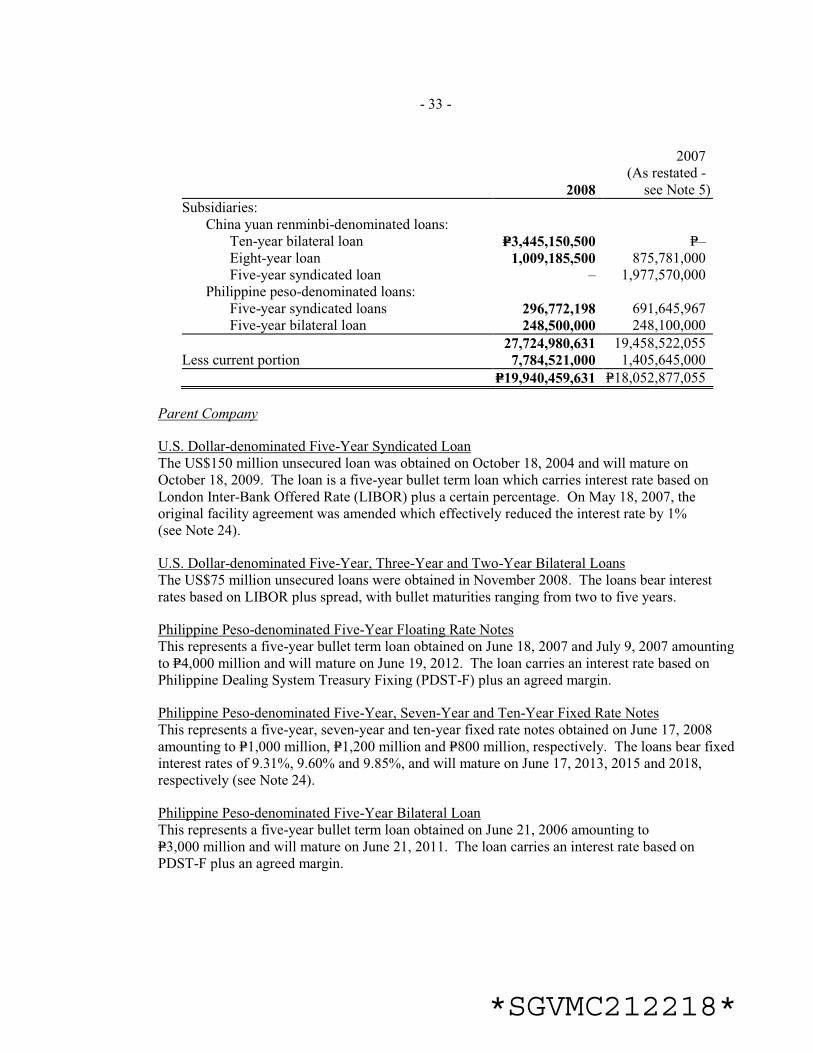
- 33 -
*SGVMC212218*
2008
2007(As restated -
see Note 5)
Subsidiaries: China yuan renminbi-denominated loans: Ten-year bilateral loan P=3,445,150,500 P=– Eight-year loan 1,009,185,500 875,781,000 Five-year syndicated loan – 1,977,570,000 Philippine peso-denominated loans: Five-year syndicated loans 296,772,198 691,645,967 Five-year bilateral loan 248,500,000 248,100,000
27,724,980,631 19,458,522,055 Less current portion 7,784,521,000 1,405,645,000
P=19,940,459,631 P=18,052,877,055
Parent Company
U.S. Dollar-denominated Five-Year Syndicated LoanThe US$150 million unsecured loan was obtained on October 18, 2004 and will mature on October 18, 2009. The loan is a five-year bullet term loan which carries interest rate based on London Inter-Bank Offered Rate (LIBOR) plus a certain percentage. On May 18, 2007, the original facility agreement was amended which effectively reduced the interest rate by 1% (see Note 24).
U.S. Dollar-denominated Five-Year, Three-Year and Two-Year Bilateral LoansThe US$75 million unsecured loans were obtained in November 2008. The loans bear interest rates based on LIBOR plus spread, with bullet maturities ranging from two to five years.
Philippine Peso-denominated Five-Year Floating Rate NotesThis represents a five-year bullet term loan obtained on June 18, 2007 and July 9, 2007 amounting to P=4,000 million and will mature on June 19, 2012. The loan carries an interest rate based on Philippine Dealing System Treasury Fixing (PDST-F) plus an agreed margin.
Philippine Peso-denominated Five-Year, Seven-Year and Ten-Year Fixed Rate NotesThis represents a five-year, seven-year and ten-year fixed rate notes obtained on June 17, 2008 amounting to P=1,000 million, P=1,200 million and P=800 million, respectively. The loans bear fixed interest rates of 9.31%, 9.60% and 9.85%, and will mature on June 17, 2013, 2015 and 2018, respectively (see Note 24).
Philippine Peso-denominated Five-Year Bilateral LoanThis represents a five-year bullet term loan obtained on June 21, 2006 amounting to P=3,000 million and will mature on June 21, 2011. The loan carries an interest rate based on PDST-F plus an agreed margin.

- 34 -
*SGVMC212218*
Philippine Peso-denominated Five-Year Syndicated LoanThis represents a five-year syndicated term loan obtained on November 21, 2003, originally amounting to P=1,700 million, payable in equal quarterly installments of P=106 million starting February 2005 up to November 2008 and bears a fixed interest rate of 8% payable quarterly. Starting April 2007, the fixed interest rate of 8% was reduced to 7.0625%.
Philippine Peso-denominated Five-Year and Seven-Year Fixed Rate NotesThis represents a five-year and seven-year fixed rate notes obtained on July 8, 2005 amounting to P=3,500 million (P=2,000 million of which was obtained from SMIC) and P=1,500 million, respectively. The loans bear fixed interest rates of 10.535% and 11.562%, and will mature on July 8, 2010 and 2012, respectively (see Notes 21 and 24).
In July 2007 and December 2006, the Company prepaid the P=3,000 million and P=2,000 million (held by SMIC with an original maturity date of July 8, 2010) notes, respectively. The related unamortized balance of debt issuance costs charged to expense amounted to P=24 million.
Other Bank LoansThis account consists of the following:
� Ten-year bullet fixed rate loan obtained on August 16, 2006 amounting to P=1,200 million. The loan carries a fixed interest rate of 9.75% and will mature on August 16, 2016 (see Note 24).
� Five-year bullet loan obtained on March 3, 2008 amounting to P=1,000 million and will mature on March 3, 2013. The loan carries a fixed interest rate of 7.18%.
� Five-year bullet loan obtained on October 2, 2006 amounting to P=1,000 million and will mature on October 2, 2011. The loan carries an interest rate based on PDST-F plus an agreed margin. The loan was prepaid on March 3, 2008. The related unamortized balance of debt issuance costs charged to expense amounted to P=4 million.
� Two-year and five-year unsecured loans obtained on December 1, 2004 amounting to P=466 million and P=534 million, respectively. The loans bear fixed interest rates of 10.87% and 12.54%, respectively. The P=466 million loan matured on December 1, 2006. The Company prepaid the P=534 million loan on June 1, 2007, with an original maturity date of December 1, 2009. The related unamortized balance of debt issuance costs charged to expense amounted to P=1 million.
Subsidiaries
China Yuan Renminbi-denominated Ten-Year Bilateral Loan This represents a ten-year loan obtained on June 11, 2008 amounting to ¥500 million to finance the construction of shopping malls. The loan is payable in annual installments until 2017. The interest rates range from 7.128% to 9.396% in 2008.

- 35 -
*SGVMC212218*
China Yuan Renminbi-denominated Eight-Year LoanThis represents eight-year loan obtained on December 28, 2005 amounting to ¥155 million to finance the construction of shopping malls. The loan is payable in annual installments with two years grace period until December 2012. The loan has a floating rate with an annual repricing at prevailing rate dictated by Central Bank of China less 10%. The loan bears interest rates ranging from 6.156% to 7.047% in 2008 and 5.508% to 6.156% in 2007.
China Yuan Renminbi-denominated Five-Year Syndicated LoanThis represents a five-year syndicated loan obtained on June 9, 2006 amounting to ¥350 million to finance the construction of shopping malls. The loan is payable in equal quarterly installments until June 9, 2011. The interest rate is based on the applicable basic rate at drawdown dates and is fixed for one year. The loan bears interest rates ranging from 6.75% to 6.93%. The loan was prepaid in June 2008.
The China yuan renminbi-denominated loans are secured by investment properties in China (see Note 11).
Philippine Peso-denominated Five-Year Syndicated LoansIn 2004, CPDC and PSC obtained a five-year term loan, which originally amounted to P=1,600 million, to finance the construction of shopping malls. The five-year term loan is payable in equal quarterly installments of P=100 million starting in October 2005 up to July 2009 and bears a fixed interest rate of 9.66% payable quarterly in arrears. Starting April 2007, the fixed interest rate of 9.66% was reduced to 6.75%.
Philippine Peso-denominated Five-Year Bilateral LoanThis represents a five-year loan term obtained on September 28, 2007 and November 6, 2007 amounting to P=250 million to finance the construction of a project called San Miguel by the Bay. The loan is payable in equal quarterly installments of P=15.6 million starting in December 2008 up to September 2012 and carries an interest rate based on PDST-F plus an agreed margin.
As of December 31, 2007, investments held for trading and temporary investments totaling P=1,388 million were pledged to secure the loans in compliance with the requirements of the Bangko Sentral ng Pilipinas (BSP). In accordance with the loan agreement, the Parent Company has the option to substitute the pledged investments held for trading and temporary investments with other assets as collateral, in accordance with the regulations of the BSP (see Note 21).
The re-pricing frequencies of floating rate loans range from three to six months.
The loan agreements provide certain restrictions and requirements principally with respect to maintenance of required financial ratios and material change in ownership or control. As of December 31, 2008 and 2007, the Company is in compliance with the terms of its loan covenants.
Long-term debt is net of unamortized debt issuance costs amounting to P=169 million and P=162 million as of December 31, 2008 and 2007, respectively (see Note 23). Amortization of debt issuance costs amounted to P=88 million, P=78 million and P=68 million in 2008, 2007 and 2006, respectively.

- 36 -
*SGVMC212218*
Repayment ScheduleRepayments of long-term debt are scheduled as follows:
Year Amount
2009 P=7,784,521,000 2010 1,326,095,500 2011 4,975,293,000 2012 4,601,667,000 2013 3,605,594,000 2014 to 2016 5,601,165,500
P=27,894,336,000
17. Stockholders’ Equity
The Company has an authorized capital stock of 20,000,000,000 shares with a par value of P=1 a share. The issued shares as of December 31, 2008 and 2007 are 13,348,191,367 shares.
As discussed in Note 5, on November 13, 2007, the BOD of SMPH approved the acquisition of 100% of the outstanding shares of the SM China Companies in exchange for SMPH common shares with a valuation based on the 30-day volume weighted average price of SMPH at P=11.86 per share. On May 20, 2008, the SEC approved the valuation and confirmed that the issuance of the shares is exempt from the registration requirements of the Securities Regulation Code. On May 28, 2008, the PSE approved the listing of 912,897,212 new shares in connection with the share-for-share swap transaction with Grand China and Oriental Land. On June 18, 2008, SMPH’s new shares issued to Grand China and Oriental Land were listed in the PSE.
On April 23, 2007, the BOD and the stockholders approved the increase in authorized capital stock from P=10,000 million, divided into 10,000,000,000 shares, to P=20,000 million, divided into 20,000,000,000 shares with a par value of P=1 a share. The BOD and the stockholders likewise approved the declaration of a 25% stock dividend or approximately 2,500 million shares to all stockholders to be issued from the increased authorized capital stock. These were subsequently approved by the SEC on May 29, 2007 and the stock dividends were issued on July 24, 2007.
“Additional paid-in capital - net” account includes paid-in subscriptions in excess of par value amounting to P=10,312 million, net of equity adjustment from business combinations amounting to P=4,818 million (see Note 5).
The retained earnings account is restricted for the payment of dividends to the extent of P=3,628 million and P=3,279 million as of December 31, 2008 and 2007, respectively, representing the cost of shares held in treasury (P=101 million in 2008 and 2007) and accumulated equity in net earnings of the subsidiaries totaling P=3,527 million and P=3,178 million as of December 31, 2008 and 2007, respectively. The accumulated equity in net earnings of the subsidiaries are not available for dividend distribution until such time that the Parent Company receives the dividends from the subsidiaries.
Treasury stock, totaling 18,857,000 shares, is stated at acquisition cost.
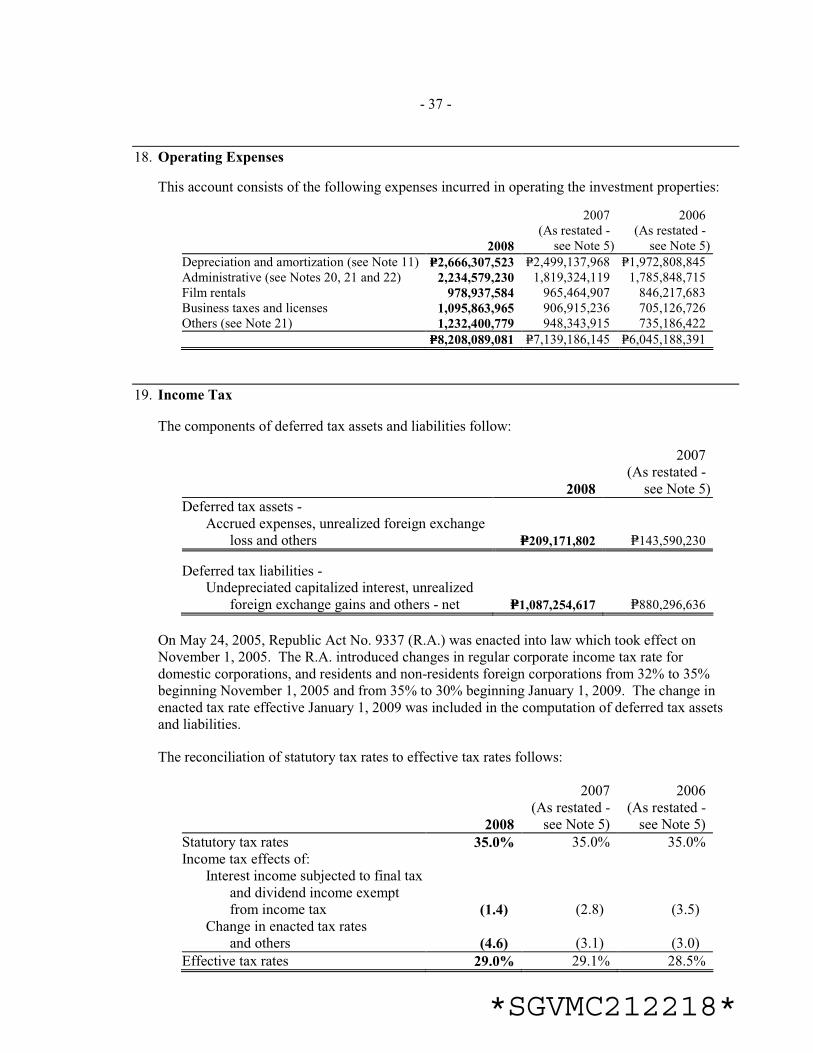
- 37 -
*SGVMC212218*
18. Operating Expenses
This account consists of the following expenses incurred in operating the investment properties:
2008
2007(As restated -
see Note 5)
2006(As restated -
see Note 5)
Depreciation and amortization (see Note 11) P=2,666,307,523 P=2,499,137,968 P=1,972,808,845 Administrative (see Notes 20, 21 and 22) 2,234,579,230 1,819,324,119 1,785,848,715 Film rentals 978,937,584 965,464,907 846,217,683 Business taxes and licenses 1,095,863,965 906,915,236 705,126,726 Others (see Note 21) 1,232,400,779 948,343,915 735,186,422
P=8,208,089,081 P=7,139,186,145 P=6,045,188,391
19. Income Tax
The components of deferred tax assets and liabilities follow:
2008
2007(As restated -
see Note 5)
Deferred tax assets - Accrued expenses, unrealized foreign exchange
loss and others P=209,171,802 P=143,590,230
Deferred tax liabilities - Undepreciated capitalized interest, unrealized
foreign exchange gains and others - net P=1,087,254,617 P=880,296,636
On May 24, 2005, Republic Act No. 9337 (R.A.) was enacted into law which took effect on November 1, 2005. The R.A. introduced changes in regular corporate income tax rate for domestic corporations, and residents and non-residents foreign corporations from 32% to 35% beginning November 1, 2005 and from 35% to 30% beginning January 1, 2009. The change in enacted tax rate effective January 1, 2009 was included in the computation of deferred tax assets and liabilities.
The reconciliation of statutory tax rates to effective tax rates follows:
2008
2007(As restated -
see Note 5)
2006(As restated -
see Note 5)
Statutory tax rates 35.0% 35.0% 35.0% Income tax effects of: Interest income subjected to final tax
and dividend income exempt from income tax (1.4) (2.8) (3.5)
Change in enacted tax rates and others (4.6) (3.1) (3.0)
Effective tax rates 29.0% 29.1% 28.5%
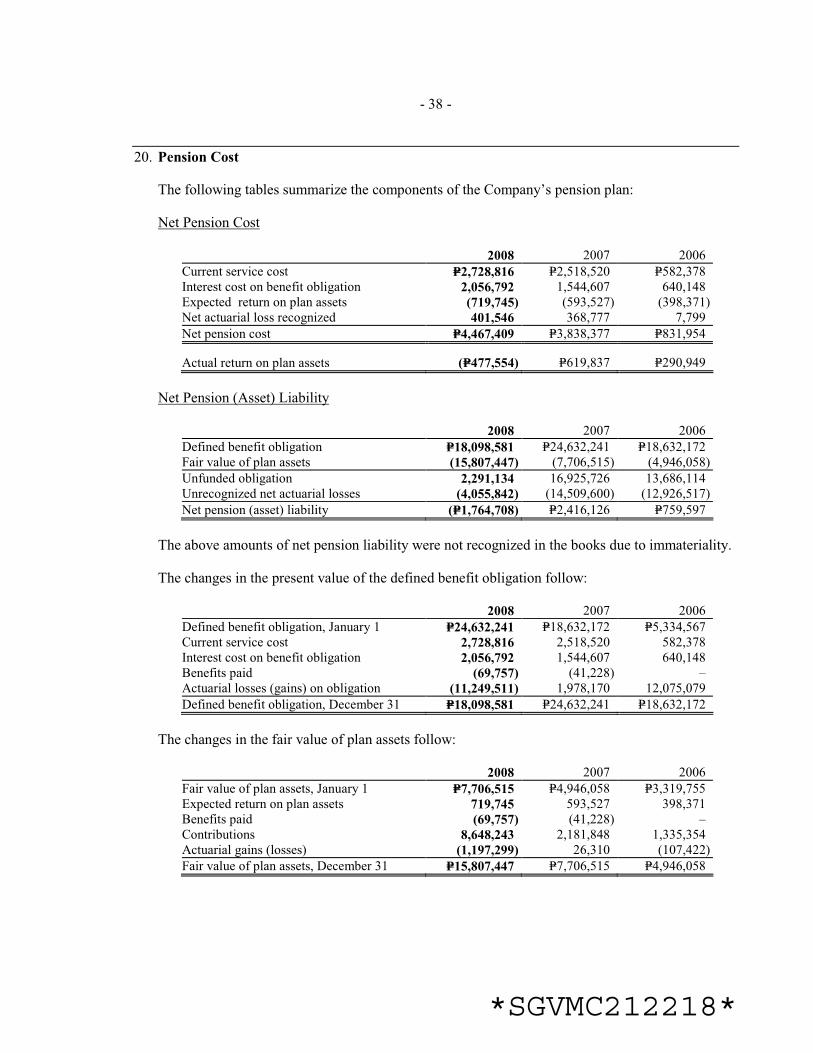
- 38 -
*SGVMC212218*
20. Pension Cost
The following tables summarize the components of the Company’s pension plan:
Net Pension Cost
2008 2007 2006
Current service cost P=2,728,816 P=2,518,520 P=582,378 Interest cost on benefit obligation 2,056,792 1,544,607 640,148 Expected return on plan assets (719,745) (593,527) (398,371)Net actuarial loss recognized 401,546 368,777 7,799
Net pension cost P=4,467,409 P=3,838,377 P=831,954
Actual return on plan assets (P=477,554) P=619,837 P=290,949
Net Pension (Asset) Liability
2008 2007 2006
Defined benefit obligation P=18,098,581 P=24,632,241 P=18,632,172 Fair value of plan assets (15,807,447) (7,706,515) (4,946,058)
Unfunded obligation 2,291,134 16,925,726 13,686,114 Unrecognized net actuarial losses (4,055,842) (14,509,600) (12,926,517)
Net pension (asset) liability (P=1,764,708) P=2,416,126 P=759,597
The above amounts of net pension liability were not recognized in the books due to immateriality.
The changes in the present value of the defined benefit obligation follow:
2008 2007 2006
Defined benefit obligation, January 1 P=24,632,241 P=18,632,172 P=5,334,567 Current service cost 2,728,816 2,518,520 582,378 Interest cost on benefit obligation 2,056,792 1,544,607 640,148 Benefits paid (69,757) (41,228) – Actuarial losses (gains) on obligation (11,249,511) 1,978,170 12,075,079
Defined benefit obligation, December 31 P=18,098,581 P=24,632,241 P=18,632,172
The changes in the fair value of plan assets follow:
2008 2007 2006
Fair value of plan assets, January 1 P=7,706,515 P=4,946,058 P=3,319,755 Expected return on plan assets 719,745 593,527 398,371 Benefits paid (69,757) (41,228) – Contributions 8,648,243 2,181,848 1,335,354 Actuarial gains (losses) (1,197,299) 26,310 (107,422)
Fair value of plan assets, December 31 P=15,807,447 P=7,706,515 P=4,946,058

- 39 -
*SGVMC212218*
The Company expects to contribute P=9 million to its defined benefit pension plan in 2009.
The plan assets are composed mainly of cash and cash equivalents, investments in government securities and other similar debt instruments.
The principal assumptions used in determining pension obligations for the Company’s plan are shown below:
2008 2007 2006
Discount rate 10.3% 8.3% 8.3%
Expected rate of return on plan assets 6.0% 6.0% 12.0% Future salary increases 10.0% 10.0% 10.0%
The overall expected rate of return on plan assets is determined based on the market prices prevailing on that date, applicable to the period within which the obligation is to be settled.
The amounts for the current and previous two years are as follows:
2008 2007 2006
Defined benefit obligation P=18,098,581 P=24,632,241 P=18,632,172 Plan assets 15,807,447 7,706,515 4,946,058 Deficit 2,291,134 16,925,726 13,686,114 Experience adjustments on plan liabilities 1,426,249 1,895,714 12,075,079 Experience adjustments on plan assets 1,197,299 56,146 107,422
21. Related Party Disclosures
The significant related party transactions entered into by the Company and the amounts included in the consolidated financial statements with respect to such transactions follow:
a. The Company has existing lease agreements with the SM Retail Group and SM Banking Group. Total rent revenue amounted to P=5,265 million, P=4,146 million and P=3,513 million in 2008, 2007 and 2006, respectively. Rent receivable, included under “Receivables” account in the consolidated balance sheets, amounted to P=1,151 million and P=947 million as of December 31, 2008 and 2007, respectively.
b. The Company leases the land where two of its malls are located from SMIC and Shoemart, Inc. for a period of 50 years, renewable upon mutual agreement of the parties. The Company shall pay SMIC and Shoemart, Inc. a minimum fixed amount or a certain percentage of its gross rent income, whichever is higher. Rent expense, included under “Operating expenses” account in the consolidated statements of income, amounted to P=158 million, P=164 million and P=105 million in 2008, 2007 and 2006, respectively. Rent payable to SMIC and Shoemart, Inc., included under “Accounts payable and other current liabilities” account in the consolidated balance sheets, amounted to P=19 million and P=16 million as of December 31, 2008 and 2007, respectively.
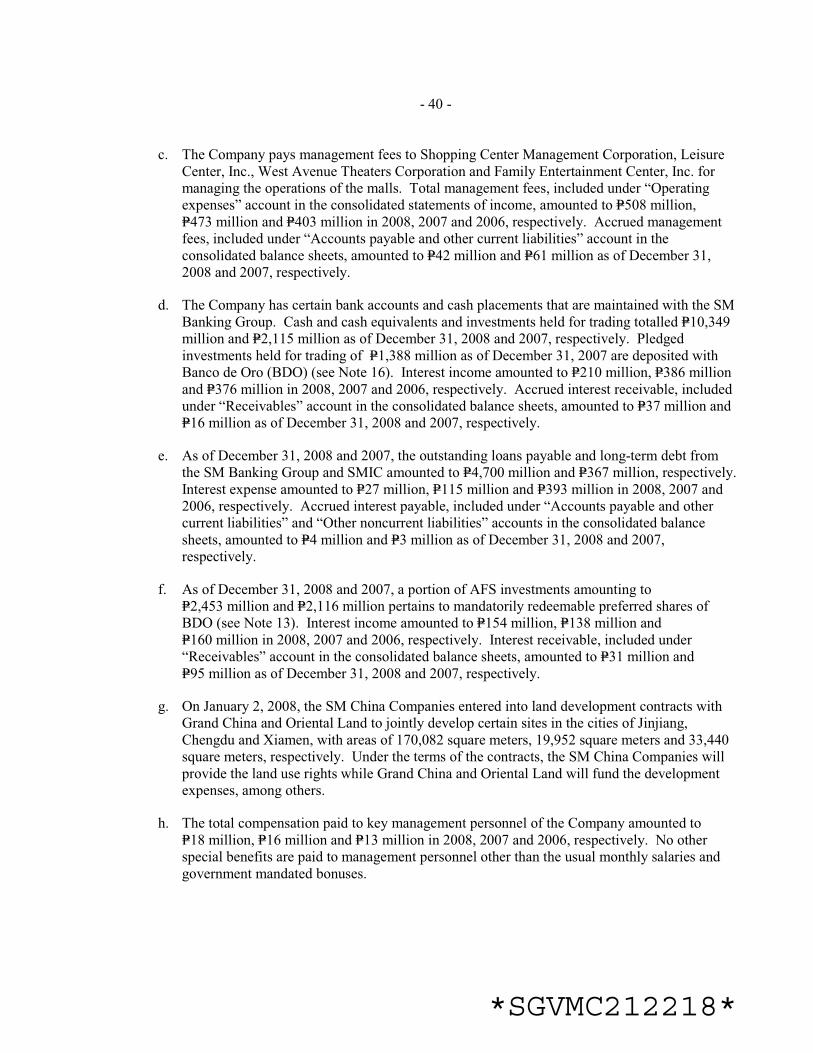
- 40 -
*SGVMC212218*
c. The Company pays management fees to Shopping Center Management Corporation, Leisure Center, Inc., West Avenue Theaters Corporation and Family Entertainment Center, Inc. for managing the operations of the malls. Total management fees, included under “Operating expenses” account in the consolidated statements of income, amounted to P=508 million, P=473 million and P=403 million in 2008, 2007 and 2006, respectively. Accrued management fees, included under “Accounts payable and other current liabilities” account in the consolidated balance sheets, amounted to P=42 million and P=61 million as of December 31, 2008 and 2007, respectively.
d. The Company has certain bank accounts and cash placements that are maintained with the SM Banking Group. Cash and cash equivalents and investments held for trading totalled P=10,349 million and P=2,115 million as of December 31, 2008 and 2007, respectively. Pledged investments held for trading of P=1,388 million as of December 31, 2007 are deposited with Banco de Oro (BDO) (see Note 16). Interest income amounted to P=210 million, P=386 million and P=376 million in 2008, 2007 and 2006, respectively. Accrued interest receivable, included under “Receivables” account in the consolidated balance sheets, amounted to P=37 million and P=16 million as of December 31, 2008 and 2007, respectively.
e. As of December 31, 2008 and 2007, the outstanding loans payable and long-term debt from the SM Banking Group and SMIC amounted to P=4,700 million and P=367 million, respectively. Interest expense amounted to P=27 million, P=115 million and P=393 million in 2008, 2007 and 2006, respectively. Accrued interest payable, included under “Accounts payable and other current liabilities” and “Other noncurrent liabilities” accounts in the consolidated balance sheets, amounted to P=4 million and P=3 million as of December 31, 2008 and 2007, respectively.
f. As of December 31, 2008 and 2007, a portion of AFS investments amounting to P=2,453 million and P=2,116 million pertains to mandatorily redeemable preferred shares of BDO (see Note 13). Interest income amounted to P=154 million, P=138 million and P=160 million in 2008, 2007 and 2006, respectively. Interest receivable, included under “Receivables” account in the consolidated balance sheets, amounted to P=31 million and P=95 million as of December 31, 2008 and 2007, respectively.
g. On January 2, 2008, the SM China Companies entered into land development contracts with Grand China and Oriental Land to jointly develop certain sites in the cities of Jinjiang, Chengdu and Xiamen, with areas of 170,082 square meters, 19,952 square meters and 33,440 square meters, respectively. Under the terms of the contracts, the SM China Companies will provide the land use rights while Grand China and Oriental Land will fund the development expenses, among others.
h. The total compensation paid to key management personnel of the Company amounted to P=18 million, P=16 million and P=13 million in 2008, 2007 and 2006, respectively. No other special benefits are paid to management personnel other than the usual monthly salaries and government mandated bonuses.
- 41 -
*SGVMC212218*
22. Lease Agreements
The Company’s lease agreements with its tenants are generally granted for a term of one year, with the exception of some of the larger tenants operating nationally, which are granted initial lease terms of five years, renewable on an annual basis thereafter. Upon inception of the lease agreement, tenants are required to pay certain amounts of deposits. Tenants likewise pay either a fixed monthly rent, which is calculated with reference to a fixed sum per square meter of area leased, or pay rent on a percentage rental basis, which comprises a basic monthly amount and a percentage of gross sales or a minimum set amount, whichever is higher.
The Company also leases certain parcels of land where some of its malls are constructed. The terms of the lease are for periods ranging from 15 to 50 years, renewable for the same period under the same terms and conditions. Rental payments are generally computed based on a certain percentage of the Company’s gross rental income or a certain fixed amount, whichever is higher.
23. Financial Risk Management Objectives and Policies
The Company’s principal financial instruments, other than derivatives, comprise of bank loans, AFS investments, investments held for trading and cash and cash equivalents. The main purpose of these financial instruments is to finance the Company’s operations. The Company has various other financial assets and liabilities such as rent receivables and trade payables, which arise directly from its operations.
The Company also enters into derivative transactions, principally interest rate swaps and cross currency swaps. The purpose is to manage the interest rate and currency risks arising from the Company’s operations and its sources of finance.
The main risks arising from the Company’s financial instruments are interest rate risk, foreign currency risk, credit risk and liquidity risk. The Company’s BOD and management review and agree on the policies for managing each of these risks as summarized below.
Interest Rate RiskThe Company’s exposure to interest rate risk relates primarily to its financial instruments with floating interest and/or fixed interest rates. Fixed rate financial instruments are subject to fair value interest rate risk while floating rate financial instruments are subject to cash flow interest rate risk. Re-pricing of floating rate financial instruments is done every three to six months. Interest on fixed rate financial instruments is fixed until maturity of the instrument. The details of financial instruments that are exposed to interest rate risk are disclosed in Notes 8, 13, 14 and 16.

- 42 -
*SGVMC212218*
The Company’s policy is to manage its interest cost using a mix of fixed and floating rate debts. To manage this mix in a cost-efficient manner, the Company enters into interest rate swaps, in which the Company agrees to exchange, at specified intervals, the difference between fixed and floating rate interest amounts calculated by reference to an agreed-upon notional principal amount. These swaps are designated to economically hedge underlying debt obligations. As of December 31, 2008 and 2007, after taking into account the effect of interest rate swaps, approximately 42% and 51%, respectively, of the Company’s long-term borrowings are at a fixed rate of interest.
Interest Rate Risk TableThe following table demonstrates the sensitivity to a reasonably possible change in interest rates, with all other variables held constant, of the Company’s income before income tax. The impact on the Company’s equity, due to changes in fair value of AFS investments, is immaterial.
Increase(Decrease)
in Basis Points
Effecton Income
BeforeIncome Tax
2008 100 (P=46,855,361)
50 (23,427,680)
(100) 46,855,361
(50) 23,427,680
2007 100 (25,223,836)50 (12,611,918)
(100) 25,223,836 (50) 12,611,918

- 43 -
*SGVMC212218*
The Company’s long-term debt, presented by maturity profile, that are exposed to interest rate risk are as follows:
2008
1-<2 Years 2-<3 Years 3-<4 Years 4-<5 Years 5-<6 Years >6 Years Total Debt Issuance Carrying Value
Fixed rate: Philippine peso-denominated five-year
syndicated loan P=300,000,000 P=– P=– P=– P=– P=– P=300,000,000 (P=3,227,802) P=296,772,198
Interest rate 6.75%
Philippine peso-denominated loans fixed rate notes – – – – 1,000,000,000 2,000,000,000 3,000,000,000 (23,982,616) 2,976,017,384
Interest rate 9.31% 9.60%-9.85%
Other bank loans – – – – 1,000,000,000 1,200,000,000 2,200,000,000 (15,152,423) 2,184,847,577
Interest rate 7.18% 9.75%
Floating rate: U.S. dollar-denominated five-year
syndicated loan $150,000,000 $– $– $– $– $– 7,128,000,000 (38,995,845) 7,089,004,155
Interest rate LIBOR+margin%
U.S. dollar-denominated bilateral loans $– $20,000,000 $30,000,000 $– $25,000,000 $– 3,564,000,000 (50,104,610) 3,513,895,390
Interest rate LIBOR+spread LIBOR+spread LIBOR+spread
China yuan renminbi-denominated eight-year bilateral loan ¥30,000,000 ¥35,000,000 ¥40,000,000 ¥40,000,000 ¥– ¥– 1,009,185,500 – 1,009,185,500
Interest rate 6.16%–7.05% 6.16%–7.05% 6.16%–7.05% 6.16%–7.05%
China yuan renminbi-denominated
ten-year loan ¥10,000,000 ¥10,000,000 ¥30,000,000 ¥40,000,000 ¥60,000,000 ¥345,000,000 3,445,150,500 – 3,445,150,500
Interest rate 7.13%–9.40% 7.13%–9.40% 7.13%–9.40% 7.13%–9.40% 7.13%–9.40% 7.13%–9.40%
Philippine peso-denominated five-year floating rate loan P=– P=– P=– P=3,998,000,000 P=– P=– 3,998,000,000 (22,905,556) 3,975,094,444
Interest rate PDST-F+margin%
Philippine peso-denominated five-year bilateral loans P=78,125,000 P=62,500,000 P=3,062,500,000 P=46,875,000 P=– P=– 3,250,000,000 (14,986,517) 3,235,013,483
Interest rate PDST-F+margin%PDST-F+margin%PDST-F+margin%PDST-F+margin%
P=27,894,336,000 (P=169,355,369) P=27,724,980,631

- 44 -
*SGVMC212218*
2007 (As restated - see Note 5)
1-<2 Years 2-<3 Years 3-<4 Years 4-<5 Years 5-<6 Years >6 Years Total Debt Issuance Carrying Value
Fixed rate:
Philippine peso-denominated five-year syndicated loan P=825,000,000 P=300,000,000 P=– P=– P=– P=– P=1,125,000,000 (P=10,233,100) P=1,114,766,900
Interest rate 6.75%–7.06% 6.75% Other bank loans – – – – – 1,200,000,000 1,200,000,000 (9,342,500) 1,190,657,500 Interest rate 9.75%Floating rate: U.S. dollar-denominated five-year
syndicated loan $– $150,000,000 $– $– $– $– 6,192,000,000 (88,026,478) 6,103,973,522 Interest rate LIBOR+margin% China yuan renminbi-denominated five-
year syndicated loan ¥90,000,000 ¥110,000,000 ¥100,000,000 ¥50,000,000 ¥– ¥– 1,977,570,000 – 1,977,570,000 Interest rate 6.75%–6.93% 6.75%–6.93% 6.75%–6.93% 6.75%–6.93% China yuan renminbi-denominated
eight-year bilateral loan ¥10,000,000 ¥30,000,000 ¥35,000,000 ¥40,000,000 ¥40,000,000 ¥– 875,781,000 – 875,781,000
Interest rate 5.51%-6.16% 5.51%-6.16% 5.51%-6.16% 5.51%-6.16% 5.51%-6.16% Philippine peso-denominated five-year
floating rate loan P=– P=– P=– P=– P=4,000,000,000 P=– 4,000,000,000 (29,494,201) 3,970,505,799 Interest rate PDST-F+margin% Philippine peso-denominated five-year
bilateral loans P=15,625,000 P=62,500,000 P=62,500,000 P=3,062,500,000 P=46,875,000 P=– 3,250,000,000 (20,982,666) 3,229,017,334 Interest rate PDST-F+margin% PDST-F+margin% PDST-F+margin% PDST-F+margin% PDST-F+margin% Other bank loans – – – P=1,000,000,000 – P=– 1,000,000,000 (3,750,000) 996,250,000 Interest rate PDST-F+margin%
P=19,620,351,000 (P=161,828,945) P=19,458,522,055
- 45 -
*SGVMC212218*
Foreign Currency RiskThe Company’s foreign currency-denominated monetary assets and liabilities amounted to P=6,716 million (US$141 million) and P=7,500 million (US$158 million), respectively, as of December 31, 2008 and P=3,687 million (US$89 million) and P=3,665 million (US$89 million), respectively, as of December 31, 2007.
In translating the foreign currency-denominated monetary assets and liabilities to peso amounts, the exchange rates used were P=47.52 to US$1.00 and P=41.28 to US$1.00, the Philippine peso to U.S. dollar exchange rates as of December 31, 2008 and 2007, respectively.
To manage foreign exchange risks, stabilize cash flows, and improve investment and cash flow planning, the Company enters into foreign currency swaps aimed at reducing and/or managing the adverse impact of changes in foreign exchange rates on operating results and cash flows.
The following table demonstrates the sensitivity to a reasonably possible change in US$ exchange rate, with all other variables held constant, of the Company’s income before income tax (due to changes in the fair value of monetary assets and liabilities, including the impact of derivative instruments). There is no impact on the Company’s equity.
Increase(Decrease)
in P= to US$ rate
Effect onIncome before
Income Tax
2008 P=1.50 P=13,036,240
1.00 8,690,827
(1.50) (13,036,240)
(1.00) (8,690,827)
2007 1.50 (14,474,864)1.00 (9,649,909)
(1.50) 14,474,864 (1.00) 9,649,909
The increase in P= to US$ rate means stronger peso against the U.S. dollar while a decrease in P= to US$ means stronger U.S. dollar against the peso.
Credit RiskIt is the Company’s policy that all prospective tenants are subject to screening procedures. In addition, receivable balances are monitored on an ongoing basis with the result that the Company’s exposure to bad debts is not significant. Given the Company’s diverse base of tenants, it is not exposed to large concentrations of credit risk.
With respect to credit risk arising from the other financial assets of the Company, which comprise of cash and cash equivalents, investments held for trading, AFS financial assets and certain derivative instruments, the Company’s exposure to credit risk arises from default of the counterparty, with a maximum exposure equal to the carrying amount of these instruments. The fair values of these financial instruments are disclosed in Note 24.
Since the Company trades only with recognized third parties, there is no requirement for collateral.

- 46 -
*SGVMC212218*
Credit Quality of Financial AssetsThe credit quality of financial assets is managed by the Company using high quality and standard quality as internal credit ratings.
High Quality. Pertains to counterparty who is not expected by the Company to default in settling its obligations, thus credit risk exposure is minimal. This normally includes large prime financial institutions, companies and government agencies.
Standard Quality. Other financial assets not belonging to high quality financial assets are included in this category.
As of December 31, 2008 and 2007, the credit quality of the Company’s financial assets is as follows:
2008
Neither Past Due Nor Impaired Past Due
High Quality Standard Quality But Not Impaired Total
Cash and cash equivalents P=10,737,196,836 P=– P=– P=10,737,196,836
Investments held for trading 143,857,296 – – 143,857,296 Receivables 678,202,262 2,504,676,635 162,863,161 3,345,742,058AFS investments 2,552,699,740 – – 2,552,699,740 Derivative assets 34,130,728 – – 34,130,728
P=14,146,086,862 P=2,504,676,635 P=162,863,161 P=16,813,626,658
2007 (As restated - see Note 5)
Neither Past Due Nor Impaired Past Due
High Quality Standard Quality But Not Impaired Total
Cash and cash equivalents P=2,504,180,947 P=– P= P=2,504,180,947 Investments held for trading 149,688,504 – – 149,688,504 Receivables 768,853,833 2,046,009,750 169,855,465 2,984,719,048 AFS investments 2,218,254,419 – 2,218,254,419 Derivative assets 347,248,200 – 347,248,200
P=5,988,225,903 P=2,046,009,750 P=169,855,465 P=8,204,091,118
Liquidity RiskThe Company seeks to manage its liquidity profile to be able to finance its capital expenditures and service its maturing debts. The Company’s objective is to maintain a balance between continuity of funding and flexibility through valuation of projected and actual cash flow information.
The table below summarizes the maturity profile of the Company’s financial liabilities based on contractual undiscounted payments:
2008
Less than
12 Months 2 to 5 Years
More than
5 Years Total
Loans payable P=2,924,884,028 P=– P=– P=2,924,884,028
Accounts payable and other current liabilities 4,141,819,171 – – 4,141,819,171
Long-term debt (including current portion) 9,674,452,851 19,229,151,578 6,690,172,021 35,593,776,450
Derivative liability 901,634,262 – – 901,634,262
Tenants’ deposits – 4,865,774,815 – 4,865,774,815
Other noncurrent liabilities* – 4,825,437,836 – 4,825,437,836
P=17,642,790,312 P=28,920,364,229 P=6,690,172,021 P=53,253,326,562
*Excluding nonfinancial liabilities amounting to P=505 million.

- 47 -
*SGVMC212218*
2007 (As restated - see Note 5)
Less than12 Months 2 to 5 Years
More than5 Years Total
Loans payable P=1,273,449,263 P=– P=– P=1,273,449,263Accounts payable and other current
liabilities 3,112,543,834 – – 3,112,543,834Long-term debt (including current
portion) 2,586,284,315 19,324,054,281 1,665,167,917 23,575,506,513Derivative liability – 1,768,518,516 – 1,768,518,516Tenants’ deposits – 4,328,461,010 – 4,328,461,010Other noncurrent liabilities* – 940,509,370 – 940,509,370
P=6,972,277,412 P=26,361,543,177 P=1,665,167,917 P=34,998,988,506
*Excluding nonfinancial liabilities amounting to P=413 million.
Capital ManagementThe primary objective of the Company’s capital management is to ensure that it maintains a strong credit rating and healthy capital ratios in order to support its business and maximize shareholder value.
The Company manages its capital structure and makes adjustments to it, in the light of changes in economic conditions. To maintain or adjust the capital structure, the Company may adjust the dividend payment to shareholders, pay-off existing debts, return capital to shareholders or issue new shares.
The Company monitors its capital gearing by measuring the ratio of interest-bearing debt to total capital and net interest-bearing debt to total capital. Interest-bearing debt includes all short-term and long-term debt while net interest-bearing debt includes all short-term and long-term debt net of cash and cash equivalents, investments held for trading and AFS investments.
As of December 31, 2008 and 2007, the Company’s ratio of interest-bearing debt to total capital and ratio of net interest-bearing debt to total capital are as follows:
Interest-bearing Debt to Total Capital
2008
2007(As restated -
see Note 5)
Loans payable P=2,830,000,000 P=1,231,957,791 Current portion of long-term debt 7,784,521,000 1,405,645,000 Long-term debt - net of current portion 19,940,459,631 18,052,877,055
Total interest-bearing debt (a) 30,554,980,631 20,690,479,846 Total equity attributable to equity holders
of the Parent 46,828,540,968 42,518,196,740
Total interest-bearing debt and equity attributableto equity holders of the Parent (b) P=77,383,521,599 P=63,208,676,586
Gearing ratio (a/b) 39% 33%
- 48 -
*SGVMC212218*
Net Interest-bearing Debt to Total Capital
2008
2007(As restated -
see Note 5)
Loans payable P=2,830,000,000 P=1,231,957,791 Current portion of long-term debt 7,784,521,000 1,405,645,000 Long-term debt - net of current portion 19,940,459,631 18,052,877,055 Less cash and cash equivalents, investments held
for trading and AFS investments (13,433,753,872) (4,872,123,870)
Total net interest-bearing debt (a) 17,121,226,759 15,818,355,976 Total equity attributable to equity holders of the Parent 46,828,540,968 42,518,196,740
Total net interest-bearing debt and equity attributable to equity holders of the Parent (b) P=63,949,767,727 P=58,336,552,716
Gearing ratio (a/b) 27% 27%
24. Financial Instruments
Fair ValuesThe table below presents a comparison of the carrying amounts and fair values of all of the Company’s financial instruments by category and by class as of December 31:
2008
2007 (As restated - see Note 5)
Carrying
Amount Fair Value
CarryingAmount Fair Value
Financial Assets
Loans and receivables: Cash and cash equivalents P=10,737,196,836 P=10,737,196,836 P=2,504,180,947 P=2,504,180,947 Receivables 3,345,742,058 3,345,742,058 2,984,719,048 2,984,719,048
14,082,938,894 14,082,938,894 5,488,899,995 5,488,899,995
Financial assets at FVPL: Investments held for trading 143,857,296 143,857,296 149,688,504 149,688,504 Derivative assets 34,130,728 34,130,728 347,248,200 347,248,200
177,988,024 177,988,024 496,936,704 496,936,704
AFS investments 2,552,699,740 2,552,699,740 2,218,254,419 2,218,254,419
P=16,813,626,658 P=16,813,626,658 P=8,204,091,118 P=8,204,091,118
Financial Liabilities
Financial liabilities at FVPL - Derivative liability P=901,634,262 P=901,634,262 P=1,768,518,516 P=1,768,518,516
Other financial liabilities: Loans payable 2,830,000,000 2,830,000,000 1,231,957,791 1,231,957,791 Accounts payable and other
current liabilities 4,141,819,171 4,141,819,171 3,112,543,834 3,112,543,834 Long-term debt (including
current portion) 27,724,980,631 28,394,830,575 19,458,522,055 20,037,792,058 Tenants’ deposits 4,865,774,815 4,794,475,073 4,328,461,010 4,193,356,615 Other noncurrent liabilities* 4,825,437,836 4,747,328,276 940,509,370 902,071,100
44,388,012,453 44,908,453,095 29,071,994,060 29,477,721,398
P=45,289,646,715 P=45,810,087,357 P=30,840,512,576 P=31,246,239,914*Excluding nonfinancial liabilities amounting to P=505 million and P=413 million as of December 31, 2008 and 2007, respectively .

- 49 -
*SGVMC212218*
The following methods and assumptions were used to estimate the fair value of each class of financial instrument for which it is practicable to estimate such value:
Cash and Cash Equivalents. The carrying amount reported in the consolidated balance sheets approximates fair value due to the short-term nature of the transactions.
Investments Held for Trading. The fair values are the quoted market prices of the instruments at balance sheet date.
Receivables. The net carrying value approximates the fair value due to the short-term maturities of the receivables.
AFS Investments. The fair value of investments in mandatorily redeemable preferred shares where there is no active market is based on the present value of future cash flows discounted at prevailing interest rates. Discount rates used range from 3.54% to 8.59% as of December 31, 2008 and 6.19% to 7.95% as of December 31, 2007.
Loans Payable and Accounts Payable and Other Current Liabilities. The carrying values reported in the consolidated balance sheets approximate the fair values due to the short-term maturities of these liabilities.
Long-term Debt. Fair value is based on the following:
Debt Type Fair Value Assumptions
Fixed Rate Loans Estimated fair value is based on the discounted value of future cash flows using the applicable rates for similar types of loans. Discount rates used range from 5.64% to 11.5% as of December 31, 2008 and 5.18% to 7.36% as of December 31, 2007.
Variable Rate Loans For variable rate loans that re-price every 3 months, the face value approximates the fair value because of the recent and regular repricing based on current market rates. For variable rate loans that re-price every 6 months, the fair value is determined by discounting the principal amount plus the next interest payment using the prevailing market rate from the period up to the next re-pricing date. Discount rate used was 0.82% to 2.40% as of December 31, 2008 and 5.20% as of December 31, 2007.
Tenants’ Deposits and Other Noncurrent Liabilities. Estimated fair values are based on the discounted value of future cash flows using the applicable rates for similar types of loans. Discount rates used range from 7.24% to 7.44% as of December 31, 2008 and 6.67% to 6.76% as of December 31, 2007.
Derivative Instruments. The fair values of the interest rate swaps and cross currency swaps are based on quotes obtained from counterparties.

- 50 -
*SGVMC212218*
Derivative Financial InstrumentsTo address the Company’s exposure to market risk for changes in interest rates primarily to long-term floating rate debt obligations and manage its foreign exchange risk, the Company entered into various derivative transactions such as cross currency swaps, interest rate swaps, foreign currency call options and non-deliverable forwards.
The table below shows information on the Company’s cross currency and interest rate swaps presented by maturity profile.
2008
<1 Year >1-<2 Years >2-<5 Years
Cross-Currency Swap
Floating-Fixed:
Notional amount $70,000,000 Receive-floating rate 6 months
LIBOR+margin%
Pay-fixed rate 12.58–12.75% Weighted swap rate P=56.31
Interest Rate Swaps
Floating-Fixed: Notional amount $80,000,000
Receive-floating rate 6 months
LIBOR+margin%
Pay-fixed rate 5.34%
Fixed-Floating:
Notional amount P=1,000,000,000 P=1,000,000,000 P=1,000,000,000 Receive-fixed rate 9.3058% 9.3058% 9.3058%
Pay-floating rate 3MPDST-F+margin% 3MPDST-F+margin% 3MPDST-F+margin%
2007
<1 Year >1-<2 Years
Cross-Currency Swap Floating-Fixed: Notional amount $70,000,000 $70,000,000 Receive-floating rate 6 months
LIBOR+margin% 6 months
LIBOR+margin% Pay-fixed rate 12.58–12.75% 12.58–12.75% Weighted swap rate P=56.31 P=56.31Interest Rate Swap Floating-Fixed: Notional amount $80,000,000 $80,000,000 Receive-floating rate 6 months
LIBOR+margin% 6 months
LIBOR+margin% Pay-fixed rate 5.34% 5.34%
Cross Currency Swaps. In 2004, the Parent Company entered into cross currency swap agreements with an aggregate notional amount of US$70 million and weighted average swap rate of P=56.31 to US$1. Under these agreements, the Parent Company effectively swaps the principal amount and interest of the U.S. dollar-denominated five-year syndicated loan into Philippine peso-denominated loans with payments up to October 2009. As of December 31, 2008 and 2007, the cross currency swaps have negative fair values of P=861 million and P=1,496 million, respectively.
Interest Rate Swaps. In 2008, the Parent Company entered into Philippine peso interest swap agreements with an aggregate notional amount of P=1,000 million. Under these agreements, the Parent Company effectively swaps the fixed rate Philippine peso-denominated five-year syndicated fixed rate notes into floating rate loans based on PDST-F plus an agreed margin with quarterly payment intervals up to June 2013. As of December 31, 2008, the fixed to floating interest rate swaps have positive fair values of P=34 million.
- 51 -
*SGVMC212218*
In 2005, the Parent Company entered into Philippine peso interest swap agreements with an aggregate notional amount of P=3,750 million. Under these agreements, the Parent Company effectively swaps these fixed rate Philippine peso-denominated five-year and seven-year syndicated fixed rate notes into floating rate loans based on Mart 1 plus an agreed margin with semi-annual payment intervals up to July 2012. As of December 31, 2006, the fixed to floating interest rate swaps have positive fair values of P=577 million. As discussed in Note 16, in June 2007, as a result of the prepayment of the underlying obligation, the related interest rate swap was also terminated with net proceeds amounting to P=438 million and realized loss of P=139 million.
Also in 2004, the Parent Company entered into US$ interest rate swap agreements with an aggregate notional amount of US$80 million. Under these agreements, the Parent Company effectively swaps the floating rate U.S. dollar-denominated five-year syndicated loan into fixed rate loans with semi-annual payment intervals up to October 2009. As of December 31, 2008 and 2007, the floating to fixed interest rate swaps have negative fair values of P=41 million and positive fair value of P=20 million, respectively.
Foreign Currency Call Options. To manage the interest expense on the loans and the hedging costs of the cross currency swaps mentioned above, the Parent Company entered into the following cost reduction trades:
Trade Dates Start Dates Notional Amount Strike Rates Premium (p.a.) Payment Dates
January 25, 2007 January 25, 2007 P=3,942,000,000 P=52 (US$1.00) 1.00% October 18, 2007 April 18, 2008
June 27, 2007 April 18, 2007 P=3,942,000,000 P=49 (US$1.00) 1.00% October 18, 2007 April 18, 2008 June 30, 2008
June 27, 2007 February 15, 2007 P=1,200,000,000 P=49 (US$1.00) 1.00% February 15, 2008 June 30, 2008
In these trades, the Parent Company will receive a premium equivalent to 1.0% savings per annum on the notional amounts. However, should the exchange rate between U.S. dollar (US$) and the Philippine peso (P=) trade above the strike price on the two dates, the Parent Company will have to pay a penalty based on an agreed formula. As of December 31, 2007, the positive fair value of the currency option is P=55 million. Realized loss from currency option contracts amounted to P=17 million in 2008.
Non-deliverable Forwards. In 2007, the Parent Company entered into forward contracts to sell P= and buy US$ with different counterparties at an aggregate notional amount of US$180 million. As of December 31, 2007, the outstanding aggregate notional amount is US$160 million. The average forward rates range from P=41.05 to P=46.53, which matured in various dates in 2008. Also in 2007, the Parent Company entered into forward contracts to sell US$ and buy P= with different counterparties at an aggregate notional amount of US$180 million. As of December 31, 2007, the outstanding aggregate notional amount is US$160 million. The average forward rates range from P=41.31 to P=46.68, which matured in various dates in 2008. As of December 31, 2007, the net fair value of the above forward contracts is immaterial. The Parent Company recognized derivative asset and derivative liability amounting to P=272 million from these forward contracts. Realized gain from these forward contracts amounted to P=47 million in 2008.
The net unrealized marked-to-market gain (loss) on derivative transactions, shown as part of “Amusement and others” account in the consolidated statements of income, amounted to P=609 million, (P=568 million) and (P=277 million) for the years ended December 31, 2008, 2007 and 2006, respectively.

- 52 -
*SGVMC212218*
Fair Value Changes on DerivativesThe net movements in fair value changes of all derivative instruments as of December 31 are as follows:
2008 2007
Balance at beginning of year (P=1,421,270,316) (P=276,560,613)Net changes in fair value during the year 608,707,480 (567,691,997)Fair value of settled contracts (54,940,698) (577,017,706)
Balance at end of year (P=867,503,534) (P=1,421,270,316)
The reconciliation of the amounts of derivative assets and liabilities recognized in the consolidated balance sheets follows:
2008 2007
Derivative assets P=34,130,728 P=347,248,200 Derivative liabilities (901,634,262) (1,768,518,516)
(P=867,503,534) (P=1,421,270,316)
25. Basic/Diluted EPS Computation
Basic EPS is computed as follows:
2008 2007 2006
Net income attributable to equity holders of the Parent (a) P=6,412,215,308 P=5,972,394,019 P=5,854,664,702
Common shares issued at beginning of year, as previously reported – 10,848,191,367 9,935,294,155
Issuance of shares to Grand China and Oriental Land (see Notes 5 and 17) – – 912,897,212
Common shares issued at beginning of year, as restated 13,348,191,367 10,848,191,367 10,848,191,367
Effect of stock dividends in 2007 (see Note 17) – 2,500,000,000 2,500,000,000
Common shares issued at end of year 13,348,191,367 13,348,191,367 13,348,191,367 Less weighted average number of treasury
shares acquired during the year 18,857,000 18,857,000 18,857,000
Weighted average number of common shares outstanding (b) 13,329,334,367 13,329,334,367 13,329,334,367
Earnings per share (a/b) P=0.481 P=0.448 P=0.439
- 53 -
*SGVMC212218*
26. Other Matters
The Company is involved in certain tax cases filed with the Court of Tax Appeals (CTA) relative to the vatability of gross receipts derived from cinema ticket sales. A favorable decision was rendered by the CTA on September 22, 2006. The motion for reconsideration of the Bureau of Internal Revenue (the Respondent) was denied on December 18, 2006. The Respondent filed an appeal on January 19, 2007, which the CTA nullified in its decision dated April 30, 2008 and resolution dated June 24, 2008. Likewise, on December 18, 2008, the CTA also dismissed a similar case for lack of merit. The Respondent has yet to file a motion for reconsideration as of February 19, 2009. In the opinion of management and its legal counsel, the eventual resolution of these cases will not have any material adverse effect on the consolidated financial statements.

*SGVMC212218*
INDEPENDENT AUDITORS’ REPORT
ON SUPPLEMENTARY SCHEDULES
The Stockholders and the Board of Directors SM Prime Holdings, Inc. SM Corporate Offices, Building A J.W. Diokno Boulevard Mall of Asia Complex, Pasay City 1300
We have audited in accordance with Philippine Standards on Auditing, the consolidated financial statements of SM Prime Holdings, Inc. and Subsidiaries included in this Form 17-A and have issued our report thereon dated February 19, 2009. Our audits were made for the purpose of forming an opinion on the basic financial statements taken as a whole. The schedules listed in the Index to Financial Statements and Supplementary Schedules are the responsibility of the Company's management. These schedules are presented for purposes of complying with Securities Regulation Code Rule 68.1 and SEC Memorandum Circular No. 11, Series of 2008 and are not part of the basic financial statements. These schedules have been subjected to the auditing procedures applied in the audit of the basic financial statements and, in our opinion, fairly state in all material respect the financial data required to be set forth therein in relation to the basic financial statements taken as a whole.
SYCIP GORRES VELAYO & CO.
Ramon D. Dizon Partner CPA Certificate No. 46047 SEC Accreditation No. 0077-AR-1 Tax Identification No. 102-085-577 PTR No. 1566425, January 5, 2009, Makati City
February 19, 2009
SyCip Gorres Velayo & Co.6760 Ayala Avenue 1226 Makati City Philippines
Phone: (632) 891 0307 Fax: (632) 819 0872 www.sgv.com.ph
BOA/PRC Reg. No. 0001 SEC Accreditation No. 0012-FR-1
A member firm of Ernst & Young Global Limited
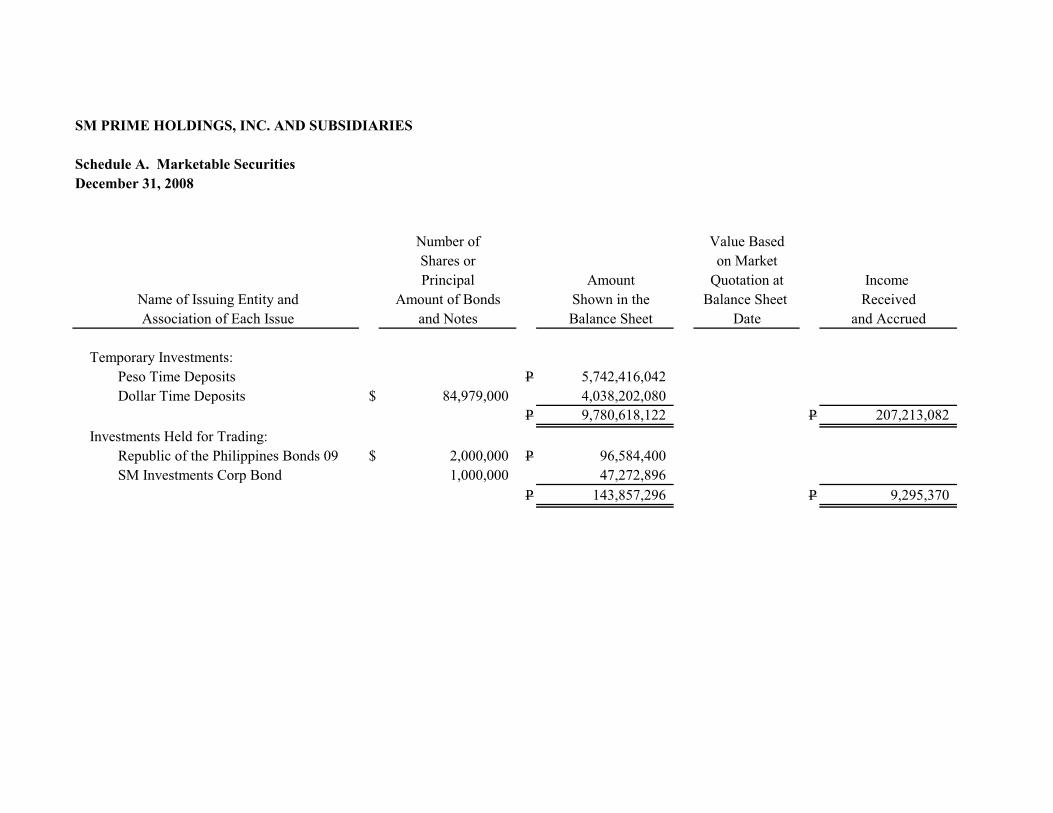
SM PRIME HOLDINGS, INC. AND SUBSIDIARIES
Schedule A. Marketable Securities
December 31, 2008
Number of Value Based
Shares or on Market
Principal Amount Quotation at Income
Amount of Bonds Shown in the Balance Sheet Received
and Notes Balance Sheet Date and Accrued
Temporary Investments:
Peso Time Deposits P 5,742,416,042
Dollar Time Deposits $ 84,979,000 4,038,202,080
P 9,780,618,122 P 207,213,082
Investments Held for Trading:
Republic of the Philippines Bonds 09 $ 2,000,000 P 96,584,400
SM Investments Corp Bond 1,000,000 47,272,896
P 143,857,296 P 9,295,370
Name of Issuing Entity and
Association of Each Issue

SM PRIME HOLDINGS, INC. AND SUBSIDIARIES
Schedule B. Non-Current Marketable Equity Securities, Other Long-Term Investments in Stock, and Other Investments
December 31, 2008
Name of Issuing Entity
and description of
investments (1)
Number of shares or
principal amount of
bonds and notes (2) Amount in Pesos
Equity in earnings
(losses) of investees
for the period (3) Other (4)
Distributions of
earnings by investees
(5) Other (6)
Number of shares or
principal amounts of
bonds and notes (2) Amount in pesos (7)
Dividends received from
investments not accounted
for by the equity method
Banco De Oro 50,000,000.00$ 2,116,349,887 336,355,312 2,452,705,199 218,341,679 Aboitiz Equity 10,000,000 101,904,532 1,909,991 99,994,541 10,312,500
2,218,254,419 336,355,312 1,909,991 2,552,699,740 228,654,179
BEGINNING BALANCE ADDITIONS DEDUCTIONS ENDING BALANCE

SM PRIME HOLDINGS, INC. AND SUBSIDIARIES
Schedule I. Capital Stock
December 31, 2008
Number of
Shares Reserved
Number of for Options,
Number of Shares Issued Warrants, Directors,
Shares and Conversions, and Officers and
Title of Issue Authorized Outstanding Other Rights Affiliates Employees Others
Common 20,000,000,000 13,329,334,367 * 9,615,615,527 7,479,931 3,706,238,909
* Net of 18,857,000 shares held in treasury

SM Prime Holdings, Inc. and Subsidiaries SM Corporate Offices, Building A, J.W. Diokno Boulevard
Mall of Asia Complex, Pasay City 1300
Retained Earnings Available for Dividend Declaration
December 31, 2008
Retained earnings, January 1, 2008, as previously reported P=16,383,297,235 Retroactive impact of business combinations -
pooling of interest method 403,150,494
Retained earnings, January 1, 2008, as restated 16,786,447,729 Cumulative equity in net income of subsidiaries, January 1, 2008 (3,177,663,395)
Retained earnings as of January 1, 2008, as adjusted to availablefor dividend distribution 13,608,784,334
Net income attributable to equity holders of the Parent closed to retained earnings in 2008 6,412,215,308
Less non-actual/unrealized income, net of applicable tax: Equity in net income of subsidiaries 1,096,371,559 Unrealized marked-to-market gain on derivatives 442,577,445 Unrealized marked-to-market gain on investments
held for trading 1,903,525
1,540,852,529
Add non-actual/unrealized losses, net of applicable tax: Dividends received from subsidiaries 746,844,709 Unrealized foreign exchanges losses (net of exchange differences attributable to cash and cash equivalents) 400,805,914
1,147,650,623
Net income actually earned in 2008 6,019,013,402
Less: Cash dividends declared in 2008 2,979,944,906 Treasury shares 101,474,705
3,081,419,611
Retained earnings as of December 31, 2008
available for dividend declaration P=16,546,378,125
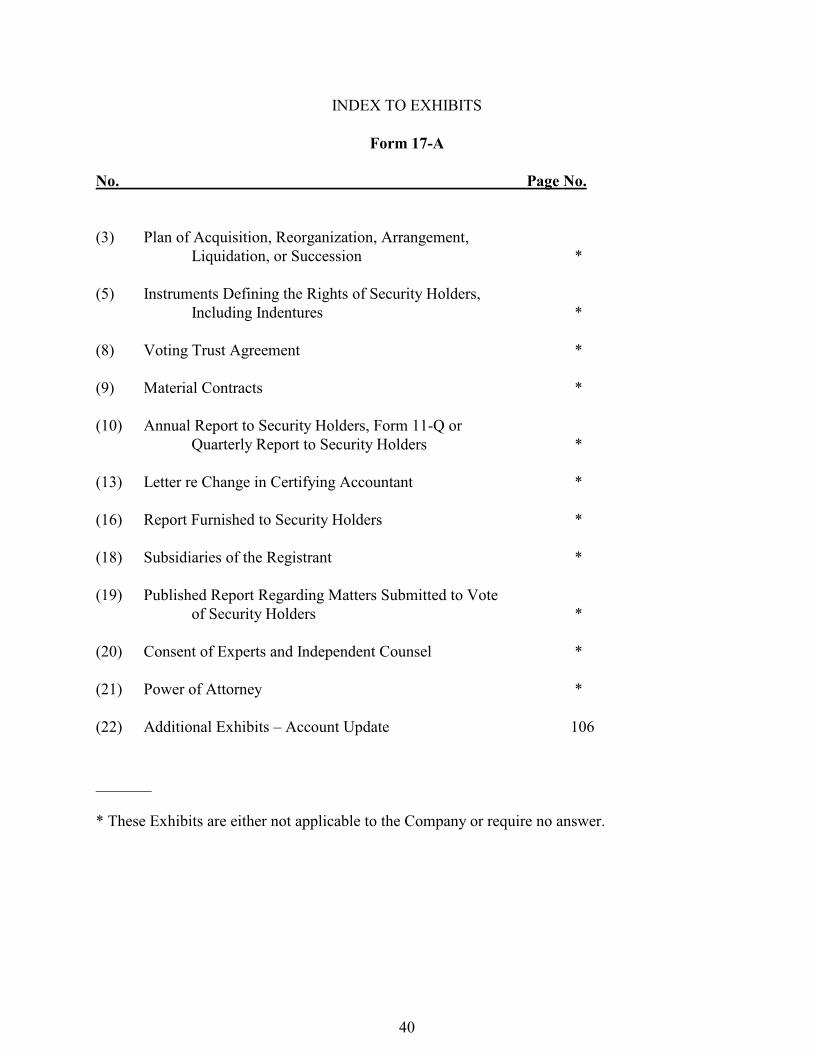
�
40
INDEX TO EXHIBITS
Form 17-A
No. Page No.
(3) Plan of Acquisition, Reorganization, Arrangement,
Liquidation, or Succession *
(5) Instruments Defining the Rights of Security Holders,
Including Indentures *
(8) Voting Trust Agreement *
(9) Material Contracts *
(10) Annual Report to Security Holders, Form 11-Q or
Quarterly Report to Security Holders *
(13) Letter re Change in Certifying Accountant *
(16) Report Furnished to Security Holders *
(18) Subsidiaries of the Registrant *
(19) Published Report Regarding Matters Submitted to Vote
of Security Holders *
(20) Consent of Experts and Independent Counsel *
(21) Power of Attorney *
(22) Additional Exhibits – Account Update 106
_______
* These Exhibits are either not applicable to the Company or require no answer.

SM PRIME HOLDINGS, INC.
AGING OF RENT RECEIVABLE
AS OF DECEMBER 31, 2008
MALL BALANCE CURRENT Over 30 days
SM MEGAMALL 302,297,269 246,524,133 55,773,136
SM NORTH EDSA 222,587,966 171,755,879 50,832,087
SM MALL OF ASIA 234,484,755 210,993,519 23,491,236
SM FAIRVIEW 126,391,109 117,661,291 8,729,819
SM SOUTHMALL 122,071,124 115,113,952 6,957,173
SM CEBU 122,061,239 92,383,076 29,678,163
SM PAMPANGA 118,599,431 113,242,644 5,356,787
SM BACOOR 101,105,236 86,772,404 14,332,832
SM MANILA 99,246,572 88,051,959 11,194,613
SM SAN LAZARO 84,980,231 79,521,917 5,458,315
SM ILOILO 79,633,205 69,780,893 9,852,312
SM DASMARINAS 67,802,658 62,598,782 5,203,877
SM CLARK 66,978,268 63,740,313 3,237,955
SM STA MESA 65,395,454 60,255,933 5,139,521
SM STA ROSA 64,582,208 57,695,929 6,886,279
SM DAVAO 59,305,731 55,658,105 3,647,626
SM MARILAO 57,886,210 55,399,238 2,486,973
SM BATANGAS 58,052,661 50,738,739 7,313,923
SM LIPA 52,723,740 50,955,436 1,768,304
SM BICUTAN 51,184,231 48,866,158 2,318,073
SM BAGUIO 50,190,334 45,695,551 4,494,783
SM MARIKINA 49,485,500 47,021,375 2,464,126
SM SUCAT 41,901,745 33,216,381 8,685,364
SM MUNTINLUPA 38,233,256 36,685,198 1,548,057
SM TAYTAY 37,575,339 35,601,529 1,973,810
SM LUCENA 37,462,349 31,883,328 5,579,021
SM BACOLOD 36,541,442 33,310,799 3,230,643
SM CAGAYAN DE ORO 34,409,152 28,164,506 6,244,646
SM MOLINO 28,917,233 27,452,651 1,464,583
SM BALIWAG 26,917,298 26,917,298
SM VALENZUELA 26,613,033 25,233,928 1,379,105
SM PASIG 24,297,106 21,683,472 2,613,635
SM ROSALES 23,161,226 23,161,226
SM BY THE BAY 17,436,785 9,173,556 8,263,230
SM NAGTAHAN 8,471,119 8,471,119
SM CHINA MALLS 28,557,580 16,585,178 11,972,403
2,667,539,796 2,347,967,391 319,572,405