Embed Size (px)
Citation preview
Agriculture, Ecosystems and Environment 188 (2014) 12–19
Contents lists available at ScienceDirect
Agriculture, Ecosystems and Environment
j ourna l h omepage: www.elsev ier .com/ locate /agee
Seasonal patterns in decomposition and nutrient release from EastAfrican savanna grasses grown under contrasting nutrient conditions
Lucy W. Ngatiaa,b, K. Ramesh Reddya,!, P.K. Ramachandran Naira,c, Robert M. Pringleb,d,Todd M. Palmerb,e, Benjamin L. Turner f
a Soil and Water Science Department, University of Florida, Gainesville, FL 32611 USAb Mpala Research Centre, P.O. Box 555, Nanyuki, Kenyac School of Forest Resources and Conservation, University of Florida, 118 Newins-Ziegler Hall, Gainesville, FL 32611, USAd Department of Ecology and Evolutionary Biology, Princeton University, Princeton, NJ 08544, USAe Department of Biology, University of Florida, Gainesville, FL 32611, USAf Smithsonian Tropical Research Institute, Apartado 0843-03092, Balboa, Ancon, Panama
a r t i c l e i n f o
Article history:Received 20 September 2013Received in revised form 27 January 2014Accepted 4 February 2014
Keywords:Aboveground biomassEast AfricaNutrient cyclingN releaseP releaseSavanna
a b s t r a c t
Litter decomposition and nutrient release is one of the key biogeochemical processes that regulate plantproductivity and nutrient cycling in African savanna ecosystems. We examined the influence of nitro-gen and phosphorus additions on grass decomposition and nutrient release rates in an Acacia savannaecosystem in central Kenya. Grass was clipped from a factorial nitrogen " phosphorus experiment anddecomposed in a common plot that had not received fertilizer. After 20 weeks, including one dry sea-son and one wet season, 50–65% of carbon, 68–75% of nitrogen and 73–83% of phosphorus had beenreleased from the litter. Decomposition was slow in the dry season (mass loss 1–2% wk#1) compared tothe wet season (7–11% wk#1). Wet season decomposition was more rapid for grasses that had been fer-tilized with nitrogen, even though tissue nitrogen was not significantly different from the control grass,indicating that factors other than litter nitrogen concentration influenced decomposition rates undernitrogen enrichment. Surprisingly, nutrient loss from decomposing litter was relatively high during thedry season, suggesting a role for dew in leaching nutrients from dry litter. We conclude that seasonal rainand nitrogen addition (but not phosphorus addition) accelerate decomposition of grass litter, but thatnutrient leaching during the dry season can be considerable.
© 2014 Elsevier B.V. All rights reserved.
1. Introduction
The balance between net primary productivity and decompo-sition of organic matter determines carbon (C) stocks in savannasand other terrestrial ecosystems (Valentini et al., 2000). The decom-position of annual litter fall contributes approximately half of theCO2 released from soils (soil + litter CO2) (Couteaux et al., 1995)and recycles nutrients for plant uptake (Aerts et al., 1992). Under-standing the factors controlling litter decomposition is thereforeimportant to determine the influence on greenhouse gases emis-sion and global warming (Fearnside, 2000).
Both abiotic and biotic processes regulate litter decomposition,including photodegradation, and microbial breakdown (Facelli andPickett, 1991) and also physical fragmentation (leaching of soluble
! Corresponding author. Current address: PO Box 110290, 2181 McCarty Hall A,Gainesville, FL 32611-0290, USA. Tel.: +1 352 294 3154; fax: +1 352 392 3399.
E-mail address: [email protected] (K.R. Reddy).
C) during rainfall events (Ferreira et al., 2006). Decomposition ratesare controlled primarily by extrinsic drivers such as climate (Aerts,2006; Austin and Vitousek, 2000; Gill and Burke, 2002) and soilproperties (Gill and Burke, 2002). Intrinsic drivers include plantlitter quality (Aerts, 2006; Gindaba et al., 2004; Mugendi and Nair,1997) and litter physical properties (Meentemeyer, 1978). Temper-ature is considered to be a major regulator of litter decomposition incold climates, while litter quality is more important under warmerconditions (Couteaux et al., 1995).
Moisture content is a major regulator of decomposition andnutrient leaching in the arid environments. Rain and irrigation areconsidered to be the main sources of moisture in agricultural areas,while rain is considered to be the main source in natural ecosys-tems. In these places other sources of water namely fog, mist anddew are often overlooked (Went, 1955). Dew is mainly depositedin the dry season when the sky is clear and hence an importantsource of moisture in the semi-arid areas during the dry seasoncompared to other climates (Went, 1955). Duvdevani (1953) con-ducting an experiment in the coastal plains of Israel, where dew
http://dx.doi.org/10.1016/j.agee.2014.02.0040167-8809/© 2014 Elsevier B.V. All rights reserved.
L.W. Ngatia et al. / Agriculture, Ecosystems and Environment 188 (2014) 12–19 13
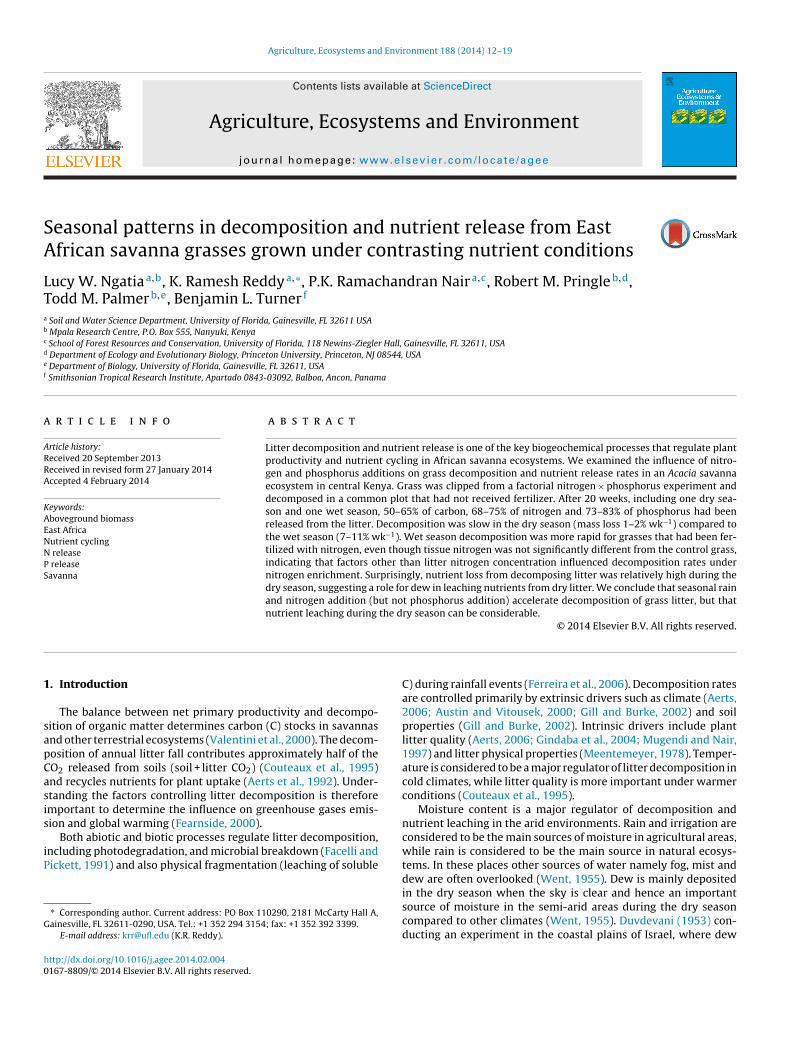
Fig. 1. Rainfall at the Mpala Research Centre, Laikipia, Kenya. Records are presented for a) the long-term rainfall average (1999–2011) and b) during the study period from12/22/2010 to 5/11/2011. In (b) the data are presented in 4 weeks intervals to emulate the field litter incubation period. The litter was incubated for 20 weeks and the sampleswere collected from the field after every 4 weeks without replacement.
occurred frequently indicated that most plants grew about twiceas much when they received dew during the night. The dew watercould run off the leaves and collect in the soil on which it drips(Duvdevani, 1953; Ruinen, 1961). The dripping dew contains bothmineral and organic constituents in varying composition, makingdew a leaching agent (Ruinen, 1961).
In African savannas, most litterfall occurs in the dry season, yetmost decomposition studies have been initiated at the onset of thewet season (Deshmukh, 1985; Jama and Nair, 1996; Mafongoyaet al., 1997; Mugendi and Nair, 1997; Mugendi et al., 1999) withfew in the dry season (e.g., Fornara and Du Toit, 2008). In addi-tion, most studies involved leguminous forbs and trees (Fornara andDu Toit, 2008; Fosu et al., 2007; Jama and Nair, 1996; Mafongoyaet al., 1997; Mugendi and Nair, 1997; Mugendi et al., 1999; Oladoyeet al., 2008), and few included grasses (Deshmukh, 1985; Ohiaguand Wood, 1979), even though grasses dominate the abovegroundbiomass of savanna ecosystems (Bond, 2008). Finally, few studieshave examined the role of nutrients in determining the decompo-sition rates of tropical savanna grasses, yet foliar nutrients can havea marked impact on litter decomposition in other ecosystems suchas temperate grassland (Kochy and Wilson, 1997; Moretto et al.,2001), tundra (Bryant et al., 1997; Hobbie and Gough, 2004), tem-perate forest (Melillo et al., 1982), montane forests (Hobbie andVitousek, 2000) and tropical forests (Gonzalez and Seastedt, 2001;Kaspari et al., 2008).
The objectives of our study were to determine the influence ofN and P addition on plant litter decomposition, N and P release insavanna ecosystem. To do this, we decomposed grasses from a fac-torial N " P fertilization experiment in a common unenriched sitethroughout one dry season and one wet season. We hypothesizedthat decomposition rate, N and P release would be greater in thewet season than in the dry season, and that grasses that had beenfertilized with N and P would decompose faster than untreatedgrasses.
2. Methods
2.1. Site description
The study was conducted in 2010 and 2011 at Mpala ResearchCentre, Kenya, which encompasses 190 km2 of semi-arid savanna
within the Laikipia County of the Rift Valley Province (37$53%E,0$17%N). The site is a conservancy where wildlife and livestockco-exist and share resources. The dominant woody vegetationincludes Senegalia (Acacia) brevispica, Vachellia (Acacia) etbaica, S.(Acacia) mellifera, V. (Acacia) nilotica and V. (Acacia) gerrardii, Crotondichogamus, Grewia spp. and Rhus vulgaris (Young et al., 1995). Theherbaceous vegetation consists of a discontinuous layer of mostlyperennial grasses, which include Pennisetum mezianum, Pennisetumstramineum, Digitaria milanjiana, and Cynodon dactylon.
The soils are red sandy loams (Typic Haplustalfs in Soil Taxon-omy) derived from metamorphic basement rock (Ahn and Geiger,1987; Goheen et al., 2013). Prior to fertilization, soil pH was6.3 (measured in water), total soil P was 230 mg kg#1 and avail-able P was 11 mg kg#1 (determined by resin bags as outlined byKouno et al. (1995)). Total soil C and N contents were 10 and1.1 g kg#1, respectively and the mean annual rainfall was approx-imately 640 mm over a 13 years period (Fig. 1a) (Goheen et al.,2013). Monthly maximum temperatures range from 25 to 33 $C,while minimum temperatures range from 12 to 17 $C (Young et al.,1998).
This study was conducted in the Ungulate Herbivory UnderRainfall Uncertainty (UHURU) experiment, established in 2008 atthe Mpala Research Centre (Goheen et al., 2013). The study was con-ducted in the southern (wettest) site of the UHURU experiment,which received an average of 638 mm rain year#1 from 2009 to2011.
2.2. Experimental design
Four fertilizer addition plots (16 m2 each; hereafter “plots”)were established in February 2010 in each of three replicate exclo-sures (1 ha each) which fenced out all herbivores larger thanLepus spp. (&2–3 kg). Thus, there were a total of 12 plots arrangedacross the three exclosures. The 12 plots entailed four fertilizertreatments and three replications of each fertilizer treatment.Within each of the 12 plots, grass was clipped to ground levelin a 1 m2 patch and discarded and fertilizers were applied to theentire 16 m2 plot on the onset of rainfall (March 2010). This allowedregrowth standing dead grass from the 1 m2 plot to be used for thedecomposition experiment. The fertilizer treatments included: (1)N only, (2) P only, (3) a mixture of N and P, and (4) unfertilized
14 L.W. Ngatia et al. / Agriculture, Ecosystems and Environment 188 (2014) 12–19
control (hereafter referred as N, P, NP and control). The fertilizerapplication consisted of N (urea) at 100 kg N ha#1 and/or P (triplesuper phosphate) at 50 kg P ha#1. All treatments were arrangedin a randomized complete block design within each of the exclo-sures. In November/December 2010, grass regrowth from the 1 m2
fertilizer-enriched patches was clipped for use in decompositionstudy.
2.3. Experimental procedure
After fertilization, aboveground standing dead grass wasselected from the regrowth, was clipped from each plot and air-dried to a constant weight. Litter bags (15 " 20 cm) were madefrom 2 mm mesh polyester to allow entry of micro- and mesofauna.Three grams (dry weight basis) of a mixture of grasses from eachfertilizer-enriched plot and each of the three treatment replicateswas put into each of 10 litter bags, which were heat sealed andplaced in the thatch layer in a common unenriched decompositionarea away from the plots of origin. After placement on the ground,the bags were lightly covered with litter from the common unen-riched plot. This experiment was maintained from 22 December2010 to 11 May 2011 (5 months). Two litter bags (duplicates) fromeach of the three treatments replicates were retrieved after 0, 4, 8,12, 16, and 20 weeks. The bags and their contents were air-dried toa constant weight. Prior to weighing the contents of each bag, soilparticles and any other extraneous matter were carefully removed.The content from the duplicate litter bags in each treatment repli-cate was composited for chemical analysis after weighing. Littersamples were then ground to pass through a 1-mm screen andanalyzed for total C, N, P and lignin concentrations. The N and Pconcentration and remaining litter biomass at any given time wereused to estimate the N and P release. The N or P release was the bal-ance between the original N or P mass and the mass at any giventime.
2.4. Litter processing and analysis
Total C and N were determined using a Costech Model 4010 Ele-mental Analyzer (Costech Analytical Industries, Inc., Valencia, CA)coupled to a Finnigan MAT Deltaplus XL mass Spectrometer (CF-IRMS, Thermo Finnigan) via a Finnigan Conflo II interface. Total Pwas determined by ignition at 550 $C followed by extraction in 1 MH2SO4 acid and detection by automated molybdate colorimetry.Digested solutions were analyzed colorimetrically using ShimadzuUV visible recording spectrophotometer UV-160. Lignin was deter-mined by a modified sequential fiber extraction method (AnkomTechnology, Fairport, NY) modified from the feed and forage anal-ysis by Van Soest (1970).
2.5. Statistical analysis
Statistical differences in treatments were determined usinganalysis of variance (ANOVA) for a randomized complete blockdesign using Tukey HSD test at = 0.05. Sidak adjustment formultiple comparisons test was used to determine the significantdifference for the multiple phase regression model at = 0.05. Anonlinear procedure of SAS (SAS 9.2) for multiphase regressionmodels was fitted for C release during decomposition; parametersinclude intercept and slope of each phase, and the spline. The slopeof the linear regression represents the decomposition rate constant(k). The spline point is the end of phase 1 and beginning of phase2 (Jama and Nair, 1996). For C release half-life was calculated frommultiple regression model by determining the time (x) that half ofthe original C mass had been released.
3. Results
3.1. Pattern of litter decomposition
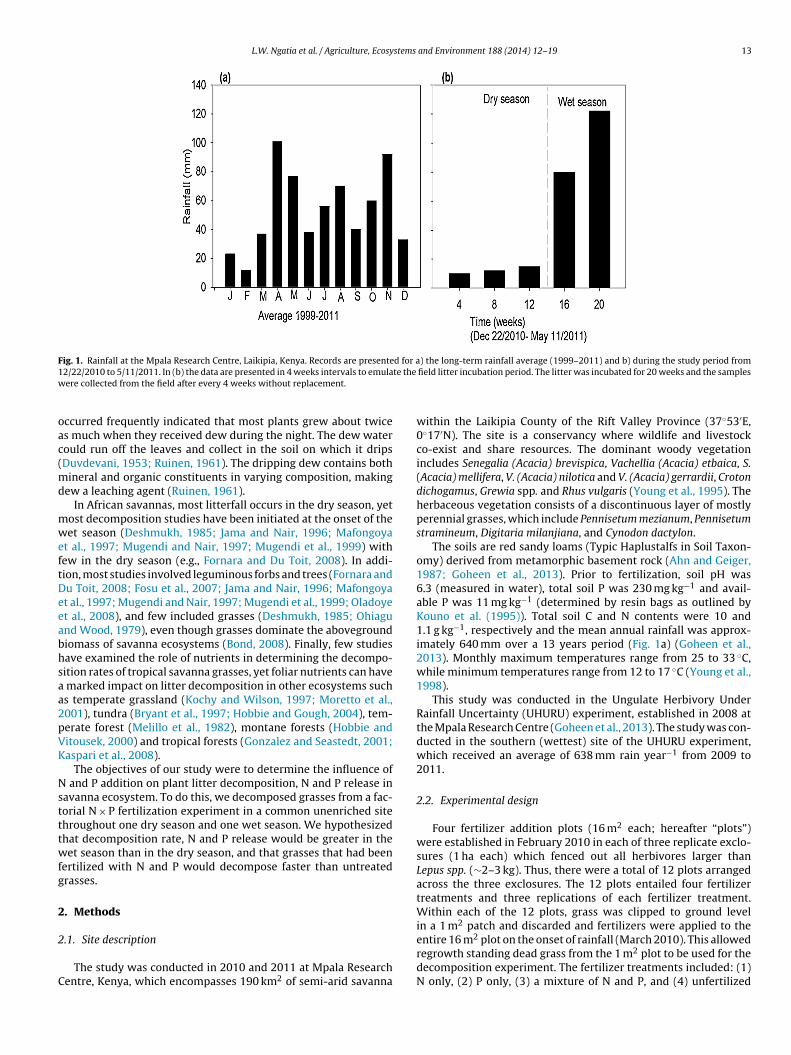
Plant litter decomposition followed a biphasic pattern, withan initial phase of slow decomposition rates followed by fasterrates (Fig. 2a–d) after the onset of the rains in April. Within nutri-ent enrichment treatments, the decomposition constants (k1 andk2) for the two phases differed significantly between dry and wetseasons (phase one is hereafter referred to dry phase and phasetwo as wet phase). Sidak adjustment for multiple comparisonstest indicated that the decomposition rate constant was higher inthe wet phase than the dry phase for all treatments (P < 0.0001for the control and N enrichment treatments P = 0.0003 for theP enrichment treatment, P = 0.04 for the NP enrichment treat-ment) (Fig. 2). The decomposition rate was two times greater forthe enriched treatments than for the control (Fig. 2). For the wetphase, the decomposition constant was significantly higher for Nenriched grasses (11% wk#1; P = 0.0008), whereas P, NP-enrichedgrass and control grass did not differ significantly from one another(Fig. 2a–d).
The decomposition rate of grass from the control treatment was10 g kg#1 week#1 in the dry phase and 70 g kg#1 week#1 in the wetphase (Fig. 2a). This corresponds to a half-life of 39 weeks. Thewet phase of decomposition started at 13 weeks at 88% initial Cmass. At the end of the study (after 20 weeks), 50% of the totalC remained. The decomposition rate of N-only enriched grass was20 g kg#1 week#1 in the dry phase and 110 g kg#1 week#1 in the wetphase, (Fig. 2b), corresponding to a half-life of 35 weeks. The wetphase of litter decomposition commenced on week 14 with 75% ofthe initial C remaining. At the end of the study, 35% of the initial Cremained.
The decomposition rate of the P-only enriched grass was20 g kg#1 week#1 in the dry phase, and 90 g kg#1 week#1 in the wetphase (Fig. 2c), with a half-life of 40 weeks. The wet phase of decom-position began at 16 weeks with 73% of the initial C mass remaining.At the end of the study, 45% of the initial C mass remained.
The NP-enriched grass decomposition rate was20 g kg#1 week#1 in the dry phase and 80 g kg#1 week#1 inthe wet phase (Fig. 2d) with a half-life of 42 weeks. Wet phasedecomposition started at 16 weeks (Fig. 2d) with 73% of theinitial C remaining. Although there were no significant differencesbetween the initial nutrient concentrations of the enriched grasses(Table 1), Sidak adjustment for multiple comparisons test indicatethat N-enriched grasses had higher decomposition rates in the sec-ond (wet) phase (P = 0.0008; Fig. 2b) compared to other treatments,with the N-enriched grasses having the least amount of C massremaining at the end of the study. The seasonal rainfall positivelycorrelated with decomposition rate (R2 = 0.80; P < 0.0001).
3.2. Trends in nitrogen and phosphorus release from the grasslitter
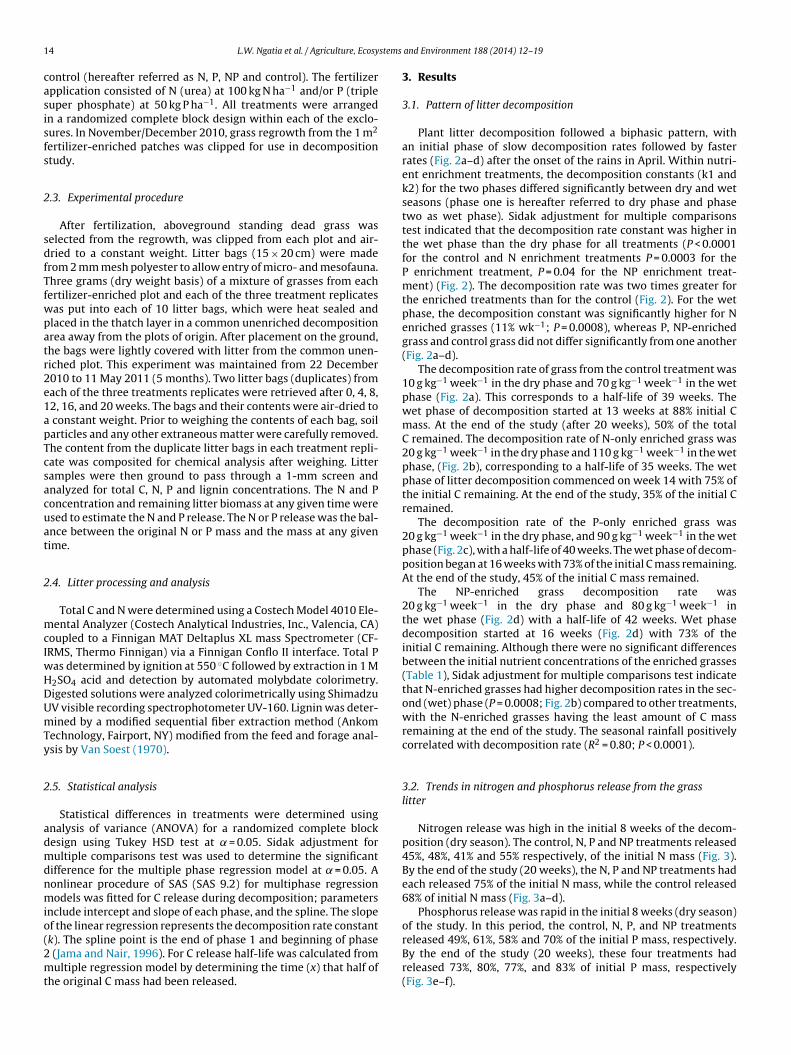
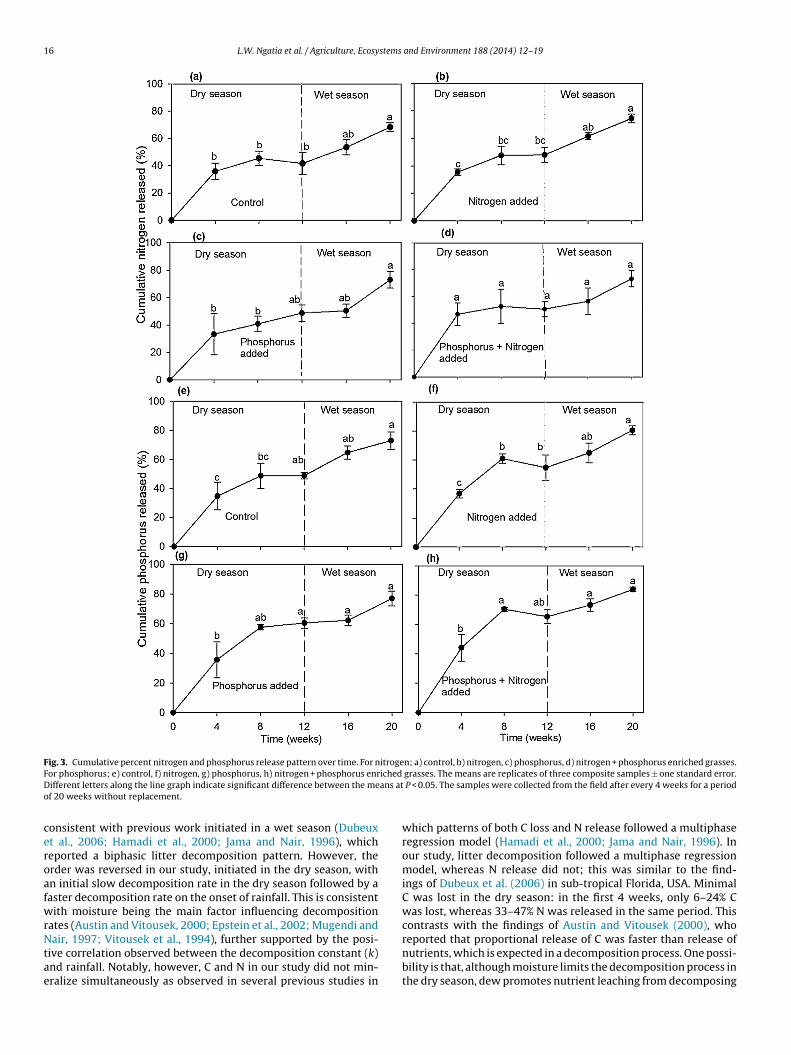
Nitrogen release was high in the initial 8 weeks of the decom-position (dry season). The control, N, P and NP treatments released45%, 48%, 41% and 55% respectively, of the initial N mass (Fig. 3).By the end of the study (20 weeks), the N, P and NP treatments hadeach released 75% of the initial N mass, while the control released68% of initial N mass (Fig. 3a–d).
Phosphorus release was rapid in the initial 8 weeks (dry season)of the study. In this period, the control, N, P, and NP treatmentsreleased 49%, 61%, 58% and 70% of the initial P mass, respectively.By the end of the study (20 weeks), these four treatments hadreleased 73%, 80%, 77%, and 83% of initial P mass, respectively(Fig. 3e–f).
L.W. Ngatia et al. / Agriculture, Ecosystems and Environment 188 (2014) 12–19 15
Fig. 2. Decomposition pattern over time for a) control, b) nitrogen-enriched, c) phosphorus-enriched, and d) nitrogen + phosphorus enriched grass placed on the unenrichedsoil surface. The means are replicates of three composite samples ± one standard error. The samples were collected from the field after every 4 weeks for a period of 20 weekswithout replacement.
Table 1Aboveground biomass, biomass C (carbon), N (nitrogen) and P (phosphorus) storage. Chemical composition of the initial grasses biomass after fertilization and ratios ofinitial aboveground biomass. The values are means of three composite replicates ± one standard error. There were no significant differences between the treatments for allparameters.
Treatment Control N P NP
Aboveground storage (kg ha#1)Aboveground biomass 1155 ± 187 1494 ± 407 1602 ± 490 2411 ± 735Carbon 472 ± 77 620 ± 170 663 ± 193 974 ± 313Nitrogen 14.7 ± 2.7 25.6 ± 3.6 27.3 ± 5.2 33.4 ± 17.6Phosphorus 1.4 ± 0.2 1.9 ± 0.6 2.0 ± 0.4 4.1 ± 0.9
Chemical composition of the initial aboveground biomass (g kg#1)Carbon 404 ± 5 415 ± 7 414 ± 6 404 ± 9Nitrogen 13 ± 1 17 ± 2 17 ± 2 14 ± 2Phosphorus 1.3 ± 0.1 1.5 ± 0.3 1.4 ± 0.1 1.2 ± 0.2Lignin 250 ± 30 210 ± 25 250 ± 5 230 ± 13
Nutrient ratios of the initial aboveground biomassLignin: N 19 ± 0.8 13 ± 3.1 15 ± 1.8 17 ± 3C:N 32 ± 3 25 ± 3 25 ± 3 30 ± 3.6C:P 326 ± 23 276 ± 49 300 ± 22 335 ± 46N:P 10.2 ± 0.8 12.2 ± 3.3 12.5 ± 1.4 12.2 ± 3.0
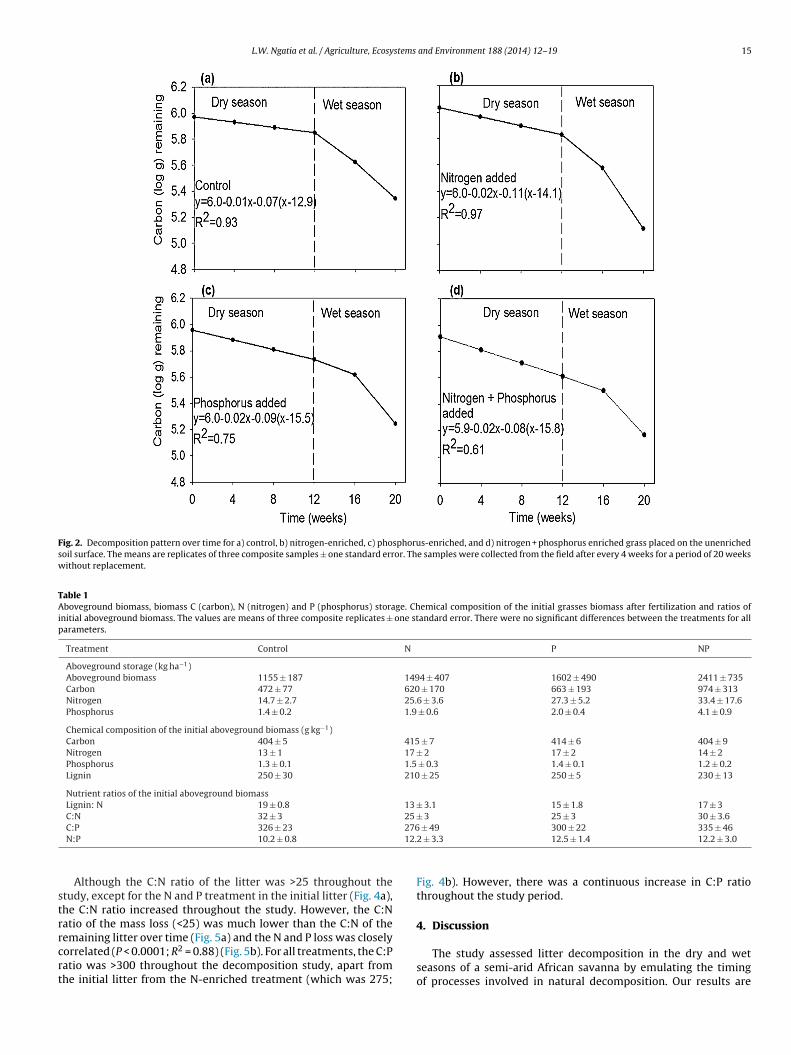
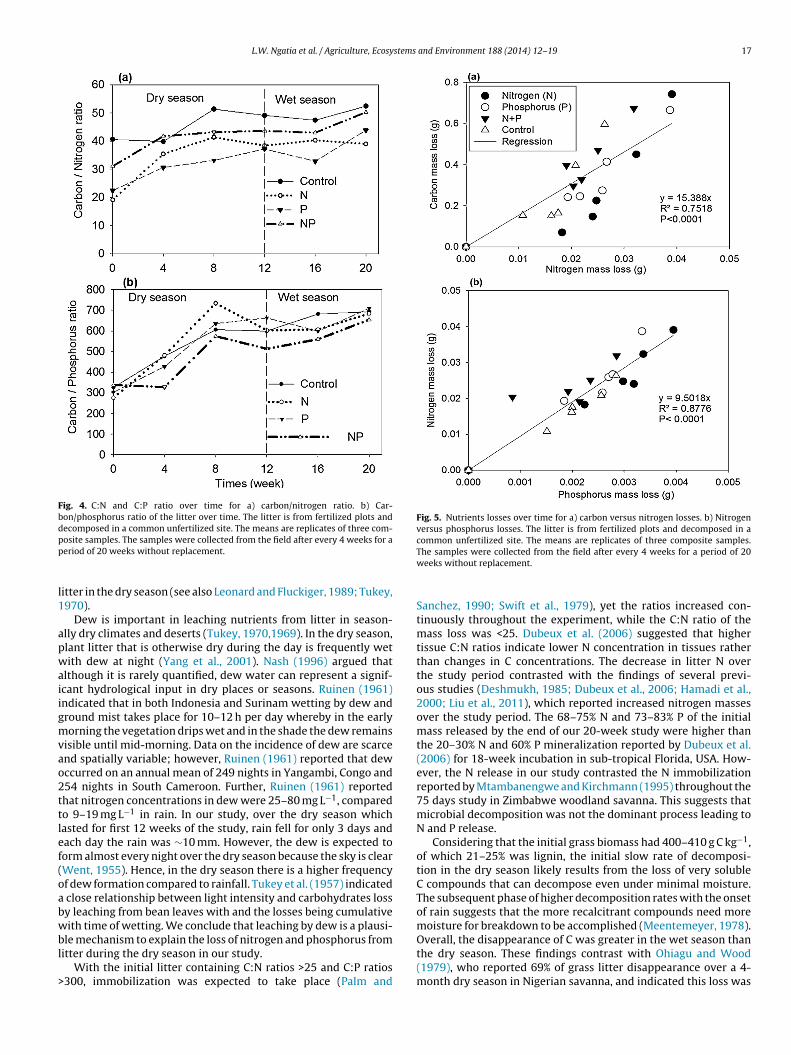
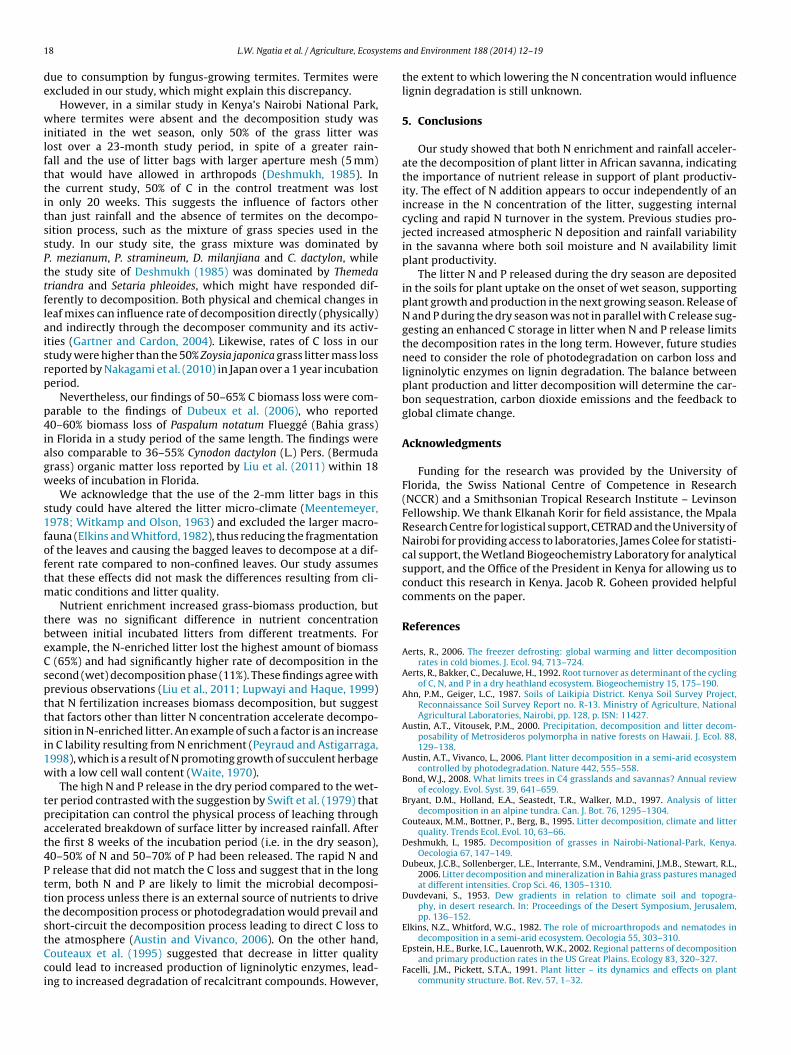
Although the C:N ratio of the litter was >25 throughout thestudy, except for the N and P treatment in the initial litter (Fig. 4a),the C:N ratio increased throughout the study. However, the C:Nratio of the mass loss (<25) was much lower than the C:N of theremaining litter over time (Fig. 5a) and the N and P loss was closelycorrelated (P < 0.0001; R2 = 0.88) (Fig. 5b). For all treatments, the C:Pratio was >300 throughout the decomposition study, apart fromthe initial litter from the N-enriched treatment (which was 275;
Fig. 4b). However, there was a continuous increase in C:P ratiothroughout the study period.
4. Discussion
The study assessed litter decomposition in the dry and wetseasons of a semi-arid African savanna by emulating the timingof processes involved in natural decomposition. Our results are
16 L.W. Ngatia et al. / Agriculture, Ecosystems and Environment 188 (2014) 12–19
Fig. 3. Cumulative percent nitrogen and phosphorus release pattern over time. For nitrogen; a) control, b) nitrogen, c) phosphorus, d) nitrogen + phosphorus enriched grasses.For phosphorus; e) control, f) nitrogen, g) phosphorus, h) nitrogen + phosphorus enriched grasses. The means are replicates of three composite samples ± one standard error.Different letters along the line graph indicate significant difference between the means at P < 0.05. The samples were collected from the field after every 4 weeks for a periodof 20 weeks without replacement.
consistent with previous work initiated in a wet season (Dubeuxet al., 2006; Hamadi et al., 2000; Jama and Nair, 1996), whichreported a biphasic litter decomposition pattern. However, theorder was reversed in our study, initiated in the dry season, withan initial slow decomposition rate in the dry season followed by afaster decomposition rate on the onset of rainfall. This is consistentwith moisture being the main factor influencing decompositionrates (Austin and Vitousek, 2000; Epstein et al., 2002; Mugendi andNair, 1997; Vitousek et al., 1994), further supported by the posi-tive correlation observed between the decomposition constant (k)and rainfall. Notably, however, C and N in our study did not min-eralize simultaneously as observed in several previous studies in
which patterns of both C loss and N release followed a multiphaseregression model (Hamadi et al., 2000; Jama and Nair, 1996). Inour study, litter decomposition followed a multiphase regressionmodel, whereas N release did not; this was similar to the find-ings of Dubeux et al. (2006) in sub-tropical Florida, USA. MinimalC was lost in the dry season: in the first 4 weeks, only 6–24% Cwas lost, whereas 33–47% N was released in the same period. Thiscontrasts with the findings of Austin and Vitousek (2000), whoreported that proportional release of C was faster than release ofnutrients, which is expected in a decomposition process. One possi-bility is that, although moisture limits the decomposition process inthe dry season, dew promotes nutrient leaching from decomposing
L.W. Ngatia et al. / Agriculture, Ecosystems and Environment 188 (2014) 12–19 17
Fig. 4. C:N and C:P ratio over time for a) carbon/nitrogen ratio. b) Car-bon/phosphorus ratio of the litter over time. The litter is from fertilized plots anddecomposed in a common unfertilized site. The means are replicates of three com-posite samples. The samples were collected from the field after every 4 weeks for aperiod of 20 weeks without replacement.
litter in the dry season (see also Leonard and Fluckiger, 1989; Tukey,1970).
Dew is important in leaching nutrients from litter in season-ally dry climates and deserts (Tukey, 1970,1969). In the dry season,plant litter that is otherwise dry during the day is frequently wetwith dew at night (Yang et al., 2001). Nash (1996) argued thatalthough it is rarely quantified, dew water can represent a signif-icant hydrological input in dry places or seasons. Ruinen (1961)indicated that in both Indonesia and Surinam wetting by dew andground mist takes place for 10–12 h per day whereby in the earlymorning the vegetation drips wet and in the shade the dew remainsvisible until mid-morning. Data on the incidence of dew are scarceand spatially variable; however, Ruinen (1961) reported that dewoccurred on an annual mean of 249 nights in Yangambi, Congo and254 nights in South Cameroon. Further, Ruinen (1961) reportedthat nitrogen concentrations in dew were 25–80 mg L#1, comparedto 9–19 mg L#1 in rain. In our study, over the dry season whichlasted for first 12 weeks of the study, rain fell for only 3 days andeach day the rain was &10 mm. However, the dew is expected toform almost every night over the dry season because the sky is clear(Went, 1955). Hence, in the dry season there is a higher frequencyof dew formation compared to rainfall. Tukey et al. (1957) indicateda close relationship between light intensity and carbohydrates lossby leaching from bean leaves with and the losses being cumulativewith time of wetting. We conclude that leaching by dew is a plausi-ble mechanism to explain the loss of nitrogen and phosphorus fromlitter during the dry season in our study.
With the initial litter containing C:N ratios >25 and C:P ratios>300, immobilization was expected to take place (Palm and
Fig. 5. Nutrients losses over time for a) carbon versus nitrogen losses. b) Nitrogenversus phosphorus losses. The litter is from fertilized plots and decomposed in acommon unfertilized site. The means are replicates of three composite samples.The samples were collected from the field after every 4 weeks for a period of 20weeks without replacement.
Sanchez, 1990; Swift et al., 1979), yet the ratios increased con-tinuously throughout the experiment, while the C:N ratio of themass loss was <25. Dubeux et al. (2006) suggested that highertissue C:N ratios indicate lower N concentration in tissues ratherthan changes in C concentrations. The decrease in litter N overthe study period contrasted with the findings of several previ-ous studies (Deshmukh, 1985; Dubeux et al., 2006; Hamadi et al.,2000; Liu et al., 2011), which reported increased nitrogen massesover the study period. The 68–75% N and 73–83% P of the initialmass released by the end of our 20-week study were higher thanthe 20–30% N and 60% P mineralization reported by Dubeux et al.(2006) for 18-week incubation in sub-tropical Florida, USA. How-ever, the N release in our study contrasted the N immobilizationreported by Mtambanengwe and Kirchmann (1995) throughout the75 days study in Zimbabwe woodland savanna. This suggests thatmicrobial decomposition was not the dominant process leading toN and P release.
Considering that the initial grass biomass had 400–410 g C kg#1,of which 21–25% was lignin, the initial slow rate of decomposi-tion in the dry season likely results from the loss of very solubleC compounds that can decompose even under minimal moisture.The subsequent phase of higher decomposition rates with the onsetof rain suggests that the more recalcitrant compounds need moremoisture for breakdown to be accomplished (Meentemeyer, 1978).Overall, the disappearance of C was greater in the wet season thanthe dry season. These findings contrast with Ohiagu and Wood(1979), who reported 69% of grass litter disappearance over a 4-month dry season in Nigerian savanna, and indicated this loss was
18 L.W. Ngatia et al. / Agriculture, Ecosystems and Environment 188 (2014) 12–19
due to consumption by fungus-growing termites. Termites wereexcluded in our study, which might explain this discrepancy.
However, in a similar study in Kenya’s Nairobi National Park,where termites were absent and the decomposition study wasinitiated in the wet season, only 50% of the grass litter waslost over a 23-month study period, in spite of a greater rain-fall and the use of litter bags with larger aperture mesh (5 mm)that would have allowed in arthropods (Deshmukh, 1985). Inthe current study, 50% of C in the control treatment was lostin only 20 weeks. This suggests the influence of factors otherthan just rainfall and the absence of termites on the decompo-sition process, such as the mixture of grass species used in thestudy. In our study site, the grass mixture was dominated byP. mezianum, P. stramineum, D. milanjiana and C. dactylon, whilethe study site of Deshmukh (1985) was dominated by Themedatriandra and Setaria phleoides, which might have responded dif-ferently to decomposition. Both physical and chemical changes inleaf mixes can influence rate of decomposition directly (physically)and indirectly through the decomposer community and its activ-ities (Gartner and Cardon, 2004). Likewise, rates of C loss in ourstudy were higher than the 50% Zoysia japonica grass litter mass lossreported by Nakagami et al. (2010) in Japan over a 1 year incubationperiod.
Nevertheless, our findings of 50–65% C biomass loss were com-parable to the findings of Dubeux et al. (2006), who reported40–60% biomass loss of Paspalum notatum Flueggé (Bahia grass)in Florida in a study period of the same length. The findings werealso comparable to 36–55% Cynodon dactylon (L.) Pers. (Bermudagrass) organic matter loss reported by Liu et al. (2011) within 18weeks of incubation in Florida.
We acknowledge that the use of the 2-mm litter bags in thisstudy could have altered the litter micro-climate (Meentemeyer,1978; Witkamp and Olson, 1963) and excluded the larger macro-fauna (Elkins and Whitford, 1982), thus reducing the fragmentationof the leaves and causing the bagged leaves to decompose at a dif-ferent rate compared to non-confined leaves. Our study assumesthat these effects did not mask the differences resulting from cli-matic conditions and litter quality.
Nutrient enrichment increased grass-biomass production, butthere was no significant difference in nutrient concentrationbetween initial incubated litters from different treatments. Forexample, the N-enriched litter lost the highest amount of biomassC (65%) and had significantly higher rate of decomposition in thesecond (wet) decomposition phase (11%). These findings agree withprevious observations (Liu et al., 2011; Lupwayi and Haque, 1999)that N fertilization increases biomass decomposition, but suggestthat factors other than litter N concentration accelerate decompo-sition in N-enriched litter. An example of such a factor is an increasein C lability resulting from N enrichment (Peyraud and Astigarraga,1998), which is a result of N promoting growth of succulent herbagewith a low cell wall content (Waite, 1970).
The high N and P release in the dry period compared to the wet-ter period contrasted with the suggestion by Swift et al. (1979) thatprecipitation can control the physical process of leaching throughaccelerated breakdown of surface litter by increased rainfall. Afterthe first 8 weeks of the incubation period (i.e. in the dry season),40–50% of N and 50–70% of P had been released. The rapid N andP release that did not match the C loss and suggest that in the longterm, both N and P are likely to limit the microbial decomposi-tion process unless there is an external source of nutrients to drivethe decomposition process or photodegradation would prevail andshort-circuit the decomposition process leading to direct C loss tothe atmosphere (Austin and Vivanco, 2006). On the other hand,Couteaux et al. (1995) suggested that decrease in litter qualitycould lead to increased production of ligninolytic enzymes, lead-ing to increased degradation of recalcitrant compounds. However,
the extent to which lowering the N concentration would influencelignin degradation is still unknown.
5. Conclusions
Our study showed that both N enrichment and rainfall acceler-ate the decomposition of plant litter in African savanna, indicatingthe importance of nutrient release in support of plant productiv-ity. The effect of N addition appears to occur independently of anincrease in the N concentration of the litter, suggesting internalcycling and rapid N turnover in the system. Previous studies pro-jected increased atmospheric N deposition and rainfall variabilityin the savanna where both soil moisture and N availability limitplant productivity.
The litter N and P released during the dry season are depositedin the soils for plant uptake on the onset of wet season, supportingplant growth and production in the next growing season. Release ofN and P during the dry season was not in parallel with C release sug-gesting an enhanced C storage in litter when N and P release limitsthe decomposition rates in the long term. However, future studiesneed to consider the role of photodegradation on carbon loss andligninolytic enzymes on lignin degradation. The balance betweenplant production and litter decomposition will determine the car-bon sequestration, carbon dioxide emissions and the feedback toglobal climate change.
Acknowledgments
Funding for the research was provided by the University ofFlorida, the Swiss National Centre of Competence in Research(NCCR) and a Smithsonian Tropical Research Institute – LevinsonFellowship. We thank Elkanah Korir for field assistance, the MpalaResearch Centre for logistical support, CETRAD and the University ofNairobi for providing access to laboratories, James Colee for statisti-cal support, the Wetland Biogeochemistry Laboratory for analyticalsupport, and the Office of the President in Kenya for allowing us toconduct this research in Kenya. Jacob R. Goheen provided helpfulcomments on the paper.
References
Aerts, R., 2006. The freezer defrosting: global warming and litter decompositionrates in cold biomes. J. Ecol. 94, 713–724.
Aerts, R., Bakker, C., Decaluwe, H., 1992. Root turnover as determinant of the cyclingof C, N, and P in a dry heathland ecosystem. Biogeochemistry 15, 175–190.
Ahn, P.M., Geiger, L.C., 1987. Soils of Laikipia District. Kenya Soil Survey Project,Reconnaissance Soil Survey Report no. R-13. Ministry of Agriculture, NationalAgricultural Laboratories, Nairobi, pp. 128, p. ISN: 11427.
Austin, A.T., Vitousek, P.M., 2000. Precipitation, decomposition and litter decom-posability of Metrosideros polymorpha in native forests on Hawaii. J. Ecol. 88,129–138.
Austin, A.T., Vivanco, L., 2006. Plant litter decomposition in a semi-arid ecosystemcontrolled by photodegradation. Nature 442, 555–558.
Bond, W.J., 2008. What limits trees in C4 grasslands and savannas? Annual reviewof ecology. Evol. Syst. 39, 641–659.
Bryant, D.M., Holland, E.A., Seastedt, T.R., Walker, M.D., 1997. Analysis of litterdecomposition in an alpine tundra. Can. J. Bot. 76, 1295–1304.
Couteaux, M.M., Bottner, P., Berg, B., 1995. Litter decomposition, climate and litterquality. Trends Ecol. Evol. 10, 63–66.
Deshmukh, I., 1985. Decomposition of grasses in Nairobi-National-Park, Kenya.Oecologia 67, 147–149.
Dubeux, J.C.B., Sollenberger, L.E., Interrante, S.M., Vendramini, J.M.B., Stewart, R.L.,2006. Litter decomposition and mineralization in Bahia grass pastures managedat different intensities. Crop Sci. 46, 1305–1310.
Duvdevani, S., 1953. Dew gradients in relation to climate soil and topogra-phy, in desert research. In: Proceedings of the Desert Symposium, Jerusalem,pp. 136–152.
Elkins, N.Z., Whitford, W.G., 1982. The role of microarthropods and nematodes indecomposition in a semi-arid ecosystem. Oecologia 55, 303–310.
Epstein, H.E., Burke, I.C., Lauenroth, W.K., 2002. Regional patterns of decompositionand primary production rates in the US Great Plains. Ecology 83, 320–327.
Facelli, J.M., Pickett, S.T.A., 1991. Plant litter – its dynamics and effects on plantcommunity structure. Bot. Rev. 57, 1–32.
L.W. Ngatia et al. / Agriculture, Ecosystems and Environment 188 (2014) 12–19 19
Fearnside, P.M., 2000. Global warming and tropical land-use change: green-house gas emissions from biomass burning, decomposition and soils in forestconversion, shifting cultivation and secondary vegetation. Clim. Change 46,115–158.
Ferreira, V., Grac a, M.A.S., de Lima, J.L.M.P., Gomes, R., 2006. Role of physical fragmen-tation and invertebrate activity in the breakdown rate of leaves. Arch. Hydrobiol.165, 493–513.
Fornara, D.A., Du Toit, J.T., 2008. Browsing-induced effects on leaf litter quality anddecomposition in a southern African savanna. Ecosystems 11, 238–249.
Fosu, M., Kuhne, R.F., Vlek, P.L.G., 2007. Mineralization and microbial biomassdynamics during decomposition of four leguminous residues. J. Biol. Sci. 7,632–637.
Gartner, T.B., Cardon, Z.G., 2004. Decomposition dynamics in mixed-species leaflitter. Oikos 104, 230–246.
Gill, R.A., Burke, I.C., 2002. Influence of soil depth on the decomposition of Boutelouagracilis roots in the short grass steppe. Plant Soil 241, 233–242.
Gindaba, J., Olsson, M., Itanna, F., 2004. Nutrient composition and short term releasefrom croton macrostachyus Del. and Millettia ferruginea (Hochst) Baker leaves.Biol. Fert. Soils 40, 393–397.
Goheen, J.R., Palmer, T.M., Charles, G.K., Helgen, K.M., Kinyua, S.N., et al., 2013. Piece-wise disassembly of a large-herbivore community across a rainfall gradient:The UHURU Experiment. PLoS ONE 8 (2), e55192, http://dx.doi.org/10.1371/journal.pone.0055192.
Gonzalez, G., Seastedt, T.R., 2001. Soil fauna and plant litter decomposition in tropicaland subalpine forests. Ecology 82, 955–964.
Hamadi, Z., Steinberger, Y., Kutiel, P., Lavee, H., Barness, G., 2000. Decomposition ofAvena sterilis litter under arid conditions. J. Arid Environ. 46, 281–293.
Hobbie, S.E., Gough, L., 2004. Litter decomposition in moist acidic and non-acidictundra with different glacial histories. Oecologia 140, 113–124.
Hobbie, S.E., Vitousek, P.M., 2000. Nutrient limitation of decomposition in Hawaiianforests. Ecology 81, 1867–1877.
Jama, B.A., Nair, R.K.R., 1996. Decomposition and nitrogen mineralization patternsof Leucaena leucocephala and Cassia siamea mulch under tropical semi-arid con-ditions in Kenya. Plant Soil 179, 275–285.
Kaspari, M., Garcia, M.N., Harms, K.E., Santana, M., Wright, S.J., Yavitt, J.B., 2008.Multiple nutrients limit litterfall and decomposition in a tropical forest. Ecology11, 35–43.
Kochy, M., Wilson, S.D., 1997. Litter decomposition and nitrogen dynamics in aspenforest and mixed-grass prairie. Ecology 78, 732–739.
Kouno, K., Tuchiya, Y., Ando, T., 1995. Measurement of soil microbial biomassphosphorus by an anion exchange membrane method. Soil Biol. Biochem. 27,1353–1357.
Leonard, S., Fluckiger, W., 1989. Effects of cation leaching on mineral cycling andtranspiration: investigations with beech seedlings Fagus sylvatica L. New Phytol.111, 173–179.
Liu, K., Sollenberger, L.E., Silveira, M.L., Vendramini, J.M.B., Newman, Y.C., 2011.Grazing intensity and nitrogen fertilization affect litter responses in ‘Tifton 85%
Bermuda grass pastures: II. Decomposition and nitrogen mineralization. Agron.J. 103, 163–168.
Lupwayi, N.Z., Haque, I., 1999. Leucaena hedgerow intercropping and cattle manureapplication in the Ethiopian highlands. I. Decomposition and nutrient release.Biol. Fert. Soils 40 (28), 182–195.
Mafongoya, P.L., Nair, P.K.R., Dzowela, B.H., 1997. Multipurpose tree prunings as asource of nitrogen to maize under semiarid conditions in Zimbabwe. Agroforest.Syst. 35, 57–70.
Meentemeyer, V., 1978. Macroclimate and lignin control of litter decompositionrates. Ecology 59, 465–472.
Melillo, J.M., Aber, J.D., Muratore, J.F., 1982. Nitrogen and lignin control of hardwoodleaf litter decomposition dynamics. Ecology 63, 621–626.
Moretto, A.S., Distel, R.A., Didone, N.G., 2001. Decomposition and nutrient dynamicof leaf litter and roots from palatable and unpalatable grasses in a semi-aridgrassland. Appl. Soil Ecol. 18, 31–37.
Mtambanengwe, F., Kirchmann, H., 1995. Litter from a tropical savanna woodland(miombo): chemical composition and C and N mineralization. Soil Biol. Biochem.27, 1639–1651.
Mugendi, D.N., Nair, P.K.R., 1997. Predicting the decomposition patterns of treebiomass in tropical highland micro regions of Kenya. Agroforest. Syst. 35,187–201.
Mugendi, D.N., Nair, P.K.R., Mugwe, J.N., O’Neill, M.K., Swift, M.J., Woomer, P.L., 1999.Alley cropping of maize with calliandra and leucaena in the sub-humid high-lands of Kenya Part 2. Biomass decomposition, N mineralization, and N uptakeby maize. Agroforest. Syst. 46, 51–54.
Nakagami, K., Sakanoue, S., Takahashi, S., 2010. Estimation of nitrogen release fromdecomposing Zoysia japonica litter using its relationship to mass loss. Jpn. Grassl.Sci. 56, 177–182.
Nash III, T.H., 1996. Nutrient elemental accumulation and mineral cycling. In: NashIII, T.H. (Ed.), Lichens. Cambridge, United Kingdom, pp. 136–153.
Ohiagu, C.E., Wood, T.G., 1979. Grass production and decomposition in SouthernGuinea Savanna, Nigeria. Oecologia 40, 155–165.
Oladoye, A.O., Ola-adams, B.A., Adedire, M.O., Agboola, D.A., 2008. Nutrient dynamicsand litter decomposition in Leucaena leucocephala (Lam.) De Wit plantation inthe Nigerian derived savanna. West Afr. J. Appl. Ecol. 13, 96–103.
Palm, C.A., Sanchez, P.A., 1990. Decomposition and nutrient release patterns of theleaves of 3 tropical legumes. Biotropica 22, 330–338.
Peyraud, J.L., Astigarraga, L., 1998. Review of the effect of nitrogen fertilization onthe chemical composition, intake, digestion and nutritive value of fresh herbage:consequences on animal nutrition and N balance. Anim. Feed Sci. Tech. 72,235–259.
Ruinen, J., 1961. The phyllosphere. Plant Soil XV (2), 81–109.Swift, M.J., Heal, O.W., Anderson, J.M., 1979. Decomposition in Terrestrial Ecosys-
tems. Blackwell Scientific Publications, Oxford.Tukey Jr., H.B., Wittwer, S.H., Tukey, H.B., 1957. Leaching of carbohydrates from plant
foliage as related to light intensity. Science 126, 120.Tukey Jr., H.B., 1969. Implications of allelopathy in agricultural plant science. Bot.
Rev. 35, 1–16.Tukey Jr., H.B., 1970. The leaching of substances from plants. Annu. Rev. Psychol. 21,
305–324.Van Soest, J.P., 1970. Forage and Fiber Analysis Handbook No. 379. USDA, Washing-
ton, DC.Valentini, R., Matteucci, G., Dolman, A.J., et al., 2000. Respiration as the main deter-
minant of carbon balance in European forests. Nature 404, 861–865.Vitousek, P.M., Turner, D.R., Parton, W.J., Sanford, R.L., 1994. Litter decomposition
on the Mauna-Loa environmental matrix, Hawaii – patterns, mechanisms, andmodels. Ecology 75, 418–429.
Waite, R., 1970. The structural carbohydrates and the in vitro digestibility of a rye-grass and a cocksfoot at two levels of nitrogenous fertilizer. J. Agric. Sci. 74,457–462.
Went, F.W., 1955. Fog, Mist, Dew, and Other Sources of Water. Yearbook of Agricul-ture.
Witkamp, M., Olson, J.S., 1963. Breakdown of confined and nonconfined oak litter.Oikos 14, 138–147.
Yang, C., Crowley, D.E., Borneman, J., Keen, N.T., 2001. Microbial phyllosphere popu-lations are more complex than previously realized. PNAS 98, 3889–3894.
Young, T.P., Patridge, N., Macrae, A., 1995. Long-term glades in acacia bushland andtheir edge effects in Laikipia Kenya. Ecol. Appl. 5, 97–108.
Young, T.P., Okello, B., Kinyua, D., Palmer, T.P., 1998. KLEE: a long-term multi-speciesherbivore exclusion experiment in Laikipia Kenya. Afr. J. Range Forage Sci. 14,94–102.