Embed Size (px)
Citation preview
ECOGRAPHY 21: 3-10. Copenhagen 1998
Decomposition and nutrient dynamics of oak Quercus spp. logsafter five years of decomposition
T. D. Schowalter, Y. L. Zhang and T. E. Sabin
Schowalter, T. D., Zhang, Y. L. and Sabin, T. E. 1998. Decomposition and nutrientdynamics of oak Quercus spp. logs after five years of decomposition. - Ecography 21:3-10.
Decomposition of oak Quercus spp. logs (25-35 cm diameter, 3 m long) wascompared among log substrates in Oregon, Minnesota, Kansas and North Carolinaduring the first five years on the ground. Decomposition of whole logs (weighted bysubstrate) averaged 0.069 yr ---1 (±0.16 SD), but followed a 2-exponential model(k = 0.12 yr. ' year I and k = 0.06 yr - years 2-5), reflecting qualitative differencesamong log substrates (outer and inner bark, sapwood and heartwood). Rapid lossfrom bark substrates contributed to the initial rapid decay rate. Sapwood decay rateaveraged 0.15 yr' and dominated the second log decay rate. Heartwood lost only 6%mass during the first five years, for an overall decay rate of 0.012 yr that likely willrepresent a longer-term third exponential decay rate.
Carbon loss amounted to ca 5 kg yr- per 170 kg log. Nutrient concentrations gen-erally declined during the first five years, but nitrogen, sulfur, and sodium accumulatedin sapwood and heartwood during this period. Sulfur content increased in all sub-strates and doubled in whole logs during this 5-yr period. Complex patterns of nutrientcontent suggest patterns of microbial colonization and nutrient utilization. Polynomialmodels were developed to describe rates of carbon and nutrient flux in log substrates.
T. D. Schowalter and Y. L. Zhang, Dept of Entomology, Oregon State Univ., Corvallis,OR 97331, USA. - T. E. Sabin, Dept of Forest Science, Oregon State Univ., Corvallis,OR 97331, USA.
Coarse woody debris (CWD) is a conspicuous featureof forest ecosystems. This material decomposes slowly(Harmon et al. 1986) and influences a variety of ecosys-tem processes over long time periods. This materialprovides important habitat for a diversity of forestspecies and is a source of considerable amounts ofcarbon and other elements released into the soil oratmosphere as woody substrates decompose.
Ecologists and forest managers have recognizedthe potential long-term contributions of decomposinglogs to carbon dynamics, nutrient cycling, soil develop-ment, ecosystem productivity, and biotic diversity(Swift 1977, Boddy 1983, Harmon et al. 1986). Theimportance of logs as long-term carbon pools hasgained added significance with the prospects of globalclimate change (Harmon et al. 1990). Hence, manage-.
Accepted 20 May 1997Copyright © ECOGRAPHY 1998ISSN 0906-7590Printed in Ireland - all rights reserved
ment of CWD and factors influencing its turnover inforest ecosystems has become an important componentof forest management (Harmon et al. 1986, Schowalteret al. 1992).
Schowalter (1992) previously reported patterns ofdecomposition among substrates (inner and outer bark,sapwood and heartwood) of decomposing oak logsQuercus spp. across a North American gradient duringthe first two years on the ground. This study wasreplicated at four sites having oaks as major compo-nents in order to represent variation in decompositiondue to site factors. The objective of this paper is tocompare decomposition rates and nutrient contentamong substrates in this cohort of decomposing oaklogs after five years of decomposition in order to com-pare initial and longer term decomposition processes.
ECOGRAPHY 21:1 (19981 3
Materials and methods
This study was replicated (blocked) at four sites acrossa continental gradient. Sites were selected on the basisof oak representation and site commitment for long-term protection. The range of oak species and climaticconditions across sites increased our representation offactors influencing decomposition processes within logs.For example, red oaks typically decompose morerapidly than do white oaks (Scheffer et al. 1949). Weincluded different oak species across a continental gra-dient in order to represent the range of conditions thataffect decomposition of a common genus at a continen-tal scale and thereby maximize our scope of inferencefor evaluating differences in decomposition patternsbetween bark and wood substrates through time at acontinental scale. Replication was insufficient to evalu-ate the effects of oak species or site conditions ondecomposition.
Oregon white oak, Quercus garryana Dougl., wasrepresented at MacDonald Forest (44°37'N, 123°19'W)near Corvallis, Oregon. Mean annual temperature atthis site is 11°C; mean annual precipitation is 110 cm,with 75% occurring as rain between November andMarch. During this study, temperatures averaged 12-13°C, and precipitation declined from 111 cm in 1986to 96 cm in 1987, and remained depressed through1992. Logs were placed under a mixed oak-Douglas-fir,Pseudotsuga menziesii (Mirb.) Franco, canopy on agentle, east-facing slope.
Northern red oak, Q. rubra L., was represented atCedar Creek Natural History Area Long Term Ecolog-ical Research (LTER) site (45°24'N, 93°I2'W) nearBethel, Minnesota. Mean annual temperature is 6°C;mean annual precipitation is 66 cm, with June andAugust the wettest months. During this study, tempera-tures averaged 5-9°C, and precipitation declined from86 cm in 1986 to 58-61 cm in 1987-1989, then in-creased to 106-116 in 1990-1991. Logs were placedunder a mixed hardwood canopy on level ground.
Burr oak, O. macrocarpa Michx. (a white oak), wasrepresented at Konza Prairie LTER (39°05'N, 96°35'W)near Manhatten, Kansas. Mean annual temperature is13°C; mean annual precipitation is 84 cm, with mostrain occurring in late spring. During this study, temper-atures averaged 13-14°C, but precipitation fluctuatedwidely with 107 cm in 1986, 82 cm in 1987, 51 cm in1988, 82 cm in 1989, 90 cm in 1990, 67 cm in 1991 and103 cm in 1992. Logs were placed under a mixedhardwood riparian canopy on level ground.
Chestnut oak, O. prinus L. (a white oak), was repre-sented at Coweeta Hydrologic Laboratory LTER(35°N, 83°30'W) near Franklin, North Carolina. Meanannual temperature is 13°C; mean annual precipitationis 180 cm and is well distributed throughout the year.However, durin g this study, temperatures averaged 12-14°C, but precipitation fluctuated widely with 124-148
cm in 1986-1988, 220-250 cm in 1989-1990, 164 cm in1991 and 204 cm in 1992. Logs were placed under amixed hardwood canopy on a gentle, east-facing slope.
At each site, six logs (25-35 cm diameter, 3 m long)were cut from lower boles of live undiseased trees,growing at or near each site, in early June 1986. Use oflive undiseased trees simulated windthrow mortalityand minimized the influence of initial differences (suchas prior colonization by decay organisms) on subse-quent decomposition (Schowalter et al. 1992). Logswere placed immediately in continuous contact with theforest floor at 1-3 m spacing beneath mature forestcanopies. Logs were numbered and randomly allocatedto destructive sampling after 1, 2, 5, 10, 20, and 30 yr.
Sampling followed methods reported by Schowalter(1992). At the time of log placemen, one 8-cm slice wasremoved from each end of each log. Diameters of outerbark, inner bark, sapwood and heartwood were mea-sured along two perpendicular axes and averaged forcalculation of cross-sectional areas. Two radial wedgeswere cut from each slice and dissected into the foursubstrates. Volume of each substrate was calculatedfrom its dimensions, except for outer bark which wasmeasured by water displacement because of the irregu-larity of the bark surface. Samples were dried at 50°C(to avoid volatilization of organic compounds) andweighed. Dry mass was divided by fresh volume toobtain sample density (Foster and Lang 1982). Thesesamples were ground to pass a 40-mesh screen andanalyzed for lignin, cellulose, and other organic com-pounds using standard acid-detergent digestion (VanSoest 1963), for total Kjeldahl N using autoanalyzertechniques, and for P, S, K, Ca, Na and Mg usinginductively coupled argon plasma (ICAP) spectroscopy(Jones 1977).
At the end of 1, 2 and 5 yr (June each year), thedesignated log at each site was destructively sampled byremoving one 8-cm slice from the middle and one sliceat 0.5 m from each end of the log. Sampled logs wereremoved from the pool of logs for subsequent sam-pling. Samples were treated as above, and substrateswere examined for excavation by insects. Volume ofeach substrate excavated by insects was measured(Zhong and Schowalter 1989).
Decomposition rate of each substrate was calculatedfrom change in substrate density. Density of whole logswas calculated as the sum of substrate volume-weightedmass (substrate density x cross-sectional area x length)divided by log volume. Decomposition rates (k) werecalculated using the formula:
Yt = yoekt
where Y, is initial density and Y, is density at time t.All variables were pooled by site (N = 4) and year
(N = 4) for each substrate. The three logs/site harvestedin yr I, 2 and 5 were removed from the yr 0 samples.Inner bark was not included in the current analyses
4 ECOGRAPHY 21:1 (1998)
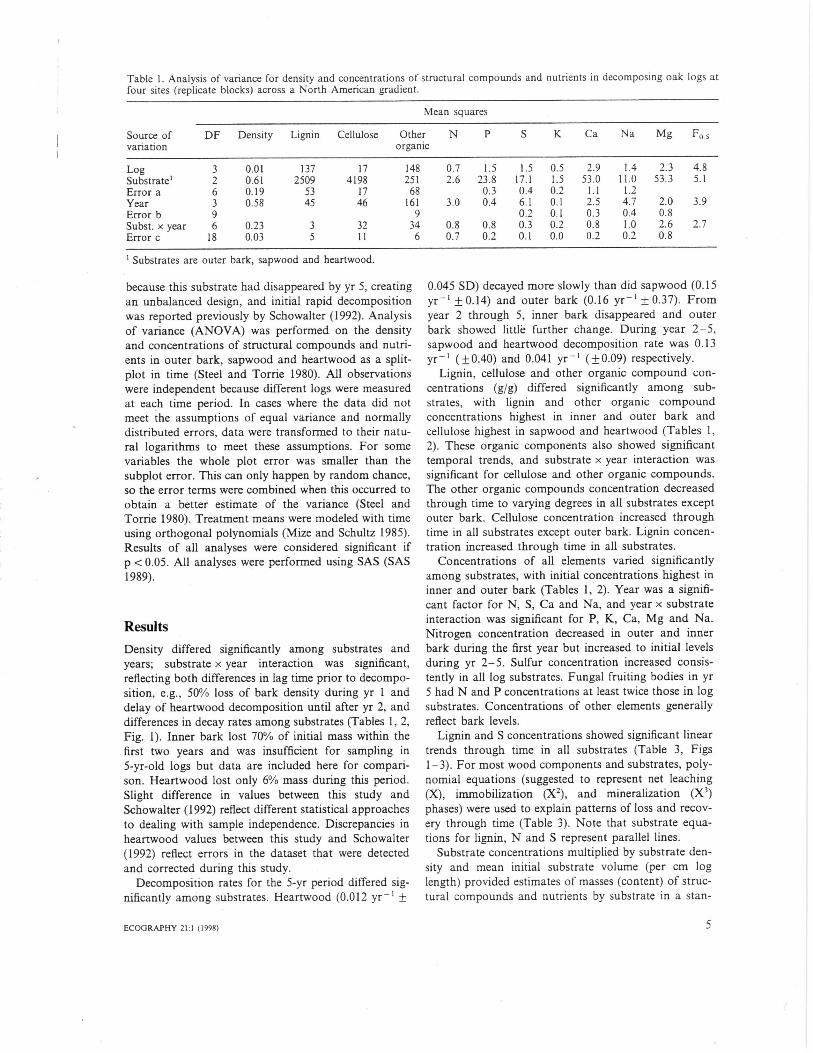
Table 1. Analysis of variance for density and concentrations of structural compounds and nutrients in decomposing oak logs atfour sites (replicate blocks) across a North American gradient.
Mean squares
Source ofvariation
DF Density Lignin Cellulose Otherorganic
N P S K Ca Na Mg Fo,
Log 3 0.01 137 17 148 0.7 1.5 1.5 0.5 2.9 1.4 2.3 4.8Substrate' 2 0.61 2509 4198 251 2.6 23.8 17.1 1.5 53.0 11.0 53.3 5.1Error a 6 0.19 53 17 68 0.3 0.4 0.2 1.1 1.2Year 3 0.58 45 46 161 3.0 0.4 6.1 0.1 2.5 4.7 2.0 3.9Error b 9 9 0.2 0.1 0.3 0.4 0.8Subst. x year 6 0.23 3 32 34 0.8 0.8 0.3 0. 7 0.8 1.0 2.6 2.7Error c 18 0.03 5 11 6 0.7 0.2 0.1 0.0 0.2 0.2 0.8
Substrates are outer bark, sapwood and heartwood.
because this substrate had disappeared by yr 5, creatingan unbalanced design, and initial rapid decompositionwas reported previously by Schowalter (1992). Analysisof variance (ANOVA) was performed on the densityand concentrations of structural compounds and nutri-ents in outer bark, sapwood and heartwood as a split-plot in time (Steel and Torrie 1980). All observationswere independent because different logs were measuredat each time period. In cases where the data did notmeet the assumptions of equal variance and normallydistributed errors, data were transformed to their natu-ral logarithms to meet these assumptions. For somevariables the whole plot error was smaller than thesubplot error. This can only happen by random chance,so the error terms were combined when this occurred toobtain a better estimate of the variance (Steel andTorrie 1980). Treatment means were modeled with timeusing orthogonal polynomials (Mize and Schultz 1985).Results of all analyses were considered significant ifp < 0.05. All analyses were performed using SAS (SAS1989).
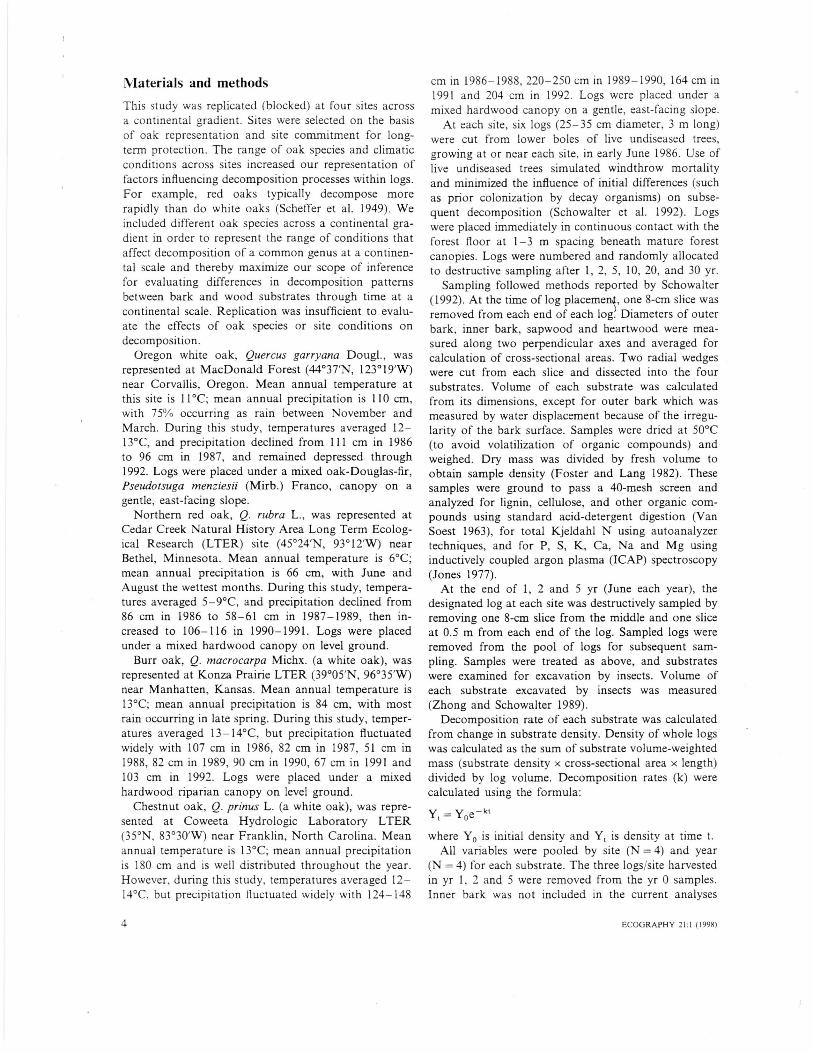
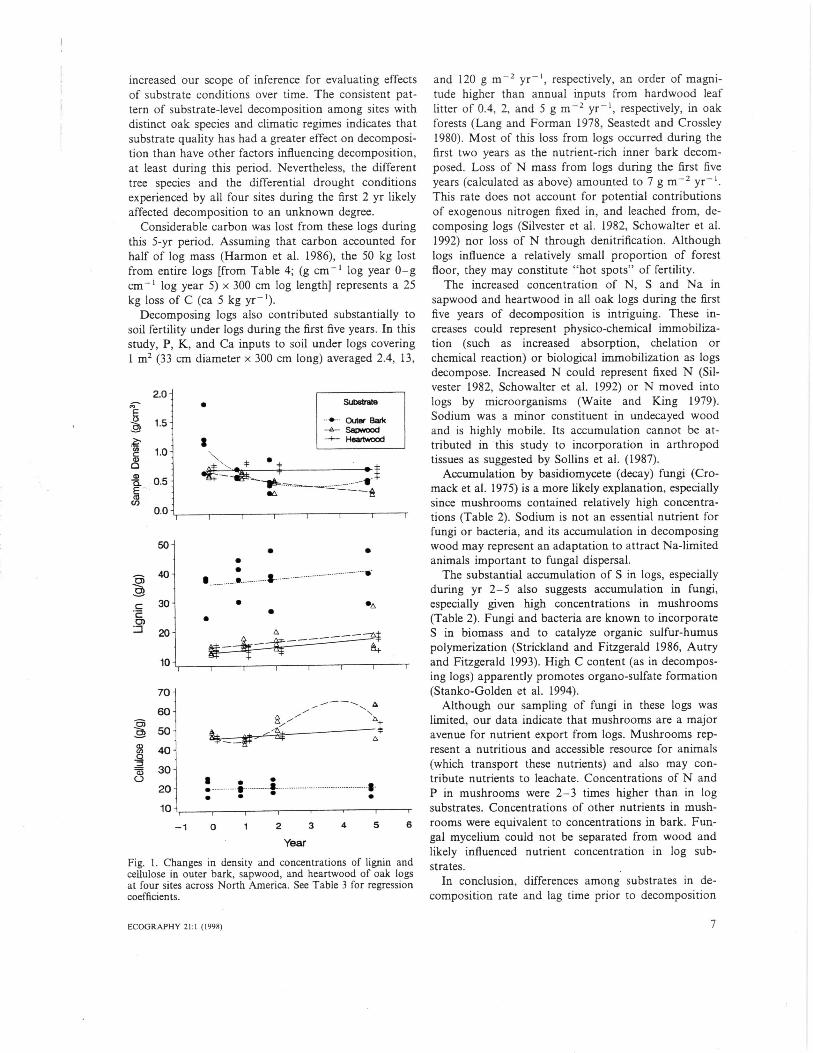
ResultsDensity differed significantly among substrates andyears; substrate x year interaction was significant,reflecting both differences in lag time prior to decompo-sition, e.g., 50% loss of bark density during yr 1 anddelay of heartwood decomposition until after yr 2, anddifferences in decay rates among substrates (Tables 1, 2,Fig. 1). Inner bark lost 70% of initial mass within thefirst two years and was insufficient for sampling in5-yr-old logs but data are included here for compari-son. Heartwood lost only 6% mass during this period.Slight difference in values between this study andSchowalter (1992) reflect different statistical approachesto dealing with sample independence. Discrepancies inheartwood values between this study and Schowalter(1992) reflect errors in the dataset that were detectedand corrected during this study.
Decomposition rates for the 5-yr period differed sig-nificantly among substrates. Heartwood (0.012 yr -1 ±
0.045 SD) decayed more slowly than did sapwood (0.15yr - ± 0.14) and outer bark (0.16 yr -1 ± 0.37). Fromyear 2 through 5, inner bark disappeared and outerbark showed littlë further change. During year 2-5,sapwood and heartwood decomposition rate was 0.13yr - (±0.40) and 0.041 yr- (±0.09) respectively.
Lignin, cellulose and other organic compound con-centrations (g/g) differed significantly among sub-strates, with lignin and other organic compoundconcentrations highest in inner and outer bark andcellulose highest in sapwood and heartwood (Tables 1,2). These organic components also showed significanttemporal trends, and substrate x year interaction wassignificant for cellulose and other organic compounds.The other organic compounds concentration decreasedthrough time to varying degrees in all substrates exceptouter bark. Cellulose concentration increased throughtime in all substrates except outer bark. Lignin concen-tration increased through time in all substrates.
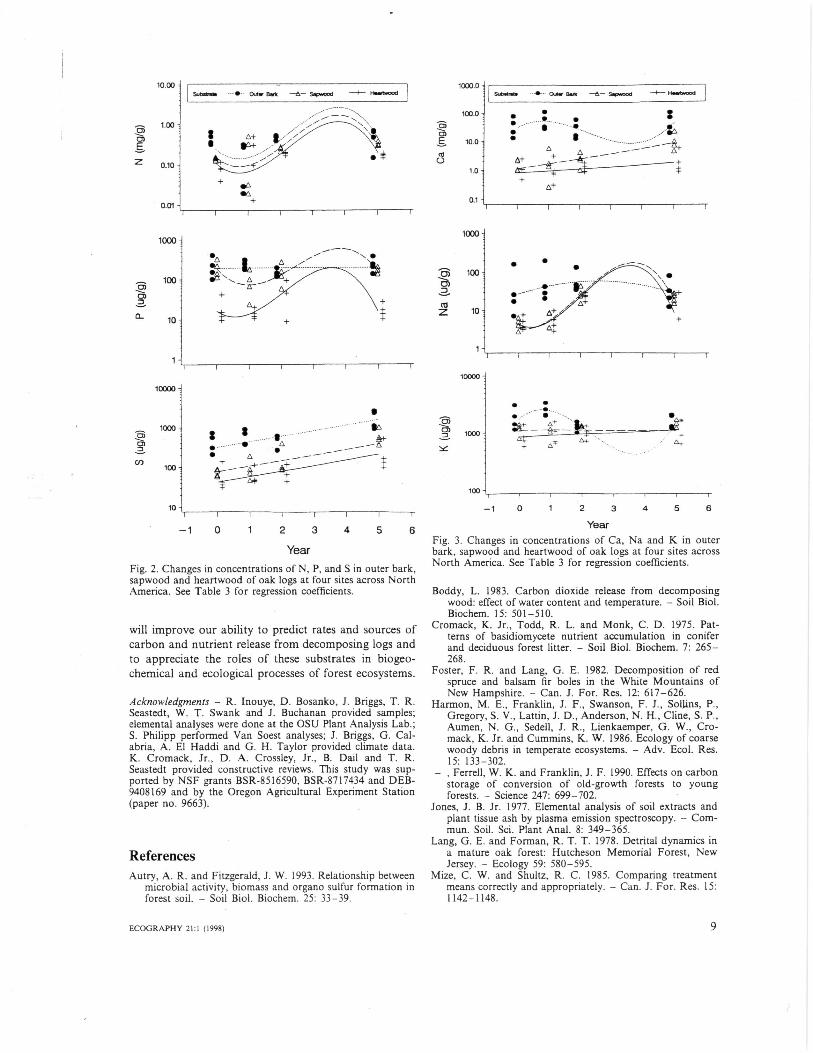
Concentrations of all elements varied significantlyamong substrates, with initial concentrations highest ininner and outer bark (Tables 1, 2). Year was a signifi-cant factor for N, S, Ca and Na, and year x substrateinteraction was significant for P, K, Ca, Mg and Na.Nitrogen concentration decreased in outer and innerbark during the first year but increased to initial levelsduring yr 2-5. Sulfur concentration increased consis-tently in all log substrates. Fungal fruiting bodies in yr5 had N and P concentrations at least twice those in logsubstrates. Concentrations of other elements generallyreflect bark levels.
Lignin and S concentrations showed significant lineartrends through time in all substrates (Table 3, Figs1-3). For most wood components and substrates, poly-nomial equations (suggested to represent net leaching(X), immobilization (X 2), and mineralization (X3)phases) were used to explain patterns of loss and recov-ery through time (Table 3). Note that substrate equa-tions for lignin, N and S represent parallel lines.
Substrate concentrations multiplied by substrate den-sity and mean initial substrate volume (per cm loglength) provided estimates of masses (content) of struc-tural compounds and nutrients by substrate in a stan-
ECOGRAPHY 21:1 (1998) 5
00
00 I00
2 t°
0"no00
nOC.) po
0.
c.e) 00
0- 00ao
cp
0c)
t 00
0
'.77] 00U .0
00 00
QpD
ro'0
,0 '0 N-000 V07 NO-CD CV7 rn CO 00 N rn 00 in 'C in in r- in0 0 Co 0 0 0 0 0 •to. 0 0 ‘CD 00 WI 0
- 0 CT CD 00 ,..C) 00 Q-1 -- 00 eV ,n7 '00, 7- NN 0'
K1 tn^0'0 reiCO cr rn 0, VD. 7.1 7,1 en -■-• ■-•0 0 .0 cz;127 "1700 Ci CV CV N - en
- 00a a .rn -71. CV -- 00a. 0 eV or ,0 (-,1 YCr,,40 en ken or I-- 0 r
000000.x.000000000CV 7 00 en: -tco '0 ry 7 4-, co CV rn 7/. en7/.•-■ .N...c:, 0 0 c:, 0 0 0 0 0 0 0 0 0 0 CD0 0 0 0 0 0 0 0 0 0 0 r- oo ao O inCV 0 eN en CO 0101 NO
0000000 00.. 000r- CD, nt ,n ,n •-■ CD CTr.V 00 •-• ,n 71.I--0 0 0 0 CD 0 CD 7 CD 0 0 CV r1
CV O r- co co r- O r- ,10 rta v-t7 v.-, 7 00 7 ,C) ,f; N in
rn rr) rn o to 7 CT 79Cr, -- 00 en CT ,C) 00 - r-co co O co 0 0 0 0 rq 0 0 0 7 0 r-C-V rn ,nrnookn ,nOCT 4-1 ‘.0CV N- CV en ■-• 00
to ,n 00 - tr, rn rl CV (V (V,71 O rs4 CD CD cl CD CD 0 rY 0 0 rn
r- r- co 0 rn rn rn 00 cf. r--</- in t n r‘i 7- N N rn 0 CV N -
0000CD CD CD CD CD CD CD CD CD 0 CD CD CD 06 6 6 6 6 6 6 6 6 6 6 6 6 6 6cl rn "1 0001 71- 0001Cr,7 TY- 7 7 to 7 7 r1 r1 r1 N <I.6 6 6 6 6 6 6 6 6 6 6 6 6 6 6
■-■0 CD 0 CD CD CD 0 0 0 0 0 0 0 c=:,6 6 6 6 6 6 6 6 6 6 6 6 0 0 6
vz;7t-6 6 cC 6 6 6 6 6 6 6 6 6 6 <6 6
1D 1001 ?1700 7--N0 0 CZ CZ 0 0 0 CD CD CD 0 CD 0 CD 06 6 6 6 6 6 6 6 6 6 6 6 6 6 6700 00 ,c cr, •7/- .cr
6 6 0 © 6 6 6 6 6 6 6 6 6 6 6
0 0 0- - 0 ©6 6 6 6 6 6 6 6 6 6 6 6 6 6 600 iN 01 ry iN N co. rn cr1 iN 00.- M"ar. tr, Q 1 7 t-4 10 t n 7 c-,1 10 10 r--; 6 ci 6 6 6 6 6 6 6 6 c:; 6 6 c;
,n Cs1 7,1 Ln •-•
0
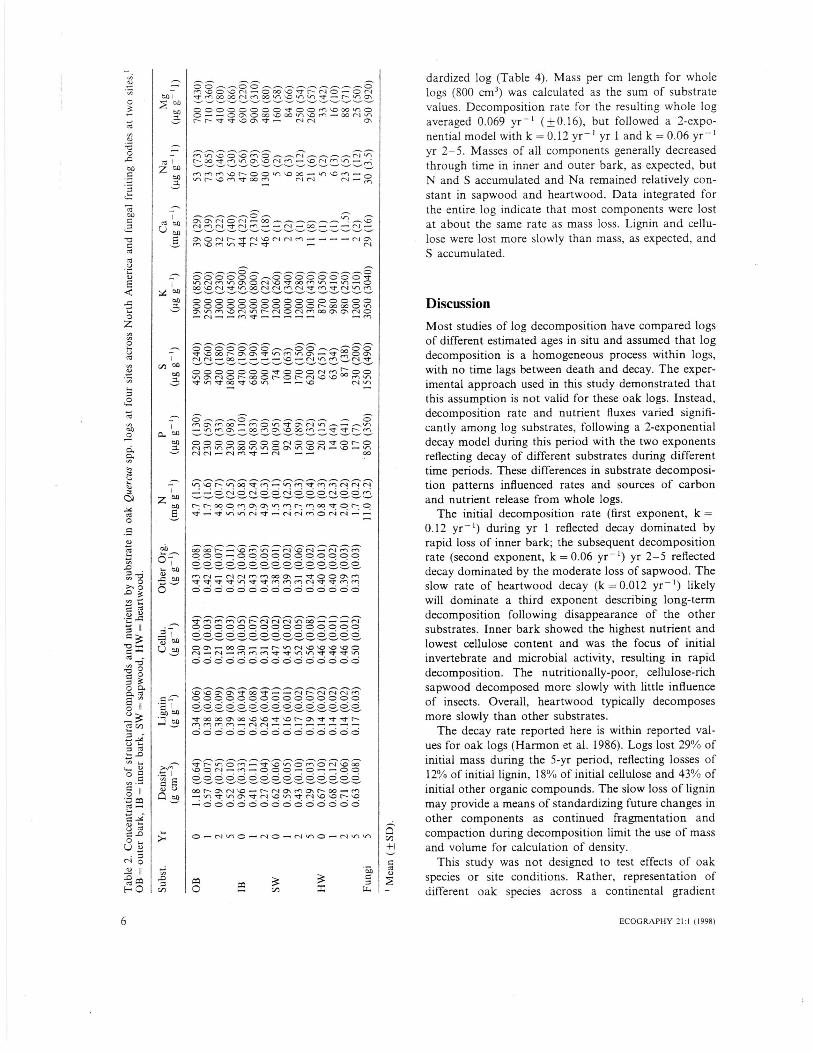
dardized log (Table 4). Mass per cm length for wholelogs (800 cm') was calculated as the sum of substratevalues. Decomposition rate for the resulting whole logaveraged 0.069 yr - ( +0.16), but followed a 2-expo-nential model with k = 0.12 yr-' yr 1 and k = 0.06 yr-1yr 2-5. Masses of all components generally decreasedthrough time in inner and outer bark, as expected, butN and S accumulated and Na remained relatively con-stant in sapwood and heartwood. Data integrated forthe entire log indicate that most components were lostat about the same rate as mass loss. Lignin and cellu-lose were lost more slowly than mass, as expected, andS accumulated.
Discussion
Most studies of log decomposition have compared logsof different estimated ages in situ and assumed that logdecomposition is a homogeneous process within logs,with no time lags between death and decay. The exper-imental approach used in this study demonstrated thatthis assumption is not valid for these oak logs. Instead,decomposition rate and nutrient fluxes varied signifi-cantly among log substrates, following a 2-exponentialdecay model during this period with the two exponentsreflecting decay of different substrates during differenttime periods. These differences in substrate decomposi-tion patterns influenced rates and sources of carbonand nutrient release from whole logs.
The initial decomposition rate (first exponent, k =0.12 yr') during yr 1 reflected decay dominated byrapid loss of inner bark; the subsequent decompositionrate (second exponent, k = 0.06 yr -1 ) yr 2-5 reflecteddecay dominated by the moderate loss of sapwood. Theslow rate of heartwood decay (k = 0.012 yr') likelywill dominate a third exponent describing long-termdecomposition following disappearance of the othersubstrates. Inner bark showed the highest nutrient andlowest cellulose content and was the focus of initialinvertebrate and microbial activity, resulting in rapiddecomposition. The nutritionally-poor, cellulose-richsapwood decomposed more slowly with little influenceof insects. Overall, heartwood typically decomposesmore slowly than other substrates.
The decay rate reported here is within reported val-ues for oak logs (Harmon et al. 1986). Logs lost 29% ofinitial mass during the 5-yr period, reflecting losses of12% of initial lignin, 18% of initial cellulose and 43% ofinitial other organic compounds. The slow loss of ligninmay provide a means of standardizing future changes inother components as continued fragmentation andcompaction during decomposition limit the use of massand volume for calculation of density.
This study was not designed to test effects of oakspecies or site conditions. Rather, representation ofdifferent oak species across a continental gradient
6 EcoGRApipt 21:1 (1998)
2.0 -
increased our scope of inference for evaluating effectsof substrate conditions over time. The consistent pat-tern of substrate-level decomposition among sites withdistinct oak species and climatic regimes indicates thatsubstrate quality has had a greater effect on decomposi-tion than have other factors influencing decomposition,at least during this period. Nevertheless, the differenttree species and the differential drought conditionsexperienced by all four sites during the first 2 yr likelyaffected decomposition to an unknown degree.
Considerable carbon was lost from these logs duringthis 5-yr period. Assuming that carbon accounted forhalf of log mass (Harmon et al. 1986), the 50 kg lostfrom entire logs [from Table 4; (g cm' log year 0-gcm -1 log year 5) x 300 cm log length] represents a 25kg loss of C (ca 5 kg yr - I).
Decomposing logs also contributed substantially tosoil fertility under logs during the first five years. In thisstudy, P, K, and Ca inputs to soil under logs covering1 m2 (33 cm diameter x 300 cm long) averaged 2.4, 13,
Substrate
Cuter BarkSapwood
--1-- Heartwood
0.0
-63
cto
50-
40
30 -•
......
••
•
..........
•
...................
et,•
20 -
10
70
15360
fr
-a 50a)ca 40
30111
20 •• • •
10
0 1 2 3 4 5 6
YearFig. I. Changes in density and concentrations of lignin andcellulose in outer bark, sapwood, and heartwood of oak logsat four sites across North America. See Table 3 for regressioncoefficients.
and 120 g m -2 yr - ', respectively, an order of magni-tude higher than annual inputs from hardwood leaflitter of 0.4, 2, and 5 g yr-', respectively, in oakforests (Lang and Forman 1978, Seastedt and Crossley1980). Most of this loss from logs occurred during thefirst two years as the nutrient-rich inner bark decom-posed. Loss of N mass from logs during the first fiveyears (calculated as above) amounted to 7 g M -2 yr'.This rate does not account for potential contributionsof exogenous nitrogen fixed in, and leached from, de-composing logs (Silvester et al. 1982, Schowalter et al.1992) nor loss of N through denitrification. Althoughlogs influence a relatively small proportion of forestfloor, they may constitute "hot spots" of fertility.
The increased concentration of N, S and Na insapwood and heartwood in all oak logs during the firstfive years of decomposition is intriguing. These in-creases could represent physico-chemical immobiliza-tion (such as increased absorption, chelation orchemical reaction) or biological immobilization as logsdecompose. Increased N could represent fixed N (Sil-vester 1982, Schowalter et al. 1992) or N moved intologs by microorganisms (Waite and King 1979).Sodium was a minor constituent in undecayed woodand is highly mobile. Its accumulation cannot be at-tributed in this study to incorporation in arthropodtissues as suggested by Sollins et al. (1987).
Accumulation by basidiomycete (decay) fungi (Cro-mack et al. 1975) is a more likely explanation, especiallysince mushrooms contained relatively high concentra-tions (Table 2). Sodium is not an essential nutrient forfungi or bacteria, and its accumulation in decomposingwood may represent an adaptation to attract Na-limitedanimals important to fungal dispersal.
The substantial accumulation of S in logs, especiallyduring yr 2-5 also suggests accumulation in fungi,especially given high concentrations in mushrooms(Table 2). Fungi and bacteria are known to incorporateS in biomass and to catalyze organic sulfur-humuspolymerization (Strickland and Fitzgerald 1986, Autryand Fitzgerald 1993). High C content (as in decompos-ing logs) apparently promotes organo-sulfate formation(Stanko-Golden et al. 1994).
Although our sampling of fungi in these logs waslimited, our data indicate that mushrooms are a majoravenue for nutrient export from logs. Mushrooms rep-resent a nutritious and accessible resource for animals(which transport these nutrients) and also may con-tribute nutrients to leachate. Concentrations of N andP in mushrooms were 2-3 times higher than in logsubstrates. Concentrations of other nutrients in mush-rooms were equivalent to concentrations in bark. Fun-gal mycelium could not be separated from wood andlikely influenced nutrient concentration in log sub-strates.
In conclusion, differences among substrates in de-composition rate and lag time prior to decomposition
•
ECOGRAPHY 21:1 (1998) 7
0.094 -0.60-0.16
0.890.890.89
8.8 -100.88
1.39 -1.67
1.39 -1.67
1.39 -1.67
1.29 -2.04
1.27 -1.230.320.320.32
-1.05 1.380.410.16
-0.12 0.60
1.10 -0.46
1.38 -1.01
-0.89 1.09
0.06
0.001-0.46
0.67361513204745
-1.36-1.81
2.17193
5.212.785.764.353.75
10.37.046.733.301.231.477.45
11046.74
Density
Lignin
Cellulose
Ln N
Ln P
Ln S
Ln Ca
Ln Na
Ln K
OBSWHWOBSWHWOBSWHWOBSW
HWOBSWHWOBSWHWOBSWHWOBSWHWOBSWHW
1.3
-0.210.21
-0.21
-0.190.21
0.16
-0.19-0.23
0.13
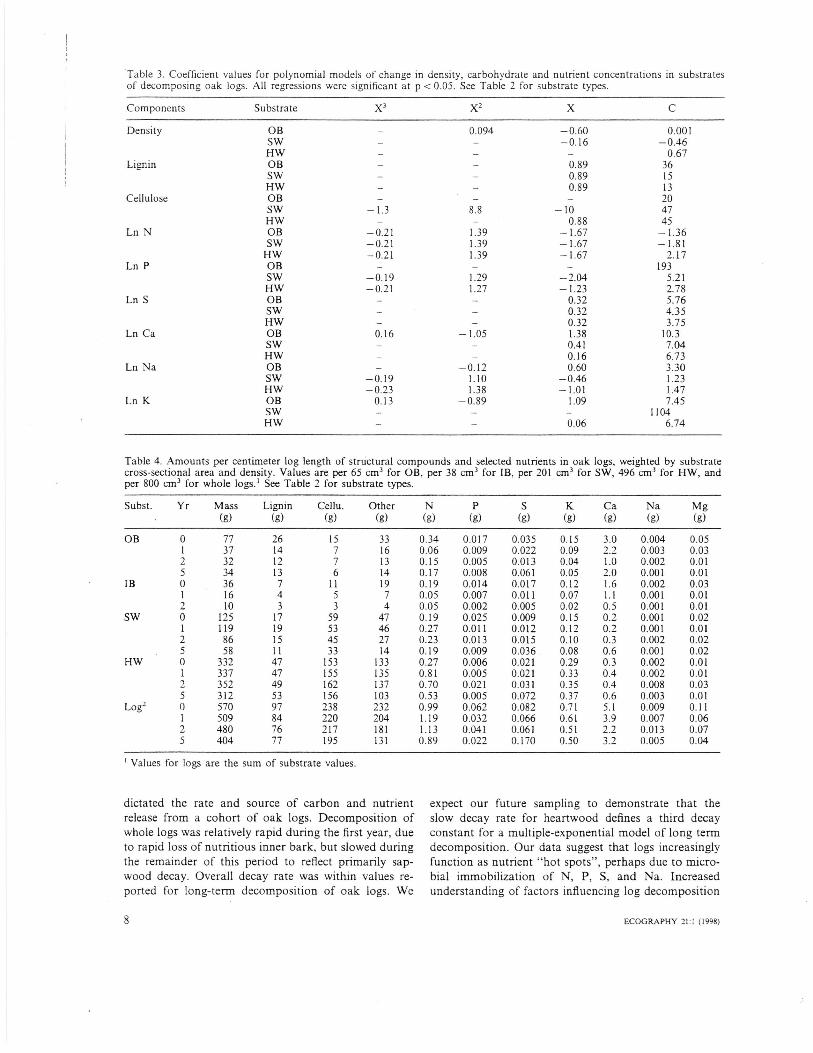
Table 4. Amounts per centimeter log length of structural compounds and selected nutrients in oak logs, weighted by substratecross-sectional area and density. Values are per 65 cm 3 for OB, per 38 cm 3 for IB, per 201 cm 3 for SW, 496 cm 3 for HW, andper 800 cm 3 for whole logs) See Table 2 for substrate types.
Subst. Yr Mass Lignin Cellu. Other N
K Ca Na Mg(g) (g)
(g) (g)
(g)
(g) (g)
(g) (g) ( g) (g)
OB 0 77
26
15
33
0.34
0.017
0.035
0.15
3.0
0.004 0.05
1 37 14
7
16
0.06
0.009
0.022
0.09
2.2
0.003
0.032 32
12
7
13
0.15
0.005
0.013
0.04
1.0
0.002
0.015 34
13
6
14
0.17
0.008
0.061
0.05
2.0
0.001
0.01IB 0 36
7
11
19
0.19
0.014
0.017
0.12 1.6
0.002
0.031 16
4
5
7 0.05
0.007
0.011
0.07
1.1
0.001
0.012 10
3
3
4
0.05
0.002
0.005
0.02
0.5
0.001
0.01SW 0 125
17
59
47
0.19
0.025
0.009
0.15
0.2
0.001
0.021 119
19
53
46
0.27
0.011
0.012
0.12
0.2
0.001
0.012 86
15
45 27 0.23
0.013
0.015
0.10
0.3
0.002
0.025 58
11
33
14
0.19
0.009
0.036
0.08
0.6
0.001
0.02HW 0 332
47
153
133
0.27
0.006
0.021
0.29
0.3
0.002
0.011 337 47
155
135
0.81
0.005
0.021
0.33
0.4
0.002
0.012 352
49
162
137
0.70
0.021
0.031
0.35
0.4
0.008
0.035 312
53
156
103
0.53
0.005
0.072
0.37
0.6
0.003
0.01Log' 0 570
97
238
232
0.99
0.062
0.082
0.71
5.1
0.009
0.111 509
84
220
204
1.19
0.032
0.066
0.61
3.9
0.007
0.062 480
76
217
181
1.13
0.041
0.061
0.51
2.7
0.013
0.075 404
77
195
131
0.89
0.022
0.170
0.50
3.2
0.005
0.04
Table 3. Coefficient values for polynomial models of change in density, carbohydrate and nutrient concentrations in substratesof decomposing oak logs. All regressions were significant at p < 0.05. See Table 2 for substrate types.
Components Substrate X3 x2
Values for logs are the sum of substrate values.
dictated the rate and source of carbon and nutrientrelease from a cohort of oak logs. Decomposition ofwhole logs was relatively rapid during the first year, dueto rapid loss of nutritious inner bark, but slowed duringthe remainder of this period to reflect primarily sap-wood decay. Overall decay rate was within values re-ported for long-term decomposition of oak logs. We
expect our future sampling to demonstrate that theslow decay rate for heartwood defines a third decayconstant for a multiple-exponential model of long termdecomposition. Our data suggest that logs increasinglyfunction as nutrient "hot spots", perhaps due to micro-bial immobilization of N, P, S, and Na. Increasedunderstanding of factors influencing log decomposition
8 ECOGRAPHY 21:1 (1998)
10.00
1.00 -ci
E
0.10 -
--------------
------ g+
--+-
2-- -----•
1000
1000.0S.. --•-- Over Bwa Sopapod 4-4— 14aarb000d &wawa. - - 41. lama Sark Sapwood —4-- Haewood
100.0
1.0 -
•------- -v.. -
••
A+A
—
A+
0.01-T
-1 0 1 2 3 4 5 6
Year
Fig. 2. Changes in concentrations of N, P, and S in outer bark,sapwood and heartwood of oak logs at four sites across NorthAmerica. See Table 3 for regression coefficients.
will improve our ability to predict rates and sources ofcarbon and nutrient release from decomposing logs andto appreciate the roles of these substrates in biogeo-chemical and ecological processes of forest ecosystems.
Acknowledgments - R. Inouye, D. Bosanko, J. Briggs, T. R.Seastedt, W. T. Swank and J. Buchanan provided samples;elemental analyses were done at the OSU Plant Analysis Lab.;S. Philipp performed Van Soest analyses; J. Briggs, G. Cal-abria, A. El Haddi and G. H. Taylor provided climate data.K. Cromack, Jr., D. A. Crossley, Jr., B. Dail and T. R.Seastedt provided constructive reviews. This study was sup-ported by NSF grants BSR-8516590, BSR-8717434 and DEB-9408169 and by the Oregon Agricultural Experiment Station(paper no. 9663).
ReferencesAutry, A. R. and Fitzgerald. J. W. 1993. Relationship between
microbial activity, biomass and organo sulfur formation inforest soil. - Soil Biol. Biochem. 25: 33-39.
0.1
10000
••
_____________—Ile__g,, — ____ +
100
-1 0 1 2 3 4 5 6
YearFig. 3. Changes in concentrations of Ca, Na and K in outerbark, sapwood and heartwood of oak logs at four sites acrossNorth America. See Table 3 for regression coefficients.
Boddy, L. 1983. Carbon dioxide release from decomposingwood: effect of water content and temperature. - Soil Biol.Biochem. 15: 501-510.
Cromack, K. Jr., Todd, R. L. and Monk, C. D. 1975. Pat-terns of basidiomycete nutrient accumulation in coniferand deciduous forest litter. - Soil Biol. Biochem. 7: 265-268.
Foster, F. R. and Lang, G. E. 1982. Decomposition of redspruce and balsam fir boles in the White Mountains ofNew Hampshire. - Can. J. For. Res. 12: 617-626.
Harmon, M. E., Franklin, J. F., Swanson, F. J., Sollins, P.,Gregory, S. V., Lattin, J. D., Anderson, N. H., Cline, S. P.,Aumen, N. G., Sedell, J. R., Lienkaemper, G. W., Cro-mack, K. Jr. and Cummins, K. W. 1986. Ecology of coarsewoody debris in temperate ecosystems. - Adv. Ecol. Res.15: 133-302.
- , Ferrell, W. K. and Franklin, J. F. 1990. Effects on carbon
storage of conversion of old-growth forests to youngforests. - Science 247: 699-702.
Jones, J. B. Jr. 1977. Elemental analysis of soil extracts andplant tissue ash by plasma emission spectroscopy. - Corn-mun. Soil. Sci. Plant Anal. 8: 349-365.
Lang, G. E. and Forman, R. T. T. 1978. Detrital dynamics ina mature oak forest: Hutcheson Memorial Forest, NewJersey. - Ecology 59: 580-595.
Mize, C. W. and Shultz, R. C. 1985. Comparing treatmentmeans correctly and appropriately. - Can. J. For. Res. 15:1142-1148.
0)
3
A-
0)0)
Cl)
1000
100
10
1
10000
1000
100
10
1000
Y
ECOGRAPHY 21:1 (1998) 9
SAS 1989. SAS/STAT User's Guide, Ver. 6, Fourth Ed., Vol.2. - SAS Inst., Cary, NC.
Scheffer, T. C., Englerth, G. H. and Duncan, C. G. 1949.Decay resistance of seven native oaks. - J. Agric. Res. 78:129-152.
Schowalter, T. D. 1992. Heterogeneity of decomposition andnutrient dynamics of oak (Quercus) logs during the firsttwo years of decomposition. - Can. J. For. Res. 22:161-166., Caldwell, B. A., Carpenter, S. E., Griffiths, R. P., Har-mon, M. E., Ingham, E. R., Kelsey, R. G., Lattin, J. D.and Moldenke, A. R. 1992. Decomposition of fallen trees:effects of initial conditions and heterotroph colonizationrates. - In: Singh, K. P. and Singh, V. S. (eds), Tropicalecosystems: ecology and management. Wiley, pp. 371-381.
Seastedt, T. R. and Crossley, D. A. Jr. 1980. Effects ofmicroarthropods on the seasonal dynamics of nutrients inforest litter. - Soil Biol. Biochem. 12: 337-342.
Silvester, W. B., Sollins, P., Verhoeven, T. and Cline, S. P.1982. Nitrogen fixation and acetylene reduction in decay-ing conifer boles: effects of incubation time, aeration, andmoisture content. - Can. J. For. Res. 12: 646-652.
Sollins, P., Cline, S. P., Verhoeven, R., Sachs, D. and Spycher,
G. 1987. Patterns of log decay in old-growth Douglas-firforests. - Can. J. For. Res. 17: 1585-1595.
Stanko-Golden, K. M., Swank, W. T. and Fitzgerald, J. W.1994. Factors affecting sulfate absorption, organic sulfurformation, and mobilization in forest land, grasslandspadosols. - Biol. Fert. Soils 17: 289-296.
Steel, R. G. D. and Tonic, J. H. 1980. Principles and proce-dures of statistics: a biometrical approach, 2nd ed. -McGraw-Hill.
Strickland, T. C. and Fitzgerald, J. W. 1986. Organosulfurrecalcitrance in soil and litter from a hardwood forest. -Soil Biol. Biochem. 18: 661-662.
Swift, M. J. 1977. The ecology of wood decomposition. - Sci.Prog. 64: 175-199.
Van Soest, P. J. 1963. Use of detergents in the analysis offibrous feeds. II. A rapid method for the determinationof fiber and lignin. - J. Ass. Off. Agric. Chem. 46: 829-835.
Waite, J. and King, B. 1979. Total nitriogen balances of woodin soil. - Mat. Org . 14: 27-41.
Zhong, H. and Schowalter, T. D. 1989. Conifer bole utiliza-tion by wood-boring beetles in western Oregon. - Can. J.For. Res. 19: 943-947.
10 ECOGRAPHY 21:1 (1998)