Embed Size (px)
Citation preview
nature geoscience | VOL 4 | FEBRUARY 2011 | www.nature.com/naturegeoscience 71
news & views
Meltwater from glaciers and ice caps contributes significantly to global sea-level rise, along with
ice discharge from tidewater glaciers. However, the present and future amplitude of these contributions is uncertain, because global information about glacier locations and sizes is still incomplete, and because projections of future climate change are highly variable. Simplified approaches to model the sea-level rise contribution from glaciers and ice caps by the end of the twenty-first century1–3 on a global scale have resulted in large discrepancies, ranging from 0.05 to 0.24 m. Writing in Nature Geoscience, Radić and Hock4 present a new modelling approach that gives a value of 0.124 ± 0.037 m for sea-level rise, by explicitly considering glacier inventory data for more than 122,000 individual glaciers and ice caps5 as well as spatially resolved projections of future climate change from ten different global climate models.
The potential sea-level rise contribution of all glaciers and ice caps amounts to about 0.5 m. This may seem little, compared with the two ice sheets in Greenland and Antarctica, which host enough ice to raise sea level by 7 m and 60 m, respectively6. However, the impacts of a few decimetres of rise could still be significant for low-lying coastal regions, and the water stored in glaciers and ice caps can be released on much shorter timescales. For the latter reason, rising sea level from glaciers and ice caps is expected to dominate eustatic sea-level rise in the coming decades2. Furthermore, changes in this water resource can affect society directly, for example, in terms of hydropower production, irrigation, glacier-related natural hazards, or river navigation. It is thus of utmost importance to calculate glacier mass changes accurately, and on a regional scale.
Glaciers are nourished by snowfall and they lose mass by melt and partly also by calving icebergs. Any calculations of their future development require robust
information about future temperature and precipitation, resolved on seasonal and regional scales and valid over mountainous terrain. These requirements alone are difficult to fulfil with present global climate models. Yet there is another problem causing large uncertain ties in the related calculations: the lack of a complete and sufficiently accurate database of glaciers and ice caps. Several datasets in a variety of formats are available and have been used in the past1,3, but they are either spatially incomplete in parts of the world or they are too coarse to allow spatially resolved calculations. Robust ways of spatially inter- and extrapolating the missing data are therefore essential for global assessments of the sea-level rise contribution from glaciers and ice caps.
Radić and Hock4 solved these difficulties in a number of innovative steps. They calculated mass balance explicitly
for each of the roughly 122,000 glaciers and ice caps that are listed with their minimum and maximum elevation in the extended format of the World Glacier Inventory (WGI-XF)5. They then applied the projections from ten different global climate models to a macroscopic glacier-response model that explicitly considers the shrinking area of glaciers and ice caps in the future. They also determined an error budget for their calculations to account for the large range of processes that were not considered in their simplified glacier-response model. For model calibration, they used measured seasonal mass-balance records from different parts of the world and linked them statistically to a number of climate parameters. The resulting set of regression equations — expressing a relationship between glacier mass balance and climate — can be applied worldwide and also to future
Sea-level riSe
Melting glaciers and ice capsThe contribution of glaciers and ice caps to global sea-level rise is uncertain: they are incompletely counted and the calculation is challenging. A new estimate from the best available data suggests a contribution of about 12 cm by 2100.
Frank Paul
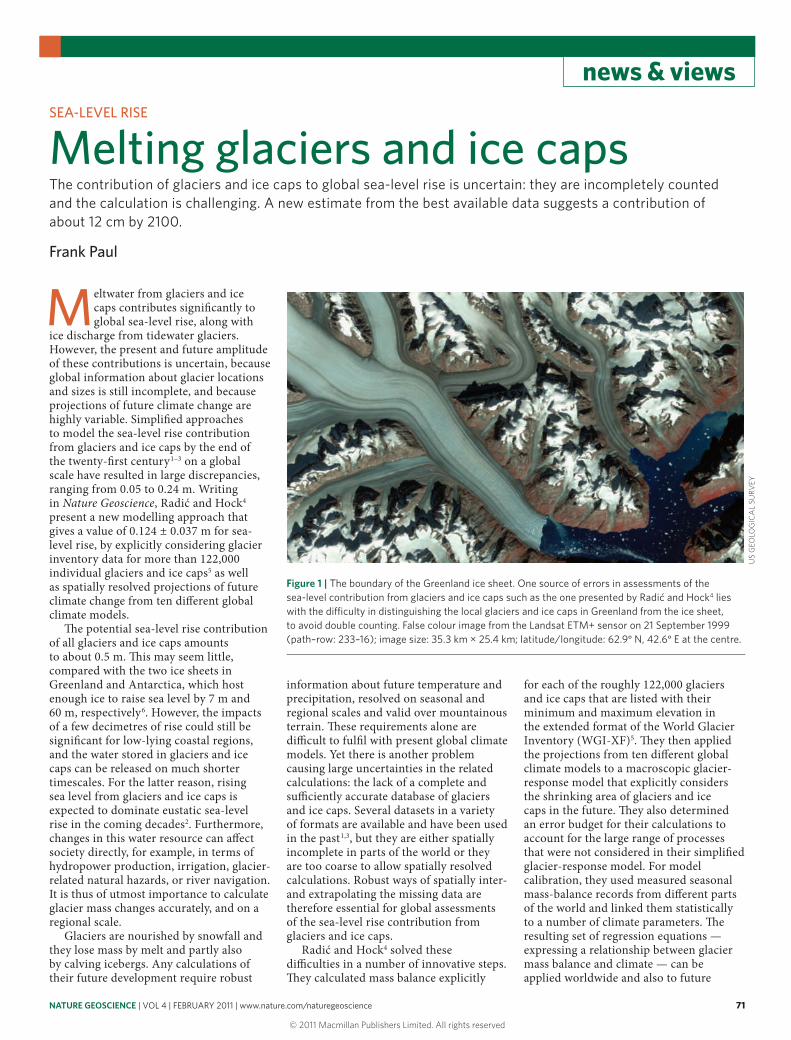
Figure 1 | The boundary of the Greenland ice sheet. One source of errors in assessments of the sea-level contribution from glaciers and ice caps such as the one presented by Radić and Hock4 lies with the difficulty in distinguishing the local glaciers and ice caps in Greenland from the ice sheet, to avoid double counting. False colour image from the Landsat ETM+ sensor on 21 September 1999 (path–row: 233–16); image size: 35.3 km × 25.4 km; latitude/longitude: 62.9° N, 42.6° E at the centre.
US
GEO
LOG
ICA
L SU
RVEY
ngeo_N&V_FEB11.indd 71 20/1/11 14:35:14
© 2011 Macmillan Publishers Limited. All rights reserved
72 nature geoscience | VOL 4 | FEBRUARY 2011 | www.nature.com/naturegeoscience
news & views
climate conditions. With this approach, Radić and Hock circumvent the problem that measured mass balances are not necessarily representative for entire mountain ranges7.
Given the shortcomings in the available data and the required simplifications in their modelling approach, the study is unlikely to be the final word. In their regionally resolved calculations, according to Radić and Hock, the largest contributions to sea-level rise originate in Arctic Canada, Alaska and the Antarctic Peninsula — where the gaps in glacier data are most severe and the differences between the various climate models are largest. Uncertainties in the extrapolated glacier response for these regions are therefore high. Furthermore, several processes that were not considered, including ice loss by iceberg calving, the replacement of ice below sea level by ocean water or the delay in runoff from ice and firn that is entirely or partly cold, are particularly prominent in these regions.
To assess these factors more accurately, glacier inven tory data that
include topographic information such as the minimum and maxium altitude are urgently needed1–3,7. Automated classification of freely available satellite data and application of geoinformatic tech niques for rapid data processing and analyses8 can help to accomplish a large part of this work within the next few years. Moreover, currently pending problems such as the separation of Greenland’s local glaciers and ice caps from its ice sheet (Fig. 1) — important to avoid double counting their sea-level rise contribution — can hopefully be solved once these inventory data are available.
Radić and Hock also report a volume loss of 75 ± 15% for glaciers in the Alps by the end of the twenty-first century, in line with earlier work9. This highlights the importance of modelling the future development of these comparably small glaciers. Although their influence on sea-level rise is limited, these Alpine glaciers constitute an important water resource on local to regional scales.
The quantitative estimates presented by Radić and Hock4 will need to be updated
as more and better glacier data and climate models become available. But in the light of their analysis, and considering potential positive feedbacks, there is little doubt that the fate of glaciers and ice caps looks gloomy on the century timescale, even in the more strongly glacierized regions of the world. ❐
Frank Paul is at the University of Zurich, Winterthurerstr. 190, 8057 Zurich, Switzerland. e-mail: [email protected]
references1. Raper, S. C. B. & Braithwaite, R. J. Nature 439, 311–313 (2006).
2. Meier, M. F. et al. Science 317, 1064–1067 (2007).
3. Hock, R., de Woul, M., Radić, V. & Dyurgerov, M.
Geophys. Res. Lett. 36, L07501 (2009).4. Radić, V. & Hock, R. Nature Geosci. 4, 91–94 (2011).
5. Cogley, J. G. Ann. Glaciol. 50, 32–38 (2009).
6. Lemke, P. et al. in IPCC Climate Change 2007: The Physical Science
Basis (eds Solomon, S. et al.) Ch. 4 (Cambridge Univ. Press, 2007).
7. Kaser, G., Cogley, J. G., Dyurgerov, M. B., Meier, M. F. &
Ohmura, A. Geophys. Res. Lett. 33, L19501 (2006).
8. Paul, F., Kääb, A., Maisch, M., Kellenberger, T. W. & Haeberli, W.
Ann. Glaciol. 34, 355–361 (2002).
9. Zemp, M., Haeberli, W., Hoelzle, M. & Paul, F. Geophys. Res. Lett.
33, L13504 (2006).
During the Great Oxidation Event about 2.4 billion years ago, the surface of the Earth tipped irrevocably into an oxygenated state, as free molecular oxygen began to accumulate in the oceans and atmosphere. But the first whiffs of oxygen began to appear at least 300 million years earlier, as organisms capable of producing the gas through photosynthesis evolved. As the Earth’s chemistry changed, so too must have the microbes that lived on its surface. But the rock record leaves only hints of the ecosystem, primarily in the form of isotopic fractionation of the elements — including iron and sulphur — that presumably fuelled the bacteria.
To assess the evolution of these metabolisms, Lawrence David and Eric Alm of the Massachusetts Institute of Technology looked to the genetics of extant organisms. They re-examined existing gene families using a technique that accounts for both the evolution of new genes, and the transfer of genes between different species
Old genesevOlutiOn
© N
PG
(Nature 469, 93–96; 2011). They identified a narrow window of genetic expansion between about 3.3 and 2.8 billion years ago, which they call the Archaean expansion.
During this period, almost 27% of the largest modern gene families arose. Perhaps unsurprisingly, given the geochemical upset at the time, most of the genes that evolved are associated with metabolism. Gene groups involved in the binding of iron, sulphur and oxygen were
particularly expanded, as were others that used
metabolites produced by respiration.
The earliest metabolic genes identified within the Archaean expansion were probably used in anaerobic respiration, and also in oxygen- and non-oxygen-producing photosynthesis. David and Alm suggest that these genes may have later contributed to aerobic respiration pathways, as well.
Intriguingly, the expansion of genes associated with molybdenum and copper utilization coincides with the increasing availability of these elements in the oceans,
as predicted by geochemical models and observations. It seems that microbes were adaptable, and
quickly able to evolve pathways to use these elements as they became available.
alicia newtOn
ngeo_N&V_FEB11.indd 72 20/1/11 14:35:15
© 2011 Macmillan Publishers Limited. All rights reserved