Embed Size (px)
Citation preview

Scotiabank Europe plc Capital and Risk Management Pillar 3 Disclosures as at 31 October 2016
1
Scotiabank Europe plc
Capital and Risk Management
Pillar 3 Disclosures
As at 31 October 2016

Scotiabank Europe plc Capital and Risk Management Pillar 3 Disclosures as at 31 October 2016
2
TABLE OF CONTENTS
No. Section Page
1 INTRODUCTION 3
1.1 Background 3
1.2 Scope 3
1.3 Principal activities 4
1.4 Business strategy 4
1.5 Governance – Board and Committees 5
1.6 Policy 9
1.7 Future developments 9
2 RISK MANAGEMENT OBJECTIVES AND POLICIES 10
2.1 Risk management framework 10
2.2 Credit and counterparty credit risk 11
2.3 Liquidity risk 16
2.4 Market risk 17
2.5 Operational risk 20
2.6 Board Risk Management Declaration 22
2.7 Board Approved Risk Statement 22
3 CAPITAL ADEQUACY 24
3.1 Internal capital adequacy assessment 24
3.2 Capital requirements 25
4 CAPITAL RESOURCES 26
4.1 Regulatory capital 26
4.2 Reconciliation 29
5 CREDIT AND COUNTERPARTY CREDIT RISK 32
5.1 Use of ECAIs 32
5.2 Credit risk 34
5.3 Counterparty credit risk 38
5.4 Impairment of financial assets 40
5.5 Credit risk mitigation 42
6 CREDIT VALUATION ADJUSTMENT 44
6.1 Derivative assets analysis 44
6.2 Reverse repurchase agreements and other similar secured lending analysis 45
7 SECURITISATION 45
8 MARKET RISK 46
9 OPERATIONAL RISK 47
10 COUNTERCYCLICAL CAPITAL BUFFER 48
11 OTHER RISKS 50
11.1 Interest rate risk on positions not included in the trading book 50
11.2 Equities not included in the trading book 51
12 LEVERAGE 52
13 ASSET ENCUMBERANCE 55
14 REMUNERATION 57
14.1 Qualitative disclosures 57
14.2 Quantitative disclosures 63

Scotiabank Europe plc Capital and Risk Management Pillar 3 Disclosures as at 31 October 2016
3
1 INTRODUCTION
1.1 Background
Scotiabank Europe plc (the “Company”) is subject to legislation issued by the UK government and European Union which
seeks to stabilise and strengthen the UK and EU financial system by ensuring that firms, including the Company, hold
adequate capital to meet the potential impact of the risks to which they are exposed. As part of this capital adequacy
regime, firms are required publicly to disclose specified information (so-called “Pillar 3 disclosures”) to enable market
participants to understand how a firm implements the applicable legislation. This should include an explanation of how it
identifies and quantifies the risks to which it is exposed together with details of how much capital it holds in respect of
these risks.
This document comprises the Company’s Pillar 3 disclosures on capital and risk management as at 31 October 2016. These
disclosures have been prepared purely for the purpose of satisfying the Company’s obligations under the Capital
Requirements Regulation (Regulation (EU) No. 575/2013) (“CRR”), associated implementing legislation and guidelines
issued by the European Banking Authority (“EBA”) and to explain the basis on which the Company has prepared and
disclosed certain capital requirements and information about the management of certain risks. These disclosures are
made for no other purpose and should not be relied upon in making any financial or investment decision.
The Company is authorised by the UK Prudential Regulation Authority (“PRA”) and regulated by the UK Financial Conduct
Authority (“FCA”). The PRA receives information on capital adequacy from, and sets certain capital requirements for, the
Company.
Additional relevant information may be found in the Company’s Annual Report and Accounts 2016.
The Company is a wholly owned subsidiary of The Bank of Nova Scotia (the “Parent”). The Parent, its affiliates and
subsidiaries, including the Company, are collectively referred to as ‘Scotiabank’.
1.2 Scope
These Pillar 3 disclosures are prepared on an unconsolidated / individual basis.

Scotiabank Europe plc Capital and Risk Management Pillar 3 Disclosures as at 31 October 2016
4
1.3 Principal activities
The Company is an “authorised person” under The Financial Services and Markets Act 2000.
The Company is a wholly owned subsidiary of The Bank of Nova Scotia (the “Parent”) a Canadian financial institution. The
Company markets and sells a range of banking products with its target market being large and mid-sized companies, as
well as banks, investment banks, governments and supranational organisations together with asset managers. The
Company generates revenue through the extension of credit to corporate clients, market-making and distribution of
Government bonds, equity financing and base metals trading. Supporting this activity is the treasury department which
prudently manages liquidity exposures and the asset and liability mismatches arising from the Company’s activities.
1.4 Business strategy
The Company’s strategy is aligned with that of the Scotiabank’s Global Banking and Markets (“GBM”) Strategy which is:
“We will grow by enhancing our client focus and will leverage the strengths of our client relationships, our broad-based
platform of products and services, and our people.”
GBM has identified the following business initiatives to support the overall strategy:
Enhance customer focus through a new client segmentation process, identifying our key customers;
Strengthen our Customer Data and Analysis;
Focus on Strategic Sectors, principally Energy, Mining, Infrastructure (including Power and Utilities), and Financial Institutions;
Optimise our return on capital and use of funding, while investing in systems and operational improvements and enhancing our risk and balance sheet management; and
Enhancing our Talent and Leadership by attracting and developing high caliber talent, and building a global leadership team with diverse perspectives.
Further information reflecting the linkage between the Company’s overall risk profile and the business strategy can be
found in the Strategic Report (Page 5 to Page 11) in the Company’s Annual Report and Accounts 2016.

Scotiabank Europe plc Capital and Risk Management Pillar 3 Disclosures as at 31 October 2016
5
1.5 Governance – Board and Committees
1.5.1 The Board
The Company is subject to the provisions of the Companies Act 2006. It is governed by a board of directors (the “Board”)
and subject to the Company’s Memorandum and Articles of Association.
The directors are as follows:
Name of Director
Executive / Non-executive
No. of additional directorships
Knowledge, skills and expertise
JG Kirwan Chief Executive Officer / Executive
Holds one Scotiabank directorship and one external directorship
As Managing Director, Head of Global Banking and Markets (GBM) Europe, John provides leadership and oversight for Scotiabank's European operations and is also the Chief Executive Officer of Scotiabank Europe plc. He is responsible for the overall strategic direction and execution of Scotiabank’s businesses in Europe. John has over 25 years of experience within the financial services industry, having held various roles with significant responsibilities. He joined Scotiabank in 2010 to establish infrastructure as a global business for the Bank and has held successive additional roles during this time. John holds a Master’s Degree in Business and Bachelor’s Degree in Economics from University College Dublin, and in 2015 he successfully completed the Executive Management Program at Duke University.
PM Cutts Non-executive
Holds one executive directorship and one external non-executive directorship
Philip Cutts graduated from the London School of Economics and Political Science and is a Chartered Accountant. Philip is an all-round financial services professional with considerable experience of running businesses at executive board level. He was Chief Executive Officer of Credit Suisse UK Limited and spent 25 years with the Royal Bank of Canada Group where he was Vice President and Director, International Wealth Management, London and held senior positions in Structured Finance and Loan Syndications and Finance and Administration.
JM Lloyd Executive
Holds one Scotiabank and one external directorship
Jane Lloyd is a Chartered Management Accountant with more than 35 years' experience in the City of London. Her career has encompassed roles in trading and in compliance and, latterly, management of both operational and finance functions. In her current role as Chief Operating Officer, GBM Europe, Jane is responsible for managing the Operations and Business Support functions in London, in addition to providing local oversight of the Technology, Operational Risk Oversight and Regulatory Initiatives Groups in London.

Scotiabank Europe plc Capital and Risk Management Pillar 3 Disclosures as at 31 October 2016
6
Name of Director
Executive / Non-executive
No. of additional directorships
Knowledge, skills and expertise
PSW Smith Chair / Non-Executive
Holds one Scotiabank directorship
As Chief Financial Officer and Chief Operating Officer for
Scotiabank’s Global Banking and Markets division, Philip is
responsible for the oversight and leadership of all aspects of
GBM’s Operations groups and the Finance function. He plays
a central role in influencing strategy and shaping the financial
direction of the division. Prior to this appointment, Philip
held the role of Deputy Head of Global Investment Banking,
where he was responsible for the equity capital markets and
investment banking activities of Scotiabank, including the
coordination of advisory activities. Philip also held a variety of
positions within Global Banking and Markets in the Wealth
Management, Equity Capital Markets, and Investment
Banking areas. Philip holds an MBA in Analytic Finance from
the University of Chicago and a BA in International Relations
from Johns Hopkins University.
KM Spooner Non-executive
Holds one external non-executive directorship
Kerry Spooner has significant experience as a non-executive director in financial services. She was appointed to the Market Harborough Building Society board in 2006 and retired in April 2015. During her tenure at Market Harborough Building Society Kerry served on the Audit, Risk, Nominations and Remuneration committees. Kerry served on the board of Leek United Building Society as a non-executive director before joining the board of The Nottingham Building Society in 2016. Kerry has 20 years of experience as a solicitor, the last 8 years of which was as a corporate finance partner at Allen & Overy LLP. Kerry has broad domestic and international experience and has lived and worked as a lawyer outside the UK.
FJR McDonald Non-executive
Fergus McDonald has many years of experience as a senior banker having been Head of UK, Europe and ME, Multinational Corporates at Barclays Bank where he spent 17 years. Mr McDonald is also a Chartered Financial Analyst.
1.5.1.i Changes during the year
The following changes to the composition of the Board occurred during the year:
ME Caplan resigned from the Board on 17 June 2016.
JG Kirwan joined the Board on 20 June 2016.
RJ Wild resigned from the Board on 15 September 2016.
SM Lowe resigned from the Board on 15 September 2016
FJR McDonald joined the Board on 15 September 2016.
There was one post year-end change to the composition of the Board. Jason Paul Lawrence joined the Board on 14
December 2016.

Scotiabank Europe plc Capital and Risk Management Pillar 3 Disclosures as at 31 October 2016
7
1.5.2 Board Diversity and Recruitment
The Company’s Corporate Governance Policy requires that:
“the search for new Board candidates is conducted, and appointments made, on merit against objective criteria. Factors
considered by the Board in its review of potential candidates include:
prominence in business, institutions or professions; residency in and familiarity with the geographic regions where the Bank carries on business; integrity, honesty and the ability to generate public confidence; demonstrated sound and independent business judgment; financial literacy; knowledge of and experience with financial institutions; risk management experience knowledge and appreciation of public issues and familiarity with local, national and international
affairs; the professional experience required to contribute to the Board’s committees the ability to allocate sufficient time to the Bank for Board and Committee work to discharge his/her
responsibilities effectively; the competencies and skills that the Board considers to be necessary for the Board, as a whole, to
possess; and the competencies and skills that the Board considers each existing director to possess.
The Board believes that its membership should be composed of highly qualified directors from diverse backgrounds, who reflect the qualities enumerated above. To support this composition as part of the Board’s commitment to sound and effective corporate governance practices, the Board will, when identifying candidates for appointment or election to the Board, consider diversity criteria including gender, age, ethnicity and geographic background. In view of the small size of the Board, the Board does not consider it appropriate to set diversity targets at present.”

Scotiabank Europe plc Capital and Risk Management Pillar 3 Disclosures as at 31 October 2016
8
1.5.3 Board & Committee Structure
A committee structure as described below operated throughout the year. Information on risk reaches the Board directly
from its two committees: the Risk Committee (“RC”) and the Audit Committee (“AC”). The Board is supported in its
governance of the Company by other Scotiabank committees in London, namely the Executive Committee (“EXCO”) and
the Asset and Liability Management Committee (“ALCO”).
1.5.3.i Risk Committee
Membership of the RC comprises the non-executive and the executive directors; senior management may be invited to the
meetings. The RC reports to the Board. During the year, the RC met five times. The RC terms of reference include, amongst
other duties:
reviewing and informing the Board on the Company’s overall risk appetite, tolerance and making
recommendations as appropriate;
assessing and informing the Board on the current risk exposures of the Company;
reviewing the Company’s overall risk assessment processes that inform the Board’s decision making;
considering the Company’s capability to identify and manage new risk types;
approval of key risk-related documents for submission to the Board;
reviewing management’s procedures to ensure compliance with capital adequacy requirements;
reviewing risk management aspects of new products and the effectiveness of the Company’s internal controls
and risk management systems.
1.5.3.ii Audit Committee
Membership of the AC comprises the non-executive directors, the Chief Executive Officer (the “CEO”) and the Chair of the
Board; senior management may be invited to the meetings. The AC reports to the Board. During the year, the AC met four
times. The AC terms of reference include, amongst other duties:
monitoring the effectiveness of the Parent’s internal audit function as it pertains to its auditing of the Company;
receiving the reports of the Company’s Compliance Officer;
consideration of any matters relating to the financial affairs of the Company;
reviewing ongoing business performance, all internal and external audit reports and the annual Financial
Statements before their submission to the Board for approval;
reviewing management’s procedures to monitor the effectiveness of the systems of accounting and internal
control procedures over financial reporting;
reviewing arrangements established by management for compliance with financial reporting requirements;
reviewing the Company’s Recovery plan and the arrangements in place to produce the Company’s Resolution
pack;
making recommendations to the Board concerning the appointment and remuneration of the external auditors;
consideration of the scope and planning of the external audit and reviewing the findings of the external auditors;
monitoring the effectiveness of the external auditor.

Scotiabank Europe plc Capital and Risk Management Pillar 3 Disclosures as at 31 October 2016
9
1.5.3.iii Executive Committee
The EXCO focuses on significant matters of strategy, operations, governance and control in order to provide a key forum
for the effective, co-ordinated management and oversight of both the Company and The Bank of Nova Scotia London
Branch. The EXCO is comprised of the Chief Executive Officer and senior managers from each business line and support
function.
1.5.3.iv Asset and Liability Management Committee
The Asset & Liability Committee (ALCO) provides local strategic direction for Balance Sheet Management and risk
oversight. Specifically this involves the oversight and management of structural interest rate risk, structural foreign
exchange risk, liquidity and funding risk, trading and investment activities.
1.6 Policy
The disclosures in this document have been prepared in accordance with the requirements laid out in the CRR, Part Eight,
are both quantitative and qualitative. The disclosures will be issued on an annual basis as at the Company’s accounting
year-end of 31 October and are published on the Parent’s website. Unless otherwise stated, all figures are as at 31 October
2016. The disclosures are not subject to an external audit, but controls comparable to those for the Annual Report and
Accounts 2016 have been applied. These disclosures are approved by the Board.
1.7 Future developments
The Company will in future be required to adhere to further legislative provisions as and when they come into effect. These
will be incorporated into the Company’s Pillar 3 disclosures in the forthcoming years:
Liquidity Coverage Ratio (“LCR”): The final guideline of the LCR disclosure is currently under development with
the expected the application date of not earlier than 30 June 2017. Once the final Guidelines have been finalised
the Company will include the LCR disclosure in the next Pillar 3 as at 31 October 2017.
Revised Pillar 3 framework (“RPF”): Following the release by the Basel Committee on Banking Supervision
(“BCBS”) of a revised version of the Pillar 3 framework in January 2015, the EBA published its initiative Guidelines
to ensure the harmonised and timely implementation of the RPF in the EU. The Guidelines apply to Globally and
Other Systemically Important Institutions (“G-SIIs and O-SIIs”), however the PRA may still require the Company to
apply some or all the disclosure requirements as per the Guidelines. The Guidelines apply from 31st
December
2017 and any disclosure requirements applicable to the Company will be reflected in the Pillar 3 document as at
31st
October 2018.
The Company may wish to adopt the best practices identified by the EBA and the recommendations for enhanced
disclosures made by the Enhanced Disclosures Task Force (“EDTF”) where disclosures are commensurate with a non-
systemically important institution.

Scotiabank Europe plc Capital and Risk Management Pillar 3 Disclosures as at 31 October 2016
10
2 RISK MANAGEMENT OBJECTIVES AND POLICIES
This section presents information about the Company’s exposure to Credit risk, Liquidity risk, Market risk for trading and non-trading activities and Operational risk; and the Company’s objectives, policies and processes for measuring and managing risk. Effective risk management is fundamental to the success of the Company and is recognised as a core deliverable in the Company’s overall approach to strategy management. The Company has a strong and disciplined risk management culture where risk management is a responsibility shared by all of the Company’s employees. A key aspect of this culture is diversification across business lines, products and industries. The Company is firmly committed to the management of risk, recognising that sound internal risk management is essential to its prudent operation, particularly with the growing complexity, diversity and volatility of markets, facilitated by rapid advances in technology and communications. Risk management is given high priority throughout the Company and is integral to the management of the business.
2.1 Risk management framework
The primary goals of risk management are to ensure that the outcomes of risk-taking activities are consistent with the Company’s strategies and risk appetite, and that there is an appropriate balance between risk and reward in order to maximise shareholder returns. The Company’s risk management framework provides the foundation for achieving these goals. This framework is subject to constant evaluation to ensure that it meets the challenges and requirements of the markets, including regulatory standards and industry best practices.
The Company’s risk management framework is predicated on the three-lines-of-defence model. Within this model:
The first line: Functional business line staff and management incur and own the risks;
The second line: Global Risk Management and other control functions provide independent oversight and objective
challenge to the first line of defence, as well as monitoring and controlling risk; and
The third line: Internal Audit Department provides assurance that control objectives are achieved by the first and
second lines of defence.
The business lines are responsible for the development and execution of business plans that are aligned with the
Company’s risk management framework and are accountable for the risks they incur. Understanding and managing these
risks is a fundamental element of each business plan. Business lines work in partnership with Global Risk Management to
ensure that risks arising from their business are thoroughly evaluated and appropriately addressed. Risk education
programmes, documented policies and procedures are jointly available to staff in the business lines and Global Risk
Management.
Responsibility for risk management policies and the level of risks assumed lies with the Board. The Board requires
management to develop, present, update and implement these policies. The structure is designed to provide assurance
that no single event, or combination of events, will materially affect the well-being of the Company.
Active, hands-on senior management plays a key role in the identification, evaluation and management of all risks. All
credit and new product decisions require direct senior management approval and the loan portfolio is continuously
reviewed with assistance from the Parent. Management is supported by a comprehensive structure of independent
controls, analysis, reporting processes and periodic examination by the Audit Department, in conjunction with the Parent’s
Audit group.
The Company has in place an extensive number of limit controls and management information systems to facilitate
effective management overview.
The following basic elements of sound risk management are applied to all financial instruments, including derivatives:
review by the Board and senior management
risk management processes which integrate product sectorial risk limits
measurement procedures and information systems

Scotiabank Europe plc Capital and Risk Management Pillar 3 Disclosures as at 31 October 2016
11
continuous risk monitoring and frequent management reporting
segregation of duties, comprehensive internal controls and internal audit procedures.
2.1.1 Risk Measurement and Reporting Systems
The purpose of our risk measurement and reporting systems is to ensure that risks are comprehensively captured with all
the attributes necessary to support well-founded decisions, that those attributes are accurately assessed and information
is delivered in a timely way for those risks to be successfully managed and mitigated.
Risk measurement and reporting systems are also subject to a governance framework designed to ensure that their build
and implementation are fit for purpose and that they are functioning properly. Risk information technology systems
development is a key responsibility of Global Risk Management.
The Company continues to invest significant resources in IT systems and processes in order to maintain and improve its risk
management capabilities. The Company promotes the deployment of technology where applicable and standards are in
place to govern the procurement and operation of systems used to process risk information within business lines and risk
functions.
Risk measurement, monitoring and reporting structures are deployed by the Company through an operating model for risk
management and control. This model sets out the responsibilities of the risk function in respect of such matters as risk
governance and oversight, approval authorities and lending guidelines, global and local scorecards, management
information and reporting, and relations with third parties including regulators, rating agencies and auditors.
2.2 Credit and counterparty credit risk
Credit risk is the risk of loss resulting from the failure of a borrower or counterparty to honour its financial or contractual
obligations to the Company. Credit risk arises in the Company’s direct lending operations, and in its funding, investment
and trading activities where counterparties have repayments or other obligations to the Company.
The effective management of credit risk requires the establishment of an appropriate credit risk culture. Key credit risk
policies and appetite statements are important elements used to create this culture. The Board of Directors reviews and
approves the Company’s Risk Appetite Framework and adopts the Parent’s Credit Risk Policy on an annual basis.
The primary objective of Global Risk Management is to ensure that the outcomes of risk-taking activities are predictable
and consistent with the Company’s objectives and risk tolerance, and that there is an appropriate balance between risk
and reward in order to maximise shareholder returns.
Global Risk Management develops the credit risk management framework and policies that detail, among other things, the
credit risk rating systems and associated parameter estimates, the delegation of authority for granting credit, the
calculation of the allowance for credit losses and the authorisation of write-offs.
The Credit Risk Policy articulates the credit risk management framework, including:
key credit risk management principles;
delegation of authority;
the credit risk management programme;
counterparty credit risk management for trading and investment activities; and
single name/aggregated exposures, beyond which exposures must be reported to the Board.
Credit exposures are segmented by country and by major industry group. Aggregate credit risk limits for each of these
segments are also reviewed and approved annually by the Board. Portfolio management objectives and risk diversification
are key factors in setting these limits.
The borrower limits are set within the context of established lending criteria and guidelines for individual borrowers,
particular industries, countries and certain types of lending, to ensure the Company does not have excessive concentration

Scotiabank Europe plc Capital and Risk Management Pillar 3 Disclosures as at 31 October 2016
12
in any single borrower, or related group of borrowers, particular industry sector or geographic region. Through the
portfolio management process, loans may be syndicated to reduce overall exposure to a single name. Risk is also mitigated
through the selective sale of loans.
Banking units and Global Risk Management regularly review the various segments of the credit portfolio on an enterprise-
wide basis to assess the impact of economic trends or specific events on the performance of the portfolio, and to
determine whether corrective action is required. These reviews include the examination of the risk factors for particular
products, industries and countries.
2.2.1 Risk measures
The credit risk rating systems support the determination of key credit risk parameter estimates which measure credit and
transaction risk. These risk parameters – probability of default, loss given default and exposure at default are transparent
and may be replicated in order to provide consistency of credit adjudication, as well as minimum lending standards for
each of the risk rating categories.
The Company’s risk rating system utilises Scotiabank’s Internal Grade (“IG”) codes – a 23 point scale used to differentiate
the risk of default of borrowers, and the risk of loss on facilities. IG codes are also used to define credit adjudication
authority levels appropriate to the size and risk of each credit application. Lower-rated credits require increasingly more
senior management involvement depending upon the aggregate exposure. Where the decision is beyond their authority
levels, credit units will refer the request – with its recommendation – to a senior credit committee for adjudication at the
Parent level. Senior credit committees also have defined authority levels and, accordingly, forward certain requests to the
Risk Policy Committee at the Parent level.
The Company’s credit risk rating system is subject to a rigorous validation, governance and oversight framework. The
objectives of this framework are to ensure that:
Credit risk rating methodologies and parameters are appropriately designed and developed, independently
validated and regularly reviewed; and
The review and validation processes represent an effective challenge to the design and development process.
Units within Global Risk Management are responsible for design and development, validation and review of the risk
measures and are functionally independent from the business units responsible for originating transactions. Furthermore,
within Global Risk Management, the units responsible for design and development are independent from the risk rating
approval and credit adjudication units. Internal credit risk ratings and associated risk parameters affect loan pricing,
computation of the collective allowance for credit losses, and return on economic capital.
2.2.2 Adjudication
London New Transaction Review Committee (“NTRC”) evaluates and opines on all corporate banking credit facilities
proposed for new borrowers/clients and those that require new commitments and/or an extension of maturity. Following
the NTRC review London risk management will send to the Toronto team a local credit recommendation and support.
Credit adjudication units within Global Risk Management analyse and evaluate all significant credit requests for credit
exposures, to ensure that risks are adequately assessed, properly approved, continually monitored and actively managed.
The decision making process begins with an assessment of the credit risk of the individual borrower or counterparty. Key
factors considered in the assessment include:
the borrower’s management;
the borrower’s current and projected financial results and credit statistics;
the industry in which the borrower operates;
economic trends;
geopolitical risk; and
evaluation of Brexit risks, where relevant.

Scotiabank Europe plc Capital and Risk Management Pillar 3 Disclosures as at 31 October 2016
13
Based on this assessment, a risk rating is assigned to the individual borrower or counterparty, using Scotiabank’s risk rating
systems. A separate risk rating is also assigned at the facility level, taking into consideration additional factors, such as
security, seniority of claim, structure, term and any other forms of credit risk mitigation that affect the amount of potential
loss in the event of a default of the facility.
Internal borrower and facility risk ratings are assigned when a facility is first authorised, and are promptly re-evaluated and
adjusted, if necessary, as a result of changes to the customer’s financial condition or business prospects. Re-evaluation is
an ongoing process, and is done in the context of general economic changes, specific industry prospects, and event risks,
such as revised financial projections, interim financial results and extraordinary announcements. Global Risk Management
is the final arbiter of internal risk ratings.
The credit adjudication process also uses a risk-adjusted return on equity profitability model to ensure that the client and
transaction structure offers an appropriate return for a given level of risk. For the corporate portfolio, the Loan Portfolio
Management Group reviews the profitability model results and provides an opinion on the relative return and pricing of
each transaction above a minimum threshold.
Individual credit exposures are regularly monitored by both the business line units and Global Risk Management for any
signs of deterioration. In addition, a review and risk analysis of each borrower is conducted annually, or more frequently
for higher-risk borrowers. If, in the judgement of management, an account requires the expertise of specialists in workouts
and restructurings, it will be transferred to a special accounts group for monitoring and resolution.
The Company obtains advice and counsel from its Parent on all substantial issues. Letters of credit, guarantees and credit
risk arising from off balance sheet instruments are managed by the same process. The RC of the Board reviews new credit
exposures at least quarterly. Settlement and any other credit risks are restricted through product limits and counterparty
netting agreements and the Company has weightings in specific industry sectors for corporate lending to improve risk
control.
2.2.3 Credit Risk Mitigation – Collateral / Security
The Company’s approach to granting credit facilities is on the basis of capacity to repay rather than placing primary
reliance on credit risk mitigants. Mitigation of credit risk is nevertheless a key aspect of effective risk management and
takes many forms.
The Company’s general policy is to promote the use of credit risk mitigation, justified by commercial prudence and good
practice as well as capital efficiency. Specific, detailed policies cover the acceptability, structuring and terms of various
types of business with regard to the availability of credit risk mitigation, for example in the form of collateral security.
These policies, together with the setting of suitable valuation parameters, are subject to regular review to ensure that they
are supported by empirical evidence and continue to fulfil their intended purpose.
2.2.3.i Traded products
Traded products are transactions such as derivatives, foreign exchange, commodities, repurchase/reverse repurchase
agreements, and securities lending/borrowing. Credit risks arising from traded products cannot be determined with
certainty at the outset, because during the tenure of a transaction the value of the counterparty’s obligation to the
Company will be affected by changes in the capital markets (such as changes in stock prices, interest rates, exchange
rates). The Parent’s Global Risk Management adjudicates credit exposures arising from transacting in traded products by
considering their current fair value plus an additional component to reflect potential future changes in their mark-to-
market value.
The credit adjudication process also includes an evaluation of potential wrong way risk, which arises when the derivative
transactions and the collateral pledged against them can result in mark-to-market exposure varying due to market
conditions that positively or negatively impact the counterparty’s creditworthiness. There are two types of wrong-way risk:

Scotiabank Europe plc Capital and Risk Management Pillar 3 Disclosures as at 31 October 2016
14
General wrong-way risk occurs when market conditions detrimental to the counterparty’s creditworthiness
generate credit exposure in a derivative transaction with that counterparty. i.e. the company becomes in-the-
money.
Specific wrong-way risk occurs when the derivative underlying is directly linked to the counterparty’s
creditworthiness. For example, buying credit protection on an entity from that entity directly or accepting the
counterparty’s own bonds or shares as collateral will result in the counterparty’s creditworthiness worsening as
exposure increases. As a counterparty’s cost of credit protection increases reflecting a higher probability of
default, so does the company’s credit exposure as a result of the mark-to-market exposure of the credit
protection contract going against the counterparty.
The Company uses a range of internally approved methodologies and tools to measure, monitor and control wrong-way
risk. Global Risk Management is responsible for the control and the monitoring process. This includes daily monitoring and
a quarterly submission of wrong-way risk information to the RC.
Credit risk associated with traded products is managed within the same credit adjudication process as the lending business.
The Company considers the credit risk arising from lending activities, as well as the potential credit risk arising from
transacting in traded products with that counterparty.
Derivatives are generally transacted under industry standard International Swaps and Derivatives Association (“ISDA”)
Master Agreements, which allow for a single net settlement of all transactions covered by that agreement in the event of a
default or early termination of the transactions. ISDA agreements are frequently accompanied by an ISDA Credit Support
Annex (“CSA”), the terms of which may vary according to each party’s view of the other party’s creditworthiness. CSAs can
require one party to post initial margin at the onset of each transaction. CSAs also allow for variation margin to be called if
total uncollateralised mark-to market exposure exceeds an agreed upon threshold. Such variation margin provisions can be
one-way (only one party will ever post collateral) or bi-lateral (either party may post depending upon which party is in-the-
money). The CSA will also detail the types of collateral that are acceptable to each party, and the haircuts that will be
applied against each collateral type. The terms of the ISDA Master Agreements and CSAs are taken into consideration in
the calculation of counterparty credit risk exposure.
The Company routinely obtains collateral and security and ensures that any collateral held is sufficiently liquid, legally
effective, enforceable and regularly reassessed. In the normal course of business, the Company receives collateral on
certain transactions to reduce its exposure to counterparty credit risk. In the normal course of business, securities and
other assets are transferred to secure an obligation or participate in clearing or settlement systems. Asset transfer
transactions are conducted under terms that are common and customary to standard derivative, securities borrowing and
lending and other lending activities.
All Securities Financing Transactions (“SFT”) are undertaken under industry standard documentation, either on Investment
Dealers Association (“IDA”) Repurchase / Reverse Repurchase Transaction Agreement, a Public Securities Association
(“PSA”) Master Repurchase Agreement, or a Global Master Repurchase Agreement (“GMRA”).
2.2.3.ii Non-traded products
Collateral
The most common method of mitigating credit risk is to take collateral. A mortgage over the asset is usually taken to help
secure claims. Physical collateral is also taken in various forms of specialised lending and leasing transactions where
income from the physical assets that are financed is also the principal source of facility repayment. In the commercial and
industrial sectors, charges are created over business assets such as premises, stock and debtors.
Collateral and security can be an important mitigant of credit risk. The Company uses two methods of credit mitigation;
direct and indirect. The main direct credit risk mitigation is the taking of security or collateral, such as:
Aircraft
Inventory
Land and buildings

Scotiabank Europe plc Capital and Risk Management Pillar 3 Disclosures as at 31 October 2016
15
Marketable securities
Property, plant and equipment
Ship mortgages
Others
The frequency of valuation depends on the class of asset. A margin requiring excess collateral value to the loan value, with
triggers requiring the collateral to be increased when breached, will generally be required. Credit risk mitigation may also
be achieved through the taking of guarantees and indemnities from third parties.
Guarantees
When the Company extends credit to corporate banking customers they may be supported by financial guarantees and
performance guarantees from a third party. In nearly all circumstances where guarantees are in place these are received
from the parent, subsidiary or sister company of the borrower. Only in exceptional circumstances, for instance where the
financing is of strategic importance to the guarantor, is the guarantee provided by a company that is not the parent,
subsidiary or sister company of the borrower. The Company performs an annual review of the borrower and within that
review an analysis of the credit position of the guarantor, the effectiveness of the guarantee and the financial covenants
applicable to the guarantor is also performed. The credit step quality of a particular transaction where a full and unlimited
guarantee is in place will be based on the creditworthiness of the guarantor and is achieved through affiliation or
probability of default substitution. In terms of assessing the creditworthiness of a guarantor, the adjudication process
detailed in section 2.2.2 is followed.
2.2.3.iii Credit derivatives
The Company does not have any credit derivatives as at 30 December 2016 (2015: Nil).
2.2.3.iv Other mitigants
Indirect credit risk mitigants will generally be embedded in the individual structure of the transaction to minimise the
impact of an external event on the obligor. For example the requirement for the obligor to hedge interest rates and input
material prices or insure receivables.
2.2.4 Past due but not impaired financial assets
Past due is defined as when any amount of principal, interest or fee has not been paid at the date it was due.
Past due but not impaired financial assets, other than those carried at fair value through profit or loss, are those for which
contractual interest or principal payments are past due, but the Company believes that impairment is not appropriate on
the basis of the level of collateral available and / or the stage of collection of amounts owed to the Company.

Scotiabank Europe plc Capital and Risk Management Pillar 3 Disclosures as at 31 October 2016
16
2.3 Liquidity risk
Liquidity risk is the risk that the Company is unable to meet its financial obligations in a timely manner at reasonable prices.
Financial obligations include liabilities to depositors, payments due under derivative contracts, settlement of securities
borrowing and repurchase transactions, and lending and investment commitments. Liquidity risk arises from fluctuations in
cash flows.
Effective liquidity risk management is essential to maintain the confidence of depositors and counterparties, manage the
Company’s cost of funds and to support core business activities, even under adverse circumstances. The liquidity risk
management process ensures that the Company is able to honour all of its financial commitments as they fall due.
Liquidity risk is also managed within the framework of policies and limits that are approved by the Board. The Board
receives reports on risk exposures and performance against approved limits. The ALCO provides senior management
oversight of liquidity risk and meets monthly to review the Company’s liquidity profile.
The key elements of the liquidity risk framework are:
Measurement and modelling – the Company’s liquidity model measures and forecasts cash inflows and outflows,
including off-balance sheet cash flows on a daily basis. Risk is managed by a set of key limits over the maximum
net cash outflow by currency over specified short- term horizons (cash gaps), a minimum level of core liquidity,
and liquidity stress tests.
Reporting – Global Risk Management provides independent oversight of all significant liquidity risks, risk
measurement, stress testing, monitoring and reporting.
Stress testing – the Company performs liquidity stress testing on a regular basis, to evaluate the effect of both
industry-wide and Scotiabank-specific disruptions on the Company’s liquidity position. Liquidity stress testing has
many purposes including:
o Helping the Company to understand the potential behaviour of various on-balance sheet and off-
balance sheet positions in circumstances of stress; and
o Based on this knowledge, facilitating the development of risk mitigation and contingency plans.
Contingency planning – the Company maintains a liquidity contingency plan that specifies an approach for
analysing and responding to actual and potential liquidity events. The plan outlines an appropriate governance
structure for the management and monitoring of liquidity events, processes for effective internal and external
communication, and identifies potential counter measures to be considered at various stages of an event.
Core liquidity – the Company maintains a pool of highly liquid, unencumbered assets that can be readily sold or
pledged to secure borrowings under stressed market conditions or due to specific events.
The Company has developed an Individual Liquidity Adequacy Assessment (“ILAAP”) as required by the PRA. The Company
has also developed a suite of stress tests and limits, the results of which are reviewed by senior management on a regular
basis. In addition, the ALCO and the RC review the Company’s liquidity position.
2.3.1 Liquid assets
Liquid assets are a key component of liquidity management and the Company holds these types of assets in sufficient
quantity to meet potential needs for liquidity management. Liquid assets can be used to generate cash either through sale,
repurchase transactions or other transactions where these assets can be used as collateral to generate cash, or by allowing
the asset to mature. Liquid assets include deposits at central banks, deposits with commercial banks, call and other short-
term loans, marketable securities, and securities received as collateral from securities financing and derivative
transactions. Liquid assets do not include borrowing capacity from central bank facilities.
Marketable securities are securities traded in active markets, which can be converted to cash within a timeframe that is in
accordance with the Company’s liquidity management framework. Assets are assessed considering a number of factors,
including the time it would take to convert them to cash. Marketable securities included in liquid assets are comprised of
securities specifically held as a liquidity buffer or for asset liability management purposes, trading securities and collateral
received for securities financing and derivative transactions.

Scotiabank Europe plc Capital and Risk Management Pillar 3 Disclosures as at 31 October 2016
17
2.4 Market risk
Market risk is the risk of loss from changes in market prices and rates (including interest rates, credit spreads, equity prices,
foreign exchange rates and commodity prices), the correlations among them, and their levels of volatility.
The Company quantifies, monitors, controls and communicates market risk on the trading and non-trading activities which
is also an essential part of the Risk Appetite Framework.
2.4.1 Market risk factors
The principal market risk factors that affect the Company are listed below together with the types of risk reporting
measures used:
2.4.1.i Interest rate risk
The risk of loss due to changes in the level and / or the volatility of interest rates. This risk affects instruments such as, but
not limited to, debt securities, loans, deposits and derivatives. Interest rate risks are managed through sensitivity, gap,
stress testing, annual income and VaR limits and mitigated through portfolio diversification and hedges using interest rate
derivatives and debt securities.
2.4.1.ii Credit spread risk
The risk of loss due to changes in the market price and volatility of credit, or the creditworthiness of issuers. This risk is
mainly concentrated in loan and debt securities portfolios. Risk is managed through sensitivity, stress testing and VaR
limits.
2.4.1.iii Equity risk
The risk of loss due to changes in prices, volatility or any other equity related risk factor of individual equity or equity linked
securities. Equity risks are managed through sensitivity, VaR and stress testing limits and mitigated through portfolio
diversification and hedges. The Company did not have any material exposure to equity risk during the financial year.
2.4.1.iv Commodity risk
The risk of loss due to changes in price volatility of base metals. Both physical and derivative commodity positions are
exposed to this risk. Risk is managed through aggregate and net trading position, sensitivity, stress testing and VaR limits
and mitigated through hedges using commodity derivatives.
2.4.1.v Foreign exchange risk
The risk of loss due to changes in foreign exchange rates. The Company does not have material exposure to foreign
currency risk. Any residual FX risks are managed through sensitivity, VaR and stress testing limits and mitigated through FX
hedges.
2.4.2 Risk Measurement Summary
2.4.2.i Value At Risk (“VaR”)
VaR is a statistical method of measuring potential loss due to market risk based upon a common confidence interval and
time horizon. The Company calculates VaR daily using a 99% confidence level, and a one-day holding period for its trading
portfolios. This means that once in every 100 days, the trading positions are expected to lose more than the VaR estimate.
VaR has two components: general market risk and debt specific risk. The Company calculates general market risk VaR using
historical simulation based on 300 days of market data.

Scotiabank Europe plc Capital and Risk Management Pillar 3 Disclosures as at 31 October 2016
18
Changes in VaR between reporting periods are generally due to changes in positions, volatilities and/or correlations
between asset classes. VaR is also used to evaluate risks arising in certain funding and investment portfolios.
2.4.2.ii Stress testing
A limitation of VaR is that it only reflects the recent history of market volatility and a specific one year stress period,
respectively. To complement these measures, stress testing examines the impact that abnormally large changes in market
factors and periods of prolonged inactivity might have on trading portfolios. Stress testing scenarios are designed to
include large shifts in risk factors as well as historical and theoretical multi risk market events. Historical scenarios capture
severe movements over periods that are significantly longer than the one-day holding period captured in VaR, such as the
2008 Credit Crisis or the 1998 Russian Financial Crisis.
Stress testing provides management with information on potential losses due to tail events. In addition, the results from
the stress testing programme are used to verify that the Company’s market risk capital is sufficient to absorb these
potential losses.
2.4.2.iii Sensitivity analysis
In trading portfolios, sensitivity analysis is used to measure the effect of changes in risk factors, including prices and
volatility, on financial products and portfolios. These measures apply across product types and are used for limit
monitoring and management reporting.
In non-trading portfolios, sensitivity analysis assesses the effect of changes in interest rates on current earnings and on the
economic value of shareholders’ equity. The Company’s sensitivity analysis for limit and disclosure purposes is measured
through positive and negative parallel shifts in the underlying interest rate curves.
2.4.2.iv Gap analysis
Gap analysis is used to assess the interest rate sensitivity of re-pricing mismatches in the Company’s non-trading
operations. Under gap analysis, interest rate sensitive assets, liabilities and off-balance sheet instruments are assigned to
defined time periods based on expected re-pricing dates. Products with a contractual maturity are assigned an interest rate
gap term based on the shorter of the contractual maturity date and the next re-pricing date. Products with no contractual
maturity are assigned an interest rate gap based on observed historical consumer behaviour.
2.4.2.v Hedging
The Company uses derivative financial instruments to facilitate client transactions and for hedging purposes. The Company
uses forward foreign exchange, interest rate and other derivative products. Derivatives that are not held for trading or
designated in a qualifying hedge relationship are fair valued through the Statement of Comprehensive Income as shown in
the statutory accounts.
On initial designation of the hedge, the Company formally documents the relationship between the hedging instruments
and the hedged items, including the risk management objective and strategy in undertaking the hedge, together with the
method that will be used to assess the effectiveness of the hedging relationship. The Company makes an assessment, both
at the inception of the hedge relationship and an on-going basis, as to whether the hedging instruments are to be highly
effective in offsetting the changes in fair value or cash flows of the respective hedged items during the period for which the
hedge is designated, and whether the actual results of each hedge are within a range of 80% - 125%.
In a fair value hedge, changes in the fair value of a derivative hedging instrument designated are recognised in Statement
of Comprehensive Income. The hedged item also is stated at fair value in respect of the risk being hedged; the gain or loss
attributable to hedged risk is recognised in Statement of Comprehensive Income. For a derivative instrument to be
designated in a hedge relationship the transaction must be reasonably expected to match or eliminate a significant
proportion of the risk inherent in the assets, liabilities, other positions or cash flows being hedged and which results from
potential movements in interest rates, exchange rates and market values. If the hedging instrument no longer meets the
criteria for hedge accounting, expires or is sold, terminated or exercised, then hedge accounting is discontinued

Scotiabank Europe plc Capital and Risk Management Pillar 3 Disclosures as at 31 October 2016
19
prospectively. When a fair value hedge is discontinued, any cumulative adjustment to the hedged item is amortised using
effective interest rate basis to the Statement of Comprehensive Income. If a designated hedge is no longer effective, the
associated derivative instrument is subsequently carried at fair value without any offset from the hedged item.
The Company does not have economic hedges that do not qualify for hedge accounting under IAS 39 ‘Financial
Instruments: Recognition and Measurement’ as at the reporting date.
2.4.3 Funding and investment activities Market risk arising from the Company’s funding and investment activities is identified, managed and controlled through
the Company’s asset-liability management processes.
2.4.3.i Interest rate risk
Interest rate risks in the non-trading portfolios are predominately driven by the interest rate mismatch (i.e. repricing
frequency) in the asset and liability exposures. Interest rate risk arising from the Company’s lending, funding and
investment activities is managed in accordance with approved policies and limits, which are designed to control the risk to
net interest income and economic value of shareholders’ equity. The income limit measures the effect of a specified
change in interest rates on the Company’s annual net interest income over the next twelve months, while the economic
value limit measures the impact of a specified change in interest rates on the present value of the Company’s net assets.
These limits are set according to the documented risk appetite of the Company.
Gap analysis, simulation modelling and sensitivity analysis are used to assess exposures and for limit monitoring and
planning purposes. The Company’s interest rate risk exposure calculations are generally based on the earlier of contractual
re-pricing or maturity of on-balance sheet and off-balance sheet assets and liabilities, although certain assets and liabilities
such as deposits without a fixed maturity are assigned a maturity profile based on the longevity of the exposure. Expected
prepayments from loans and cashable investment products are also incorporated into the exposure calculations.
The Company utilises swaps when required by particular customer transactions, but hedges its position using a back to
back contract with its Parent in order to mitigate any exposures from these transactions.
Scotiabank Europe plc Capital and Risk Management Pillar 3 Disclosures as at 31 October 2016
20
2.5 Operational risk
Operational risk is the risk of loss, whether direct or indirect, to which the Company is exposed due to inadequate or failed
internal processes or systems, human error or external events. Operational risk includes legal and regulatory risk, business
process and change risk, fiduciary or disclosure breaches, technology failure, financial crime and environmental risk.
The Company aims to minimise all operational risks and reputational impacts. An operational risk event has the potential
to significantly erode capital capacity and reduce the Company’s net income. Therefore, the Company sets and develops
limits, policy and framework to manage and mitigate operational risk.
Operational risk can not only result in financial loss, but also regulatory sanctions and damage to the Company’s
reputation. The Company is very successful at managing operational risk with a view to safeguarding client assets and
preserving shareholder value.
Operational risks are managed and controlled within the individual business lines and a wide variety of checks and balances
to address operational risks have been developed as an important part of the Company’s risk management culture. They
include adoption of the overall, group-wide standards and policies established by the Parent to ensure proper risk analysis
and control, including risk management policies, a rigorous planning process, regular organisational review, thorough
enforcement of the Parent’s Code of Conduct, and clearly defined and documented approval authorities. The Company is
also subject to a documented compliance programme, the elements of which are regulatory awareness, regulatory risk
assessment, compliance monitoring and reporting. As well, regular audits by the Parent’s Audit Department include
comprehensive reviews of the design and operation of internal control systems in all business and support groups, new
products and systems, and the reliability and integrity of data processing operations. The Audit Committee approves an
annual audit scope and plan, and reviews all subsequent reports and management responses to ensure appropriate
corrective action is taken.
2.5.1 Operational Risk Management Framework
Scotiabank’s Operational Risk Management Framework sets out an integrated approach to identify, assess, control,
mitigate and report operational risks across the Company. The following are key components of Scotiabank’s Operational
Risk Management Framework:
The Company’s Risk and Control Self-Assessment programme, which is managed by Operational Risk Oversight
with assurance from Global Operational Risk Management, includes formal reviews of significant units,
operations and processes to identify and assess operational risks. This programme provides a basis for
management to ensure that key risks have been identified and that controls are functioning effectively. Business
line management attests to the accuracy of each assessment and develops action plans to mitigate risks if
controls are not identified as effective. Results of these reviews are summarised and reported to senior
management and the Board.
The Company has a standard inventory of operational risks which are discussed and considered in each risk
assessment.
The Company’s Key Risk Indicator (“KRI”) programme provides management with an early warning system of
changes in risk exposure that may indicate that an operational risk appetite or tolerance may be breached.
Scotiabank’s centralised operational loss event database, which is managed and maintained by the central
operational risk unit within Global Risk Management, captures key information on operational losses. This data is
analysed, benchmarked against industry loss data and significant metrics and then reported to senior
management and the Parent’s Board to provide insight into operational risk exposures, appetites and trends.
Scotiabank is a member of the Operational Risk Data Exchange Association (“ORX”), an international consortium
of banks that share anonymised loss data. This industry data is used to support risk identification and
assessment. Discussion forums within ORX also help to ensure that the Company adopts all industry best
practices and developments.
Scotiabank’s monitoring of industry events, identifies significant losses incurred at other financial institutions and
provides a reference for reviewing and assessing the Company’s own risk exposure.
Bank-wide communications plan has been developed to enhance the awareness and understanding of
operational risk across Scotiabank.

Scotiabank Europe plc Capital and Risk Management Pillar 3 Disclosures as at 31 October 2016
21
The elements of the Operational Risk Management Framework are also integrated into the overall risk
management processes across all levels of Scotiabank, including the evaluation, review, approval and
implementation of new products and services. A standard risk assessment tool named the New Initiative Risk
Assessment (“NIRA”) template has been developed to be used by all Product Sponsors when assessing and
reviewing all risks relating to new products and services. The review of risks using the NIRA template is a
minimum requirement for every new product or service in scope of the New Product and Services Risk
Management Policy.

Scotiabank Europe plc Capital and Risk Management Pillar 3 Disclosures as at 31 October 2016
22
2.6 Board Risk Management Declaration
The Board is responsible for reviewing the effectiveness of the Company’s risk management framework and internal
controls which are designed to manage and mitigate the risks of not achieving business objectives.
The Board considers that it has in place adequate systems and controls with regard to the Company’s profile and strategy
and an appropriate array of assurance mechanisms, properly resourced and skilled, to avoid or minimise loss.
2.7 Board Approved Risk Statement
The primary goals of risk management are to ensure that the outcomes of risk-taking activities are consistent with the
Company’s strategies and risk appetite, and that there is an appropriate balance between risk and reward in order to
maximise shareholder returns. The Company’s risk management framework provides the foundation for achieving these
goals.
The Company’s risk strategy consists of the following components:
1. Governing Financial Objectives: summarise the overarching financial objectives of the Company in terms of
profitability, capital adequacy and access to financial resources. 2. Strategic Principles: are primarily aimed at building franchise value by generating superior financial returns. 3. Risk Management Principles: guide the Company’s overall approach to the management of risk-taking activities.
The Company’s risk management framework is applied on an enterprise-wide basis and consists of three elements; risk
governance, risk appetite and risk management techniques which are underpinned by Scotiabank’s strong risk culture.
The risk appetite measures are integrated into decision making, monitoring and reporting processes, with early warning
trigger levels set to drive any required corrective action before overall tolerance levels are reached.

Scotiabank Europe plc Capital and Risk Management Pillar 3 Disclosures as at 31 October 2016
23
The Board expresses the Company’s Risk Appetite through a number of key Risk Appetite measures:
Group Dimensions Measure Frequency of Monitoring
Sust
ain
able
Earn
ings
Return on Equity Ratio of net income before tax to common shareholders equity based
on year to date performance.
Monthly
Productivity Ratio Productivity Ratio – ratio of non-interest expenses to net revenue Monthly
Mai
nta
inin
g C
apit
al
Ad
equ
acy
Target Regulatory Capital Ratio The Company calculates its Internal Capital Ratio (internal capital for
Pillar 1 risk plus add-on for Pillar 2 risks) within its ICAAP. After
review of the Company’s ICAAP, PRA sets Individual Capital Guidance.
Quarterly
Capital Buffer After review of the Company’s ICAAP, PRA sets a capital buffer which
can only be utilised during times of stress
Quarterly
Effe
ctiv
e Li
qu
idit
y an
d
Fun
din
g M
anag
em
ent Survival Horizon The amount of time the Company needs to have sufficient liquidity to
meet its obligations during a liquidity crisis.
Weekly
Liquidity Coverage Ratio (LCR) LCR is intended to ensure that SBE maintains a minimum level of
unencumbered, high quality liquid assets that can be converted into
cash to meet its liquidity needs for a 30 calendar day time horizon
under an extreme liquidity stress scenario specified by regulatory
supervisors.
Weekly
Ind
ivid
ual
Ris
k M
etr
ics
Market Risk Maximum Value at Risk (VaR) for all trading books at 99% confidence
interval based on historical market movements
Daily
Interest Rate Risk in the Non-
Trading Book
Annual Income (AI): maximum effect of a +/- 100bp parallel shift in
yield curves on the Company’s annual income
Daily
Economic Value (EV): maximum effect of a +/- 100bp parallel shift in
yield curves on the net present value of the Company’s assets and
liabilities.
Daily
Credit Risk Credit Risk Strategy as set out in the relevant appendix in the
Company’s ICAAP.
Limits on maximum authorised portfolio, any single credit exposure,
total authorised loans below IG75, industry limits and maximum loan
loss in any one year.
Ongoing
Monthly
Counterparty Credit Risk Limit on any single counterparty credit risk exposure. Daily
Operational Risk Single event and year-to-date loss as a percentage of pre-tax income Ongoing
Reputational Risk Damage to the Company’s and/or Scotiabank’s brand or franchise
value
Ongoing
Regulatory Compliance Regulatory breaches with severe adverse consequences Ongoing
The required disclosure of key ratios and figures relating to the Company’s risk profile has not been included in the above
table as, in the opinion of the Board, this information is sensitive and would undermine the Company’s competitive
position. The Company has operated within the Risk Appetite limits during the year and there were no breaches reported.

Scotiabank Europe plc Capital and Risk Management Pillar 3 Disclosures as at 31 October 2016
24
3 CAPITAL ADEQUACY
The Company is well capitalised and maintains a strong capital base to support the development of the business and
ensures that the Pillar 1 capital requirements and Individual Capital Guidance (“ICG”) are met at all times. As a result, the
Company maintains capital ratios comfortably above minimum regulatory requirements.
A summary of the key regulatory metrics is as follows:
31 October 2016 31 October 2015
USD ‘000s USD ‘000s
(restated)
Common equity tier 1 capital 1,741,048 1,759,178
Tier 1 capital 1,741,048 1,759,178
Total regulatory capital 1,768,748 1,779,649
Common equity tier 1 capital ratio 18.08% 19.35%
Tier 1 capital ratio 18.08% 19.35%
Total capital ratio 18.37% 19.57%
Total risk weighted assets (“RWAs”) 9,627,737 9,092,744
3.1 Internal capital adequacy assessment
The Company carries out an annual internal capital adequacy assessment (“ICAAP”), last performed as at 31 October 2015,
which considers the adequacy of the capital held and assesses the impact of five year forward looking stress scenarios.
There has been a change in the next annual ICAAP date which will be based on capital figures as at 31 December 2016. The
approach to the Company’s assessment of the adequacy of its internal capital to support current and future activities has
been to identify the material risks in the business and then determine the level of internal capital required by the
Company.
The Company’s management took the following steps in making its assessment:
a. undertook an adequacy assessment for each significant Pillar 1 risk;
b. identified other material Pillar 2 risks which could impact the Company and undertook further adequacy
assessments to determine the Pillar 2 add-on for these risks;
c. combined the adequacy assessments for Pillar 1 and Pillar 2 risks – the adequacy assessment for aggregated
required capital;
d. compared the results of the adequacy assessment with the Company’s current Pillar 1 regulatory capital
calculations for each risk type and took the higher charge;
e. undertook stress testing using severe but plausible scenarios in order to assess future capital capacity. These
scenarios were also modelled to include potential management actions to conserve capital.
Based on assessments performed, management is satisfied that with appropriate management actions in place, the
Company’s available capital is sufficient to support its risk profile and strategic plans under regulatory requirements and
that it has sufficient capital to cover the main elements of severe stress in the short and medium term. This will enable the
Company to realise its business objectives, implement intended strategy and in the severe stress scenario execute its
contingency plans. Based on the results, it was concluded that the Company would not require any future capital injections
and could rely on its existing capital base.

Scotiabank Europe plc Capital and Risk Management Pillar 3 Disclosures as at 31 October 2016
25
3.2 Capital requirements
The following summary table details the risk-weighted exposure amounts and Pillar 1 capital requirements of the Company
as at:
31 October 2016 Risk weighted exposure amounts Capital requirements
USD '000s USD '000s
Credit risk 6,434,716 514,777
Counterparty risk 1,271,729 101,738
Market risk 1,447,261 115,781
Operational risk 449,920 35,994
Settlement/Delivery risk 152 12
Credit valuation adjustments 23,959 1,917
Total capital requirements 9,627,737 770,219
31 October 2015 Risk weighted exposure amounts Capital requirements
USD '000s USD '000s
Credit risk 6,280,142 502,411
Counterparty risk 842,273 67,382
Market risk (restated) 1,507,518 120,602
Operational risk 441,596 35,328
Settlement/Delivery risk - -
Credit valuation adjustments 21,215 1,697
Total capital requirements 9,092,744 727,420

Scotiabank Europe plc Capital and Risk Management Pillar 3 Disclosures as at 31 October 2016
26
4 CAPITAL RESOURCES
4.1 Regulatory capital
The table below summarises the composition of the Company’s regulatory capital as at 31 October 2016:
Transitional own funds disclosure template
Common Equity Tier 1 (CET1) capital: instruments and reserves
(A) AMOUNT AT
DISCLOSURE DATE
(USD'000s)
(B) REGULATION (EU) No 575/2013
ARTICLE REFERENCE
(C) AMOUNTS
SUBJECT TO PRE-
REGULATION (EU)
No 575/2013
TREATMENT OR
PRESCRIBED
RESIDUAL
AMOUNT OF
REGULATION (EU)
No 575/2013
1 Capital instruments and the related share premium accounts 985,795 26 (1), 27, 28, 29, EBA list 26 (3) 985,795
of which: Instrument type 1 985,795 EBA list 26 (3) 985,795
2 Retained earnings 764,452 26 (1) (c) 764,452
3
Accumulated other comprehensive income (and other
reserves, to include unrealised gains and losses under the
applicable accounting standards)
543 26 (1) 543
6 Common Equity Tier 1 (CET1) capital before regulatory
adjustments 1,750,790
1,750,790
Common Equity Tier 1 (CET1) capital: regulatory
adjustments
7 Additional value adjustments (negative amount) (9,742) 34, 105 (9,742)
10
Deferred tax assets that rely on future profitability excluding
those arising from temporary differences (net of related tax
liability where the conditions in Article 38 (3) are met)
(negative amount)
- 36 (1) (c), 38, 472 (5) -
28 Total regulatory adjustments to Common Equity Tier 1
(CET1) (9,742)
(9,742)
29 Common Equity Tier 1 (CET1) capital 1,741,048
1,741,048
Tier 2 (T2) capital
Tier 2 (T2) capital: instruments and provisions
50 Credit risk adjustments 27,700 62 (c) & (d) 27,700
58 Tier 2 (T2) capital 27,700
27,700
59 Total capital (TC - T1 + T2) 1,768,748
1,768,748

Scotiabank Europe plc Capital and Risk Management Pillar 3 Disclosures as at 31 October 2016
27
The table below summarises the composition of the Company’s regulatory capital as at 31 October 2015:
Transitional own funds disclosure template
Common Equity Tier 1 (CET1) capital: instruments and reserves
(A) AMOUNT AT
DISCLOSURE DATE
(USD'000s)
(B) REGULATION (EU) No 575/2013
ARTICLE REFERENCE
(C) AMOUNTS
SUBJECT TO
PRE-
REGULATION
(EU) No
575/2013
TREATMENT OR
PRESCRIBED
RESIDUAL
AMOUNT OF
REGULATION
(EU) No
575/2013
1 Capital instruments and the related share premium
accounts
985,795 26 (1), 27, 28, 29, EBA list 26 (3) 985,795
of which: Instrument type 1 985,795 EBA list 26 (3) 985,795
2 Retained earnings 783,420 26 (1) (c) 783,420
3
Accumulated other comprehensive income (and other
reserves, to include unrealised gains and losses under the
applicable accounting standards)
1,263 26 (1) 1,263
6 Common Equity Tier 1 (CET1) capital before regulatory
adjustments
1,770,478 1,770,478
Common Equity Tier 1 (CET1) capital: regulatory
adjustments
7 Additional value adjustments (negative amount) (10,718) 34, 105 (10,718)
10
Deferred tax assets that rely on future profitability excluding
those arising from temporary differences (net of related tax
liability where the conditions in Article 38 (3) are met)
(negative amount)
(582) 36 (1) (c), 38, 472 (5) (582)
28 Total regulatory adjustments to Common Equity Tier 1
(CET1)
(11,300) (11,300)
29 Common Equity Tier 1 (CET1) capital 1,759,178 1,759,178
Tier 2 (T2) capital
Tier 2 (T2) capital: instruments and provisions
50 Credit risk adjustments 20,471 62 (c) & (d) 20,471
58 Tier 2 (T2) capital 20,471 20,471
59 Total capital (TC - T1 + T2) 1,779,649 1,779,649

Scotiabank Europe plc Capital and Risk Management Pillar 3 Disclosures as at 31 October 2016
28
Prudential filters
31 October 2016 31 October 2015
USD ‘000s USD '000s
Additional valuation adjustments (“AVAs”) (9,656) (10,718)
Independent price verification (“IPVs”) adjustments (86) -
Value adjustments due to the requirements of prudential valuation (9,742) (10,718)
Note: The Company is using Simplistic Approach to calculate AVAs.
Deductions to capital
31 October 2016 31 October 2015
USD ‘000s USD '000s
Deferred tax assets that rely on future profitability and do not arise from temporary differences net of associated tax liabilities
- (582)
No exposure values have been deducted from own funds as at 31 October 2016 (2015: Nil).
Called up share capital
The Company has 1 billion authorised ordinary shares of which 617.55 million are allotted, called up and paid. Each share is
issued at USD 1.5963.
Accumulated other comprehensive income
The revaluation of available-for-sale items is reflected under accumulated other comprehensive income.
Capital restrictions
The Company has no restrictions applied to the calculation of capital in accordance with the CRD IV and the capital
instruments, prudential filters and deductions to which those restrictions apply (2015: Nil).
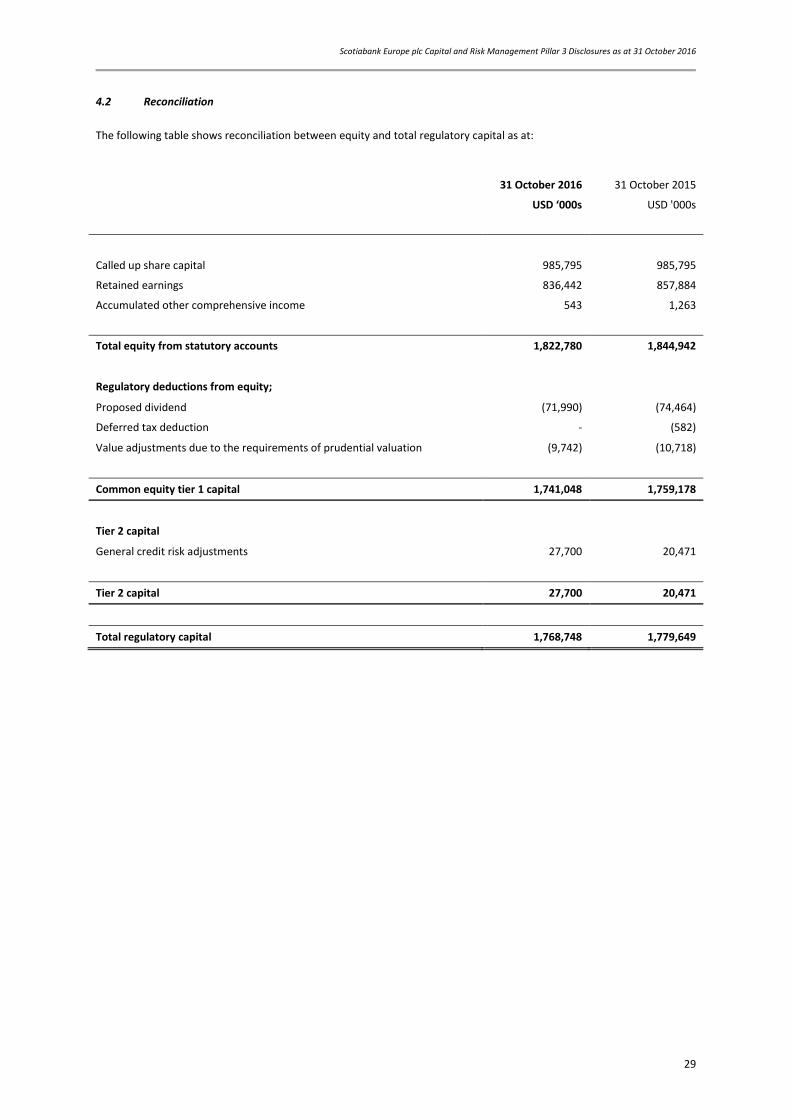
Scotiabank Europe plc Capital and Risk Management Pillar 3 Disclosures as at 31 October 2016
29
4.2 Reconciliation
The following table shows reconciliation between equity and total regulatory capital as at:
31 October 2016 31 October 2015
USD ‘000s USD '000s
Called up share capital 985,795 985,795
Retained earnings 836,442 857,884
Accumulated other comprehensive income 543 1,263
Total equity from statutory accounts 1,822,780 1,844,942
Regulatory deductions from equity;
Proposed dividend (71,990) (74,464)
Deferred tax deduction - (582)
Value adjustments due to the requirements of prudential valuation (9,742) (10,718)
Common equity tier 1 capital 1,741,048 1,759,178
Tier 2 capital
General credit risk adjustments 27,700 20,471
Tier 2 capital 27,700 20,471
Total regulatory capital 1,768,748 1,779,649
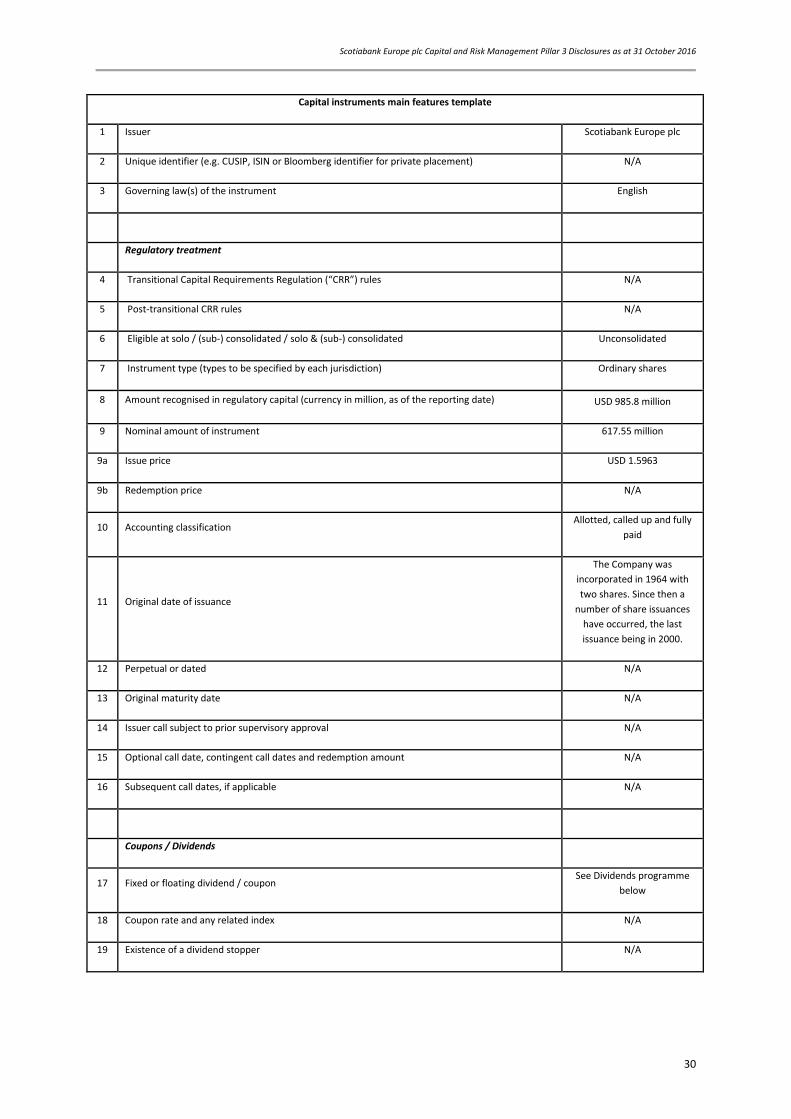
Scotiabank Europe plc Capital and Risk Management Pillar 3 Disclosures as at 31 October 2016
30
Capital instruments main features template
1 Issuer Scotiabank Europe plc
2 Unique identifier (e.g. CUSIP, ISIN or Bloomberg identifier for private placement) N/A
3 Governing law(s) of the instrument English
Regulatory treatment
4 Transitional Capital Requirements Regulation (“CRR”) rules N/A
5 Post-transitional CRR rules N/A
6 Eligible at solo / (sub-) consolidated / solo & (sub-) consolidated Unconsolidated
7 Instrument type (types to be specified by each jurisdiction) Ordinary shares
8 Amount recognised in regulatory capital (currency in million, as of the reporting date) USD 985.8 million
9 Nominal amount of instrument 617.55 million
9a Issue price USD 1.5963
9b Redemption price N/A
10 Accounting classification Allotted, called up and fully
paid
11 Original date of issuance
The Company was
incorporated in 1964 with
two shares. Since then a
number of share issuances
have occurred, the last
issuance being in 2000.
12 Perpetual or dated N/A
13 Original maturity date N/A
14 Issuer call subject to prior supervisory approval N/A
15 Optional call date, contingent call dates and redemption amount N/A
16 Subsequent call dates, if applicable N/A
Coupons / Dividends
17 Fixed or floating dividend / coupon See Dividends programme
below
18 Coupon rate and any related index N/A
19 Existence of a dividend stopper N/A

Scotiabank Europe plc Capital and Risk Management Pillar 3 Disclosures as at 31 October 2016
31
Capital instruments main features template
20a Fully discretionary, partially discretionary or mandatory (in terms of timing) N/A
20b Fully discretionary, partially discretionary or mandatory (in terms of amount) N/A
21 Existence of step up or other incentive to redeem N/A
22 Noncumulative or cumulative N/A
23 Convertible or non-convertible N/A
24 If convertible, conversion trigger(s) N/A
25 If convertible, fully or partially N/A
26 If convertible, conversion rate N/A
27 If convertible, mandatory or optional conversion N/A
28 If convertible, specify instrument type convertible into N/A
29 If convertible, specify issuer of instrument it converts into N/A
30 Write-down features N/A
31 If write-down, write-down trigger(s) N/A
32 If write-down, full or partial N/A
33 If write-down, permanent or temporary N/A
34 If temporary write-down, description of write-up mechanism N/A
35 Position in subordination hierarchy in liquidation (specify instrument type immediately senior to
instrument) N/A
36 Non-compliant transitioned features N/A
37 If yes, specify non-compliant features N/A
(1) Insert 'N/A' if the question is not applicable
Dividends programme
The Company’s Articles of Association (the ”Articles”) provide that the directors may pay dividends, subject to the
provisions of the Articles, the Companies Acts and there being sufficient profit.

Scotiabank Europe plc Capital and Risk Management Pillar 3 Disclosures as at 31 October 2016
32
5 CREDIT AND COUNTERPARTY CREDIT RISK
5.1 Use of External Credit Assessment Institutions (“ECAIs”)
The Company uses the standardised approach when calculating credit and counterparty risk. The standardised approach
requires banks to use risk assessments prepared by ECAIs or Export Credit Agencies (“ECAs”) to determine the risk
weightings applied to rated counterparties.
The Company uses external credit assessments provided by Moody’s Investors Services (“Moody’s”) to determine the risk
weight of rated counterparties in each of the following standardised credit risk exposure classes:
Central governments or central banks
Regional governments or local authorities
Multilateral development banks
International organisations
Institutions
Corporates
Equity
High risk
Exposures in default
The Company uses external credit assessments provided by Dominion Bond Rating Service (“DBRS”) to determine the risk
weight of rated counterparties in the following standardised credit risk exposure class:
Securitisation positions
Moody’s and DBRS are recognised by the PRA as eligible external credit assessment institutions for the purposes of
calculating credit risk requirements under the standardised approach. The external ratings of Moody’s and DBRS are
mapped to the prescribed credit quality step assessment scale that in turn produces standard risk weightings.
When calculating the risk-weighted value of an exposure using ECAI risk assessments, systems look up the available ratings
for customers according to the EBA’s rating selection rules. The system then applies the EBA’s prescribed credit quality step
mapping to derive from the rating the relevant risk weight.
Credit quality step Moody's assessments
1 Aaa to Aa3
2 A1 to A3
3 Baa1 to Baa3
4 Ba1 to Ba3
5 B1 to B3
6 Caa1 and below
Credit quality step DBRS assessments
1 AAA to AA
2 A
3 BBB
4 BB
5 B
6 CCC to D
All other exposure classes are assigned risk weightings as prescribed in the EBA’s rulebook.

Scotiabank Europe plc Capital and Risk Management Pillar 3 Disclosures as at 31 October 2016
33
As the standardised approach applies to both credit and counterparty credit risk, the following table covers both risk
categories. The table below shows the exposure amounts associated with the credit quality steps and the relevant risk
weightings as at (only credit quality steps with exposures are shown):
31 October 2016
Credit quality step Exposure
(pre credit risk mitigation)
Exposure (post credit risk
mitigation) RWAs
Capital requirements
USD '000s USD '000s USD '000s USD '000s
1 6,063,334 3,099,261 154,461 12,357
2 1,446,441 508,262 175,348 14,028
3 788,521 581,144 581,144 46,492
4 246,431 246,166 246,166 19,693
5 72,680 72,680 109,019 8,722
Unrated 38,590,969 7,600,562 6,440,307 515,224
47,208,376 12,108,075 7,706,445 616,516
31 October 2015
Credit quality step Exposure
(pre credit risk mitigation)
Exposure (post credit risk
mitigation) RWAs
Capital requirements
USD '000s USD '000s USD '000s USD '000s
1 7,532,923 2,613,896 110,989 8,879
2 349,464 170,482 70,246 5,620
3 670,630 660,599 660,012 52,801
4 386,366 386,366 386,366 30,909
5 205,888 205,888 308,832 24,707
Unrated 25,676,881 7,785,543 5,585,971 446,878
34,822,152 11,822,774 7,122,416 569,794

Scotiabank Europe plc Capital and Risk Management Pillar 3 Disclosures as at 31 October 2016
34
5.2 Credit risk
Credit risk arises in the Company’s direct lending operations, and in its funding, investment and trading activities where
counterparties have repayment or other obligations to the Company.
The Company utilises the standardised approach when calculating credit and counterparty credit risk for Pillar 1 regulatory
purposes.
The following tables analyse regulatory credit risk weighted exposures and capital requirements as at:
31 October 2016 Exposure value Average exposure
value RWAs
Capital requirements
USD '000s USD '000s USD '000s USD '000s
Credit risk
Standardised approach (SA) exposure classes
Central governments and central banks 2,193,955 2,049,316 8,642 691
Regional governments or local authorities 1,191 1,251 2,976 238
Institutions 292,619 179,301 58,524 4,682
Corporates 6,529,184 6,318,621 6,276,947 502,156
Exposures in default 7,978 11,019 11,967 957
Items associated with particular high risk - 2,624 - -
Equity 1,923 2,150 1,923 154
Securitisation positions 69,736 68,572 34,868 2,789
Other items 38,869 38,639 38,869 3,110
Total 9,135,455 8,671,493 6,434,716 514,777
31 October 2015 Exposure value Average exposure
value RWAs
Capital requirements
USD '000s USD '000s USD '000s USD '000s
Credit risk
Standardised approach (SA) exposure classes
Central governments and central banks 1,908,391 1,788,283 16,226 1,298
Regional governments or local authorities 2,762 2,713 6,905 552
Institutions 61,603 122,286 12,321 986
Corporates 6,220,126 6,049,071 6,131,480 490,518
Exposures in default 9,912 13,242 9,912 793
Items associated with particular high risk 6,721 6,657 10,082 807
Equity 2,432 2,408 2,432 195
Securitisation positions 66,056 16,514 33,028 2,642
Other items 57,757 44,936 57,757 4,621
Total 8,335,760 8,046,110 6,280,143 502,412

Scotiabank Europe plc Capital and Risk Management Pillar 3 Disclosures as at 31 October 2016
35
Geographic distribution of regulatory exposure asset classes as at:
31 October 2016 United Kingdom European Union Rest of world Total
Exposure value RWAs Exposure value RWAs Exposure value RWAs Exposure value RWAs
USD '000s USD '000s
USD '000s USD '000s
USD '000s USD '000s USD '000s USD '000s
Credit risk
Standardised approach (SA) exposure classes
Central governments and central banks 554,998 - 734,066 - 904,891 8,642 2,193,955 8,642
Regional governments or local authorities 1,191 2,976 - - - - 1,191 2,976
Institutions 109,077 21,815 174,625 34,925 8,916 1,783 292,619 58,524
Corporates 1,381,849 1,396,876 1,700,193 1,594,492 3,447,143 3,285,580 6,529,184 6,276,947
Exposures in default - - - - 7,978 11,967 7,978 11,967
Items associated with particular high risk - - - - - - - -
Equity 1,923 1,923 - - - - 1,923 1,923
Securitisation positions - - 69,736 34,868 - - 69,736 34,868
Other items 38,869 38,869 - - - - 38,869 38,869
Total 2,087,907 1,462,459 2,678,620 1,664,285 4,368,928 3,307,972 9,135,455 6,434,716
31 October 2015 United Kingdom European Union Rest of world Total
Exposure value RWAs Exposure value RWAs Exposure value RWAs Exposure value RWAs
USD '000s USD '000s
USD '000s USD '000s
USD '000s USD '000s USD '000s USD '000s
Credit risk
Standardised approach (SA) exposure classes
Central governments and central banks 851,504 - 546,164 - 510,723 16,226 1,908,391 16,226
Regional governments or local authorities 2,762 6,905 - - - - 2,762 6,905
Institutions 4,756 951 25,474 5,095 31,373 6,275 61,603 12,321
Corporates 1,606,435 1,633,368 1,763,566 1,625,922 2,850,125 2,872,190 6,220,126 6,131,480
Exposures in default - - - - 9,912 9,912 9,912 9,912
Items associated with particular high risk 6,721 10,082 - - - - 6,721 10,082
Equity 2,432 2,432 - - - - 2,432 2,432
Securitisation positions - - 66,056 33,028 - - 66,056 33,028
Other items 57,757 57,757 - - - - 57,757 57,757
Total 2,532,367 1,711,495 2,401,260 1,664,045 3,402,133 2,904,603 8,335,760 6,280,143

Scotiabank Europe plc Capital and Risk Management Pillar 3 Disclosures as at 31 October 2016
36
Industry sector classification of regulatory exposure asset classes as at:
31 October 2016 Finance and
insurance
Government, educational,
health and social services
Transportation and storage
Wholesale and retail
Manufacturing Others Total
USD '000s USD '000s USD '000s USD '000s USD '000s USD '000s USD '000s
Credit risk
Standardised approach (SA) exposure classes
Central governments and central banks - 2,188,194 5,761 - - - 2,193,955
Regional governments or local authorities - 1,191 - - - - 1,191
Institutions 292,619 - - - - - 292,619
Corporates 1,298,484 - 1,674,590 449,514 543,810 2,562,786 6,529,184
Exposures in default - - 7,978 - - - 7,978
Items associated with particular high risk - - - - - - -
Equity 1,923 - - - - - 1,923
Securitisation positions 69,736 - - - - - 69,736
Other items - - - - - 38,869 38,869
Total 1,662,762 2,189,385 1,688,329 449,514 543,810 2,601,655 9,135,455
31 October 2015 Finance and
insurance
Government, educational,
health and social services
Transportation and storage
Wholesale and retail
Manufacturing Others Total
USD '000s USD '000s USD '000s USD '000s USD '000s USD '000s USD '000s
Credit risk
Standardised approach (SA) exposure classes
Central governments and central banks - 1,884,916 10,817 - - 12,657 1,908,390
Regional governments or local authorities - - - - - 2,762 2,762
Institutions 61,603 - - - - - 61,603
Corporates 1,292,887 - 1,625,519 165,692 476,988 2,659,041 6,220,127
Exposures in default - - 9,912 - - - 9,912
Items associated with particular high risk 6,721 - - - - - 6,721
Equity 2,432 - - - - - 2,432
Securitisation positions 66,056 - - - - - 66,056
Other items - - - - - 57,757 57,757
Total 1,429,699 1,884,917 1,646,248 165,692 476,988 2,732,216 8,335,760
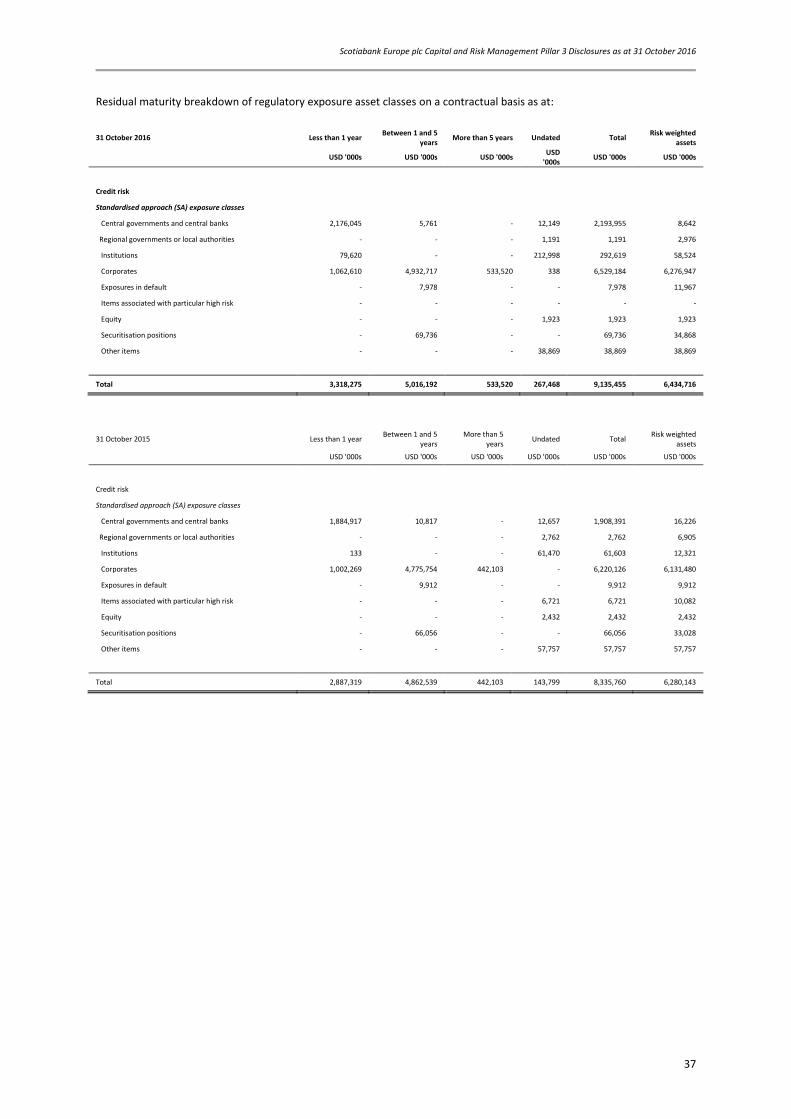
Scotiabank Europe plc Capital and Risk Management Pillar 3 Disclosures as at 31 October 2016
37
Residual maturity breakdown of regulatory exposure asset classes on a contractual basis as at:
31 October 2016 Less than 1 year Between 1 and 5
years More than 5 years Undated Total
Risk weighted assets
USD '000s USD '000s USD '000s USD
'000s USD '000s USD '000s
Credit risk
Standardised approach (SA) exposure classes
Central governments and central banks 2,176,045 5,761 - 12,149 2,193,955 8,642
Regional governments or local authorities - - - 1,191 1,191 2,976
Institutions 79,620 - - 212,998 292,619 58,524
Corporates 1,062,610 4,932,717 533,520 338 6,529,184 6,276,947
Exposures in default - 7,978 - - 7,978 11,967
Items associated with particular high risk - - - - - -
Equity - - - 1,923 1,923 1,923
Securitisation positions - 69,736 - - 69,736 34,868
Other items - - - 38,869 38,869 38,869
Total 3,318,275 5,016,192 533,520 267,468 9,135,455 6,434,716
31 October 2015 Less than 1 year Between 1 and 5
years More than 5
years Undated Total
Risk weighted assets
USD '000s USD '000s USD '000s USD '000s USD '000s USD '000s
Credit risk
Standardised approach (SA) exposure classes
Central governments and central banks 1,884,917 10,817 - 12,657 1,908,391 16,226
Regional governments or local authorities - - - 2,762 2,762 6,905
Institutions 133 - - 61,470 61,603 12,321
Corporates 1,002,269 4,775,754 442,103 - 6,220,126 6,131,480
Exposures in default - 9,912 - - 9,912 9,912
Items associated with particular high risk - - - 6,721 6,721 10,082
Equity - - - 2,432 2,432 2,432
Securitisation positions - 66,056 - - 66,056 33,028
Other items - - - 57,757 57,757 57,757
Total 2,887,319 4,862,539 442,103 143,799 8,335,760 6,280,143

Scotiabank Europe plc Capital and Risk Management Pillar 3 Disclosures as at 31 October 2016
38
5.3 Counterparty credit risk
An economic loss occurs if the transaction or a portfolio of transactions with the counterparty has a positive economic
value at the time of default. It arises for Over-The-Counter (“OTC”) derivatives and SFTs and is calculated in both trading
and non-trading books,
Under Basel III, the Company uses the mark-to-market method when calculating the risk-weighted assets for derivatives
and uses the financial comprehensive method when calculating the risk-weight assets for SFTs.
The table below reflects the counterparty credit risk exposure (including settlement/delivery risk) by exposure class and
product as at:
31 October 2016 Securities Financing
Transactions Derivatives Other Settlement risk
Total counterparty credit risk
Exposure
value RWAs
Exposure value
RWAs Exposure
value RWAs
Exposure value
RWAs Exposure
value RWAs
USD
'000s USD
'000s USD
'000s USD
'000s USD
'000s USD
'000s USD
'000s USD
'000s USD
'000s USD
'000s
By exposure class;
Central governments and central banks
23,479 - 115,280 - - - - - 138,759 -
Institutions 471,469 94,294 202,700 40,540 1,201 240 - - 675,370 135,074
Corporates 614,723 614,722 280,892 280,892 19,650 19,650 50 152 915,315 915,416
Central clearing counterparties
516,196 10,324 558,127 11,163 168,903 199,904 - - 1,243,226 221,391
1,625,867 719,340 1,156,999 332,595 189,754 219,794 50 152 2,972,670 1,271,881
31 October 2015 Securities Financing
Transactions Derivatives Other Settlement risk
Total counterparty credit risk
Exposure
value RWAs
Exposure value
RWAs Exposure
value RWAs
Exposure value
RWAs Exposure
value RWAs
USD
'000s USD
'000s USD
'000s USD
'000s USD
'000s USD
'000s USD
'000s USD
'000s USD
'000s USD
'000s
By exposure class;
Central governments and central banks
25,353 2,035 158,857 - - - - - 184,210 2,035
Institutions 187,915 187,915 480,716 480,716 14,388 14,388 - - 683,019 683,019
Corporates 336,369 67,274 244,470 48,894 1,515 303 - - 582,354 116,471
Central clearing counterparties
488,945 9,779 1,462,213 29,244 86,272 1,725 - - 2,037,430 40,748
1,038,582 267,003 2,346,256 558,854 102,175 16,416 - - 3,487,013 842,273

Scotiabank Europe plc Capital and Risk Management Pillar 3 Disclosures as at 31 October 2016
39
The table below reflects the counterparty credit risk exposure (including settlement/delivery risk) by geographical region as
at:
31 October 2016 United Kingdom European Union Rest of world Total
Exposure
value RWAs
Exposure value
RWAs Exposure
value RWAs
Exposure value
RWAs
USD
'000s USD
'000s USD
'000s USD
'000s USD
'000s USD
'000s USD
'000s USD '000s
By exposure class;
Central governments and central banks
23,479 - 115,280 - - - 138,759 -
Institutions 192,054 38,410 258,818 51,764 224,498 44,900 675,370 135,074
Corporates 496,892 496,891 65,652 65,652 352,771 352,873 915,315 915,416
Central clearing counterparties 1,084,060 187,153 159,166 34,238 - - 1,243,226 221,391
1,796,485 722,454 598,916 151,654 577,269 397,773 2,972,670 1,271,881
31 October 2015 United Kingdom European Union Rest of world Total
Exposure
value RWAs
Exposure value
RWAs Exposure
value RWAs
Exposure value
RWAs
USD
'000s USD
'000s USD
'000s USD
'000s USD
'000s USD
'000s USD
'000s USD
'000s
By exposure class;
Central governments and central banks
15,178 - 169,032 2,035 - - 184,210 2,035
Institutions 108,499 21,700 180,032 36,006 293,823 58,765 582,354 116,471
Corporates 163,922 163,922 64,848 64,848 454,249 454,249 683,019 683,019
Central clearing counterparties 1,939,535 38,790 97,895 1,958 - - 2,037,430 40,748
2,227,134 224,412 511,807 104,847 748,072 513,014 3,487,013 842,273

Scotiabank Europe plc Capital and Risk Management Pillar 3 Disclosures as at 31 October 2016
40
5.4 Impairment of financial assets
5.4.1 Loans and advances and doubtful debts
Loans are designated as non-performing as soon as management has doubts as to the ultimate collectability of principal or
interest or when contractual payments of principal or interest are 90 days overdue. When a loan is designated as non-
performing, an individual impairment provision is raised if required. There are two basic types of provisions, individual
impairment and collective provision.
5.4.2 Individual impairment
For the loans where objective evidence of impairment exists, individual impairments are recognised. Loan impairment is
recognised when, in management’s opinion, there is no longer reasonable assurance that interest and principal payments
will be made on a timely basis. Impairment losses are calculated by discounting the expected future cash flows of a loan at
its original effective interest rate, and comparing the resultant present value with the loan’s current carrying amount. Any
loss is charged in the Statement of Comprehensive Income.
Objective evidence that loans and advances are impaired can include significant financial difficulty of the borrower or
issuer, default or delinquency by a borrower, restructuring of a loan or advance by the Company on terms that the
Company would not otherwise consider, indications that a borrower or issuer will enter bankruptcy, the disappearance of
an active market for a security, or other observable data relating to a group of borrowers or issuers such as adverse
changes in the payment status or economic conditions that correlate with defaults.
A summary of impaired and past due loans is as follows:
Gross Value Impairment Gross Value Impairment
31 October
2016
31 October
2016 31 October 2015 31 October 2015
USD ‘000s USD ‘000s USD ‘000s USD ‘000s
Not past due 23,856,794 - 19,525,812 -
More than 120 days past due 37,476 7,946 13,785 3,871
Of which:
Shipping – Marshall Islands 12,948 7,946 13,785 3,871
Construction – Mexico 24,528 - - -
Total 23,894,270 7,946 19,539,597 3,871
5.4.3 Collective provisions
Collective provisions are made in relation to losses, which although not specifically identified, exist in the loan portfolio
based upon objective evidence at the Statement of Financial Position date. Provisions are charged directly to the
Statement of Comprehensive Income.
Individually assessed loans for which no evidence of loss has been identified are grouped together according to their credit
risk characteristics for the purpose of calculating an estimated collective loss. This arises from impairment at the Statement
of Financial Position date which will only be individually identified in the future.
The collective impairment allowance is determined after taking into account:
Historical loss experience in portfolios of similar credit risk characteristics (for example, by industry sector or loan
grade);
The estimated period between impairment occurring and the loss being identified and evidenced by the
establishment of an appropriate allowance against the individual loan; and

Scotiabank Europe plc Capital and Risk Management Pillar 3 Disclosures as at 31 October 2016
41
Management’s judgement as to whether current economic and credit conditions are such that the actual level of
inherent losses is likely to be greater or less than that suggested by historical experience.
The period between a loss occurring and its identification is estimated by business line management.
5.4.4 Loans written off
The Company has specific provisions of USD 7.9 million as at 31 October 2016 (2015: USD 3.9 million).
The amount of loan write off is assessed on a case by case basis with advice and counsel sought from the Parent. Full or
partial write-offs of loans and advances are generally recorded when management believes there is no realistic prospect of
a full recovery of interest and principal payments being made on a timely basis.
The following table reflects a reconciliation of specific and collective credit risk adjustments for impaired exposures as at:
31 October 2016 Specific Collective Total
USD '000s USD '000s USD '000s
Balance as at 1 November 2015 3,871 20,471 24,342
Amounts written off - - -
Recoveries of advances written off in previous year 9 - 9
Charge to the Statement of Comprehensive Income 4,066 7,229 11,295
Other movements - - -
Balance as at 31 October 2016 7,946 27,700 35,646
31 October 2015 Specific Collective Total
USD '000s USD '000s USD '000s
Balance as at 1 November 2014 - 25,571 25,571
Amounts written off - - -
Recoveries of advances written off in previous year 36 - 36
Charge to the Statement of Comprehensive Income 3,835 (4,214) (379)
Other movements - (886) (886)
Balance as at 31 October 2015 3,871 20,471 24,342
The collective provision for bad and doubtful debts is made against loans and advances to cover incurred loan losses, which
are present in any portfolio of loans and advances of this size although not specifically identified. The collective provision
reflects the Directors’ view of such losses in the portfolio given current lending levels, the credit cycle and the economic
climate.

Scotiabank Europe plc Capital and Risk Management Pillar 3 Disclosures as at 31 October 2016
42
5.5 Credit risk mitigation
Refer to Page 13-15 of the document for further information on credit risk mitigation techniques.
5.5.1 Valuing collateral
Valuation strategies are established to monitor collateral mitigants to ensure that they will continue to provide the
anticipated secure secondary repayment source. The frequency of valuation depends on the class of asset. At the one
extreme e.g. term notes supported by mortgage collateral, valuation of the notes against the loan will be carried out
daily. At the other extreme, professional independent valuations of collateral such as ships are more likely to be required
once or twice a year. A margin requiring excess collateral value to the loan value, with triggers requiring the collateral to be
increased when breached, will generally be required.
The table below reflects the collateral utilised to mitigate exposure by geographical region as at:
31 October 2016 United Kingdom European Union Rest of world Total
USD '000s USD '000s USD '000s USD '000s
By exposure class;
Central governments and central banks 617,975 - - 617,975
Corporates 11,970,629 28,164 1,705,284 13,704,078
Institutions 13,461,639 7,182,045 134,565 20,778,248
Total 26,050,243 7,210,209 1,839,849 35,100,301
31 October 2015 United Kingdom European Union Rest of world Total
USD '000s USD '000s USD '000s USD '000s
By exposure class;
Central governments and central banks 833,472 581,342 - 1,414,814
Corporates 4,894,780 33,488 257,632 5,185,900
Institutions 9,171,287 3,375,165 3,852,213 16,398,665
Total 14,899,539 3,989,995 4,109,845 22,999,379

Scotiabank Europe plc Capital and Risk Management Pillar 3 Disclosures as at 31 October 2016
43
The table below reflects the exposure for each asset class that is covered by eligible financial collateral as at:
31 October 2016 Exposure
(pre-collateral) Collateral
Exposure (post-collateral)
USD ‘000s USD ‘000s USD '000s
By exposure class;
Central governments or central banks 2,950,691 617,975 2,332,716
Regional governments or local authorities 1,191 - 1,191
Corporates 21,148,526 13,704,078 7,444,448
Exposures in default 7,978 - 7,978
Institutions 22,989,462 20,778,248 2,211,214
Items associated with particular high risk - - -
Equity 1,923 - 1,923
Other items 38,869 - 38,869
Securitisation positions 69,736 - 69,736
Total 47,208,376 35,100,301 12,108,075
31 October 2015 Exposure
(pre-collateral) Collateral
Exposure (post-collateral)
USD ‘000s USD ‘000s USD '000s
By exposure class;
Central governments or central banks 3,507,415 1,414,814 2,092,601
Regional governments or local authorities 2,762 - 2,762
Corporates 12,089,044 5,185,900 6,903,144
Exposures in default 9,912 - 9,912
Institutions 19,080,053 16,398,665 2,681,388
Items associated with particular high risk 6,721 - 6,721
Equity 2,432 - 2,432
Other items 57,757 - 57,757
Securitisation positions 66,056 - 66,056
Total 34,822,152 22,999,379 11,822,773
The Company has analysed the eligibility of collateral under all approaches and methods as defined in CRR Article 197.
5.5.2 Treatment of guarantees
A guarantee does not reduce the amount of the exposure that the Company is subject to, however it can reduce the risk
weighting applied to the loan when calculating credit risk. As at 31 October 2016, the effect of a guarantee in place
transferred USD 125 million of exposure from 100% to 20% risk weighting (2015: USD 125 million). The obligor and the
guarantor both fall within ‘Corporates’ exposure class.

Scotiabank Europe plc Capital and Risk Management Pillar 3 Disclosures as at 31 October 2016
44
6 CREDIT VALUATION ADJUSTMENT
The Company’s regulatory capital charge for credit valuation was USD 1.9 million as at 31 October 2016 (2015: USD 1.7
million). The Company uses the Standardised method to calculate credit valuation adjustments.
CRD IV introduced a new regulatory capital charge to cover the risk of mark-to-market losses on expected counterparty risk
derivatives and SFTs; this is called a credit valuation adjustment.
6.1 Derivative assets analysis
Under IFRSs, netting is only permitted if a legal right of set-off exists and the cash flows are intended to be settled on a net
basis. Under EBA regulatory rules, however, netting is applied for capital calculations if there is a legal certainty and the
positions are managed on a collateralised basis.
The table below reflects a comparison of derivative assets accounting balances and counterparty credit risk exposure as at:
31 October 2016 Accounting Regulatory
USD '000s USD '000s
Gross positive fair value of contracts 946,378 946,378
Netting benefits (502,493) (750,081)
Netted current credit exposure 443,885 196,297
Collateral held - (5,080)
Net derivatives credit exposure 443,885 191,217
31 October 2015 Accounting Regulatory
USD '000s USD '000s
Gross positive fair value of contracts 1,755,009 1,755,009
Netting benefits (856,851) (1,315,612)
Netted current credit exposure 898,158 439,397
Collateral held - (11,983)
Net derivatives credit exposure 898,158 427,414

Scotiabank Europe plc Capital and Risk Management Pillar 3 Disclosures as at 31 October 2016
45
6.2 Reverse repurchase agreements and other similar secured lending analysis
Under IFRSs, the assets and liabilities are offset and the net amount is reported in the financial statements when there is a
legally enforceable right to offset the recognised amounts and there is an interaction to settle on a net basis, or realise the
asset and settle the liability as simultaneously.
The table below reflects the impact of master netting arrangements on reverse repurchase agreements and other similar
secured lending as at:
31 October 2016 31 October 2015
USD ‘000s USD ‘000s
Reverse repurchase agreements and other similar secured lending (gross) 14,594,733 12,363,495
Netting arrangements (1,617,831) (4,140,303)
Reverse repurchase agreements and other similar secured lending (net) 12,976,902 8,223,192
7 SECURITISATION
The Company is involved in securitisation deals where it acts as an investor as at the reporting date. Although the Company
has acted as an investor in previous financial periods, the current deals are new for the year. The securitisation comprises
the senior tranches of auto asset backed securities.
The positions are reflected in the table below:
31 October 2016 On Balance Sheet Off Balance Sheet Total Risk weighed assets Fair value hierarchy
USD '000s USD '000s USD '000s USD '000s
Loans and receivables 57,228 12,508 69,736 34,868 Level 3
57,228 12,508 69,736 34,868
31 October 2015 On Balance Sheet Off Balance Sheet Total Risk weighed assets Fair value hierarchy
USD '000s USD '000s USD '000s USD '000s
Loans and receivables 49,238 16,818 66,056 33,028 Level 3
49,238 16,818 66,056 33,028
Accounting treatment
Loans and receivables are initially recorded at fair value plus any attributable transaction costs and subsequently measured
at amortised cost using the effective interest rate method, less impairment losses. Level 3 inputs are unobservable inputs
for the asset or liability (i.e. not based on observable market data).

Scotiabank Europe plc Capital and Risk Management Pillar 3 Disclosures as at 31 October 2016
46
Monitoring
Scotiabank’s asset-backed finance team performs monthly surveillance and analysis of the transactions based on the
settlement report provided by the borrower. A formal review and update is provided to the Parent’s credit team at least
annually and a third party audit firm conducts an annual due diligence of the securitisation report and associated
mechanics.
Credit risk
The securitisations are subject to a credit risk capital charge under the standardised approach and the capital requirement
is USD 2.8 million as at 31 October 2016 (2015: USD 2.6 million). Using DBRS ratings, the loans and receivables position
attracts a risk-weighting of 50%.
Other risks
There are a number of inherent risks in purchasing certain securitised notes including: the performance of the underlying
assets; the explicit support of the Issuer and its financial stability; volatility in the market value of securitised notes; and
liquidity risk that the SPV issuing the purchased securitisation notes has insufficient income from the underlying assets to
meet its obligations.
8 MARKET RISK
The Company adopts the standardised approach to calculate market risk for regulatory purposes, more specifically
maturity based method for calculation of general debt instruments risk and maturity ladder approach for commodity risk.
The table below provides risk weighted exposure amounts and capital requirements arising from Market risk as at:
31 October 2016 Risk weighted exposure Capital requirements
USD '000s USD '000s
Market risk
Traded debt instruments 526,132 42,091
Foreign exchange 2,154 172
Commodities 918,975 73,518
Underwriting - -
Total 1,447,261 115,781
31 October 2015 Risk weighted exposure Capital requirements
USD '000s (restated)
USD '000s (restated)
Market risk
Traded debt instruments 638,125 65,700
Foreign exchange 6,098 488
Commodities 785,625 62,850
Underwriting 77,670 6,214
Total 1,507,518 120,602
During the year the Company has made a change to its commodity risk capital calculation and therefore the FY15 charge
reported above has been revised for comparative purposes.

Scotiabank Europe plc Capital and Risk Management Pillar 3 Disclosures as at 31 October 2016
47
9 OPERATIONAL RISK
The Company uses the Basic Indicator Approach (“BIA”) for calculating the capital requirement for Operational risk which is
15% of the average over three years of the relevant indicator, and uses audited figures to perform the calculations. The
relevant indicator is the sum of all the elements listed below:
Interest receivable and similar income
Interest payable and similar charges
Income from shares and other variable / fixed – yield securities
Commissions / fees receivable
Commissions / fees payable
Net profit or loss on financial operations
Other operating income
The table below provides the risk weighted exposure amounts and capital requirements for Operational risk as at:
31 October 2016 Risk weighted exposure Capital requirements
USD '000s USD '000s
Operational risk
Operational Risk (BIA) 449,920 35,994
Total 449,920 35,994
31 October 2015 Risk weighted exposure Capital requirements
USD '000s USD '000s
Operational risk
Operational Risk (BIA) 441,596 35,328
Total 441,596 35,328

Scotiabank Europe plc Capital and Risk Management Pillar 3 Disclosures as at 31 October 2016
48
10 COUNTERCYCLICAL CAPITAL BUFFER
Since 1 January 2016 the Company is required to maintain an institution-specific Countercyclical Buffer (“CCyB”). This
requirement follows closely the international approach of Basel III, with the primary objective to achieve the broader
macro-prudential goal of protecting the banking sector from periods of excess aggregate credit growth that have often
been associated with the build-up of system-wide risk.
The CCyB is calculated as the weighted average of the buffers in effect in the jurisdictions to which the Company has a
credit exposure, and must be set between 0% and 2.5%. It consists entirely of Common Equity Tier 1 capital and, if the
minimum buffer requirements are breached, capital distribution constraints will be imposed on the Company.
The CCyB implementation includes a transitional period, with the CCyB rate capped at 0.625% prior to 31 December 2016,
at 1.25% from 1 January 2017 until 31 December 2017, and 1.875% from 1 January 2018 until 31 December 2018. The CCyB
rate will be capped at 2.5% from 1 January 2019.
The table below provides the geographical distribution of its credit exposures relevant for the calculation of its
countercyclical capital buffer:
General credit
exposures
Trading Book
exposures
Securitisation
exposures
Own funds requirements
Row Exposure value for
SA
Sum of long and
short positions of trading
book exposures
for SA
Exposure value for
SA
of which: General Credit
exposures
of which: Trading
Book exposures
of which:
Securitisation
exposures
Total Own Funds requirements
weights
Countercyclical capital buffer rate
USD '000s USD '000s USD '000s USD '000s USD '000s USD '000s
USD '000s
USD '000s %
010 030 050 070 080 090 100 110 120
010 Breakdown by country:
Australia 755,311 52,348 52,348 0.0897
Barbados 1,200 144 144 0.0002
Belgium 169,613 13,569 13,569 0.0233
Bermuda 218,572 17,486 17,486 0.0300
Brazil 528 42 42 0.0001
British Virgin Islands
117,054 9,364 9,364 0.0161
Canada 22,425 5,983 1,794 96 1,890 0.0032
Cayman Islands 60,553 4,844 4,844 0.0083
Chile 28,390 2,271 2,271 0.0039
China, People's Republic
1,369 110 110 0.0002
Curaçao 11,126 890 890 0.0015
France 240,961 11,277 11,277 0.0193
Germany 213,670 15,559 15,559 0.0267
Guernsey 50,384 4,031 4,031 0.0069
Hong Kong 14,076 1,126 1,126 0.0019 0.625
India 42,269 3,382 3,382 0.0058
Ireland 92,837 69,736
7,427 2,789 10,216 0.0175
Israel 75,778 6,062 6,062 0.0104
Italy 27,904 2,232 2,232 0.0038

Scotiabank Europe plc Capital and Risk Management Pillar 3 Disclosures as at 31 October 2016
49
Japan 9,517 761 761 0.0013
Jersey 147,479 11,798 11,798 0.0202
Korea, Republic of 3,464 277 277 0.0005
Kuwait 133,721 10,698 10,698 0.0183
Liberia 129,763 10,381 10,381 0.0178
Luxembourg 157,808 13,703 13,703 0.0235
Malaysia 2,883 231 231 0.0004
Malta 33,343 2,667 2,667 0.0046
Marshall Islands 283,241 22,978 22,978 0.0394
Mauritius 99,627 7,970 7,970 0.0137
Mexico 85,321 110 6,826 9 6,834 0.0117
Monaco 17,661 1,413 1,413 0.0024
Netherlands 605,684 60,687 48,455 190 48,645 0.0834
Norway 464,425 494 37,133 1 37,135 0.0637 1.5
Other United Arab Emirates
2,426 194 194 0.0003
Panama 10,593 847 847 0.0015
Peru 58,112 6,323 4,648 101 4,750 0.0081
Singapore 66,333 5,307 5,307 0.0091
South Africa 88,537 7,083 7,083 0.0121
Spain 124,495 9,960 9,960 0.0171
Sweden 99,530 16,007 7,962 256 8,219 0.0141 1.5
Switzerland 535,090 37,932 37,932 0.0650
United Kingdom 1,920,723 155,003 155,003 0.2657
United States 270,613 21,649 21,649 0.0371
020 Total 7,494,409 89,604 69,736 579,836 653 2,789 583,278 1
As at the 31st October 2016 the Company’s CCyB requirement amounted to USD 11.3 million.
The table below provides the amount of the company’s institution specific countercyclical capital buffer:
Row
USD ‘000s
010
010 Total Risk exposure amount 9,627,737
020 Institution specific countercyclical capital buffer 0.1178%
030 Institution specific countercyclical capital buffer requirement 11,345
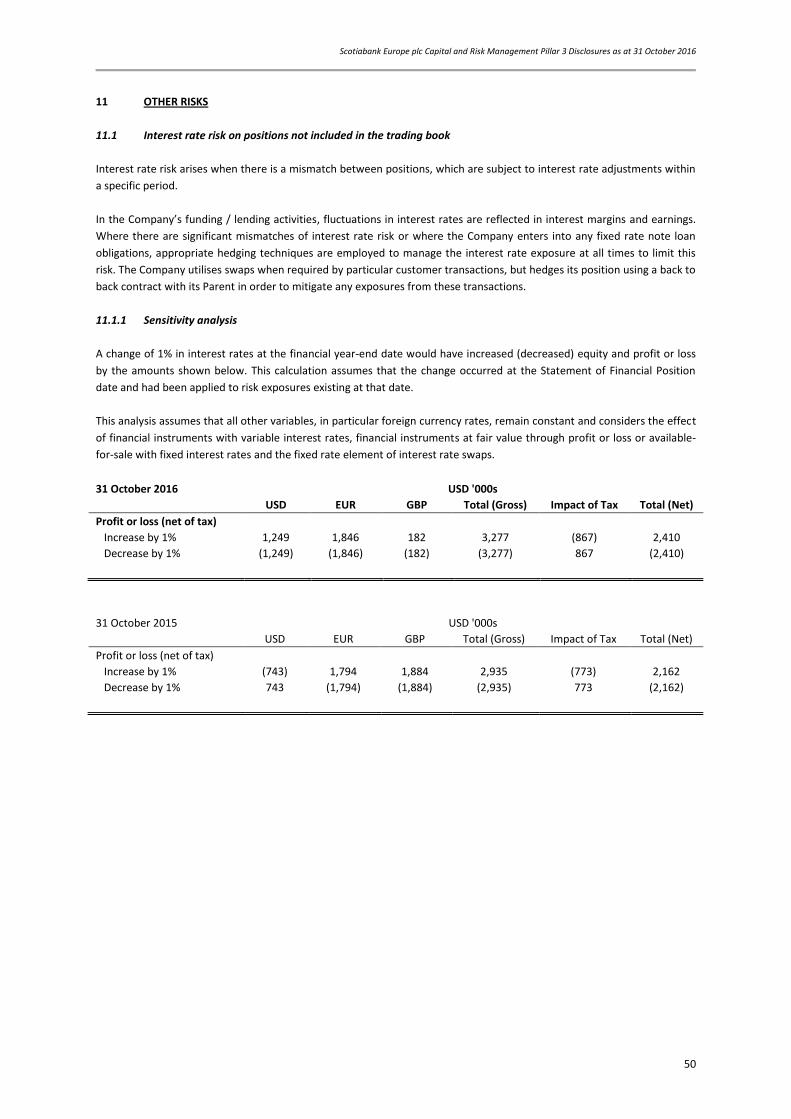
Scotiabank Europe plc Capital and Risk Management Pillar 3 Disclosures as at 31 October 2016
50
11 OTHER RISKS
11.1 Interest rate risk on positions not included in the trading book
Interest rate risk arises when there is a mismatch between positions, which are subject to interest rate adjustments within
a specific period.
In the Company’s funding / lending activities, fluctuations in interest rates are reflected in interest margins and earnings.
Where there are significant mismatches of interest rate risk or where the Company enters into any fixed rate note loan
obligations, appropriate hedging techniques are employed to manage the interest rate exposure at all times to limit this
risk. The Company utilises swaps when required by particular customer transactions, but hedges its position using a back to
back contract with its Parent in order to mitigate any exposures from these transactions.
11.1.1 Sensitivity analysis
A change of 1% in interest rates at the financial year-end date would have increased (decreased) equity and profit or loss
by the amounts shown below. This calculation assumes that the change occurred at the Statement of Financial Position
date and had been applied to risk exposures existing at that date.
This analysis assumes that all other variables, in particular foreign currency rates, remain constant and considers the effect
of financial instruments with variable interest rates, financial instruments at fair value through profit or loss or available-
for-sale with fixed interest rates and the fixed rate element of interest rate swaps.
31 October 2016 USD '000s
USD EUR GBP Total (Gross) Impact of Tax Total (Net)
Profit or loss (net of tax)
Increase by 1% 1,249 1,846 182 3,277 (867) 2,410
Decrease by 1% (1,249) (1,846) (182) (3,277) 867 (2,410)
31 October 2015 USD '000s
USD EUR GBP Total (Gross) Impact of Tax Total (Net)
Profit or loss (net of tax)
Increase by 1% (743) 1,794 1,884 2,935 (773) 2,162
Decrease by 1% 743 (1,794) (1,884) (2,935) 773 (2,162)

Scotiabank Europe plc Capital and Risk Management Pillar 3 Disclosures as at 31 October 2016
51
11.2 Equities not included in the trading book
The Company had unlisted equity investments in the non-trading book of USD 1.9 million as at 31 October 2016 (2014: USD
4.8 million) which are non-core assets and classified as available-for-sale items.
The Equities are London Metal Exchange (“LME”) class B shares and held for clearing member status. Historically, the
Company had invested in various Leverage buy-out funds which have all been sold.
The table below reflects a breakdown of non-trading book equity investments as at:
31 October 2016 31 October 2015
USD ‘000s USD '000s
Leverage buy-out funds (unlisted) - 2,396
Equities (unlisted) 1,923 2,432
Total drawn amount 1,923 4,828
Accounting treatment
Equities classified as available-for-sale assets are initially recognised at fair value plus any attributable transaction costs and
changes therein are recognised directly in equity through Other Comprehensive Income. When equity is derecognised, the
cumulative gain or loss in equity is transferred to the Statement of Comprehensive Income. The fair value of these assets is
determined by reference to their quoted market price or, if not available, a recognised valuation technique. Level 2 inputs
are inputs other than quoted prices included within Level 1 that are observable for the asset or liability, either directly (i.e.
as prices) or indirectly (i.e. derived from prices).
The net gain from disposal of equity securities amounted to USD 0.3 million for the financial year ended 31 October 2016
(2015: USD 1.3 million). The unrealised gains recorded through the Other Comprehensive Income amounted to USD nil as
at 31 October 2016 (2015: USD 1.0 million).
Valuation
The LME shares have no dividend participation and are valued at historical purchase price. The Leverage buy-out funds are
valued by the General Partner.
Credit risk
The capital requirements for Equities amounted to USD 0.2 million. The Leverage buy-out fund, sold during the year, was
classified as high risk for regulatory reporting purposes.

Scotiabank Europe plc Capital and Risk Management Pillar 3 Disclosures as at 31 October 2016
52
12 LEVERAGE
The leverage ratio is a transparent, comparable measure not affected by risk weightings. It is calculated as tier 1 capital
divided by total exposure measure as per CRD IV article 429(2). The company has chosen to calculate the leverage ratio
using total tier 1 capital as per CRD IV article 499(2).
At 31 October 2016 the leverage ratio was 6.20% (6.07% average for 12 months), significantly above PRAs proposed
minimum of 3% and above the internal minimum requirement set by the Board of Directors.
The level of leverage is actively monitored by the company’s Board of Directors, Asset Liability Committee and Audit Committee and regularly assessed alongside capital and capital ratios. The committees also monitor compliance with risk management, assist in assessing market trends, economic and political developments, and providing global strategic direction for all aspects of risk management. Additionally a Risk Committee of the Board provides a forum for in-depth review and analysis of the risks to which the Company is subject.
The leverage ratio has decreased by 0.69% during the year. Total exposure value has increased by USD 2.5 billion mainly
due to increased reverse repurchase agreement trading.
Summary reconciliation of accounting assets and leverage ratio exposures 31 October 2016 31 October 2015
USD 'millions USD 'millions
Total assets as per published financial statements 24,970 20,955
Adjustments for derivative financial instruments 713 1,459
Adjustments for SFTs 489 1,052
Adjustments for off-balance sheet items (i.e. conversion to credit equivalent amounts of off-balance sheet exposures)
1,863 2,043
Other adjustments 17 10
Total leverage ratio exposure 28,052 25,519

Scotiabank Europe plc Capital and Risk Management Pillar 3 Disclosures as at 31 October 2016
53
Leverage ratio common disclosure
USD ‘millions
2016 2015
On-balance sheet exposures (excluding derivatives and SFTs)
On-balance sheet items (excluding derivatives, SFTs and fiduciary assets, but including collateral) 24,555 20,077
(Asset amounts deducted in determining Tier 1 capital) (10) (11)
Total on-balance sheet exposures (excluding derivatives, SFTs and fiduciary assets) (sum of lines 1 and 2) 24,545 20,066
Derivative exposures
Replacement cost associated with all derivatives transactions (i.e net of eligible cash variation margin) 191 439
Add-on amounts for PFE associated with all derivatives transactions (mark-to-market method) 966 1,918
Exposure determined under Original Exposure method - -
Gross-up for derivatives collateral provided where deducted from the balance sheet assets pursuant to the applicable accounting framework
- -
(Deductions of receivables assets for cash variation margin provided in derivatives transactions) - -
(Exempted central clearing counterparty (“CCP”) leg of client-cleared trade exposures) - -
Adjusted effective notional amount of written credit derivatives - -
(Adjusted effective notional offsets and add-on deductions for written credit derivatives) - -
Total derivative exposures 1,157 2,358
Securities financing transaction exposures
Gross SFT assets (with no recognition of netting), after adjusting for sales accounting transactions - -
(Netted amounts of cash payables and cash receivables of gross SFT assets) - -
Counterparty credit risk exposure for SFT assets 489 1,052
Derogation for SFTs: Counterparty credit risk exposure in accordance with Articles 429b(4) and 222 of Regulation (EU) No 575/2013
- -
Agent transaction exposures - -
(Exempted CCP leg of client-based SFT exposure) - -
Total securities financing transaction exposures 489 1,052
Other off-balance sheet exposures
Off-balance sheet exposures at gross notional amount 4,094 4,174
(Adjustments for conversion to credit equivalent amounts) (2,233) (2,131)
Other off-balance sheet exposures 1,862 2,043
Exempted exposures in accordance with Article 429(7) and (14) of Regulation (EU) No 575/2013 (on and off balance sheet)
(Intragroup exposures (solo basis) exempted in accordance with Article 429(7) of Regulation (EU) No 575/2013 (on and off balance sheet)
- -
(Exposures exempted in accordance with Article 429(14) of Regulation (EU) No 575/2013 (on an off balance sheet)
- -
Capital and total exposures
Tier 1 capital 1,741 1,759
Leverage ratio total exposure measure 28,052 25,519
Leverage ratio
Leverage ratio 6.21% 6.89%
Choice on transitional arrangements and amount of derecognised fiduciary items
Choice on transitional arrangements for the definition of the capital measure FULL IMPACT FULL IMPACT
Amount of derecognised fiduciary items in accordance with Article 429(11) of Regulation (EU) N 575/2013 - -

Scotiabank Europe plc Capital and Risk Management Pillar 3 Disclosures as at 31 October 2016
54
Split-up of on balance sheet exposures (excluding derivatives, SFTs and exempted exposures) USD ’millions
2016 2015
Total on-balance sheet exposures (excluding derivatives, SFTs, and exempted exposures), of which:
24,545 20,066
Trading book exposures 17,282 13,751
Banking book exposures, of which: 7,263 6,315
Exposures treated as sovereigns 2,195 1,898
Institutions 293 46
Corporate 4,679 4,304
Exposures in default 8 -
Other exposures (e.g. equity, securitisations, and other non-credit obligation assets) 88 67

Scotiabank Europe plc Capital and Risk Management Pillar 3 Disclosures as at 31 October 2016
55
13 ASSET ENCUMBRANCE
An asset would be treated as encumbered if it has been pledged or if it is subject to any form of arrangement to secure,
collateralise or credit enhance any transaction from which it cannot be freely withdrawn.
The Pillar 3 asset encumbrance disclosure templates, shown below, have been compiled in accordance with EBA’s
guidelines on disclosure of encumbered and unencumbered assets and the PRA’s supervisory statement SS11/14 (“CRD IV:
Compliance with the EBA’s Guidelines on the disclosure of encumbered and unencumbered assets”). In accordance with
the threshold criteria under SS11/14, the Company is not required to report Template B on the fair value of encumbered
and unencumbered collateral received. Furthermore, the statement requires that the data is presented as a median
calculation rather than point in time.
Table A and Table C below reflect the median of the last four quarters as at 31 October 2016:
Template A: Encumbered and unencumbered assets
Carrying amount
of encumbered assets
Fair Value of encumbered
assets
Carrying amount of
unencumbered assets
Fair value of unencumbered
assets
USD '000s USD '000s USD '000s USD '000s
010 040 060 090
010 Assets of the reporting institution
5,032,890 - 20,017,532 -
030 Equity instruments - - 2,185 2,185
040 Debt securities 4,125,277 4,125,277 2,675,210 2,675,210
120 Other assets 988,765 - 17,465,875 -
Template C: Encumbered Assets, Collateral Received and Associated Liabilities
Matching liabilities,
contingent liabilities or securities lent
Assets, collateral received and own debt securities
issued other than covered bonds and ABSs
encumbered
USD '000s USD '000s
010 030
010 Carrying amount of selected financial liabilities 15,205,210 14,969,776
Template D: Information on importance of encumbrance
As an integral aspect of its business, the Company engages in activities that result in certain assets being encumbered. The majority of encumbrance arises from its secured financing transactions, including repos/reverse repos and securities lending. Other sources of encumbrance are collateral placed at CCPs and clearing banks (including default funds and initial margins) and the minimum reserves placed at Bank of England. The Company primarily adopts standard collateral agreements and collateralises based on industry standard contractual agreements (mostly CSA, IDA, PSA or GMRA). The majority of the unencumbered assets are reverse repurchase agreements and stock borrowing receivables and loans and advances. Other unencumbered assets include cash, derivative assets, property and equipment, deferred tax assets and other assets.

Scotiabank Europe plc Capital and Risk Management Pillar 3 Disclosures as at 31 October 2016
56
Table A and Table C below reflect the median of the last four quarters as at 31 October 2015:
Template A: Encumbered and unencumbered assets
Carrying amount
of encumbered assets
Fair Value of encumbered
assets
Carrying amount of
unencumbered assets
Fair value of unencumbered
assets
USD '000s USD '000s USD '000s USD '000s
010 040 060 090
010 Assets of the reporting institution
5,660,876 - 17,839,772 -
030 Equity instruments - - 4,766 4,766
040 Debt securities 4,953,185 4,953,185 2,081,846 2,081,846
120 Other assets 707,691 - 15,753,160 -
Template C: Encumbered Assets, Collateral Received and Associated Liabilities
Matching liabilities,
contingent liabilities or securities lent
Assets, collateral received and own debt securities
issued other than covered bonds and ABSs
encumbered
USD '000s USD '000s
010 030
010 Carrying amount of selected financial liabilities 14,829,358 15,289,886
Template D: Information on importance of encumbrance
As an integral aspect of its business, the Company engages in activities that result in certain assets being encumbered. The majority of encumbrance arises from its secured financing transactions, including repos/reverse repos and securities lending. Other sources of encumbrance are collateral placed at CCPs and clearing banks (including default funds and initial margins) and the minimum reserves placed at Bank of England. The Company primarily adopts standard collateral agreements and collateralises based on industry standard contractual agreements (mostly CSA, IDA, PSA or GMRA). The majority of the unencumbered assets are reverse repurchase agreements and stock borrowing receivables and loans
and advances. Other unencumbered assets include cash, derivative assets, property and equipment, deferred tax assets
and other assets.

Scotiabank Europe plc Capital and Risk Management Pillar 3 Disclosures as at 31 October 2016
57
14 REMUNERATION
All staff are employed by the Parent and those that provide services to the Company do so either under internal
secondment arrangements or pursuant to intergroup service level agreements.
14.1 Qualitative Disclosure
14.1.1 Governance
Role of the Compensation Committee
The Parent has an established Human Resources Committee (“HRC”), based in Toronto, which is responsible for setting
global, bank-wide policies for Scotiabank on compensation, overseeing the compensation governance framework and
ensuring that compensation arrangements are consistent with and promote effective risk management. In addition, the
HRC annually approves the remuneration policy statement that applies to the Company, as well as individual awards to
Material Risk Takers (“MRTs”) who are subject to the UK’s Remuneration Code for Firms that are dual regulated by the FCA
and the PRA.
The HRC also reviews the total compensation principles and major compensation programmes of Scotiabank and
recommends to the Parent board the total compensation to be paid or awarded to executive officers of Scotiabank and
other Parent board-appointed officers, agreements and employment contracts applicable to executive officers and other
Parent board appointed officers, general criteria and design of Scotiabank’s major incentive plans, and the basis and
allocation for distribution of awards relating to various other incentive plans.
Decision-making process of the Compensation Committee
The HRC assumes decision-making responsibilities relating to compensation and annual disclosure. It reviews and
recommends the content and effectiveness of compensation policy, as informed by corporate human resources and
independent advisors, and ensures that they align with Scotiabank’s strategic objectives.
To achieve this, the HRC is responsible for:
Overseeing robust succession plans to provide effective leadership
Reviewing compensation principles and alignment of these compensation principles with Scotiabank’s pay for
performance strategy as well as Scotiabank’s risk appetite
Monitoring compensation and governance trends, staying abreast of regulatory requirements and monitoring
compliance
Reviewing major compensation programmes and making recommendations to the Parent board with respect to
compensation plans
Reviewing compensation disclosure and recommending approval to the Parent board prior to publication
The HRC held seven meetings in 2016 including two joint sessions with the Parent’s Risk Committee (2015: seven
meetings).
More information on HRC compensation decision-making can be found in the Parent’s Management Proxy Circular at
http://www.scotiabank.com/ca/en/0,,917,00.html.
Composition of the Compensation Committee
Current members of the HRC are: Aaron Regent (Chair), Nora Aufreiter, Ronald Brenneman, William Fatt, Thomas O'Neill,
Indira Samarasekera, Una Power and Barbara Thomas. The members of the HRC are all non-executive directors of the
Parent.

Scotiabank Europe plc Capital and Risk Management Pillar 3 Disclosures as at 31 October 2016
58
External Consultants
The HRC retains an external, qualified third party to advise them on compensation matters. The Committee has policies
which make sure the advisor is, and remains, independent. In 2016, Frederic W. Cook & Co. (“FWC”), working without
direction from management, provided the HRC with updates on ongoing and emerging trends in executive compensation
and governance, competitive analysis of the Parent’s CEO compensation, review of materials in advance of committee
meetings, and the identification of discussion points and issues for the Committee’s consideration when evaluating
compensation design proposals. FWC is an independent executive compensation consulting firm based in New York.
Role of SBE Board and Senior Manager Function 12
While the HRC acts as the Company’s remuneration committee, the Company Board is kept informed of UK remuneration
adequacy, effectiveness and related governance. The Company Board has appointed a Non-Executive Director (“NED”) to
ensure remuneration programmes are in line with UK regulatory requirements. The NED and Company Board are
responsible for being aware of any matters to be discussed or decisions made by the HRC which are relevant to the
Company and provide local oversight, review and input on remuneration matters, where appropriate. From a regulatory
perspective, the NED fulfils PRA’s role of chairman of remuneration committee function (i.e., senior management function
12 or “SMF12”) for the Company.
MRT Criteria
Scotiabank follows EBA regulatory technical standards1 and identifies the following groups of employees as MRT:
(a) Executive level employees (UK resident Executive Directors of UK subsidiaries);
(b) Employees leading business line functions with a significant proportion of revenues, numbers of front office staff and
capital usage;
(c) Employees leading stewardship functions including compliance, finance, legal, audit and HR;
(d) Employees responsible for developing and implementing Scotiabank and business line strategy;
(e) Senior management whose activities are deemed to have a material impact on the Scotiabank risk profile in the UK;
and
(f) Higher earners who have a material impact on the risk profile of UK subsidiaries.
Scotiabank also followed guidance from a Bank of England letter to proportionality level two firms and have considered
individuals who expose the firm to a material level of harm, including reputational harm when identifying MRTs.
Note: 1 Under Article 92(2) of the CRD, the EBA introduced regulatory technical standards to set out the criteria to identify categories of staff
whose professional activities have a material impact on the firm’s risk profile (Regulation (EU) No 604/2014)
14.1.2 Link between pay and performance
In addition to base salary and role-based allowance, Scotiabank’s executive compensation includes a mix of annual and
deferred incentives – which are known as “pay-at-risk,” since they are not guaranteed. Executives are also eligible to
participate in benefit, pension, and perquisite programmes.
In determining the appropriate mix, the HRC considers the executive’s ability to effect results over the longer term, the mix
for similar positions in Scotiabank’s comparator group, and market practice.
More information on pay and performance can be found in the Parent’s Management Proxy Circular.

Scotiabank Europe plc Capital and Risk Management Pillar 3 Disclosures as at 31 October 2016
59
14.1.3 Design and Structure of Remuneration
Salary
Base salary compensates executives for fulfilling their day-to-day roles and responsibilities, including leadership and
management skills. Total compensation, including base salary and incentives, is reviewed annually and adjusted where
appropriate based on an executive’s role and experience, sustained performance, internal job value and local external
market practice.
Role-based Allowance (“RBA”)
In fulfilment of the CRD IV regulatory requirements, the role-based allowance was implemented in 2015 as a potential
element of an eligible employee’s fixed annual pay. The amount of the role-based allowance is determined by taking into
account “market compensation” for a role. “Market compensation” includes other remuneration that an employee in that
role may receive. RBAs are pre-determined, non-discretionary, not dependent on performance, not an incentive for risk-
taking by the employee, non-revocable and cannot be cancelled, reduced or suspended except for in limited
circumstances. An adjustment to RBA will normally only be made following a change in the role or function performed by
the eligible employee or a change in the market value of or market compensation for the role, or to comply with or take
account of any regulatory changes in any jurisdiction in which the RBA is paid.
Benefit Pension Plan
The Scotiabank Pension Scheme (UK & CI), a registered defined benefit pension plan was closed to new members in July
2005 and was closed to future accruals effective 31 October 2016. Starting 1 November 2016, all employees are eligible to
participate in the Scotiabank Group Personal Pension Plan (“GPPP”), an approved defined contribution plan. Participants in
the GPPP have the option to be either contributory or non- contributory members.
14.1.4 Annual Incentives
Rationale & Eligibility Criteria
All MRTs are eligible to participate in an annual incentive plan. Annual incentives are designed to reward employees for
their contribution to the achievement of Scotiabank’s annual financial and non-financial goals.
Scotiabank currently has two annual incentive programmes for employees in the UK including MRTs, designed to reward
employees for their contribution to the achievement of annual goals:
Annual Incentive Plan (“AIP”), for all back- and middle-office employees, including employees in control function
roles and supporting personnel who are not client-facing;
Global Banking and Markets Incentive Plan (“GBMIP”), for GBM front-office employees globally, in designated
units and roles that support revenue generation.
Performance Measurement/Assessment
The AIP rewards employees based on Scotiabank’s performance on financial and customer metrics for the fiscal year as
well as individual performance, which has a significant impact on final awards The AIP includes risk-adjusted measures that
reflect the full range of potential risks. The aggregate AIP pool is determined based on Scotiabank’s achievement on a
scorecard of All-Bank measures: return on equity (ROE), earnings per share (“EPS”), operational leverage and a customer
metric, adjusted for performance relative to peers, as well as a discretionary risk adjustment that is approved by the Parent
Board after considering performance against Scotiabank’s Risk Appetite Framework.
The GBMIP is designed to reward eligible employees of GBM on the achievement of the objectives of both GBM and
Scotiabank. The aggregate GBMIP pool is determined based on GBM’s net income before bonus and taxes (“NIBBT”) and
net income after tax (“NIAT”) versus plan, adjusted for performance relative to peers and overall Scotiabank performance,
as well as a discretionary risk adjustment that is approved by the HRC after considering performance against Scotiabank’s

Scotiabank Europe plc Capital and Risk Management Pillar 3 Disclosures as at 31 October 2016
60
Risk Appetite Framework. Individual awards consider individual and business line performance, as well as market position,
and the pool of funds available.
Risk Adjustment
Prior to the awards being approved, Scotiabank’s Chief Risk Officer assesses whether there are any other potential risks
that should be reflected in the incentive pool funding, and recommends adjustments – if necessary – to the HRC. For
further details please refer to section 14.1.6.
Deferral and Vesting
Participants of the AIP in the UK at the internal director level and above may be eligible to receive grants of deferred
compensation in addition to an AIP payment.
Non-exempt2 MRTs receive 50% of their deferred award in Restricted Share Units (“RSUs”) and 50% in Deferred
Cash. All awards vest pro-rata over three years. The vested RSUs are subject to a further six-month holding
period before being paid out in cash. The portion of total incentive deferred varies between 40% and 60% in
accordance with the Remuneration Code for Dual Regulated Firms.
Exempt2 MRTs and other employees depending on seniority receive deferred compensation on a discretionary
basis based on individual performance, and awards typically range between 0% - 30% of total incentives received.
Awards are made entirely in share units (i.e. RSUs or Performance Share Units (PSUs), depending on employee
level).
GBMIP participants receive a portion of their award as deferred compensation.
Non-exempt2 MRTs receive 50% of their award in GBM Deferred Performance Plan (“DPP”) units, and 50% in
Deferred Cash. All awards vest pro-rata over three years and the vested DPP awards are subject to a further six-
month holding period before being paid out in cash. The portion of total incentive deferred varies between 40%
and 60% in accordance with the Remuneration Code for Dual regulated Firms.
Exempt2 MRTs and other GBMIP participants receive the entire award in DPP units. The portion of total incentive
deferred varies between 15% - 40% depending on GBM job level.
Note: 2 Exempt per SYSC 19D.3.3
14.1.5 Deferred Incentives
Rationale & Eligibility Criteria
A portion of the incentive awards made to MRTs are deferred to reward them for sustained performance over a 3-year
period. Deferred incentive awards include share units (i.e. RSUs or PSUs depending on employee level), the GBM DPP and
the Deferred Cash awards.
The RSU and PSU plans are intended for key individuals who have the ability to assist in creating future shareholder value.
Back and middle-office employees, including employees in control function roles and supporting personnel who are not
client-facing at the internal director level and above may be eligible to receive grants of deferred compensation.
The DPP plan is an integral part of GBM’s overall compensation programme designed to align the interests of GBM
employees with those of Scotiabank’s shareholders. All GBM front office employees in client-facing roles and roles that
support revenue generation in the UK are eligible to participate.
The Deferred Cash plan is intended for non-exempt MRTs only. All non-exempt MRTs in the UK are eligible to participate,
and awards can make up no more than 50% of the total incentive deferred.

Scotiabank Europe plc Capital and Risk Management Pillar 3 Disclosures as at 31 October 2016
61
Performance Measurement/Assessment
The RSU and PSU plan is designed to reward nominated employees below the executive level and certain executives
outside of Canada for delivering sustained shareholder value. RSUs and PSUs vest over a 3-year period and gain value with
the appreciation of Scotiabank’s common share price. PSUs contain a performance multiplier for units vesting at the end
of the period which is based on the Banks’s performance which can range from 0.75x to 1.25x.
The DPP plan allows GBM employees to receive a portion of their total incentive as DPP units. Units are tied to Scotiabank’s
common share price. The performance multiplier for DPP units vesting in a given fiscal year is based on GBM’s
performance for that fiscal year. The multiplier will range from 0.75x to 1.25x.
Deferred Cash Awards are also subject to a performance multiplier. The amount payable upon vesting is equal to the award
amount vesting multiplied by a performance multiplier, ranging from 0.75x to 1.25x, and determined using the All-Bank
score from Scotiabank’s AIP.
Deferral and Vesting
RSUs and DPP units vest on a pro-rata basis over the term of the grant. One-third of the initial units granted – including
dividend entitlements – vest on 30 November of each year. The final vesting date is the last day of the 35th
month following
grant date. Units are subject to early expiry in certain circumstances. PSUs vest at the end of the performance period.
Vested RSUs, PSUs and DPP units continue to be held for six months following the vesting date and are paid out in cash.
Deferred cash awards vest and are redeemable one-third per year following the date of the award.
Risk Adjustments
Prior to the awards vesting, Scotiabank’s Chief Risk Officer assesses whether there are any other potential risks that should
be reflected in the amount vesting, and recommends adjustments – if necessary – to the HRC. For further details please
refer to section 14.1.6.
14.1.6 Compensation Risk Management
Scotiabank’s approach to risk management and compensation is to ensure alignment of compensation with Scotiabank’s
risk profile and risk time horizon. Scotiabank’s compensation programme takes into account the risks that employees take
on behalf of Scotiabank, and ensures compensation takes into consideration prospective risks and outcomes.
In designing executive compensation programmes, Scotiabank strives to ensure that:
1. Risk is carefully managed, so that all business performance targets and individual/department objectives can be
accomplished within established risk policies, limits, processes and standards. The key metrics on which incentive
compensation plans are based are approved by the Parent board.
Executives are discouraged from taking unreasonable and excessive risks by delivering incentive compensation
through a combination of annual, mid-term and long-term incentives that reflect Scotiabank’s risk profile and by
deferring a substantial portion of the incentive compensation paid to senior executives and other employees
whose actions have a material impact on Scotiabank’s risk exposure. Caps are also placed on annual incentive
funding in conjunction with stress-testing potential payouts and implementing share ownership and post-
retirement share retention requirements to ensure alignment on a long-term basis.
The Chief Risk Officer and the Global Risk Management function review all material plans from a design
perspective to ensure that they reflect the risk appetite framework of Scotiabank. The Chief Risk Officer assesses
whether there are other potential risks that should be adjusted for in the incentive pool funding (such as
concentration risk, off-balance-sheet risk and liquidity risk), or for individuals, monitors all incentive plans for
adherence with Scotiabank’s risk appetite, and recommends adjustments to the Parent’s human resources and
risk committees, if warranted.

Scotiabank Europe plc Capital and Risk Management Pillar 3 Disclosures as at 31 October 2016
62
As part of the Chief Risk Officer’s risk assessment, prudent valuations for capital adequacy are conducted to
ensure Scotiabank is appropriately managing its capital to produce shareholder returns. As each business line is
allocated equity which reflects their respective economic capital, the capital adequacy assessment ensures that
capital is adequate to meet current and future risk, and achieve strategic objectives. These prudent valuations
ensure business lines are being charged adequately for the risk inherent in their respective business, and feed
into the determination of incentive pools.
Scotiabank measures shareholder value creation using ROE. Scotiabank closely monitors ROE relative to a well-
established target and relative to the cost of capital to ensure that it is comfortably creating shareholder value.
2. Measures for incentive programmes are thoroughly reviewed by the senior executive leadership team: A committee
has been established of the President and CEO of the Parent and his direct reports, the Human Capital Committee
(“HCC”), that provides senior leaders with the opportunity to review and evaluate the key measures of material
incentive programmes from an overall policy and comprehensive risk basis.
3. Scotiabank’s risk committee participates in reviews of the design and results of incentive programmes: The risk
committee members and the HRC members jointly review and approve the design, metrics, targets, and payouts of
material incentive programmes.
4. Key stewardship and support functions are focused on overall corporate interests: This focus ensures that
compensation for executives responsible for areas such as risk management, legal, compliance, finance, internal audit,
and human resources is tied to overall Scotiabank performance rather than the performance of any one line of
business they may support. Key stewardship and support function management have day-to-day responsibility and
ultimate accountability for key stewardship and support function employees including hiring decisions, performance
appraisals, and compensation.
5. Adherence to business values, codes of conduct, risk and compliance-related policies are key considerations when
determining individual compensation awards. For material risk impact employees, Scotiabank’s Compensation Review
Committee (includes the heads of finance, risk management, legal, compliance, internal audit, and human resources)
reviews possible breaches in conduct to ensure appropriate linkage between incentive compensation and risk.
6. At the local level, the UK head of risk management conducts an assessment of operations and adherence to the
business risk appetite framework. Additionally, the Managing Director and Head of Europe and the UK heads of
human resources, risk, and compliance, provide context and names of material risk takers identified as having a code
of conduct, risk or compliance issue that may have a material impact to the Scotiabank or the Company. The
individuals identified are reported to the Compensation Review Committee for further review and potential
adjustments to incentive compensation awards.
7. Clawback provisions: A clawback policy applies to MRTs. The employees forfeit outstanding awards or repay previous
compensation if there is a) employee misconduct/misbehaviour or b) material risk management failure of the firm
and/or business unit.
8. Anti-hedging and non-assignability provisions prohibit employees from utilizing hedging strategies or derivatives to
circumvent the risk alignment effects of Scotiabank’s compensation programmes.
9. Compensation programmes are reviewed independently of management: The Parent’s internal audit group conducts
an annual review of compensation programmes and practices, reporting directly to the HRC. The review includes all
material compensation plans and programmes, and assessment of the appropriateness of these plans and
programmes against organisational goals and risk profile as well as the Financial Stability Board (“FSB”) principles and
standards, and an assessment of appropriateness of payouts relative to performance and risk.

Scotiabank Europe plc Capital and Risk Management Pillar 3 Disclosures as at 31 October 2016
63
14.2 Quantitative Disclosure
The following table summarises those MRTs whose 2016 total remuneration exceeded EUR 1 million.
Total Remuneration Band (EUR) 2016 Number of MRTs 2015 Number of MRTs
3 million to 3.5 million Nil 1
2.5 million to 3 million Nil Nil
2 million to 2.5 million 1 1
1.5 million to 2 million Nil 1
1 million to 1.5 million 5 5
Total 6 8
The following pages show compensation awards and related data for 2016 MRTs in detail. The figures reflect the full value
of the compensation awarded to MRTs and the cost of which is borne by both the Parent and the Company.
14.2.1 Wholesale Banking
Table 1.1: Fixed and Variable Compensation (USD millions)
The following table summarises total remuneration earned during fiscal year 2016. This includes variable compensation
awards made after the end of the fiscal year to reflect decisions made during the 2016 compensation planning cycle, rather
than awards made at the outset of fiscal 2016 from the 2015 compensation planning cycle.
31 October 2016
Senior Management Non-Senior
Management Total Ratios
Number of MRTs 10 10 20
Fixed
Cash 6.7 5.7 12.5
Total fixed 6.7 5.7 12.5 73%
Variable
Cash 0.7 0.7 1.4
Non-deferred shares 0.6 0.6 1.2
Deferred cash 0.5 0.4 0.9
Deferred shares 0.6 0.5 1.1
Total variable pay 2.4 2.2 4.6 27%
31 October 2015
Senior Management Non-Senior
Management Total Ratios
Number of MRTs 6 16 22
Fixed
Cash 8.3 9.4 17.7
Total fixed 8.3 9.4 17.7 73%
Variable
Cash 0.9 1.4 2.3
Non-deferred shares 0.9 0.6 1.5
Deferred cash 0.8 0.5 1.3
Deferred shares 0.8 0.8 1.6
Total variable pay 3.4 3.3 6.7 27%

Scotiabank Europe plc Capital and Risk Management Pillar 3 Disclosures as at 31 October 2016
64
Table 1.2: Deferred Compensation (USD millions)
The following table summarises deferred compensation awarded or redeemed during the fiscal year, or outstanding at the
end of the fiscal year. Outstanding deferred compensation is valued as of 31 October, and share-based remuneration is
valued using the closing share price of the Parent’s common shares on 31 October 2016 of C$72.08 (2015: C$61.49).
31 October 2016
Senior Management Non-Senior
Management Total
Outstanding and vested 0 0 0
Outstanding and unvested 3.2 5.1 8.3
Awarded during financial year 2.8 1.5 4.3
Paid out 2.8 2.7 5.5
Reduced through performance adjustments 0.0 0.0 0.0
31 October 2015 (restated)
Senior Management Non-Senior
Management Total
Outstanding and vested1 0.2 0.0 0.2
Outstanding and unvested1 6.9 5.9 12.8
Awarded during financial year 5.4 5.1 10.5
Paid out 4.3 3.9 8.2
Reduced through performance adjustments 0.0 0.0 0.0
1 Information was misstated in our prior year’s report, where we reported outstanding and vested awards as outstanding and unvested
awards, and vice versa
Table 1.3: Sign-on and Severance Compensation (USD millions)
In fiscal 2016, no sign-on awards were paid to Wholesale Banking MRTs (2015: Nil). Two MRTs received severance awards
during fiscal 2016 (2015: 2 severances were paid to MRTs). To preserve confidentiality of the individuals, the values of
these will be disclosed confidentially to the regulatory authority, upon request.

Scotiabank Europe plc Capital and Risk Management Pillar 3 Disclosures as at 31 October 2016
65
14.2.2 Control and Other Functions
Table 2.1: Fixed and Variable Compensation (USD millions)
The following table summarises total remuneration earned during fiscal year 2016. This includes variable compensation
awards made after the end of the fiscal year to reflect decisions made during the 2016 compensation planning cycle, rather
than awards made at the outset of fiscal 2016 from the 2015 compensation planning cycle.
31 October 2016
Senior
Management Non-Senior
Management Total Ratios
Number of MRTs 10 0 10
Fixed
Cash 2.8 0.0 2.8
Total fixed 2.8 0.0 2.8 72%
Variable
Cash 0.5 0.0 0.5
Non-deferred shares 0.1 0.0 0.1
Deferred cash 0.1 0.0 0.1
Deferred shares 0.4 0.0 0.4
Total variable pay 1.1 0.0 1.1 28%
31 October 2015
Senior Management Non-Senior
Management Total Ratios
Number of Code Staff 6 3 9
Fixed
Cash 2.5 1.1 3.6
Total fixed 2.5 1.1 3.6 69%
Variable
Cash 0.5 0.2 0.7
Non-deferred shares 0.0 0.0 0.0
Deferred cash 0.2 0.0 0.2
Deferred shares 0.5 0.2 0.7
Total variable pay 1.2 0.4 1.6 31%

Scotiabank Europe plc Capital and Risk Management Pillar 3 Disclosures as at 31 October 2016
66
Table 2.2: Deferred Compensation (USD millions)
The following table summarises deferred compensation awarded or redeemed during the fiscal year, or outstanding at the
end of the fiscal year. Outstanding deferred compensation is valued as of 31 October, and share-based remuneration is
valued using the closing share price of the Parent’s common shares on 31 October 2016 of C$72.08 (2015: C$61.49).
31 October 2016
Senior Management Non-Senior
Management Total
Outstanding and vested 0.1 0.0 0.1
Outstanding and unvested 2.6 0.0 2.6
Awarded during financial year 0.5 0.0 0.5
Paid out 0.4 0.0 0.4
Reduced through performance adjustments 0.0 0.0 0.0
31 October 2015 (restated)
Senior Management Non-Senior
Management Total
Outstanding and vested1 0.0 0.0 0.0
Outstanding and unvested1 1.1 0.6 1.7
Awarded during financial year 0.9 0.5 1.4
Paid out 0.6 0.5 1.1
Reduced through performance adjustments 0.0 0.0 0.0
1 Information was misstated in our prior year’s report, where we reported outstanding and vested awards as outstanding and unvested
awards, and vice versa
Table 2.3: Sign-on and Severance Compensation (USD millions)
In fiscal 2016, there were no sign-on payments made to Control and Other Functions MRTs (2015: Nil). One MRT received a
severance award in fiscal 2016 (2015: Nil). To preserve confidentiality of the individuals, the value of this award will be
disclosed confidentially to the regulatory authority, upon request.