Embed Size (px)
Citation preview

Click to edit Master title style
• Click to edit Master
text styles
– Second level
• Third level
– Fourth level
» Fifth level
• Click to edit Master
text styles
– Second level
• Third level
– Fourth level
» Fifth level
TSX:KGI 1 klgold.com
TSX:KGI
Scotiabank Mining Conference | December 1-2, 2015
Ritz Carlton, Toronto
GROWTH & VALUE
Creating an Ontario
Focused Intermediate
Gold Producer

Click to edit Master title style
• Click to edit Master
text styles
– Second level
• Third level
– Fourth level
» Fifth level
• Click to edit Master
text styles
– Second level
• Third level
– Fourth level
» Fifth level
TSX:KGI 2 klgold.com TSX:KGI klgold.com 2
Forward Looking Statements
Cautionary Note Regarding Forward Looking Statements.
This presentation contains statements which constitute ”forward-looking statements”, including statements regarding the plans, intentions, beliefs
and current expectations of the Company with respect to the future business activities and operating performance of the Company. The words
“may”, “would”, “could”, “should”, “will”, “intend”, “plan”, “anticipate”, “believe”, “estimate”, “expect” and similar expressions, as they relate to the
Company, are intended to identify such forward-looking statements. Forward-looking statements used in this Presentation include, but may
not be limited to; statements regarding the Company’s production guidance for Stub Year 2015, and the financial years ended 2016, 2017
and 2018; the ability to bring more higher grade stopes online from the 5400 level and access to the 5600 level and below, and the timing
thereof; the exploration programs and the results and timing thereof.
In respect of the forward-looking information concerning the anticipated completion of the proposed Transaction and the anticipated timing thereof,
Kirkland Lake has provided them in reliance on certain assumptions that it believes are reasonable at this time, including assumptions as to the time
required to prepare and mail shareholder meeting materials, including the required information circular; the ability of the parties to receive, in a
timely manner, the necessary regulatory, court, shareholder and other third party approvals; and the ability of the parties to satisfy, in a timely
manner, the other conditions to the closing of the Transaction. These dates may change for a number of reasons, including unforeseen delays in
preparing meeting materials, inability to secure necessary shareholder, regulatory, court or other third party approvals in the time assumed or the
need for additional time to satisfy the other conditions to the completion of the Transaction. Accordingly, readers should not place undue reliance on
the forward-looking information contained in this news release concerning these times.
With respect to the forward looking information of Kirkland Lake and/or St Andrew, concerning the future gold production of Kirkland Lake and St
Andrew, future cash costs of production, the gold resources and reserves of Kirkland Lake and St Andrew, and the development of the Kirkland
Lake and St Andrew properties are subject to various key assumptions described in each party’s respective Annual Information Forms and
Technical Reports referred to herein and as filed on the SEDAR profiles of both companies at www.sedar.com.
Investors are cautioned that forward-looking statements are based on the opinions, assumptions and estimates of management considered reasonable at the date
the statements are made such as, without limitation, opinion, assumptions and estimates of management regarding the Company’s business, its ability to increase
its production capacity and decrease its production cost. Such opinions, assumptions and estimates, are inherently subject to a variety of risks and uncertainties
and other known and unknown factors that could cause actual events or results to differ materially from those projected in the forward-looking statements. These
factors are discussed in length in the Company's annual Management's Discussion and Analysis and Annual Information Form for the year ended April 30, 2015.
and the Company’s Management's Discussion and Analysis for the interim period ended July 31, 2015 filed with the securities regulatory authorities in certain
provinces of Canada and available at www.sedar.com.
Should one or more of these risks or uncertainties materialize, or should assumptions underlying the forward-looking statements prove incorrect,
actual results may vary materially from those described herein as intended, planned, anticipated, believed, estimated or expected. Although the
Company has attempted to identify important risks, uncertainties and factors which could cause actual results to differ materially, there may be others
that cause results not to be as anticipated, estimated or intended. The Company does not intend, and does not assume any obligation, to update these
forward-looking statements except as otherwise required by applicable law.

Click to edit Master title style
• Click to edit Master
text styles
– Second level
• Third level
– Fourth level
» Fifth level
• Click to edit Master
text styles
– Second level
• Third level
– Fourth level
» Fifth level
TSX:KGI 3 klgold.com
Investment Highlights
Emerging Ontario-focused intermediate gold producer with high-grade
sustainable assets in prolific mining camps
Proven management team and board of directors with a positive track record
Profitable with strong cash flow generation and a robust balance sheet
Strong AISC profile and long-term, sustainable production platform
Enhanced capital markets presence and increased access to capital and debt
markets
Leverage to Canadian dollar gold price
Significant exploration upside in the prolific Abitibi greenstone belt

Click to edit Master title style
• Click to edit Master
text styles
– Second level
• Third level
– Fourth level
» Fifth level
• Click to edit Master
text styles
– Second level
• Third level
– Fourth level
» Fifth level
TSX:KGI 4 klgold.com
Creating A New Mid-Tier Gold Producer
Ontario Focused Intermediate Gold Producer The combined entity will be an Ontario-focused intermediate producer expected to produce
between 260 – 310 koz of gold in 2016
Improved diversification with production from four mines and two centrally located mills in
Ontario’s southern Abitibi greenstone belt
Improved Financial Flexibility Solid balance sheet with over C$100 million in cash
Combination of strong future cash flows from both companies
Ability to benefit from future operational and corporate synergies
Enhanced Market Profile Two companies are covered by 15 research analysts collectively
Enhanced trading liquidity and appeal to a larger shareholder base
Exploration Upside Consolidation of large land holdings in the heart of two Ontario gold camps
Proximity to existing mine infrastructure
Further Opportunities Combined entity will have stronger market positioning and warrants a re-rating
KGI + SAS Pro-Forma Highlights Include:

Click to edit Master title style
• Click to edit Master
text styles
– Second level
• Third level
– Fourth level
» Fifth level
• Click to edit Master
text styles
– Second level
• Third level
– Fourth level
» Fifth level
TSX:KGI 5 klgold.com
Pro Forma Capitalization
KGI SAS Pro Forma
TSX Share Price1 C$/share $5.23 $0.38
Basic Shares Outstanding1 mm 80.7 368.3 114.7
FDITM Shares Outstanding2 mm 83.5 375.4 117.6
FDITM Market Capitalization2 C$mm $436.9 $178.0 $615.0
Cash and Cash Equivalents2 C$mm $88.5 $24.8 $113.3
Debt3 C$mm $124.3 $6.5 $130.9
Enterprise Value C$mm $472.8 $159.8 $632.6
1. As at November 16, 2015.
2. KGI FDITM shares and market cap based on share price on November 16, 2015, SAS FDITM shares, market cap and cash
based on transaction offer price.
3. Based on balance sheet data as of July 31, 2015 for KGI and September 30, 2015 for SAS.

Click to edit Master title style
• Click to edit Master
text styles
– Second level
• Third level
– Fourth level
» Fifth level
• Click to edit Master
text styles
– Second level
• Third level
– Fourth level
» Fifth level
TSX:KGI 6 klgold.com
Pro Forma Snapshot
KGI SAS Pro Forma
LTM Avg. Daily Trading Value C$mm $3.0 $0.1 $3.1
Analyst Coverage # 14 1 15
2P Reserves oz Au 1,463,000 833,331 2,296,331
Measured & Indicated Resources oz Au 2,047,000 2,668,000 4,715,000
2015 Production oz Au 152,629 105,000 257,629
AISC US$/oz $956 $934 $947
1. KGI production based on mid-range of SY 2015 guidance plus actual FY 2015 production from January-April; SAS production
based on mid-range of 2015 guidance.
2. KGI AISC based on actual FY 2015; SAS AISC based on actual year-to-date 2015.

Click to edit Master title style
• Click to edit Master
text styles
– Second level
• Third level
– Fourth level
» Fifth level
• Click to edit Master
text styles
– Second level
• Third level
– Fourth level
» Fifth level
TSX:KGI 7 klgold.com
Macassa
Taylor Holt
Holloway
Diversification Within A Stable, Mining Friendly Jurisdiction
Macassa Mine Complex
SY 2015E Production* 90 – 110 koz Au
Q1 SY 2015 AISC US$956/oz Au
Macassa Mill 2,000 tpd (50% utilized)
Reserves & Resources*
Total P&P Reserves
(Macassa Mine Complex) 1.5 Mozs
Measured & Indicated
(Property Wide) 2.0 Mozs
Inferred (Property Wide) 1.7 Mozs
The combined operating portfolio will include four producing mines and two
centrally located mills
St Andrew Goldfields
2015E Production 100-110koz Au
YTD Q3 2015 AISC US$934/oz Au
Holt Mill 3,000 tpd (80% utilized)
Resources & Reserves*
Holt Mine 591 kozs
Holloway Mine 40 kozs
Taylor Mine 156 kozs
Total P&P
(including Hislop Mine) 0.8 Mozs
Measured & Indicated
(Property Wide) 2.7 Mozs
Inferred
(Property Wide) 2.2 Mozs
*SY 2015 is an eight month time period
*Resources are exclusive of Reserves (see appendix for full NI
43-101 disclosure)
Assets in close
proximity (80km radius)

Click to edit Master title style
• Click to edit Master
text styles
– Second level
• Third level
– Fourth level
» Fifth level
• Click to edit Master
text styles
– Second level
• Third level
– Fourth level
» Fifth level
TSX:KGI 8 klgold.com
A Corner Stone
High-Grade Asset
MACASSA MINE
COMPLEX

Click to edit Master title style
• Click to edit Master
text styles
– Second level
• Third level
– Fourth level
» Fifth level
• Click to edit Master
text styles
– Second level
• Third level
– Fourth level
» Fifth level
TSX:KGI 9 klgold.com
One of the Highest Grade Gold Mines In The World Select Group of Producing Assets with +1Moz’s in Reserves
Mine Operator Location Gold Grade Reserves Reserve Update
g/t Au Date
Macassa Mine Complex Kirkland Lake Gold Canada (Ontario) 19.2 1.5 Moz Dec/2014
Turquoise Ridge Barrick USA (Nevada) 16.9 4.5 Moz Dec/2014
Gosowong Newcrest Indonesia 12.0 1.2 Moz Dec/2014
Moab Khotsong AngloGold Ashanti South Africa 10.0 6.1 Moz Dec/2014
Mponeng AngloGold Ashanti South Africa 10.0 14.6 Moz Dec/2014
Red Lake Goldcorp Canada 10.0 2.1 Moz Dec/2014
Kupol/Dvoinoye Kinross Russia 8.5 2.1 Moz Dec/2014
TauTona AngloGold Ashanti South Africa 8.0 1.4 Moz Dec/2014
19.2
16.9
12.0 10.0 9.9 9.6 8.5 8.0
0.0
5.0
10.0
15.0
20.0
25.0
Macassa MineComplex
Turquoise Ridge Gosowong Red Lake Moab Khotsong Mponeng Kupol/Dvoinoye Tau Tona
Gra
de g
/t
Reserve Grades
Company Source – This is a select group of Companies that illustrate producing mines only with mineral reserves in excess of 1Moz’s (gold only, no equivalent Au ounces shown)

Click to edit Master title style
• Click to edit Master
text styles
– Second level
• Third level
– Fourth level
» Fifth level
• Click to edit Master
text styles
– Second level
• Third level
– Fourth level
» Fifth level
TSX:KGI 10 klgold.com
Robust Level of Reserves & Resources Resources are Exclusive of Reserves
See Appendix for more disclosure on MRMR statement which is as of December 31, 2014.
Based on current level of reserves and a
conservative 70% conversion of M&I
resources (@ 200,000 oz p.a),
KGI has a 14 year mine life.
Property Wide SMC
Mineral Reserves (P&P)
Includes the ’04/ Main Break
and SMC
1.5 Moz’s
2.6M tons @ 0.56 opt
(19.2 g/t )
0.9 Moz’s
1.5M tons @ 0.65 opt
(22.3 g/t)
Mineral Resources (M&I)
Includes the ’04/ Main Break,
SMC, Near Surface and other
2.0 Moz’s
4.2M tons @ 0.49 opt
(16.8 g/t )
0.9 Moz’s
1.4M tons @ 0.66 opt
(22.6 g/t)
Mineral Resources (Inferred)
Includes the ’04/ Main Break,
SMC, Near Surface and other
1.7 Moz’s
2.1M tons @ 0.56 opt
(19.2 g/t)
0.9 Moz’s
1.4M tons @ 0.65 opt
(22.3 g/t)
Breakout of
SMC only

Click to edit Master title style
• Click to edit Master
text styles
– Second level
• Third level
– Fourth level
» Fifth level
• Click to edit Master
text styles
– Second level
• Third level
– Fourth level
» Fifth level
TSX:KGI 11 klgold.com
5025 Level
P+P 28,000 Tons @ 0.48 oz/ton 14,000 Oz’s
M+I 74,000 Tons @ 0.42 oz/ton 32,000 Oz’s
5300 Level
P+P 561,000 Tons @ 0.47 oz/ton 261,000 Oz’s M+I 245,0000 Tons @ 0.43 oz/ton 107,000 Oz’s
5400 Level
P+P 370,000 Tons @ 0.61 oz/ton 226,000 Oz’s M+I 174,000 Tons @ 0.42 oz/ton 72,000 Oz’s
5600 Level
P+P 239,000 Tons @ 0.77 oz/ton 183,000 Oz’s M+I 186,000 Tons @ 0.63 oz/ton 117,000 Oz’s
5700 Level
P+P 202,000 Tons @ 1.03 oz/ton 208,000 Oz’s M+I 164,000 Tons @ 0.91 oz/ton 96,000 Oz’s
South Mine Complex
Access from 5400L
and 5600L allows
delineation drilling of
resources, especially
below 5600L
Remains Open at
Depth and Across
Strike OPEN
*Drawing not to scale
5800 to 6600 Level
P+P 50,000 Tons @ 0.83 oz/ton 41,000 Oz’s
M+I 551,000 Tons @ 0.91 oz/ton 499,000 Oz’s
OPEN
OPEN
16.5 g/t
16.1 g/t
20.9 g/t
26.4 g/t
35.3 g/t
28.5 g/t
Click to edit Master title style
• Click to edit Master
text styles
– Second level
• Third level
– Fourth level
» Fifth level
• Click to edit Master
text styles
– Second level
• Third level
– Fourth level
» Fifth level
TSX:KGI 12 klgold.com
Production Update
SY15_Q1
41,482
41,204
94,437
0.45 (15.4 g/t)
SY15_Q2
33,511
34,606
85,869
0.40 (13.7 g/t)
SY15_YTD
74,993
75,810
180,306
0.43 (14.7 g/t)
SY15
Guidance
90,000 – 110,000
0.43
(14.7 g/t)
Ounces
Recovered
Ounces
Sold
Tons
Milled
Head Grade
(opt)
* Production guidance for SY15 is based on eight months of production
Sixth stope brought into production on 5400 level during Q2SY15
Main ramp is at the 5600 level

Click to edit Master title style
• Click to edit Master
text styles
– Second level
• Third level
– Fourth level
» Fifth level
• Click to edit Master
text styles
– Second level
• Third level
– Fourth level
» Fifth level
TSX:KGI 13 klgold.com
-
50,000
100,000
150,000
200,000
250,000
14 15 SY15 16 17 18
Go
ld O
un
ce
s
OzRecovered
Guidance
Linear (OzRecovered)
April 30th Fiscal Year End Calendar Year End 8 Month Stub Year
Growing Production Profile
The Stub Year (SY) 8 month period runs from May 1 – December 31, 2015, with guidance of between
90,000 – 110,000 ounces with throughput between 1,000 to 1,070 stpd.
2016, 2017 and 2018 guidance based on stated head grade and average throughput of 1,130, 1,140 and 1,145 stpd
respectively.
0.38/ 13.0 0.37/ 12.7 0.43/ 14.7 0.44/ 15.1 0.45/ 15.4 0.46/ 15.8 Guided Head Grades (OPT/ GPT)
0.33/ 11.3 0.43/ 14.7 0.43/ 14.7 - - - Actual Head Grades Achieved (OPT/ GPT)

Click to edit Master title style
• Click to edit Master
text styles
– Second level
• Third level
– Fourth level
» Fifth level
• Click to edit Master
text styles
– Second level
• Third level
– Fourth level
» Fifth level
TSX:KGI 14 klgold.com
AICC by Quarter (18 Months)
$0
$500
$1,000
$1,500
$2,000
Q3/14 Q4/14 Q1/15 Q2/15 Q3/15 Q4/15 Q1/SY15
Royalties
Exploration (includingsurface)
Corporate (incl. Finance& Interest)
PP&E
Capital Development(incl. Sustaining andNew)
Operating Costs
Co
st
in C
$ p
er
Ou
nce P
rod
uced
Fiscal Year
FISCAL 2015 Q1_SY15
AICC C$1,327/ Oz C$1,234/Oz
Average Sales Price C$1,412/ Oz C$1,498/Oz

Click to edit Master title style
• Click to edit Master
text styles
– Second level
• Third level
– Fourth level
» Fifth level
• Click to edit Master
text styles
– Second level
• Third level
– Fourth level
» Fifth level
TSX:KGI 15 klgold.com
Exploration Potential In A Historic Camp
Currently mining and
exploring on one of the
five mine targets.
Current Underground
and Surface Drilling
Targets: Three main
areas currently being
explored from surface
and underground.
Regional Program:
Regional exploration to
test eastwards along
strike.

Click to edit Master title style
• Click to edit Master
text styles
– Second level
• Third level
– Fourth level
» Fifth level
• Click to edit Master
text styles
– Second level
• Third level
– Fourth level
» Fifth level
TSX:KGI 16 klgold.com
The SMC Continues To Grow
See press releases dated June 9, 2015 and October 20, 2015, as filed on SEDAR
Area’s currently
being mined
Recent drilling has extended and confirmed the continuity of the SMC at depth and further to the
east on the HM Claim.
Will continue to drill from underground to find new mineralization, and in order to move
mineralization from inferred into the measured and indicated categories for future resource and
reserve expansion.

Click to edit Master title style
• Click to edit Master
text styles
– Second level
• Third level
– Fourth level
» Fifth level
• Click to edit Master
text styles
– Second level
• Third level
– Fourth level
» Fifth level
TSX:KGI 17 klgold.com
SMC Drilling on the HM and South Claims
SELECTED
HIGHLIGHTS
DH 53-2881 (NSZ)
67.9 g/ 5.0 metres 1.98 opt/ 16.7 feet
DH 53-2882 (NSZ)
14.7 g/ 3.5 metres 0.43 opt/ 11.0 feet
DH 53-2883 (NSZ)
16.5 g/t 2.7 metres 0.48 opt/ 9.0 feet
DH 53-2886 (FWZ)
383.3 g/ 2.6 metres 11.18 opt/ 8.5 feet
See press release dated October 20, 2015, as filed on SEDAR

Click to edit Master title style
• Click to edit Master
text styles
– Second level
• Third level
– Fourth level
» Fifth level
• Click to edit Master
text styles
– Second level
• Third level
– Fourth level
» Fifth level
TSX:KGI 18 klgold.com
Regional Exploration – Long Section Looking North
• Initial results from our regional program do not appear to be Main Break related (Phase 1)
• Geophysics anomalies identified and follow-up targeting exercise in progress (Phase 1a)
• Phase 1a program has 7,000 metres (23,000 feet) left to drill, and will be completed before
calendar year end.

Click to edit Master title style
• Click to edit Master
text styles
– Second level
• Third level
– Fourth level
» Fifth level
• Click to edit Master
text styles
– Second level
• Third level
– Fourth level
» Fifth level
TSX:KGI 19 klgold.com
Regional Drilling – Section Looking East
SELECTED HIGHLIGHTS
AB-15-12
11.7 g/ 0.3 metres
0.34 opt/ 1.0 feet
AB-15-23 3,241.4 g/ 0.7 metres
94.54 opt/ 2.3 feet
11.7 g/ 0.3 metres
0.34 opt/ 1.0 feet
AB-15-53 12.3 g/ 0.5 metres
0.36 opt/ 1.7 feet
AB-15-91 646.3 g/ 0.9 metres
18.85 opt/ 2.8 feet
including 1,783.2 g/ 0.3 metres
52.01 opt/ 1.0 feet
And 89.5 g/ 0.3 metres
2.61 opy/ 1.0 feet
See press release dated November 3, 2015, as filed on SEDAR

Click to edit Master title style
• Click to edit Master
text styles
– Second level
• Third level
– Fourth level
» Fifth level
• Click to edit Master
text styles
– Second level
• Third level
– Fourth level
» Fifth level
TSX:KGI 20 klgold.com
Sustainable Assets
SAS PROPERTIES

Click to edit Master title style
• Click to edit Master
text styles
– Second level
• Third level
– Fourth level
» Fifth level
• Click to edit Master
text styles
– Second level
• Third level
– Fourth level
» Fifth level
TSX:KGI 21 klgold.com
Map of St Andrew Assets
120 km strike length
Holt, Holloway, Taylor Producing Assets
Hislop Care & Maintenance
Ludgate, Aquarius Exploration Targets with existing resources
Garrison Creek Exploration Target
Source: St Andrew website (www.sasgoldmines.com)

Click to edit Master title style
• Click to edit Master
text styles
– Second level
• Third level
– Fourth level
» Fifth level
• Click to edit Master
text styles
– Second level
• Third level
– Fourth level
» Fifth level
TSX:KGI 22 klgold.com
Growing Production Profile
107
135 145
155 155
0
20
40
60
80
100
120
140
160
180
0
200
400
600
800
1,000
1,200
2015 2016 2017 2018 2019
Go
ld P
rod
uct
ion
(ko
z/ye
ar)
Thro
ugh
pu
t (k
t/ye
ar)
Au Ounces Tonnes Mill Capacity (ktpy)
Source: St Andrew website (www.sasgoldmines.com)

Click to edit Master title style
• Click to edit Master
text styles
– Second level
• Third level
– Fourth level
» Fifth level
• Click to edit Master
text styles
– Second level
• Third level
– Fourth level
» Fifth level
TSX:KGI 23 klgold.com
Building Value
AN EMERGING
MID-TIER PRODUCER

Click to edit Master title style
• Click to edit Master
text styles
– Second level
• Third level
– Fourth level
» Fifth level
• Click to edit Master
text styles
– Second level
• Third level
– Fourth level
» Fifth level
TSX:KGI 24 klgold.com
Proposed Transaction
Business combination of Kirkland Lake Gold Inc. and St Andrew Goldfields Ltd.
Total equity value of approximately C$178mm1
Pro forma ownership: 71% Kirkland Lake Gold / 29% St Andrew Goldfields1
Consideration
0.0906 of a Kirkland Lake common share, representing consideration of C$0.47 per St Andrew
common share1
46% premium based on 20-day volume weighted average prices for both companies and a 25%
premium to the St Andrew closing price on November 16, 2015
Conditions
66 2/3% St Andrew shareholder vote
50.1% Kirkland Lake shareholder vote
Customary regulatory and court approvals
Other Terms
35% of St Andrew shares outstanding have entered into support agreements to vote in favour of the
transaction
One St Andrew Director to join Kirkland Lake’s Board of Directors
Standard reciprocal non-solicitation clauses with a fiduciary out in respect of a Superior Proposal
Five full business day right to match provision for Kirkland Lake
Reciprocal break fee of C$7.1mm
Proposed Timing
Mailing of meeting materials as soon as practical
Shareholder meetings in January 2016
Expected closing by late January 2016
Transaction Summary
1. Based on November 16, 2015 closing prices.

Click to edit Master title style
• Click to edit Master
text styles
– Second level
• Third level
– Fourth level
» Fifth level
• Click to edit Master
text styles
– Second level
• Third level
– Fourth level
» Fifth level
TSX:KGI 25 klgold.com
$1,507
$1,037
$615 $488 $471 $423 $406
$233 $140
New Gold Alamos Pro Forma Lake Shore Primero Kirkland Lake Klondex Richmont St Andrew
Strong Market Positioning
Market Capitalization (C$mm)
Combined entity will be positioned as a new intermediate gold producer with a significant resource
base in two world class gold camps in Ontario
(1)
1. ITM diluted market cap.
2. Based on analyst consensus.
451
361
291 274
175 160 157 131
89
Alamos New Gold Pro Forma Primero Lake Shore Kirkland Lake Klondex St Andrew Richmont
2016E Production (koz)2
St Andrew will add significant annual gold production

Click to edit Master title style
• Click to edit Master
text styles
– Second level
• Third level
– Fourth level
» Fifth level
• Click to edit Master
text styles
– Second level
• Third level
– Fourth level
» Fifth level
TSX:KGI 26 klgold.com
KGI Peer Group (Grade and Reserve Ounces)
--
0.50
1.00
1.50
2.00
2.50
-- 5.0 10.0 15.0 20.0 25.0
Re
se
rve
s (
Mo
z A
u)
Grade (g/t)
Lakeshore Gold St Andrew Goldfields
Wesdome
Richmont
Pro-Forma
Kirkland Lake
Klondex

Click to edit Master title style
• Click to edit Master
text styles
– Second level
• Third level
– Fourth level
» Fifth level
• Click to edit Master
text styles
– Second level
• Third level
– Fourth level
» Fifth level
TSX:KGI 27 klgold.com
Checking All the Right Boxes
Three new independent board members with diverse and credible experience Enhanced governance levels
Operational improvements resulted in achieving production guidance Improved credibility and
reputation
New leadership to steer the Company in the right direction Eric Sprott appointed
Chairman of the Board
Rationalized business to return to profitability Positive earnings over past 5
quarters
Generated free cash flow over the past 5 quarters Reduced costs resulted in
increased cash position
Successful bought deal financing to strengthen the balance sheet Raised $32.1 MM in
February 2015
Delisted from the AIM market Additional cost and efficiency
savings
Change in financial reporting period and addition of AISC reporting metric Better visibility, inline with
industry
Relocated CFO position to Toronto head office Centralized management
team
Commenced regional exploration program to foster future organic growth Rebuilding a gold camp
Assessing M&A to de-risk business and increase production in the near term Consolidation within stable
jurisdictions

Click to edit Master title style
• Click to edit Master
text styles
– Second level
• Third level
– Fourth level
» Fifth level
• Click to edit Master
text styles
– Second level
• Third level
– Fourth level
» Fifth level
TSX:KGI 28 klgold.com
Kirkland Lake APPENDIX
Notes, additional disclosure
and other information

Click to edit Master title style
• Click to edit Master
text styles
– Second level
• Third level
– Fourth level
» Fifth level
• Click to edit Master
text styles
– Second level
• Third level
– Fourth level
» Fifth level
TSX:KGI 29 klgold.com
F2015 Achievements
All amounts stated are in Canadian dollars
*All-in cash costs, all-in sustaining costs and free cash flow are non-GAAP measures. See Kirkland Lake Gold MD&A for
period ending July 31, 2015 for a reconciliation of these non-GAAP measures, as filed on SEDAR at www.sedar.com.
SY 2015 Guidance 8 month period from
May 1 – Dec 31, 2015
Metric SY15_Q1
Actual Status
$800 - $850 Cash operating cost (per ounce produced) $792 Favourable
$1,300 - $1,400 AICC* (per ounce produced) $1,234 On Track
$1,200 - $1,300 AISC* (per ounce sold) $1,193 Favourable
$41 - $48 Million Total Capital Expenditures (incl. PP&E) $11 Million Favourable
$145 - $155 Million Revenue $62 Million On Track
$43 - $53 Million Cash flow from operations $15 Million On Track
$2 - $5 Million Free cash flow* $4 Million Favourable

Click to edit Master title style
• Click to edit Master
text styles
– Second level
• Third level
– Fourth level
» Fifth level
• Click to edit Master
text styles
– Second level
• Third level
– Fourth level
» Fifth level
TSX:KGI 30 klgold.com
Analyst Coverage
Firm Analyst
GMP Oliver Turner
Dundee Securities Mathew O’Keefe
CIBC World Markets Cosmos Chiu
Macquarie Capital Markets Ron Stewart
BMO Capital Markets Brian Quast
M Partners Andrew Mikitchook
Mirabaud Securities Richard Morgan
Firm Analyst
Scotiabank Craig Johnston
PI Financial Philip Ker
Pareto Securities John McClintock
National Bank Financial Raj Ray
Clarus Securities Jamie Spratt
Investec Bank Hunter Hillcoat
Very Independent Research John Tumazos
KIRKLAND LAKE GOLD IS FOLLOWED BY THE ANALYSTS LISTED ABOVE. THIS LIST IS PROVIDED FOR INFORMATION PURPOSES ONLY AND IS SUBJECT TO CHANGE
AS COVERAGE IS ADDED OR DROPPED BY A FIRM.
OPINIONS, ESTIMATES OR FORECASTS REGARDING KIRKLAND LAKE GOLD'S PERFORMANCE THAT ARE MADE BY THESE ANALYSTS ARE THEIRS ALONE AND DO
NOT REPRESENT THE OPINIONS, ESTIMATES OR FORECASTS OF KIRKLAND LAKE GOLD OR ITS MANAGEMENT.
KIRKLAND LAKE GOLD DOES NOT IMPLY ITS ENDORSEMENT OF, OR CONCURRENCE WITH, SUCH INFORMATION, CONCLUSIONS OR RECOMMENDATIONS AND
TAKES NO RESPONSIBILITY FOR MONITORING, SUPPLEMENTING OR CORRECTING ANY INFORMATION OR FORECASTS PROVIDED BY THE ANALYSTS.

Click to edit Master title style
• Click to edit Master
text styles
– Second level
• Third level
– Fourth level
» Fifth level
• Click to edit Master
text styles
– Second level
• Third level
– Fourth level
» Fifth level
TSX:KGI 31 klgold.com
Kirkland Lake Camp
The Kirkland Lake gold
camp has been in production
for over 100 years
One of the highest grade
gold camps in the world
Almost 25 Moz’s has been
produced to date, from
seven mines
KGI owns five former
producing high grade mines
with historical production of
~22 Moz’s of gold
Average head grade of 0.44
opt or 15.1 g/t
Currently only mining and
exploration on one of these
past producers
Click to edit Master title style
• Click to edit Master
text styles
– Second level
• Third level
– Fourth level
» Fifth level
• Click to edit Master
text styles
– Second level
• Third level
– Fourth level
» Fifth level
TSX:KGI 32 klgold.com
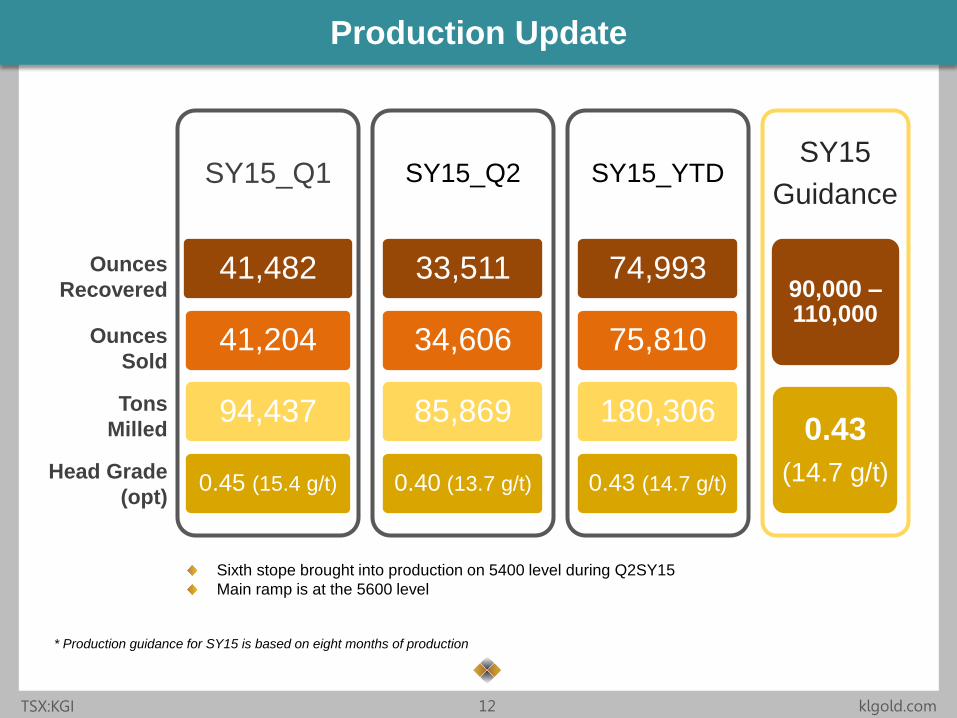
Experienced Team
Eric Sprott 2 Non-executive Chairman
Barry Cooper, B.Sc., MBA 1 Non-executive Director
Pamela Klessig, P.Geo Non-executive Director
Barry Olson, M.Sc. 1 Non-executive Director
Jeffrey Parr, CA, BA, MBA 1 Non-executive Director
Dawn Whittaker, LLB Non-executive Director
George Ogilvie, P.Eng. Director, President & Chief Executive Officer
Perry Ing, CA, CFA 3 Chief Financial Officer
Chris Stewart, P.Eng. Vice President, Operations
Jennifer Wagner, LL.B. Corporate Legal Counsel
Suzette N Ramcharan, CPIR Director, Investor Relations
Kevin Fearn, BA, CHRP, CHRL Director, Human Resources
Board of Directors
Senior Management
1 Appointed October 2014; 2 Appointed February 2015; 3 Appointed November 2015

Click to edit Master title style
• Click to edit Master
text styles
– Second level
• Third level
– Fourth level
» Fifth level
• Click to edit Master
text styles
– Second level
• Third level
– Fourth level
» Fifth level
TSX:KGI 33 klgold.com
Financial Position
CASH C$88.5 million 3
DEBT C$119.1 million convertible debentures
(principal amount owing)
KGI.DB: 6% coupon/ $15.00 strike
C$57.4MM mature Jun/2017
KGI.DB.A: 7.5% coupon/ $13.70 strike
C$62.1MM* mature Dec/2017
NCIB allows KGI to purchase up to 10% of each issue within a 12
month period commencing April 3, 2015, and can be renewed
annually 4
ROYALTY 2.5% NSR Franco Nevada Corporation
Option to buyback 1% by October 31, 2016, at a cost of
US$36MM less any money paid against the 1%
52 Week Performance 2
HIGH C$6.88
LOW C$2.79
Current Share Price C$5.50 (Nov 2)
Major Shareholders (~50%) 1
Resolute Funds (~10%)
Eric Sprott (~9%)
Columbia Wanger Asset Management LLC (~8%)
Equinox Partners (~7%)
Van Eck Associates Corporation (~5%)
Harry Dobson (~4%)
Sprott Asset Management (~4%)
ABC Funds (~2%)
CAPITAL STRUCTURE 1
ISSUED SHARES 80,954,117
Stock Options 3,532,050
FULLY DILUTED 84,571,167
MARKET CAP ~385 Million 2
1 As at November 1, 2015; 2 As at November 26, 2015 3 As of November 13, 2015; 4 See press release dated April 1, 2015 for details on the NCIB

Click to edit Master title style
• Click to edit Master
text styles
– Second level
• Third level
– Fourth level
» Fifth level
• Click to edit Master
text styles
– Second level
• Third level
– Fourth level
» Fifth level
TSX:KGI 34 klgold.com
80%
90%
100%
110%
120%
130%
140%
150%
160%
170%
180%
190%
200%
Jan-15 Feb-15 Mar-15 Apr-15 May-15 Jun-15 Jul-15 Aug-15 Sep-15 Oct-15
Kirkland Lake (TSX:KGI) Gold Price (C$ / oz) GDXJ Index (C$)
2015 YTD Share Price Performance
11%
73%
4%

Click to edit Master title style
• Click to edit Master
text styles
– Second level
• Third level
– Fourth level
» Fifth level
• Click to edit Master
text styles
– Second level
• Third level
– Fourth level
» Fifth level
TSX:KGI 35 klgold.com
Monthly Production Profile
10.6
13.0
10.6 11.7
10.6
10.3 8.9
9.9
15.4
13.4 11.7
12.7
11.7
16.1 17.5
13.4
14.7
14.1
16.1 15.1
14.4
17.8
13.7
12.0
13.0
18.5
15.1
-
2.0
4.0
6.0
8.0
10.0
12.0
14.0
16.0
18.0
20.0
0
5,000
10,000
15,000
20,000
May Jul Sep Nov Jan Mar May Jul Sep Nov Jan Mar May Jul
Oz Recovered
Head Grade
F2015
Hea
d G
rad
e (
Gra
ms
per
To
nn
e)
Go
ld P
rod
ucti
on
(O
un
ce
s)
AVERAGE
GRADE (g/t)
F2014 F2015 Q1_SY15
11.7 (0.34 opt) 14.7 (0.43 opt) 15.4 (0.45 opt)
SY15

Click to edit Master title style
• Click to edit Master
text styles
– Second level
• Third level
– Fourth level
» Fifth level
• Click to edit Master
text styles
– Second level
• Third level
– Fourth level
» Fifth level
TSX:KGI 36 klgold.com
0.37
0.40
0.37
0.32
0.41
0.37
0.31
0.33
0.43
0.00
0.05
0.10
0.15
0.20
0.25
0.30
0.35
0.40
0.45
0.50
-
50,000
100,000
150,000
200,000
250,000
07 08 09 10 11 12 13 14 15 SY15 16 17 18
Go
ld O
un
ce
s
Oz Recovered Guidance Head Grade Linear (Oz Recovered)
Fiscal Year
Previous Guidance
0.43
0.44
0.45 0.46
Annual Production Profile
Expectation Gap
The Stub Year (SY) 8 month period runs from May 1 – December 31, 2015, with guidance of between 90,000 –
110,000 ounces. Former F2016 12 month period had guidance of between 150,000 – 170,000 ounces, as shown in
the dotted line.
2016, 2017 and 2018 have December 31st year ends.
Hea
d G
rad
e (
Ou
nc
es
Pe
r To
n)
= 200 employees
Click to edit Master title style
• Click to edit Master
text styles
– Second level
• Third level
– Fourth level
» Fifth level
• Click to edit Master
text styles
– Second level
• Third level
– Fourth level
» Fifth level
TSX:KGI 37 klgold.com
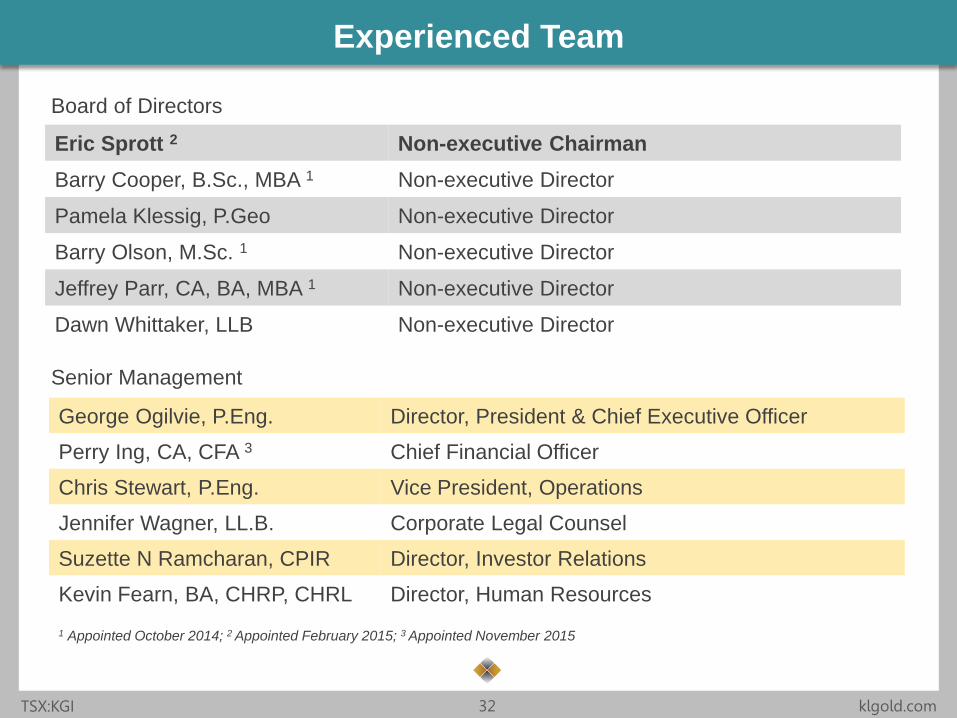
Labour Rationalization
Fiscal Year Head Count (YE)* Savings (in millions of C$)
F2013 1,214 -
F2014 1,021 $19.3 M
F2015 1,003 $1.8 M
SY15_Q1 988 $1.5 M
Total Savings $25.6 M
F2013 0.89 tons/ person
F2014 0.94 tons/ person
F2015 1.00 ton/ person
SY15_Q1 1.10 tons/ person
68% 91,518 ounces to 153,957 ounces
-17% 1,214 employees
to 1,003 employees
PR
OD
UC
TIO
N
MA
NP
OW
ER
LE
VE
LS
Change from F2013 to F2015
Costs Savings Realized Over Past 9 Quarters
*Peak manpower levels were 1,244 persons in December 2013.

Click to edit Master title style
• Click to edit Master
text styles
– Second level
• Third level
– Fourth level
» Fifth level
• Click to edit Master
text styles
– Second level
• Third level
– Fourth level
» Fifth level
TSX:KGI 38 klgold.com
Strengthened Financial Position
• Successful and well timed bought deal financing added $32.1 M in cash to the
balance sheet in F2015.
• Initiated a Normal Course Issuer Bid in April 2015, to buy-back the convertible
debentures trading at a discount to par.
SY15_Q1
$80.3 M
$81.1 M
$119.5 M
F2015
$38.9 M
$80.3 M
$121.5 M
F2014
$76.8 M
$38.9 M
$126.5 M
Opening Cash Balance
Closing Cash Balance
Principal Amount of
Convertible Debentures
October 19, 2015 October 19, 2014 October 19, 2013
KGI.DB 6% Coupon Price - $97.0 YTM - 8.6% Price - $88.0 YTM - 11.3% Price - $76.0 YTM - 15.5%
KGI.DB.A 7.5% Coupon Price - $95.0 YTM - 10.1% Price - $92.0 YTM - 10.5% Price - $72.5 YTM - 16.1%

Click to edit Master title style
• Click to edit Master
text styles
– Second level
• Third level
– Fourth level
» Fifth level
• Click to edit Master
text styles
– Second level
• Third level
– Fourth level
» Fifth level
TSX:KGI 39 klgold.com
SY15_Q1
Results SY15_Q1
Vs Q1/F15
Cash Cost Per Ton $348
US$279
+2%
-11%
Cash Operating Cost Per Ounce $792
US$635
+1%
-21%
All-In Cash Costs Per Ounce
Produced (AICC)
$1,234
US$989
-1%
-14%
All-In Sustaining Cost Per Ounce Sold
(AISC)
$1,193
US$956
-3%
-16%
Gold Sales 41,204 +7%
Average Sales Price $1,498 +7%
Revenues $61.7 MM +14%
Cash Flow from Operations $14.9 MM -11%
Free Cash Flow $4.1 MM -18%
SY15_Q1 Financial Highlights
- All US$ equivalents are converted at the average CAD to USD exchange rate during
the reporting period.
CO
ST
S
SA
LE
S
CA
SH
FL
OW
- See MDA for period ending July 31, 2015, for discussion of Non-GAAP Measures
such as cash cost per ton, AICC, AISC, and free cash flow.

Click to edit Master title style
• Click to edit Master
text styles
– Second level
• Third level
– Fourth level
» Fifth level
• Click to edit Master
text styles
– Second level
• Third level
– Fourth level
» Fifth level
TSX:KGI 40 klgold.com
Capital Expenditures
22.4 30.9
45.8 46.9 55.0
41.5 30.4
9.7
28.9
24.5
44.0 29.6
6.0 18.0
0
10
20
30
40
50
60
70
80
90
100
F2010 F2011 F2012 F2013 F2014 F2015 SY2015
Capital Expenditures (Mineral Properties) PP&E
C$
Mill
ions
Project Capital was Completed in January 2014
C$9M in Capital Development of 5400L and SMC Main Decline to 5600L Spent in FY15
F2015 Sustaining Capex guidance reduced from $51MM to $50MM after Q3

Click to edit Master title style
• Click to edit Master
text styles
– Second level
• Third level
– Fourth level
» Fifth level
• Click to edit Master
text styles
– Second level
• Third level
– Fourth level
» Fifth level
TSX:KGI 41 klgold.com
‘04 Break Underground Drilling
See press release dated February 23, 2015
SELECTED
HIGHLIGHTS
DH 34-666
86.8 g/t / 0.7 metres (2.53 opt/ 2.4 feet)
DH 34-668
27.4 g/t / 1.3 metres 0.80 opt/ 4.4 feet

Click to edit Master title style
• Click to edit Master
text styles
– Second level
• Third level
– Fourth level
» Fifth level
• Click to edit Master
text styles
– Second level
• Third level
– Fourth level
» Fifth level
TSX:KGI 42 klgold.com
Regional Exploration – Plan View

Click to edit Master title style
• Click to edit Master
text styles
– Second level
• Third level
– Fourth level
» Fifth level
• Click to edit Master
text styles
– Second level
• Third level
– Fourth level
» Fifth level
TSX:KGI 43 klgold.com
Near Surface Exploration Target
Near surface mineralization is within 2 Km’s of mill
Mill has excess capacity of +/- 1,000 tpd
Mineralization from 100’ to 1,000’ below surface
Open across strike
M&I: 299,370 tonnes @ 0.34opt (11.7gpt) 112,000 oz
Inferred: 90,718 tonnes @ 0.42opt (14.4gpt) 42,000 oz

Click to edit Master title style
• Click to edit Master
text styles
– Second level
• Third level
– Fourth level
» Fifth level
• Click to edit Master
text styles
– Second level
• Third level
– Fourth level
» Fifth level
TSX:KGI 44 klgold.com
KGI Reserve & Resource Estimates Resources are exclusive of Reserves
Grade Grade Au Grade Grade Au Grade Grade Au
opt g/t (000's) opt g/t (000's) opt g/t (000's)
'04 & Main Break 545 0.43 494 14.7 236 583 0.48 529 16.5 278 1,128 0.46 1023 15.8 514
South Mine Complex 346 0.51 314 17.5 177 1,120 0.69 1016 23.7 773 1,467 0.65 1,331 22.3 949
Macassa Mine Complex 891 0.46 808 15.8 412 1,703 0.62 1,545 21.3 1,051 2,595 0.56 2,354 19.2 1,463
Proven
Tonnes
(000's)
Tons
(000's)
Tonnes
(000's)
ZoneProbable Proven & Probable
Tons
(000's)
Tonnes
(000's)
Tons
(000's)
MINERAL RESERVES - As at December 31, 2014
Note: Columns may not add due to rounding. Macassa Mine Complex reserves the ’04 & Main Break and the SMC.
MINERAL RESOURCES - As at December 31, 2014
Grade Grade Au
opt g/t (000's)
04 & Main Break 485 0.41 440 14.1 201
SMC 1,358 0.65 1,232 22.3 876
Near Surface Target 100 0.42 91 14.4 42
Property Wide 2,114 0.56 1,918 19.2 1,777
ZoneTons (000's) Tonnes (000's)
InferredNote: Columns may not add due to rounding. Property Wide resources include the ’04 &
Main Break, SMC, Near Surface Target, as well as peripheral resources blocks (such as
the Lakeshore Ramp).
Grade Grade Au Grade Grade Au Grade Grade Au
opt g/t (000's) opt g/t (000's) opt g/t (000's)
04 & Main Break 1063 0.4 964 13.7 430 1148 0.42 1041 14.4 483 2,211 0.41 2006 14.1 913
SMC 33 0.37 30 12.7 12 1377 0.67 1249 23.0 917 1,410 0.66 1279 22.6 929
Near Surface Target - - - - - 330 0.34 299 11.7 112 330 0.34 299 11.7 112
Property Wide 1106 0.4 1003 13.7 447 3,096 0.52 2,809 17.8 1,599 4,202 0.49 3,812 16.8 2,047
Measured
Tons
(000's)
Tonnes
(000's)
ZoneIndicated Measured & Indicated
Tons
(000's)
Tonnes
(000's)
Tons
(000's)
Tonnes
(000's)

Click to edit Master title style
• Click to edit Master
text styles
– Second level
• Third level
– Fourth level
» Fifth level
• Click to edit Master
text styles
– Second level
• Third level
– Fourth level
» Fifth level
TSX:KGI 45 klgold.com
QP Info and Notes to Reserves & Resources
The reserve and resource estimates have been audited and verified, and the technical disclosure in thie press release dated April 13, 2015, has been
approved, by the Company’s independent reserve and resource engineer, Glenn R. Clark, P. Eng., of Glenn R. Clark & Associates Limited. Mr. Clark
is a ‘qualified person’ under National Instrument 43-101, Standards of Disclosure for Mineral Projects, of the Canadian Securities Administrators. The
report detailing the December 31, 2014, reserve and resource estimates will be filed on SEDAR (www.sedar.com) within 45 days of this press release.
See ‘Notes for Reserves and Resources’ below for key assumptions, parameters and methods used to estimate the foregoing reserves and
resources.
Notes for Reserves and Resources:
The reserves and resources have been classified according to the Canadian Institute of Mining, Metallurgy and Petroleum (CIM) Standards on Mineral
Resources and Reserves: Definition and Guidelines (December 2005).
1. The reserves and resources are estimated using the polygonal method.
2. Resources do not include reserves.
3. All intersections are calculated to a 6.0 foot minimum horizontal mining width for structures dipping at greater than 45 degrees. The minimum
mining height for structures dipping less than 45 degrees is 9.0 feet.
4. Dilution is added to reserves at varying rates depending on the mining method, and the width of the ore. The average dilution of the reserves at
December 31, 2014, is 27% at 0.02 opt, marginally up from an average of 24.0% the previous year. Long-hole stopes are diluted by anywhere
between 50-100% (mostly 50%). Cut and fill stopes are diluted by anywhere between 10-50%.
5. All higher grades are cut to 3.50 opt. Based on a statistical analysis completed by Scott Wilson Roscoe Postle Associates Inc. in 2007, the
Company has implemented various higher grade cutting factors for four zones in the South Mine Complex. These four zones are the New South
Zone (7.20 opt), Lower D North (9.30 opt), Lower D North Footwall (4.80 opt), and the #7 and #7 HW Zones (6.40 opt). Cut-off grades of 0.22 opt
and 0.18 opt are used for reserve and resource calculations respectively, depending on the location, and economics of the block. Generally, a cut-
off of 0.22 opt is required on a whole-block basis to achieve profitability and reserve classification. It is possible to have sub-blocks within an ore
reserve block that assay less than any cut-off which have been incorporated for mining or geotechnical reasons. Ore blocks that grade between
0.18 opt and the cut-off of 0.22 opt have been classified as resource. The cut-off grade for near-surface resources (surface to -1,000 foot
elevation) is 0.12 opt. An internal report completed by Roscoe Postle and Associates in October 2014, suggest that the cutting factor for
mineralization on the Amalgamated Trend be set at 2.50 opt. This grade capping was implemented by the Company and incorporated in the
estimates for 2014.
6. The area of influence of the proven and measured categories are 30 feet from development chip samples, probable and indicated categories are
50 feet of radius from a known sample point (drill holes) and inferred is another 50 feet of influence (between 50 – 100 feet).
7. A 94.2% tonnage recovery is used. Continuity of the veins appears very good.
8. The assumptions used include CAD$1,350.00 (US$1,200) per ounce of gold.
9. The Company is not aware of any environmental, permitting, legal, title, taxation, socio-political, marketing or other issue that may materially affect
its estimate of mineral resources.
10. Mineral resources which are not mineral reserves do not have demonstrated economic viability.

Click to edit Master title style
• Click to edit Master
text styles
– Second level
• Third level
– Fourth level
» Fifth level
• Click to edit Master
text styles
– Second level
• Third level
– Fourth level
» Fifth level
TSX:KGI 46 klgold.com
www.klgold.com
Suzette N Ramcharan, CPIR
Director of Investor Relations
+1-647-361-0200
Mobile: +1-647-284-5315
TSX:KGI