Embed Size (px)
Citation preview

I am pleased to provide you with this report on the Assessments of Reading, Writing and Mathematics, Primary Division (Grades 1–3) and Junior Division (Grades 4–6), for 2008–2009. Included are student results for the current year, those from previous years and, to put these results in context, information about the local student populations.
Throughout the province and since the inception of the agency, EQAO results have helped inform professional practice and have served as a catalyst for improving student achievement. This report has been designed to assist you in your conversations about improved student learning.
We believe that every student deserves the best outcome from public education. That’s why, in close collaboration with Ontario educators, EQAO continues to develop assessments that gauge the achievement of all Ontario students against the learning expectations outlined in The Ontario Curriculum. These assessments ensure that every student in Ontario’s publicly funded school system is assessed using the same yard stick at key stages in his or her schooling.
However, it should be remembered that EQAO’s assessment results are just one piece of information about student achievement. These results should be considered in conjunction with school-based information, such as that from classroom assessments.
I trust this report will help parents, educators and all who support a strong public education system work together so that all students can reach their full potential.
Sincerely,
Marguerite JacksonChief Executive OfficerEducation Quality and Accountability Office
PERCENTAGE OF ALL STUDENTS AT OR ABOVE THEPROVINCIAL STANDARD (LEVELS 3 AND 4), 2008–2009
WHERE TO FIND . . . PAGEGrade 3 Grade 6
Percentages of all students at or above the provincial standard: · 2008–2009 .................................................................. 1 1· Over time .................................................................... 2 3
Tips for using this report ................................................................ 4 4
Contextual information: 2008–2009 ............................................... 5 9
Results for groups of students: 2008–2009· All students ............................................................... 6 10· Participating students .............................................. 7 11· Students by gender................................................... 8 12
Contextual information: Over time ............................................... 13 17
Results for all students: Over time ............................................... 14–16 18–20
Results for all students: Over time by gender.............................. 21 22
Student questionnaire results ....................................................... 23–26 27–30
Explanation of terms ...................................................................... 31 31
School: Senhor Santo Cristo Sep S (763799)
Board: Toronto Catholic District School Board (67059)
Assessments of Reading, Writing and MathematicsPrimary Division (Grades 1–3) and Junior Division (Grades 4–6), 2008–2009
School Report
ProvinceBoardSchoolProvinceBoardSchoolProvinceBoardSchool
33
62 61
20
72 68
47
72 70
Reading Writing Mathematics
Grade 3
ProvinceBoardSchoolProvinceBoardSchoolProvinceBoardSchool
66 69 71 67 62 63
N/R N/R N/R
Reading Writing Mathematics
Grade 6
Senhor Santo Cristo Sep S (763799)School Report
1 of 31September 17, 2009

Senhor Santo Cristo Sep S (763799)School Report
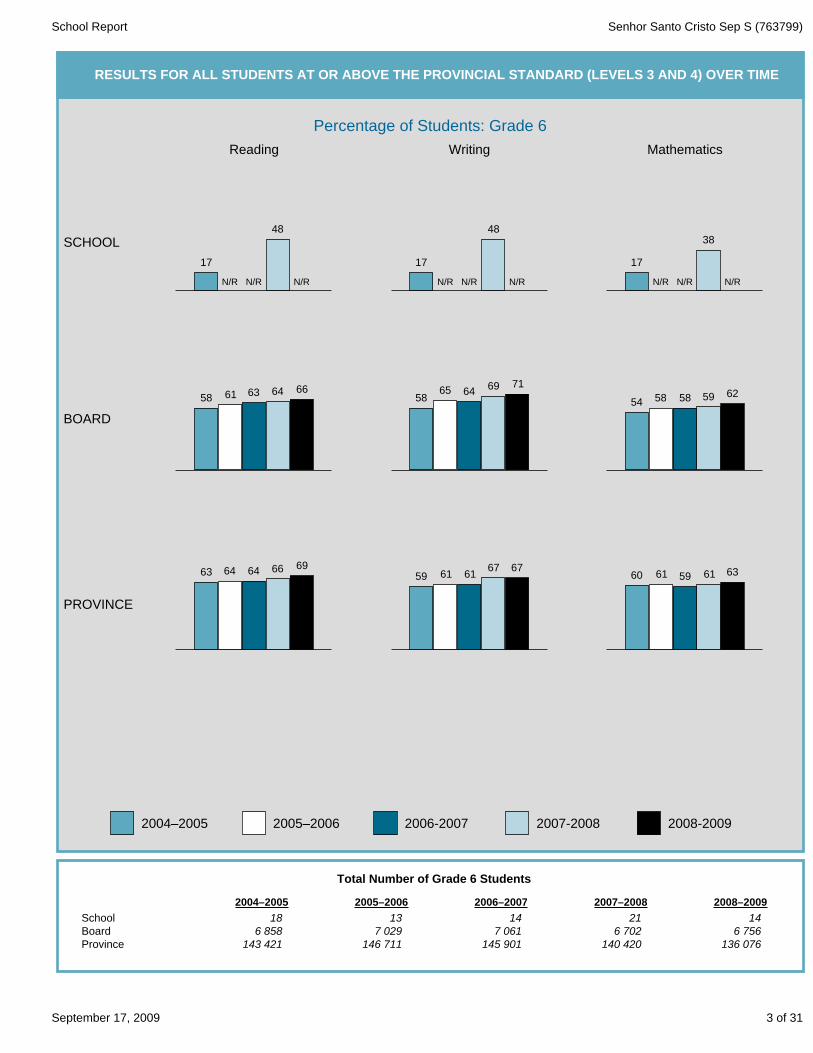
RESULTS FOR ALL STUDENTS AT OR ABOVE THE PROVINCIAL STANDARD (LEVELS 3 AND 4) OVER TIME
Percentage of Students: Grade 3
2004–2005 2005–2006 2006–2007 2007–2008
Reading Writing Mathematics
SCHOOL
BOARD
PROVINCE
2008–2009
125 4815 960
15
2008–2009
128 6606 305
13
2007–2008
131 0126 243
14
2006–2007
132 7826 501
18
2005–2006
135 7406 581
27
2004–2005
ProvinceBoardSchool
Total Number of Grade 3 Students
26
44
N/R N/R
3344 44
N/R N/R
2030
61
N/R N/R
47
6166 68 68 72
6370 69 70 72
5562 60 62 62
61 64 64 66 6859 62 62 61 61
66 68 69 68 70
2 of 31September 17, 2009
Senhor Santo Cristo Sep S (763799)School Report
RESULTS FOR ALL STUDENTS AT OR ABOVE THE PROVINCIAL STANDARD (LEVELS 3 AND 4) OVER TIME
Percentage of Students: Grade 6
2004–2005 2005–2006 2006-2007 2007-2008
Reading Writing Mathematics
SCHOOL
BOARD
PROVINCE
2008-2009
136 0766 756
14
2008–2009
140 4206 702
21
2007–2008
145 9017 061
14
2006–2007
146 7117 029
13
2005–2006
143 4216 858
18
2004–2005
ProvinceBoardSchool
Total Number of Grade 6 Students
17
48
N/R N/R N/R
17
48
N/R N/R N/R
17
38
N/R N/R N/R
54 58 58 59 625865 64
69 71
58 61 63 64 66
59 61 6167 6763 64 64 66 69
60 61 59 61 63
3 of 31September 17, 2009
Senhor Santo Cristo Sep S (763799)School Report
ABOUT THIS SCHOOL OR BOARD REPORTTIPS
Each school or board is unique. To appreciate the distinctive character of a school or board, look at the contextual information to understand the features and characteristics of the community it serves.
�
Every assessment captures the performance of students at one point in time each year. Consider the results along with other information about students’ achievement in reading, writing and mathematics.
�
Exercise caution when interpreting results for small schools or boards. Results may vary considerably from year to year, and differences may look exaggerated. For example, in a school of 20 students, a difference of 10% represents only two students.
�
Trends may be difficult to identify or to interpret. This is especially true in small schools or boards, or in schools where there is a high turnover in the student population.
�
EQAO values students’ privacy. Results are not reported publicly for schools where fewer than 15 students participated, because it might be possible to identify individual students.
This report shows how well students have met curriculum expectations to the end of the Primary Division and the end of the Junior Division. Students complete a set of test booklets that allow them to show what they have learned in reading, writing and mathematics. The assessments are based on The Ontario Curriculum.
This report includes¨ results for this year
¨ a comparison of results over the past four years to aid in monitoring improvement
¨ information about the characteristics of the students who participated
¨ summary graphs showing the percentage of students achieving the provincial standard in reading, writing and mathematics
¨ detailed tables and graphs showing results for all levels of achievement, results for gender and participation information
¨ student questionnaire results
¨ an explanation of all terms used in this report.
HOW TO USE THIS REPORT
¨ Examine the contextual information to understand the similarities and differences between the school, the board and the province; the board and the province. Consider the challenges that any differences might present.
¨ Examine the results for reading, writing and mathematics.
· Are these results consistent with what you would expect? · How do the school results compare to the board and the province; the board
results compare to the province?· How do these results compare over time?
· What influence might students’ attitudes have on student performance (refer
to the questionnaire results)?
¨ Speak to school or board staff about the goals for school improvement related to reading, writing and mathematics.
The Education Quality and Accountability Office is an independent agency that gathers information about student achievement through province-wide assessments. Each year, all Grade 3 and Grade 6 students across Ontario take part in these assessments of reading, writing and mathematics. Individual results are reported to students and to parents and guardians. School, board and provincial results are released publicly.
Learn more about us at www.eqao.com.
4 of 31September 17, 2009

Senhor Santo Cristo Sep S (763799)School Report
Place of Birth
Assessments of Reading, Writing and Mathematics, Primary and Junior Divisions, 2008–2009
Contextual Information: Grade 3*
This information provides a context for interpreting the school’s results.
* Contextual data pertaining to gender, student status, place of birth, language learned at home and year entered school and board are provided by schools and/or boards through the Student Data Collection process. Some data may be missing because they were not provided by the school or the board.
** See the Explanation of Terms.
Demographic Information School Board Province
Enrolment
Number of Grade 3 students 15 5 960 125 481 Number of classes with Grade 3 students 3 462 9 385 Number of schools with Grade 3 classes Not applicable 169 3 399
Number Percent Number Percent Number Percent
Gender
Female 6 40% 2 969 50% 60 999 49%
Male 9 60% 2 991 50% 64 482 51%
Gender not specified 0 0% 0 0% 0 0%
Student Status
English language learners** 0 0% 607 10% 11 281 9%
Students with special needs (excluding gifted)** 7 47% 747 13% 18 291 15%
Born outside Canada 0 0% 1 077 18% 13 717 11%
In Canada less than one year 0 0% 60 1% 804 1%
In Canada one year or more but less than three years 0 0% 345 6% 2 893 2%
In Canada three years or more 0 0% 671 11% 8 946 7%
Language
First language learned at home was other than English 3 20% 1 884 32% 27 084 22%
Born in Canada 15 100% 4 867 82% 111 561 89%
79% 93 098 74%93% 3 or more years prior to the assessment 14 4 687
0% 350 6% 8 048 6%
0% 501 8% 11 982 10%
Year prior to the assessment 0
2 years prior to the assessment 0
2 years prior to the assessment 1
Year prior to the assessment
13%12%7%
12%9%13%
3 or more years prior to the assessment 73% 61%66%
14 5455662
16 821743
76 8493 93011
Year Student Entered Current School
13%7% Year of the assessment 12% 16 7467001
Data not available 0% <1%<1% 520210
1% 3 633 3%0% Data not available 0 47
Year Student Entered Current Board
7%6% 8 7207% 375 Year of the assessment 1
5 of 31September 17, 2009
Senhor Santo Cristo Sep S (763799)School Report
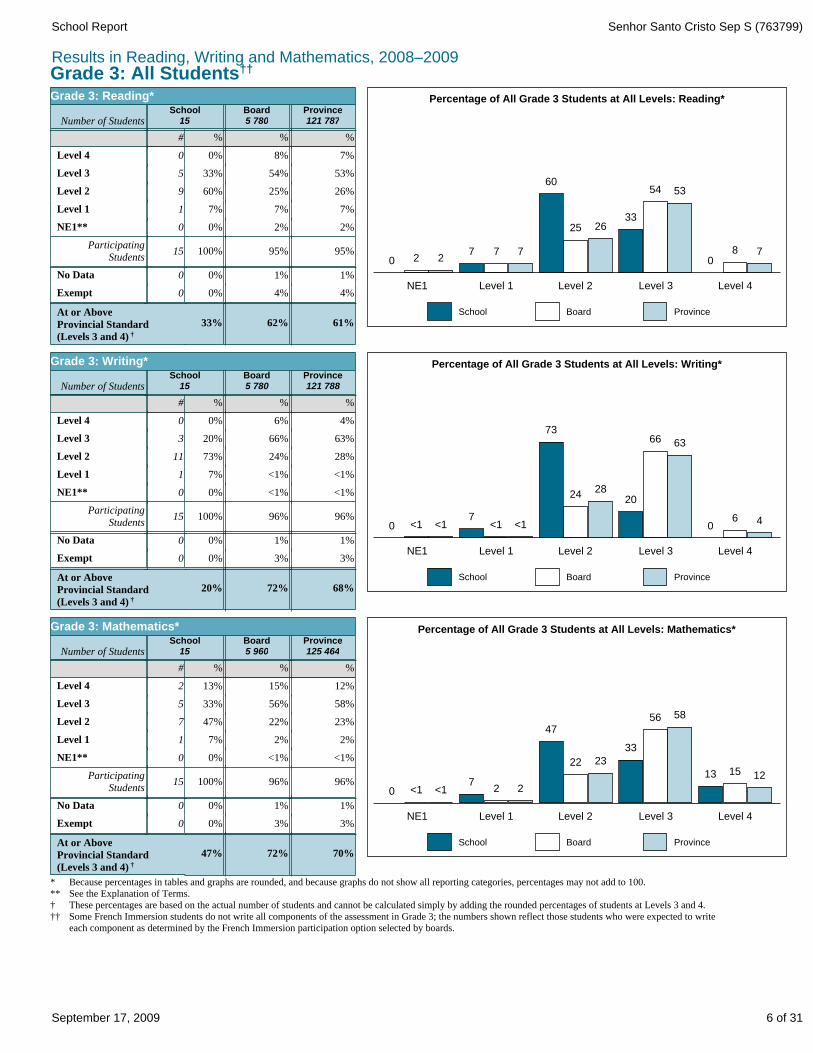
Results in Reading, Writing and Mathematics, 2008–2009Grade 3: All Students††
ProvinceBoardSchool
780
5354
332625
60
777220
Percentage of All Grade 3 Students at All Levels: Reading*
NE1 Level 1 Level 2 Level 3 Level 4
%%%#
Province121 787
Board5 780
School15Number of Students
61%
4%
1%
95%
2%
7%
26%
53%
7%
62%
4%
1%
95%
2%
7%
25%
54%
8%
33%
0%
0%
100%
0%
7%
60%
33%
0%
0
15
0
1
9
5
0
0 Exempt
No Data
ParticipatingStudents
NE1**
Level 1
Level 2
Level 3
Level 4
At or AboveProvincial Standard(Levels 3 and 4) †
Grade 3: Reading*
ProvinceBoardSchool
460
6366
202824
73
<1<17
<1<10
Percentage of All Grade 3 Students at All Levels: Writing*
NE1 Level 1 Level 2 Level 3 Level 4
%%%#
Province121 788
Board5 780
School15Number of Students
68%
3%
1%
96%
<1%
<1%
28%
63%
4%
72%
3%
1%
96%
<1%
<1%
24%
66%
6%
20%
0%
0%
100%
0%
7%
73%
20%
0%
0
15
0
1
11
3
0
0 Exempt
No Data
ParticipatingStudents
NE1**
Level 1
Level 2
Level 3
Level 4
At or AboveProvincial Standard(Levels 3 and 4) †
Grade 3: Writing*
ProvinceBoardSchool
121513
5856
332322
47
227
<1<10
Percentage of All Grade 3 Students at All Levels: Mathematics*
NE1 Level 1 Level 2 Level 3 Level 4
%%%#
Province125 464
Board5 960
School15Number of Students
70%
3%
1%
96%
<1%
2%
23%
58%
12%
72%
3%
1%
96%
<1%
2%
22%
56%
15%
47%
0%
0%
100%
0%
7%
47%
33%
13%
0
15
0
1
7
5
2
0 Exempt
No Data
ParticipatingStudents
NE1**
Level 1
Level 2
Level 3
Level 4
At or AboveProvincial Standard(Levels 3 and 4) †
Grade 3: Mathematics*
* Because percentages in tables and graphs are rounded, and because graphs do not show all reporting categories, percentages may not add to 100.** See the Explanation of Terms.† These percentages are based on the actual number of students and cannot be calculated simply by adding the rounded percentages of students at Levels 3 and 4.†† Some French Immersion students do not write all components of the assessment in Grade 3; the numbers shown reflect those students who were expected to write
each component as determined by the French Immersion participation option selected by boards.
6 of 31September 17, 2009

Senhor Santo Cristo Sep S (763799)School Report
Results in Reading, Writing and Mathematics, 2008–2009
Grade 3: Participating Students (excludes “no data” and “exempt” categories)
ProvinceBoardSchool
790
5656
332726
60
877220
Percentage of Participating Grade 3 Students at All Levels: Reading*
NE1 Level 1 Level 2 Level 3 Level 4
%%%#
8%
27%
56%
7%
7%
26%
56%
7%
60%
33%
1
9
5
Level 1
Level 2
Level 3
63%65%33%
2%2%0%0 NE1**
At or AboveProvincial Standard(Levels 3 and 4) †
Province116 256
Board5 503
School15Number of Students
Grade 3: Reading*
9%0%0 Level 4
ProvinceBoardSchool
560
6669
202925
73
<1<17
<1<10
Percentage of Participating Grade 3 Students at All Levels: Writing*
NE1 Level 1 Level 2 Level 3 Level 4
%%%#
<1%
29%
66%
5%
<1%
25%
69%
7%
73%
20%
1
11
3
Level 1
Level 2
Level 3
71%75%20%
<1%<1%0%0 NE1**
At or AboveProvincial Standard(Levels 3 and 4) †
Province116 812
Board5 521
School15Number of Students
Grade 3: Writing*
6%0%0 Level 4
ProvinceBoardSchool
131613
6059
332423
47
227
<1<10
Percentage of Participating Grade 3 Students at All Levels: Mathematics*
NE1 Level 1 Level 2 Level 3 Level 4
%%%#
2%
24%
60%
13%
2%
23%
59%
7%
47%
33%
1
7
5
Level 1
Level 2
Level 3
73%75%47%
<1%<1%0%0 NE1**
At or AboveProvincial Standard(Levels 3 and 4) †
Province120 405
Board5 697
School15Number of Students
Grade 3: Mathematics*
16%13%2 Level 4
* Because percentages in tables and graphs are rounded, percentages may not add to 100.** See the Explanation of Terms.† These percentages are based on the actual number of students and cannot be calculated simply by adding the rounded percentages of students at Levels 3 and 4.
7 of 31September 17, 2009
Senhor Santo Cristo Sep S (763799)School Report
Results in Reading, Writing and Mathematics, 2008–2009
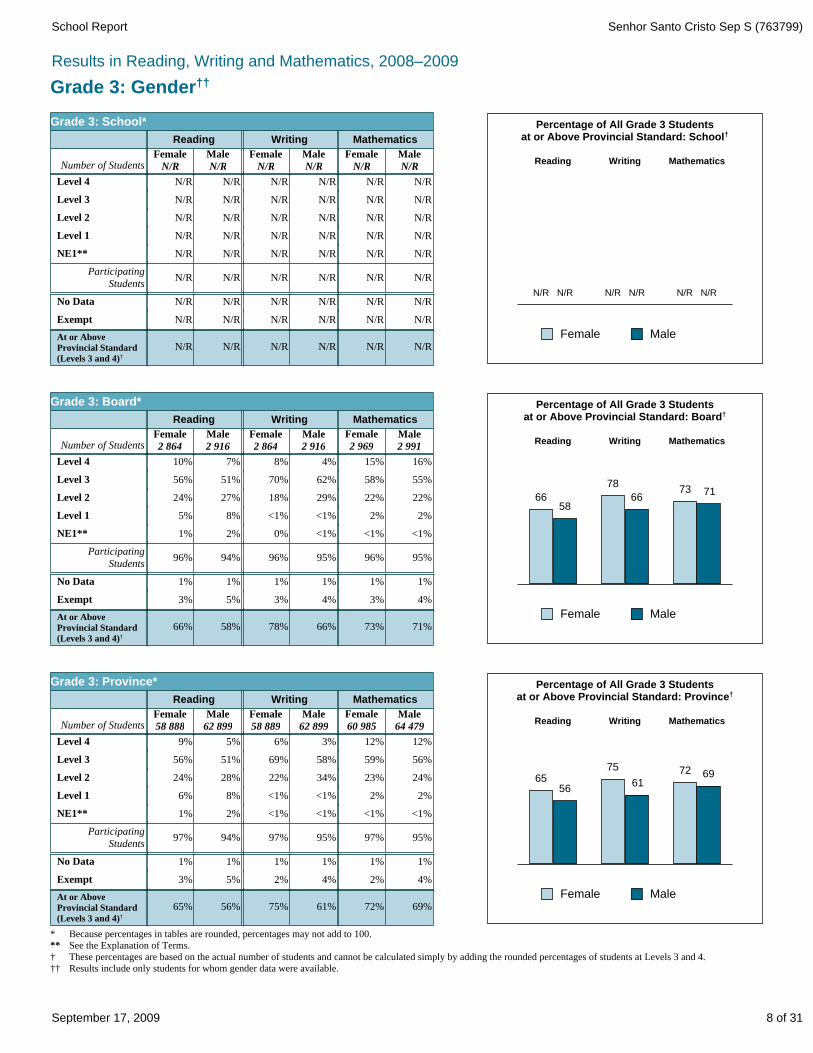
Grade 3: Gender††
Percentage of All Grade 3 Studentsat or Above Provincial Standard: School†
Reading Writing Mathematics
Female Male
N/R N/R N/R N/R N/R N/R
N/RN/RN/RN/RN/RN/R
N/R
N/R
N/RN/RN/RN/RN/RN/R Exempt
N/RN/RN/RN/RN/RN/R No Data
N/RN/RN/RN/RN/RN/RParticipating
Students
N/RN/RN/RN/RN/RN/R NE1**
N/RN/RN/RN/RN/RN/R Level 1
N/RN/RN/RN/RN/R Level 2
N/RN/RN/RN/RN/R Level 3
N/RN/RN/RN/RN/RN/R Level 4
At or AboveProvincial Standard(Levels 3 and 4)†
MaleN/R
FemaleN/R
MaleN/R
FemaleN/R
MaleN/R
FemaleN/RNumber of Students
MathematicsWritingReading
Grade 3: School*
Percentage of All Grade 3 Studentsat or Above Provincial Standard: Board†
Reading Writing Mathematics
6658
78
6673 71
Female Male71%73%66%78%58%66%
55%
22%
4%3%4%3%5%3% Exempt
1%1%1%1%1%1% No Data
95%96%95%96%94%96%Participating
Students
<1%<1%<1%0%2%1% NE1**
2%2%<1%<1%8%5% Level 1
22%29%18%27%24% Level 2
58%62%70%51%56% Level 3
16%15%4%8%7%10% Level 4
At or AboveProvincial Standard(Levels 3 and 4)†
Male2 991
Female2 969
Male2 916
Female2 864
Male2 916
Female2 864Number of Students
MathematicsWritingReading
Grade 3: Board*
Percentage of All Grade 3 Studentsat or Above Provincial Standard: Province†
Reading Writing Mathematics
6556
75
6172 69
Female Male69%72%61%75%56%65%
56%
24%
4%2%4%2%5%3% Exempt
1%1%1%1%1%1% No Data
95%97%95%97%94%97%Participating
Students
<1%<1%<1%<1%2%1% NE1**
2%2%<1%<1%8%6% Level 1
23%34%22%28%24% Level 2
59%58%69%51%56% Level 3
12%12%3%6%5%9% Level 4
At or AboveProvincial Standard(Levels 3 and 4)†
Male64 479
Female60 985
Male62 899
Female58 889
Male62 899
Female58 888Number of Students
MathematicsWritingReading
Grade 3: Province*
* Because percentages in tables are rounded, percentages may not add to 100.** See the Explanation of Terms.† These percentages are based on the actual number of students and cannot be calculated simply by adding the rounded percentages of students at Levels 3 and 4.†† Results include only students for whom gender data were available.
8 of 31September 17, 2009
Senhor Santo Cristo Sep S (763799)School Report
Place of Birth
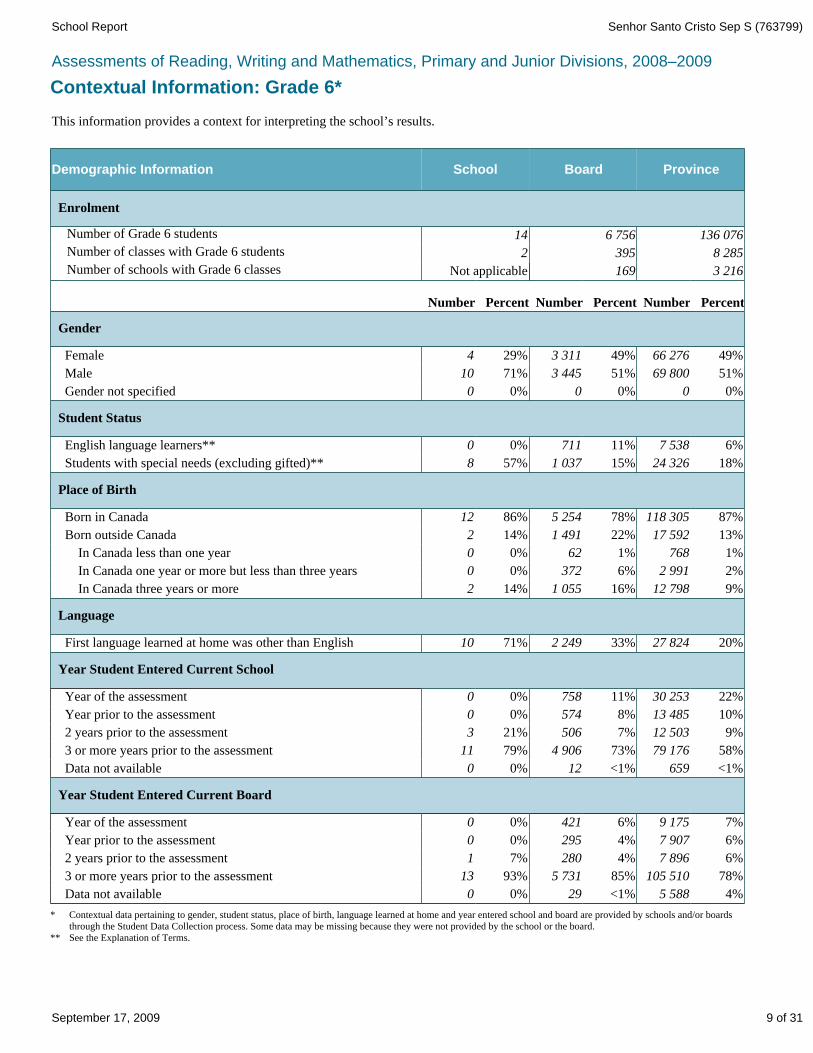
Assessments of Reading, Writing and Mathematics, Primary and Junior Divisions, 2008–2009
Contextual Information: Grade 6*
This information provides a context for interpreting the school’s results.
* Contextual data pertaining to gender, student status, place of birth, language learned at home and year entered school and board are provided by schools and/or boards through the Student Data Collection process. Some data may be missing because they were not provided by the school or the board.
** See the Explanation of Terms.
Demographic Information School Board Province
Enrolment
Number of Grade 6 students 14 6 756 136 076 Number of classes with Grade 6 students 2 395 8 285 Number of schools with Grade 6 classes Not applicable 169 3 216
Number Percent Number Percent Number Percent
Gender
Female 4 29% 3 311 49% 66 276 49%
Male 10 71% 3 445 51% 69 800 51%
Gender not specified 0 0% 0 0% 0 0%
Student Status
English language learners** 0 0% 711 11% 7 538 6%
Students with special needs (excluding gifted)** 8 57% 1 037 15% 24 326 18%
Born outside Canada 2 14% 1 491 22% 17 592 13%
In Canada less than one year 0 0% 62 1% 768 1%
In Canada one year or more but less than three years 0 0% 372 6% 2 991 2%
In Canada three years or more 2 14% 1 055 16% 12 798 9%
Language
First language learned at home was other than English 10 71% 2 249 33% 27 824 20%
Born in Canada 12 86% 5 254 78% 118 305 87%
85% 105 510 78%93% 3 or more years prior to the assessment 13 5 731
0% 295 4% 7 907 6%
7% 280 4% 7 896 6%
Year prior to the assessment 0
2 years prior to the assessment 1
2 years prior to the assessment 3
Year prior to the assessment
9%7%21%
10%8%0%
3 or more years prior to the assessment 79% 58%73%
13 4855740
12 503506
79 1764 90611
Year Student Entered Current School
22%0% Year of the assessment 11% 30 2537580
Data not available 0% <1%<1% 659120
<1% 5 588 4%0% Data not available 0 29
Year Student Entered Current Board
7%6% 9 1750% 421 Year of the assessment 0
9 of 31September 17, 2009

Senhor Santo Cristo Sep S (763799)School Report
Results in Reading, Writing and Mathematics, 2008–2009Grade 6: All Students
ProvinceBoardSchool
1111
5955
2223
57<11
Percentage of All Grade 6 Students at All Levels: Reading*
NE1 Level 1 Level 2 Level 3 Level 4
N/R N/R N/R N/R N/R
%%%#
Province136 069
Board6 753
SchoolN/RNumber of Students
69%
3%
1%
96%
<1%
5%
22%
59%
11%
66%
3%
1%
97%
1%
7%
23%
55%
11%
N/R
N/R
N/R
N/R
N/R
N/R
N/R
N/R
N/R
N/R
N/R
N/R
N/R
N/R
N/R
N/R
N/R Exempt
No Data
ParticipatingStudents
NE1**
Level 1
Level 2
Level 3
Level 4
At or AboveProvincial Standard(Levels 3 and 4) †
Grade 6: Reading*
ProvinceBoardSchool
910
5860
2925
<1<1<1<1
Percentage of All Grade 6 Students at All Levels: Writing*
NE1 Level 1 Level 2 Level 3 Level 4
N/R N/R N/R N/R N/R
%%%#
Province136 075
Board6 753
SchoolN/RNumber of Students
67%
3%
1%
96%
<1%
<1%
29%
58%
9%
71%
3%
1%
97%
<1%
<1%
25%
60%
10%
N/R
N/R
N/R
N/R
N/R
N/R
N/R
N/R
N/R
N/R
N/R
N/R
N/R
N/R
N/R
N/R
N/R Exempt
No Data
ParticipatingStudents
NE1**
Level 1
Level 2
Level 3
Level 4
At or AboveProvincial Standard(Levels 3 and 4) †
Grade 6: Writing*
ProvinceBoardSchool
1314
4948
2727
67<1<1
Percentage of All Grade 6 Students at All Levels: Mathematics*
NE1 Level 1 Level 2 Level 3 Level 4
N/R N/R N/R N/R N/R
%%%#
Province136 075
Board6 756
SchoolN/RNumber of Students
63%
3%
1%
96%
<1%
6%
27%
49%
13%
62%
3%
1%
97%
<1%
7%
27%
48%
14%
N/R
N/R
N/R
N/R
N/R
N/R
N/R
N/R
N/R
N/R
N/R
N/R
N/R
N/R
N/R
N/R
N/R Exempt
No Data
ParticipatingStudents
NE1**
Level 1
Level 2
Level 3
Level 4
At or AboveProvincial Standard(Levels 3 and 4) †
Grade 6: Mathematics*
* Because percentages in tables and graphs are rounded, and because graphs do not show all reporting categories, percentages may not add to 100.** See the Explanation of Terms.† These percentages are based on the actual number of students and cannot be calculated simply by adding the rounded percentages of students at Levels 3 and 4.
10 of 31September 17, 2009
Senhor Santo Cristo Sep S (763799)School Report
Results in Reading, Writing and Mathematics, 2008–2009
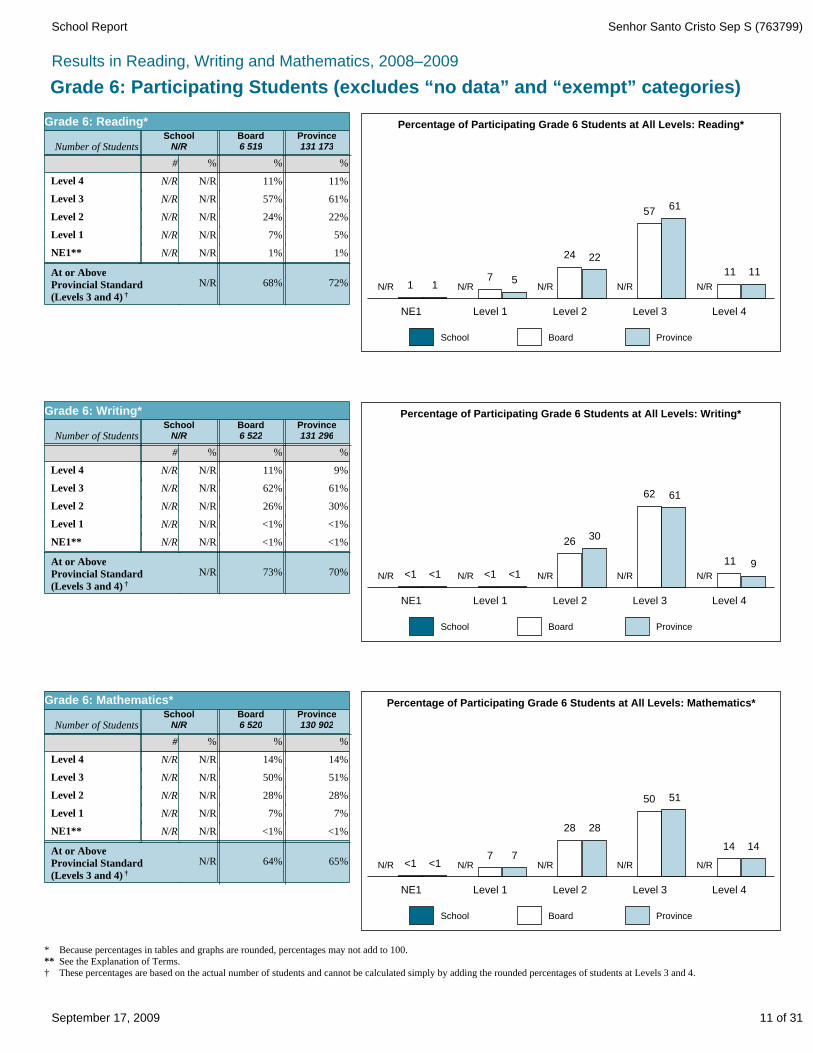
Grade 6: Participating Students (excludes “no data” and “exempt” categories)
ProvinceBoardSchool
1111
6157
2224
5711
Percentage of Participating Grade 6 Students at All Levels: Reading*
NE1 Level 1 Level 2 Level 3 Level 4
N/R N/R N/R N/R N/R
%%%#
5%
22%
61%
11%
7%
24%
57%
N/R
N/R
N/R
N/R
N/R
N/R
Level 1
Level 2
Level 3
72%68%N/R
1%1%N/RN/R NE1**
At or AboveProvincial Standard(Levels 3 and 4) †
Province131 173
Board6 519
SchoolN/RNumber of Students
Grade 6: Reading*
11%N/RN/R Level 4
ProvinceBoardSchool
911
6162
3026
<1<1<1<1
Percentage of Participating Grade 6 Students at All Levels: Writing*
NE1 Level 1 Level 2 Level 3 Level 4
N/R N/R N/R N/R N/R
%%%#
<1%
30%
61%
9%
<1%
26%
62%
N/R
N/R
N/R
N/R
N/R
N/R
Level 1
Level 2
Level 3
70%73%N/R
<1%<1%N/RN/R NE1**
At or AboveProvincial Standard(Levels 3 and 4) †
Province131 296
Board6 522
SchoolN/RNumber of Students
Grade 6: Writing*
11%N/RN/R Level 4
ProvinceBoardSchool
1414
5150
2828
77<1<1
Percentage of Participating Grade 6 Students at All Levels: Mathematics*
NE1 Level 1 Level 2 Level 3 Level 4
N/R N/R N/R N/R N/R
%%%#
7%
28%
51%
14%
7%
28%
50%
N/R
N/R
N/R
N/R
N/R
N/R
Level 1
Level 2
Level 3
65%64%N/R
<1%<1%N/RN/R NE1**
At or AboveProvincial Standard(Levels 3 and 4) †
Province130 902
Board6 520
SchoolN/RNumber of Students
Grade 6: Mathematics*
14%N/RN/R Level 4
* Because percentages in tables and graphs are rounded, percentages may not add to 100.** See the Explanation of Terms.† These percentages are based on the actual number of students and cannot be calculated simply by adding the rounded percentages of students at Levels 3 and 4.
11 of 31September 17, 2009
Senhor Santo Cristo Sep S (763799)School Report
Results in Reading, Writing and Mathematics, 2008–2009
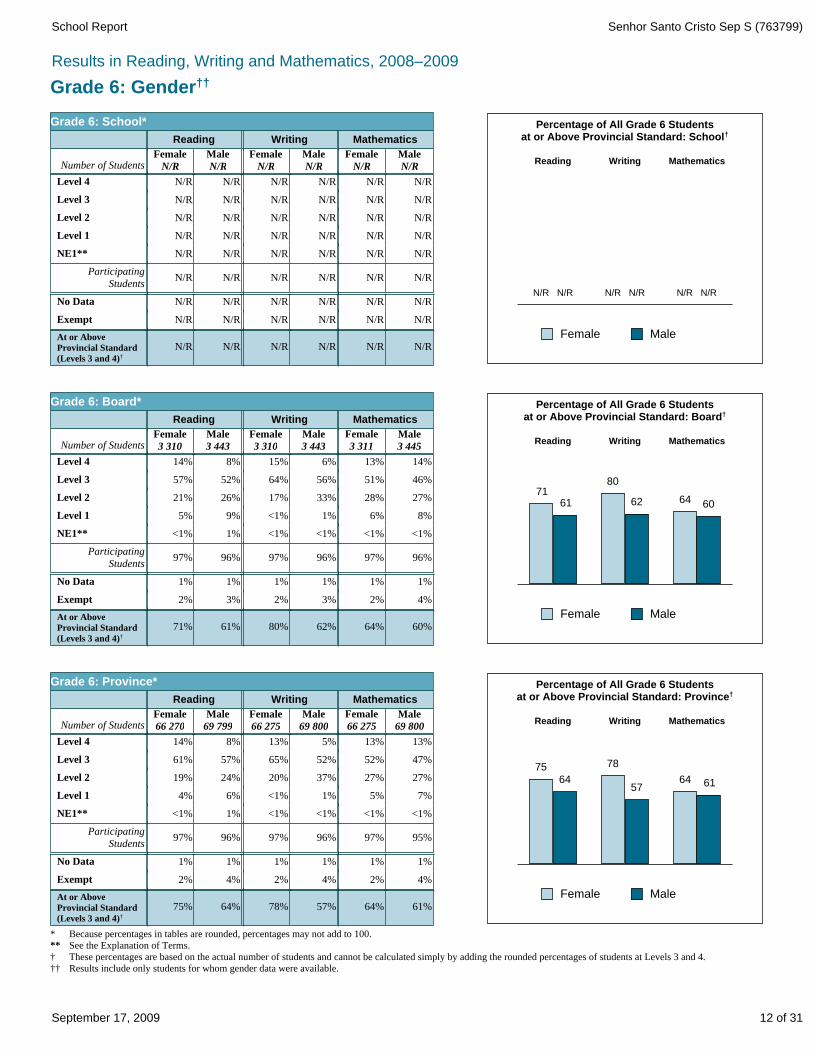
Grade 6: Gender††
Percentage of All Grade 6 Studentsat or Above Provincial Standard: School†
Reading Writing Mathematics
Female Male
N/R N/R N/R N/R N/R N/R
N/RN/RN/RN/RN/RN/R
N/R
N/R
N/RN/RN/RN/RN/RN/R Exempt
N/RN/RN/RN/RN/RN/R No Data
N/RN/RN/RN/RN/RN/RParticipating
Students
N/RN/RN/RN/RN/RN/R NE1**
N/RN/RN/RN/RN/RN/R Level 1
N/RN/RN/RN/RN/R Level 2
N/RN/RN/RN/RN/R Level 3
N/RN/RN/RN/RN/RN/R Level 4
At or AboveProvincial Standard(Levels 3 and 4)†
MaleN/R
FemaleN/R
MaleN/R
FemaleN/R
MaleN/R
FemaleN/RNumber of Students
MathematicsWritingReading
Grade 6: School*
Percentage of All Grade 6 Studentsat or Above Provincial Standard: Board†
Reading Writing Mathematics
7161
80
62 64 60
Female Male60%64%62%80%61%71%
46%
27%
4%2%3%2%3%2% Exempt
1%1%1%1%1%1% No Data
96%97%96%97%96%97%Participating
Students
<1%<1%<1%<1%1%<1% NE1**
8%6%1%<1%9%5% Level 1
28%33%17%26%21% Level 2
51%56%64%52%57% Level 3
14%13%6%15%8%14% Level 4
At or AboveProvincial Standard(Levels 3 and 4)†
Male3 445
Female3 311
Male3 443
Female3 310
Male3 443
Female3 310Number of Students
MathematicsWritingReading
Grade 6: Board*
Percentage of All Grade 6 Studentsat or Above Provincial Standard: Province†
Reading Writing Mathematics
7564
78
5764 61
Female Male61%64%57%78%64%75%
47%
27%
4%2%4%2%4%2% Exempt
1%1%1%1%1%1% No Data
95%97%96%97%96%97%Participating
Students
<1%<1%<1%<1%1%<1% NE1**
7%5%1%<1%6%4% Level 1
27%37%20%24%19% Level 2
52%52%65%57%61% Level 3
13%13%5%13%8%14% Level 4
At or AboveProvincial Standard(Levels 3 and 4)†
Male69 800
Female66 275
Male69 800
Female66 275
Male69 799
Female66 270Number of Students
MathematicsWritingReading
Grade 6: Province*
* Because percentages in tables are rounded, percentages may not add to 100.** See the Explanation of Terms.† These percentages are based on the actual number of students and cannot be calculated simply by adding the rounded percentages of students at Levels 3 and 4.†† Results include only students for whom gender data were available.
12 of 31September 17, 2009
Senhor Santo Cristo Sep S (763799)School Report
0%Data notcollected††
2008–20092007–20082006–20072005–20062004–2005
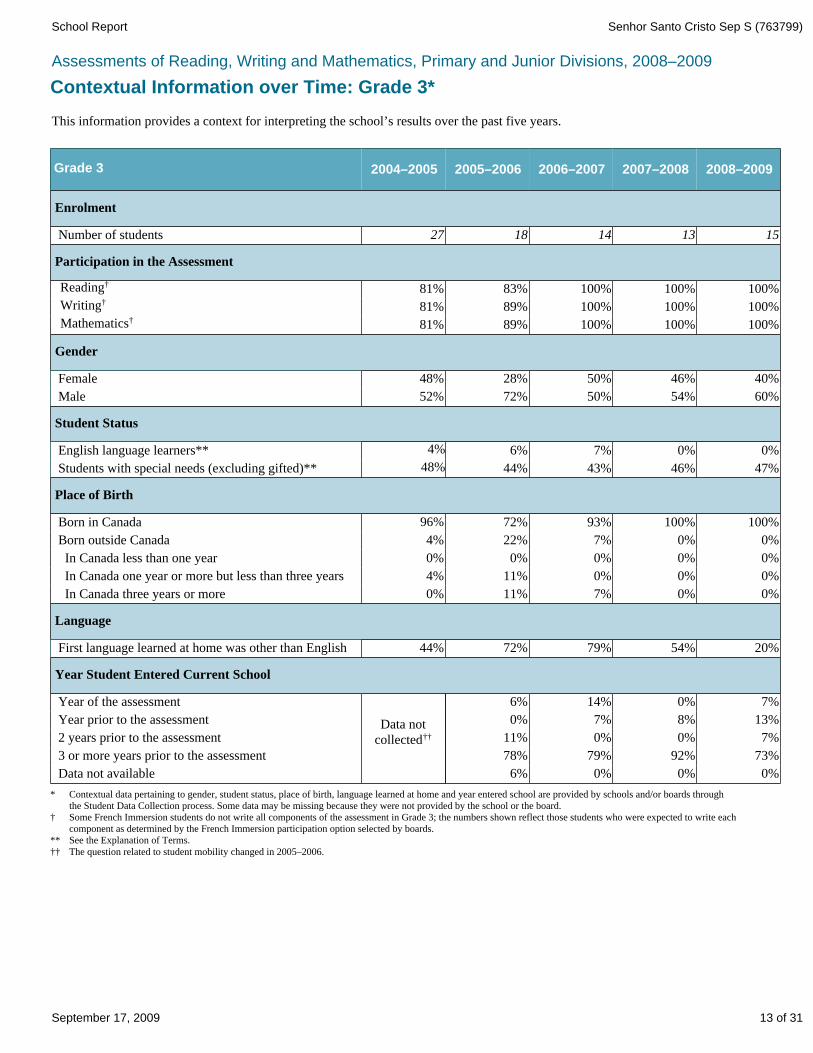
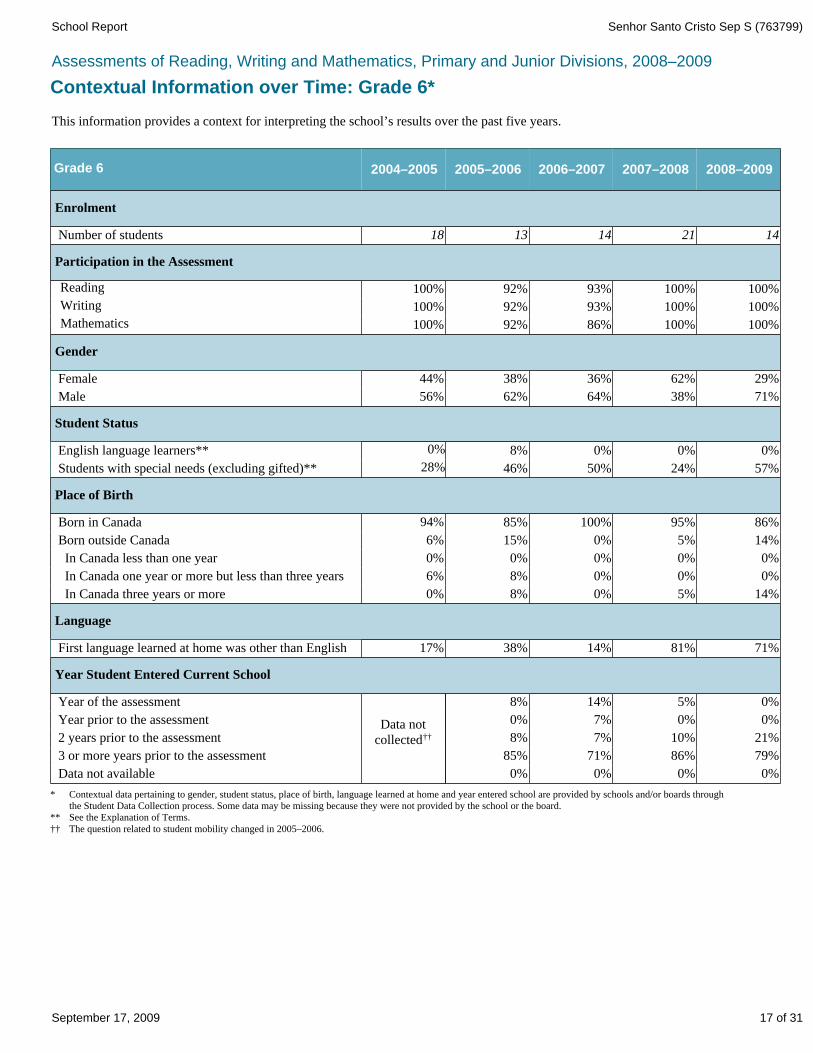
This information provides a context for interpreting the school’s results over the past five years.
Contextual Information over Time: Grade 3*
Assessments of Reading, Writing and Mathematics, Primary and Junior Divisions, 2008–2009
* Contextual data pertaining to gender, student status, place of birth, language learned at home and year entered school are provided by schools and/or boards through the Student Data Collection process. Some data may be missing because they were not provided by the school or the board.
† Some French Immersion students do not write all components of the assessment in Grade 3; the numbers shown reflect those students who were expected to write each component as determined by the French Immersion participation option selected by boards.
** See the Explanation of Terms.†† The question related to student mobility changed in 2005–2006.
Male
3 or more years prior to the assessment
Year prior to the assessment
2 years prior to the assessment
In Canada less than one year
Born outside Canada
In Canada one year or more but less than three years
In Canada three years or more
Data not available
Writing†
Mathematics†
Enrolment
Number of students 27 18 14 13 15
Participation in the Assessment
81% 89% 100% 100% 100%
81% 89% 100% 100% 100%
Gender
Reading† 81% 83% 100% 100% 100%
52% 72% 50% 54% 60%
Female 48% 28% 50% 46% 40%
Student Status
English language learners** 4% 6% 7% 0% 0%
4% 22% 7% 0% 0%
0% 0% 0% 0% 0%
4% 11% 0% 0% 0%
0% 11% 7% 0% 0%
Language
First language learned at home was other than English 44% 72% 79% 54% 20%
Year Student Entered Current School
Year of the assessment
Grade 3
Students with special needs (excluding gifted)** 48% 44% 43% 46% 47%
Place of Birth
Born in Canada 96% 72% 93% 100% 100%
6% 14% 0% 7%
7% 8% 13%
11% 0% 0% 7%
78% 79% 92% 73%
6% 0% 0% 0%
13 of 31September 17, 2009
Senhor Santo Cristo Sep S (763799)School Report
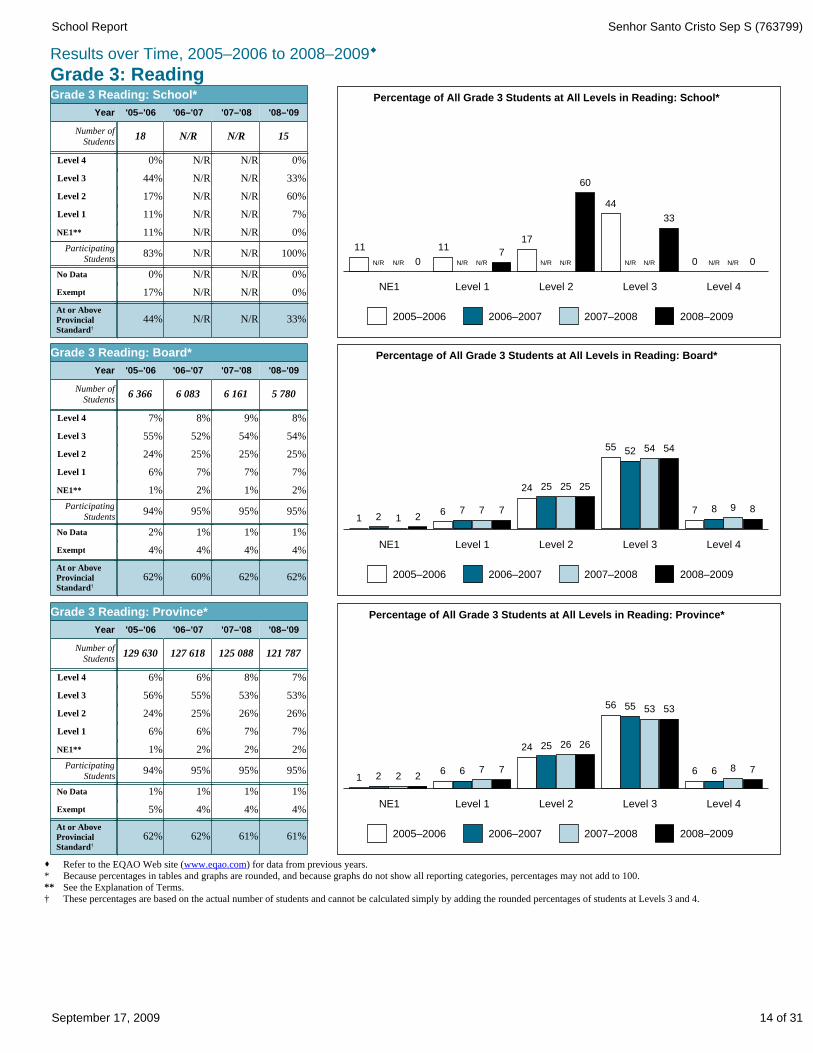
Grade 3: ReadingResults over Time, 2005–2006 to 2008–2009®
· Refer to the EQAO Web site (www.eqao.com) for data from previous years.* Because percentages in tables and graphs are rounded, and because graphs do not show all reporting categories, percentages may not add to 100.** See the Explanation of Terms.† These percentages are based on the actual number of students and cannot be calculated simply by adding the rounded percentages of students at Levels 3 and 4.
Percentage of All Grade 3 Students at All Levels in Reading: School*
NE1 Level 1 Level 2 Level 3 Level 4
11
2005–2006 2006–2007 2007–2008 2008–2009
0
117
17
60
44
33
0 0N/R N/R N/R N/R N/R N/R N/R N/R N/R N/R
33%N/RN/R44%
0%N/RN/R17% Exempt
0%N/RN/R0% No Data
100%N/RN/R83%Participating X
StudentsX
0%N/RN/R11% NE1**
7%N/RN/R11% Level 1
60%N/RN/R17% Level 2
33%N/RN/R44% Level 3
0%N/RN/R0% Level 4
15N/RN/R18Number of
Students
'08–'09'07–'08'06–'07'05–'06Year
Grade 3 Reading: School*
At or AboveProvincial Standard†
Percentage of All Grade 3 Students at All Levels in Reading: Board*
NE1 Level 1 Level 2 Level 3 Level 4
1
2005–2006 2006–2007 2007–2008 2008–2009
2 1 26 7 7 7
24 25 25 25
55 52 54 54
7 8 9 8
62%62%60%62%
4%4%4%4% Exempt
1%1%1%2% No Data
95%95%95%94%Participating X
StudentsX
2%1%2%1% NE1**
7%7%7%6% Level 1
25%25%25%24% Level 2
54%54%52%55% Level 3
8%9%8%7% Level 4
5 7806 1616 0836 366Number of
Students
'08–'09'07–'08'06–'07'05–'06Year
Grade 3 Reading: Board*
At or AboveProvincial Standard†
Percentage of All Grade 3 Students at All Levels in Reading: Province*
NE1 Level 1 Level 2 Level 3 Level 4
1
2005–2006 2006–2007 2007–2008 2008–2009
2 2 26 6 7 7
24 25 26 26
56 55 53 53
6 6 8 7
61%61%62%62%
4%4%4%5% Exempt
1%1%1%1% No Data
95%95%95%94%Participating X
StudentsX
2%2%2%1% NE1**
7%7%6%6% Level 1
26%26%25%24% Level 2
53%53%55%56% Level 3
7%8%6%6% Level 4
121 787125 088127 618129 630Number of
Students
'08–'09'07–'08'06–'07'05–'06Year
Grade 3 Reading: Province*
At or AboveProvincial Standard†
14 of 31September 17, 2009

Senhor Santo Cristo Sep S (763799)School Report
Grade 3: WritingResults over Time, 2005–2006 to 2008–2009®
· Refer to the EQAO Web site (www.eqao.com) for data from previous years.* Because percentages in tables and graphs are rounded, and because graphs do not show all reporting categories, percentages may not add to 100.** See the Explanation of Terms.† These percentages are based on the actual number of students and cannot be calculated simply by adding the rounded percentages of students at Levels 3 and 4.
Percentage of All Grade 3 Students at All Levels in Writing: School*
NE1 Level 1 Level 2 Level 3 Level 4
0
2005–2006 2006–2007 2007–2008 2008–2009
0 07
44
73
44
20
0 0N/R N/R N/R N/R N/R N/R N/R N/R N/R N/R
20%N/RN/R44%
0%N/RN/R11% Exempt
0%N/RN/R0% No Data
100%N/RN/R89%Participating X
StudentsX
0%N/RN/R0% NE1**
7%N/RN/R0% Level 1
73%N/RN/R44% Level 2
20%N/RN/R44% Level 3
0%N/RN/R0% Level 4
15N/RN/R18Number of
Students
'08–'09'07–'08'06–'07'05–'06Year
Grade 3 Writing: School*
At or AboveProvincial Standard†
Percentage of All Grade 3 Students at All Levels in Writing: Board*
NE1 Level 1 Level 2 Level 3 Level 4
<1
2005–2006 2006–2007 2007–2008 2008–2009
1 <1 <1 <1 <1 <1 <1
24 25 25 24
61 61 63 66
8 8 7 6
72%70%69%70%
3%4%4%4% Exempt
1%1%1%2% No Data
96%95%95%94%Participating X
StudentsX
<1%<1%1%<1% NE1**
<1%<1%<1%<1% Level 1
24%25%25%24% Level 2
66%63%61%61% Level 3
6%7%8%8% Level 4
5 7806 1616 0836 366Number of
Students
'08–'09'07–'08'06–'07'05–'06Year
Grade 3 Writing: Board*
At or AboveProvincial Standard†
Percentage of All Grade 3 Students at All Levels in Writing: Province*
NE1 Level 1 Level 2 Level 3 Level 4
<1
2005–2006 2006–2007 2007–2008 2008–2009
<1 <1 <1 <1 <1 <1 <1
29 30 29 28
58 58 61 63
6 6 5 4
68%66%64%64%
3%3%4%5% Exempt
1%1%1%1% No Data
96%96%95%94%Participating X
StudentsX
<1%<1%<1%<1% NE1**
<1%<1%<1%<1% Level 1
28%29%30%29% Level 2
63%61%58%58% Level 3
4%5%6%6% Level 4
121 788125 088127 618129 630Number of
Students
'08–'09'07–'08'06–'07'05–'06Year
Grade 3 Writing: Province*
At or AboveProvincial Standard†
15 of 31September 17, 2009

Senhor Santo Cristo Sep S (763799)School Report
Grade 3: MathematicsResults over Time, 2005–2006 to 2008–2009®
· Refer to the EQAO Web site (www.eqao.com) for data from previous years.* Because percentages in tables and graphs are rounded, and because graphs do not show all reporting categories, percentages may not add to 100.** See the Explanation of Terms.† These percentages are based on the actual number of students and cannot be calculated simply by adding the rounded percentages of students at Levels 3 and 4.
Percentage of All Grade 3 Students at All Levels in Mathematics: School*
NE1 Level 1 Level 2 Level 3 Level 4
6
2005–2006 2006–2007 2007–2008 2008–2009
0 07
22
4756
33
613
N/R N/R N/R N/R N/R N/R N/R N/R N/R N/R
47%N/RN/R61%
0%N/RN/R11% Exempt
0%N/RN/R0% No Data
100%N/RN/R89%Participating X
StudentsX
0%N/RN/R6% NE1**
7%N/RN/R0% Level 1
47%N/RN/R22% Level 2
33%N/RN/R56% Level 3
13%N/RN/R6% Level 4
15N/RN/R18Number of
Students
'08–'09'07–'08'06–'07'05–'06Year
Grade 3 Mathematics: School*
At or AboveProvincial Standard†
Percentage of All Grade 3 Students at All Levels in Mathematics: Board*
NE1 Level 1 Level 2 Level 3 Level 4
<1
2005–2006 2006–2007 2007–2008 2008–2009
<1 <1 <1 2 3 3 2
25 24 24 22
54 55 55 56
13 13 13 15
72%68%68%66%
3%4%4%4% Exempt
1%1%1%2% No Data
96%95%95%94%Participating X
StudentsX
<1%<1%<1%<1% NE1**
2%3%3%2% Level 1
22%24%24%25% Level 2
56%55%55%54% Level 3
15%13%13%13% Level 4
5 9606 3056 2436 501Number of
Students
'08–'09'07–'08'06–'07'05–'06Year
Grade 3 Mathematics: Board*
At or AboveProvincial Standard†
Percentage of All Grade 3 Students at All Levels in Mathematics: Province*
NE1 Level 1 Level 2 Level 3 Level 4
<1
2005–2006 2006–2007 2007–2008 2008–2009
<1 <1 <1 3 3 3 2
23 24 25 23
57 57 56 58
11 11 12 12
70%68%69%68%
3%3%3%4% Exempt
1%1%1%1% No Data
96%96%95%95%Participating X
StudentsX
<1%<1%<1%<1% NE1**
2%3%3%3% Level 1
23%25%24%23% Level 2
58%56%57%57% Level 3
12%12%11%11% Level 4
125 464128 659130 996132 782Number of
Students
'08–'09'07–'08'06–'07'05–'06Year
Grade 3 Mathematics: Province*
At or AboveProvincial Standard†
16 of 31September 17, 2009
Senhor Santo Cristo Sep S (763799)School Report
0%Data notcollected††
2008–20092007–20082006–20072005–20062004–2005
This information provides a context for interpreting the school’s results over the past five years.
Contextual Information over Time: Grade 6*
Assessments of Reading, Writing and Mathematics, Primary and Junior Divisions, 2008–2009
* Contextual data pertaining to gender, student status, place of birth, language learned at home and year entered school are provided by schools and/or boards through the Student Data Collection process. Some data may be missing because they were not provided by the school or the board.
** See the Explanation of Terms.†† The question related to student mobility changed in 2005–2006.
Male
3 or more years prior to the assessment
Year prior to the assessment
2 years prior to the assessment
In Canada less than one year
Born outside Canada
In Canada one year or more but less than three years
In Canada three years or more
Data not available
Writing
Mathematics
Enrolment
Number of students 18 13 14 21 14
Participation in the Assessment
100% 92% 93% 100% 100%
100% 92% 86% 100% 100%
Gender
Reading 100% 92% 93% 100% 100%
56% 62% 64% 38% 71%
Female 44% 38% 36% 62% 29%
Student Status
English language learners** 0% 8% 0% 0% 0%
6% 15% 0% 5% 14%
0% 0% 0% 0% 0%
6% 8% 0% 0% 0%
0% 8% 0% 5% 14%
Language
First language learned at home was other than English 17% 38% 14% 81% 71%
Year Student Entered Current School
Year of the assessment
Grade 6
Students with special needs (excluding gifted)** 28% 46% 50% 24% 57%
Place of Birth
Born in Canada 94% 85% 100% 95% 86%
8% 14% 5% 0%
7% 0% 0%
8% 7% 10% 21%
85% 71% 86% 79%
0% 0% 0% 0%
17 of 31September 17, 2009
Senhor Santo Cristo Sep S (763799)School Report
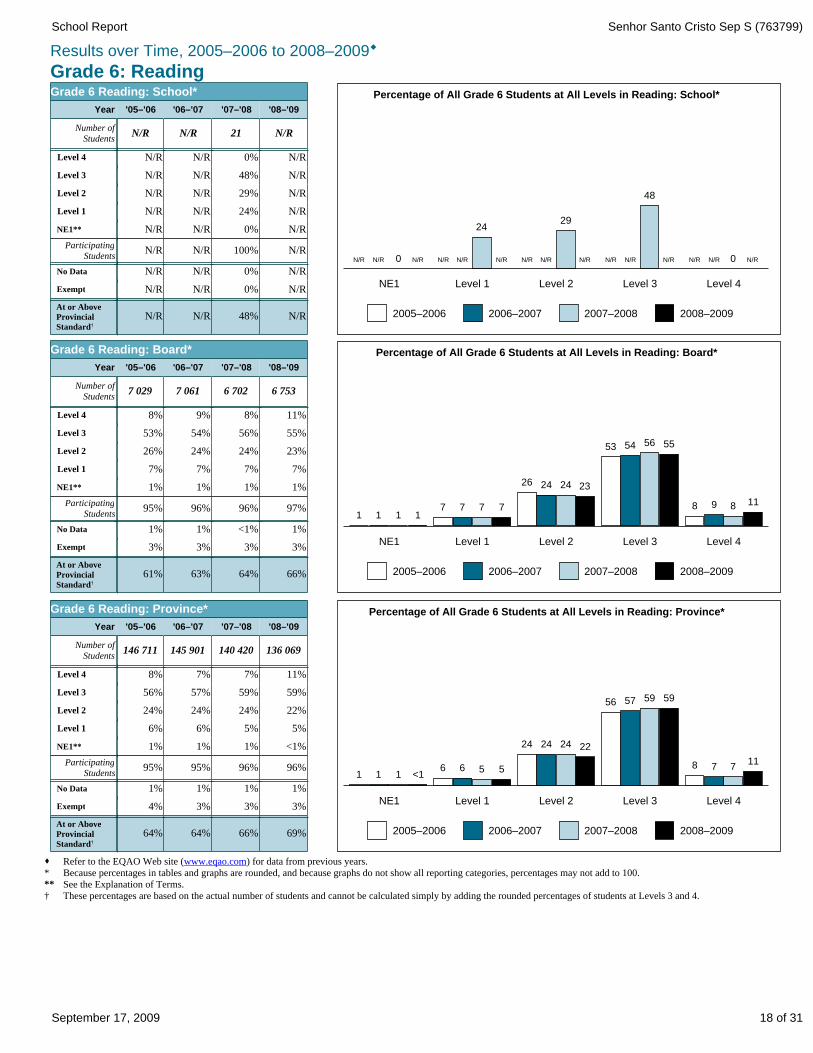
Grade 6: ReadingResults over Time, 2005–2006 to 2008–2009®
· Refer to the EQAO Web site (www.eqao.com) for data from previous years.* Because percentages in tables and graphs are rounded, and because graphs do not show all reporting categories, percentages may not add to 100.** See the Explanation of Terms.† These percentages are based on the actual number of students and cannot be calculated simply by adding the rounded percentages of students at Levels 3 and 4.
Percentage of All Grade 6 Students at All Levels in Reading: School*
NE1 Level 1 Level 2 Level 3 Level 4
2005–2006 2006–2007 2007–2008 2008–2009
N/R 0
2429
48
0N/R N/R N/R N/R N/R N/R N/R N/R N/R N/R N/R N/R N/R N/R
N/R48%N/RN/R
N/R0%N/RN/R Exempt
N/R0%N/RN/R No Data
N/R100%N/RN/RParticipating X
StudentsX
N/R0%N/RN/R NE1**
N/R24%N/RN/R Level 1
N/R29%N/RN/R Level 2
N/R48%N/RN/R Level 3
N/R0%N/RN/R Level 4
N/R21N/RN/RNumber of
Students
'08–'09'07–'08'06–'07'05–'06Year
Grade 6 Reading: School*
At or AboveProvincial Standard†
Percentage of All Grade 6 Students at All Levels in Reading: Board*
NE1 Level 1 Level 2 Level 3 Level 4
1
2005–2006 2006–2007 2007–2008 2008–2009
1 1 17 7 7 7
26 24 24 23
53 54 56 55
8 9 8 11
66%64%63%61%
3%3%3%3% Exempt
1%<1%1%1% No Data
97%96%96%95%Participating X
StudentsX
1%1%1%1% NE1**
7%7%7%7% Level 1
23%24%24%26% Level 2
55%56%54%53% Level 3
11%8%9%8% Level 4
6 7536 7027 0617 029Number of
Students
'08–'09'07–'08'06–'07'05–'06Year
Grade 6 Reading: Board*
At or AboveProvincial Standard†
Percentage of All Grade 6 Students at All Levels in Reading: Province*
NE1 Level 1 Level 2 Level 3 Level 4
1
2005–2006 2006–2007 2007–2008 2008–2009
1 1 <16 6 5 5
24 24 24 22
56 57 59 59
8 7 711
69%66%64%64%
3%3%3%4% Exempt
1%1%1%1% No Data
96%96%95%95%Participating X
StudentsX
<1%1%1%1% NE1**
5%5%6%6% Level 1
22%24%24%24% Level 2
59%59%57%56% Level 3
11%7%7%8% Level 4
136 069140 420145 901146 711Number of
Students
'08–'09'07–'08'06–'07'05–'06Year
Grade 6 Reading: Province*
At or AboveProvincial Standard†
18 of 31September 17, 2009

Senhor Santo Cristo Sep S (763799)School Report
Grade 6: WritingResults over Time, 2005–2006 to 2008–2009®
· Refer to the EQAO Web site (www.eqao.com) for data from previous years.* Because percentages in tables and graphs are rounded, and because graphs do not show all reporting categories, percentages may not add to 100.** See the Explanation of Terms.† These percentages are based on the actual number of students and cannot be calculated simply by adding the rounded percentages of students at Levels 3 and 4.
Percentage of All Grade 6 Students at All Levels in Writing: School*
NE1 Level 1 Level 2 Level 3 Level 4
2005–2006 2006–2007 2007–2008 2008–2009
N/R 0 0
5243
5N/R N/R N/R N/R N/R N/R N/R N/R N/R N/R N/R N/R N/R N/R
N/R48%N/RN/R
N/R0%N/RN/R Exempt
N/R0%N/RN/R No Data
N/R100%N/RN/RParticipating X
StudentsX
N/R0%N/RN/R NE1**
N/R0%N/RN/R Level 1
N/R52%N/RN/R Level 2
N/R43%N/RN/R Level 3
N/R5%N/RN/R Level 4
N/R21N/RN/RNumber of
Students
'08–'09'07–'08'06–'07'05–'06Year
Grade 6 Writing: School*
At or AboveProvincial Standard†
Percentage of All Grade 6 Students at All Levels in Writing: Board*
NE1 Level 1 Level 2 Level 3 Level 4
<1
2005–2006 2006–2007 2007–2008 2008–2009
<1 <1 <1 2 1 1 <1
28 3025 25
57 56 59 60
8 8 10 10
71%69%64%65%
3%3%3%3% Exempt
1%<1%1%1% No Data
97%96%96%95%Participating X
StudentsX
<1%<1%<1%<1% NE1**
<1%1%1%2% Level 1
25%25%30%28% Level 2
60%59%56%57% Level 3
10%10%8%8% Level 4
6 7536 7027 0617 029Number of
Students
'08–'09'07–'08'06–'07'05–'06Year
Grade 6 Writing: Board*
At or AboveProvincial Standard†
Percentage of All Grade 6 Students at All Levels in Writing: Province*
NE1 Level 1 Level 2 Level 3 Level 4
<1
2005–2006 2006–2007 2007–2008 2008–2009
<1 <1 <1 2 2 1 <1
31 3328 29
54 5458 58
7 7 9 9
67%67%61%61%
3%3%3%4% Exempt
1%1%1%1% No Data
96%96%95%95%Participating X
StudentsX
<1%<1%<1%<1% NE1**
<1%1%2%2% Level 1
29%28%33%31% Level 2
58%58%54%54% Level 3
9%9%7%7% Level 4
136 075140 420145 901146 711Number of
Students
'08–'09'07–'08'06–'07'05–'06Year
Grade 6 Writing: Province*
At or AboveProvincial Standard†
19 of 31September 17, 2009
Senhor Santo Cristo Sep S (763799)School Report
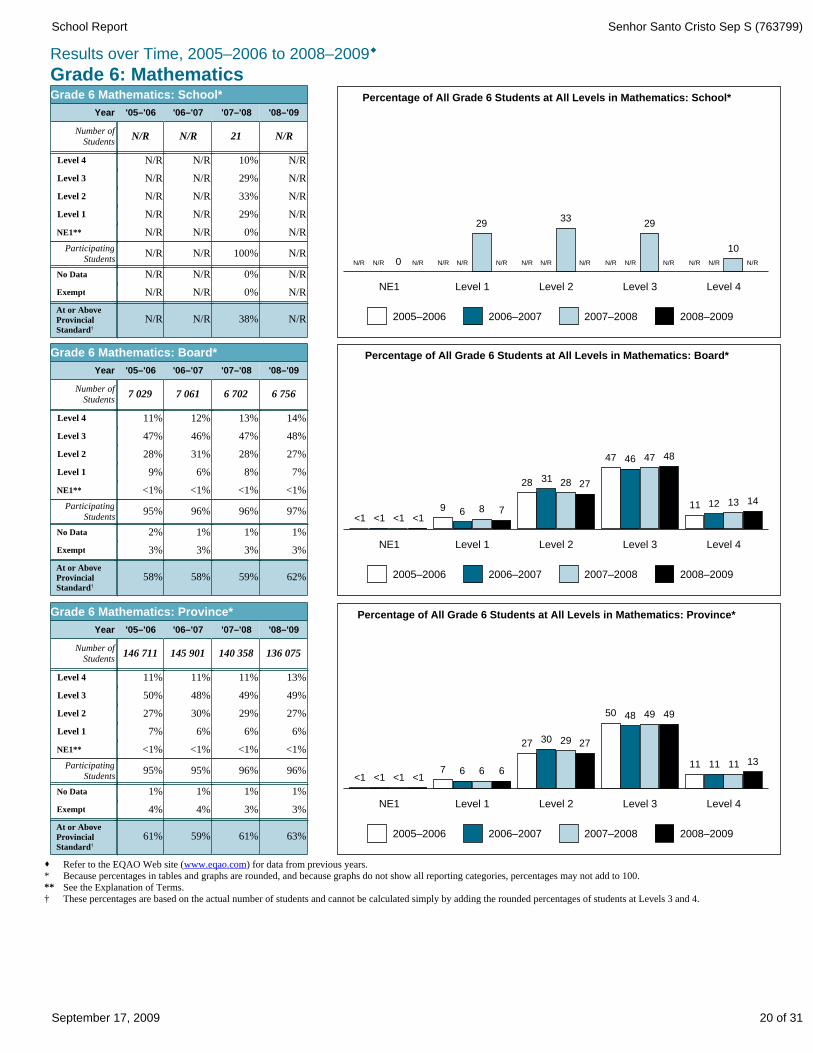
Grade 6: MathematicsResults over Time, 2005–2006 to 2008–2009®
· Refer to the EQAO Web site (www.eqao.com) for data from previous years.* Because percentages in tables and graphs are rounded, and because graphs do not show all reporting categories, percentages may not add to 100.** See the Explanation of Terms.† These percentages are based on the actual number of students and cannot be calculated simply by adding the rounded percentages of students at Levels 3 and 4.
Percentage of All Grade 6 Students at All Levels in Mathematics: School*
NE1 Level 1 Level 2 Level 3 Level 4
2005–2006 2006–2007 2007–2008 2008–2009
N/R 0
2933
29
10
N/R N/R N/R N/R N/R N/R N/R N/R N/R N/R N/R N/R N/R N/R
N/R38%N/RN/R
N/R0%N/RN/R Exempt
N/R0%N/RN/R No Data
N/R100%N/RN/RParticipating X
StudentsX
N/R0%N/RN/R NE1**
N/R29%N/RN/R Level 1
N/R33%N/RN/R Level 2
N/R29%N/RN/R Level 3
N/R10%N/RN/R Level 4
N/R21N/RN/RNumber of
Students
'08–'09'07–'08'06–'07'05–'06Year
Grade 6 Mathematics: School*
At or AboveProvincial Standard†
Percentage of All Grade 6 Students at All Levels in Mathematics: Board*
NE1 Level 1 Level 2 Level 3 Level 4
<1
2005–2006 2006–2007 2007–2008 2008–2009
<1 <1 <19 6 8 7
28 31 28 27
47 46 47 48
11 12 13 14
62%59%58%58%
3%3%3%3% Exempt
1%1%1%2% No Data
97%96%96%95%Participating X
StudentsX
<1%<1%<1%<1% NE1**
7%8%6%9% Level 1
27%28%31%28% Level 2
48%47%46%47% Level 3
14%13%12%11% Level 4
6 7566 7027 0617 029Number of
Students
'08–'09'07–'08'06–'07'05–'06Year
Grade 6 Mathematics: Board*
At or AboveProvincial Standard†
Percentage of All Grade 6 Students at All Levels in Mathematics: Province*
NE1 Level 1 Level 2 Level 3 Level 4
<1
2005–2006 2006–2007 2007–2008 2008–2009
<1 <1 <17 6 6 6
27 30 29 27
50 48 49 49
11 11 11 13
63%61%59%61%
3%3%4%4% Exempt
1%1%1%1% No Data
96%96%95%95%Participating X
StudentsX
<1%<1%<1%<1% NE1**
6%6%6%7% Level 1
27%29%30%27% Level 2
49%49%48%50% Level 3
13%11%11%11% Level 4
136 075140 358145 901146 711Number of
Students
'08–'09'07–'08'06–'07'05–'06Year
Grade 6 Mathematics: Province*
At or AboveProvincial Standard†
20 of 31September 17, 2009

Senhor Santo Cristo Sep S (763799)School Report
READING
WRITING
MATHEMATICS
Female Male
2004–2005
Female Male
13 14 135
MaleFemale
2005–2006
7 7
Female Male
2006–2007
6 7
Female Male
2007–2008
6 9
Female Male
2008–2009
School
† Includes only students for whom gender data were available.
2004–2005 2005–2006 2006–2007 2007–2008 2008–2009
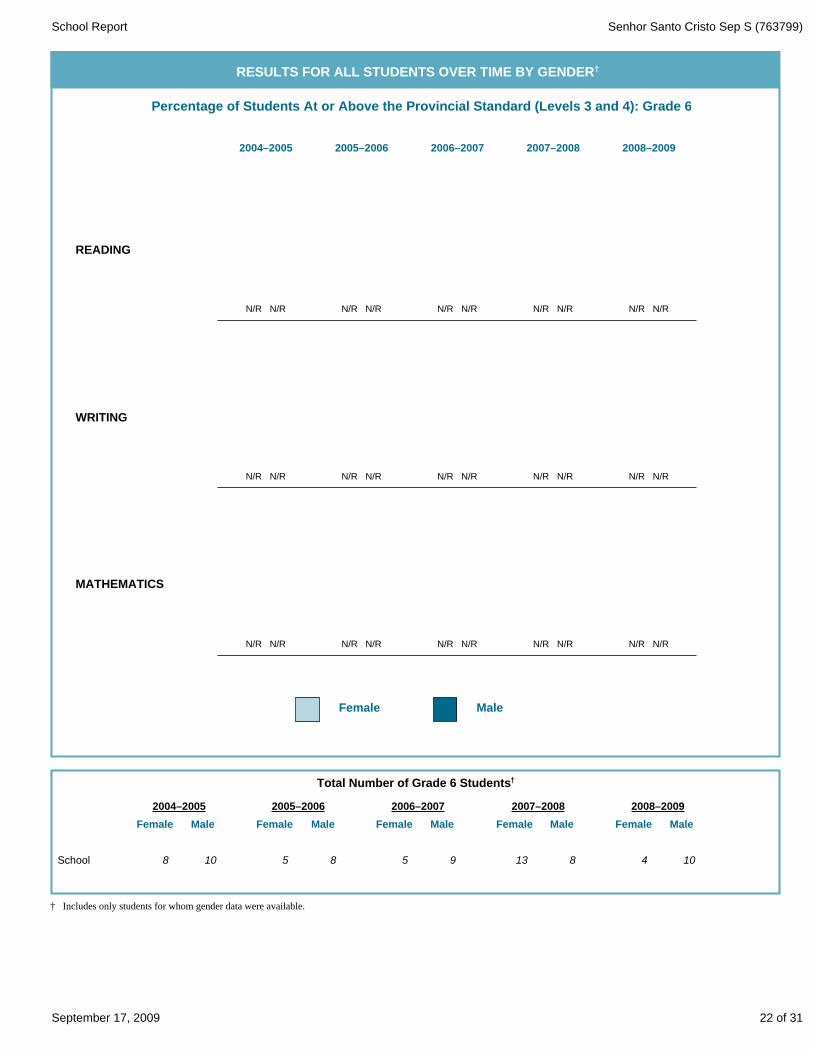
RESULTS FOR ALL STUDENTS OVER TIME BY GENDER†
Total Number of Grade 3 Students†
Percentage of Students At or Above the Provincial Standard (Levels 3 and 4): Grade 3
N/R N/R N/R N/R N/R N/R N/R N/R N/R N/R
N/R N/R N/R N/R N/R N/R N/R N/R N/R N/R
N/R N/R N/R N/R N/R N/R N/R N/R N/R N/R
21 of 31September 17, 2009
Senhor Santo Cristo Sep S (763799)School Report
READING
WRITING
MATHEMATICS
Female Male
2004–2005
Female Male
8 10 85
MaleFemale
2005–2006
5 9
Female Male
2006–2007
13 8
Female Male
2007–2008
4 10
Female Male
2008–2009
School
† Includes only students for whom gender data were available.
2004–2005 2005–2006 2006–2007 2007–2008 2008–2009
RESULTS FOR ALL STUDENTS OVER TIME BY GENDER†
Total Number of Grade 6 Students†
Percentage of Students At or Above the Provincial Standard (Levels 3 and 4): Grade 6
N/R N/R N/R N/R N/R N/R N/R N/R N/R N/R
N/R N/R N/R N/R N/R N/R N/R N/R N/R N/R
N/R N/R N/R N/R N/R N/R N/R N/R N/R N/R
22 of 31September 17, 2009

Senhor Santo Cristo Sep S (763799)School Report
At home, there is a computer for me to use for school work.
Number ofStudents Who
Answered“Yes”
I use a computer for reading activities at school.
I like to read.
I am a good reader.
Assessments of Reading, Writing and Mathematics, Primary and Junior Divisions, 2008–2009
STUDENT QUESTIONNAIRE RESULTS FOR THIS SCHOOL: GRADE 3 (# = 14)
Questionnaire ItemPercentage of Students*
0 100
I read by myself at home.
I read with someone older than me at home.
8
9
7
4
3
I am a good writer.
I like to write.
I write by myself at home.
Someone older than me helps me with my writing at home.
I use a computer for writing activities at school.
6
5
9
4
1
I am good at mathematics.
I like mathematics.
I use mathematics to solve problems outside school.
Someone older than me helps me with my mathematics athome.
I use a computer to learn mathematics at school.
I use a calculator to learn mathematics at school.
2
4
2
6
1
2
3
Yes Sometimes No
* Percentages may not add to 100, due to a lack of or ambiguous responses. Where there is no number in a box, the percentage of responses is smaller than 4.
57 43
64 21 14
50 43 7
29 29 43
21 50 29
43 57
36 57
64 29 7
29 50 21
7 86 7
14 71 14
29 64 7
14 36 50
43 43 14
7 29 64
14 79 7
21 29 50
23 of 31September 17, 2009

Senhor Santo Cristo Sep S (763799)School Report
* Percentages may not add to 100, due to a lack of or ambiguous responses.
Number ofStudents
only or mostly English
another language (or other languages) as often as English
only or mostly another language (or other languages)
Assessments of Reading, Writing and Mathematics, Primary and Junior Divisions, 2008–2009
STUDENT QUESTIONNAIRE RESULTS FOR THIS SCHOOL: GRADE 3 (# = 14)
Questionnaire ItemPercentage of Students*
0 100
only or mostly English
another language (or other languages) as often as English
only or mostly another language (or other languages)
10
2
2
9
1
4
Language(s) students speak at home:
Language(s) that people speak to students at home:
71
14
14
64
7
29
24 of 31September 17, 2009
Senhor Santo Cristo Sep S (763799)School Report
Assessments of Reading, Writing and Mathematics, Primary and Junior Divisions, 2008–2009
There is a computer for me to use for school work.
I use a calculator to learn mathematics at school.
I use a computer to learn mathematics at school.
Someone older than me helps me with my mathematics athome.
I use mathematics to solve problems outside school.
I like mathematics.
I am good at mathematics.
I use a computer for writing activities at school.
Someone older than me helps me with my writing athome.
I write by myself at home.
I like to write.
I am a good writer.
I use a computer for reading activities at school.
I read with someone older than me at home.
I read by myself at home.
I like to read.
I am a good reader.
Ma
le*
(# =
8)
School
Fe
ma
le*
(# =
6)
All S
tud
en
ts(#
= 1
4)
Ma
le*
(# =
2 8
23
)
Board
Fe
ma
le*
(# =
2 8
49
)
All S
tud
en
ts(#
= 5
67
2)
Ma
le*
(# =
60
96
3)
Province
Fe
ma
le*
(# =
58
86
7)
All S
tud
en
ts(#
= 1
19
83
0)
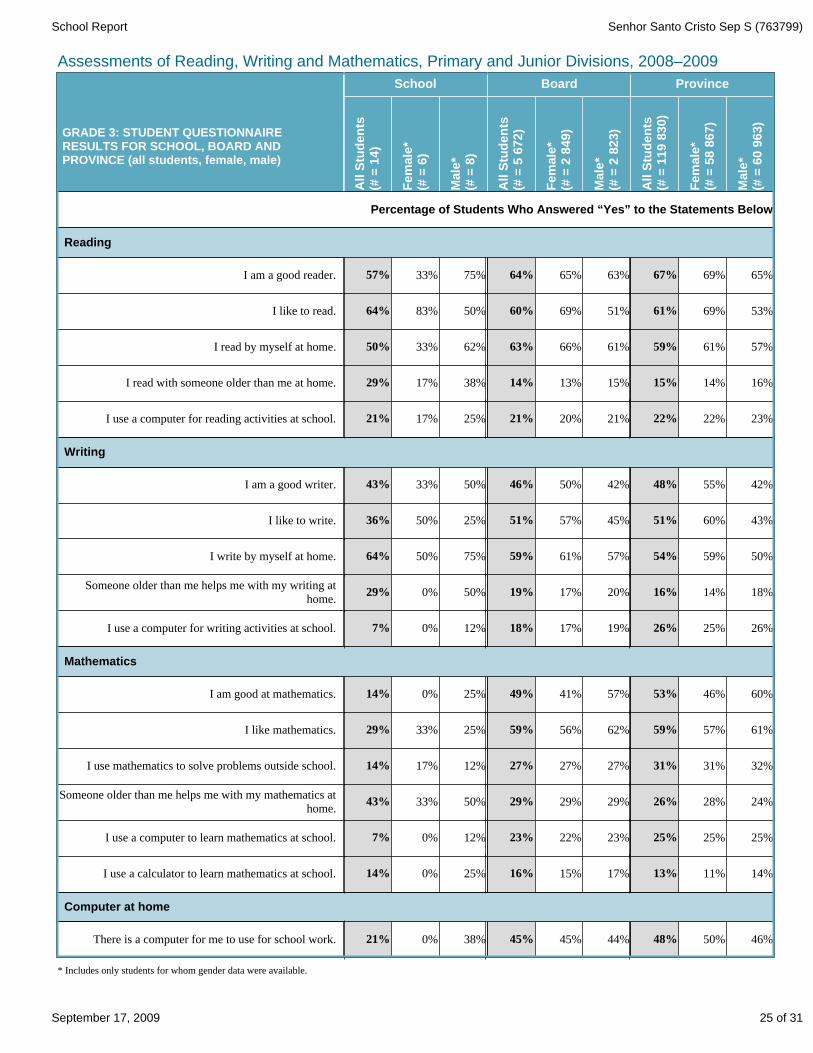
Percentage of Students Who Answered “Yes” to the Statements Below
46%50%48%44%45%45%38%0%21%
Computer at home
* Includes only students for whom gender data were available.
GRADE 3: STUDENT QUESTIONNAIRE RESULTS FOR SCHOOL, BOARD AND PROVINCE (all students, female, male)
14%11%13%17%15%16%25%0%14%
25% 25%25%23%22%23%12%0%7%
24%28%26%29%29%29%50%33%43%
32%31%31%27%27%27%12%17%14%
61%57%59%62%56%59%25%33%29%
60%46%53%57%41%49%25%0%14%
Mathematics
26%25%26%19%17%18%12%0%7%
18%14%16%20%17%19%50%0%29%
50%59%54%57%61%59%75%50%64%
43%60%51%45%57%51%25%50%36%
42%55%48%42%50%46%50%33%43%
Writing
23%22%22%21%20%21%25%17%21%
16%14%15%15%13%14%38%17%29%
57%61%59%61%66%63%62%33%50%
53%69%61%51%69%60%50%83%64%
65%69%67%63%65%64%75%33%57%
Reading
25 of 31September 17, 2009

Senhor Santo Cristo Sep S (763799)School Report
only or mostly English
another language (or other languages) as often as English
only or mostly another language (or other languages)
Assessments of Reading, Writing and Mathematics, Primary and Junior Divisions, 2008–2009
only or mostly another language (or other languages)
another language (or other languages) as often as English
only or mostly English
Ma
le*
(# =
8)
School
Fe
ma
le*
(# =
6)
All S
tud
en
ts(#
= 1
4)
Ma
le*
(# =
2 8
23
)
Board
Fe
ma
le*
(# =
2 8
49
)
All S
tud
en
ts(#
= 5
67
2)
Ma
le*
(# =
60
96
3)
Province
Fe
ma
le*
(# =
58
86
7)
All S
tud
en
ts(#
= 1
19
83
0)
GRADE 3: STUDENT QUESTIONNAIRE RESULTS FOR SCHOOL, BOARD AND PROVINCE (all students, female, male)
* Includes only students for whom gender data were available.** Percentages may not add to 100, due to a lack of or ambiguous responses.
13%14%14%19%22%20%0%67%29%
11%12%12%19%22%20%12%0%7%
75%74%74%62%56%59%88%33%64%
Language(s) that people speak to students at home:**
8%8%8%11%12%11%0%33%14%
11%13%12%18%20%19%12%17%14%
80%78%79%70%67%69%88%50%71%
Language(s) students speak at home:**
26 of 31September 17, 2009
Senhor Santo Cristo Sep S (763799)School Report
At home, there is a computer for me to use for school work.
Number ofStudents Who
Answered“Yes”
I use a computer for reading activities at school.
I like to read.
I am a good reader.
Assessments of Reading, Writing and Mathematics, Primary and Junior Divisions, 2008–2009
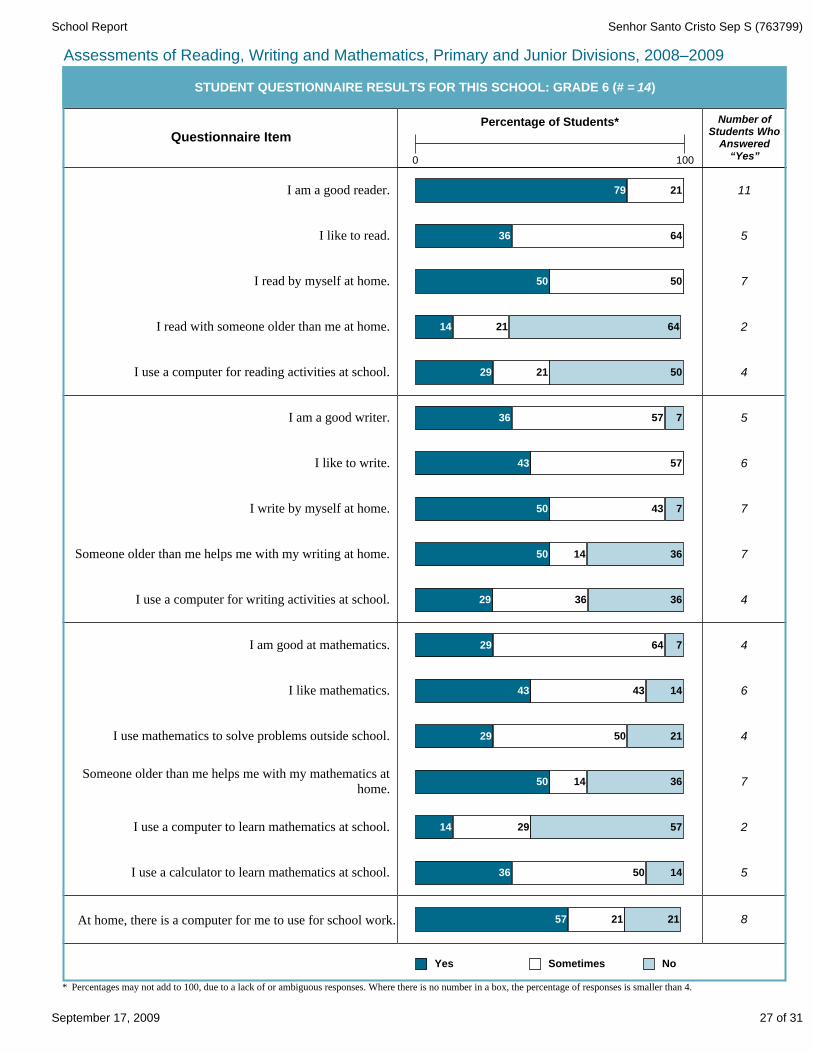
STUDENT QUESTIONNAIRE RESULTS FOR THIS SCHOOL: GRADE 6 (# = 14)
Questionnaire ItemPercentage of Students*
0 100
I read by myself at home.
I read with someone older than me at home.
11
5
7
2
4
I am a good writer.
I like to write.
I write by myself at home.
Someone older than me helps me with my writing at home.
I use a computer for writing activities at school.
5
6
7
7
4
I am good at mathematics.
I like mathematics.
I use mathematics to solve problems outside school.
Someone older than me helps me with my mathematics athome.
I use a computer to learn mathematics at school.
I use a calculator to learn mathematics at school.
4
6
4
7
2
5
8
Yes Sometimes No
* Percentages may not add to 100, due to a lack of or ambiguous responses. Where there is no number in a box, the percentage of responses is smaller than 4.
79 21
36 64
50 50
14 21 64
29 21 50
36 57 7
43 57
50 43 7
50 14 36
29 36 36
29 64 7
43 43 14
29 50 21
50 14 36
14 29 57
36 50 14
57 21 21
27 of 31September 17, 2009
Senhor Santo Cristo Sep S (763799)School Report
* Percentages may not add to 100, due to a lack of or ambiguous responses.
Number ofStudents
only or mostly English
another language (or other languages) as often as English
only or mostly another language (or other languages)
Assessments of Reading, Writing and Mathematics, Primary and Junior Divisions, 2008–2009
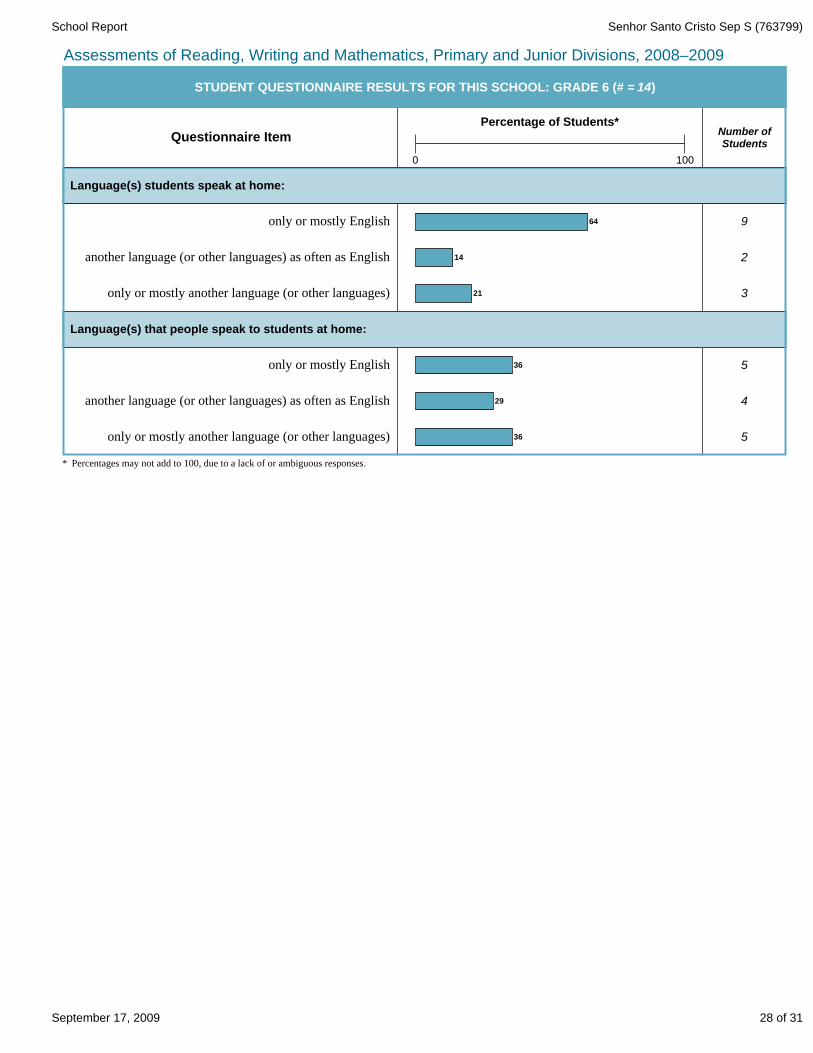
STUDENT QUESTIONNAIRE RESULTS FOR THIS SCHOOL: GRADE 6 (# = 14)
Questionnaire ItemPercentage of Students*
0 100
only or mostly English
another language (or other languages) as often as English
only or mostly another language (or other languages)
9
2
3
5
4
5
Language(s) students speak at home:
Language(s) that people speak to students at home:
64
14
21
36
29
36
28 of 31September 17, 2009

Senhor Santo Cristo Sep S (763799)School Report
Assessments of Reading, Writing and Mathematics, Primary and Junior Divisions, 2008–2009
There is a computer for me to use for school work.
I use a calculator to learn mathematics at school.
I use a computer to learn mathematics at school.
Someone older than me helps me with my mathematics athome.
I use mathematics to solve problems outside school.
I like mathematics.
I am good at mathematics.
I use a computer for writing activities at school.
Someone older than me helps me with my writing athome.
I write by myself at home.
I like to write.
I am a good writer.
I use a computer for reading activities at school.
I read with someone older than me at home.
I read by myself at home.
I like to read.
I am a good reader.
Ma
le*
(# =
N/R
)
School
Fe
ma
le*
(# =
N/R
)
All S
tud
en
ts(#
= 1
4)
Ma
le*
(# =
3 2
74
)
Board
Fe
ma
le*
(# =
3 2
02
)
All S
tud
en
ts(#
= 6
47
6)
Ma
le*
(# =
66
21
6)
Province
Fe
ma
le*
(# =
64
07
4)
All S
tud
en
ts(#
= 1
30
29
0)
Percentage of Students Who Answered “Yes” to the Statements Below
77%82%79%76%81%79%N/RN/R57%
Computer at home
* Includes only students for whom gender data were available.
GRADE 6: STUDENT QUESTIONNAIRE RESULTS FOR SCHOOL, BOARD AND PROVINCE (all students, female, male)
24%26%25%24%25%25%N/RN/R36%
13% 13%13%12%13%13%N/RN/R14%
19%25%22%18%23%20%N/RN/R50%
38%31%35%36%32%34%N/RN/R29%
51%38%45%55%39%47%N/RN/R43%
57%40%49%56%37%47%N/RN/R29%
Mathematics
31%29%30%29%26%27%N/RN/R29%
10%7%9%10%8%9%N/RN/R50%
43%57%50%52%63%58%N/RN/R50%
32%52%42%34%50%42%N/RN/R43%
36%48%42%37%44%41%N/RN/R36%
Writing
14%13%13%13%11%12%N/RN/R29%
4%3%4%4%3%3%N/RN/R14%
62%78%70%63%78%70%N/RN/R50%
42%64%53%36%60%48%N/RN/R36%
61%69%65%59%64%61%N/RN/R79%
Reading
29 of 31September 17, 2009

Senhor Santo Cristo Sep S (763799)School Report
only or mostly English
another language (or other languages) as often as English
only or mostly another language (or other languages)
Assessments of Reading, Writing and Mathematics, Primary and Junior Divisions, 2008–2009
only or mostly another language (or other languages)
another language (or other languages) as often as English
only or mostly English
Ma
le*
(# =
N/R
)
School
Fe
ma
le*
(# =
N/R
)
All S
tud
en
ts(#
= 1
4)
Ma
le*
(# =
3 2
74
)
Board
Fe
ma
le*
(# =
3 2
02
)
All S
tud
en
ts(#
= 6
47
6)
Ma
le*
(# =
66
21
6)
Province
Fe
ma
le*
(# =
64
07
4)
All S
tud
en
ts(#
= 1
30
29
0)
GRADE 6: STUDENT QUESTIONNAIRE RESULTS FOR SCHOOL, BOARD AND PROVINCE (all students, female, male)
* Includes only students for whom gender data were available.** Percentages may not add to 100, due to a lack of or ambiguous responses.
12%12%12%20%21%20%N/RN/R36%
12%13%12%21%24%22%N/RN/R29%
76%75%76%59%55%57%N/RN/R36%
Language(s) that people speak to students at home:**
7%6%6%10%10%10%N/RN/R21%
11%13%12%18%20%19%N/RN/R14%
82%81%81%72%70%71%N/RN/R64%
Language(s) students speak at home:**
30 of 31September 17, 2009
Senhor Santo Cristo Sep S (763799)School Report
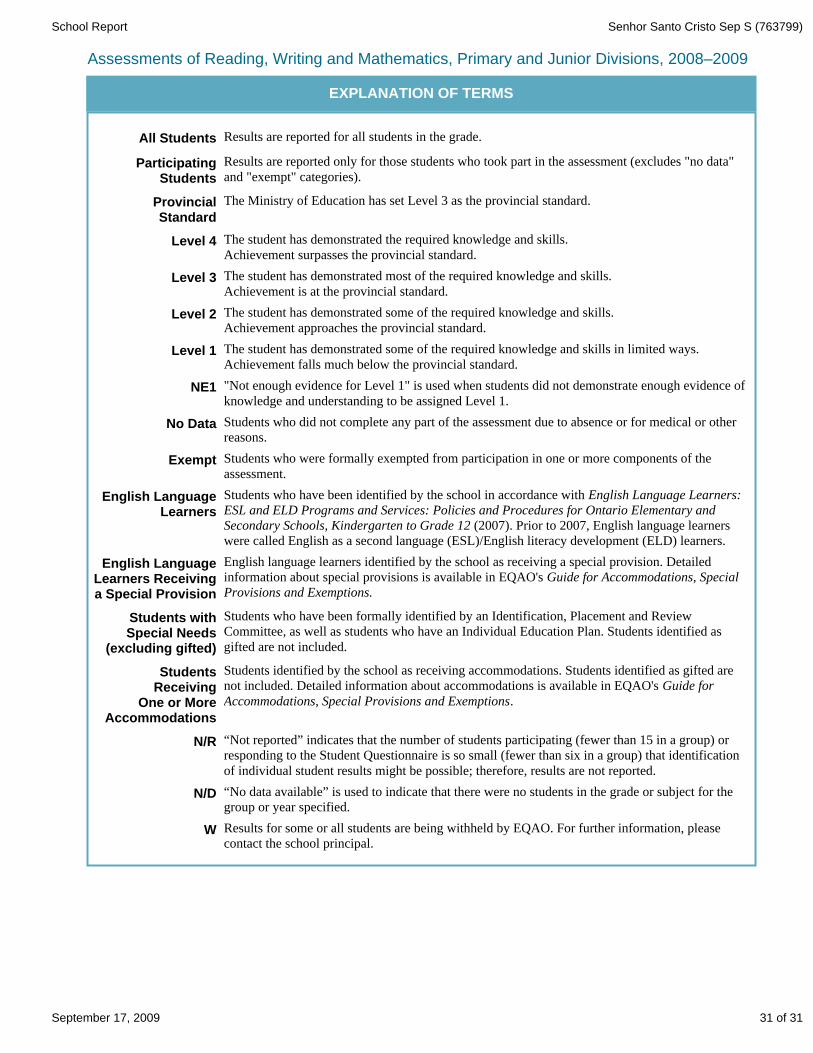
EXPLANATION OF TERMS
All Students Results are reported for all students in the grade.
Results are reported only for those students who took part in the assessment (excludes "no data" and "exempt" categories).
ParticipatingStudents
The Ministry of Education has set Level 3 as the provincial standard.ProvincialStandard
The student has demonstrated the required knowledge and skills.Achievement surpasses the provincial standard.
Level 4
The student has demonstrated some of the required knowledge and skills.Achievement approaches the provincial standard.
Level 2
The student has demonstrated some of the required knowledge and skills in limited ways.Achievement falls much below the provincial standard.
Level 1
Students who did not complete any part of the assessment due to absence or for medical or other reasons.
No Data
NE1 "Not enough evidence for Level 1" is used when students did not demonstrate enough evidence of knowledge and understanding to be assigned Level 1.
Students who were formally exempted from participation in one or more components of the assessment.
Exempt
Students who have been identified by the school in accordance with English Language Learners: ESL and ELD Programs and Services: Policies and Procedures for Ontario Elementary and Secondary Schools, Kindergarten to Grade 12 (2007). Prior to 2007, English language learners were called English as a second language (ESL)/English literacy development (ELD) learners.
English LanguageLearners
The student has demonstrated most of the required knowledge and skills.Achievement is at the provincial standard.
Level 3
English LanguageLearners Receivinga Special Provision
English language learners identified by the school as receiving a special provision. Detailed information about special provisions is available in EQAO's Guide for Accommodations, Special Provisions and Exemptions.
Students withSpecial Needs
(excluding gifted)
Students who have been formally identified by an Identification, Placement and Review Committee, as well as students who have an Individual Education Plan. Students identified as gifted are not included.
StudentsReceiving
One or MoreAccommodations
Students identified by the school as receiving accommodations. Students identified as gifted are not included. Detailed information about accommodations is available in EQAO's Guide for Accommodations, Special Provisions and Exemptions.
N/R “Not reported” indicates that the number of students participating (fewer than 15 in a group) or responding to the Student Questionnaire is so small (fewer than six in a group) that identification of individual student results might be possible; therefore, results are not reported.
N/D “No data available” is used to indicate that there were no students in the grade or subject for the group or year specified.
W Results for some or all students are being withheld by EQAO. For further information, please contact the school principal.
Assessments of Reading, Writing and Mathematics, Primary and Junior Divisions, 2008–2009
31 of 31September 17, 2009