Embed Size (px)
Citation preview

29
SCENT: Scalable Compressed Monitoring of EvolvingMultirelational Social NetworksYU-RU LIN, K. SELCUK CANDAN, and HARI SUNDARAM, Arizona State UniversityLEXING XIE, IBM T. J. Watson Research Center
We propose SCENT, an innovative, scalable spectral analysis framework for internet scale monitoring of multirelational socialmedia data, encoded in the form of tensor streams. In particular, a significant challenge is to detect key changes in the socialmedia data, which could reflect important events in the real world, sufficiently quickly. Social media data have three challengingcharacteristics. First, data sizes are enormous; recent technological advances allow hundreds of millions of users to create andshare content within online social networks. Second, social data are often multifaceted (i.e., have many dimensions of potentialinterest, from the textual content to user metadata). Finally, the data is dynamic; structural changes can occur at multiple timescales and be localized to a subset of users. Consequently, a framework for extracting useful information from social media dataneeds to scale with data volume, and also with the number and diversity of the facets of the data. In SCENT, we focus on thecomputational cost of structural change detection in tensor streams. We extend compressed sensing (CS) to tensor data. Weshow that, through the use of randomized tensor ensembles, SCENT is able to encode the observed tensor streams in the form ofcompact descriptors. We show that the descriptors allow very fast detection of significant spectral changes in the tensor stream,which also reduce data collection, storage, and processing costs. Experiments over synthetic and real data show that SCENT isfaster (17.7x–159x for change detection) and more accurate (above 0.9 F-score) than baseline methods.
Categories and Subject Descriptors: H.3.3 [Information Storage and Retrieval]: Information Search and Retrieval—Information filtering; H.5.1 [Information Interfaces and Representation]: Multimedia Information Systems—Evaluation/methodology
General Terms: Experimentation, Measurement, Algorithms, Human FactorsAdditional Key Words and Phrases: Social media, social network analysis, stream mining, multirelational learning, tensoranalysis
ACM Reference Format:Lin, Y.-R., Candan, K. S., Sundaram, H., and Xie, L. 2011. SCENT: Scalable compressed monitoring of evolving multirelationalsocial networks. ACM Trans. Multimedia Comput. Commun. Appl. 7S, 1, Article 29 (October 2011), 22 pages.DOI = 10.1145/2037676.2037686 http://doi.acm.org/10.1145/2037676.2037686
1. INTRODUCTION
Large volumes of social media data are being generated through highly popular social media plat-forms, such as Facebook, Twitter, Digg, and Flickr. For example, as of 2010, Facebook has 500 million
Authors’ addresses: Y.-R. Lin, K. S. Candan, and H. Sundaram, Arizona State University, Tempe, AZ 85281; email: [email protected]; L. Xie, T. J. Watson Research Center, Hawthorne, NY 10532.Permission to make digital or hard copies of part or all of this work for personal or classroom use is granted without fee providedthat copies are not made or distributed for profit or commercial advantage and that copies show this notice on the first pageor initial screen of a display along with the full citation. Copyrights for components of this work owned by others than ACMmust be honored. Abstracting with credit is permitted. To copy otherwise, to republish, to post on servers, to redistribute tolists, or to use any component of this work in other works requires prior specific permission and/or a fee. Permissions may berequested from Publications Dept., ACM, Inc., 2 Penn Plaza, Suite 701, New York, NY 10121-0701 USA, fax +1 (212) 869-0481,or [email protected]© 2011 ACM 1551-6857/2011/10-ART29 $10.00
DOI 10.1145/2037676.2037686 http://doi.acm.org/10.1145/2037676.2037686
ACM Transactions on Multimedia Computing, Communications and Applications, Vol. 7S, No. 1, Article 29, Publication date: October 2011.

29:2 • Y.-R. Lin et al.
users,1 and Twitter currently has a rate of 36,000 tweets per minute.2 The nature of the data availablein these platforms present many opportunities: data about individuals and the social structures towhich they belong, are invaluable resources for understanding many multifaceted and complex socialphenomena, from entertainment to politics to religion, that permeate every aspect of our daily lives.As many commercial/social/political institutions and movements rush to leverage the Web to improvetheir reach, online communication takes an increasingly significant role alongside (and in some casessurpassing) more traditional venues. In fact, today social media provide a key context for the rapidemergence and dissemination of cultural memes. Therefore, a critical understanding of the develop-ment and evolution of online social structures is increasingly important for educators, policy makers,as well as advertisement agencies and, thus, there is an increasing demand for analysis frameworksthat can support applications, such as community discovery, that depend on information latent in thesocial data [Chi et al. 2006; Kolda and Sun 2008; Lin et al. 2008; Lin et al. 2009; Sun et al. 2006].
We note essential computational elements in recognizing nuanced patterns of bridging and linkingamong individuals and communities that occur through social media at different structural levels ofinteraction.
—In social networks, user interactions and community interests are constantly evolving, often trackingreal-world events. Social media data is also multifaceted: typically involving multiple types of rela-tionships (e.g., friendship, cocommenting on a news story). Entities in social networks may also havedifferent attributes, e.g., location, age, profession. The multidimensional and multirelational natureof these interactions increases the complexity that the computational algorithms need to handle.
—The datasets relevant to the analysis are enormous in size and diverse in form and content, and aregrowing and evolving rapidly. The volume of the data and the speed with which the data changespose significant challenges. Furthermore, a framework for extracting useful information from socialmedia data needs to scale also against the number and diversity of the facets of the data.
Consequently, scalable frameworks, which are able to analyze voluminous social media data, are im-portant to any significant technical advances in social media understanding. In this article, we proposeSCENT, an innovative, spectral analysis framework for Internet scale monitoring of multi-relationalsocial media data, encoded in the form of tensor streams.
1.1 SCENT: Scalable Compressed Domain Analysis of EvolviNg Tensors
A scalable framework for managing voluminous user data in a form amenable for large scale dataanalysis is a key step to any significant technical advances in social media understanding. The com-putational ceiling arising due to finite resources requires us to pursue innovative strategies to addressthe data scalability challenges. To facilitate very large scale data management and analysis, in thispaper, we propose SCENT, Scalable Compressed Domain Analysis of EvolviNg Tensors frameworkfor monitoring the evolution of multifaceted (also called multirelational) social network data resultingfrom users’ continuous online interactions.
The key characteristics of social media data sets of urgent interest include the following: (a) volumi-nous, (b) multirelational, (c) evolving, and (d) spectrally regular. As it is common in social media anal-ysis, in SCENT, we model the social data in the form of tensor (multidimensional array) streams [Chiet al. 2006; Sun et al. 2006] and consider the problem of tracking the changes in the spectral prop-erties of the tensor over time. Prior work, including Sun et al. [2006], also considered this problem
1http://www.facebook.com/press/info.php?statistics.2http://blog.twitter.com/2010/02/measuring-tweets.html.
ACM Transactions on Multimedia Computing, Communications and Applications, Vol. 7S, No. 1, Article 29, Publication date: October 2011.

SCENT: Scalable Compressed Monitoring of Evolving Multirelational Social Networks • 29:3
formulation and attempted to tackle the underlying computational complexity issues through incre-mental tensor decomposition techniques.
The problem with these existing approaches, however, is that (while being faster than regular tensordecomposition) even incremental tensor decomposition has exponential complexity [Sun et al. 2006].To reduce the computational cost of detecting significant changes in the tensor streams, SCENT in-troduces an innovative compressed sensing mechanism that is able to encode the social data tensorstreams in the form of compact descriptors. Compressive sensing (CS) is an emerging area of researchin information theory [Candes and Romberg 2007; Candes and Tao 2006; Candes and Wakin 2008],which shows that under certain conditions a signal can be faithfully reconstructed using fewer numberof samples than predicted by the well-known Nyquist sampling theorem. We show that the descriptorsallow very fast detection of significant spectral changes in the tensor stream, which also reduce datacollection, storage, and processing costs.
While there has been work in other domains, such as audio, on change analysis and onset detection,there are key domain-specific differences between the techniques applicable in different domains. Themajor differences between traditional multimedia and social media data, especially within the contextof change detection, include: (a) at each time instance, the relevant data forms a (multirelational)graph, as opposed to a vector or matrix of intensity values; (b) the graph is very large. Therefore,change detection in social media data requires techniques that can efficiently detect structural changesin very large graphs.
In this paper, we focus on the problem of change detection, a key step in understanding the devel-opment and evolution patterns in multirelational social media data. Our contributions include thefollowing.
(1) Compressive sensing for tensors. The first contribution of this paper is to extend the recently devel-oped CS theory to tensor stream analysis. CS theory has been primarily used in the analysis of 1Dand 2D continuous time signals. Furthermore, we note that (as we discuss in Section 3) the basiccompressed sensing theory assumes the availabilities of (a) a sparse data basis and (b) a constanttime random sensing mechanism, neither of which generally holds in social media tensors.
(2) Compressed tensor encoding. We show how to create and use random sensing ensembles to trans-form a given tensor into a compressed representation that implicitly captures the spectral charac-teristics of the tensor (i.e., the so called core tensor coefficients [Tucker 1966]). The length of thiscompressed representation is only O(S · logN/S), where N is the size of data tensor and S is asmall approximation rank.
(3) Efficient change detection. We also show that if the goal is to only identify the points of significantchange (as opposed to discovering the values of the spectral coefficients at each time instance),the random sensing ensembles can be created more cheaply. Moreover, changes can be detected bycomparing tensors in their compressed representations with logarithmic space cost.
(4) Tensor coefficient recovery. We propose three recovery strategies to incrementally obtain core ten-sor coefficients either from the input data tensor or from the compressed representation. Thesestrategies can be used in different situations based on the availability of data and resources.
(5) Systematic evaluation. We systematically study the efficiency and effectiveness of our proposedframework on both synthetic and real data sets. On synthetic datasets, we study the SCENT per-formance over different data sizes, dimensionalities, and evolution scenarios. This provides a gen-eral recommendation for applications with different computational resources available. On realdata sets, we demonstrate the efficiency of SCENT on monitoring time-varying multirelationalsocial networks. The experimental results show that our SCENT monitoring procedure is able tomaintain an approximated tensor stream with high accuracy (above 0.9 in terms of F1-score), lowACM Transactions on Multimedia Computing, Communications and Applications, Vol. 7S, No. 1, Article 29, Publication date: October 2011.

29:4 • Y.-R. Lin et al.
topic
user
keyword
χt
keywordfactor user
factor
coretensor topic
factor
Fig. 1. Social network representation via a 3-mode data tensor Xt at time t, which can be summarized by a core tensor andfactors for each mode (Tucker decomposition).
Table I. Description of NotationsSymbol Descriptionx a vector (boldface lower-case letter)X a matrix (boldface capital letter)X a tensor (boldface script letter)I1, . . . , IM the dimensionality of mode 1, . . ., MUi |Ni=1,Xi |Ni=1 a sequence of N matrices or tensors‖X‖ the norm of a tensor X‖x‖1, ‖x‖2 the l1-norm or l2-norm of a vector x�, � basis matrices
errors (under 1.1 relative to baseline tensor decomposition in real-world datasets) and low timecost (17X–159X faster for change detection).
1.2 Organization
The rest of this article is organized as follows. Section 2 introduces tensor analysis and the problem ofspectral tracking. Section 3 presents the proposed framework, compressed sensing of tensors. Section 4reports experiments. Section 5 reviews the related work, and Section 6 presents our conclusion andfuture work.
2. SPECTRAL TRACKING FOR THE EVOLUTION OF SOCIAL NETWORKS
We model the social data in the form of tensor (multidimensional array) streams. This section provideskey notations and minimal background on tensor representation (Section 2.1) and anlysis (Section 2.2).These will allow us to formally state the problem of tracking significant changes occurring in thesocial media data stream (Section 2.3). For a more comprehensive review on tensors, we refer readersto Kolda and Bader [2009].
2.1 Tensor Representation of Social Data
A tensor is a mathematical representation of a multiway array. The order of a tensor is the numberof modes (or ways). A first-order tensor is a vector, a second-order tensor is a matrix, and a higher-order tensor has three or more modes. We use x to denote a vector, X denote a matrix, and X a tensor.Figure 1 provides an example order-3 tensor representing the three-way relations of users, topics, andkeywords. Each entry (i, j, k), for example, could represent the number of times the user i submittedan entry on topic j with keyword k. Table I presents the key notations used in this work. Please seeAppendix A for more details on tensors.ACM Transactions on Multimedia Computing, Communications and Applications, Vol. 7S, No. 1, Article 29, Publication date: October 2011.

SCENT: Scalable Compressed Monitoring of Evolving Multirelational Social Networks • 29:5
...
timedata tensor stream
spectral tracking
.. …..
access cost
process cost
Fig. 2. Problem overview: Our goal is to develop a fast spectral tracking mechanism that reduces the processing cost.
2.2 Tensor Analysis
Matrix data is often analyzed for its latent semantics using a matrix decomposition operation knownas the singular value decomposition (SVD). The analogous analysis operation on a tensor is knownas tensor decomposition [Kolda and Bader 2009]. CP/PARAFAC [Carroll and Chang 1970; Harshman1970] and Tucker decomposition [Tucker 1966] are the two most popular tensor decomposition variants(see Kolda and Bader [2009] for a detailed review). In this paper, we use the Tucker decomposition toobtain the spectral coefficients (and the basis matrices) of a given tensor.
Definition 2.1 (Tucker decomposition). A Tucker decomposition of X ∈ RI1×···×IM yields a core tensor
Z of specified size R1 × · · · × RM and factor matrices Um|Mm=1 ∈ R
Im×Rm such that
X ≈ ZM∏
m=1
×mUTm, (1)
that is, the reconstruction error e = ‖X − Z∏M
m=1 ×mUTm‖ is minimized. The right-hand side denotes a
tensor multiplies a sequence of matrices: Z ×1 U1 · · · ×M UM where the symbol ×d denotes the mode-dproduct (see Definition A.3). The Tucker decomposition approximates a tensor as a smaller core tensortimes the product of matrices spanned by the first few left singular vectors in each mode. Typically, thefactor matrices Um|M
m=1 in Tucker decomposition are assumed to be orthogonal (the assumption doesnot hold for CP decomposition).
Figure 1 also depicts the Tucker decomposition of the order-3 tensor representing the three-wayrelations of users, topics, and keywords. In this case, each factor matrix describes one distinct facet ofthe data: that is, users, topics, and keywords clusters; the core tensor on the other hand indicates thestrength (e.g., amount of correlation) of the relationships among the three facets.
2.3 Spectral Tracking
Figure 2 illustrates a social data stream in tensor form. In this example, the data stream is representedas a sequence of tensors, each representing a snapshot of the social network. Spectral tracking ofthis stream involves identifying when significant changes occur in the data stream and updating theanalysis appropriately. Therefore, the problem of spectral tracking can be formalized as follows.
ACM Transactions on Multimedia Computing, Communications and Applications, Vol. 7S, No. 1, Article 29, Publication date: October 2011.

29:6 • Y.-R. Lin et al.
“Given a sequence of tensors Xt|Tt=1 ∈ RI1×...×IM , compute the core tensor and factor matrices, Zt and
Um;t|Mm=1 such that the mean reconstruction error
eT = 1T
T∑t=1
‖Xt − Xt‖, (2)
where Xt ≈ Zt∏M
m=1 ×mUTm;t, is minimized.”
The tracking process involves (1) fetching the data tensors for each time (access cost) and (2) deter-mining whether there is a significant structural change at the time (process cost). Given the recon-structed tensor stream Xt|Tt=1, significant changes in the core tensor are often seen as indicators of thestructural (i.e., correlational) changes in the data [Kolda and Sun 2008; Sun et al. 2006]. However,obtaining the core tensor through the decomposition process is expensive. While it is possible to in-crementally maintain the decomposition, the time complexity of the incremental maintenance itself isO(
∑Mi=1 Ri I2
i ) + O(∑M
i=1 Ii∏M
j=1 Ij), that is, exponential in the number of modes, or data facets, M. HereRi denotes the specified rank of the i-th factor matrix, whereas Ii denotes the dimensionality of thedata tensor along the i-th mode.
Therefore, a key step in efficient spectral tracking is to minimize the computational cost required inthis process.
3. COMPRESSIVE SENSING OF TENSORS
In this article, we argue that
significant spectral changes can be detected and structural properties can be tracked with-out having to rely on incremental decomposition maintenance.
We present an efficient spectral tracking framework in this section. After introducing the basic com-pressed sensing theory (Section 3.1), we present how to extend the theory to tensor analysis (Section 3.2),to develop algorithms for change detection and tensor recovery (Section 3.3 and 3.4).
3.1 Compressive Sensing
Recent developments in information theory have shown that under certain conditions, sparse signals(i.e., signals with few spectral coefficients) can be recovered from a very small number of samplesor measurements [Candes and Wakin 2008]. Let v ∈ R
n be an n-dimensional vector (i.e., a signal).Mathematically, sampling (or sensing) of this vector can be described in the form of a matrix product,y = �v, with a k × n sensing matrix �. The k-dimensional vector y denotes the k samples one obtainsfrom the data vector v; v is called s-sparse if it has s nonzero entries. CS asserts that an s-sparse signalv can be recovered from y if the sensing matrix, �, satisfies the restricted isometry property (RIP); thatis, � should be such that
(1 − δs)‖u‖22 ≤ ‖�u‖2
2 ≤ (1 + δs)‖u‖22 (3)
holds simultaneously for all s-sparse vectors u and a sufficiently small value δs (here ‖u‖2 =√∑
i u2i
is the l2-norm of vector u). Intuitively, RIP means that all subsets of s columns from � are nearlyorthogonal (but the columns of � cannot be exactly orthogonal since there are more columns thanrows). This result is especially useful because of the following two observations.
—Existence of a convenient sensing matrix. It has been shown that k × n random matrices whose rowsare chosen randomly from a suitable distribution satisfying RIP with overwhelming probability,provided that k ≥ C · s · log(n/s), where C is some small positive constant[Candes and Tao 2006;Candes and Wakin 2008]. This implies that it is easy to construct a sensing matrix with smallnumber of samples.
ACM Transactions on Multimedia Computing, Communications and Applications, Vol. 7S, No. 1, Article 29, Publication date: October 2011.
SCENT: Scalable Compressed Monitoring of Evolving Multirelational Social Networks • 29:7
—Sufficiency of sparsity in an alternative transform space. The result also holds for a suitably trans-formed version of v that is s-sparse. Let � be a transformation matrix such that the coefficient vectorw = �−1v is s-sparse; then, the sampling process can be formulated as y = �v = ��w. The CStheory states that, if � is a random matrix satisfying RIP, then in most cases the product A = ��
will also satisfy RIP [Baraniuk et al. 2008]. This implies that most real-world signals (whose coef-ficients tend to be sparse in some spectral domain) can be efficiently sampled using CS. Note thatin CS literature, � often refers to an orthornormal basis (such as a wavelet basis); however, otherproper bases can be chosen as long RIP is satisfied, as we shall discuss later.
Furthermore, it has been shown that if we are given a k-dimensional sampling vector y = �v (orequivalently y = ��w = Aw), the coefficient vector w can be recovered exactly, with high probability,by solving the minimization problem:
minx‖w‖1 subject to y = Aw,
where ‖v‖1 = ∑i |vi| is the l1-norm of v. Here the role of l1 minimization is to search the sparsest w
that satisfies the constraint y = Aw, and w = w with high probability.
3.2 Sparse Random Sensing Tensors
Suppose � is a random sensing matrix satisfying RIP (Equation (3)); standard CS involves computingthe inner product of data vector with rows of �. We extend this to tensors as follows: Given a tensorX ∈ R
I1×...×IM , we
(1) construct K random tensors Rk|Kk=1 of the same size as X , and
(2) obtain a sensing vector y with each element yk = 〈X ,Rk〉.As discussed in Section 3.2, to efficiently encode data X into a compressed representation y, we need
to establish (a) a sparse data basis for X and (b) a constant time random sensing mechanism.The described procedure has an equivalent counterpart in matrix form; we construct a K×N random
sensing matrix �, where N = ∏Mm=1 Im. � comprises vec(Rk) in each row, and then obtain y = �x, where
x = vec(X ). Here, “vec(·)” is the vectorization operation which unfolds the tensor into a vector.In practice, sensing matrices that satisfy the RIP property are quite easy to generate [Candes and
Tao 2006]. In our work, we consider a sparse ensemble suggested by Baraniuk et al. [2008], whichestablished that RIP holds with high probability when the K × N matrix � is drawn according to (aslong as K ≥ C · s · log(N/s) for all s-sparse vectors, where C is some positive constant):
�kj =√
3n
⎧⎨⎩
+1 with probability 1/60 . . . 2/3.
−1 . . . 1/6(4)
The advantage of such ensemble is that the sensing matrix � (i.e. the set of random tensors Rk’s) willonly have about 1/3 nonzero entries.
To construct sparse transformation of data, let us consider a tensor decomposition of tensor X ; thatis, X ≈ Z
∏Mm=1 ×mUT
m for Z ∈ RR1×...×RM and Um|M
m=1 ∈ RIm×Rm. While Z itself will be dense, the number
of coefficient in Z is much smaller than the size of X ; that is, Z can be seen as the set of sparsecoefficients of X . Note that, the vector y can be written as
y = ��z, (5)
where z = vec(Z) and � is a matrix representation of∏M
m=1 ×mUm. Thus, we can see y as a sensingvector (measurements) for not only the data tensor X , but also for the core tensor Z with respect to
ACM Transactions on Multimedia Computing, Communications and Applications, Vol. 7S, No. 1, Article 29, Publication date: October 2011.

29:8 • Y.-R. Lin et al.
Table II. SCENT CS-Based Change DetectionInput:
New data tensor XtPast sensing vector yt−i
The set of random tensors Rk|Kk=1Output:
Spectral change at time t relative to time t − iChange-Detection:1. Sense yt from yk;t = 〈Xt,Rk〉2. Compute δ = ‖yt − yt−i‖/‖yt−i‖. If δ > τy, output change
the transformed matrix (basis) � comprising of a particular set of factor matrices Um|Mm=1. With the
following lemma, it is easy to show that RIP (Equation (3)) holds for �� and the core tensor Z can berecovered through compressive sensing.
LEMMA 3.1. If the factor matrices Um|Mm=1 are orthogonal, the matrix � constructed based on Equa-
tion (5) is also orthogonal.
See Appendix B for the proof of Lemma 3.1.
Accordingly, with the sparse transformed representation Z of data X , the length of the compressedsensing vector y is only O(S · logN/S), where N is the size of data tensor and S is a small approxima-tion rank (the size of core tensor). Also see Appendix B for more detailed discussion.
3.3 CS-Based Change Detection
Significant changes in the data are reflected in significant changes in the core tensor coefficients [Koldaand Sun 2008; Sun et al. 2006]; thus significant changes in the tensor stream can be said to occurbetween time instances t and t − i (for some i ≥ 1) if ‖�Z‖ = ‖Zt − Zt−i‖ = ‖zt − zt−i‖ > τz, forsome positive value τz. Because z = (��)−1y, we can write �z = (��)−1�y = (��)−1(yt − yt−i). Thismeans that, assuming that P−1 = (��)−1 exists, we can detect changes in the core tensor simplyby using the sensing vectors yt and yt−i. While, in general, P−1 may not exist, the Moore-Penrosepseudo-inverse P+ = (PT P)−1PT is guaranteed to exist3 and is unique.4 Thus, we approximate �zas �z∗ = P+(yt − yt−i). The transformed matrix � can be chosen from the tensor decomposition ofan arbitrary data tensor Xt′ so that for any zt and zt−i, � does not change and hence P remainsconstant. Consequently, we have ‖�z∗‖ ∝ ‖�y‖ and the relative change in y can be computed byδ = ‖yt−yt−i‖/‖yt−i‖. This enables us to develop a compressive sensing based spectral change detectionalgorithm, as listed in Table II.
Cost. Let L be the number of nonzero entries in data tensors5 Xt and Xt−i. The computational costfor detecting a spectral change in a given time instance only involves the random sensing process; thatis, K inner products on the nonzero entries in both data and random tensors, which is only O(KL).Note that the set of random tensors used for sensing only need to be constructed once; the same set ofsensing tensors can be reused for each time instance.
3For arbitrary matrices, the existence of the Moore-Penrose pseudo-inverse may be established from the singular value decom-position (SVD) [Golub and Van Loan 1996].4If a matrix A is invertible, its inverse and pseudoinverse are the same; moreover the pseudoinverse of a pseudoinverse is theoriginal matrix.5Tensors that encode social media are known to be relatively sparse [Kolda and Sun 2008].
ACM Transactions on Multimedia Computing, Communications and Applications, Vol. 7S, No. 1, Article 29, Publication date: October 2011.

SCENT: Scalable Compressed Monitoring of Evolving Multirelational Social Networks • 29:9
3.4 Core Tensor Recovery
In this section, we present three complementary core tensor recovery strategies. We focus on the coretensor coefficients as the factor matrices can be obtained from the latest performed tensor decomposi-tion and can be folded together with a core tensor to approximate the original data. For the samplingvector y = ��z, where � is the sensing matrix and � is a matrix representation of the factor matrixesof the data tensor, the core tensor Z (or z) can be recovered by: (a) tensor decomposition based recovery,(b) factor-driven recovery , and (c) CS-recovery. By leveraging with change detection procedure, thesestrategies can be used in different situations based on the availability of data and resources.
Tensor decomposition based recovery. As we mentioned earlier, the conventional mechanism to re-cover the core tensor is to either carry out full tensor decomposition or maintain the decompositionincrementally. SCENT can reduce the cost by relying to them only when significant changes are de-tected in the tensor stream as described in Section 3.3.
Factor-driven recovery. In factor matrix driven recovery, the core tensor is recovered using the datatensor and the factor matrices. The transformation z = �T x which would give the core tensor coeffi-cients from the data values and the matrix representation � of
∏Mm=1 ×mUm is equivalent to the tensor
operation Z = X∏M
m=1 ×mUm. The computational cost of this process is O(N) where N = ∏Mm=1 Im, but
it relies on the availability of the full data tensor as well as the factor matrices. Note that unless asignificant change has been detected (in which case tensor will be decomposed), the set of factor ma-trices can be picked from the most recent decomposition of an earlier data tensor; that is, � remainsunchanged, and tensor decomposition is needed only when significant spectral changes are detectedthrough compressive sensing.
CS-recovery. Let P = �� be a K × S matrix6. It has been shown that the core tensor coefficient z canbe recovered from constrained l1-minimization [Candes and Romberg 2007]:
minz‖z‖1 subject to y = Pz. (6)
When the data tensor is large, we have K ≥ S and this means that we no longer have an undersampledsituation given a fixed basis �; thus, z can be recovered unambiguously by l2-minimization:
min‖y − Pz‖2 (7)
and the solution z∗ is obtained from z∗ = P+y, where as mentioned earlier, P+ = (PT P)−1PT is theMoore-Penrose pseudo-inverse. Note that, the computational cost of CS-recovery is dominated by com-puting P which is O(KSN) where K × S is the size of P, N is the data size defined above. Whilecomputing P is relatively expensive, this can be done offline (i.e., when a significant change is detectedand the factor matrices are being updated), and the online phase involves computing core tensor coef-ficient given P.
We summarize these strategies in Table III (also see Appendix C for more details about the threestrategies). The overall encoding (sensing) and decoding (recovery) process is illustrated in Figure 3.
4. EXPERIMENTS
We evaluated SCENT on both synthetic data and real-world data sets with the goal of studying theperformance in terms of (a) change detection accuracy, (b) recovery error, and (c) cost running time.We consider these under different (synthetic and real) data sets and parameter settings. In the fol-lowing we first describe the datasets, the baseline methods and the performance metrics used in theevaluations. We then report and discuss the results.
6Here we use a different variable P and z instead of A and w due to the special construction of P based on tensor decomposition.See Appendix B for more detailed explanation.
ACM Transactions on Multimedia Computing, Communications and Applications, Vol. 7S, No. 1, Article 29, Publication date: October 2011.

29:10 • Y.-R. Lin et al.
Table III. Core Tensor RecoveryEncoding: Given data tensor X ∈ R
I1×...×IM
1. Construct the random tensors Rk|Kk=1 of the same size as X2. Sense y from yk = 〈X ,Rk〉Decoding: Given sensing vector y, random tensors Rk|Kk=1, factor matrices Um|Mm=1(a) Tensor decomposition (given the data tensor X )
Construct the core tensor by decomposing X(b) Factor-driven recovery (given the data tensor X )
Construct the core tensor from Z = X∏M
m=1 ×mUm(c) CS-recovery (given the sensing vector y)
1. Construct the matrix P = ��
2. Compute core tensor coefficient z = vec(Z) from z = P+y
...time
data tensor stream
.. …..
…..
1RR
2R
KRR…..
χ1
χ2
y1 y2
χt
yt
Encoding(random sensing)
change detectiontensordecompositon
...∼χ1
∼χ2
∼χt
Decoding(tensor recovery)
Fig. 3. Our SCENT framework reduces the process cost by triggering tensor decomposition based on change detection.
4.1 Datasets
Digg dataset. From the Digg dataset described in Lin et al. [2009], we extracted a sequence of thirdorder tensors to represent the user-topic-keyword relation. Each tensor represents the data of one day(from August 1 to August 27, 2008). Each (i, j, k)-entry in the tensor represents that a user i submitsa story of topic j with a keyword k. In this dataset, the average number of stories submitted per dayis 4076. Consequently, the data density per tensor, i.e. fraction of non-zero entries of a tensor, is about3 × 10−6.
DBLP dataset. From the DBLP data, we generate a sequence of conference-author-keyword tensors.Each (i, j, k)-entry in a tensor represents that an author j published a paper with keyword k in con-ference i. Each tensor represents papers published in a year (from 1995 to 2008). In this dataset, theaverage number of papers per year is 3180, corresponding to the mean number of nonzero entries of atensor. The data density per tensor is about 10−6.ACM Transactions on Multimedia Computing, Communications and Applications, Vol. 7S, No. 1, Article 29, Publication date: October 2011.

SCENT: Scalable Compressed Monitoring of Evolving Multirelational Social Networks • 29:11
Table IV. Real-World DatasetsDataset Digg DBLP
dimensions2575 users × 51 topics 78 conferences × 6226 authors
× 8596 keywords × 6251 keywordsdensity 3 × 10⁻⁶ 1 × 10⁻⁶
timestamps 27 (days) 14 (years)
The properties of tensors in both real datasets are listed in Table IV. As can be seen, the data tensorsin both datasets are relatively sparse.
Synthetic datasets. We design a simulation to generate synthetic tensor streams as input data. Thesimulation, with ground truth available, helps get a more comprehensive picture about the perfor-mance of SCENT in handling diverse structure change scenarios. We generated a set of tensor streams(i.e., sequences of tensors) with characteristics that have been observed in prior research, such aspower-low distribution [Barabasi et al. 2002] and densification over time [Leskovec et al. 2005]. Thesimulation is controlled by a set of parameters (see Table VII in Appendix D for the list of parameters).Specifically, we created tensors of different sizes (from 103 to 106), data densities (from 10−4 to 10−1),and number of modes (from 3 to 6), with fixed Poisson parameter λ = 10 (average timesteps betweentwo changes) and tensor stream length T = 200. We used a relatively large drift rate (∼5%; datadeviation between two change events) and a high change frequency (λ = 10) to test SCENT in stressconditions. The details of the synthetic data generation are provided in Appendix D.
4.2 Change Detection Methods
We compare the following monitoring procedures, each of which estimates change, �, and reports if �
exceeds a threshold τ .
(1) Naıve-monitor – detects the change based on the difference in consecutive data tensors, that is,� = ‖Xt − Xt−1‖/‖Xt−1‖.
(2) Basic-monitor – detects change based on the difference in reconstructed data tensors across time,that is, � = ‖Xt − Xt−1‖/‖Xt−1‖ where is the approximated tensor of X obtained from standardTucker tensor decomposition.
(3) DTA-monitor – Similar to the basic-monitor except the approximated tensors are obtained by anincremental tensor analysis called DTA [Sun et al. 2006]. At each time t, DTA utilizes the de-composition results of Xt−1 to compute Xt. The forgetting factor in DTA is set to be 0.1 for all theexperiments as suggested by the authors7.
(4) SCENT-monitor – as described in Section 3.3, SCENT detects change based on the difference inthe random sensing of data tensors, that is, � = ‖yt − yt−1‖/‖yt−1‖, where y is the random sensingof tensor X . The length of sensing measurements K is controlled by the sampling constant C andcore tensor size. We fixed the approximation rank to be 5 in each mode, for all methods describedbelow.
4.3 Recovery Methods
While DTA-monitor relies on conventional tensor decomposition, the SCENT-monitor uses the follow-ing CS-based recovery strategies to maintain the approximated tensor streams:
—SCENT-c (piecewise-constant recovery) performs full tensor decomposition whenever a change isdetected using CS-based approach and holds the decomposition results until the next change point.
7When the forgetting factor is set to be 0, DTA outputs results as from standard Tucker tensor decomposition. We have usedDTA with forgetting factor 0 to implement Basic-monitor.
ACM Transactions on Multimedia Computing, Communications and Applications, Vol. 7S, No. 1, Article 29, Publication date: October 2011.

29:12 • Y.-R. Lin et al.
—SCENT-f (factor-driven recovery) performs full tensor decomposition whenever a change is detected,and uses the decomposition factor matrices to perform factor-driven recovery until next change point.
—SCENT-p (CS-recovery through P matrix) performs full tensor decomposition whenever a changeis detected, and uses the decomposition factor matrices to update the P matrix and to perform theCS-recovery.8
4.4 Performance Metrics
We use three metrics to evaluate the efficiency of SCENT:
—Detection accuracy (F1): We evaluate change detection accuracy using the F1-score based on preci-
sion and recall: F1 = 2 · precision·recallprecition+recall .
—Error ratio: We assess the coefficient recovery performance by comparing the mean reconstructionerror (Equation (2)) against the mean reconstruction error of the Basic-monitor scheme.
—Running time (CPU time in seconds).
The experiments are repeated 10 times under each of the different settings and the average perfor-mance results are reported.
4.5 Experiments with Digg and DBLP Data
Figure 4 shows the efficiency of SCENT-monitors on Digg and DBLP datasets, compared with baselinemethods Basic- and DTA- monitor. We use C = 1/4 for SCENT-monitors. Since in these datasets,the ground truth about the abrupt changes is not available, for this experiment we only report therecovery error ratio and the running times. Figure 4(a) shows the running time for the Digg dataset –the recovery step for SCENT-monitor is required only when changes are detected, i.e. only in 5 ofthe 27 days: day 3, 11, 16, 17, and 25. Figure 4(b) shows the error ratio in Digg dataset; the errorratios appear to slightly increase right before change detection; the error ratio of SCENT-f remains lowthroughout the experiment. Figure 4(c) shows the running time for the DBLP dataset; the recovery stepof SCENT-c is required only when significant changes are detected in ’98, ’02, ’03 and ’07. Figure 4(d)shows the corresponding error ratio; once again error ratios of SCENT schemes remain low (<1.1).
Table V shows the average running times and error ratios. A summarization of performance gainversus loss is given in Table VI. In addition to having low average error ratios in both datasets, the timecosts of SCENT-monitors (SCENT-c and SCENT-f) are relatively low. The SCENT-monitors perform40 ∼ 159X faster in change detection and up to 3X faster in recovery, with an error penalty of 1 ∼ 4%on average (ref. Table VI). Due to factor-driven recovery between two detected changes, SCENT-f hasa lower error ratio than SCENT-c, but a higher running time.
The experiments show that, since tensor decomposition takes significantly more time, a fast changedetection mechanism is critical in reducing the overall execution costs.
4.6 Synthetic Data Experiments
The goal of the experiments with synthetic data is to observe the detection accuracy based on theground truth and to observe the performance as a function of key parameters.
As can be seen in Figure 5(a), in terms of change detection accuracy, despite relying on the wholedataset, the Naıve-monitor performs the worse: that is, structural changes in the social media cannotbe estimated directly from the data. The other three methods show comparable performance. Note also
8Because the offline computation of P is relatively expensive, in this paper we focus on the online phase of CS-recovery andreport its performance on the synthetic datasets.
ACM Transactions on Multimedia Computing, Communications and Applications, Vol. 7S, No. 1, Article 29, Publication date: October 2011.

SCENT: Scalable Compressed Monitoring of Evolving Multirelational Social Networks • 29:13
(a) Digg
(b) Digg
(c) DBLP
(d) DBLP
Fig. 4. Efficiency comparison based on Digg and DBLP datasets. (a,c) Running time in Digg and DBLP datasets: The Basic-and DTA- monitor perform full or incremental tensor decomposition at each time frame. For SCENT-c and SCENT-f, full tensordecomposition is required only when changes are detected: see the peaks in the running time curves. For SCENT-c, since thereis no maintenance, the time costs between two change points include only the detection costs; for SCENT-f, however, the timeincludes detection time plus factor-driven recovery time at each instance. Note that there is a significant difference in SCENT-fcosts between Digg and DBLP data sets. (b,d) The error ratios of SCENT-monitors remain low for most of the tensors; the errorsappear to slightly increase right before change detection. Note: we use a sampling constant C = 1/4 for SCENT-monitors. Theaverage performances are reported in Table V and Table VI.
Table V.Average running time (in seconds) and error ratio. In both
datasets, all methods have similar recovery error ratios. However,the time costs (both detection and recovery) of SCENT-monitor are
relative low.Detection Digg DBLP Recovery Digg DBLP
time time time error time errorBasic 0.810 1.700 Basic 0.810 1 1.700 1DTA 0.875 1.688 DTA 0.875 1.003 1.688 1.001SCENT 0.020 0.011 SCENT-c 0.202 1.040 1.040 1.020
SCENT-f 0.338 1.011 1.011 1.010
ACM Transactions on Multimedia Computing, Communications and Applications, Vol. 7S, No. 1, Article 29, Publication date: October 2011.

29:14 • Y.-R. Lin et al.
Table VI.Summary of performance improvement of SCENT-monitors
with respect to the Basic-monitor.Recovery
Detection SCENT-c SCENT-fGain (speed-up) in Digg 40.4X 299% 144%Loss (error increase) in Digg N/A 3.95% 1.97%Gain (speed-up) in DBLP 159.3X 139% 11.51%Loss (error increase) in DBLP N/A 1.09% 0.94%
(a) (b) (c)
Fig. 5. Efficiency comparisons with baseline methods. (a) detection accuracy (F1-score; higher is better), (b) recovery error ratio(lower is better), and (c) run time (in seconds; lower is better). Note that for baseline methods (Basic- and DTA-monitor), thedetection time and recovery time are the same (for Naıve-monitor, the error ratio and running time do not have meaning; henceit does not appear in (b) and (c)); C = 1/4 for the SCENT-monitors.
that the detection accuracy drops slightly in the case of large densification rates; again, the largestdrop is for the Naıve-monitor.
As mentioned earlier, in these experiments we used a relatively large ∼5% drift rate and a highfrequency λ = 10 of abrupt changes to observe the recovery error in stress conditions. Figure 5(b)shows that, the DTA-monitor is the best in terms of the recovery error relative to the Basic monitor.This is expected as both perform similar tensor decompositions. The SCENT alternatives perform welldespite the significant drift rate (the error ratio is between 1.2 and 1.5 relative to the Basic-monitor).Figure 5(c) shows that SCENT-monitor has much lower running time relative to alternatives. Forchange detection, SCENT is about 17.7X faster than the baseline methods. CS-based processing alsohelps reduce the recovery time for SCENT-c and SCENT-f by up to ∼25% despite the high frequency ofabrupt changes: the fact that SCENT-c recovery is much higher than the detection cost indicates thatmost of the cost comes from the decomposition cost when changes are detected; the fact that SCENT-cand SCENT-f are close to each other indicates that the factor-driven recovery adds only a minimaloverhead. Also note that the online phase of the SCENT-p recovery (with P matrix computed offline)is 68%∼76% faster than the baseline methods.
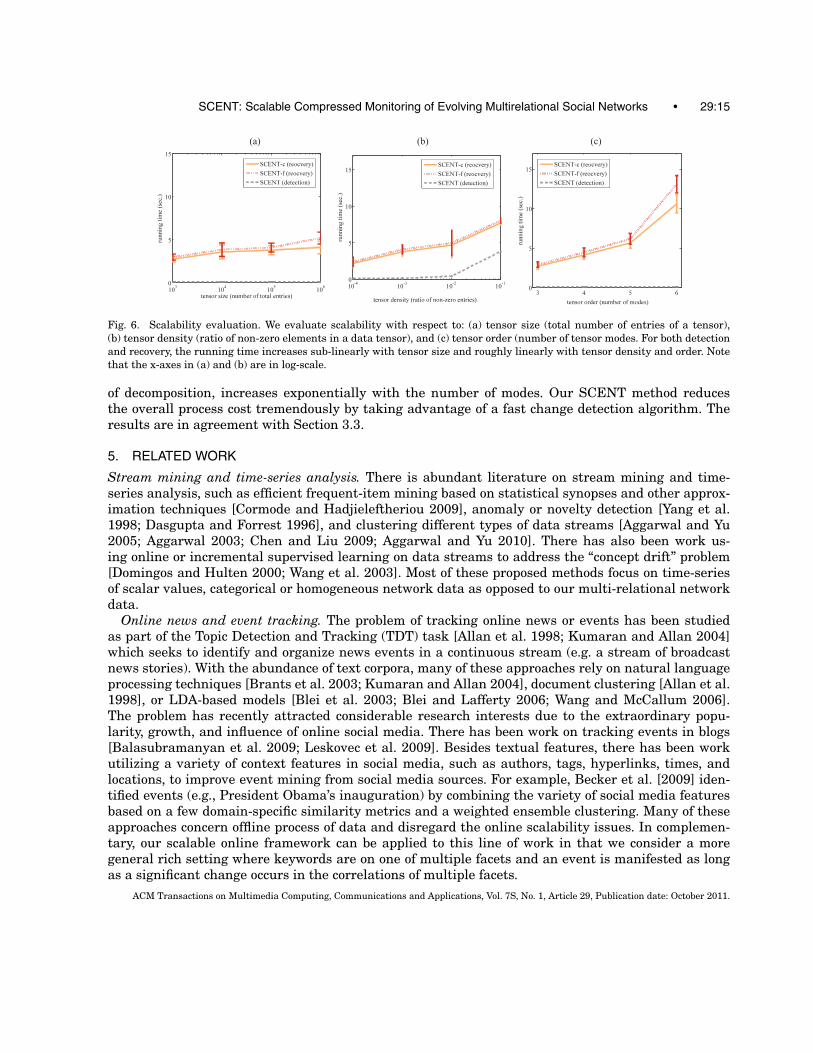
Scalability. In Figure 6, we study how the computational time of SCENT varies with changes in (a)tensor size (total number of entries of a tensor), (b) tensor density (ratio of nonzero elements in a datatensor), and (c) tensor order (number of tensor modes. The running time increases sub-linearly with theincrease of tensor size (ref. Figure 6(a)). Figure 6(b) shows that running time increases roughly linearlywith tensor density. Note that in both Figure 6(a) and (b), the x-axes are in log-scale. Figure 6(c) showsthe detection running time remains constant and the recovery running time increases almost linearlywith the number of tensor modes. This is important in that the core tensor size, and hence the costACM Transactions on Multimedia Computing, Communications and Applications, Vol. 7S, No. 1, Article 29, Publication date: October 2011.
SCENT: Scalable Compressed Monitoring of Evolving Multirelational Social Networks • 29:15
(a) (b) (c)
Fig. 6. Scalability evaluation. We evaluate scalability with respect to: (a) tensor size (total number of entries of a tensor),(b) tensor density (ratio of non-zero elements in a data tensor), and (c) tensor order (number of tensor modes. For both detectionand recovery, the running time increases sub-linearly with tensor size and roughly linearly with tensor density and order. Notethat the x-axes in (a) and (b) are in log-scale.
of decomposition, increases exponentially with the number of modes. Our SCENT method reducesthe overall process cost tremendously by taking advantage of a fast change detection algorithm. Theresults are in agreement with Section 3.3.
5. RELATED WORK
Stream mining and time-series analysis. There is abundant literature on stream mining and time-series analysis, such as efficient frequent-item mining based on statistical synopses and other approx-imation techniques [Cormode and Hadjieleftheriou 2009], anomaly or novelty detection [Yang et al.1998; Dasgupta and Forrest 1996], and clustering different types of data streams [Aggarwal and Yu2005; Aggarwal 2003; Chen and Liu 2009; Aggarwal and Yu 2010]. There has also been work us-ing online or incremental supervised learning on data streams to address the “concept drift” problem[Domingos and Hulten 2000; Wang et al. 2003]. Most of these proposed methods focus on time-seriesof scalar values, categorical or homogeneous network data as opposed to our multi-relational networkdata.
Online news and event tracking. The problem of tracking online news or events has been studiedas part of the Topic Detection and Tracking (TDT) task [Allan et al. 1998; Kumaran and Allan 2004]which seeks to identify and organize news events in a continuous stream (e.g. a stream of broadcastnews stories). With the abundance of text corpora, many of these approaches rely on natural languageprocessing techniques [Brants et al. 2003; Kumaran and Allan 2004], document clustering [Allan et al.1998], or LDA-based models [Blei et al. 2003; Blei and Lafferty 2006; Wang and McCallum 2006].The problem has recently attracted considerable research interests due to the extraordinary popu-larity, growth, and influence of online social media. There has been work on tracking events in blogs[Balasubramanyan et al. 2009; Leskovec et al. 2009]. Besides textual features, there has been workutilizing a variety of context features in social media, such as authors, tags, hyperlinks, times, andlocations, to improve event mining from social media sources. For example, Becker et al. [2009] iden-tified events (e.g., President Obama’s inauguration) by combining the variety of social media featuresbased on a few domain-specific similarity metrics and a weighted ensemble clustering. Many of theseapproaches concern offline process of data and disregard the online scalability issues. In complemen-tary, our scalable online framework can be applied to this line of work in that we consider a moregeneral rich setting where keywords are on one of multiple facets and an event is manifested as longas a significant change occurs in the correlations of multiple facets.
ACM Transactions on Multimedia Computing, Communications and Applications, Vol. 7S, No. 1, Article 29, Publication date: October 2011.
29:16 • Y.-R. Lin et al.
Tensor analysis. Tensor decompositions have been used in a variety of applications in data mining.Chi et al. [2006] applied the high-order singular value decomposition (HOSVD, a version of the Tuckerdecomposition) to extract dynamic structural changes as trends of the blogosphere. Sun et al. [2006]proposed methods for dynamically updating a Tucker approximation, with applications ranging fromtext analysis to network modeling. Although tensors are power tools for representing and mininghigher order data, the analysis based on tensor decomposition are usually expensive. To tackle large-size tensor decomposition, Kolda and Sun [2008] have proposed a scalable Tucker decomposition forsparse tensors. A biased sampling method has been proposed in CUR tensor decomposition [Drineasand Mahoney 2007], which reduce tensor dimensions based on the marginal norm distribution alongeach mode.
Applications of compressed sensing. The desirable features of CS has drawn significant researchinterests in signal processing, and has been recently extended to many applications, ranged from com-puter vision to networked data analysis [Haupt et al. 2008]. For example, Bajwa et al. [2006] appliesCS to identify sparse channels in order to optimize the wireless communication systems.
Graph mining, compression and sampling. Latent Semantic Indexing (LSI) [Deerwester et al. 1990]employs SVD to discover the latent topics or factors in the document-term matrix. On the Web, meth-ods based on ranking algorithms [Brin and Page 1998; Kleinberg 1999], spectral clustering or graphpartitioning [Shi and Malik 2000] and probability mixture model (such as PLSI [Hofmann 1999]) havebeen proposed for web data reduction. In addition, time-varying graphs have been analyzed through,for example, evolutionary clustering [Lin et al. 2008]. Also, existing works in lossless social graph com-pression [Chierichetti et al. 2009] are able to reduce the storage complexity to 3–4 bits per edge. Thegraph sampling work has a different goal in that it seek to reduce the data in a way that preserves sta-tistical and topological properties of the overall network [Leskovec and Faloutsos 2006; Rusmevichien-tong et al. 2001]. Most algorithms leverage connectivity and the degree of activity as indicators ofimportance and filter the graphs in a way that maintains only important nodes and edges [Leskovecand Faloutsos 2006].
Many existing social network analysis and mining approaches do not consider the impact of temporaldynamics on the analysis quality and computational cost. In this paper, we focus on identifying thesignificant change points when a costly tensor computation would be necessary. Through compressivesensing, our SCENT framework provides a strong indication of the change to the core tensor. Betweensignificant changes, the spectral properties are tracked using relatively cheaper alternatives with goodrecovery properties.
6. CONCLUSION AND FUTURE WORK
We proposed the SCENT framework for monitoring the evolution of multirelational social networkdata from users’ continuous online interactions. To track spectral characteristics in multirelationaldata, prior work relies on tensor decomposition, which is computationally expensive for Internet-scaledata management and analysis. The key idea in this article was that significant spectral changes inmulti-relational networks can be quickly detected before tensor decomposition, and the fast changedetection can further speed up the tensor stream approximation. We leveraged tensor-based analysiswith the recent established CS theory to develop the SCENT framework, which involved: (a) encodingthe observed tensor streams in the form of compact descriptors through sparse random sensing, and(b) incrementally obtaining core tensor coefficients either from the input data tensor or from the com-pact descriptors. The experimental results showed that our SCENT monitoring procedure was ableto maintain an approximated tensor stream with high accuracy (above 0.9 in terms of F1-score), lowerrors (under 1.5 relative to baseline tensor decomposition) and low time cost (17X–159X faster forchange detection).ACM Transactions on Multimedia Computing, Communications and Applications, Vol. 7S, No. 1, Article 29, Publication date: October 2011.
SCENT: Scalable Compressed Monitoring of Evolving Multirelational Social Networks • 29:17
APPENDIX
A. TENSORS
This sections provide the key notations and main concepts used in this article. For a more comprehen-sive discussions on tensors, we refer readers to Kolda and Bader’s review [Kolda and Bader 2009].
A tensor is a mathematical representation of a multiway array. The order of a tensor is the number ofmodes (or ways). We use x to denote a vector, X denote a matrix, and X a tensor. A sequence of tensorsX1 . . .Xn is called a tensor stream, if n is a positive integer that increases with time. The dimensionalityof a mode is the number of elements (entities) in that mode. We use Id to denote the dimensionalityof mode d. For instance, the tensor X ∈ R
I1×I2×I3 has 3 modes with dimensionalities of I1, I2 and I3,respectively. The (i1,i2,i3)-element of a third-order tensor is denoted by X123. Indices typically rangefrom 1 to their capital version, for instance, i1 = 1,. . . ,I1. Specifically for a matrix X, we use X(i, :)and X(:, j) to extract the i-th row and the j-th column of X. We provide the definitions of tensor norm,matricization or unfolding, and tensor product in Appendix A.
Definition A.1 (Tensor norm). The norm of an M-order tensor X ∈ RI1×...×IM is ‖X‖ =√∑I1
i1=1∑I2
i2=1 . . .∑IM
iM=1 x2i1i2...iM
.
Definition A.2 (Mode-d matricization or unfolding). Matricization is the process of reordering theelements of an M-way array into a matrix. The mode-d matricization of a tensor X ∈ R
I1×...×IM isdenoted by X(d), i.e. unfold(X , d) = X(d) ∈ R
Id×∏q∈{1,...,M},q =d Iq . Unfolding a tensor on mode d results in a
matrix with height Id and its width is the product of dimensionalities of all other modes. The inverseoperation is denoted as X = fold(X(d)) ∈ R
I1×...×IM . Similarly, we can define a vectorization operationx = vec(X ), which linearizes (unfolds) the tensor into a vector.
Definition A.3 (Mode-d product). The mode-d matrix product of a tensor X with a matrix U ∈ RJ×Id
is denoted by X ×d U and results in a tensor of size I1 × . . . × Id−1 × J × Id+1 × . . . × IM. Elementwise,we have (X ×d U)i1i2...id−1 jid+1...iM = ∑Id
id=1 xi1i2...iM ujid. In general, a tensor X ∈ RI1×...×IM can multiply a
sequence of matrices Ui|Mi=1 ∈ R
Ii×Ri as: X ×1 U1 . . . ×M UM, which can be written as X∏M
i=1 ×iUi forclarity.
B. PROOF AND DISCUSSION
PROOF OF LEMMA 3.1. In Equation (5), � is a matrix representation of∏M
m=1 ×mUm. Specifically, let jbe the linear index corresponding to a set of subscript values ( j1, . . . , jM), and define a tensor B j suchthat
B j = B j1... jM =M∏
m=1
×mUm(:, jm), 1 ≤ jm ≤ Rm,
where Um(:, jm) is the jm-th column of Um. � is constructed such that �(:, j) = vec(B j) ∀1 ≤ j ≤ S,where S = ∏M
m=1 ×mRm. Let umim = Um(:, im), um
jm = Um(:, jm), ∀m ∈ [1, M], be two set of vectors. We haveBi = Bi1...iM = u1
i1 ⊗ u2i2 ⊗ . . . ⊗ uM
iMand B j = B j1... jM = u1
j1 ⊗ u2j2 ⊗ . . . ⊗ uM
jM , where ⊗ denotes the tensorproduct operation (or outer product).
The inner product 〈Bi,B j〉 = 〈u1i1 ⊗u2
i2 ⊗. . .⊗uMiM
, u1j1 ⊗u2
j2 ⊗. . .⊗uMjM〉 = 〈u1
i1 , u1j1〉〈u2
i2 , u2j2〉 . . . 〈uM
iM, uM
jM〉.Hence, 〈Bi,B j〉 = 1 when i = j and 0 if i = j. Since �(:, j) = vec(B j) ∀1 ≤ j ≤ S, the columns of � aremutually orthogonal.
With Lemma 3.1, we can establish that RIP (Equation (3)) holds for the pair �� due to the in-coherence [Candes and Romberg 2007] between � and �, where � here is constructed by the sparse
ACM Transactions on Multimedia Computing, Communications and Applications, Vol. 7S, No. 1, Article 29, Publication date: October 2011.

29:18 • Y.-R. Lin et al.
…..
X1RR
2R
Krandom tensors
KRR
.
yEncoding
factor matrices
P
Decoding
core tensor
data tensor
(c) CS−recovery
(a) tensor decomposi�on
(b) factor-driven
inner product
Fig. 7. Recovery strategies: (a) tensor decomposition based, (b) factor-driven, and (c) CS-recovery.
ensemble method and satisfies RIP [Baraniuk et al. 2008]. The verification of RIP in Equation (5) playsa crucial role in our method. In CS literature, the formulation of sampling process y = �v = ��x usu-ally considers the transformation matrix � as an n × n orthonormal basis, where n is the length ofsignal. Consequently, the transformed vector x ∈ R
n is required to be s-sparse (where s < n). In suchcase, the at most s nonzero entries in x can be effectively recovered by l1-minimization [Candes andRomberg 2007] (as described in Equation (6)). In our method, the transformation matrix � ∈ R
N×S
(i.e. the matrix representation of∏M
m=1 ×mUm) is not an orthonormal basis and it directly transformsthe data into a relatively small vector z ∈ R
S (the vector representation of the core tensor Z). Hencewe need to verify that RIP holds for �� in Equation (5) in particular to assure that
∏Mm=1 ×mUm is a
proper basis and z is a concise representation in this basis (z is not necessarily sparse).The proper transformation leads to two main advantages in our method. First, in the sensing step
(Section 3.2 and 3.3), the length of the sensing vector y ∈ RK, is determined by the choice of the K × N
sensing matrix � (i.e., the set of random tensors Rk’s). When � is constructed by the sparse ensemblemethod [Baraniuk et al. 2008], RIP holds for the random sensing matrix � as long as K ≥ C ·s ·log(N/s)for all s-sparse vectors, where C is some positive constant. Based on Lemma 3.1, we can verify thatRIP holds for the S-length vector z as long as K ≥ C · S · log(N/S) random tensors are used. Hence,the length of the compressed sensing vector y is only O(S · logN/S). Second, in the recovering process(Section 3.4), we show that when K is chosen to be larger than S in the sensing step, z can be recoveredunambiguously by l2-minimization (Equation (7)), which is a more effective recovering process than l1-minimization.
C. RECOVERY STRATEGIES
The core tensor recovery strategies described in Section 3.4 can be illustrated by Figure 7. By lever-aging with change detection procedure, these strategies, corresponding to different ways the randomsensing ensembles have been constructed, can be used in different situations based on the availabilityof data and resources.ACM Transactions on Multimedia Computing, Communications and Applications, Vol. 7S, No. 1, Article 29, Publication date: October 2011.

SCENT: Scalable Compressed Monitoring of Evolving Multirelational Social Networks • 29:19
10% 30% 50% 70% 90%0
1
2
3
4
5
preserving density
runn
ing
time
(sec
.)
SCAN (detection)SCAN−c (reocvery)SCAN−f (recovery)
(a) Digg
10% 30% 50% 70% 90%0
5
10
15
20
25
preserving density
runn
ing
time
(sec
.)
SCAN (detection)
SCAN−c (reocvery)
SCAN−f (recovery)
(b) DBLP
Fig. 8. Running time against data density. The running time remains roughly constant when randomly removing 10% ∼ 90%elements from the original data tensors in both real-world datasets.
(a) (b) (c)
Fig. 9. (a) Detection accuracy (F1-score), (b) error ratio, and (c) detection running time (sec.) over different values of samplingconstant C. The performance of SCENT increases with larger value of C (higher accuracy and lower error ratio), with slightlyincrease in running time.
D. EXPERIMENT DETAILS
Running time in Digg and DBLP data. In Figure 8, we study how the computational time of thethree variants of our SCENT method vary with changes in data density. The original data density(number of nonzero elements in data tensors) in both real-world datasets can be found in Table IV.In these experiments, we randomly remove 10% ∼ 90% elements from the original data tensors andreport the running time of SCENT. As can be seen, the running time remains almost constant on bothdatasets. This observation is also consistent with the scalability test in the synthetic data experiments(see Figure 6(b)) which shows that when the data density increases exponentially, the running timeincreases roughly linearly.
Length of sensing vector. Figure 9 shows the impact of the parameter, C, on SCENT in the syntheticdata experiments: a larger value of C leads to higher accuracy in detection and lower error ratio, withonly slightly increase in the detection time. The empirical results suggest that both the detection andrecovery quality are reasonably well as long as C ≥ 1/4.
ACM Transactions on Multimedia Computing, Communications and Applications, Vol. 7S, No. 1, Article 29, Publication date: October 2011.

29:20 • Y.-R. Lin et al.
Table VII. Synthetic Data SettingsFixed settings:� tensor stream length (T ): 200� drift rate: ∼ 5% (data deviation between two change events)� change frequency (λ): 10 (average timesteps between two changes)Varying settings:� tensor size, density, and number of modes� densification rate (κ): with probability κ, a non-zero entries is relocated
through preferential attachment
Table VIII. Data Drift ModelGiven: data tensor X ∈ R
I1×...×IM , densification probability κ, drift rate δ,generate data drift H by the following process:
H := XRepeat while ‖H − X‖/‖X‖ < δ
Randomly pick a non-zero entry x from HRandomly pick a mode m ∈ [1, M]With probability κ, pick a zero entry x′ from H along mode-m with
probability proportional to∑i1 ...im−1im+1 ...iM
hi1 ...im−1imim+1 ...iM∑i1 ...iM
hi1 ...iM
and then swap the value of x and x′With probability 1 − κ, randomly pick a zero entry x′ from H along mode-m,
and then swap the value of x and x′
Synthetic data settings. In the synthetic data experiments (ref. Section 4.1), we generated a setof tensor streams (i.e., sequences of tensors) with characteristics that have been observed in priorresearch. The simulation is controlled by a set of parameters listed in Table VII.
Data drift in Synthetic datasets. The synthetic data are generated as follows: each tensor streamXt|Tt=1 is generated to simulate (a) abrupt changes and (b) drifts. Abrupt change events are gener-ated based on Poisson distribution with parameter λ, the expected length of interval between changes.We model an abrupt change at t by generating a random tensor Xt, where the nonzero entries aredistributed at random according to a specified data density (i.e., the ratio of the number of nonzero en-tries to the total number of entries in a tensor). Drifts are small changes between consecutive tensors.Since it has been observed that social network evolution exhibits preferential attachment phenomena[Barabasi et al. 2002] and the network tends to densify over time [Leskovec et al. 2005], we modeldrifts through a densification parameter, κ; with probability κ, a nonzero entry is relocated throughpreferential attachment and with probability 1 − κ, it is moved to a random location. The relocationprocess proceeds until the tensor norm deviates from the original at a specified rate.
We model data drift to simulate the preferential attachment phenomenon. Prior work on preferentialattachment considers a unipartite or bipartite network. To implement the idea on multirelationalnetworks, we relocate a nonzero entry in a tensor based on the degree distribution along each mode ofthe tensor. The parameter, densification probability κ, controls to what extent the data drift is drivenby preferential attachment. Another parameter, drift rate δ, controls how much the new data tensordeviates from the old one. The data drift model is given in Table VIII.
ACKNOWLEDGMENTS
We thank Jimeng Sun for providing us with the DTA source code, Nan Cao for helping prepare theDBLP dataset, and Mahsa Mojtahedi for the help with the experiment resources.ACM Transactions on Multimedia Computing, Communications and Applications, Vol. 7S, No. 1, Article 29, Publication date: October 2011.

SCENT: Scalable Compressed Monitoring of Evolving Multirelational Social Networks • 29:21
REFERENCES
AGGARWAL, C. 2003. A framework for diagnosing changes in evolving data streams. In Proceedings of the ACM SIGMOD Inter-national Conference on Management of Data. ACM, 586.
AGGARWAL, C. AND YU, P. 2005. Online analysis of community evolution in data streams. In Proceedings of the SIAM InternationalConference on Data Mining. SIAM, 56.
AGGARWAL,C., ZIE, Y., AND YU, P. 2010. On clustering graph streams. In Proceedings of the SIAM International Conference onData Mining.
ALLAN, J., PAPKA, R., AND LAVRENKO, V. 1998. On-line new event detection and tracking. In Proceedings of the Annual InternationalACM SIGIR Conference on Research and Development in Information Retrieval. ACM, 37–45.
BAJWA, W., HAUPT, J., SAYEED, A., AND NOWAK, R. 2006. Compressive wireless sensing. In Proceedings of the 5th InternationalConference on Information Processing in Sensor Networks. ACM, 142.
BALASUBRAMANYAN, R., LIN, F., COHEN, W., HURST, M., AND SMITH, N. 2009. From episodes to sagas: Understanding the newsby identifying temporally related story sequences. In Proceeedings of the 3rd International AAAI Conference on Weblogs andSocial Media (Poster).
BARABASI, A., JEONG, H., NEDA, Z., RAVASZ, E., SCHUBERT, A., AND VICSEK, T. 2002. Evolution of the social network of scientificcollaborations. Physica A: Stat Mechan Appl. 311, 3–4, 590–614.
BARANIUK, R., DAVENPORT, M., DEVORE, R., AND WAKIN, M. 2008. A simple proof of the restricted isometry property for randommatrices. Construct. Approxim. 28, 3, 253–263.
BECKER, H., NAAMAN, M., AND GRAVANO, L. 2009. Event identification in social media. In Proceedings of the ACM SIGMODInternational Conference on Management of Data Workshop on the Web and Databases (WebDB’09).
BLEI, D. AND LAFFERTY, J. 2006. Dynamic topic models. In Proceedings of the International Conference on Machine Learning.ACM, 120.
BLEI, D., NG, A., AND JORDAN, M. 2003. Latent dirichlet allocation. J. Mach. Learn. Resear. 3, 993–1022.BRANTS, T., CHEN, F., AND FARAHAT, A. 2003. A system for new event detection. In Proceedings of the Annual International ACM
SIGIR Conference on Research and Development in Information Retrieval. ACM, 330–337.BRIN, S. AND PAGE, L. 1998. The anatomy of a large-scale hypertextual web search engine. Comput. Netw. ISDN Syst. 30, 1–7,
107–117.CANDES, E. AND ROMBERG, J. 2007. Sparsity and incoherence in compressive sampling. Inv. Probl. 23, 969–985.CANDES, E. AND TAO, T. 2006. Near-optimal signal recovery from random projections: Universal encoding strategies? IEEE Trans.
Inform. Theory 52, 12, 5406–5425.CANDES, E. AND WAKIN, M. 2008. People hearing without listening: An introduction to compressive sampling. IEEE Signal
Process. Mag. 25, 2, 21–30.CARROLL, J. AND CHANG, J. 1970. Analysis of individual differences in multidimensional scaling via an n-way generalization of
Eckart-Young decomposition. Psychometrika 35, 3, 283–319.CHEN, K. AND LIU, L. 2009. He-tree: a framework for detecting changes in clustering structure for categorical data streams.
VLDB J. 18, 6, 1241–1260.CHI, Y., TSENG, B., AND TATEMURA, J. 2006. Eigen-trend: Trend analysis in the blogosphere based on singular value decomposi-
tions. In Proceedings of the ACM International Conference on Information and Knowledge Management. ACM, 68–77.CHIERICHETTI, F., KUMAR, R., LATTANZI, S., MITZENMACHER, M., PANCONESI, A., AND RAGHAVAN, P. 2009. On compressing social
networks. In Proceedings of the ACM SIGKDD International Conference on Knowledge Discovery and Data Mining. ACM,219–228.
CORMODE, G. AND HADJIELEFTHERIOU, M. 2009. Finding the frequent items in streams of data. Comm. ACM 52, 10, 97–105.DASGUPTA, D. AND FORREST, S. 1996. Novelty detection in time series data using ideas from immunology. In Proceedings of the
International Conference. on Intelligent Systems.DEERWESTER, S., DUMAIS, S., FURNAS, G., LANDAUER, T., AND HARSHMAN, R. 1990. Indexing by latent semantic analysis. J. Am. Soc.
Inform. Sci. 41, 6, 391–407.DOMINGOS, P. AND HULTEN, G. 2000. Mining high-speed data streams. In Proceedings of the 6th ACM SIGKDD International
Conference on Knowledge Discovery and Data Mining. ACM, 80.DRINEAS, P. AND MAHONEY, M. 2007. A randomized algorithm for a tensor-based generalization of the singular value decomposi-
tion. Linear Alg. Appl. 420, 2–3, 553–571.GOLUB, G. AND VAN LOAN, C. 1996. Matrix Computation. Johns Hopkins University Press.HARSHMAN, R. 1970. Foundations of the parafac procedure: Models and conditions for an “explanatory” multi-modal factor anal-
ysis. UCLA Working Papers in Phonetics 16, 1, 84.
ACM Transactions on Multimedia Computing, Communications and Applications, Vol. 7S, No. 1, Article 29, Publication date: October 2011.

29:22 • Y.-R. Lin et al.
HAUPT, J., BAJWA, W., RABBAT, M., AND NOWAK, R. 2008. Compressed sensing for networked data. IEEE Signal Process. Mag. 25,2, 92–101.
HOFMANN, T. 1999. Probabilistic latent semantic indexing. In Proceedings of the Annual International ACM SIGIR Conferenceon Research and Development in Information Retrieval. ACM Press, New York, NY, 50–57.
KLEINBERG, J. M. 1999. Authoritative sources in a hyperlinked environment. J. ACM 46, 5, 604–632.KOLDA, T. AND BADEr, B. 2009. Tensor decompositions and applications. SIAM Rev. 51, 3, 455–500.KOLDA, T. G. AND SUN, J. 2008. Scalable tensor decompositions for multi-aspect data mining. In Proceedings of the IEEE Interna-
tional Conference on Data Mining. 363–372.KUMARAN, G. AND ALLAN, J. 2004. Text classification and named entities for new event detection.In Proceedings of the Annual
International ACM SIGIR Conference on Research and Development in Information Retrieval. ACM, 304.LESKOVEC, J., BACKSTROM, L., AND KLEINBERG, J. 2009. Meme-tracking and the dynamics of the news cycle. In Proceedings of the
ACM SIGKDD International Conference on Knowledge Discovery and Data Mining. ACM, 497–506.LESKOVEC, J. AND FALOUTSOS, C. 2006. Sampling from large graphs. In Proceedings of the ACM SIGKDD International Conference
on Knowledge Discovery and Data Mining. ACM, New York, NY, 631–636.LESKOVEC, J., KLEINBERG, J., AND FALOUTSOS, C. 2005. Graphs over time: Densification laws, shrinking diameters and possible
explanations. In Proceedings of the ACM SIGKDD International Conference on Knowledge Discovery and Data Mining.LIN, Y.-R., CHI, Y., ZHU, S., SUNDARAM, H., AND TSENG, B. L. 2008. Facenet: A framework for analyzing communities and their
evolutions in dynamics networks. In Proceedings of the International World Wide Web Conference. ACM Press.LIN, Y.-R., SUN, J., CASTRO, P., KONURU, R., SUNDARAM, H., AND KELLIHER, A. 2009. Metafac: Community discovery via relational
hypergraph factorization. In Proceedings of the ACM SIGKDD International Conference on Knowledge Discovery and DataMining.
RUSMEVICHIENTONG, P., PENNOCK, D., LAWRENCE, S., AND GILES, C. 2001. Methods for sampling pages uniformly from the worldwide web. In Proceedings of the AAAI Fall Symposium on Using Uncertainty within Computation. 121–128.
SHI, J. AND MALIK, J. 2000. Normalized cuts and image segmentation. IEEE Trans. Patt. Anal. Mach. Intell. 22, 8, 888–905.SUN, J., TAO, D., AND FALOUTSOS, C. 2006. Beyond streams and graphs: Dynamic tensor analysis. In Proceedings of the ACM
SIGKDD International Conference on Knowledge Discovery and Data Mining. 374–383.TUCKER, L. 1966. Some mathematical notes on three-mode factor analysis. Psychometrika 31, 3, 279–311.WANG, H., FAN, W., YU, P., AND HAN, J. 2003. Mining concept-drifting data streams using ensemble classifiers. In Proceedings of
the ACM SIGKDD International Conference on Knowledge Discovery and Data Mining. ACM, 226–235.WANG, X. AND MCCALLUM, A. 2006. Topics over time: a non-Markov continuous-time model of topical trends. In Proceedings of
the ACM SIGKDD International Conference on Knowledge Discovery and Data Mining. ACM, 433.YANG, Y., PIERCE, T., AND CARBONELL, J. 1998. A study of retrospective and on-line event detection. In Proceedings of the Annual
International ACM SIGIR Conference on Research and Development in Information Retrieval. ACM, 28–36.
Received September 2010; revised March 2011; accepted July 2011
ACM Transactions on Multimedia Computing, Communications and Applications, Vol. 7S, No. 1, Article 29, Publication date: October 2011.