Embed Size (px)
Citation preview
Design & Engineering Services
ZERO NET ENERGY DEMONSTRATION SHOWCASE
UNIVERSITY OF CALIFORNIA, SANTA BARBARA
RECREATIONAL CENTER AND AQUATICS COMPLEX
ET10SCE2030 Report
Prepared by:
Design & Engineering Services
Customer Service Business Unit
Southern California Edison
March 2013
Zero Net Energy Demonstration Showcase ET10SCE2030
Southern California Edison
Design & Engineering Services November 2012
Acknowledgements
Southern California Edison’s Design & Engineering Services (DES) group is responsible for
this project. It was developed as part of Southern California Edison’s Emerging Technologies
Program under internal project number ET10SCE2030 Bach Tsan conducted this technology
evaluation with overall guidance and management from Teren Abear. For more information
on this project, contact [email protected].
Disclaimer
This report was prepared by Southern California Edison (SCE) and funded by California
utility customers under the auspices of the California Public Utilities Commission.
Reproduction or distribution of the whole or any part of the contents of this document
without the express written permission of SCE is prohibited. This work was performed with
reasonable care and in accordance with professional standards. However, neither SCE nor
any entity performing the work pursuant to SCE’s authority make any warranty or
representation, expressed or implied, with regard to this report, the merchantability or
fitness for a particular purpose of the results of the work, or any analyses, or conclusions
contained in this report. The results reflected in the work are generally representative of
operating conditions; however, the results in any other situation may vary depending upon
particular operating conditions.
Zero Net Energy Demonstration Showcase ET10SCE2030
Southern California Edison Page iii Design & Engineering Services November 2012
EXECUTIVE SUMMARY In an effort to partner with innovators and early adopters of the ZNE concept through the
Emerging Technologies Program (ETP), Southern California Edison (SCE) is working with the
University of California at Santa Barbara (UCSB), Division of Student Affairs to understand
the feasibility of achieving Zero Net Energy (ZNE) at the UCSB Recreational Facility and
Aquatics Complex.
Though specific goals of SCE and UCSB are somewhat different, the partnership is aligned to
achieve Zero Net Energy (ZNE) on the existing UCSB recreational facilities located on
campus. Because ZNE is a unique pathway to building design and construction and is still
under development, both sides of the partnership were interested in understanding and
documenting the various pathways for achieving ZNE. This project was undertaken to create
the foundation necessary to proceed with design and implementation of energy efficiency
measures (EEMs) and renewable technologies to achieve ZNE.
Because of the work of the partnership, the project team has identified over 30 EEMs to
help reduce the baseline usage of the Recreational Facility and Aquatics Complex. These
EEMs have been evaluated for energy savings, cost payback, and optimized specifically for
this facility, enabling the presentation of four example packages of ways in which the facility
can achieve ZNE with a reasonable return on investment.
Recommended packages were sorted into four categories including: ZNE based on utility-
recommended EEMs (i.e., economic-driven), ZNE based on quickest implementation, ZNE
based on quickest payback, and an innovation/pool-focused ZNE package. These packages
range in paybacks from fewer than 10 years for the economic-driven package to 23 years
for the innovation/pool-focused package. It is difficult to quantify energy savings since
combining renewable generation will eliminate grid source energy usage altogether;
however, the project team did quantify energy savings for the EEM packages. Energy
savings ranged from 600,000 kilowatt-hour (kWh) annually for the economic-driven
package to 1,600,000 kWh annually for the innovation/pool focused project.
Identifying energy savings figures and reducing baseline energy usage were found to be
essential for achieving ZNE. These tasks were performed by the project team based on the
Measurement and Verification (M&V) plan established at the beginning of the project.
Without first lowering the baseline usage, a renewable generation plant to cover the
baseline usage was shown to be uneconomical and did not fully address gas usage.
Supplemental to establishing energy savings figures, the project team documented the
Owner’s Project Requirements (OPR) and Basis of Design (BOD), both considered critical in
proceeding with any complex retrofit or new construction project. It is expected, should
UCSB move forward with some or all of the EEMs, incentives from various programs will be
leveraged.
Based on the work performed as part of this project, it was determined that ZNE is feasible
for the UCSB recreational facility and aquatics complex. However, due to the complexity of
some of the measures, it is recommended that UCSB retain a design team prior to
proceeding with implementation.
Once a design team has been retained, it is highly recommended that they review the OPR,
BOD, and anticipated energy savings figures established by this project.
Zero Net Energy Demonstration Showcase ET10SCE2030
Southern California Edison Page iv
Design & Engineering Services November 2012
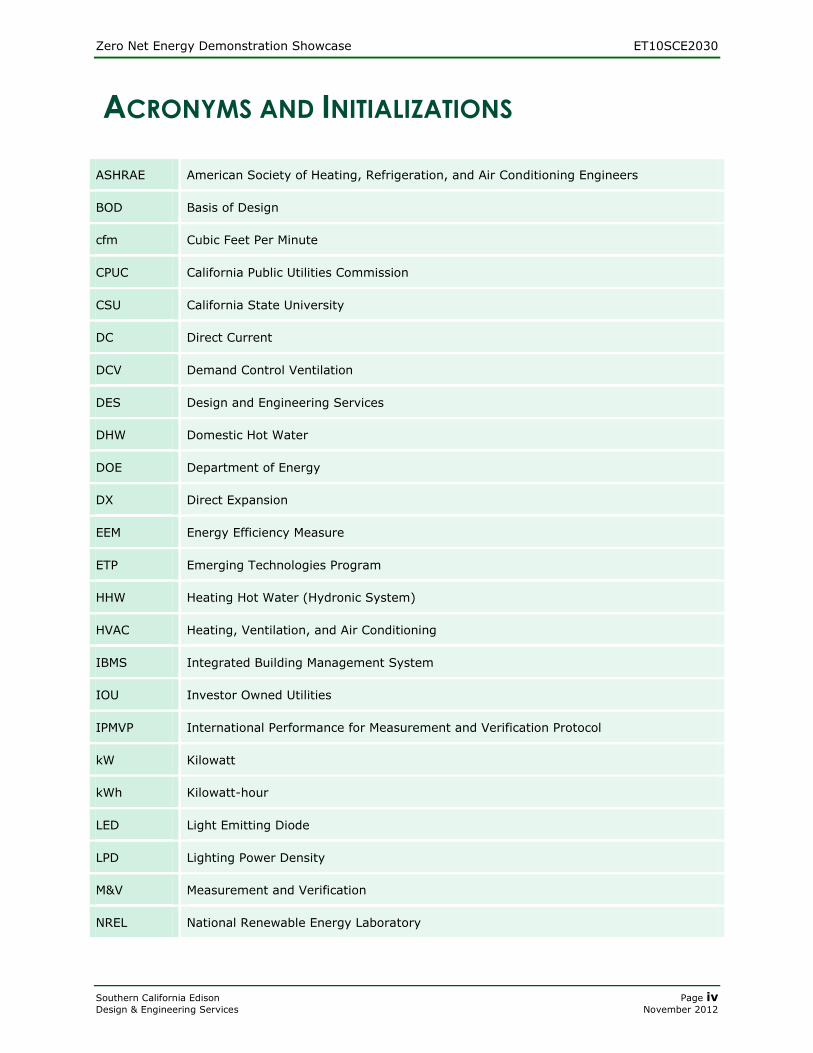
ACRONYMS AND INITIALIZATIONS
ASHRAE American Society of Heating, Refrigeration, and Air Conditioning Engineers
BOD Basis of Design
cfm Cubic Feet Per Minute
CPUC California Public Utilities Commission
CSU California State University
DC Direct Current
DCV Demand Control Ventilation
DES Design and Engineering Services
DHW Domestic Hot Water
DOE Department of Energy
DX Direct Expansion
EEM Energy Efficiency Measure
ETP Emerging Technologies Program
HHW Heating Hot Water (Hydronic System)
HVAC Heating, Ventilation, and Air Conditioning
IBMS Integrated Building Management System
IOU Investor Owned Utilities
IPMVP International Performance for Measurement and Verification Protocol
kW Kilowatt
kWh Kilowatt-hour
LED Light Emitting Diode
LPD Lighting Power Density
M&V Measurement and Verification
NREL National Renewable Energy Laboratory
Zero Net Energy Demonstration Showcase ET10SCE2030
Southern California Edison Page v
Design & Engineering Services November 2012
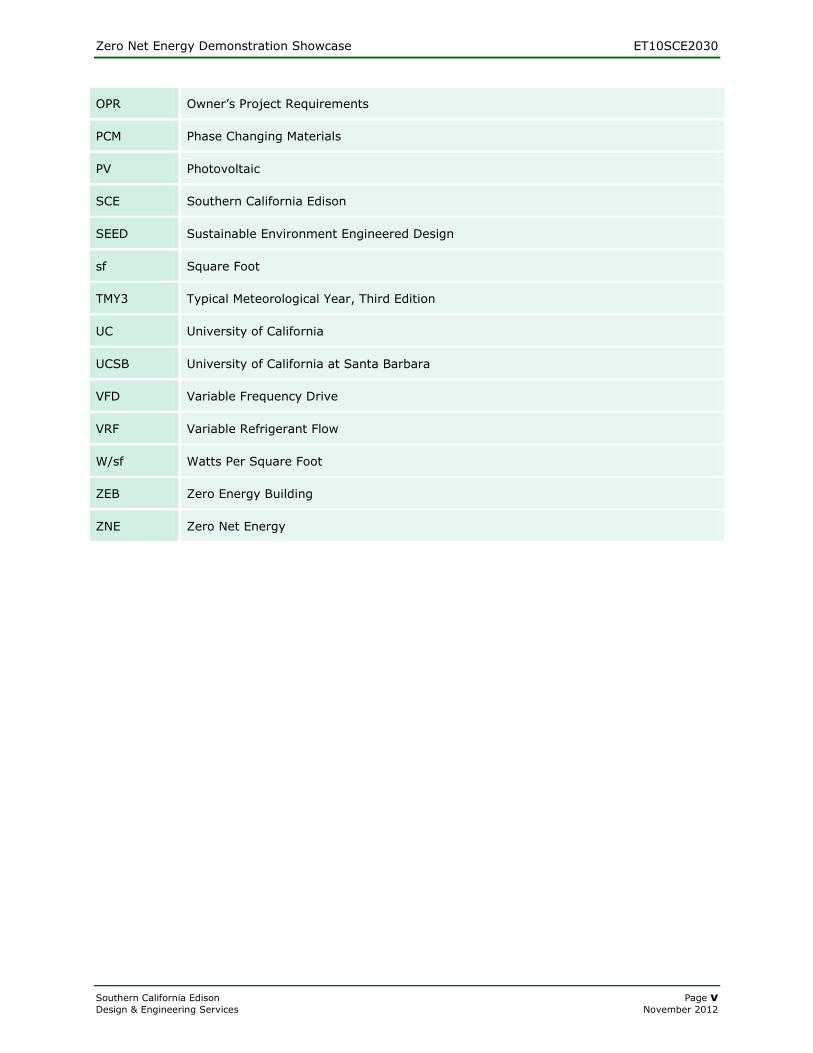
OPR Owner’s Project Requirements
PCM Phase Changing Materials
PV Photovoltaic
SCE Southern California Edison
SEED Sustainable Environment Engineered Design
sf Square Foot
TMY3 Typical Meteorological Year, Third Edition
UC University of California
UCSB University of California at Santa Barbara
VFD Variable Frequency Drive
VRF Variable Refrigerant Flow
W/sf Watts Per Square Foot
ZEB Zero Energy Building
ZNE Zero Net Energy
Zero Net Energy Demonstration Showcase ET10SCE2030
Southern California Edison Page vi Design & Engineering Services November 2012
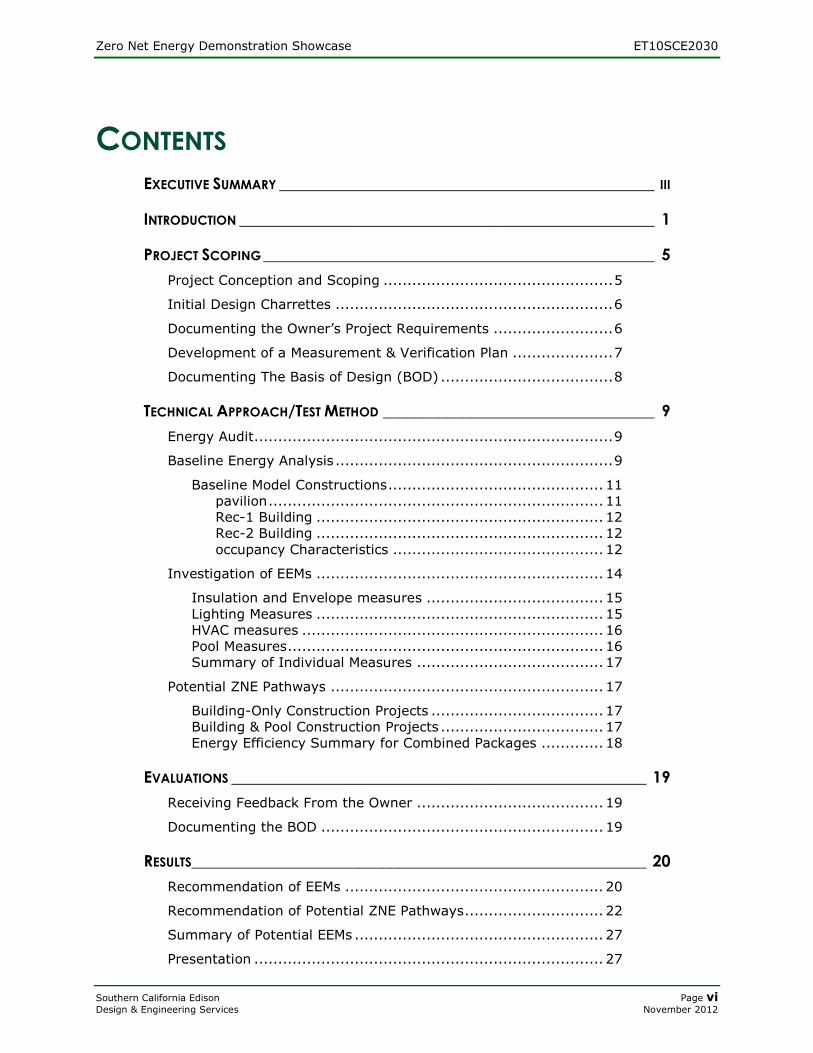
CONTENTS
EXECUTIVE SUMMARY _______________________________________________ III
INTRODUCTION ____________________________________________________ 1
PROJECT SCOPING _________________________________________________ 5
Project Conception and Scoping ................................................ 5
Initial Design Charrettes .......................................................... 6
Documenting the Owner’s Project Requirements ......................... 6
Development of a Measurement & Verification Plan ..................... 7
Documenting The Basis of Design (BOD) .................................... 8
TECHNICAL APPROACH/TEST METHOD __________________________________ 9
Energy Audit ........................................................................... 9
Baseline Energy Analysis .......................................................... 9
Baseline Model Constructions ............................................. 11 pavilion ...................................................................... 11 Rec-1 Building ............................................................ 12 Rec-2 Building ............................................................ 12 occupancy Characteristics ............................................ 12
Investigation of EEMs ............................................................ 14
Insulation and Envelope measures ..................................... 15 Lighting Measures ............................................................ 15 HVAC measures ............................................................... 16 Pool Measures .................................................................. 16 Summary of Individual Measures ....................................... 17
Potential ZNE Pathways ......................................................... 17
Building-Only Construction Projects .................................... 17 Building & Pool Construction Projects .................................. 17 Energy Efficiency Summary for Combined Packages ............. 18
EVALUATIONS ____________________________________________________ 19
Receiving Feedback From the Owner ....................................... 19
Documenting the BOD ........................................................... 19
RESULTS_________________________________________________________ 20
Recommendation of EEMs ...................................................... 20
Recommendation of Potential ZNE Pathways ............................. 22
Summary of Potential EEMs .................................................... 27
Presentation ......................................................................... 27
Zero Net Energy Demonstration Showcase ET10SCE2030
Southern California Edison Page vii Design & Engineering Services November 2012
RECOMMENDATIONS ______________________________________________ 29
ATTACHMENTS ___________________________________________________ 30
REFERENCES _____________________________________________________ 31
FIGURES Figure 1. California Public Utility Definition of Zero Net EnergyError! Bookmark not defined.
Figure 1. California Public Utility Definition of Zero Net Energy ........... 3
Figure 3. Project Flow Chart ........................................................ 4
Figure 4. UCSB Recreation Center – Architectural Illustration ............ 6
Figure 5 . Average Monthly Temperature Comparison ..................... 11
Figure 6. Recreational Complex Normal Hours Occupancy .............. 12
Figure 7. Recreational Complex Reduced Hours Occupancy .............. 13
Figure 8. Recreational Complex Electricity End-Use Breakdown, All
Facilities .................................................................... 14
Figure 9. Recreational Complex Gas End-Use Breakdown, All
Facilities .................................................................... 14
TABLES Table 1. Recreational Facility Scheduling ....................................... 13
Table 2. EEM List and Implementation Characteristics .................... 21
Table 3. Utility-Recommended Project .......................................... 23
Table 4. Economic-Driven Project................................................. 24
Table 5. Quickest-Implemented Project ........................................ 25
Table 6. Innovation/Pool-Focused Project...................................... 26
Zero Net Energy Demonstration Showcase ET10SCE2030
Southern California Edison Page 1
Design & Engineering Services November 2012
INTRODUCTION The California Public Utilities Commission (CPUC) has set objectives for aggressive long-
term strategies, including the goal that new construction will reach Zero Net Energy (ZNE)
performance for all new construction of single and multi-family homes by 2020. In addition,
through implementation of deep levels of energy efficiency and clean, distributed
generation, ZNE capability will be implemented in 100% of new starts and 50% of existing
buildings by 2030.1 This is one of the first ZNE projects conducted by Southern California
Edison’s (SCEs) Design and Engineering Services (DES) as a demonstration showcase. In
addition, the project team required the utility expertise provided by DES staff with outside
design and energy consultants with previous experience with utility type evaluation work.
To help achieve these goals, the California Investor Owned Utilities (IOU) have been tasked
with investigating pathways for achieving ZNE in the various sectors of both new
construction and retrofit applications. Southern California Edison (SCE) specifically has
initiated multiple projects that include the evaluation of ZNE facilities in their territory. As
with many innovations and new ideas, the concept of ZNE is a tough sell. This could be
caused by the lack of financial information regarding the cost of implementing ZNE features
or a lack of information available regarding deep energy efficiency retrofits and renewable
generation technologies. Similarly, the lack of established ZNE projects makes investment in
this new concept difficult to justify.
The pattern of adoption for ZNE is anticipated to follow that of emerging energy efficient
technologies. For that reason, SCE has elected to include the ZNE research as part of the
Emerging Technologies Program (ETP). Similar to other concepts in the ETP, a group of
innovators and early adopters with whom SCE would like to work are expected to come
forward and help create market traction for the ZNE concept. To encourage such
participation and gain new understanding of the complexities of the development,
installation and staging of cohesive ZNE packages, ETP will undertake “Demonstration
Showcases”. These real-world projects allow various stakeholders to gain hands-on
experience with a comprehensive system of proven Energy Efficiency (EE) measures as part
of a ZNE project. In addition, among other things, Demonstration Showcase projects assist
in addressing cost, installation, and performance issues as well as aid in the discovery of
other potential barriers that could impede market acceptance.
One such Demonstration Showcase for the ZNE concept involves a partnership between
Southern California Edison (SCE) and The University of California at Santa Barbara (UCSB),
Division of Student Affairs. These two partners are committed financially to the challenges
and opportunities of working together on forward-thinking, emerging technologies that will
potentially have great impact on the future of energy usage.
The UCSB, Division of Student Affairs, has discussed many sustainability goals with SCE.
Those mentioned in preliminary discussions include:
Reducing dependence on grid source power
Achieving ZNE for the recreational facilities
Creating a replicable model for achieving ZNE in other campus facilities
Because ZNE is a still developing, unique pathway to building design and construction, both
SCE and UCSB would like to understand and document the various pathways for achieving
it. Although the ultimate goals of the partners with regard to this project are somewhat
different, they are aligned to achieve ZNE on the existing UCSB recreational facilities located
Zero Net Energy Demonstration Showcase ET10SCE2030
Southern California Edison Page 2
Design & Engineering Services November 2012
on campus. Ultimately, the goal is to demonstrate the viability of a ZNE project. Combined
with other ZNE demonstrations this information will help provide the technical and financial
details necessary to steer the building industry towards pursuing CPUC ZNE goals with
minimal Utility involvement.
As more ZNE projects are demonstrated throughout the various IOU service territories, the
market barriers to achieving the aggressive, long-term efficiency goals set forth by the
CPUC will become clearer. In addition, the financial characteristics of implementing bundled
EEMs combined with renewable generation and data on associated paybacks will become
available. This will help adopters to make informed decisions about proceeding with ZNE
projects, and making investments in energy efficiency. Combined with other ZNE
demonstrations, this information will help provide the technical and financial details
necessary to help steer the building industry toward pursuing CPUC ZNE goals with minimal
utility involvement. National Renewable Energy Laboratory (NREL) provides the following
four definitions applicable to Zero Energy Buildings (ZEBs).2 Note that each definition uses
the grid for net use accounting and has different applicable renewable energy sources. In
addition, although typically renewable generation is located on site, there are “off-site” ZEBs
that have a portion of the renewable generation located off site:
1. Net Zero Site Energy: A site ZEB produces at least as much energy as it uses in a
year when accounted for at the site.
2. Net Zero Source Energy: A source ZEB produces at least as much energy as it
uses in a year, when accounted for at the source. Source energy refers to the
primary energy used to generate and deliver the energy to the site. To calculate a
building’s total source energy, imported and exported energy is multiplied by the
appropriate site-to source conversion multipliers.
3. Net Zero Energy Costs: In a cost ZEB, the amount of money the utility pays the
building owner for the energy the building exports to the grid is at least equal to the
amount the owner pays the utility for the energy services and energy used over the
year.
4. Net Zero Energy Emissions: A net-zero emissions ZEB produces at least as much
emissions-free renewable energy as it uses from emissions-producing energy
sources.3
All of these definitions could be appropriate for a building depending on the project goals
and the position of the design team or building owner. For example, a building owner may
be more interested in site energy costs and potential cost reduction, whereas organizations
such as the Department of Energy (DOE) may be more concerned with source energy and
still others with a reduction in carbon emissions.
The definition that most effectively describes the ZNE goals set forth by SCE and UCSB for
the recreational facilities is that of Net Zero Site Energy (definition 1 listed above). This
definition matches the CPUC definition as found in the California Long Term Strategic Energy
Plan: “ZNE is a general term applied to a building with a net energy consumption of zero
over a typical year. To cope with fluctuations in demand, zero energy buildings are typically
envisioned as connected to the grid, exporting electricity to the grid when there is a surplus,
and drawing electricity when not enough electricity is being produced”.4
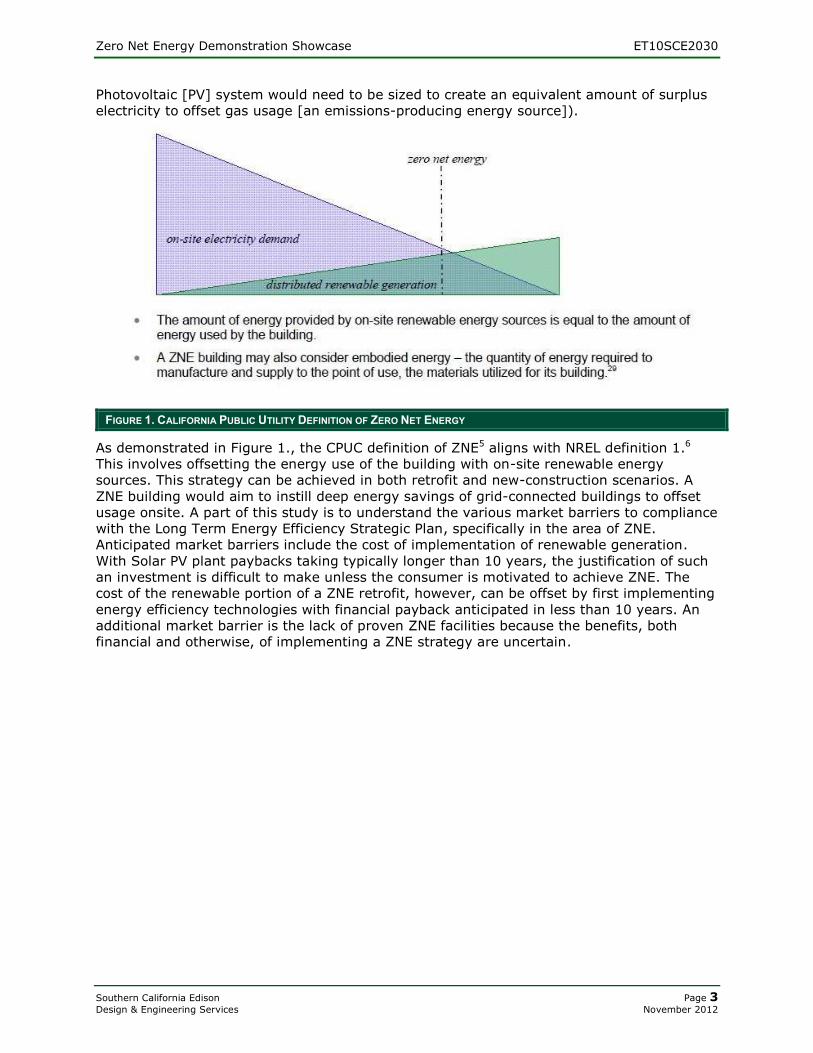
Figure 1. is a graphical representation of the CPUC definition of ZNE in the context of
electricity usage. Theoretically, since gas usage is final and non-renewable, any use of this
fuel would disqualify the facility from achieving ZNE. This would imply that for a new
construction scenario, only electric-based systems may be used. For retrofit situations, all
systems requiring gas must be eliminated (that is, unless the NREL definition for Net Zero
Energy Emissions [the definition 4 listed above] is applied, which suggests that a
Zero Net Energy Demonstration Showcase ET10SCE2030
Southern California Edison Page 3
Design & Engineering Services November 2012
Photovoltaic [PV] system would need to be sized to create an equivalent amount of surplus
electricity to offset gas usage [an emissions-producing energy source]).
FIGURE 1. CALIFORNIA PUBLIC UTILITY DEFINITION OF ZERO NET ENERGY
As demonstrated in Figure 1., the CPUC definition of ZNE5 aligns with NREL definition 1.6
This involves offsetting the energy use of the building with on-site renewable energy
sources. This strategy can be achieved in both retrofit and new-construction scenarios. A
ZNE building would aim to instill deep energy savings of grid-connected buildings to offset
usage onsite. A part of this study is to understand the various market barriers to compliance
with the Long Term Energy Efficiency Strategic Plan, specifically in the area of ZNE.
Anticipated market barriers include the cost of implementation of renewable generation.
With Solar PV plant paybacks taking typically longer than 10 years, the justification of such
an investment is difficult to make unless the consumer is motivated to achieve ZNE. The
cost of the renewable portion of a ZNE retrofit, however, can be offset by first implementing
energy efficiency technologies with financial payback anticipated in less than 10 years. An
additional market barrier is the lack of proven ZNE facilities because the benefits, both
financial and otherwise, of implementing a ZNE strategy are uncertain.
Zero Net Energy Demonstration Showcase ET10SCE2030
Southern California Edison Page 4
Design & Engineering Services November 2012
ASSESSMENT OBJECTIVES
To address the project goals of real-time experience and implementation data related to
ZNE implementations, the team used a tiered approach with multiple checkpoints. Unlike
the testing of a single emerging technology, the packaged nature of developing a strategy
for achieving ZNE follows that of a design or retrofit project strategy commonly used by
architects and engineers. This process, referred to as programming, is typically used in the
very beginning of a project, prior to Schematic Design, to help develop project
requirements, costs, and features. Similar to typical programming activities, SCE and its
consultants held design charrettes, interviewed the owner to understand project
requirements, reviewed design drawings and existing facility configuration, and became
familiar with the UCSB recreational center facilities as a whole. The team determined in
these initial charrettes and meetings that this project would be energy-focused, and hence
they needed to do supplemental work in the programming phase not typical of average
design and retrofit projects. This has included (1) a site and facility energy audit, (2)
thorough energy analysis, (3) investigation and recommendation of EEMs, (4) gaining an
understanding of the feasibility of achieving ZNE at this facility and (5) proposing various
pathways and options for achieving ZNE.
The scope of the project was to understand the feasibility of achieving ZNE and presenting
various potential pathways. A Basis of Design (BOD) was created to capture and document
the decisions that lead to the construction and design phase. The BOD can then be used to
provide focus during the Schematic Design (SD), Design Development (DD), and
Construction Document (CD) phases to ensure that the original intent of the project is
maintained through planning to implementation.
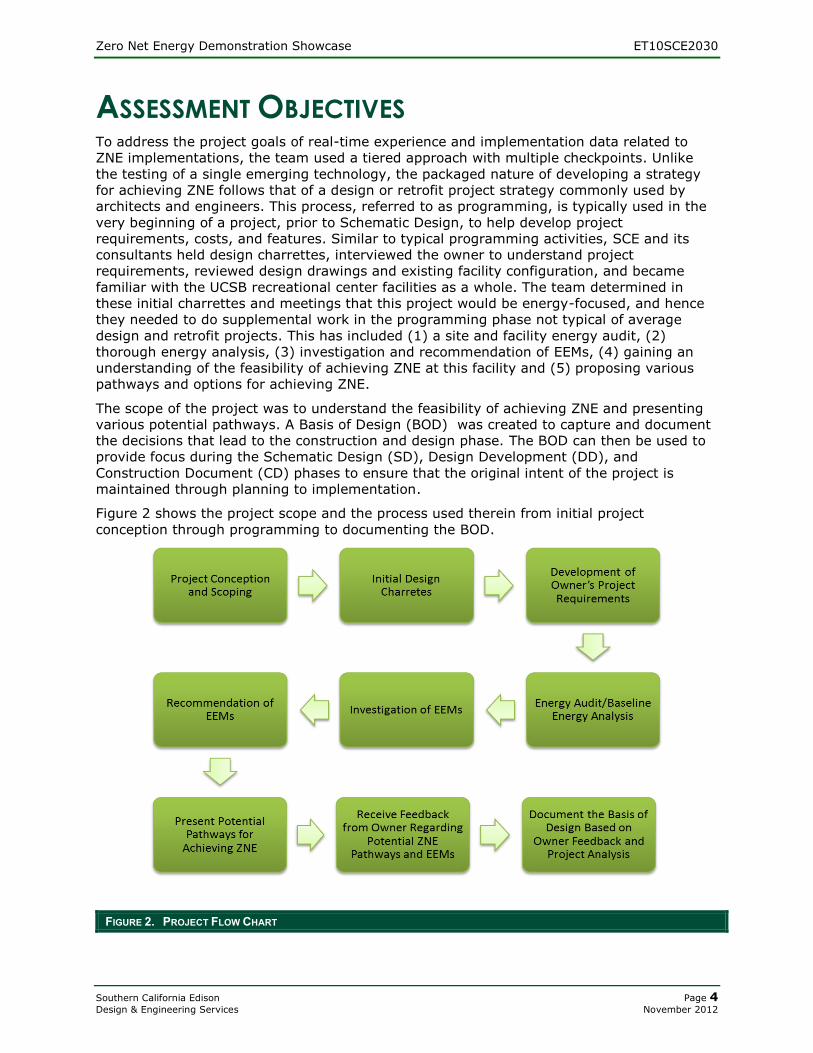
Figure 2 shows the project scope and the process used therein from initial project
conception through programming to documenting the BOD.
FIGURE 2. PROJECT FLOW CHART
Zero Net Energy Demonstration Showcase ET10SCE2030
Southern California Edison Page 5
Design & Engineering Services November 2012
PROJECT SCOPING
PROJECT CONCEPTION AND SCOPING In March of 2012, the Division of Student Affairs of UCSB prepared a presentation
entitled “Moving to the 6th Wave of Innovation – A Systems Approach.” This
presentation explained the value and interest in moving toward a ZNE educational
and service environment.
The presentation begins with a quote from Dr. William Edward Deming:
“A system is a network of interdependent components that work together to
try to accomplish the aim of the system. A system must have an aim. Without
an aim, there is no system. The aim of the system must be clear to everyone
in the system. The aim of the system must include plans for the future. The
aim is a value judgment. (We are of course talking here about a man-made
system.)”
This indicates that there are educational, economic and moral functions to ZNE
systems, and highlights that the campus is looking for a holistic, systematic
approach to efficient energy usage rather than using individual Band-Aids to address
energy usage problems. The rest of the UCSB students’ presentation explains UCSB’s
vision for this ZNE project. Student Affairs has concluded that a systems approach to
Zero Net Energy will reduce the impact of budget cuts on its operations and create a
national leadership status for these campus facilities in the area of green
technologies and earth stewardship.
Since 1995, UCSB has had in place a campus sustainability plan based on a vision of
making the campus a national leader in the integration of sustainability in higher
education learning, discovery, and operations. The plan includes a commitment by
UCSB to move towards a climate-neutral campus through energy efficiency,
conservation, on-site energy generation and the strategic procurement of clean and
renewable energy. To support its ongoing efforts towards campus sustainability,
UCSB has expressed a strong interest in making its recreation center a ZNE building.
The recreation center already incorporates many aspects of energy efficient design,
along with on-site renewable energy production, making ZNE a potentially realistic
option. Achieving this level of performance will help demonstrate the ability to
achieve ZNE in the existing building market. As a pilot project, the recreation center
will also support a variety of statewide and national efforts to improve energy
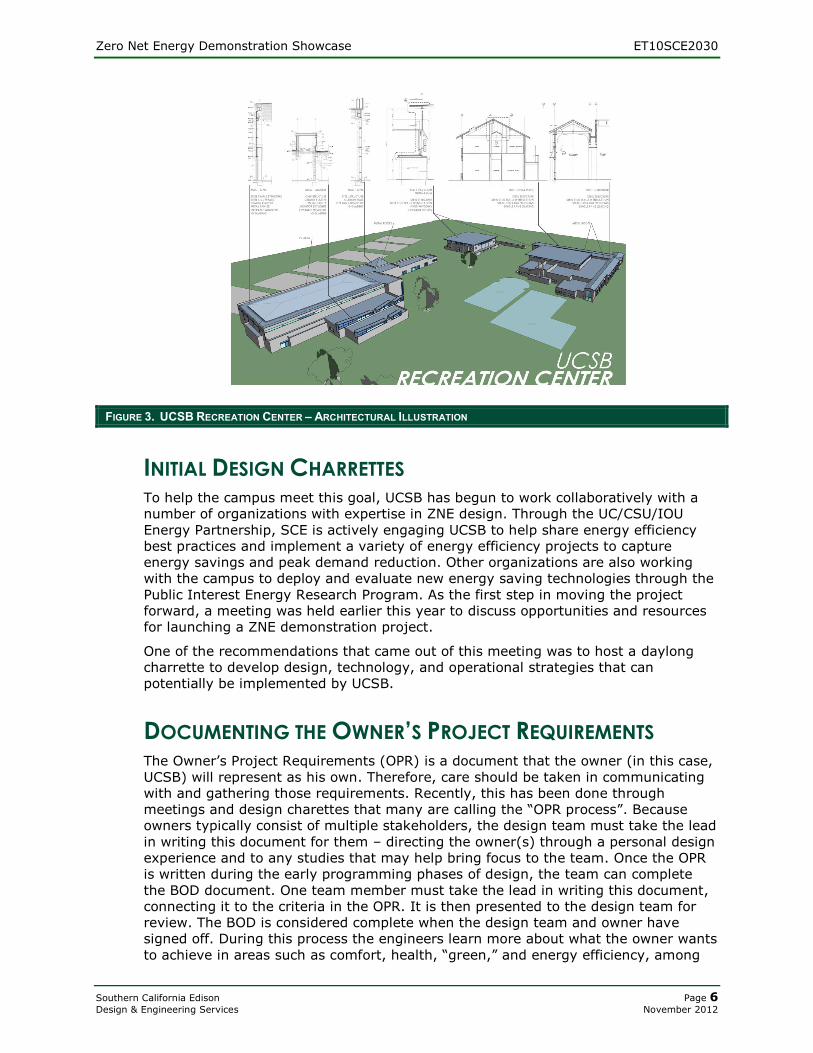
efficiency, reduce peak demand and accelerate efforts towards ZNE. Figure 3 depicts
an architectural drawing.
Zero Net Energy Demonstration Showcase ET10SCE2030
Southern California Edison Page 6
Design & Engineering Services November 2012
FIGURE 3. UCSB RECREATION CENTER – ARCHITECTURAL ILLUSTRATION
INITIAL DESIGN CHARRETTES To help the campus meet this goal, UCSB has begun to work collaboratively with a
number of organizations with expertise in ZNE design. Through the UC/CSU/IOU
Energy Partnership, SCE is actively engaging UCSB to help share energy efficiency
best practices and implement a variety of energy efficiency projects to capture
energy savings and peak demand reduction. Other organizations are also working
with the campus to deploy and evaluate new energy saving technologies through the
Public Interest Energy Research Program. As the first step in moving the project
forward, a meeting was held earlier this year to discuss opportunities and resources
for launching a ZNE demonstration project.
One of the recommendations that came out of this meeting was to host a daylong
charrette to develop design, technology, and operational strategies that can
potentially be implemented by UCSB.
DOCUMENTING THE OWNER’S PROJECT REQUIREMENTS The Owner’s Project Requirements (OPR) is a document that the owner (in this case,
UCSB) will represent as his own. Therefore, care should be taken in communicating
with and gathering those requirements. Recently, this has been done through
meetings and design charettes that many are calling the “OPR process”. Because
owners typically consist of multiple stakeholders, the design team must take the lead
in writing this document for them – directing the owner(s) through a personal design
experience and to any studies that may help bring focus to the team. Once the OPR
is written during the early programming phases of design, the team can complete
the BOD document. One team member must take the lead in writing this document,
connecting it to the criteria in the OPR. It is then presented to the design team for
review. The BOD is considered complete when the design team and owner have
signed off. During this process the engineers learn more about what the owner wants
to achieve in areas such as comfort, health, “green,” and energy efficiency, among
Zero Net Energy Demonstration Showcase ET10SCE2030
Southern California Edison Page 7
Design & Engineering Services November 2012
others. Often initial energy modeling ideas are derived in the OPR and then
presented in the BOD. The result of this process is a more complete picture of the
design intent before drafting is ever started. This document is included herein as
Attachment 3 in the Appendix.
DEVELOPMENT OF A MEASUREMENT & VERIFICATION PLAN Since the OPR included a sizable energy piece that included evaluating EEMs, the
project team needed first to develop a strategy for approach. In this case, the
development of a Measurement and Verification (M&V) plan prior to moving forward
with a technical analysis was essential. The M&V plan was largely based on the
International Performance Measurement and Verification Protocol (IPMVP). The
IPMVP is a guidance document describing common practices in measuring;
computing and reporting savings achieved by energy efficiency projects and
commonly used for reference in M&V plans. There are four general options in an
approach to IPMVP:
Option (A) Retrofit Isolation: Key Parameter Measurement
Option (B) Retrofit Isolation: All Parameter Measurement
Option (C) Whole Facility
Option (D) Calibrated Simulation
The M&V plan developed for this project, which was updated throughout the
preliminary project phase, was structured such that it addresses the following items:
Applicable M&V strategies for evaluating energy savings
IPMVP options A-D
Plan for preliminary savings estimations
Selected IPMVP options
EEM analysis (updated as conducted)
Plan for project implementation savings estimations
Recommended IMPVP options
Recommended metering/sub-metering strategies
The focus of the M&V plan was to outline the methodology used to establish credible
baseline energy usage and savings figures for a set of recommended EEMs that could
be easily transferred to the implementation phase. As indicated in the M&V plan,
EEMs were developed based on findings during a site audit, review of design
drawings, a utility bill analysis and interviews with site personnel. These suggested
EEMs were evaluated in accordance with this plan by SCE and its consultant,
Sustainable Environment Engineered Design (SEED), while adhering to the IPMVP.
Though SCE and SEED followed this M&V plan during the preliminary analysis phase,
the UCSB implementation guide remains flexible to allow for changes as the project
becomes more defined. Since the generic inputs and operating parameters of the
recommended EEMs used for the preliminary analysis typically change during the
implementation phase, a separate strategy for estimating “installed condition”
energy savings was developed for UCSB, should they decide to move forward with
any element of the project.
The M&V plan was developed for this project and included as Attachment 2.
Zero Net Energy Demonstration Showcase ET10SCE2030
Southern California Edison Page 8
Design & Engineering Services November 2012
DOCUMENTING THE BASIS OF DESIGN (BOD) After the presentation of EEMs and sample packages, the owners selected a project
consisting of those EEMs that aligned best with their original OPR. Based on their
feedback of presented EEMs, the owners documented their final selection of
measures to be packaged and implemented. This marks the transition from
programming to schematic design where a design team is selected and the project
moves into schematic and detailed design. The document that captures the work to
date and ensures a smooth transition into detailed design is commonly referred to as
the BOD. This document, written by the design team, lays out the concepts,
approach and execution necessary to achieve the project goals as determined
through the OPR and programming activities. Since consultants on the project team
are design engineers familiar with the significance of documenting the BOD, this
document was provided as part of the closing activities to ensure the work performed
as part of this evaluation was not lost in the transition to the project implementation
phase.
Zero Net Energy Demonstration Showcase ET10SCE2030
Southern California Edison Page 9
Design & Engineering Services November 2012
TECHNICAL APPROACH/TEST METHOD The development of an M&V plan was essential for providing a path of action for developing
appropriate EEMs and providing accurate energy savings estimates. This M&V plan is
Attachment 2 in the Appendix and provides the detailed strategy of the M&V technical
approach.
Prior to implementing the M&V plan, the project team conducted a site energy audit. This
audit, which covered all end uses, was conducted to understand any equipment deficiencies
and opportunities for EEM implementation. Facility design drawings were also reviewed to
understand current system configuration and to identify any EEM opportunities at the
system level. For example, if an outdated and inefficient system for heating and cooling is
used, an EEM opportunity may be to modernize it. Once identified, the project team
evaluated each EEM using the process outlined in the M&V plan and in accordance with the
IPMVP. Once a set of viable EEMs were identified, a separate evaluation was performed to
understand the feasibility of achieving ZNE through the combination of these EEMs and
renewable generation.
ENERGY AUDIT Since this project is energy-focused, the project team performed a detailed energy
audit on the recreational facility. This included all three buildings, the sports field and
other exterior lighting and the pools. The team made several site visits and
employed different experts. Lighting professionals assisted by walking the whole site
and pricing potential lighting retrofits. A general lack of lighting control was evident
at those initial meetings, and potential changes to lighting were viewed as “low
hanging fruit in that such improvements would be easy to make.
An audit team visited the site during the early stages of this OPR process to gather
information about the existing conditions of the building components that effect
energy consumption. Problems such as broken motorized operators of windows were
made apparent in early reports. Finally, a mechanical engineering team also made a
site visit. During this last walk-through, each piece of equipment was visited and
verified as meeting existing drawings. Occupant use was monitored and noted.
Systems were further diagrammed and studied in order to understand where the
building energy was being used. Finally, those systems were modeled in software to
see how they should interact, assisting in even further understanding of the systems.
BASELINE ENERGY ANALYSIS Multiple EEM opportunities were discovered through the site energy audit, the review
of design drawings and the utility bill analysis. Since multiple EEMs were identified,
IPMVP option D (which involves a computer simulation of whole-building energy use)
was deemed the most appropriate process for developing preliminary energy savings
estimates. The pre-construction energy use is determined by utility metering, which
is then used to calibrate the as-built model. Option D has many advantages,
including:
Allows study of potential EEMs without the high cost of installation
Zero Net Energy Demonstration Showcase ET10SCE2030
Southern California Edison Page 10
Design & Engineering Services November 2012
Can be used to study unique and groundbreaking ideas
Allows for the investigation of single EEMs on one building
Allows for the investigation of multiple EEMs on one building
Helps understand any interactive effects that may result from EEM
implementation.
Ensures compliance with the IPMVP
Reduces the need for costly and timely sub-metering of building systems
Can be used in the future to make educated decisions on remodel
The whole building-calibrated simulation method requires an accurate energy
simulation model of the as-built building to serve as the baseline. For the UCSB
recreation and aquatics complex, the baseline models were founded on as-built
drawings supplied by facilities staff. This includes the Pavilion, Rec-1 and Rec-2
facilities only. (Note that the pool and sports field lighting were evaluated separately
through IPMVP option A, as a calibrated simulation method (option D) is not
applicable.)
As stated in the IPMVP for option D: “Calibration is achieved by verifying that the
simulation model reasonably predicts the energy patterns of the facility by
comparing model results to a set of calibration data. This calibration data includes
measured energy data, independent variable, and static factor. Calibration of
building simulations is usually done with 12 monthly utility bills. These bills should be
from a period of stable operation. Detailed operating data from the facility helps to
develop the calibration model. This data will include operating characteristics,
occupancy, weather, loads and equipment efficiency”7
The goal of model calibration is not to exactly match the utility usage, but rather to
establish a “typical” usage profile for both electricity and gas by evaluating multiple
years of utility data. Though the goal is to find a period of stable operation in which
to calibrate the model, anomalies that are not considered typical usage still may be
found in the utility bills. For example, a gas leak during the month of January could
cause a large discrepancy between metered usage and modeled usage. Prior to
adjusting the model, utility bills from other similar years should be investigated to
confirm that the variance is not simply an error in the building model. Since a gas
leak would not be considered “typical,” the model should not be adjusted to match
this incongruity. Given that electricity and gas usage is rarely identical from year to
year, there will be some inherent errors in trying to match a typical year simulated
model to any figure for individual- or average-year metered usage.
For calibration purposes, monthly utility bill data supplied by SCE (electricity) and
facilities staff (gas) were used to adjust building usage parameters for the analysis
year 2010. Operating characteristics such as annual operating schedules for the
UCSB recreation facilities were obtained from building staff and through audits
performed by the M&V team to help tune the model. This includes information on
thermostat setpoints, lighting schedules, equipment schedules, equipment
efficiencies and equipment condition. Annual hours of operation and “special event”
calendars helped to calibrate the model and to add resolution to the occupancy
profiles entered into the computer simulation software. It should be noticed that
these parameters remain constant during the evaluation of all EEM runs to ensure
that an accurate snapshot of energy savings at the system level.
Typical Meteorological Year Three (TMY3) data will be used for all computer
simulations. Though it is optimum to use 2010-specific data to first calibrate the
Zero Net Energy Demonstration Showcase ET10SCE2030
Southern California Edison Page 11
Design & Engineering Services November 2012
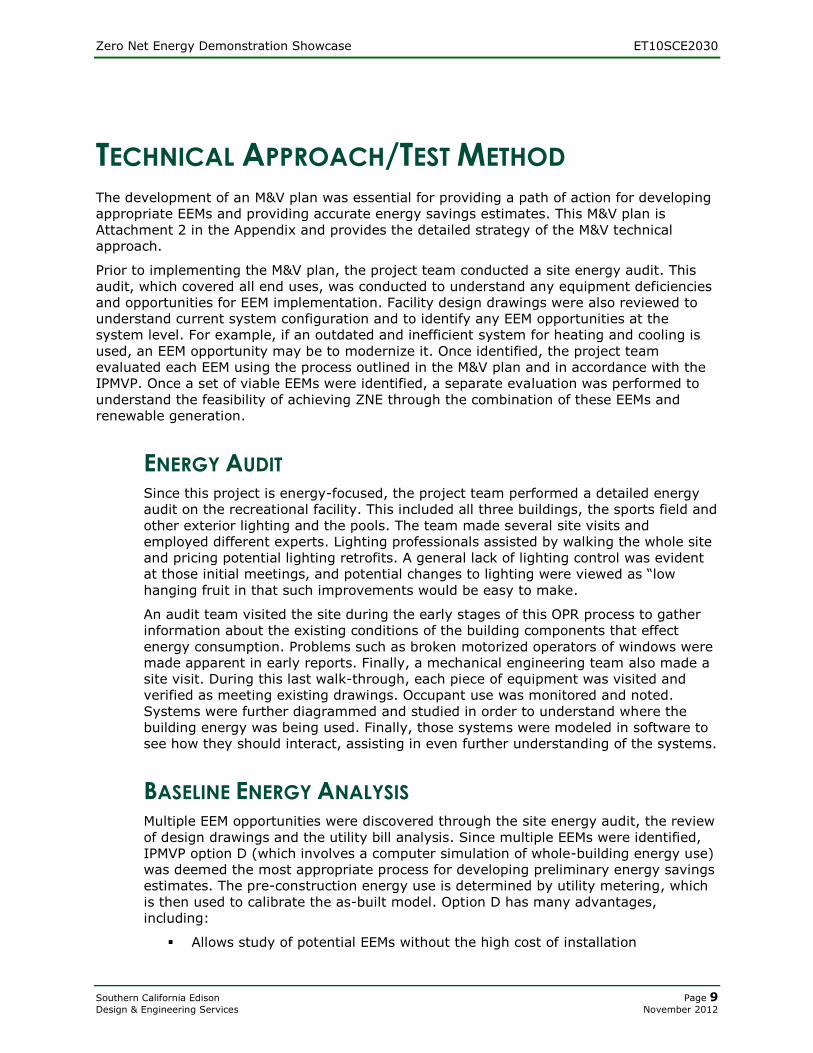
model, it was shown through a separate analysis (see Figure 4) that 2010 weather
data is similar to the TMY3 data.
FIGURE 4 . AVERAGE MONTHLY TEMPERATURE COMPARISON
There are a total of four meters, two for gas and two for electricity, which serve the
recreational facilities and aquatics complex. The Rec-1 gas and electricity meters
monitor the Rec-1 building, Pavilion building, exterior building lighting, sports field
lighting and the aquatics complex (which includes two pools and a spa). The Rec-2
gas and electricity meters monitor only the Rec-2 building. To complete the
calibration on Rec-2, certain operating parameters such as temperature setpoints,
occupancy schedule and lighting schedule were adjusted until energy usage outputs
from the model matched that of the utility bills. Since the Rec-1 buildings (including
the Pavilion) do not have their own meters, the calibration is more difficult. The
combination of all Rec-1 facilities onto one meter presents difficulties in model
calibration. Since Rec-2 has similar operating characteristics and schedules to the
Rec-1 buildings, the calibration technique used for Rec-2 could usefully be applied to
the Rec-1 facilities. For example, changes to Rec-2 occupancy, lighting or equipment
schedules would also be valid for the buildings and lighting covered by the Rec-1
meters since they are in the same area and have similar occupancy types and hours
of operation.
However, there are many system and envelope characteristics that are included in
the modeling software, major inputs used for modeling each of the buildings are
listed below.
BASELINE MODEL CONSTRUCTIONS
PAVILION
The Pavilion is a 12,960 square-foot (sf) building that includes one large multi-use
exercise area. The following building characteristics were relayed from the audit
team to the energy modeling team for baseline model construction:
R-9 wall insulation and R-27 roof insulation
Single pane windows
Lighting Power Density (LPD) of 1.6 watts per square foot (W/sf) interior
overhead lighting
Zero Net Energy Demonstration Showcase ET10SCE2030
Southern California Edison Page 12
Design & Engineering Services November 2012
A heating, ventilation, and air conditioning (HVAC) system with heat-only unit
ventilators containing hot water coils
REC-1 BUILDING
The Rec-1 building is a 40,722 sf building that includes large multi-use exercise
areas, a weight room, squash courts and offices. The following building
characteristics were relayed from the audit team to the energy modeling team for
baseline model construction:
R-9 insulated walls with no roof insulation
Single pane windows
LPD of 1.6 W/sf interior overhead lighting
An HVAC system with heat-only unit ventilators containing hot water coils and
DX cooling
REC-2 BUILDING
The Rec-2 building is a 51,024 sf building that includes large multi-use exercise
areas, a climbing wall and offices. The following building characteristics were relayed
from the audit team to the energy modeling team for baseline model construction:
R-11 insulated walls and R-30 insulated roof
A mixture of double- and single-pane windows
LPD of 1.0 W/sf interior overhead lighting
An HVAC system with heat-only unit ventilators containing hot water coils
OCCUPANCY CHARACTERISTICS
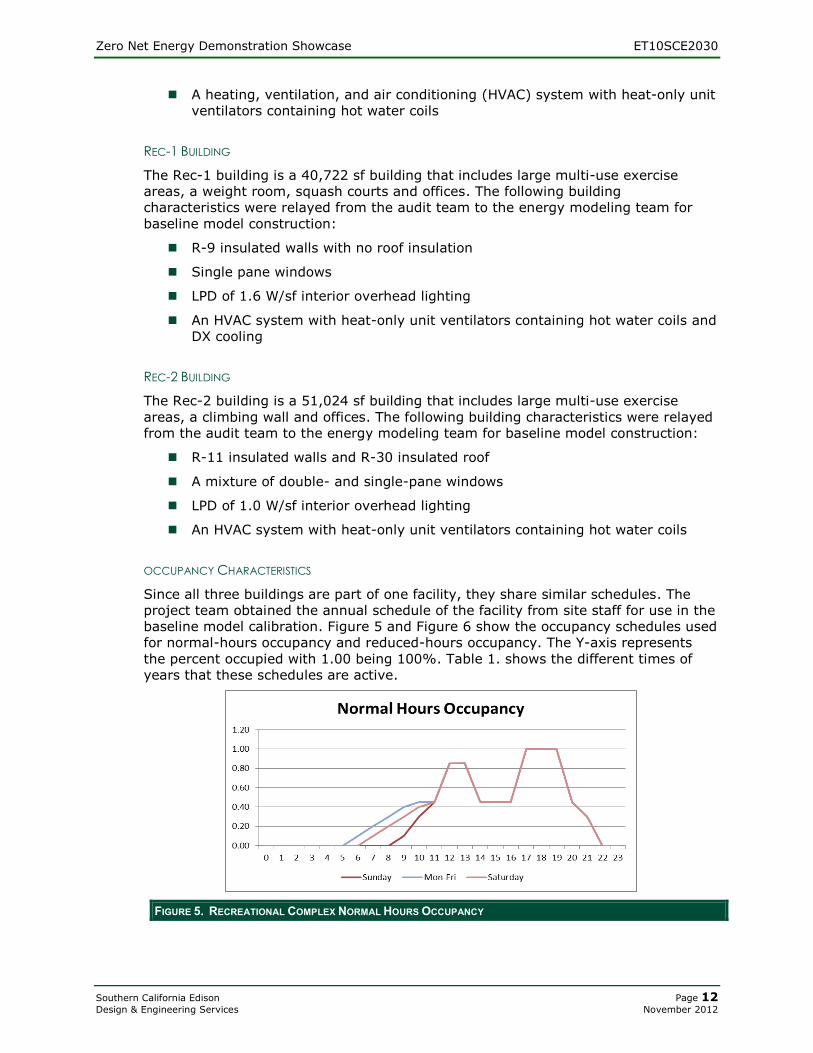
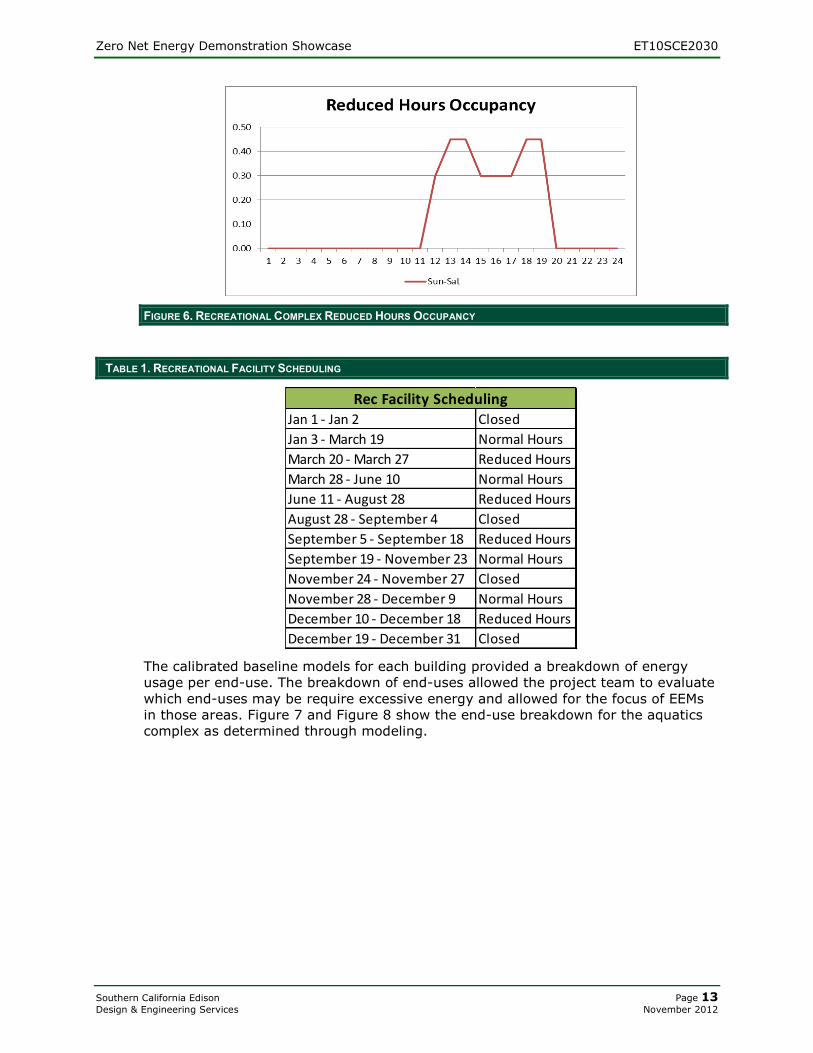
Since all three buildings are part of one facility, they share similar schedules. The
project team obtained the annual schedule of the facility from site staff for use in the
baseline model calibration. Figure 5 and Figure 6 show the occupancy schedules used
for normal-hours occupancy and reduced-hours occupancy. The Y-axis represents
the percent occupied with 1.00 being 100%. Table 1. shows the different times of
years that these schedules are active.
FIGURE 5. RECREATIONAL COMPLEX NORMAL HOURS OCCUPANCY
Zero Net Energy Demonstration Showcase ET10SCE2030
Southern California Edison Page 13
Design & Engineering Services November 2012
FIGURE 6. RECREATIONAL COMPLEX REDUCED HOURS OCCUPANCY
TABLE 1. RECREATIONAL FACILITY SCHEDULING
Jan 1 - Jan 2 Closed
Jan 3 - March 19 Normal Hours
March 20 - March 27 Reduced Hours
March 28 - June 10 Normal Hours
June 11 - August 28 Reduced Hours
August 28 - September 4 Closed
September 5 - September 18 Reduced Hours
September 19 - November 23 Normal Hours
November 24 - November 27 Closed
November 28 - December 9 Normal Hours
December 10 - December 18 Reduced Hours
December 19 - December 31 Closed
Rec Facility Scheduling
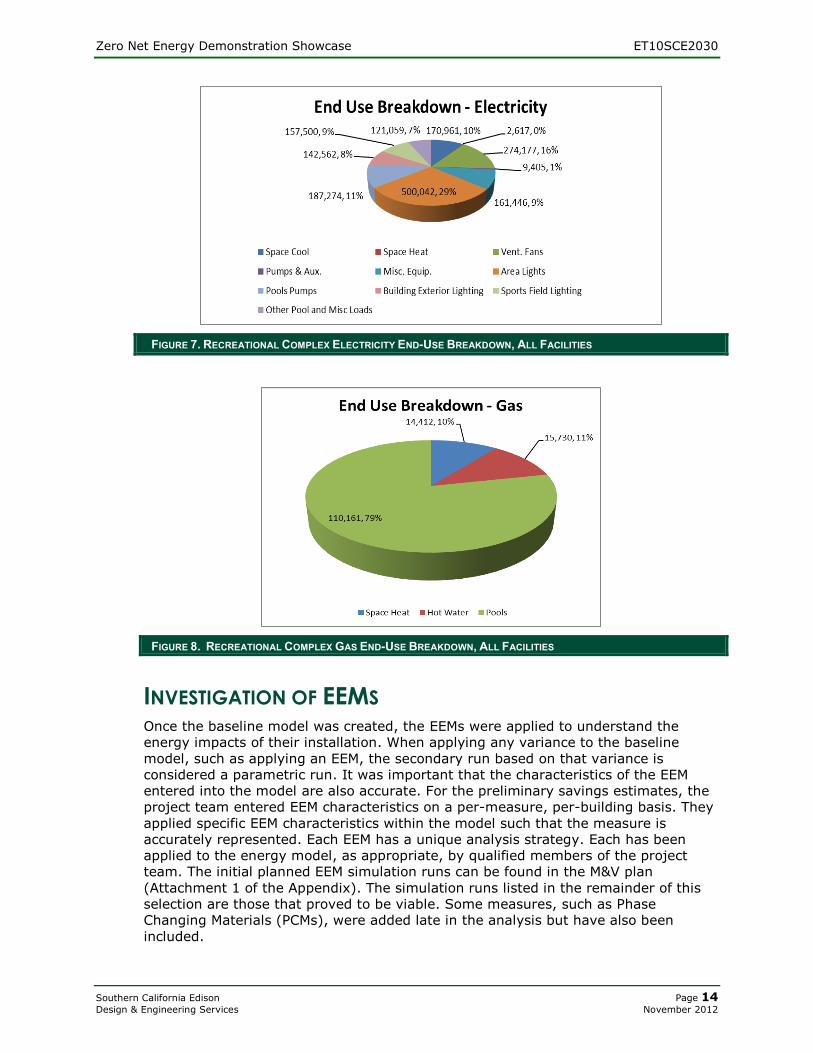
The calibrated baseline models for each building provided a breakdown of energy
usage per end-use. The breakdown of end-uses allowed the project team to evaluate
which end-uses may be require excessive energy and allowed for the focus of EEMs
in those areas. Figure 7 and Figure 8 show the end-use breakdown for the aquatics
complex as determined through modeling.
Zero Net Energy Demonstration Showcase ET10SCE2030
Southern California Edison Page 14
Design & Engineering Services November 2012
FIGURE 7. RECREATIONAL COMPLEX ELECTRICITY END-USE BREAKDOWN, ALL FACILITIES
FIGURE 8. RECREATIONAL COMPLEX GAS END-USE BREAKDOWN, ALL FACILITIES
INVESTIGATION OF EEMS Once the baseline model was created, the EEMs were applied to understand the
energy impacts of their installation. When applying any variance to the baseline
model, such as applying an EEM, the secondary run based on that variance is
considered a parametric run. It was important that the characteristics of the EEM
entered into the model are also accurate. For the preliminary savings estimates, the
project team entered EEM characteristics on a per-measure, per-building basis. They
applied specific EEM characteristics within the model such that the measure is
accurately represented. Each EEM has a unique analysis strategy. Each has been
applied to the energy model, as appropriate, by qualified members of the project
team. The initial planned EEM simulation runs can be found in the M&V plan
(Attachment 1 of the Appendix). The simulation runs listed in the remainder of this
selection are those that proved to be viable. Some measures, such as Phase
Changing Materials (PCMs), were added late in the analysis but have also been
included.
Zero Net Energy Demonstration Showcase ET10SCE2030
Southern California Edison Page 15
Design & Engineering Services November 2012
Both SCE staff and the consultant performed Modeling and energy analysis. As one
of the first ZNE projects that Southern California Edison’s Design and Engineering
Services (DES) has done as a demonstration showcase, the project team required
the utility expertise as provided by DES staff with outside design and energy
consultants familiar with a previous experience with utility type evaluation work.
INSULATION AND ENVELOPE MEASURES
For the evaluation of insulation measures, the project team included additional
insulation in the walls and roofs as appropriate. For example, since Rec-1 has areas
with no insulation, a parametric run was initiated that switched the existing un-
insulated walls and roofs to walls with R-19 insulation and a roof with R-38
insulation. Though this was tested on all three buildings, only Rec-1 demonstrated a
significant energy savings amount. Another measure evaluated was the addition of
PCM. PCMs are installed in the same fashion as insulations and the benefits are
similar. For example, with a standard wall on a hot day, the interior of the wall will
begin to heat up as the exterior temperature and solar loads rise for the day. With
the addition of the PCMs, this process is blocked because the energy that would
normally transfer through the wall is used to change the phase of the material within
the technology. As a result, the temperature on the inside surface of the material
remains constant. Modeling of new and innovative technologies such as PCMs is
difficult because the available software does not cover them. As a result, the person
modeling the energy is forced to evaluate the technology and create a system that
mirrors the thermal and operating characteristics of it. In the case of PCMs, the
technology is expected to perform similar to that of thermal mass. To estimate
energy savings of PCMs, the modeler added 6 inches of heavyweight concrete to the
interior of the building in all locations specified to receive the PCM retrofit.
The project team also evaluated the addition of skylights and other glazing options to
assist with daylighting. It is important to note that the addition of glazing to let in
more daylight without the necessary lighting controls could actually raise energy
usage since heat can more easily enter and leave the space. For this reason, all day-
lighting simulations were performed in parallel with the addition of daylight sensors,
which dimmed or deactivated lighting as necessary.
Some of the existing glazing is older single-pane construction. Parametric runs were
performed to understand the benefits of upgrading the glazing system, though
eventually this measure was dropped due to the estimated cost of implementation.
LIGHTING MEASURES
Five lighting measures were evaluated. This includes, at the request of UCSB, a
lighting project proposed by a consultant not affiliated with this project, which
comprised a lamp and fixture replacement to reduce the LPD in Rec-1 by 0.1 W/sf.
Other lighting projects include hiring a lighting design engineer to hit a design an
LPD target of 0.9 W/sf and a more aggressive project that achieves 0.5 W/sf. To
model this, the LPD in all areas was switched to 0.9 W/sf or 0.5 W/sf, depending on
which measure was being modeled. In reality, the LPD may vary per space but the
overall goal was for the building average to reach the target LPD and to understand
the energy savings associated with the upper and lower limits of design. Since the
high-level nature of these measures did not allow for the evaluation of lighting
illumination levels in each space, the design team is tasked with ensuring that
lighting levels do not drop below Title 24 code-required and standard IES values.
Zero Net Energy Demonstration Showcase ET10SCE2030
Southern California Edison Page 16
Design & Engineering Services November 2012
HVAC MEASURES
More than 13 HVAC measures were evaluated. This included quick, inexpensive
upgrades to existing systems such as replacing boilers and pumps and direct
expansion (DX) units and adding variable frequency drive (VFD) fans. Also included
were more in-depth system renovations such as replacing the existing DX and unit
ventilator systems with a new variable refrigerant flow (VRF) heat pump system that
could recover heat by modulating and directing the flow of refrigerant to provide
simultaneous heating and cooling. The project team felt that standard options for
HVAC upgrades were appropriate and thus did not capture the innovation that should
be associated with ZNE building. For this reason, more innovative HVAC options such
as ground source heat pumps, water loop heat pumps and connecting to the campus’
central plant were analyzed.
POOL MEASURES
Pool measures included improving the efficiency of the pool itself and designing
systems around the potential harvest of energy from the pool that is currently
wasted. Since it is an outdoor pool, a large amount of energy is used to heat it.
Based on estimates that over 110,000 therms are used to heat the pool, the project
team saw the potential to capture that previously wasted energy and, with a water
loop heat pump, use it to heat all three recreational facility buildings.
Analyzing this proposed strategy requires more steps than a typical model. First, a
large glass pyramid covering the pool is modeled separately from the other buildings.
This space is kept at 82°F during cold hours so pool does not lose heat, and it is left
open to the outdoors during warm hours to take advantage of ambient heat. In this
way, the focus for consistent temperature moves from the pool to maintaining the
heat in the pyramid itself. This is done with a water loop heat pump, similar to the
ones installed in the buildings. The waste heat that collects at the top of the pyramid
is captured and an air-water heat exchanger is used to exchange heat to the hot side
of the water loop heat pumps that serve the buildings. This recapturing of heat is the
key to utilizing the facility’s waste heat effectively. The solar thermal array is sized to
cover only the hot side of the water loop heat pump since waste heat may be
sufficient to cover the hot side of the water loop heat pumps installed in the building.
As with the other options, for areas that originally only had cooling, heating is locked
out. For areas with only heat, then cooling is locked out.
Modeling included a parametric run that changed all airside HVAC units to water loop
heat pumps. On the hot side of the water loop heat pump, a boiler will be installed.
Since waste heat from a separate energy model cannot be included in energy
modeling software runs, the gas usage for space heating is simply changed to zero
after the simulation runs, because all boiler loads would be replaced with waste heat
collected from the top of the pyramid. On the cold side, a fluid cooler will be
installed. A separate load calculation is used to understand how much waste heat is
available at the top of the pyramid, assuming approximately 60,000 cubic feet per
minute (cfm) of air moving through the pyramid at all times. This is done by creating
a separate model within the same software to understand the heating requirements
necessary to keep the glass pyramid at 82°F. A supplemental hand calculation was
performed to understand how much heat could be reclaimed from the top of the
pyramid. The energy savings figure was then determined by subtracting the new
“whole building” energy use from that of the baseline case.
Zero Net Energy Demonstration Showcase ET10SCE2030
Southern California Edison Page 17
Design & Engineering Services November 2012
SUMMARY OF INDIVIDUAL MEASURES
Measures were applied as appropriate to each of the buildings. Some of those listed
in the M&V plan were not found to be viable and were not presented to UCSB. After
modeling to understand energy savings was undertaken by the project team, a
separate financial analysis was performed to understand project paybacks as well as
life cycle costs. The final list of measures identified is included in the “Results”
section of this document.
POTENTIAL ZNE PATHWAYS Investigation of EEMs on a per-measure, per-building basis was only the first step in
presenting ZNE pathways to UCSB. To demonstrate a ZNE pathway, a package of
measures that can be applied to the recreation centers and aquatics complex as a
whole must be constructed. Some of the identified measures overlapped so they
were reduced based on the different implementation parameters. For example, since
the HVAC system is outdated in some areas of the buildings, there could be multiple
options for replacement. Identifying and analyzing the various projects with different
implementation parameters resulted in a number of options for UCSB to choose from
instead of only one option that may or may not be appropriate based on the needs of
the University. These implementation parameters include:
BUILDING-ONLY CONSTRUCTION PROJECTS
A Utility-Recommended Project package includes:
Measures as recommended by the utility based on the experience of their
energy efficiency experts. These measures include a combination of proven
technologies and innovative deep energy retrofits while considering
financial paybacks and potential utility incentives. The package of
measures was selected to maximize energy savings.
An Economic-Driven Project package includes:
Measures that show the quickest financial payback, low implementation
cost and life cycle cost. Implementation time and maximizing energy
savings were considered but not the priority.
A Quickest-Implementation package includes:
Measures that can be implemented quickly - Energy savings and project
financials were considered but not the priority.
BUILDING & POOL CONSTRUCTION PROJECTS
An Innovation/Pool-Focused Project package includes:
This project includes a package of measures, which cover proven
technologies and innovative retrofits that allow the building and pool
facilities to exchange energy with each other. Some measures harvest the
embodied energy of the pool to offset building usage and vice versa.
Measures were considered based on their innovative nature and energy
savings regardless of cost and implementation time.
Zero Net Energy Demonstration Showcase ET10SCE2030
Southern California Edison Page 18
Design & Engineering Services November 2012
ENERGY EFFICIENCY SUMMARY FOR COMBINED PACKAGES
Based on these parameters, the energy analysis strategy shifted to evaluate the
selected measures on a site basis. For example, one lighting project focuses on
reducing the LPD to 0.5 W/sf in each building. The total energy savings for the
project must include the energy savings associated with reducing the LPD in all three
buildings. This required a spreadsheet analysis, which takes the model outputs and
calculates total project savings. This was performed for all four packages. However,
this analysis estimates energy savings for recommended projects, the selection of
measures and a final package will be determined by UCSB. It is recommended that
once a set of measures has been determined by UCSB, these models should be
subjected to further energy modeling to understand interactive effects. Interactive
effects include the portions of energy savings lost by implementing multiple EEMs at
once. For example, if an HVAC measure were combined with a lighting measure, a
portion of energy savings would be discounted because the lighting load that the
HVAC system would have to offset has been reduced. For this reason, the cooling
energy savings when the two measures are modeled together will be less than if
modeled separately. Likewise, since improving lighting efficiency removes heat
addition to the space, heating load will increase in the winter causing HVAC systems
to use more energy. Due to this reason, the final energy savings figure may not be
represented exactly by the energy analysis performed as a part of this project. The
energy savings presented as part of this project are intended to provide an initial
estimate based on current operating conditions and identified EEMs. Since this
analysis was performed in the programming and preliminary schematic design phase,
it is expected that the EEMs will take a shape, which varies from assumptions made
in modeling. In addition, it is common for operating parameters to change after a
construction project. These variables, among others, may cause energy saving
figures to vary from initial estimates. It is highly recommended that UCSB continue
modeling as EEMs are selected and the project advances to ensure the most accurate
energy savings figures.
Zero Net Energy Demonstration Showcase ET10SCE2030
Southern California Edison Page 19
Design & Engineering Services November 2012
EVALUATIONS
RECEIVING FEEDBACK FROM THE OWNER Feedback from the University was then assembled into charts and data fields.
Rankings of systems and ideas quickly pointed to the viability and desirability of
certain systems and eliminated others. However, it also became immediately evident
that different systems would be applied to the building depending upon whatever
ideal the University and the construction implementation team decided to hold
highest. For example, the Utility (IOUs, Edison, etc.) holds the idea of a micro-DC
system high because of the tremendous potential that technology has to relieve the
grid of peak use energy. The technology, however, needs significant development to
be viable. When no “non-renewable energy” is held in highest regard, dampening the
impacts of the pool becomes of primary concern. Feedback was assembled and
organized into the BOD.
DOCUMENTING THE BOD The BOD (attachment 3 in the Appendix to this report) is the document that
summarizes the project activities, taking into account the original OPR and
subsequent feedback. This design-based document indicates a strategy for
conformance to the OPR. Furthermore, the BOD is used to document what systems
are to be commissioned by the commissioning agent. The BOD represents the design
intent and it is used to accept submittals for the construction team. The BOD is
meant to describe the system to be commissioned as well as the design assumptions
that are not otherwise included in the construction documents. The document should
be updated at each step of the design process.
The BOD in this case is only near completion, because no design team has been
chosen. Input from the design team and adjustments to the BOD need to be
implemented before design documents are underway. In this particular project, four
different design paths have been presented, and only one path can be used to
continue. ZNE projects in particular are sensitive to a well-written and -studied BOD
because the goal is to balance energy used with energy created – in cases where
determining energy used has been difficult in the past.
Zero Net Energy Demonstration Showcase ET10SCE2030
Southern California Edison Page 20
Design & Engineering Services November 2012
RESULTS
RECOMMENDATION OF EEMS Over 30 EEMS were identified and evaluated during the preliminary analysis. Some
measures were unique to one of the three buildings, while others could apply to all
buildings. Other measures specifically addressed the pool. Though some EEMs
seemed appropriate before modeling, a number of them dropped out based on a lack
of energy savings potential. Others dropped out based on measure implementation
cost. All EEMs were evaluated as described in the “Technical Approach” section of
this report. Table 1. shows the final list of EEMs as presented to UCSB and organized
by implementation time.
Zero Net Energy Demonstration Showcase ET10SCE2030
Southern California Edison ET10SCE2030_ 11.24.2012_SH_R01 Page 21
Design & Engineering Services November 2012
TABLE 2. EEM LIST AND IMPLEMENTATION CHARACTERISTICS
Peak
Period
Savings
Energy
Savings
Energy
Savings
Total
GHG
Savings
Total
Annual
Cost
Savings
Measure
Cost
Simple
paybackNet ROI LCC
kW kWh Therm lbs-CO2 $ $ yr % $
1a Consultant Lighting Project Rec 1 3.6 28,609 -251 17,955 $2,871 $ 36,895.00 12.85 8% $12,217.56
3 Install/Fix Daylight Sensors Rec 1 and Rec 2 19.6 90,553 -562 59,389 $9,343 $ 66,496.69 7.12 14% $17,747.07
7 Increase Wall Insulation to R-19 Rec 1 0.6 3,714 1,020 13,909 $1,531 $ 15,033.63 9.82 10% -$4,040.28
8 Increase RoofInsulation to R-38 Rec 1 8.3 18,307 3,907 56,233 $6,311 $ 61,530.73 9.75 10% -$17,124.14
9 Adjust Tstat Setpoint by 2 deg F All Buildings 2.9 21,624 3,081 49,549 $5,768 $ 750.00 0.13 769% -$43,786.96
10Add Evaporative Precool system to DX Unit Condensers ( Rec1 and Rec
2 Only)Rec 1 and Rec 2
5.8 23,559 -1 17,049 $2,590 $ 27,047.31 10.44 10% $25,071.13
11 Add VFD to Boiler P3_4 Pavillion 0.3 5,693 -195 1,977 $412 $ 5,007.65 12.16 8% $1,253.02
12 Demand Control Ventilation Rec 1 and Rec 2 0.1 20,140 1,947 36,001 $4,357 $ 11,232.84 2.58 39% -$19,322.84
1 Lighting Only project - Reduce LPD to 0.9W/sf All Buildings 32.9 200,829 -1,846 125,118 $20,061 $ 213,434.10 10.64 9% $41,818.68
2 Lighting Only Project Reduce LPD to 0.5W/sf (All Buildings) All Buildings 45.1 284,303 -2,672 176,477 $28,334 $ 816,759.21 28.83 3% $426,266.69
4 Install Skylights & Daylight Sensors All Buildings 26.5 117,399 -415 80,446 $12,457 $ 132,076.14 10.60 9% $52,099.12
5 Add High Performance Glazing (All Buildings) All Buildings 2.5 36,812 2,153 50,339 $6,418 $ 545,476.11 85.00 1% $465,498.38
6 PCM-Thermal Mass All Buildings 3.6 21,893 1,825 35,928 $4,416 $ 1,262,615.02 285.94 0% $1,207,585.26
13 Sw itch to 99% eff Cond Mod Boilers Pavillion and Rec 1 Only 0.4 0 632 6,952 $695 $ 30,596.90 44.01 4% $21,933.17
23 Solar Pool Pumping System Pool Only 21.4 120,255 0 87,079 $13,228 $ 138,070.00 10.44 10% $2,843.30
14Replace DX Coils w ith CHW coils, McQuay Frictionless Chiller VSD drives,
Primary/Secondary Pumps/Waterside Economizer (Rec1 and Rec 2 Only)Rec 1 and Rec 2
15.6 46,704 1,739 52,948 $7,050 $ 304,972.77 43.26 2% $229,572.16
15Sw itch to 99% eff Cond Mod Boilers/EMS Control/VFD Pump/Replace
Furnaces w ith HW Coils/Heat Exchanger for DHWAll Buildings
2.5 -2,024 2,370 24,604 $2,384 $ 97,700.41 40.98 2% $67,986.02
16 Install VRF Heat Pump System All Buildings 24.8 105,319 14,370 234,334 $27,392 $ 364,112.72 13.29 8% $60,133.37
17 Water Loop HP Option 1 -99% Eff Boiler and Fluid Cooler All Buildings 4.1 70,662 10,184 163,192 $18,975 $ 473,751.61 24.97 4% $274,665.06
18 Water Loop HP Option 2 -Ground Source Heat Pump All Buildings 15.7 115,183 14,383 241,619 $28,491 $ 1,065,942.28 37.41 3% $748,262.72
19 Water Loop HP Option 3 -Solar Thermal (hot) and Fluid Cooler (cold) All Buildings 1.4 67,085 14,372 206,670 $23,189 $ 1,729,015.58 74.56 1% $1,477,421.63
19aWater Loop HP (PVVT) Option 3a -Solar Thermal (hot) Fluid Cooler (cold)
for buildings + Solar Thermal Panels for Pool*All Buildings
1.4 67,085 112,790 1,238,778 $123,778 $10,196,605.92 82.38 1% $8,698,916.30
20Water Loop HP Option 4 - Solar Thermal (hot) and Fluid Cooler (cold) +
Glass Pyramid All Buildings
-1.9 -154,129 112,790 1,129,082 $107,115 $ 4,175,665.59 38.98 3% $2,440,627.83
21 Install Solar To cover DHW Load Rec 1 and Rec 2 0.0 0 15,731 173,041 $17,304 $ 584,225.00 33.76 3% $412,918.09
22Micro Direct DC System (All Buildings' Fans and Open Gym Area Lighting)
- Full Package*All Buildings
123.3 586,296 -1,336 409,853 $63,023 $ 1,614,455.44 25.62 4% $844,004.71
22a Direct DC Change Existing Gym/MAC lighting to LED ⱡ All Buildings 40.6 154,793 -1,336 97,393 $15,558 $ 347,573.00 22.34 4% $156,182.98
22b Direct DC Change AC Induction Supply Fan Motors to DC ECM ⱡ All Buildings 20.1 145,040 0 105,026 $15,954 $ 14,170.56 0.89 113% -$182,164.09
22c Micro Direct DC System after EEM (22a and 22b) installation* All Buildings 62.6 286,463 0 207,434 $31,511 $1,252,712 39.75 3% $862,508.49
ⱡ Savings/Project only valid if installed as part of the Micro DC system
** This figure assumes that both 22a and 22b have been installed
*Includes solar to cover all fan loads for three buildings and lighting for Open Gym Areas, can be combined with 22a, 22b to reduce solar plant requirements
Implementation Time <1 year
Implementation Time 1-2 years
Implementation Time 2-4 years
Project Payback
No. Measure Description
Energy Savings and Cost Savings
Applicable Buildings
Zero Net Energy Demonstration Showcase ET10SCE2030
Southern California Edison Page 22
Design & Engineering Services November 2012
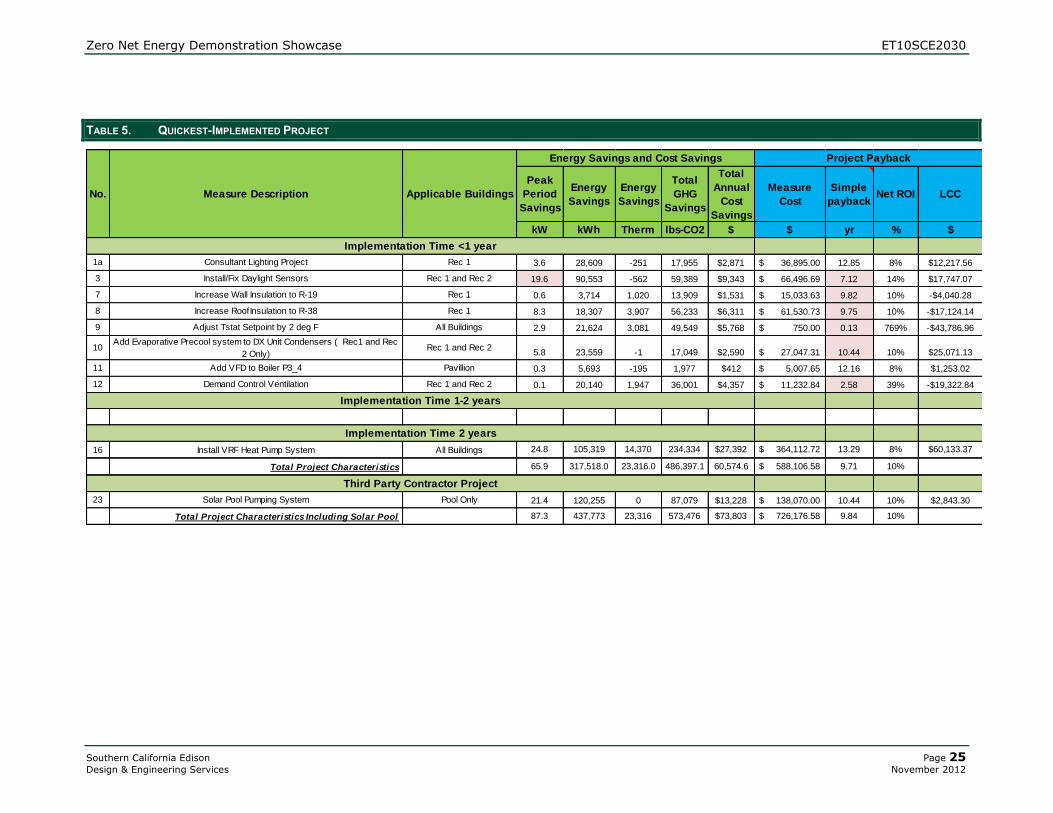
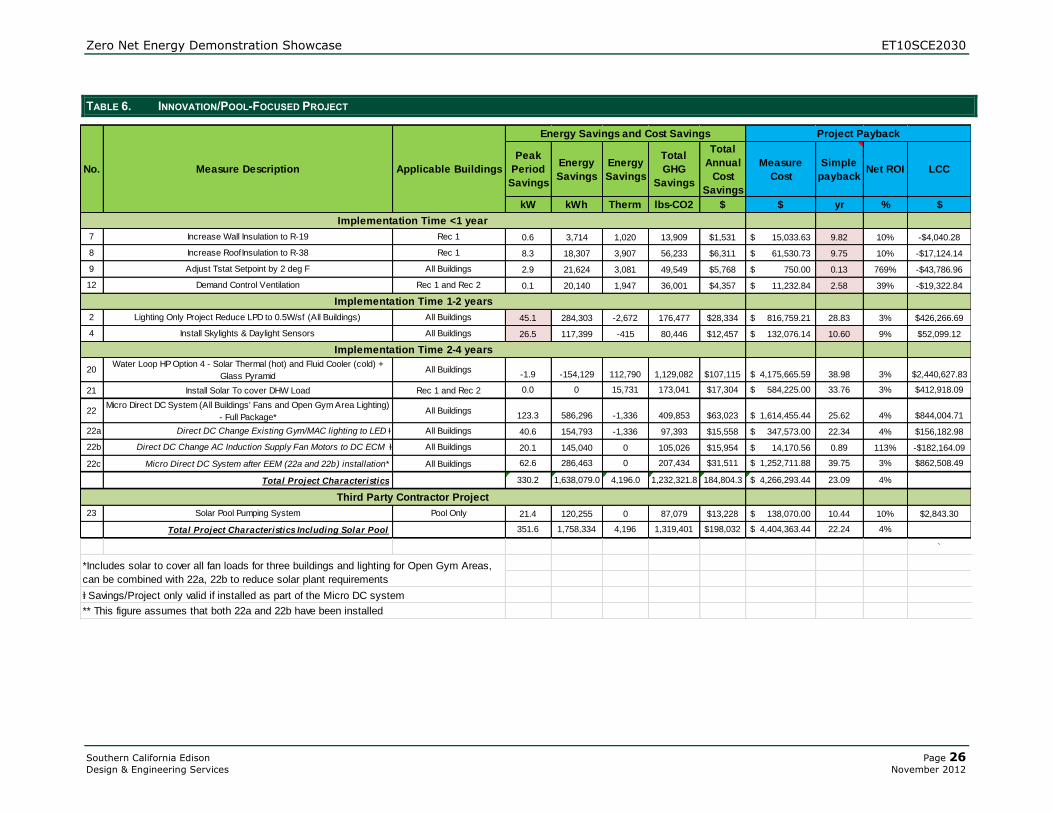
RECOMMENDATION OF POTENTIAL ZNE PATHWAYS The presentation of EEMs on a per-measure basis allowed for comparison between
the measures while showing the specifics of each technology and range of energy
that can be saved across the various end-uses. Since the ultimate goal of this project
is to demonstrate the feasibility of achieving ZNE for this facility, a number of EEM
packages were established to demonstrate that there are multiple pathways to
achieving ZNE. Of course, one potential pathway is to evaluate the current energy
usage of the buildings and size a solar plant accordingly. The project team did not
feel this fully embraced the ZNE concept, which includes reducing waste and using
most energy efficient technologies. As a result, four sets of EEM packages were
assembled. To complete the ZNE project, these EEMs should be combined with a
properly sized renewable generation plant. The implementation of the EEMs first
reduces the baseline energy usage, making the renewable generation plant size
smaller. These potential ZNE pathways are expected to be adjusted by UCSB to
ensure that the packaged EEMs fit their needs for the facility. Tables 3-6 show the
packaged EEMs and the respective energy savings. To achieve ZNE, the total energy
savings for the packaged EEMs would be subtracted from the baseline. The
remainder of electricity would need to be addressed through renewable generation.
Zero Net Energy Demonstration Showcase ET10SCE2030
Southern California Edison Page 23
Design & Engineering Services November 2012
TABLE 3. UTILITY-RECOMMENDED PROJECT
Peak
Period
Savings
Energy
Savings
Energy
Savings
Total
GHG
Savings
Total
Annual
Cost
Savings
Measure
Cost
Simple
paybackNet ROI LCC
kW kWh Therm lbs-CO2 $ $ yr % $
7 Increase Wall Insulation to R-19 Rec 1 0.6 3,714 1,020 13,909 $1,531 $ 15,033.63 9.82 10% -$4,040.28
8 Increase RoofInsulation to R-38 Rec 1 8.3 18,307 3,907 56,233 $6,311 $ 61,530.73 9.75 10% -$17,124.14
9 Adjust Tstat Setpoint by 2 deg F All Buildings 2.9 21,624 3,081 49,549 $5,768 $ 750.00 0.13 769% -$43,786.96
12 Demand Control Ventilation Rec 1 and Rec 2 0.1 20,140 1,947 36,001 $4,357 $ 11,232.84 2.58 39% -$19,322.84
2 Lighting Only Project Reduce LPD to 0.5W/sf (All Buildings) All Buildings 45.1 284,303 -2,672 176,477 $28,334 $ 816,759.21 28.83 3% $426,266.69
4 Install Skylights & Daylight Sensors All Buildings 26.5 117,399 -415 80,446 $12,457 $ 132,076.14 10.60 9% $52,099.12
18 Water Loop HP Option 2 -Ground Source Heat Pump All Buildings 15.7 115,183 14,383 241,619 $28,491 $ 1,065,942.28 37.41 3% $748,262.72
21 Install Solar To cover DHW Load Rec 1 and Rec 2 0.0 0 15,731 173,041 $17,304 $ 584,225.00 33.76 3% $412,918.09
22Micro Direct DC System (All Buildings' Fans and Open Gym Area Lighting)
- Full Package*All Buildings
123.3 586,296 -1,336 409,853 $63,023 $ 1,614,455.44 25.62 4% $844,004.71
22a Direct DC Change Existing Gym/MAC lighting to LED ⱡ All Buildings 40.6 154,793 -1,336 97,393 $15,558 $ 347,573.00 22.34 4% $156,182.98
22b Direct DC Change AC Induction Supply Fan Motors to DC ECM ⱡ All Buildings 20.1 145,040 0 105,026 $15,954 $ 14,170.56 0.89 113% -$182,164.09
22c Micro Direct DC System after EEM (22a and 22b) installation* All Buildings 62.6 286,463 0 207,434 $31,511 $ 1,252,711.88 39.75 3% $862,508.49
Total Project Characteristics 222.6 1,166,966.0 35,646.0 1,237,129.4 $167,576.9 $ 4,302,005.28 25.67 4%
23 Solar Pool Pumping System Pool Only 21.4 120,255 0 87,079 $13,228 $ 138,070.00 10.44 10% $2,843.30
Total Project Characteristics Including Solar Pool 244.0 1,287,221 35,646 1,324,208 $180,805 $ 4,440,075.28 24.56 4%
ⱡ Savings/Project only valid if installed as part of the Micro DC system
** This figure assumes that both 22a and 22b have been installed
Implementation Time <1 year
Implementation Time 1-2 years
Implementation Time 2-4 years
No. Measure Description Applicable Buildings
Energy Savings and Cost Savings Project Payback
Third Party Contractor Project
*Includes solar to cover all fan loads for three buildings and lighting for Open Gym Areas,
can be combined with 22a, 22b to reduce solar plant requirements
Zero Net Energy Demonstration Showcase ET10SCE2030
Southern California Edison Page 24
Design & Engineering Services November 2012
TABLE 4. ECONOMIC-DRIVEN PROJECT
Peak
Period
Savings
Energy
Savings
Energy
Savings
Total
GHG
Savings
Total
Annual
Cost
Savings
Measure
Cost
Simple
paybackNet ROI LCC
kW kWh Therm lbs-CO2 $ $ yr % $
3 Install/Fix Daylight Sensors Rec 1 and Rec 2 19.6 90,553 -562 59,389 $9,343 $ 66,496.69 7.12 14% $17,747.07
7 Increase Wall Insulation to R-19 Rec 1 0.6 3,714 1,020 13,909 $1,531 $ 15,033.63 9.82 10% -$4,040.28
8 Increase RoofInsulation to R-38 Rec 1 8.3 18,307 3,907 56,233 $6,311 $ 61,530.73 9.75 10% -$17,124.14
9 Adjust Tstat Setpoint by 2 deg F All Buildings 2.9 21,624 3,081 49,549 $5,768 $ 750.00 0.13 769% -$43,786.96
10Add Evaporative Precool system to DX Unit Condensers ( Rec1 and Rec
2 Only)Rec 1 and Rec 2
5.8 23,559 -1 17,049 $2,590 $ 27,047.31 10.44 10% $25,071.13
12 Demand Control Ventilation Rec 1 and Rec 2 0.1 20,140 1,947 36,001 $4,357 $ 11,232.84 2.58 39% -$19,322.84
1 Lighting Only project - Reduce LPD to 0.9W/sf All Buildings 32.9 200,829 -1,846 125,118 $20,061 $ 213,434.10 10.64 9% $41,818.68
16 Install VRF Heat Pump System All Buildings 24.8 105,319 14,370 234,334 $27,392 $ 364,112.72 13.29 8% $60,133.37
Total Project Characteristics 94.9 484,045.0 21,916.0 591,582.7 77,352.6 $ 759,638.03 9.82 10%
23 Solar Pool Pumping System Pool Only 21.4 120,255 0 87,079 $13,228 $ 138,070.00 10.44 10% $2,843.30
Total Project Characteristics Including Solar Pool 116.3 604,300 21,916 678,662 $90,581 $ 897,708.03 9.91 10%
Third Party Contractor Project
Implementation Time <1 year
Implementation Time 1-2 years
Implementation Time 2-4 years
No. Measure Description Applicable Buildings
Energy Savings and Cost Savings Project Payback
Zero Net Energy Demonstration Showcase ET10SCE2030
Southern California Edison Page 25
Design & Engineering Services November 2012
TABLE 5. QUICKEST-IMPLEMENTED PROJECT
Peak
Period
Savings
Energy
Savings
Energy
Savings
Total
GHG
Savings
Total
Annual
Cost
Savings
Measure
Cost
Simple
paybackNet ROI LCC
kW kWh Therm lbs-CO2 $ $ yr % $
1a Consultant Lighting Project Rec 1 3.6 28,609 -251 17,955 $2,871 $ 36,895.00 12.85 8% $12,217.56
3 Install/Fix Daylight Sensors Rec 1 and Rec 2 19.6 90,553 -562 59,389 $9,343 $ 66,496.69 7.12 14% $17,747.07
7 Increase Wall Insulation to R-19 Rec 1 0.6 3,714 1,020 13,909 $1,531 $ 15,033.63 9.82 10% -$4,040.28
8 Increase RoofInsulation to R-38 Rec 1 8.3 18,307 3,907 56,233 $6,311 $ 61,530.73 9.75 10% -$17,124.14
9 Adjust Tstat Setpoint by 2 deg F All Buildings 2.9 21,624 3,081 49,549 $5,768 $ 750.00 0.13 769% -$43,786.96
10Add Evaporative Precool system to DX Unit Condensers ( Rec1 and Rec
2 Only)Rec 1 and Rec 2
5.8 23,559 -1 17,049 $2,590 $ 27,047.31 10.44 10% $25,071.13
11 Add VFD to Boiler P3_4 Pavillion 0.3 5,693 -195 1,977 $412 $ 5,007.65 12.16 8% $1,253.02
12 Demand Control Ventilation Rec 1 and Rec 2 0.1 20,140 1,947 36,001 $4,357 $ 11,232.84 2.58 39% -$19,322.84
16 Install VRF Heat Pump System All Buildings 24.8 105,319 14,370 234,334 $27,392 $ 364,112.72 13.29 8% $60,133.37
Total Project Characteristics 65.9 317,518.0 23,316.0 486,397.1 60,574.6 $ 588,106.58 9.71 10%
23 Solar Pool Pumping System Pool Only 21.4 120,255 0 87,079 $13,228 $ 138,070.00 10.44 10% $2,843.30
Total Project Characteristics Including Solar Pool 87.3 437,773 23,316 573,476 $73,803 $ 726,176.58 9.84 10%
Third Party Contractor Project
Implementation Time <1 year
Implementation Time 1-2 years
Implementation Time 2 years
No. Measure Description Applicable Buildings
Energy Savings and Cost Savings Project Payback
Zero Net Energy Demonstration Showcase ET10SCE2030
Southern California Edison Page 26
Design & Engineering Services November 2012
TABLE 6. INNOVATION/POOL-FOCUSED PROJECT
Peak
Period
Savings
Energy
Savings
Energy
Savings
Total
GHG
Savings
Total
Annual
Cost
Savings
Measure
Cost
Simple
paybackNet ROI LCC
kW kWh Therm lbs-CO2 $ $ yr % $
7 Increase Wall Insulation to R-19 Rec 1 0.6 3,714 1,020 13,909 $1,531 $ 15,033.63 9.82 10% -$4,040.28
8 Increase RoofInsulation to R-38 Rec 1 8.3 18,307 3,907 56,233 $6,311 $ 61,530.73 9.75 10% -$17,124.14
9 Adjust Tstat Setpoint by 2 deg F All Buildings 2.9 21,624 3,081 49,549 $5,768 $ 750.00 0.13 769% -$43,786.96
12 Demand Control Ventilation Rec 1 and Rec 2 0.1 20,140 1,947 36,001 $4,357 $ 11,232.84 2.58 39% -$19,322.84
2 Lighting Only Project Reduce LPD to 0.5W/sf (All Buildings) All Buildings 45.1 284,303 -2,672 176,477 $28,334 $ 816,759.21 28.83 3% $426,266.69
4 Install Skylights & Daylight Sensors All Buildings 26.5 117,399 -415 80,446 $12,457 $ 132,076.14 10.60 9% $52,099.12
20Water Loop HP Option 4 - Solar Thermal (hot) and Fluid Cooler (cold) +
Glass Pyramid All Buildings
-1.9 -154,129 112,790 1,129,082 $107,115 $ 4,175,665.59 38.98 3% $2,440,627.83
21 Install Solar To cover DHW Load Rec 1 and Rec 2 0.0 0 15,731 173,041 $17,304 $ 584,225.00 33.76 3% $412,918.09
22Micro Direct DC System (All Buildings' Fans and Open Gym Area Lighting)
- Full Package*All Buildings
123.3 586,296 -1,336 409,853 $63,023 $ 1,614,455.44 25.62 4% $844,004.71
22a Direct DC Change Existing Gym/MAC lighting to LED ⱡ All Buildings 40.6 154,793 -1,336 97,393 $15,558 $ 347,573.00 22.34 4% $156,182.98
22b Direct DC Change AC Induction Supply Fan Motors to DC ECM ⱡ All Buildings 20.1 145,040 0 105,026 $15,954 $ 14,170.56 0.89 113% -$182,164.09
22c Micro Direct DC System after EEM (22a and 22b) installation* All Buildings 62.6 286,463 0 207,434 $31,511 $ 1,252,711.88 39.75 3% $862,508.49
Total Project Characteristics 330.2 1,638,079.0 4,196.0 1,232,321.8 184,804.3 $ 4,266,293.44 23.09 4%
23 Solar Pool Pumping System Pool Only 21.4 120,255 0 87,079 $13,228 $ 138,070.00 10.44 10% $2,843.30
Total Project Characteristics Including Solar Pool 351.6 1,758,334 4,196 1,319,401 $198,032 $ 4,404,363.44 22.24 4%
`
*Includes solar to cover all fan loads for three buildings and lighting for Open Gym Areas,
can be combined with 22a, 22b to reduce solar plant requirements
ⱡ Savings/Project only valid if installed as part of the Micro DC system
** This figure assumes that both 22a and 22b have been installed
Implementation Time <1 year
Implementation Time 1-2 years
Implementation Time 2-4 years
No. Measure Description Applicable Buildings
Energy Savings and Cost Savings Project Payback
Third Party Contractor Project
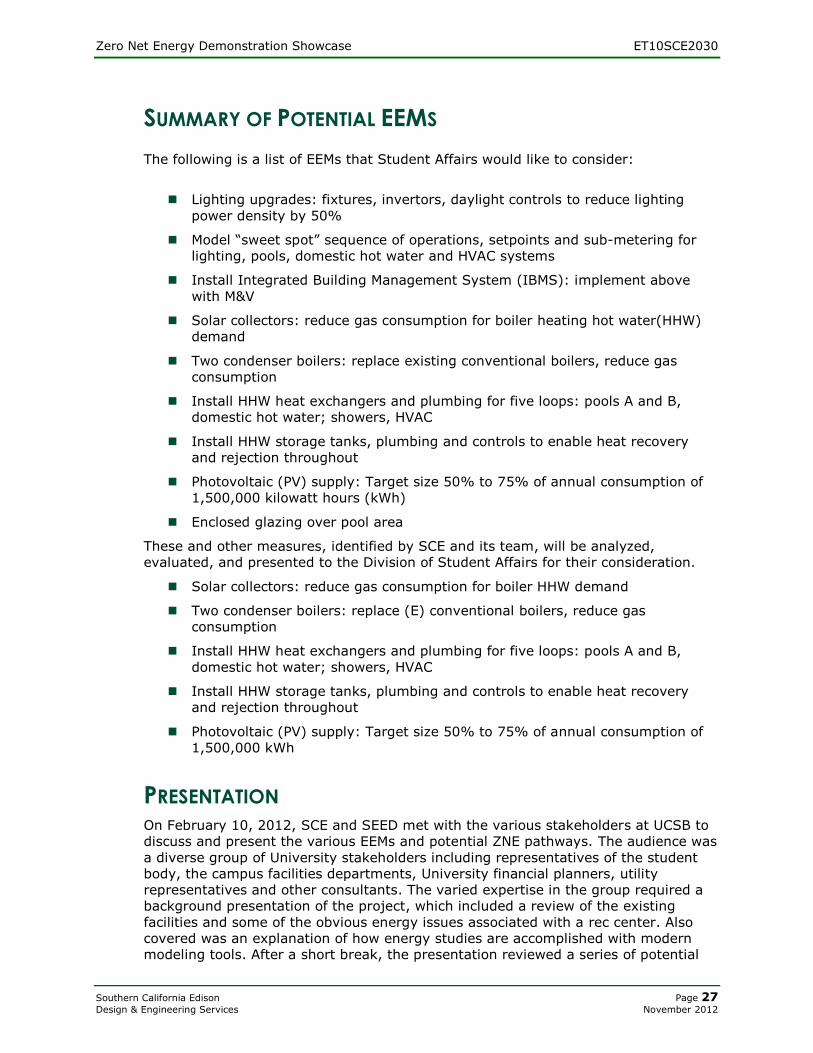
Zero Net Energy Demonstration Showcase ET10SCE2030
Southern California Edison Page 27
Design & Engineering Services November 2012
SUMMARY OF POTENTIAL EEMS
The following is a list of EEMs that Student Affairs would like to consider:
Lighting upgrades: fixtures, invertors, daylight controls to reduce lighting
power density by 50%
Model “sweet spot” sequence of operations, setpoints and sub-metering for
lighting, pools, domestic hot water and HVAC systems
Install Integrated Building Management System (IBMS): implement above
with M&V
Solar collectors: reduce gas consumption for boiler heating hot water(HHW)
demand
Two condenser boilers: replace existing conventional boilers, reduce gas
consumption
Install HHW heat exchangers and plumbing for five loops: pools A and B,
domestic hot water; showers, HVAC
Install HHW storage tanks, plumbing and controls to enable heat recovery
and rejection throughout
Photovoltaic (PV) supply: Target size 50% to 75% of annual consumption of
1,500,000 kilowatt hours (kWh)
Enclosed glazing over pool area
These and other measures, identified by SCE and its team, will be analyzed,
evaluated, and presented to the Division of Student Affairs for their consideration.
Solar collectors: reduce gas consumption for boiler HHW demand
Two condenser boilers: replace (E) conventional boilers, reduce gas
consumption
Install HHW heat exchangers and plumbing for five loops: pools A and B,
domestic hot water; showers, HVAC
Install HHW storage tanks, plumbing and controls to enable heat recovery
and rejection throughout
Photovoltaic (PV) supply: Target size 50% to 75% of annual consumption of
1,500,000 kWh
PRESENTATION On February 10, 2012, SCE and SEED met with the various stakeholders at UCSB to
discuss and present the various EEMs and potential ZNE pathways. The audience was
a diverse group of University stakeholders including representatives of the student
body, the campus facilities departments, University financial planners, utility
representatives and other consultants. The varied expertise in the group required a
background presentation of the project, which included a review of the existing
facilities and some of the obvious energy issues associated with a rec center. Also
covered was an explanation of how energy studies are accomplished with modern
modeling tools. After a short break, the presentation reviewed a series of potential

Zero Net Energy Demonstration Showcase ET10SCE2030
Southern California Edison Page 28
Design & Engineering Services November 2012
EEMs that could be applied to the building. Explanations of how these particular
EEMs were modeled were provided. A lunch break was taken before all the concepts
were coalesced at the end to present an idea of what a zero energy facility on the
UCSB campus might look like. During the presentation, stakeholders were expected
to make notes about each technology and apply rankings to the ideas that represent
the highest desires of the University. This data is tabulated and ranked to determine
which EEMs were most popular amongst the facilities and university personnel. The
final recommendations are based on this input along with the analysis of cost and
energy savings for each measure and their aggregates.
Zero Net Energy Demonstration Showcase ET10SCE2030
Southern California Edison Page 29
Design & Engineering Services November 2012
RECOMMENDATIONS Achieving ZNE involves an intensive planning, design and construction process. As a result,
much of the work performed for this Demonstration Showcase project aligns with the
programming and schematic design activities performed by architectural/engineering firms
in the planning phases. Documenting the OPR, developing an M&V plan, modeling various
EEMS, and documenting the BOD are all tasks that should be included in any innovative
design’s planning phase. Though a major goal of the project was to prove the feasibility of
achieving ZNE at this location, SCE also wanted to help stimulate forward momentum on the
project by including pre-design assistance, some programming and schematic design, and
most importantly the BOD, which is the documentation of a path of action that will
ultimately fulfill the OPR. In this case, the OPR includes achieving ZNE by implementing
innovative energy efficiency characteristics, renewable generation, reducing dependence on
grid source power, and creating a replicable model for achieving ZNE in other campus
facilities. The BOD documents created for this project provide a documented response to the
OPR and a path of action for achieving ZNE for the recreation facilities and aquatics
complex. These documents can easily be passed to the design team should UCSB move
forward with implementation. This was carefully planned to ensure UCSB had the
information necessary for an easy transition into design and eventual construction.
The goals of this Demonstration Showcase project are three-fold:
Development, installation and staging of cohesive EEMs in real-world settings
To allow various stakeholders to gain hands-on experience with comprehensive
systems of proven EEMs
Address barriers to cost, installation, and performance.
Since ZNE building is relatively new, showing that the three goals of the Demonstration
Showcase project can be achieved and a proven project deployed helps fulfill the additional
goal of gaining market traction for the concept. As this feasibility study concluded, the
project team has left the documents necessary to guide a design team in completing a
schematic design and helps it move into creating detailed design and construction
documents. It is recommended that UCSB take the work that has been performed as part of
this evaluation out to bid for the design and eventual construction of their selected EEMs
and ZNE pathway. These documents provide a head start into design and a detailed look of
how ZNE can be achieved for their facility.
Zero Net Energy Demonstration Showcase ET10SCE2030
Southern California Edison Page 30
Design & Engineering Services November 2012
ATTACHMENTS
1. UCSB Owner’s Project Requirements
UCSB_OPR.docx
2. UCSB M&V Plan
UCSB_M&V_Plan.doc
3. UCSB Basis of Design
UCSB_BOD.docx
Zero Net Energy Demonstration Showcase ET10SCE2030
Southern California Edison Page 31
Design & Engineering Services November 2012
REFERENCES
1 California Long Term Energy Efficiency Strategic Plan. Achieving Maximum Energy Savings in California for 2009 and Beyond. California Public Utilities Commission, September 2008.
2 Zero Energy Buildings. A Critical Look at the Definition. Conference Paper NREL/CP-550-39833
3 National Renewable Energy Laboratory, June 2006.
4 California Long Term Energy Efficiency Strategic Plan. Achieving Maximum Energy Savings in
California for 2009 and Beyond. California Public Utilities Commission, September 2008.
5 California Long Term Energy Efficiency Strategic Plan. Achieving Maximum Energy Savings in California for 2009 and Beyond. California Public Utilities Commission, September 2008.
6 International Performance Measurement and Verification Protocol. Concepts for Determining Energy and Water Savings Volume 1. Efficiency Valuation Organization, September 2010