Embed Size (px)
Citation preview
1
IMPACT EVALUATION OF PROJECT “UP-
SCALING OF KITCHEN GARDENING IN
URBAN AREAS OF PUNJAB”.
Prepared by
Mr. Rashid Ali,
Deputy Director of Agriculture (ES)
& Mr. Qamar Zaman, Assistant Director of Agriculture (ES)
& Mr. Nasir Iqbal, Assistant Research Officer (ES)
Edited by Mr. Natiq Hussain Chief
PLANNING & EVALUATION CELL
AGRICULTURE DEPARTMENT
266-REWAZ GARDEN, LAHORE
DECEMEBER, 2012
2
List of Contents
# Title Page
Preface
1. Introduction 1-2
2. Methodology 3
2.1 District wise number of selected respondents 3
3. Results and discussion 4-13
3.1. Distribution of winter and summer vegetable seed kits to selected respondents
4
3.2 Growing of vegetable seeds 4
3.3 Use of inputs and expenditure 5
3.4 Production of vegetable 6
3.5 Share of vegetable kits in total area 7
3.6 Benefits claimed by sample respondents 8
3.7 Share of kitchen gardening project in total production of vegetable in Punjab during Rabi 2011-12 & Kharif 2012
7
3.8 Share of kitchen gardening project value wise in total income of vegetable in Punjab during Rabi 2011-12 & Kharif 2012
7-9
3.9 Increase in vegetable consumption per week during winter & summer season due to project
10
3.10 Extent of home consumption and distribution to neighbors 10
3.11 Saving in Vegetable consumption during Rabi 2011-12 & Kharif 2012
11
3.12 Benefit cost Ratio of the project 11
3.13 General Observations 12
4. Conclusion and recommendations 13-15
3
List of Tables
# Title Page
1. District wise Number of selected respondents 3
2. Distribution of seed kits to selected respondents 4
3. Growing of vegetables in selected respondents 5
4. Average expenditure per respondent incurred on the inputs 6
5. Per kit production of selected respondents 6
6. Percentage area covered by project through providing kits 7
7. Share of kitchen gardening project in total production of
vegetable in Punjab during Rabi 2011-12
8
8. Share of kitchen gardening project value wise in total income of
vegetable in Punjab during Rabi 2011-12
9
9. Increase in vegetable consumption per week due to project 10
10. Extent of home consumption of winter & summer vegetables 10
11. Saving of expenditure due to project on per week use basis 11
12. Benefit Cost Ratio of Project. 11
4
PREFACE
Vegetables are important part of the human diet and consumed in daily life in
different forms. These are the rich source of vitamins and minerals in addition to other dietary
components like protein, carbohydrates and fiber. Vegetable production through kitchen
gardening can play an important role not only to cope with nutritional requirements of the peri-
urban and urban areas but also reduce the burden on kitchen expenditure and supply in fresh
farm.
Keeping in view the above scenario under the instruction of Chief Minister
Punjab, Agriculture Department implemented a project titled “Up-Scaling of Kitchen
Gardening in Urban Areas of Punjab” which was approved by PDWP on 21.7.2011 at total
cost of Rs.22.00 million for a period of two years i.e. 2011-12 & 2012. Agriculture Department
has planned to use all available information media to create awareness among the people with
the main objective to make available fresh quality vegetables and to enhance per capita
vegetable consumption among the urban and peri urban population.
P&E Cell was entrusted the job to conduct field visits and desk monitoring for
effective implementation. Two season vegetables i.e. winter and summer vegetables have
been harvested, so this organization has taken up the task of impact evaluation. Impact
evaluation assesses the changes that can be attributed to a particular intervention. This involves
counterfactual analysis, i.e. a comparison between what actually happened and what would
have happened in the absence of the intervention. Impact Evaluation seeks to answer cause-
and-effect questions.
A two member team of Planning & Evaluation Cell visited project area of
selected districts from 26-11-2012 to 29-11-2012 to undertake impact evaluation study. The
period under study was vegetable sown & harvested during winter (Rabi 2011-12) and summer
(Kharif 2012). The data shows that the vegetable germination remained at satisfactory level.
Overall 177490 seed kits were provided during Rabi 2011-12 and 75000 seed kits were
provided in Kharif 2012, which covered 2.34% of total area under vegetables in Punjab. The
average production of seed kits vegetables was found satisfactory. The consumption pattern of
target people also increased due to this intervention. Vegetables produced were healthy as
minimum quantities of pesticide & chemical fertilizer were used. The officers of this office
completed the evaluation wholeheartedly and zealously and I appreciate their effort. The results
presented in the report will certainly be helpful to devise future strategy with special reference to
kitchen gardening.
Chief, Planning & Evaluation Cell,
D:\DDA (ES)\F&VDP\Kitchen Gardening Project\Reports\Contents & tables.docx
5
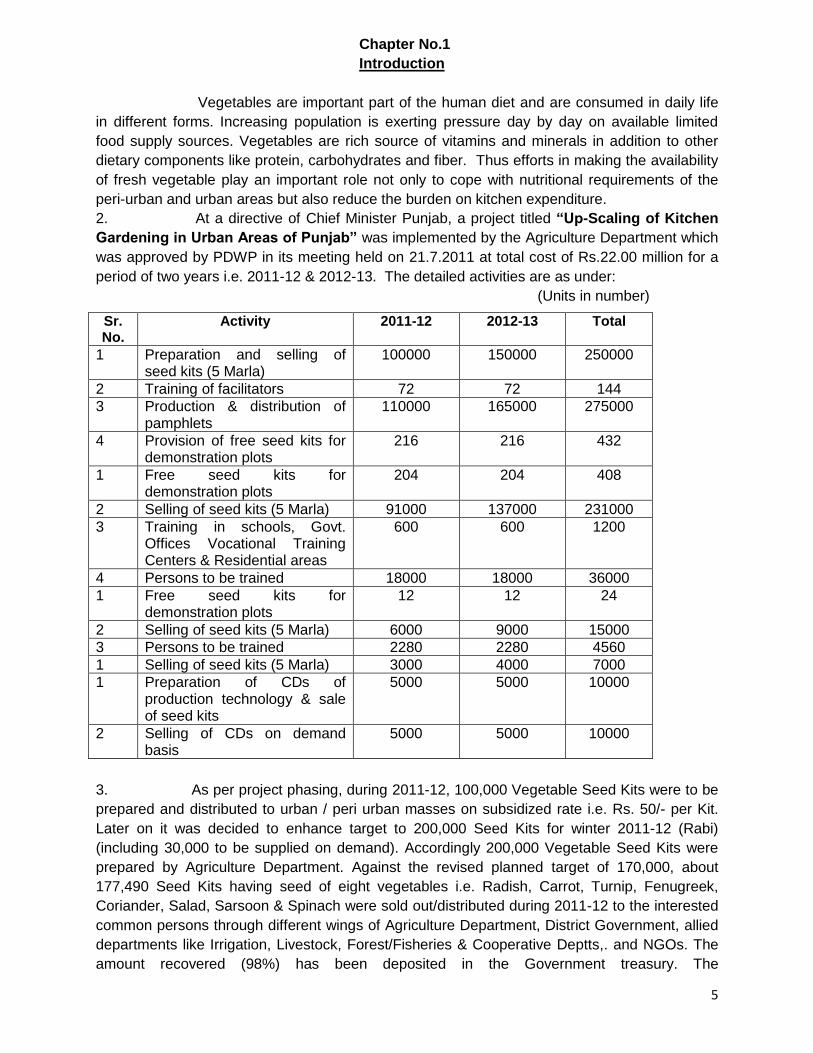
Chapter No.1
Introduction
Vegetables are important part of the human diet and are consumed in daily life
in different forms. Increasing population is exerting pressure day by day on available limited
food supply sources. Vegetables are rich source of vitamins and minerals in addition to other
dietary components like protein, carbohydrates and fiber. Thus efforts in making the availability
of fresh vegetable play an important role not only to cope with nutritional requirements of the
peri-urban and urban areas but also reduce the burden on kitchen expenditure.
2. At a directive of Chief Minister Punjab, a project titled “Up-Scaling of Kitchen
Gardening in Urban Areas of Punjab” was implemented by the Agriculture Department which
was approved by PDWP in its meeting held on 21.7.2011 at total cost of Rs.22.00 million for a
period of two years i.e. 2011-12 & 2012-13. The detailed activities are as under:
(Units in number)
Sr. No.
Activity 2011-12 2012-13 Total
1 Preparation and selling of seed kits (5 Marla)
100000 150000 250000
2 Training of facilitators 72 72 144
3 Production & distribution of pamphlets
110000 165000 275000
4 Provision of free seed kits for demonstration plots
216 216 432
1 Free seed kits for demonstration plots
204 204 408
2 Selling of seed kits (5 Marla) 91000 137000 231000
3 Training in schools, Govt. Offices Vocational Training Centers & Residential areas
600 600 1200
4 Persons to be trained 18000 18000 36000
1 Free seed kits for demonstration plots
12 12 24
2 Selling of seed kits (5 Marla) 6000 9000 15000
3 Persons to be trained 2280 2280 4560
1 Selling of seed kits (5 Marla) 3000 4000 7000
1 Preparation of CDs of production technology & sale of seed kits
5000 5000 10000
2 Selling of CDs on demand basis
5000 5000 10000
3. As per project phasing, during 2011-12, 100,000 Vegetable Seed Kits were to be
prepared and distributed to urban / peri urban masses on subsidized rate i.e. Rs. 50/- per Kit.
Later on it was decided to enhance target to 200,000 Seed Kits for winter 2011-12 (Rabi)
(including 30,000 to be supplied on demand). Accordingly 200,000 Vegetable Seed Kits were
prepared by Agriculture Department. Against the revised planned target of 170,000, about
177,490 Seed Kits having seed of eight vegetables i.e. Radish, Carrot, Turnip, Fenugreek,
Coriander, Salad, Sarsoon & Spinach were sold out/distributed during 2011-12 to the interested
common persons through different wings of Agriculture Department, District Government, allied
departments like Irrigation, Livestock, Forest/Fisheries & Cooperative Deptts,. and NGOs. The
amount recovered (98%) has been deposited in the Government treasury. The
6
distribution/selling of Vegetable Seed Kits were started well in time, just before the sowing time
i.e. from the last week of September and completed up to the end of November 2011. Similarly,
75,000 seed kits were distributed during summer 2012 (Kharif) in March, April 2012 of Lady
finger, Bitter gourd, Bottle gourd, Sponge gourd, Cucumber, Long melon, Tinda & Vegetable
marrow. About 244,164 farmers were trained through training program at 10,740 sites, 190,000
printed leaflets regarding the production technology of vegetable were distributed among
buyers, more than 10,000 banners were placed at different places including sale points, 35
Radio/TV talks & 153 road shows/rallies were conducted, 3331 demonstration plots were laid
down at public parks, educational institutes/colleges/universities etc., Government
residences/offices etc. for dissemination. During winter 2012-13 (Rabi), sale of 129500 seed
kits has been reported.
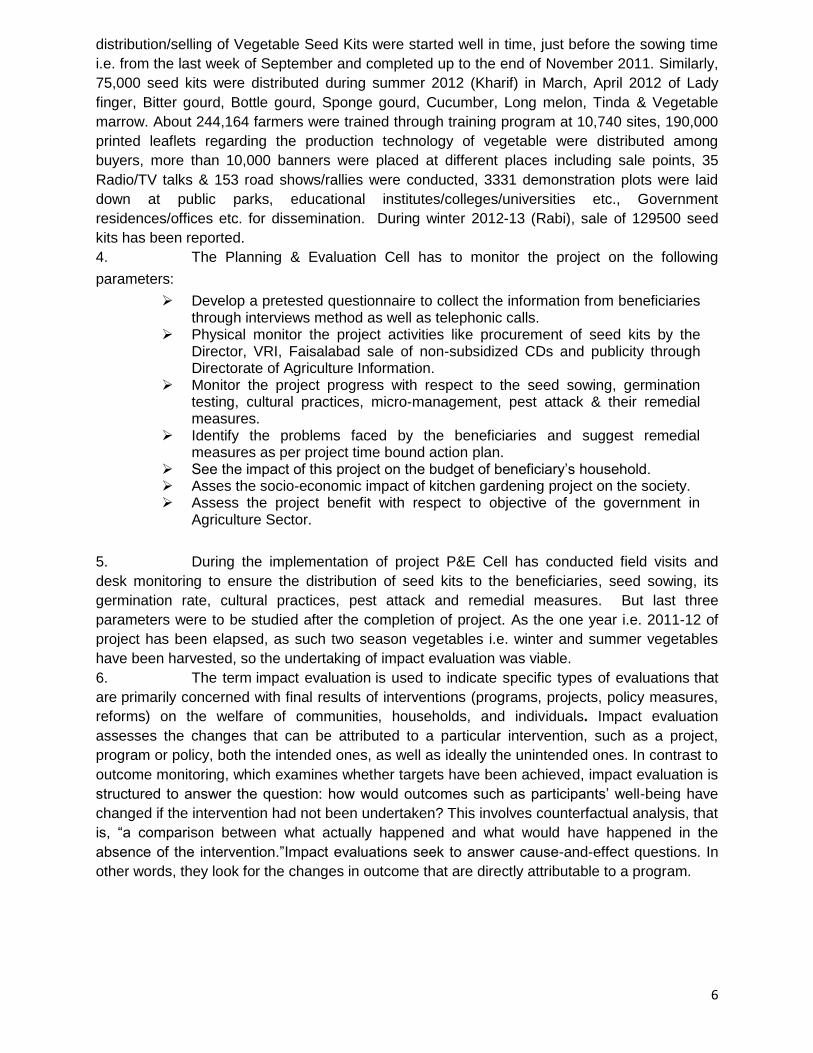
4. The Planning & Evaluation Cell has to monitor the project on the following
parameters:
Develop a pretested questionnaire to collect the information from beneficiaries through interviews method as well as telephonic calls.
Physical monitor the project activities like procurement of seed kits by the Director, VRI, Faisalabad sale of non-subsidized CDs and publicity through Directorate of Agriculture Information.
Monitor the project progress with respect to the seed sowing, germination testing, cultural practices, micro-management, pest attack & their remedial measures.
Identify the problems faced by the beneficiaries and suggest remedial measures as per project time bound action plan.
See the impact of this project on the budget of beneficiary’s household. Asses the socio-economic impact of kitchen gardening project on the society. Assess the project benefit with respect to objective of the government in
Agriculture Sector.
5. During the implementation of project P&E Cell has conducted field visits and
desk monitoring to ensure the distribution of seed kits to the beneficiaries, seed sowing, its
germination rate, cultural practices, pest attack and remedial measures. But last three
parameters were to be studied after the completion of project. As the one year i.e. 2011-12 of
project has been elapsed, as such two season vegetables i.e. winter and summer vegetables
have been harvested, so the undertaking of impact evaluation was viable.
6. The term impact evaluation is used to indicate specific types of evaluations that
are primarily concerned with final results of interventions (programs, projects, policy measures,
reforms) on the welfare of communities, households, and individuals. Impact evaluation
assesses the changes that can be attributed to a particular intervention, such as a project,
program or policy, both the intended ones, as well as ideally the unintended ones. In contrast to
outcome monitoring, which examines whether targets have been achieved, impact evaluation is
structured to answer the question: how would outcomes such as participants’ well-being have
changed if the intervention had not been undertaken? This involves counterfactual analysis, that
is, “a comparison between what actually happened and what would have happened in the
absence of the intervention.”Impact evaluations seek to answer cause-and-effect questions. In
other words, they look for the changes in outcome that are directly attributable to a program.
7
Chapter No.2
Methodology
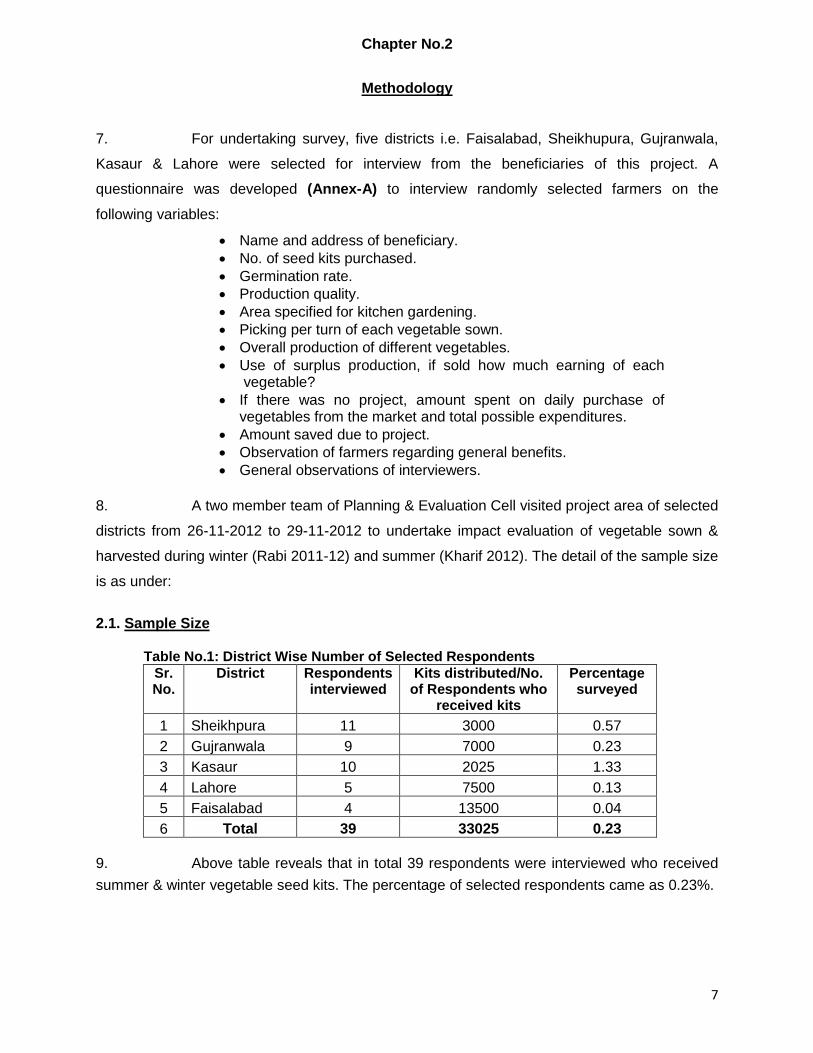
7. For undertaking survey, five districts i.e. Faisalabad, Sheikhupura, Gujranwala,
Kasaur & Lahore were selected for interview from the beneficiaries of this project. A
questionnaire was developed (Annex-A) to interview randomly selected farmers on the
following variables:
Name and address of beneficiary.
No. of seed kits purchased.
Germination rate.
Production quality.
Area specified for kitchen gardening.
Picking per turn of each vegetable sown.
Overall production of different vegetables.
Use of surplus production, if sold how much earning of each vegetable?
If there was no project, amount spent on daily purchase of vegetables from the market and total possible expenditures.
Amount saved due to project.
Observation of farmers regarding general benefits.
General observations of interviewers.
8. A two member team of Planning & Evaluation Cell visited project area of selected
districts from 26-11-2012 to 29-11-2012 to undertake impact evaluation of vegetable sown &
harvested during winter (Rabi 2011-12) and summer (Kharif 2012). The detail of the sample size
is as under:
2.1. Sample Size Table No.1: District Wise Number of Selected Respondents
Sr. No.
District Respondents interviewed
Kits distributed/No. of Respondents who
received kits
Percentage surveyed
1 Sheikhpura 11 3000 0.57
2 Gujranwala 9 7000 0.23
3 Kasaur 10 2025 1.33
4 Lahore 5 7500 0.13
5 Faisalabad 4 13500 0.04
6 Total 39 33025 0.23
9. Above table reveals that in total 39 respondents were interviewed who received
summer & winter vegetable seed kits. The percentage of selected respondents came as 0.23%.
8
Chapter No.3
Results and Discussion
10. In this chapter data collected and analyzed on different aspects is discussed and
results are inferred.
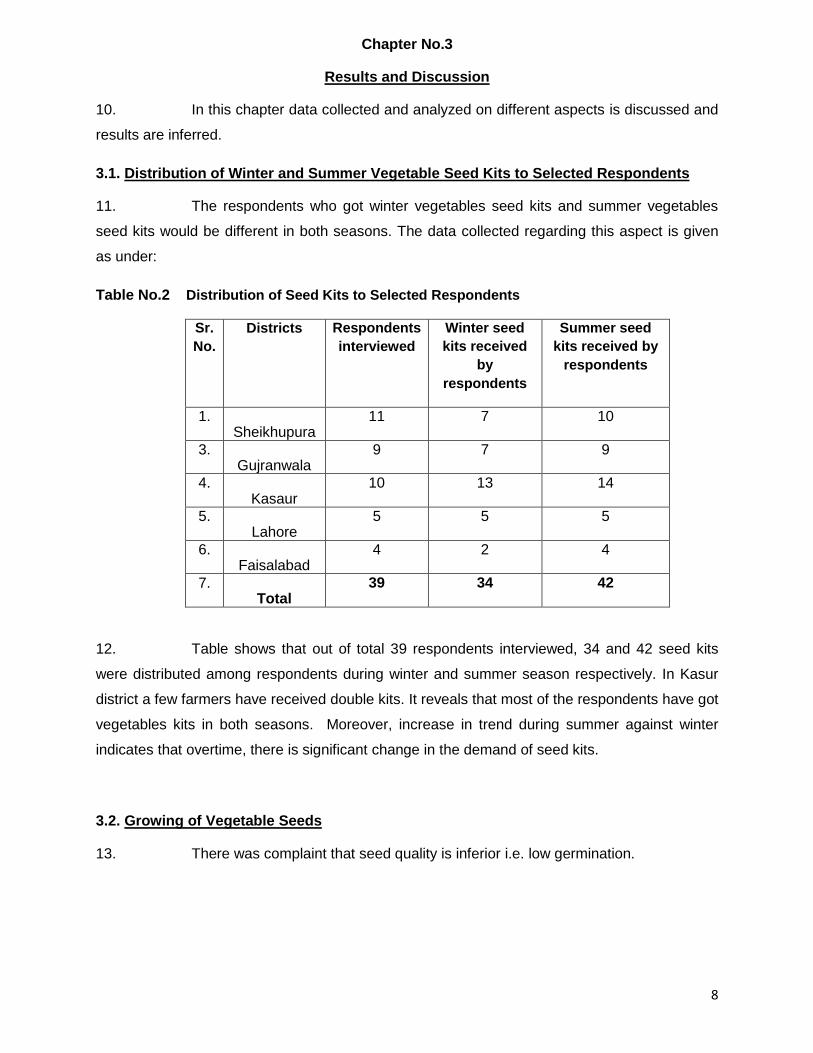
3.1. Distribution of Winter and Summer Vegetable Seed Kits to Selected Respondents
11. The respondents who got winter vegetables seed kits and summer vegetables
seed kits would be different in both seasons. The data collected regarding this aspect is given
as under:
Table No.2 Distribution of Seed Kits to Selected Respondents
Sr.
No.
Districts Respondents
interviewed
Winter seed
kits received
by
respondents
Summer seed
kits received by
respondents
1. Sheikhupura
11 7 10
3. Gujranwala
9 7 9
4. Kasaur
10 13 14
5. Lahore
5 5 5
6. Faisalabad
4 2 4
7. Total
39 34 42
12. Table shows that out of total 39 respondents interviewed, 34 and 42 seed kits
were distributed among respondents during winter and summer season respectively. In Kasur
district a few farmers have received double kits. It reveals that most of the respondents have got
vegetables kits in both seasons. Moreover, increase in trend during summer against winter
indicates that overtime, there is significant change in the demand of seed kits.
3.2. Growing of Vegetable Seeds
13. There was complaint that seed quality is inferior i.e. low germination.
9
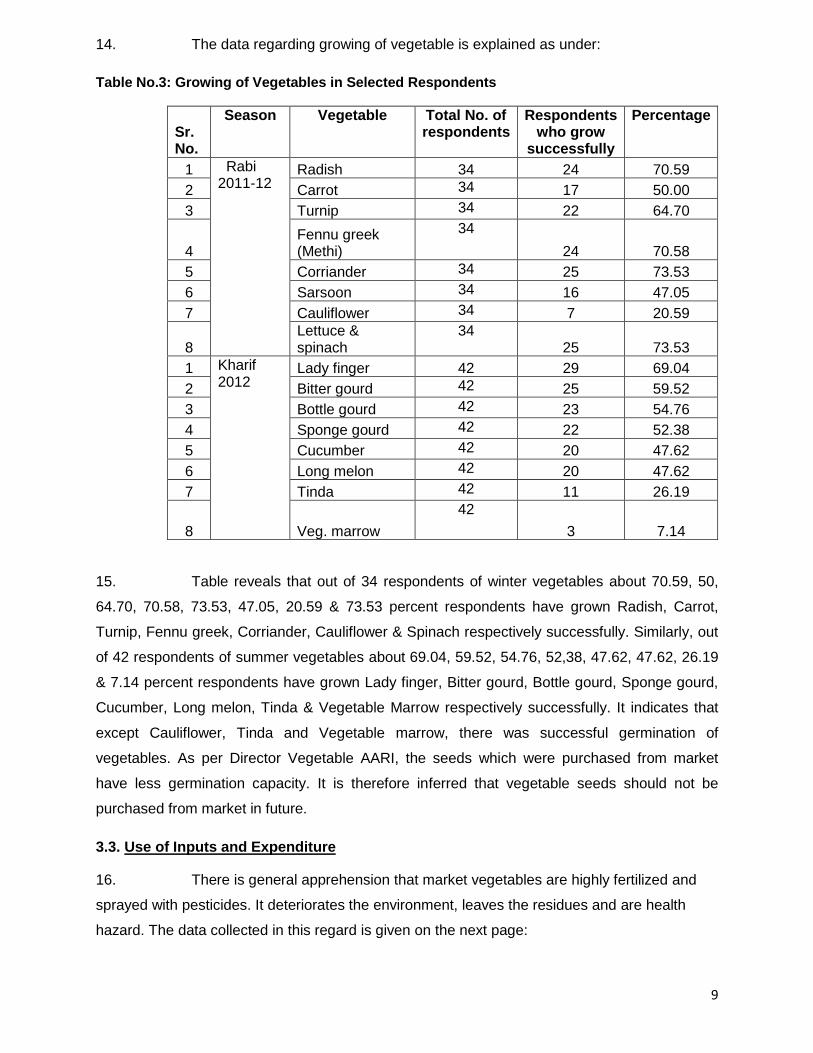
14. The data regarding growing of vegetable is explained as under:
Table No.3: Growing of Vegetables in Selected Respondents
Sr. No.
Season Vegetable Total No. of respondents
Respondents who grow
successfully
Percentage
1 Rabi 2011-12
Radish 34 24 70.59
2 Carrot 34 17 50.00
3 Turnip 34 22 64.70
4 Fennu greek (Methi)
34
24 70.58
5 Corriander 34 25 73.53
6 Sarsoon 34 16 47.05
7 Cauliflower 34 7 20.59
8 Lettuce & spinach
34 25 73.53
1 Kharif 2012
Lady finger 42 29 69.04
2 Bitter gourd 42 25 59.52
3 Bottle gourd 42 23 54.76
4 Sponge gourd 42 22 52.38
5 Cucumber 42 20 47.62
6 Long melon 42 20 47.62
7 Tinda 42 11 26.19
8 Veg. marrow
42
3 7.14
15. Table reveals that out of 34 respondents of winter vegetables about 70.59, 50,
64.70, 70.58, 73.53, 47.05, 20.59 & 73.53 percent respondents have grown Radish, Carrot,
Turnip, Fennu greek, Corriander, Cauliflower & Spinach respectively successfully. Similarly, out
of 42 respondents of summer vegetables about 69.04, 59.52, 54.76, 52,38, 47.62, 47.62, 26.19
& 7.14 percent respondents have grown Lady finger, Bitter gourd, Bottle gourd, Sponge gourd,
Cucumber, Long melon, Tinda & Vegetable Marrow respectively successfully. It indicates that
except Cauliflower, Tinda and Vegetable marrow, there was successful germination of
vegetables. As per Director Vegetable AARI, the seeds which were purchased from market
have less germination capacity. It is therefore inferred that vegetable seeds should not be
purchased from market in future.
3.3. Use of Inputs and Expenditure
16. There is general apprehension that market vegetables are highly fertilized and
sprayed with pesticides. It deteriorates the environment, leaves the residues and are health
hazard. The data collected in this regard is given on the next page:
10
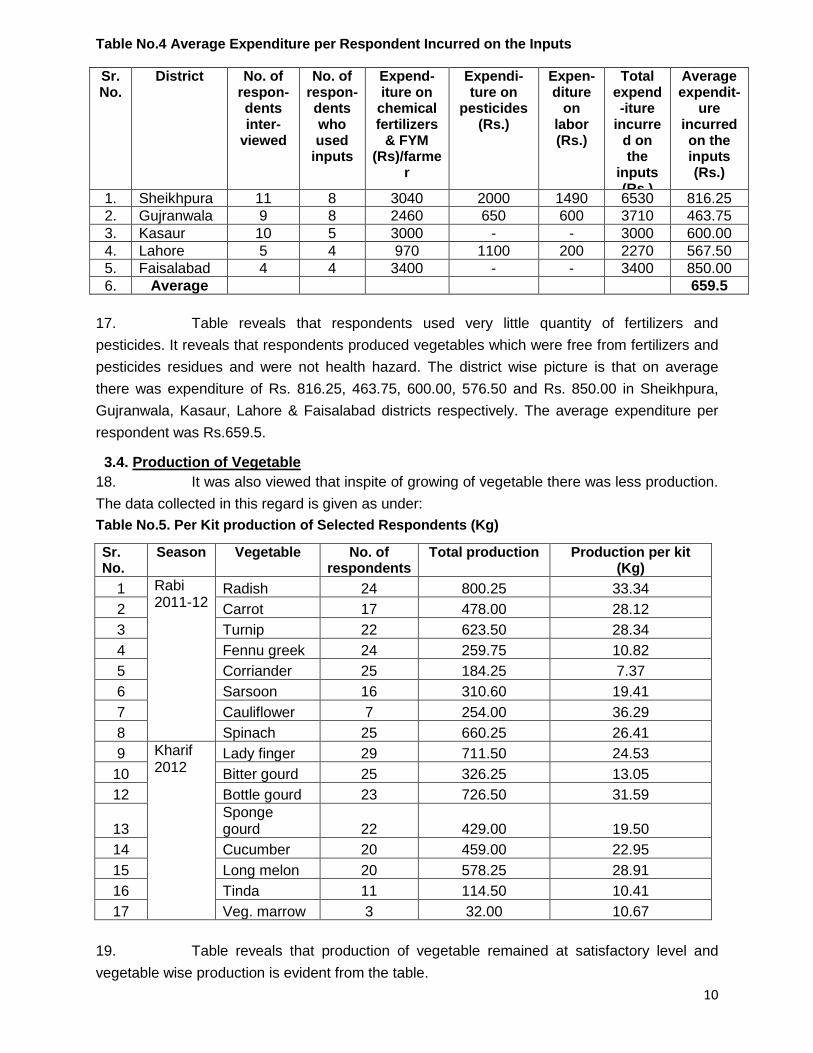
Table No.4 Average Expenditure per Respondent Incurred on the Inputs
Sr. No.
District No. of respon-dents inter-
viewed
No. of respon-dents who used
inputs
Expend-iture on
chemical fertilizers
& FYM (Rs)/farme
r
Expendi-ture on
pesticides (Rs.)
Expen-diture
on labor (Rs.)
Total expend-iture
incurred on the
inputs (Rs.)
Average expendit-
ure incurred on the inputs (Rs.)
1. Sheikhpura 11 8 3040 2000 1490 6530 816.25
2. Gujranwala 9 8 2460 650 600 3710 463.75
3. Kasaur 10 5 3000 - - 3000 600.00
4. Lahore 5 4 970 1100 200 2270 567.50
5. Faisalabad 4 4 3400 - - 3400 850.00
6. Average 659.5
17. Table reveals that respondents used very little quantity of fertilizers and
pesticides. It reveals that respondents produced vegetables which were free from fertilizers and
pesticides residues and were not health hazard. The district wise picture is that on average
there was expenditure of Rs. 816.25, 463.75, 600.00, 576.50 and Rs. 850.00 in Sheikhpura,
Gujranwala, Kasaur, Lahore & Faisalabad districts respectively. The average expenditure per
respondent was Rs.659.5.
3.4. Production of Vegetable
18. It was also viewed that inspite of growing of vegetable there was less production.
The data collected in this regard is given as under:
Table No.5. Per Kit production of Selected Respondents (Kg)
Sr. No.
Season Vegetable No. of respondents
Total production Production per kit (Kg)
1 Rabi 2011-12
Radish 24 800.25 33.34
2 Carrot 17 478.00 28.12
3 Turnip 22 623.50 28.34
4 Fennu greek 24 259.75 10.82
5 Corriander 25 184.25 7.37
6 Sarsoon 16 310.60 19.41
7 Cauliflower 7 254.00 36.29
8 Spinach 25 660.25 26.41
9 Kharif 2012
Lady finger 29 711.50 24.53
10 Bitter gourd 25 326.25 13.05
12 Bottle gourd 23 726.50 31.59
13 Sponge gourd 22 429.00 19.50
14 Cucumber 20 459.00 22.95
15 Long melon 20 578.25 28.91
16 Tinda 11 114.50 10.41
17 Veg. marrow 3 32.00 10.67
19. Table reveals that production of vegetable remained at satisfactory level and
vegetable wise production is evident from the table.
11
3.5. Share of Vegetable Kits in Total Area
20. There is general feeling that vegetable seed kits supplied have reasonable share
in total vegetable area, due to which production should have increased reasonably. The data in
this regard is given below:
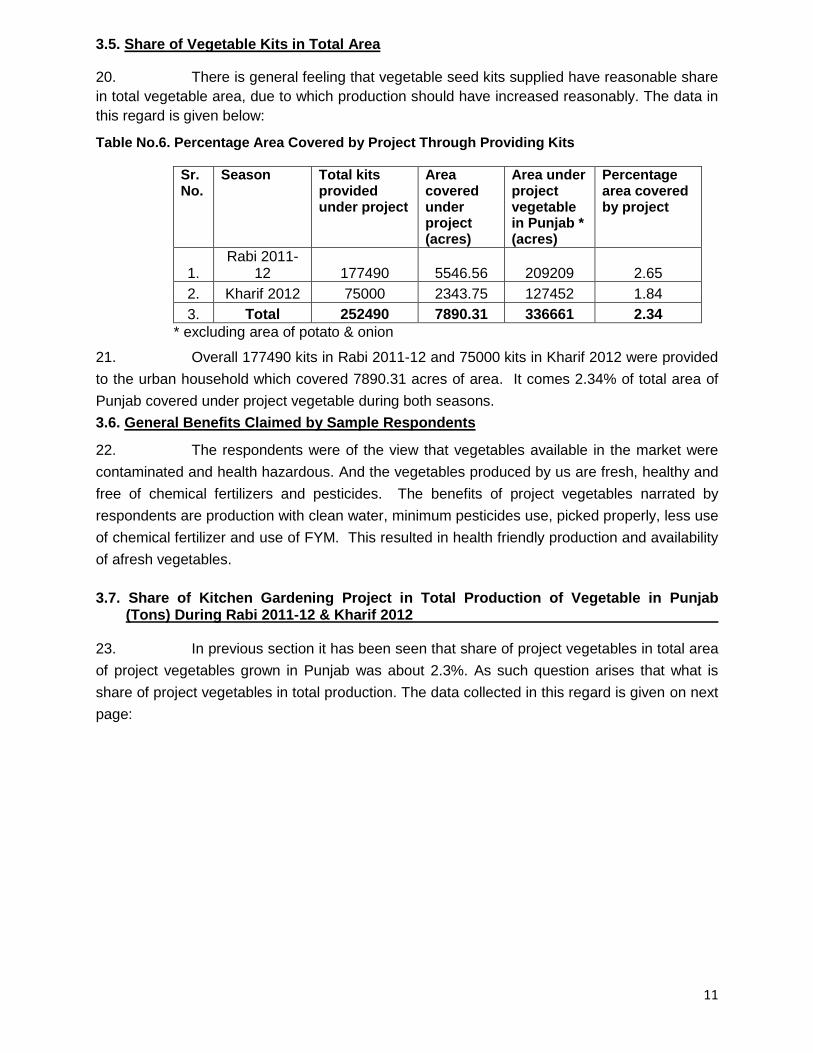
Table No.6. Percentage Area Covered by Project Through Providing Kits
Sr. No.
Season Total kits provided under project
Area covered under project (acres)
Area under project vegetable in Punjab * (acres)
Percentage area covered by project
1. Rabi 2011-
12 177490 5546.56 209209 2.65
2. Kharif 2012 75000 2343.75 127452 1.84
3. Total 252490 7890.31 336661 2.34
* excluding area of potato & onion
21. Overall 177490 kits in Rabi 2011-12 and 75000 kits in Kharif 2012 were provided
to the urban household which covered 7890.31 acres of area. It comes 2.34% of total area of
Punjab covered under project vegetable during both seasons.
3.6. General Benefits Claimed by Sample Respondents
22. The respondents were of the view that vegetables available in the market were
contaminated and health hazardous. And the vegetables produced by us are fresh, healthy and
free of chemical fertilizers and pesticides. The benefits of project vegetables narrated by
respondents are production with clean water, minimum pesticides use, picked properly, less use
of chemical fertilizer and use of FYM. This resulted in health friendly production and availability
of afresh vegetables.
3.7. Share of Kitchen Gardening Project in Total Production of Vegetable in Punjab
(Tons) During Rabi 2011-12 & Kharif 2012
23. In previous section it has been seen that share of project vegetables in total area
of project vegetables grown in Punjab was about 2.3%. As such question arises that what is
share of project vegetables in total production. The data collected in this regard is given on next
page:
12
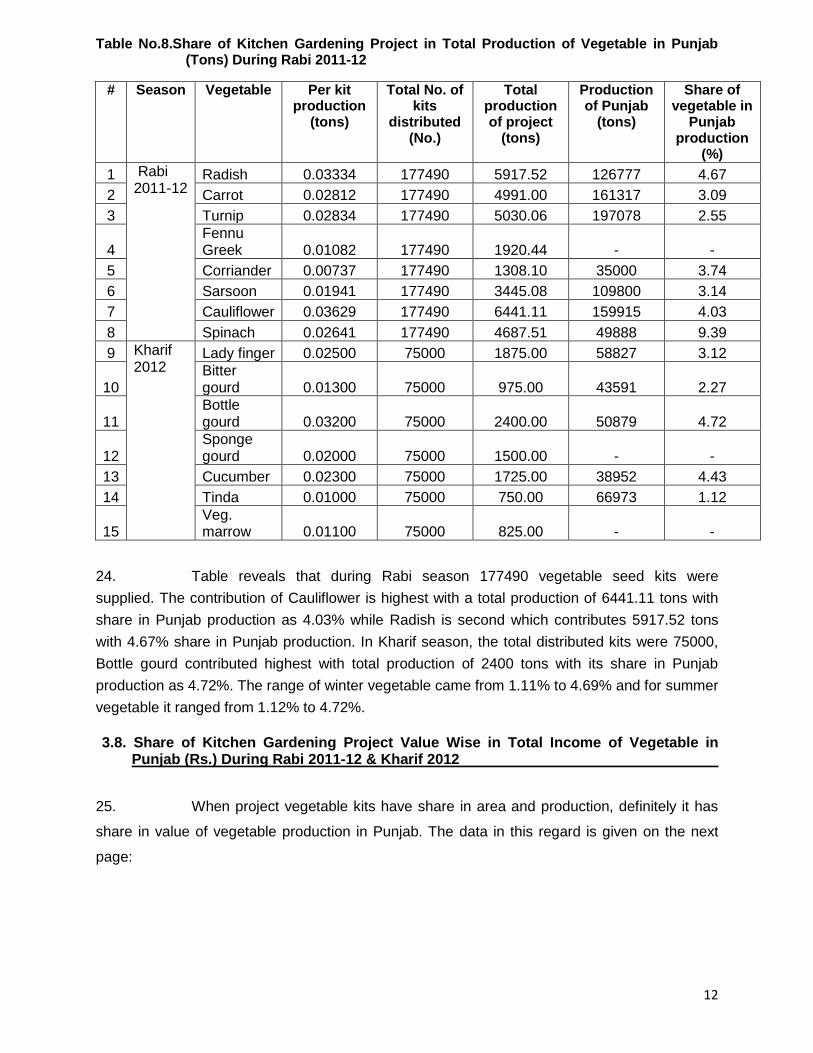
Table No.8.Share of Kitchen Gardening Project in Total Production of Vegetable in Punjab (Tons) During Rabi 2011-12
# Season Vegetable Per kit production
(tons)
Total No. of kits
distributed (No.)
Total production of project
(tons)
Production of Punjab
(tons)
Share of vegetable in
Punjab production
(%)
1 Rabi 2011-12
Radish 0.03334 177490 5917.52 126777 4.67
2 Carrot 0.02812 177490 4991.00 161317 3.09
3 Turnip 0.02834 177490 5030.06 197078 2.55
4 Fennu Greek 0.01082 177490 1920.44 - -
5 Corriander 0.00737 177490 1308.10 35000 3.74
6 Sarsoon 0.01941 177490 3445.08 109800 3.14
7 Cauliflower 0.03629 177490 6441.11 159915 4.03
8 Spinach 0.02641 177490 4687.51 49888 9.39
9 Kharif 2012
Lady finger 0.02500 75000 1875.00 58827 3.12
10 Bitter gourd 0.01300 75000 975.00 43591 2.27
11 Bottle gourd 0.03200 75000 2400.00 50879 4.72
12 Sponge gourd 0.02000 75000 1500.00 - -
13 Cucumber 0.02300 75000 1725.00 38952 4.43
14 Tinda 0.01000 75000 750.00 66973 1.12
15 Veg. marrow 0.01100 75000 825.00 - -
24. Table reveals that during Rabi season 177490 vegetable seed kits were
supplied. The contribution of Cauliflower is highest with a total production of 6441.11 tons with
share in Punjab production as 4.03% while Radish is second which contributes 5917.52 tons
with 4.67% share in Punjab production. In Kharif season, the total distributed kits were 75000,
Bottle gourd contributed highest with total production of 2400 tons with its share in Punjab
production as 4.72%. The range of winter vegetable came from 1.11% to 4.69% and for summer
vegetable it ranged from 1.12% to 4.72%.
3.8. Share of Kitchen Gardening Project Value Wise in Total Income of Vegetable in Punjab (Rs.) During Rabi 2011-12 & Kharif 2012
25. When project vegetable kits have share in area and production, definitely it has
share in value of vegetable production in Punjab. The data in this regard is given on the next
page:
13
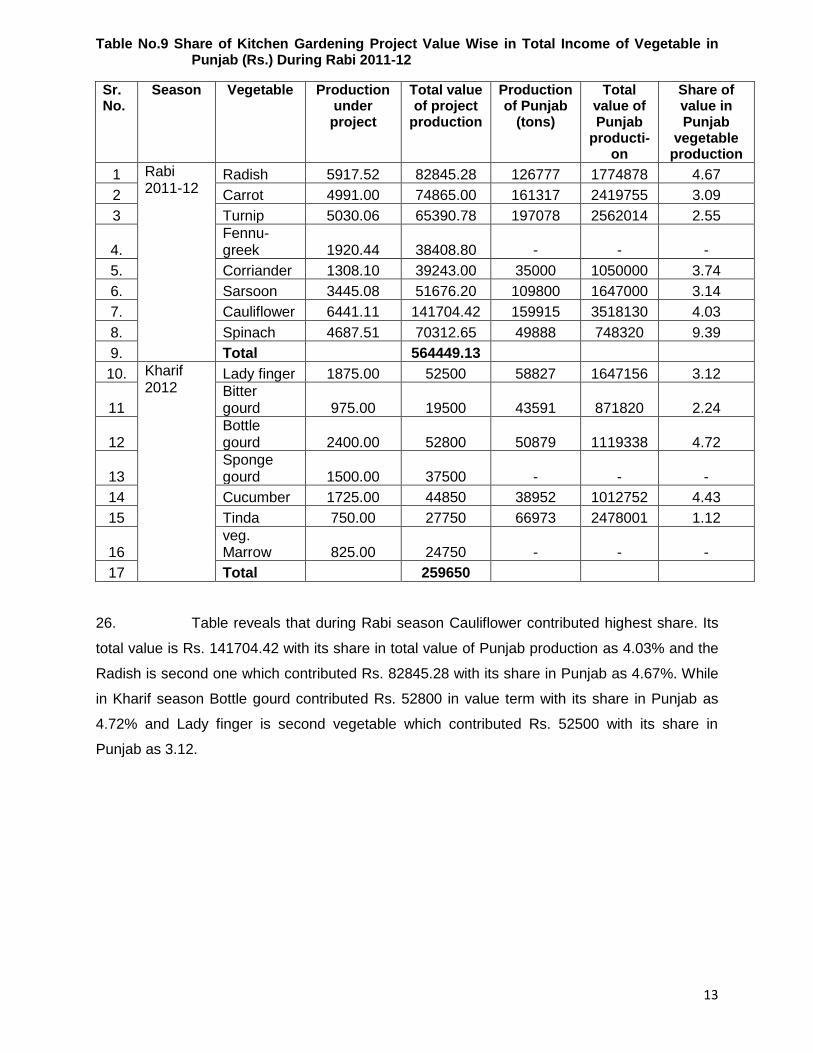
Table No.9 Share of Kitchen Gardening Project Value Wise in Total Income of Vegetable in Punjab (Rs.) During Rabi 2011-12
Sr. No.
Season Vegetable Production under project
Total value of project
production
Production of Punjab
(tons)
Total value of Punjab
producti-on
Share of value in Punjab
vegetable production
1 Rabi 2011-12
Radish 5917.52 82845.28 126777 1774878 4.67
2 Carrot 4991.00 74865.00 161317 2419755 3.09
3 Turnip 5030.06 65390.78 197078 2562014 2.55
4. Fennu- greek 1920.44 38408.80 - - -
5. Corriander 1308.10 39243.00 35000 1050000 3.74
6. Sarsoon 3445.08 51676.20 109800 1647000 3.14
7. Cauliflower 6441.11 141704.42 159915 3518130 4.03
8. Spinach 4687.51 70312.65 49888 748320 9.39
9. Total
564449.13 10. Kharif
2012
Lady finger 1875.00 52500 58827 1647156 3.12
11 Bitter gourd 975.00 19500 43591 871820 2.24
12 Bottle gourd 2400.00 52800 50879 1119338 4.72
13 Sponge gourd 1500.00 37500 - - -
14 Cucumber 1725.00 44850 38952 1012752 4.43
15 Tinda 750.00 27750 66973 2478001 1.12
16 veg. Marrow 825.00 24750 - - -
17 Total
259650
26. Table reveals that during Rabi season Cauliflower contributed highest share. Its
total value is Rs. 141704.42 with its share in total value of Punjab production as 4.03% and the
Radish is second one which contributed Rs. 82845.28 with its share in Punjab as 4.67%. While
in Kharif season Bottle gourd contributed Rs. 52800 in value term with its share in Punjab as
4.72% and Lady finger is second vegetable which contributed Rs. 52500 with its share in
Punjab as 3.12.
14
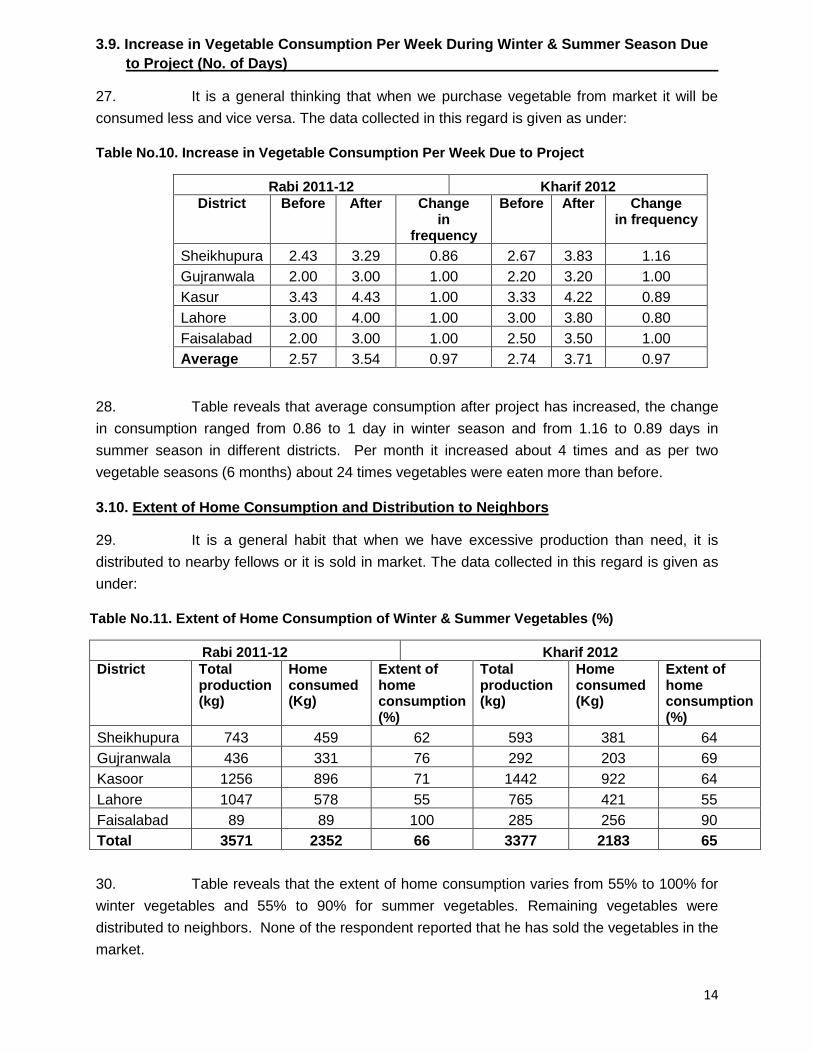
3.9. Increase in Vegetable Consumption Per Week During Winter & Summer Season Due
to Project (No. of Days)
27. It is a general thinking that when we purchase vegetable from market it will be
consumed less and vice versa. The data collected in this regard is given as under:
Table No.10. Increase in Vegetable Consumption Per Week Due to Project
Rabi 2011-12 Kharif 2012
District Before After Change in
frequency
Before After Change in frequency
Sheikhupura 2.43 3.29 0.86 2.67 3.83 1.16
Gujranwala 2.00 3.00 1.00 2.20 3.20 1.00
Kasur 3.43 4.43 1.00 3.33 4.22 0.89
Lahore 3.00 4.00 1.00 3.00 3.80 0.80
Faisalabad 2.00 3.00 1.00 2.50 3.50 1.00
Average 2.57 3.54 0.97 2.74 3.71 0.97
28. Table reveals that average consumption after project has increased, the change
in consumption ranged from 0.86 to 1 day in winter season and from 1.16 to 0.89 days in
summer season in different districts. Per month it increased about 4 times and as per two
vegetable seasons (6 months) about 24 times vegetables were eaten more than before.
3.10. Extent of Home Consumption and Distribution to Neighbors
29. It is a general habit that when we have excessive production than need, it is
distributed to nearby fellows or it is sold in market. The data collected in this regard is given as
under:
Table No.11. Extent of Home Consumption of Winter & Summer Vegetables (%)
Rabi 2011-12 Kharif 2012
District Total production (kg)
Home consumed (Kg)
Extent of home consumption (%)
Total production (kg)
Home consumed (Kg)
Extent of home consumption (%)
Sheikhupura 743 459 62 593 381 64
Gujranwala 436 331 76 292 203 69
Kasoor 1256 896 71 1442 922 64
Lahore 1047 578 55 765 421 55
Faisalabad 89 89 100 285 256 90
Total 3571 2352 66 3377 2183 65
30. Table reveals that the extent of home consumption varies from 55% to 100% for
winter vegetables and 55% to 90% for summer vegetables. Remaining vegetables were
distributed to neighbors. None of the respondent reported that he has sold the vegetables in the
market.
15
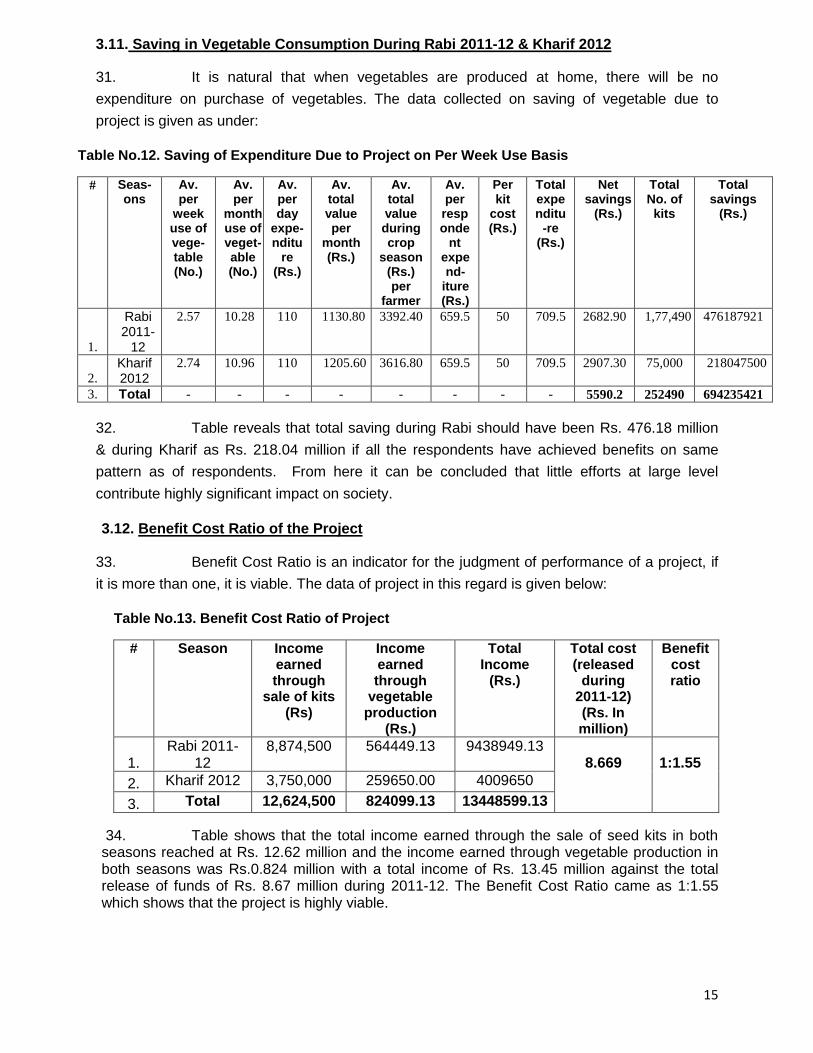
3.11. Saving in Vegetable Consumption During Rabi 2011-12 & Kharif 2012
31. It is natural that when vegetables are produced at home, there will be no
expenditure on purchase of vegetables. The data collected on saving of vegetable due to
project is given as under:
Table No.12. Saving of Expenditure Due to Project on Per Week Use Basis
# Seas-ons
Av. per
week use of vege-table (No.)
Av. per
month use of veget-able (No.)
Av. per day
expe-nditu
re (Rs.)
Av. total value per
month (Rs.)
Av. total value during crop
season (Rs.) per
farmer
Av. per
responde
nt expend-
iture (Rs.)
Per kit
cost (Rs.)
Total expenditu
-re (Rs.)
Net savings
(Rs.)
Total No. of kits
Total savings
(Rs.)
1.
Rabi 2011-
12
2.57 10.28 110 1130.80 3392.40 659.5 50 709.5 2682.90 1,77,490 476187921
2. Kharif 2012
2.74 10.96 110 1205.60 3616.80 659.5 50 709.5 2907.30 75,000 218047500
3. Total - - - - - - - - 5590.2 252490 694235421
32. Table reveals that total saving during Rabi should have been Rs. 476.18 million
& during Kharif as Rs. 218.04 million if all the respondents have achieved benefits on same
pattern as of respondents. From here it can be concluded that little efforts at large level
contribute highly significant impact on society.
3.12. Benefit Cost Ratio of the Project
33. Benefit Cost Ratio is an indicator for the judgment of performance of a project, if
it is more than one, it is viable. The data of project in this regard is given below:
Table No.13. Benefit Cost Ratio of Project
# Season Income earned through
sale of kits (Rs)
Income earned through
vegetable production
(Rs.)
Total Income
(Rs.)
Total cost (released
during 2011-12) (Rs. In million)
Benefit cost ratio
1. Rabi 2011-
12 8,874,500 564449.13 9438949.13
8.669 1:1.55
2. Kharif 2012 3,750,000 259650.00 4009650
3. Total 12,624,500 824099.13 13448599.13
34. Table shows that the total income earned through the sale of seed kits in both seasons reached at Rs. 12.62 million and the income earned through vegetable production in both seasons was Rs.0.824 million with a total income of Rs. 13.45 million against the total release of funds of Rs. 8.67 million during 2011-12. The Benefit Cost Ratio came as 1:1.55 which shows that the project is highly viable.
16
3.13. General Observations
35. During field visit/survey and discussions with Agriculture Extension staff and
respondents, the following observations were noted:
3.13.1. The cost of kits in many cases was born by extension staff. This accounts to thousands as per Field Assistant and higher ups. The extension staff could not recover the amounts due to their social contacts with the respondents and staff considers it against derogatory to demand Rs.50 or Rs.100 from respondents.
3.13.2. Baildars of Extension Department have been used extensively in sowing of vegetables and then after care activities such as hoeing, fertilizing, and spraying. This is not a good practice, due to which departmental activities are affected.
3.13.3. Seed kits packed from market seeds have less germination and quality. It gives bad name to Department.
3.13.4. In cities, location of plots is not suitable. In winter, plots remain shadowed, germination and production is reduced. In summer there is too hot due to heat up of walls. It also spoils the quality and production of vegetables.
3.13.5. The idea of growing vegetables on roofs is not accepted by the public.
3.13.6. In cities income of the people is high due to which they are less vegetarian and they do not give due importance to grow vegetables.
17
Chapter No.4
Conclusions and Recommendations
36. The project has its positive impact on the society in terms of production, income
and consumption pattern. The project ensured the availability of clean, fresh and healthy
vegetables which are free from chemical fertilizer & pesticide residues as the respondents have
used very little quantity of chemical fertilizers and pesticides. The data shows that the vegetable
production remained at satisfactory level. Overall 177490 seed kits were provided during Rabi
2011-12 and 75000 seed kits were provided in Kharif 2012 which covered 2.34% of total area
under vegetable in Punjab. The main findings are as under:
Out of total 39 respondents interviewed, 34 and 42 seed kits were distributed among respondents during winter and summer season respectively.
About 252490 kits were supplied during Rabi & Kharif season during 2011-12 and it covered about 2.34% of total area of vegetable excluding potato & onion. Although this percentage is in-significant but provides a valid base for its propagation.
The germination of winter vegetable ranged from 20.59% to 73.53%. This situation needs efforts.
The germination of summer vegetable ranged from 7.14% to 69.04%. It is not a healthy sign.
The average expenditure on inputs was Rs. 659.50 per respondents. The main expenditure was on farmyard manure and labor. The expenditure on other inputs was minimum.
The per kit production of different vegetables in winter season ranged from 7.37 to 36.29 kg.
The per kit production of different vegetables in summer season ranged from 10.41 to 31.59 kg.
The share of winter vegetables production in total production of Punjab ranged from 2.55 to 4.03%.
The share of summer vegetables production in total production of Punjab ranged from 1.12 to 4.72%.
The value wise share of different winter vegetables production ranged from 2.55 to 4.67%.
The value wise share of different summer vegetables production ranged from 1.12 to 4.72%.
The increase in consumption pattern per week of both seasons came as 0.97 days.
The extent of home consumption in both seasons came as 66% while remaining was distributed to neighbors.

18
The per respondents savings due to project in Rabi & Kharif seasons came as Rs.2682.90 & Rs. 2907.30 respectively.
The Benefit Cost Ratio of the project came as 1:1.55.
The cost of kits in most cases has been born by the extension staff of Agriculture Department.
Baildars of extension wing have been used extensively in sowing of vegetables and after care activities.
Seed kits packed from market seeds have less germination and need some intervention.
In cities, location of plots is not suitable, remained shadowed in winter season and hot in summer season.
The idea of growing vegetables on roofs is not accepted by the urban population.
In cities income of people are high and are less vegetarians, thus paid no attention in growing of vegetables.
Recommendations
37. In future this exercise should not be taken on project basis. It should be made a regular feature of Agri. Extension wing of Agriculture Department as in the past. This department has been preparing kits and offering for sale. As it is a healthy activity and keeps the urban men & women busy, the lesson emerged in the exercise needs to be addressed in future planning. The major drawbacks noted in the implementation of project are as follow:
a. Complaint of seed having low germination.
b. Capacity building in production technology at micro level
c. Involvement of private sectors.
38. These three factors need elaboration and further discussion is given as under:
a. Complaint of Seed Having Low Germination
39. Most vegetables seed used in this project were purchased from the open market.
Although filters like testing of germination by Vegetable Research Institute (VRI), AARI and FSC
& RD was used but did not give the desired results. This may be due to:
i. Unsatisfied quality of seeds.
ii. Poor sowing methods adoption.
40. The survey team observed that seed produced by VRI has less complaint. It is
therefore proposed that VRI may develop the capacity of vegetable growers for seed production
and in this regard hybrid seed may be preferred because it has vigor as well quality. As far as
method of sowing is concerned, although brochure with seed kit was provided but as seeds are
soft and small, care is necessary while sowing the seed. This is discussed in the next headings.
19
b. Capacity Building in Production Technology at Micro Level.
41. Capacity building was important component of the project. It was successfully
implemented through imparting training of master trainers at Multan, Faisalabad, Rawalpindi
divisions at district and local level. Demonstration in public places at school/colleges,
propaganda through mass media and distribution of CDs but it still needs further improvement.
The attention should be given more on method of sowing and other micro management such as,
weed management and harvesting practices etc.
c. Involvement of Private Sectors
42. NGO’s and private sector have shown interest due to which we have achieved
more than the targets. The private sector may be encouraged to participate in this program in
following ways:
i. To enhance the capacity of production of vegetables seed of
private sector by Research Wing. In the mean time the
department will enhance the seed production capacity of
Research Wing to cope the needs of project.
ii. To enhance the capacity building of NGO’s for production of
kitchen vegetables mainly emphasizing on sector of quality
seed, method of sowing and micro management practices.
iii. Commercialization of seed kits preparation and its sale through
private sector.
D:\DDA (ES)\F&VDP\Kitchen Gardening Project\Reports\Report of 2012\synopsis 28.01.2013.doc