Embed Size (px)
Citation preview
Scale Up Methodology for the Fine Chemical Industry -
The Influence of the Mixing in the Process
Moshe Bentolila (VisiMix Ltd. Sales and Customer Support). <[email protected]>
Roberto Novoa (VisiMix Ltd. Training and Customer Support). <[email protected]>
Abstract- In this article the authors, based on the VisiMix Software, the experience of VisiMix users and personal
knowledge from more than ten years of experience using VisiMix for API, Fine Chemicals and others, processes simulation,
show a Method for Scale Down – Scale Up of Batch – Semi Batch operations built under Hydrodynamics study of the
Mixing procedure in the reactor system. The use of the recommended method will offer the user the possibility to achieve
the best results during production stage with saving among time and currency, and at the same time increasing the
knowledge of the performed process. Several examples at the end of the article show the benefits of the proposed VisiMix
Method Loops for Scale Down - Scale Up and Hydrodynamics Considerations.
Keywords: Mixing, chemical method, stirred tanks, batch chemical reactor, simulation, scale up, scale down.
1. INTRODUCTION
Chemical production is a result of several chemical reactions and purification steps.
Purification steps and processes yield are a direct function of the level of understanding of the
reaction system. Reaction quality results have a tremendous impact in separation technology.
Chemical production is frequently performed on stirred vessels that are operated at batch or
semi-batch configuration. The choice process configuration is determined at the development
stage of the project. Therefore, if the chemical reaction and mixing are not well understood,
wrong selections will be adopted in the process development.
The financial impact of understanding the chemical reaction was assessed. It was estimated
that US$500 million can be saved by optimizing a blockbuster drug on the market (Ka Ming
Ng 2003). It is estimated that losses by poor mixing is $1 to $10 billion in the US chemical
industry alone (Kresta 2001).
Once the process (Chemical, Biological or Physical) is known well, a common situation
during the process transfer from lab to production or from site to site is the gap between the
old and new results. If the hydrodynamics knowledge is integrated with the chemical
phenomena, it will be possible to set up small and automatic equipment to prove the
relationship between mixing and chemistry. In this way, it may be the first time that the
process will be evaluated at large scale similar conditions. The main advantage of the
methodology is the combination of neither realistic conditions in small equipment and of
course catching the main normal gaps between the lab and the production results. The
combination of equipment and calculation decrease drastically the experiments work required
to solve any topic like scale-up or even improve process that running regularly in the large
scale. (Bentolila 2011).
Our goal is to develop a method, based on calculated parameters that will run properly in
the first trial on a new scale or site, similar to our successful results in the lab or in the old
facility.
In order to achieve this, we need to evaluate the process with the same conditions we will
have in the production phase.
The main parameters changed are the hydrodynamics of the system. If we are able to
identify and control these parameters we will be able to achieve the available and optimal
solution.
In this proposal we will provide to the chemical industry with a guideline for a combination
of hydrodynamics parameters with the chemical process in order to avoid problems during
the scale-up of the process.
2. PROPOSED METHOD
Process development at the chemical industry (pharmaceutical, API, food, fine chemicals,
biotechnology among others) is performed in small glass reactors. From this lab small glass
reactors experience is common to obtain kinetic constants and mixing effects. Akiti [2005]
demonstrated the dissimilarity of these reactors since a small glass reactor is not an ideal
reactor. Good data for scale up is obtained from the combination of the experimental data
with the computation facilities. One of the first authors that thought about this concept was
Eng. Berty. In is paper he explained how the computation tools are more developed and the
equipment and sensors are more exact. In this way he presents in his paper the follow flow
chard, Figure1 and confirmed by Basu [1999] and Ka Ming Ng [2003].
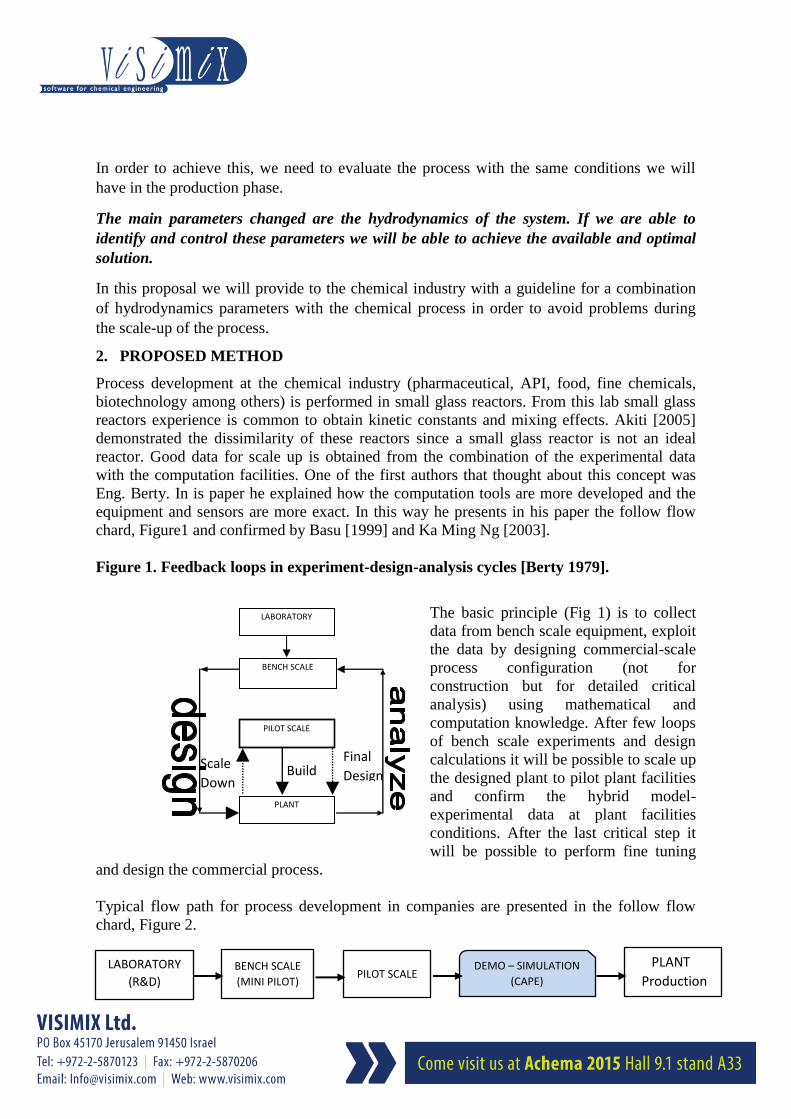
Figure 1. Feedback loops in experiment-design-analysis cycles [Berty 1979].
The basic principle (Fig 1) is to collect
data from bench scale equipment, exploit
the data by designing commercial-scale
process configuration (not for
construction but for detailed critical
analysis) using mathematical and
computation knowledge. After few loops
of bench scale experiments and design
calculations it will be possible to scale up
the designed plant to pilot plant facilities
and confirm the hybrid model-
experimental data at plant facilities
conditions. After the last critical step it
will be possible to perform fine tuning
and design the commercial process.
Typical flow path for process development in companies are presented in the follow flow
chard, Figure 2.
LABORATORY
PILOT SCALE
10-1000 liter
PLANT
1000 – 6000 liter
BENCH SCALE
1- 10 liter
Scale
Down
Final
Design Build
LABORATORY
(R&D)
BENCH SCALE
(MINI PILOT) PILOT SCALE
DEMO – SIMULATION
(CAPE)
PLANT
Production

Figure 2. Typical flow path for process development in companies
In this pathway, we can find a vast disconnection between all the required knowledge to
develop the process, including here the communication between different departments in the
company.
Flow charts for the best organization of scale up activities were presented for different
authors. Normally, all of them wrote in industrial journals. The common factor is to try to
intensify the number of experiment requires for achieving a good knowledge of the process.
Lastly, the scale-down concept is used in order to characterize the process in small scales.
The main question is how after having a good understanding of the scale-down study, we
continue to have a gap between lab results, pilot result and production results in the process.
A well set up of lab equipment, based on the intrinsic change in the scale up activities will
focus the best set of experiments to avoid this gap. Based on the Figure 1, we despoiled the
advised flow chard in a completed method that contains the follow steps:
1. - Chemistry or Biological Mechanism of the Process
2. - Design the Future Feasibility according to the Business Company Plan
3. - Calculate by different simulations tools how will be the process in the commercial scale.
4. - Set the lab equipment in the possible scale that will provide the most approximate
conditions that in the commercial production scale.
5. - Optimize the process based in the possible range work available in the commercial step.
6. - Use the medium scale to verify your model.
As we consider VisiMix the better simulation tool to estimate Hydrodynamics characteristic
parameters for batch and semi-batch process, our proposed method, that take into account
upper 6 steps is like in general view from following Figure 3.
Figure 3. VisiMix Method General Scheme: Loops for Scale Down - Scale Up and
Hydrodynamics Considerations
PRODUCTION
LABORATORY
(R&D)
VisiMix
S
C
A
L
E
D
O
W
N
ANALYZE
S
C
A
L
E
U
P
Final
Design Once the Science of the process
(Chemistry, Biology or physics)
is known well:
Process Transfer from
Laboratory to Production
Process Transfer from
site to site

The use of VisiMix as Technology Simulation tool is recommended over the judgment of
more than 200 companies who have demonstrate with different cases study where they
achieve: Reliable and accurate results, Replacing Pilot Experiments and Accelerated
Time-to-Market process all of these with User Friendly and easily accessible software.
From Figure 3 a comprehensive flow chart is as follow in Figure 4. Following this flow chart
we will clarify the importance of the hydrodynamics parameters characteristics above the
scale down – scale up process.
Figure 4. VisiMix Method Comprehensive Scheme: Loops for Scale Down - Scale Up
and Hydrodynamics Considerations
Once the Science of the process (Chemistry, Biology or physics) is known well:
Process Transfer from Laboratory to Production
Process Transfer from site to site
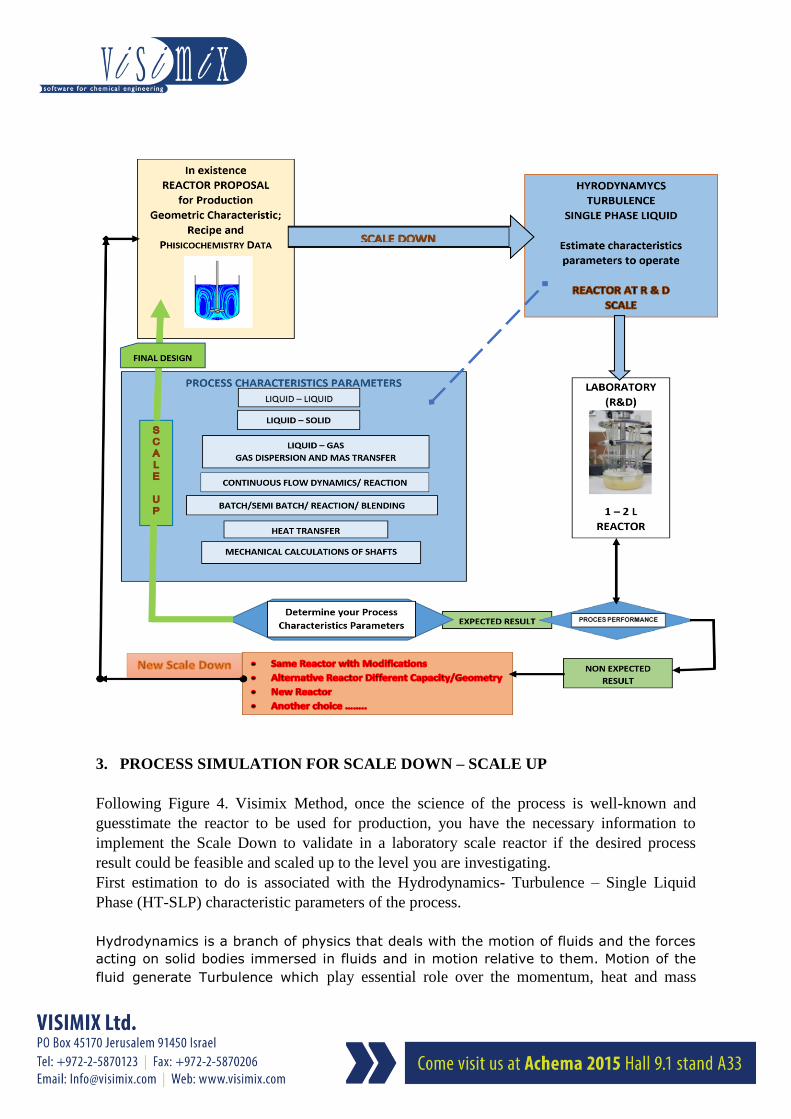
3. PROCESS SIMULATION FOR SCALE DOWN – SCALE UP
Following Figure 4. Visimix Method, once the science of the process is well-known and
guesstimate the reactor to be used for production, you have the necessary information to
implement the Scale Down to validate in a laboratory scale reactor if the desired process
result could be feasible and scaled up to the level you are investigating.
First estimation to do is associated with the Hydrodynamics- Turbulence – Single Liquid
Phase (HT-SLP) characteristic parameters of the process.
Hydrodynamics is a branch of physics that deals with the motion of fluids and the forces
acting on solid bodies immersed in fluids and in motion relative to them. Motion of the
fluid generate Turbulence which play essential role over the momentum, heat and mass
transfer during the operation with the consequent effect upon the expected times to complete
the process performance.
All this complex behavior taking place in a vessel because the energy provided by impeller
rotation (or by another mechanism) to the fluid volume (liquid, liquid-liquid, liquid-gas,
liquid-solid phases) is commonly known by the code name MIXING.
VisiMix gives the possibility to calculate the mixing characteristic parameters for different
applications as show in Table 1. Besides these key process parameters for scale up there are
others important to be estimate in order to have a broader knowledge about the process been
escalated, among others, following is recommended to calculate:
Mixing Power: Is important to be sure that reactor could operate with the installed motor
power. If the calculated mixing power exceeds 0.7 of the motor power rating you have
previously entered into the system, the warning “Mixing power is too high for your drive” is
issued.
Reynolds Number for Flow: This value is based on the average velocity of the flow and
radius of the tank. The lower limit of a turbulent regime corresponds to a Reynolds number
value of about 1500. Significant changes in hydrodynamics are observed when the Reynolds
number value is lower than 1000. If Re ≤ 1500 you have to use VisiMix Laminar.
Vortex Parameters: If the vortex is too deep and reaches the impeller, unstable gas caverns
may form around the impeller blades. The resulting shaft vibrations may reduce the reliability
of the equipment. Gas insertion into the media may also occur. VisiMix lets you know if such
conditions are expected. Due to vortex, there is an increase in the level of media near the tank
wall. In some cases, this may possibly cause media overflow. In addition, it may increase the
heat transfer area in cases of heating/cooling in jacketed tanks.
Gas pick-up from the surface: High intensity of turbulence on the surface of agitated media
results in a random formation of cavities and entrainment of gas bubbles into the liquid.
General flow pattern: The visualization is based on the results of approximate modeling the
flow with stabilized hydrodynamics. It imitates the motion of tracer particles, which have
been injected at random into the tank. The time that has elapsed since loading the tracer
particles is displayed on the screen.
As show in Table 1 there are several characteristics mixing parameters frequently applied
during Scale Down – Scale Up simulation.
Scale down process means to reproduce in laboratory scale similar values for key process
parameters, estimated utilizing production reactor – stirrer system geometric characteristics
measurements.
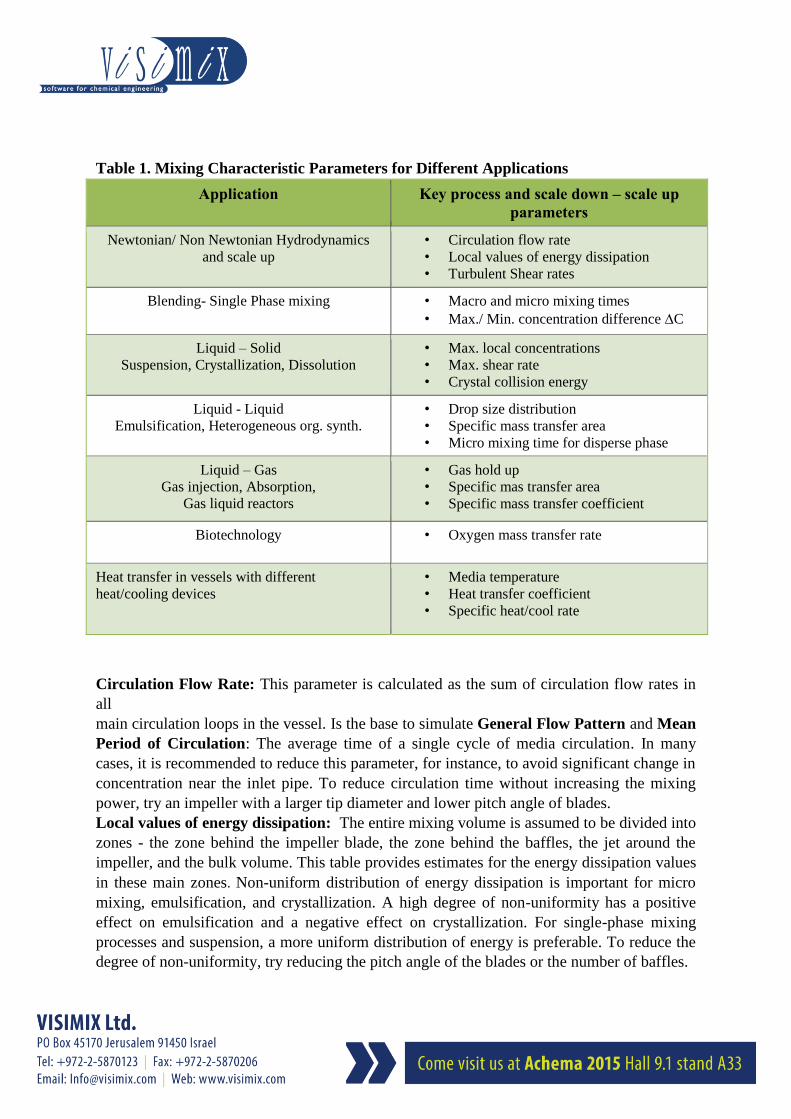
Table 1. Mixing Characteristic Parameters for Different Applications
Circulation Flow Rate: This parameter is calculated as the sum of circulation flow rates in
all
main circulation loops in the vessel. Is the base to simulate General Flow Pattern and Mean
Period of Circulation: The average time of a single cycle of media circulation. In many
cases, it is recommended to reduce this parameter, for instance, to avoid significant change in
concentration near the inlet pipe. To reduce circulation time without increasing the mixing
power, try an impeller with a larger tip diameter and lower pitch angle of blades.
Local values of energy dissipation: The entire mixing volume is assumed to be divided into
zones - the zone behind the impeller blade, the zone behind the baffles, the jet around the
impeller, and the bulk volume. This table provides estimates for the energy dissipation values
in these main zones. Non-uniform distribution of energy dissipation is important for micro
mixing, emulsification, and crystallization. A high degree of non-uniformity has a positive
effect on emulsification and a negative effect on crystallization. For single-phase mixing
processes and suspension, a more uniform distribution of energy is preferable. To reduce the
degree of non-uniformity, try reducing the pitch angle of the blades or the number of baffles.
Application Key process and scale down – scale up
parameters
Newtonian/ Non Newtonian Hydrodynamics
and scale up
• Circulation flow rate
• Local values of energy dissipation
• Turbulent Shear rates
Blending- Single Phase mixing • Macro and micro mixing times
• Max./ Min. concentration difference C
Liquid – Solid
Suspension, Crystallization, Dissolution
• Max. local concentrations
• Max. shear rate
• Crystal collision energy
Liquid - Liquid
Emulsification, Heterogeneous org. synth.
• Drop size distribution
• Specific mass transfer area
• Micro mixing time for disperse phase
Liquid – Gas
Gas injection, Absorption,
Gas liquid reactors
• Gas hold up
• Specific mas transfer area
• Specific mass transfer coefficient
Biotechnology • Oxygen mass transfer rate
Heat transfer in vessels with different
heat/cooling devices
• Media temperature
• Heat transfer coefficient
• Specific heat/cool rate

Energy dissipation - maximum value: This parameter is calculated as an average value
of the turbulent dissipation rate in the zone with the highest degree of turbulence. In most
cases, it takes place in the vortices formed behind the impeller blades. Energy dissipation
in this area depends on the difference between the impeller tip velocity and the tangential
velocity of the media. The most important micro scale phenomena, such as drop break-up,
breaking of crystals, nucleation, and efficient micro mixing take place in these zones.
Energy dissipation - average value: This parameter represents the volume average
specific power, and is calculated as the mixing power per kg of media.
Energy dissipation in the tank bulk volume: This value controls micro mixing in single-
phase reactors. To increase this value without increasing the mixing power, reduce the
pitch angle of the blades or the number or width of the baffles; alternatively, increase the
tip diameter of the impeller and reduce the number of revolutions.
Turbulent shear rates in different zones: This parameter must not be confused with
average velocity gradient, and its value is typically one or two orders of magnitude greater
than the latter.
The turbulent shear rate, turb. is the characteristic shear rate at the micro scale level that
governs such processes as mass transport to growing and from dissolving solid particles.
Characteristic time of micro mixing: This parameter represents an estimate of the time
required to achieve uniform distribution of the dissolved substances down to the molecular
level. It is assumed to depend on the molecular diffusion of solute, while the scale of mixing
due to molecular diffusion only is supposed to correspond to the micro scale of turbulence.
Micro mixing time is estimated both as the diffusion time, and as the maximum lifetime of a
volume element, which has elapsed before the element enters the zone of the maximum
dissipation rate. The final value of this parameter is calculated with respect to both estimates.
Characteristic size of the volume element is assumed equal to the micro scale of turbulence in
the tank bulk volume.
Macro mixing time: This parameter characterizes the time required for the distribution of
solute (admixture, tracer, paint, etc.) throughout the entire volume of the tank. It is calculated
as the time required to reduce the maximum difference of local concentrations of the
admixture to about 1% of its final average value (in batch mixing conditions). The admixture
is assumed to be injected instantly. Selection of the real duration of blending is based on the
sum of Macro mixing time and the Characteristic time of micro mixing. To reduce the macro
mixing time in an un-baffled tank, try increasing tip diameter of impeller or slope angle of the
blades. In baffled tanks, reducing the macro mixing time is usually achieved by increasing the
mixing power.
Once HT - SLP characteristics parameters for production reactor are computed it will be
required to do the same work for laboratory reactor to establish operational specifications to
achieve similar values on it.
At this point it will be possible to define and execute a set of experiments (DOE), comprising
optimization possibilities. The evaluation of these results will allow to decide if directly go to
Scale Up to the initial production reactor proposal or, on the contrary, go for another different
proposition as reflected in Figure 4. VisiMix Method.
4. DEMONSTRATIVE REAL EXAMPLES
Following examples were worked up by different VisiMix users from several customers
companies. Most of these summarized examples were presented in Boston, July 2011, in the
course of the First VisiMix Users Meeting.
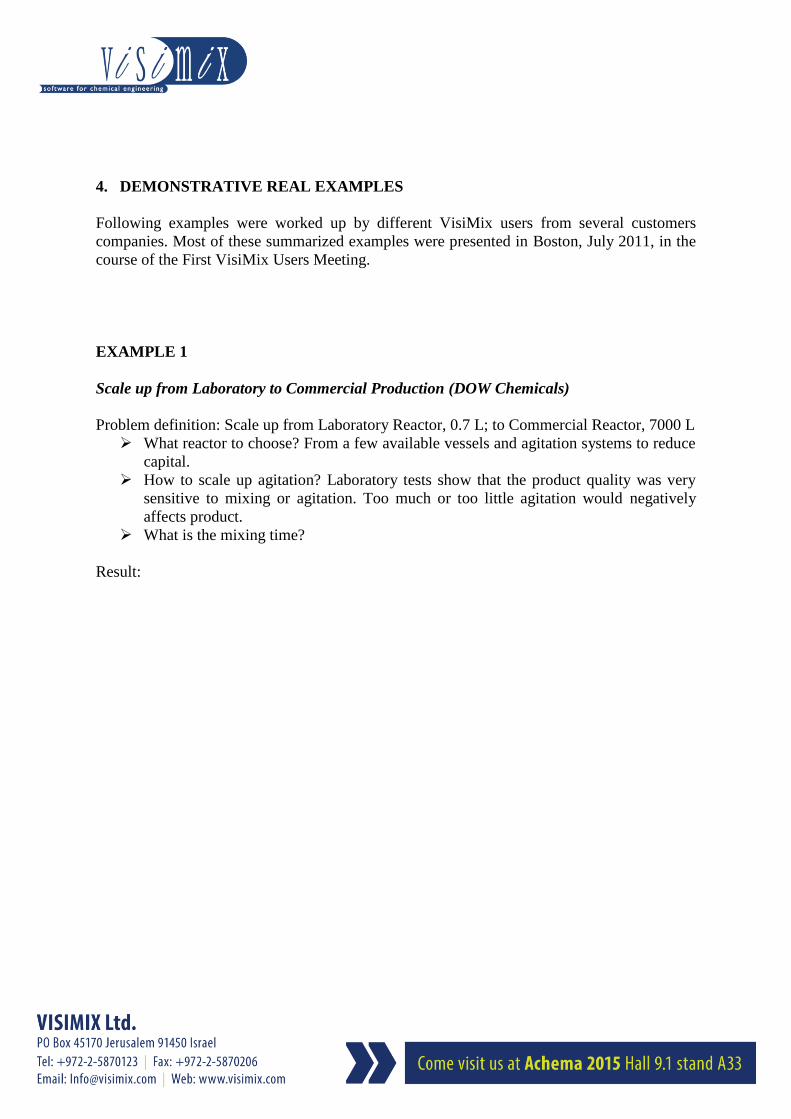
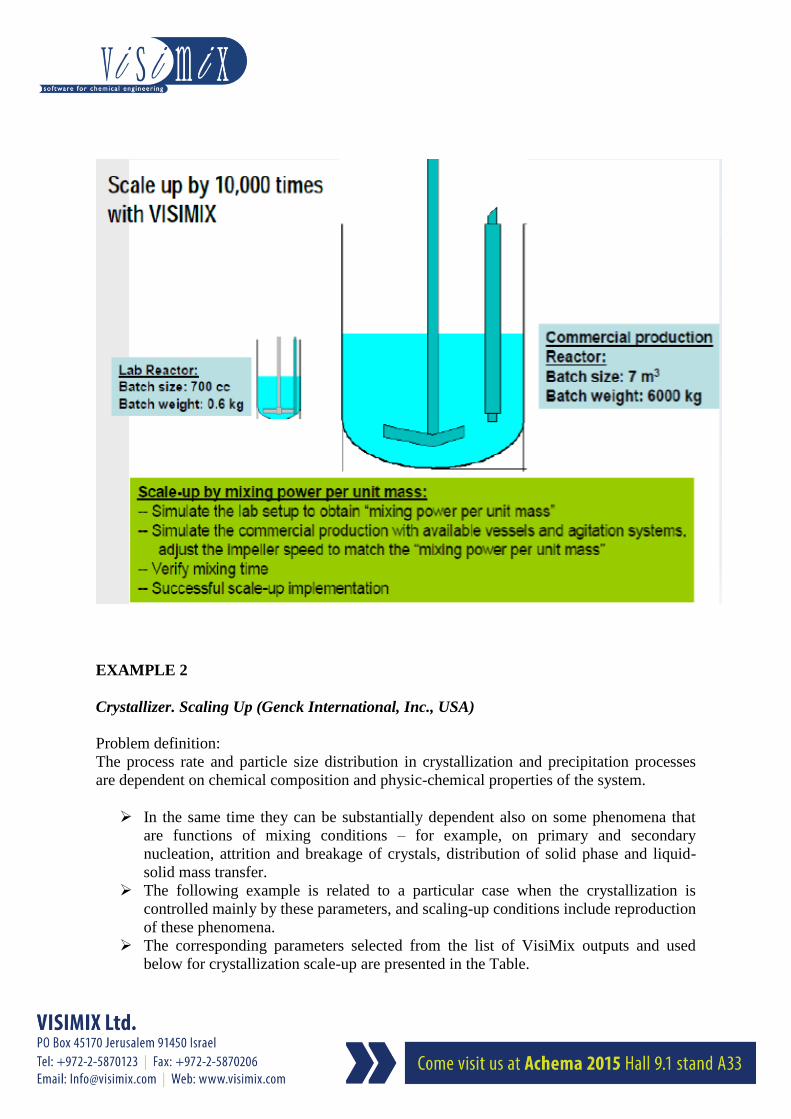
EXAMPLE 1
Scale up from Laboratory to Commercial Production (DOW Chemicals)
Problem definition: Scale up from Laboratory Reactor, 0.7 L; to Commercial Reactor, 7000 L
What reactor to choose? From a few available vessels and agitation systems to reduce
capital.
How to scale up agitation? Laboratory tests show that the product quality was very
sensitive to mixing or agitation. Too much or too little agitation would negatively
affects product.
What is the mixing time?
Result:
EXAMPLE 2
Crystallizer. Scaling Up (Genck International, Inc., USA)
Problem definition:
The process rate and particle size distribution in crystallization and precipitation processes
are dependent on chemical composition and physic-chemical properties of the system.
In the same time they can be substantially dependent also on some phenomena that
are functions of mixing conditions – for example, on primary and secondary
nucleation, attrition and breakage of crystals, distribution of solid phase and liquid-
solid mass transfer.
The following example is related to a particular case when the crystallization is
controlled mainly by these parameters, and scaling-up conditions include reproduction
of these phenomena.
The corresponding parameters selected from the list of VisiMix outputs and used
below for crystallization scale-up are presented in the Table.
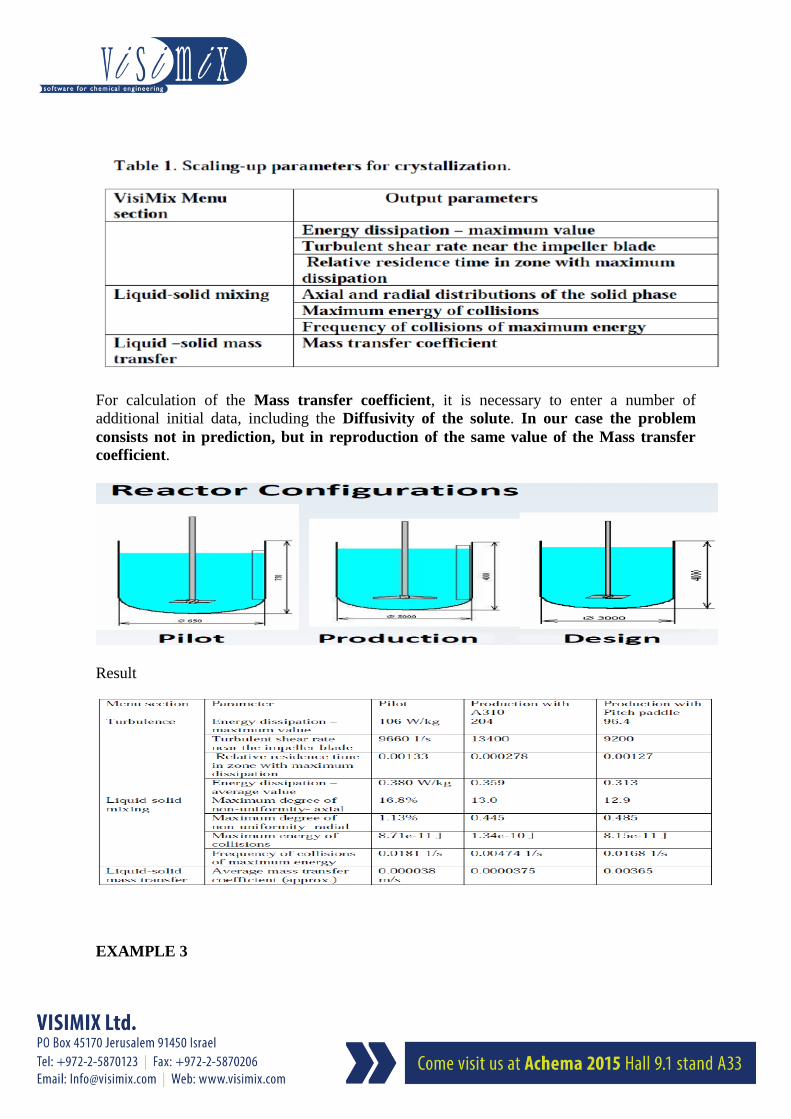
For calculation of the Mass transfer coefficient, it is necessary to enter a number of
additional initial data, including the Diffusivity of the solute. In our case the problem
consists not in prediction, but in reproduction of the same value of the Mass transfer
coefficient.
Result
EXAMPLE 3

Typical Fine Chemical Development. Batch and Semi Batch Process
Problem definition:
GAP between R&D and Production result
Task: decreasing the number of required batches for validation process in the production step.
The traditional approach: running the process at increased size reactors and looking for
optimal process and operational parameters at every stage.
The VisiMix analysis: implementation of mixing calculations at the first development step as
part of the characterization of the process. This activity provides the understanding of the
influence of the hydrodynamics in the process. By scaling down calculations, setting the lab
equipment according to the output results from the production equipment simulation, it is
possible to find the operation surface range for a robust process.
The VisiMix solution: the relationship between mixing parameters and experimental work
based on QbD practice, provide the company with a deep “know how” about the process and
the scale up activities and decrease the “out of specifications” material during the process at
different sizes.
The VisiMix analysis: implementation of mixing calculations at the first development step as
part of the characterization of the process. This activity provides the understanding of the
influence of the hydrodynamics in the process. By scaling down calculations, setting the lab
equipment according to the output results from the production equipment simulation, it is
possible to find the operation surface range for a robust process.
Batches/Year Using VisiMix Method
The Result:
Decreasing the
required batches for
validation in the production
step from around 100 to
below five. Savings of at
least $ 1, 000, 000 per project
Complete the required
knowledge for the process
understanding.
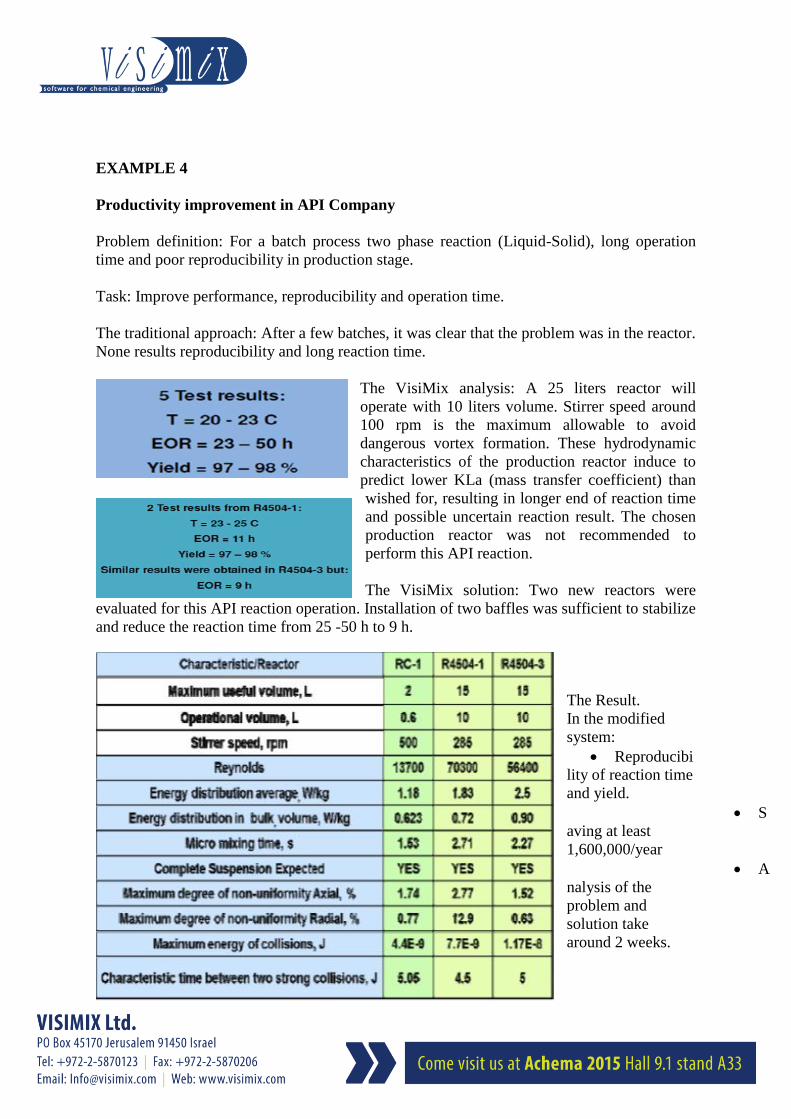
EXAMPLE 4
Productivity improvement in API Company
Problem definition: For a batch process two phase reaction (Liquid-Solid), long operation
time and poor reproducibility in production stage.
Task: Improve performance, reproducibility and operation time.
The traditional approach: After a few batches, it was clear that the problem was in the reactor.
None results reproducibility and long reaction time.
The VisiMix analysis: A 25 liters reactor will
operate with 10 liters volume. Stirrer speed around
100 rpm is the maximum allowable to avoid
dangerous vortex formation. These hydrodynamic
characteristics of the production reactor induce to
predict lower KLa (mass transfer coefficient) than
wished for, resulting in longer end of reaction time
and possible uncertain reaction result. The chosen
production reactor was not recommended to
perform this API reaction.
The VisiMix solution: Two new reactors were
evaluated for this API reaction operation. Installation of two baffles was sufficient to stabilize
and reduce the reaction time from 25 -50 h to 9 h.
The Result.
In the modified
system:
Reproducibi
lity of reaction time
and yield.
S
aving at least
1,600,000/year
A
nalysis of the
problem and
solution take
around 2 weeks.
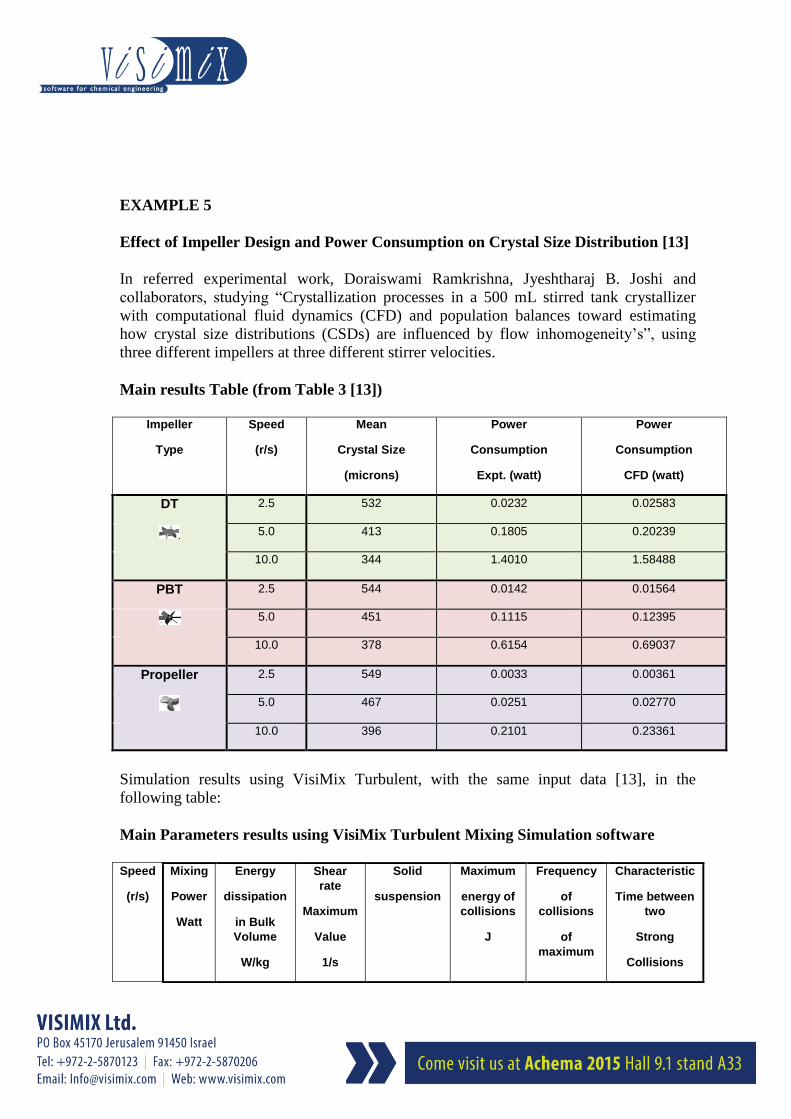
EXAMPLE 5
Effect of Impeller Design and Power Consumption on Crystal Size Distribution [13]
In referred experimental work, Doraiswami Ramkrishna, Jyeshtharaj B. Joshi and
collaborators, studying “Crystallization processes in a 500 mL stirred tank crystallizer
with computational fluid dynamics (CFD) and population balances toward estimating
how crystal size distributions (CSDs) are influenced by flow inhomogeneity’s”, using
three different impellers at three different stirrer velocities.
Main results Table (from Table 3 [13])
Impeller
Type
Speed
(r/s)
Mean
Crystal Size
(microns)
Power
Consumption
Expt. (watt)
Power
Consumption
CFD (watt)
DT 2.5 532 0.0232 0.02583
5.0 413 0.1805 0.20239
10.0 344 1.4010 1.58488
PBT 2.5 544 0.0142 0.01564
5.0 451 0.1115 0.12395
10.0 378 0.6154 0.69037
Propeller 2.5 549 0.0033 0.00361
5.0 467 0.0251 0.02770
10.0 396 0.2101 0.23361
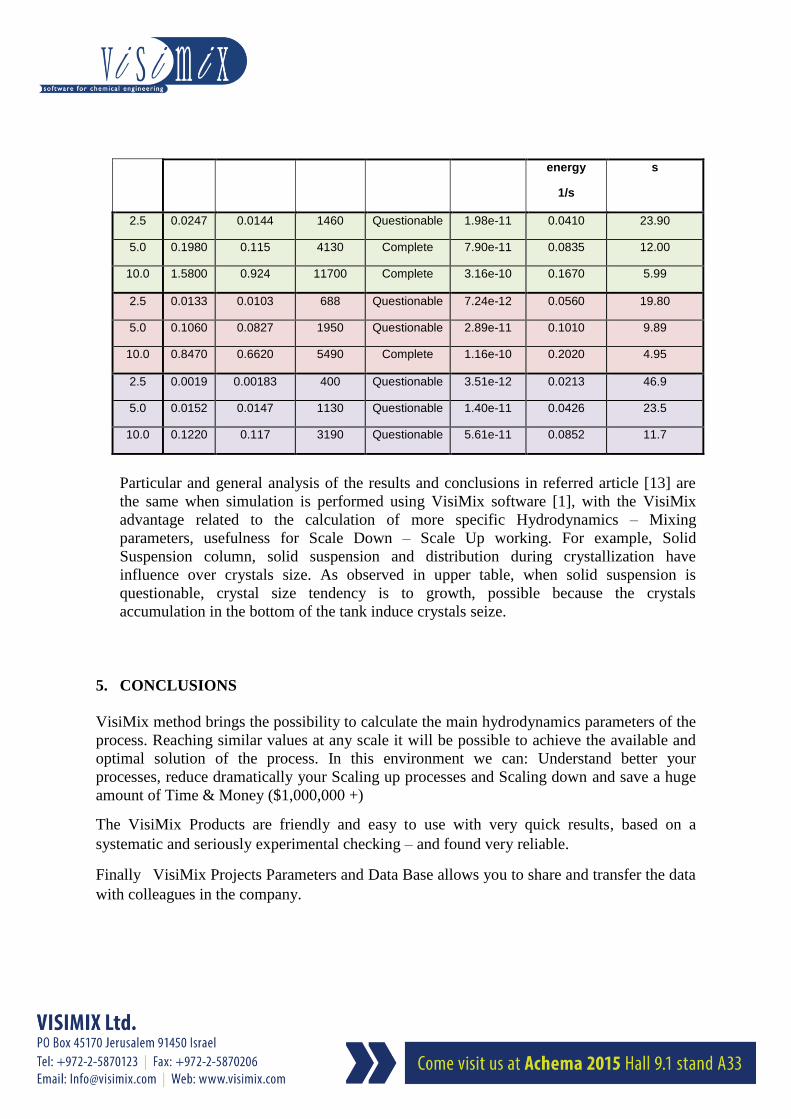
Simulation results using VisiMix Turbulent, with the same input data [13], in the
following table:
Main Parameters results using VisiMix Turbulent Mixing Simulation software
Speed
(r/s)
Mixing
Power
Watt
Energy
dissipation
in Bulk
Volume
W/kg
Shear
rate
Maximum
Value
1/s
Solid
suspension
Maximum
energy of
collisions
J
Frequency
of
collisions
of
maximum
Characteristic
Time between
two
Strong
Collisions
energy
1/s
s
2.5 0.0247 0.0144 1460 Questionable 1.98e-11 0.0410 23.90
5.0 0.1980 0.115 4130 Complete 7.90e-11 0.0835 12.00
10.0 1.5800 0.924 11700 Complete 3.16e-10 0.1670 5.99
2.5 0.0133 0.0103 688 Questionable 7.24e-12 0.0560 19.80
5.0 0.1060 0.0827 1950 Questionable 2.89e-11 0.1010 9.89
10.0 0.8470 0.6620 5490 Complete 1.16e-10 0.2020 4.95
2.5 0.0019 0.00183 400 Questionable 3.51e-12 0.0213 46.9
5.0 0.0152 0.0147 1130 Questionable 1.40e-11 0.0426 23.5
10.0 0.1220 0.117 3190 Questionable 5.61e-11 0.0852 11.7
Particular and general analysis of the results and conclusions in referred article [13] are
the same when simulation is performed using VisiMix software [1], with the VisiMix
advantage related to the calculation of more specific Hydrodynamics – Mixing
parameters, usefulness for Scale Down – Scale Up working. For example, Solid
Suspension column, solid suspension and distribution during crystallization have
influence over crystals size. As observed in upper table, when solid suspension is
questionable, crystal size tendency is to growth, possible because the crystals
accumulation in the bottom of the tank induce crystals seize.
5. CONCLUSIONS
VisiMix method brings the possibility to calculate the main hydrodynamics parameters of the
process. Reaching similar values at any scale it will be possible to achieve the available and
optimal solution of the process. In this environment we can: Understand better your
processes, reduce dramatically your Scaling up processes and Scaling down and save a huge
amount of Time & Money ($1,000,000 +)
The VisiMix Products are friendly and easy to use with very quick results, based on a
systematic and seriously experimental checking – and found very reliable.
Finally VisiMix Projects Parameters and Data Base allows you to share and transfer the data
with colleagues in the company.
REFERENCES
1. VisiMix Website, http://www.visimix.com/, User Publications, Boston Conference
Highlights, Users Guide.
2. Bentolila M, “Predicting mixing in stirred reactor and in micro reactor. Research
Proposal for PhD. in Chemical Engineering”, Israel Institute of Technology.
September, 2006
3. Bentolila M, “Influence of Flow Parameters: Application in Scale-Up Processes in
Chemical and Biological Systems”. Dissertation in partial fulfillment of the
requirements for the degree of Doctor of Philosophy 2014, Hebrew University of
Jerusalem, December 2013
4. Braginsky, L. N. and Belevizkaya, M. A., Theory. Found. of Chem. Eng. (USSR), 25,
6 (1991, USA translation - 1992).
5. Braginsky, L. et al, "Mixing of Liquids. Theoretical Basements and Methods of
Technical Calculation." - Chimia, Leningrad, 1984, 336 pp.
6. Braginsky, L. et al, "Mechanical Mixing Devices. The Method for Calculation."
(State standard) - Leningrad, 1976, 1988, 100 pp.
7. Braginsky, L. et al, "The Modern Approach to Modeling and Improvement of Unit
Operations in Mixing Equipment". Chemie (Israel), 1992, N12.
8. Genck, W., Hasson, M., Manoff, E., Novoa, R. and Bentolila, L. “Computer Aided
Process Engineering at Chemagis”, Pharmaceutical Engineering, 30 – 38, July/August
2011.
9. Basu, P.K. et al., "Consider a New Approach to Pharmaceutical Process
Development", CEP, August (5), 82-90 (1999).
10. Berty J.M., "The Changing Role of the Pilot Plant", CEP. September, 48-51 (1979).
11. Ka Ming, Ng. and Wibono, C., "Beyond Process Design: "The emergence of a
Process Development Focus"", Korean J. Chem. Eng., 20(5), 791-798 (2003).
12. Paul, E.L., Atiemo-Obeng, V.A., Kresta, S.M., "Handbook of Industrial Mixing",
Wiley Interscience. (2004).
13. Doraiswami Ramkrishna, Jyeshtharaj B. Joshi, et al, “Effect of Impeller Design and
Power Consumption on Crystal Size Distribution”, AIChE Journal, 3596 – 3613,
October 2014 Vol. 60, No. 10.