Embed Size (px)
Citation preview
SOUTH CAROLINA STATE ENERGY PLAN PREPARED BY: OFFICE OF REGULATORY STAFF
Introduction
SOUTH CAROLINA
STATE ENERGY PLAN
www.energy.sc.gov
Prepared By: Office of Regulatory Staff Office of Regulatory Staff: Energy Office
This document dated July 29, 2016, represents the first phase of the development of
the State Energy Plan. This draft includes a look at the current state of Energy in South Carolina. Phase II of the development will look to provide policy recommendations.
The South Carolina State Energy Plan is a comprehensive blueprint to build a reliable, resilient, clean, and affordable energy system for South Carolina residents and
businesses. Specifically, the plan is designed to maximize environmental quality, energy conservation, and energy efficiency while minimizing the cost of energy
throughout the state.
DRAFT
Draft Dated 7/29/2016
SOUTH CAROLINA STATE ENERGY PLAN PREPARED BY: OFFICE OF REGULATORY STAFF
Introduction
Contents
I. EXECUTIVE SUMMARY .......................................................................................................................... vii
II. INTRODUCTION: THE BASICS .............................................................................................................. viii
What is the South Carolina State Energy Plan? ..................................................................................... viii
Who is Responsible for Energy Policy and Regulation in South Carolina? ............................................ viii
Who is Responsible for Energy Planning in South Carolina? ................................................................... ix
Who Developed the South Carolina State Energy Plan and How Was It Done? ..................................... ix
How is the Plan Informed by South Carolinians? ...................................................................................... x
III. SOUTH CAROLINA’S ENERGY LANDSCAPE .............................................................................................. 2
Demographic Snapshot ............................................................................................................................. 2
Economic Output: GDP and Manufacturing ............................................................................................. 3
Environmental Outlook ............................................................................................................................. 4
IV. ELECTRICITY AND NATURAL GAS REPORTS ............................................................................................ 8
Electric and Natural Gas Utilities .............................................................................................................. 8
Electric Transmission System Overview ............................................................................................ 20
U.S. Natural Gas System Overview .................................................................................................... 21
South Carolina Natural Gas Infrastructure Overview ....................................................................... 22
South Carolina Natural Gas Consumption and Supply ...................................................................... 22
Propane Distribution System ............................................................................................................. 24
V. ELECTRICITY AND NATURAL GAS DEMAND BY END USE SECTOR ........................................................ 27
Generation .......................................................................................................................................... 27
Capacity .............................................................................................................................................. 30
Electricity and Natural Gas Consumption .......................................................................................... 31
VI. ENERGY EFFICIENCY PROGRAMS .......................................................................................................... 33
VII. RENEWABLE ENERGY PROGRAMS ........................................................................................................ 34
VIII. ENERGY FOR TRANSPORTATION .......................................................................................................... 38
Public or Mass Transit Programs ....................................................................................................... 39
Carpooling or Ridesharing .................................................................................................................. 39
DRAFT
Draft Dated 7/29/2016
SOUTH CAROLINA STATE ENERGY PLAN PREPARED BY: OFFICE OF REGULATORY STAFF
Introduction
Fueling Infrastructure ......................................................................................................................... 40
IX. REGULATIONS AND STATUTES AFFECTING UTILITIES ........................................................................... 41
X. RESOURCE PLANNING .......................................................................................................................... 42
Integrated Resource Plan ........................................................................................................................ 42
Statewide Generation Resources ............................................................................................................ 43
Resource Roles ................................................................................................................................... 43
Future Outlook: Projected Generation and Capacity Mix ................................................................ 44
DRAFT
Draft Dated 7/29/2016
SOUTH CAROLINA STATE ENERGY PLAN PREPARED BY: OFFICE OF REGULATORY STAFF
Introduction
ACRONYMS ORS – Office of Regulatory Staff – represents the South Carolina public’s interest in utility regulation of
major utility providers and distributors
PSC – Public Service Commission – regulates rates and services of public utilities in South Carolina
PURC – State Regulation of Public Utilities Review Committee ‐ evaluates the actions of the Public
Service Commission, the members of the commission, the ORS, and the Executive Director of the ORS on
an annual basis and appointments of the PSC Commissioners
SCDHEC – South Carolina Department of Health and Environmental Control – responsible for the welfare
of public health and the environment in South Carolina
CPW‐ Commission of Public Works – Various city commissions throughout SC provide electricity, water
distribution, and sewer collection/treatment to residents
PHMSA – Pipeline and Hazardous Materials Safety Administration – Department Of Transportation
agency that regulates and enforces safe and reliable operations of US pipeline transportation
EIA – Energy Information Administration – collects and analyzes data to aid sound energy policymaking
throughout the US
MWh – Megawatt‐hour – Electrical Unit of measure (An energy output of one Megawatt for the
duration of one hour)
DEC – Duke Energy Carolinas – generates and supplies electricity in western North and South Carolina
DEP – Duke Energy Progress – generates and supplies electricity primarily in eastern North and South
Carolina, and the Asheville, N.C., area
SCE&G – South Carolina Electric and Gas – generates and supplies electricity and natural gas services to
South Carolina businesses and residents. A subsidiary of SCANA Corporation
IOUs – Investor‐Owned Utilities – Utility distributors and generators managed as a private enterprise, as
opposed to a state or federally‐owned distributor
SAIDI ‐ System Average Interruption Duration Index – the average electricity outage duration for each
customer served. Used as a reliability indicator of electrical distributors
SAIFI ‐ System Average Interruption Frequency Index – the average number of electricity interruptions of
each customer served, usually in a given year
DCGT – Dominion Carolina Gas Transmission – a natural gas transportation company serving wholesale
and direct industrial customers throughout South Carolina
SNG – Southern Natural Gas – a natural gas pipeline transporting company
DRAFT
Draft Dated 7/29/2016

SOUTH CAROLINA STATE ENERGY PLAN PREPARED BY: OFFICE OF REGULATORY STAFF
Introduction
NGA – Natural Gas Authorities – a series of natural gas providers throughout South Carolina
Bcf/BTU – Billion Cubic Feet/British Thermal Unit – Natural Gas Unit of measure (1 Bcf = 1 trillion BTU’s)
DRAFT
Draft Dated 7/29/2016
SOUTH CAROLINA STATE ENERGY PLAN PREPARED BY: OFFICE OF REGULATORY STAFF
Introduction
GLOSSARY
Narrative
CAFE Standards – Corporate Average Fuel Economy Standards. Enacted by Congress in 1975 to decrease
energy usage of vehicles by increasing standards for the fuel economy of cars and smaller trucks.
Distributed Energy Resources (DER) – Smaller power sources, such as solar farms, wind turbines, and
microgrids, that can be aggregated to provide poser necessary to meet regular demand.
Eastern Interconnection – One of the major AC (Alternate Current) electrical grids in North America.
This grid reaches from Canada to the Atlantic coast (excluding Quebec), south down to Florida, and west
towards the Rocky Mountains.
LNG Export Facilities – Plants that distribute liquefied natural gas to natural gas companies for the
purpose of energy distribution among residential, industrial, and commercial consumers.
NERC Reliability Standards – Standards enforced by the Federal Power Act that help sustain the reliable
transmission and delivery of electricity utilities in the country.
Petrochemical Plants – Facilities that convert crude oil, minerals, and natural gas into products used in
industrial processes.
Appendices
Mass‐Based Program – An approach to Clean Power Plan regulations; a state’s goal is expressed by a
maximum number of tons of CO2 emissions.
Rate‐Based Program – An approach to Clean Power Plan regulations; a state’s emission goal is
expressed as emissions of CO2 per MWh of electricity generated.
Shale Gas – Natural gas found trapped underground between shale formations in the U.S.
DRAFT
Draft Dated 7/29/2016

SOUTH CAROLINA STATE ENERGY PLAN PREPARED BY: OFFICE OF REGULATORY STAFF
Introduction
I. EXECUTIVE SUMMARY
Placeholder.
DRAFT
Draft Dated 7/29/2016
SOUTH CAROLINA STATE ENERGY PLAN PREPARED BY: OFFICE OF REGULATORY STAFF
Introduction
II. INTRODUCTION: THE BASICS
What is the South Carolina State Energy Plan?
The South Carolina State Energy Plan (State Energy Plan or the plan) is a comprehensive blueprint for a
reliable, resilient, clean, and affordable energy system for South Carolina (S.C.) residents and businesses.
Specifically, the plan is designed to maximize (to the extent practical) reliability, environmental quality,
energy conservation, and energy efficiency while minimizing the cost of energy throughout the state.
Who is Responsible for Energy Policy and Regulation in South Carolina?
The South Carolina General Assembly establishes the state’s energy policy through legislation that
governs the state’s electric utilities and energy‐related aspects of manufacturing, commerce,
transportation, and economic development. In the electric utility area, the General Assembly has
established governance for investor‐owned utilities (IOUs), municipal providers, cooperatives, and
Santee Cooper. The South Carolina Office of Regulatory Staff (ORS) and the PSC have a role in a large
portion of that responsibility, but not the entire portion. Also, from an agency standpoint, a number of
agencies implement aspects of energy policy including Commerce, the South Carolina Department of
Health and Environmental Control (DHEC), S.C. Department of Natural Resources (DNR), S.C.
Department of Agriculture, and S.C. Department of Transportation (DOT), among others.
DRAFT
Draft Dated 7/29/2016

SOUTH CAROLINA STATE ENERGY PLAN PREPARED BY: OFFICE OF REGULATORY STAFF
Introduction
In South Carolina, two state agencies are primarily charged with developing the state’s energy
regulation and policy framework. These agencies are the ORS and the Public Service Commission of
South Carolina (PSC).
In 2004, the South Carolina General Assembly created the ORS to represent the public interest in utility
regulation. In the agency’s enabling legislation, public interest is defined as a balance among the
interests of the public, the economic development of South Carolina, and the financial integrity of the
state’s public utilities.
The PSC is the adjudicative arm of public utility regulation in South Carolina. The seven commissioners
(each elected to four‐year terms by the S.C. General Assembly) make rulings in regulatory proceedings
for utilities with regard to programs, tariffs, and rate changes.
The South Carolina Public Service Authority (Santee Cooper) has a statutorily established governing
board that is appointed by the Governor, deemed fully qualified by the State Regulation of Public
Utilities Review Committee, and confirmed by the state Senate. The state’s electric distribution
cooperatives are governed by boards of directors that are elected by their members. Municipal electric
systems are governed either by city council or an elected commission or board of public works.
The State Regulation of Public Utilities Review Committee is also charged with oversight of the PSC and ORS, and with making policy recommendations to the General Assembly. DHEC is the state’s environmental regulatory agency and also plays an important role in South Carolina’s
energy policy landscape. Other state agencies playing roles in the implementation of South Carolina’s
energy policy include the S.C. Department of Commerce, DNR, the DOT, and the state agriculture and
forestry commissions.
Who is Responsible for Energy Planning in South Carolina?
Development of a State Energy Plan is the responsibility of the former State Energy Office, which became part of the ORS in July 2015 as a result of legislation restructuring South Carolina state government. This office, now referred to as the ORS Energy Office, is charged with serving as the principal energy planning entity for the state. While the regulatory role of the ORS applies primarily to IOUs, the planning role of the ORS Energy Office is different and covers the entire electric and natural gas sector as well as others like the transportation sector.
Who Developed the South Carolina State Energy Plan and How Was It Done?
Development of the State Energy Plan was directed by the ORS and its Energy Office, as specified in
statute. The following organizations were represented on the Steering Committee with several other
organizations being represented in the working subcommittees to assist in development of the plan:
City of Rock Hill
Conservation Voters of South Carolina (CVSC)
DRAFT
Draft Dated 7/29/2016
SOUTH CAROLINA STATE ENERGY PLAN PREPARED BY: OFFICE OF REGULATORY STAFF
Introduction
Department of Health and Environmental Control (DHEC)
Duke Energy Corporation (Duke)
Electric Cooperatives of South Carolina (ECSC)
Public Utilities Review Committee (PURC)
SC Senate Judiciary Committee & House Labor, Commerce and Industry Committee
South Carolina Coastal Conservation League (SCCCL)
South Carolina Electric and Gas Company (SCE&G)
South Carolina Energy Users
South Carolina Public Service Authority (Santee Cooper)
Southern Environmental Law Center (SELC)
Office of Regulatory Staff (ORS)
How is the Plan Informed by South Carolinians?
Comments on the plan were solicited throughout the process from stakeholders and members of the
public through public hearings and a public comment page on the ORS Energy Office website.
Comments received throughout the public hearing and comment process are available online.
(See Appendix A for South Carolina legislation regarding the State Energy Plan, State Energy Office, the
ORS, PSC, and DHEC.)
DRAFT
Draft Dated 7/29/2016

SOUTH CAROLINA STATE ENERGY PLAN PREPARED BY: OFFICE OF REGULATORY STAFF
Part I: Policy 1
PARTONEPolicy Recommendations
This document dated July 29, 2016, represents the first phase of the development of the State Energy Plan (see Part Two: South Carolina’s Energy System below). This draft of Part Two includes a look at the current state of Energy in South Carolina. Phase II of the development of the State Energy Plan (currently underway) will seek to provide relevant policy recommendations. These recommendations, once complete, will form the basis for this section (Part One: Policy Recommendations).
DRAFT
Draft Dated 7/29/2016

SOUTH CAROLINA STATE ENERGY PLAN PREPARED BY: OFFICE OF REGULATORY STAFF
Part II: Baseline 1
PARTTWOSouth Carolina’s Energy System
DRAFT
Draft Dated 7/29/2016
SOUTH CAROLINA STATE ENERGY PLAN PREPARED BY: OFFICE OF REGULATORY STAFF
Part II: Baseline 2
III. SOUTH CAROLINA’S ENERGY LANDSCAPE
Demographic Snapshot
Consumers of energy across all fuel types, within all utilities, and across the state are diverse.
Population, age, housing, income and the interplay among these socioeconomic and demographic
metrics all affect energy use in the Palmetto State. A detailed picture of the major economic and
demographic drivers for South Carolina is included in Appendix B. Below are the major points:
Population – The state has outpaced the nation in percentage growth in population for the past
40 years due to both natural growth within the state itself and a gradual population shift
towards the southeastern United States. South Carolina’s exponential job growth, tier 1
research universities and low cost of living have attracted over 170,000 in new residents from all
over the U.S. to South Carolina in 2014 alone. Moreover, South Carolina’s population growth is
expected to continue at an estimated rate of 11 percent over the next 10 years; however,
roughly one quarter of the state’s counties (11 out of 46) have and will likely continue to
experience a decline in population.
Age – South Carolina has a relatively young state, with an average age of 37.9. Though South
Carolina is a popular destination for retirees and baby boomer (a trend that is expected to
continue), there are more households with residents under the age of 18 than over the age of
65.
Housing – Approximately two thirds of housing stock in the state is single‐family homes. The
remaining one third is split almost equally between mobile homes and multi‐family dwellings.
Multi‐family housing generally uses much less energy because of smaller square footage, while
mobile homes use relatively more energy due to lack of insulation and their stand‐alone
construction.
Income – South Carolina’s real median household income has fluctuated considerably over the
past 30 years (1984‐2014), with relatively low growth equating to an increase of 0.1 percent
annually. In 2013, the state’s poverty rate was still the ninth highest in the nation, with just over
18 percent of the population classified as living in households with income below $23,550.
While conventional wisdom has suggested that lower income equates to lower energy use,
recent research by the state’s electric cooperatives indicates that the relationship between
income and energy use is complicated, with middle income residents using less energy per
person than those with the lowest incomes (see Appendix B).
Energy Use and Expenditure per Capita – The average American spent $3,052 per person (2012
data) while the average South Carolinian spent $3,310 for residential and transportation energy
combined. South Carolinians consumed 347 million British Thermal Units (BTUs) per person in
2009, compared to an average of 308 million for the average U.S. resident. South Carolina
ranked 18 out of all states based on 2009 data according to the U.S. Department of Energy.
DRAFT
Draft Dated 7/29/2016
SOUTH CAROLINA STATE ENERGY PLAN PREPARED BY: OFFICE OF REGULATORY STAFF
Part II: Baseline 3
Economic Output: GDP and Manufacturing
Gross Domestic Product in South Carolina
Economic activity is heavily dependent upon adequate and reliable sources of energy, so the growth
trends for measures of South Carolina’s economic output are important.
A growing state economy and population require energy. Households use natural gas and electricity to
heat and cool their homes, cook meals, watch television, and perform a host of activities that make up
everyday life. Gasoline fuels the tens of millions of miles that are driven each year in South Carolina for
households and businesses, and manufacturers use energy in all of its forms to create durable and
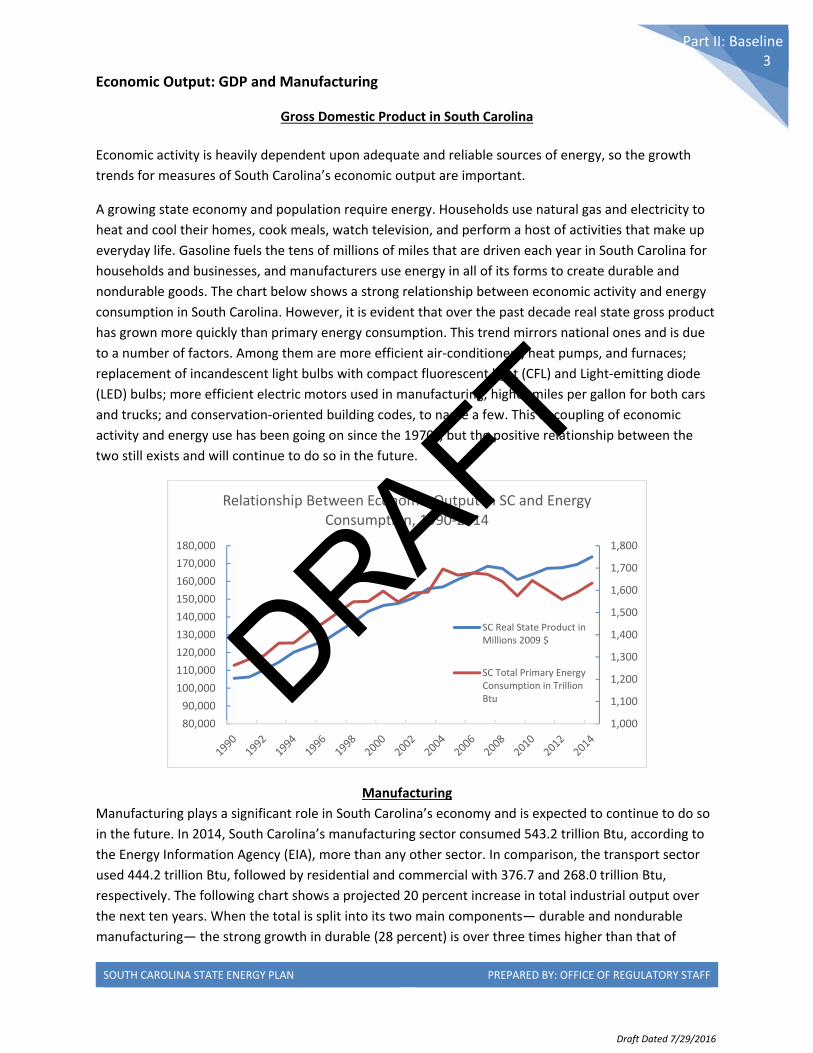
nondurable goods. The chart below shows a strong relationship between economic activity and energy
consumption in South Carolina. However, it is evident that over the past decade real state gross product
has grown more quickly than primary energy consumption. This trend mirrors national ones and is due
to a number of factors. Among them are more efficient air‐conditioners, heat pumps, and furnaces;
replacement of incandescent light bulbs with compact fluorescent light (CFL) and Light‐emitting diode
(LED) bulbs; more efficient electric motors used in manufacturing; higher miles per gallon for both cars
and trucks; and conservation‐oriented building codes, to name a few. This decoupling of economic
activity and energy use has been going on since the 1970s, but the positive relationship between the
two still exists and will continue to do so in the future.
Manufacturing
Manufacturing plays a significant role in South Carolina’s economy and is expected to continue to do so
in the future. In 2014, South Carolina’s manufacturing sector consumed 543.2 trillion Btu, according to
the Energy Information Agency (EIA), more than any other sector. In comparison, the transport sector
used 444.2 trillion Btu, followed by residential and commercial with 376.7 and 268.0 trillion Btu,
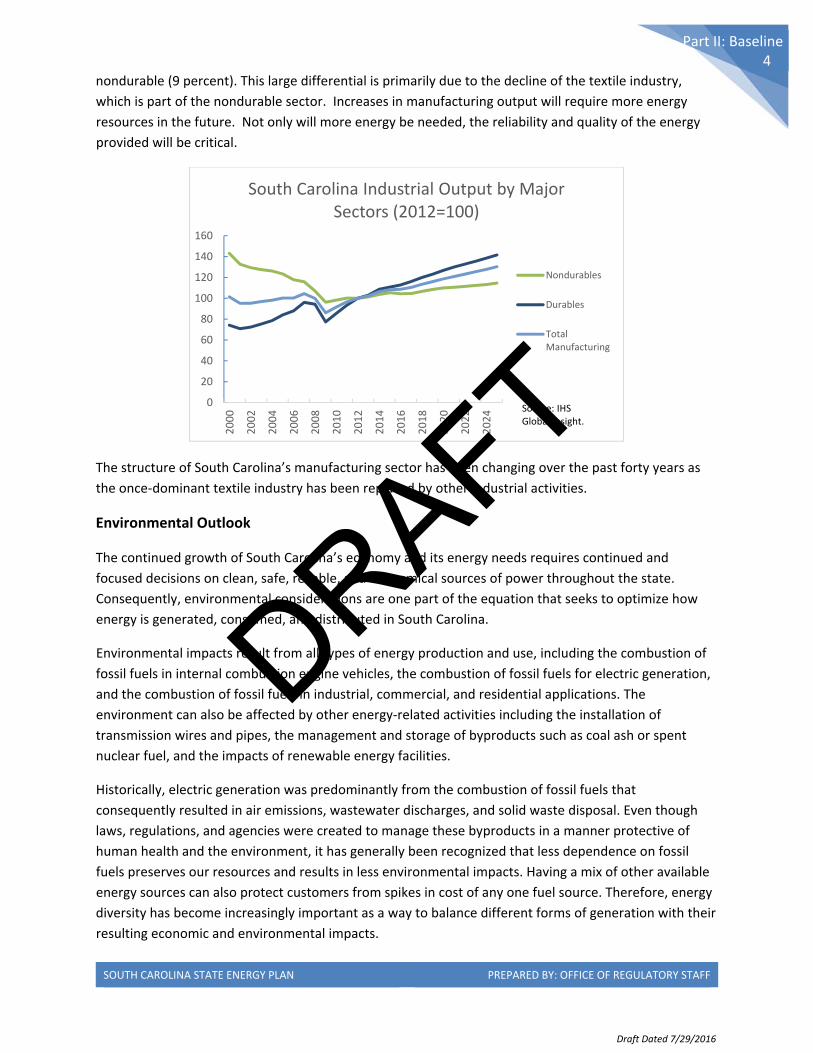
respectively. The following chart shows a projected 20 percent increase in total industrial output over
the next ten years. When the total is split into its two main components— durable and nondurable
manufacturing— the strong growth in durable (28 percent) is over three times higher than that of
1,000
1,100
1,200
1,300
1,400
1,500
1,600
1,700
1,800
80,000
90,000
100,000
110,000
120,000
130,000
140,000
150,000
160,000
170,000
180,000
Relationship Between Economic Output In SC and Energy Consumption, 1990‐2014
SC Real State Product inMillions 2009 $
SC Total Primary EnergyConsumption in TrillionBtuDRAFT
Draft Dated 7/29/2016
SOUTH CAROLINA STATE ENERGY PLAN PREPARED BY: OFFICE OF REGULATORY STAFF
Part II: Baseline 4
nondurable (9 percent). This large differential is primarily due to the decline of the textile industry,
which is part of the nondurable sector. Increases in manufacturing output will require more energy
resources in the future. Not only will more energy be needed, the reliability and quality of the energy
provided will be critical.
The structure of South Carolina’s manufacturing sector has been changing over the past forty years as
the once‐dominant textile industry has been replaced by other industrial activities.
Environmental Outlook
The continued growth of South Carolina’s economy and its energy needs requires continued and
focused decisions on clean, safe, reliable, and economical sources of power throughout the state.
Consequently, environmental considerations are one part of the equation that seeks to optimize how
energy is generated, consumed, and distributed in South Carolina.
Environmental impacts result from all types of energy production and use, including the combustion of
fossil fuels in internal combustion engine vehicles, the combustion of fossil fuels for electric generation,
and the combustion of fossil fuels in industrial, commercial, and residential applications. The
environment can also be affected by other energy‐related activities including the installation of
transmission wires and pipes, the management and storage of byproducts such as coal ash or spent
nuclear fuel, and the impacts of renewable energy facilities.
Historically, electric generation was predominantly from the combustion of fossil fuels that
consequently resulted in air emissions, wastewater discharges, and solid waste disposal. Even though
laws, regulations, and agencies were created to manage these byproducts in a manner protective of
human health and the environment, it has generally been recognized that less dependence on fossil
fuels preserves our resources and results in less environmental impacts. Having a mix of other available
energy sources can also protect customers from spikes in cost of any one fuel source. Therefore, energy
diversity has become increasingly important as a way to balance different forms of generation with their
resulting economic and environmental impacts.
0
20
40
60
80
100
120
140
1602000
2002
2004
2006
2008
2010
2012
2014
2016
2018
2020
2022
2024
South Carolina Industrial Output by Major Sectors (2012=100)
Nondurables
Durables
TotalManufacturing
Source: IHSGlobal Insight.
DRAFT
Draft Dated 7/29/2016
SOUTH CAROLINA STATE ENERGY PLAN PREPARED BY: OFFICE OF REGULATORY STAFF
Part II: Baseline 5
Energy diversity is defined as having a diverse set of energy options and the fuel sources to go with it.
The options include but are not limited to coal, natural gas, nuclear, hydro, biomass, pumped storage,
wind, and solar. Each has its own unique set of circumstances and environmental impacts. By
maintaining an appropriate energy diversity mix in South Carolina, a reliable, resilient, clean, and
affordable energy system will continue to be available to all residents and businesses in South Carolina.
Air emissions from industrial facilities, electric utilities, and vehicle exhaust affect the quality of the air
we breathe. Wastewater discharges and water consumed for power generation affect the quality and
quantity of water in our lakes and rivers. Coal ash and nuclear waste require special handling.
In South Carolina, the Department of Health and Environmental Control (SCDHEC) is the lead regulatory
agency directing utility and industry compliance with air, water and other environmental standards (See
Appendix A). Many federal regulations also come into play (see Appendix T). Working with these
agencies, utilities have significantly reduced particulate matter, sulfur dioxide, nitrogen oxides, and
mercury, among other pollutants. Through these efforts, South Carolina is meeting or doing better than
required under the ever‐tightening federal standards.
Since energy decisions potentially affect the quality of South Carolina’s environment in many ways, it is
important to consider key environmental indicators in order to assess how a State Energy Plan balances
economic and environmental impacts over time.
Ambient Air Quality
The Clean Air Act (CAA), which was last amended in 1990, requires the Environmental Protection Agency
(EPA) to set National Ambient Air Quality Standards (NAAQS) for pollutants that are common in outdoor
air, considered harmful to public health and the environment, and that come from numerous and
diverse sources including fossil fuel‐fired power plants. The CAA established two types of national air
quality standards. Primary standards set limits to protect public health, including the health of at‐risk
populations such as people with pre‐existing heart or lung disease (for example, asthmatics); children;
and older adults. Secondary standards set limits to protect public welfare, including protection against
visibility impairment and protection from damage to animals, crops, vegetation, and buildings.
The EPA must designate areas as meeting (attainment) or not meeting (nonattainment) the NAAQS.
States are required to develop a general plan to attain and maintain the NAAQS in all areas of the
country and a specific plan to attain the standards for each area designated as nonattainment.
In addition, emissions of carbon dioxide, methane, and other greenhouse gases from facilities in South
Carolina are facing increased attention as part of federal regulatory efforts. The EPA recently developed
greenhouse gas regulations for the electric power sector’s existing facilities. Although the EPA’s Clean
Power Plan mandates are currently stayed by the U.S. Supreme Court, greenhouse gases from electric
power utilities may still be subject to regulations in the future (see Appendix U).
Large fossil fuel units are classified as major stationary sources and are required to install pollution‐
control equipment and to meet specific emissions limitations. In addition, under the 1990 CAA
amendments, major stationary sources must obtain operating permits. Smaller fossil fuel units may not
have extensive pollution control devices, but may instead have efficiency standards.
DRAFT
Draft Dated 7/29/2016
SOUTH CAROLINA STATE ENERGY PLAN PREPARED BY: OFFICE OF REGULATORY STAFF
Part II: Baseline 6
Because of environmental policies implemented by the SCDHEC, South Carolina is currently in
compliance/attainment with all primary and secondary NAAQS. Appendix B provides more information
on ambient air concentration trends.
Mercury in the Environment
Mercury (Hg) is a naturally occurring metal that can cause adverse health effects to exposed humans
and other animals (Mergler et al. 2007). Mercury can be released into the environment by natural
causes, such as forest fires and volcanic eruptions, or by anthropogenic activities, such as the
combustion of fossil fuels (Lindberg et al. 2007). If released into the atmosphere, Hg can be deposited in
terrestrial and aquatic ecosystems far from its original source (Lindberg et al. 2007). After deposition, Hg
can be methylated through biochemical processes into methylmercury (MeHg), and it is this form that
can be biomagnified in the food chain (Munthe et al. 2007). For this reason, various government
agencies have issued consumption advisories for fish and other aquatic life that may pose a health risk
to humans (Glover et al. 2010). Appendix B provides information on consumption advisories in South
Carolina.
While there may be pockets of localized mercury deposition from U.S. power plants, it is recognized that
the majority (over 75%) of mercury deposition that occurs within the U.S. originates from outside of the
U.S. (Butler et al. 2007). In order to minimize the U.S. portion of utility emissions, the EPA finalized the
Mercury Air Toxics Rule in April 2012. This rule requires U.S. coal‐fired power plants to install maximum
achievable mercury‐control technology no later than April 2016. This rule will require what amounts to a
90% reduction of mercury from U.S. sources, thus minimizing man‐made U.S. mercury emissions.
It is important to again note that the impact of anthropogenic mercury occurs when the deposited
mercury is converted to methylmercury (see above) and enters the food chain. Methyl mercury
conversion primarily occurs in blackwater swamps and wetlands (Ibid). The work of the EPA and DHEC
with the Mercury Air Toxics Rule will greatly minimize U.S. deposition and further reduce conversion and
impact to the environment.
Water Quality
Water pollutants and temperature variances are regulated under the Clean Water Act. The basis of the
Clean Water Act was enacted in 1948 and was called the Federal Water Pollution Control Act, but the
Act was significantly reorganized and expanded in 1972. The "Clean Water Act" became the Act's
common name with amendments in 1972.
The Clean Water Act makes it unlawful to discharge any pollutant from a point source into navigable
waters, unless a permit is obtained. The EPA’s National Pollutant Discharge Elimination System (NPDES)
permit program controls discharges. The S.C. Pollution Control Act (PCA) is the basis of South Carolina's
water‐pollution control and water‐quality protection programs and provides the authority for SCDHEC
to permit facilities, including power plants that must apply for and maintain five‐year renewable
discharge permits. NPDES permits are issued by the Department of Health and Environmental Control.
Facilities are required to monitor these discharges on a regular basis and submit results monthly to
SCDHEC. SCDEHC maintains several tools to share information with the public about water quality issues
DRAFT
Draft Dated 7/29/2016
SOUTH CAROLINA STATE ENERGY PLAN PREPARED BY: OFFICE OF REGULATORY STAFF
Part II: Baseline 7
in the state (SC Watershed Atlas: http://gis.dhec.sc.gov/watersheds/, and Water Quality Tool:
http://gisweb01.dhec.sc.gov/water/Stormwater.html?mode=1/).
Water Quantity
Growing population and energy use continue to stress the available water supply for energy generation,
drinking water, recreation, agriculture, fish and wildlife, and other important uses in South Carolina.
Water is withdrawn from South Carolina lakes and rivers and used for both power generation
(hydroelectric facilities including pumped storage) and cooling. In fact, most manmade lakes were
created specifically for these purposes (for example, Lake Monticello, Lake Murray, Lake Wateree).
While over 20.4 trillion gallons are used for these purposes, over 85% of this usage is non‐consumptive
and does not affect water supply. In addition, any water used and returned to the environment must be
permitted by SCDHEC and meet water‐quality standards.
SCDHEC and the South Carolina Department of Natural Resources (DNR) are currently developing basin‐
wide surface water models assessing existing surface water systems and demands in South Carolina, as
well as updating the DNR’s State Water Plan. The results of this assessment will provide a decision
support tool for surface‐water permitting, water‐policy development, water planning, and drought
management.
Coal Combustion Residuals
Fly ash, bottom ash, and gypsum are byproducts of coal combustion known as coal combustion residuals
(CCR) and can contain low levels of heavy metals such as arsenic, mercury, selenium, cadmium, and
chromium. The EPA’s recently finalized CCR Rule (April 2015) regulates coal ash as a non‐hazardous
waste. South Carolina Public Service Authority (Santee Cooper), South Carolina Electric & Natural Gas
(SCE&G), and Duke Energy are all developing compliance plans to comply with this rule.
Nuclear Waste
Under the terms of the Atlantic Compact Commission, commercial low‐level nuclear waste produced in
South Carolina is disposed of at the Barnwell Low‐Level Radioactive Waste Disposal Facility, licensed by
SCDHEC. Rates for disposing of this waste are approved by the Public Service Commission (PSC). Spent
fuel rods, however, are currently stored on site at South Carolina’s nuclear power plants until the
federal government opens a permanent disposal site. These sites are licensed by the Nuclear Regulatory
Commission (NRC).
DRAFT
Draft Dated 7/29/2016
SOUTH CAROLINA STATE ENERGY PLAN PREPARED BY: OFFICE OF REGULATORY STAFF
Part II: Baseline 8
IV. ELECTRICITY AND NATURAL GAS REPORTS
Electric and Natural Gas Utilities Forty‐six (46) electric distribution utilities and 16 natural gas distribution utilities operate in South
Carolina. These utilities serve the over 4.8 million residents of the state. Furthermore, these utilities are
responsible for the electric transmission and distribution lines as well as the natural gas pipeline system
that crisscross South Carolina.
These utilities can be grouped into six categories: investor‐owned utilities, state‐owned utility, electric
cooperatives, municipal electric utilities, municipal natural gas utilities, and wholesale power producers
(see Appendix C for complete listings of utilities by category).
Investor‐Owned Electric Utilities
Investor‐owned electric utilities are privately owned utilities whose stock is publicly traded. Their rates are regulated by the PSC, and they are allowed to earn a rate of return on their investments.
The four South Carolina investor‐owned electric utilities are as follows:
Duke Energy Carolinas
Duke Energy Progress
Lockhart Power Company
South Carolina Electric & Gas Company
Duke Energy
Headquartered in Charlotte, N.C., Duke Energy is a Fortune 125 company serving approximately 7.4
million electric customers in six states.
Duke Energy’s subsidiaries, Duke Energy Carolinas (DEC) and Duke Energy Progress (DEP), are regulated
public utilities primarily engaged in the generation, transmission, distribution, and sale of electricity to
approximately 4 million customers in portions of North Carolina and South Carolina. In 2012, Duke
Energy and Progress Energy merged to form today’s Duke Energy, one of the largest electric power
holding companies in the United States. However, DEC and DEP continue to operate as separate utilities
under their parent company Duke Energy. DEC and DEP maintain separate costs, rates, and service‐area
responsibilities.
DRAFT
Draft Dated 7/29/2016
SOUTH CAROLINA STATE ENERGY PLAN PREPARED BY: OFFICE OF REGULATORY STAFF
Part II: Baseline 9
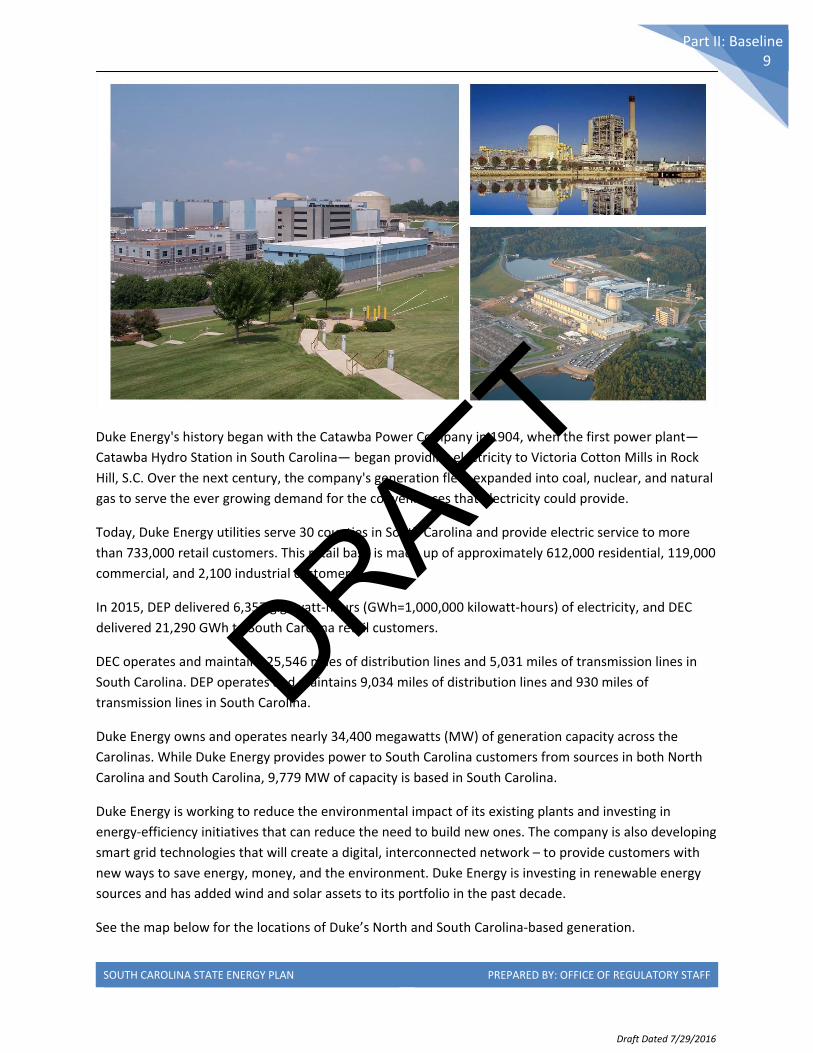
Duke Energy's history began with the Catawba Power Company in 1904, when the first power plant—
Catawba Hydro Station in South Carolina— began providing electricity to Victoria Cotton Mills in Rock
Hill, S.C. Over the next century, the company's generation fleet expanded into coal, nuclear, and natural
gas to serve the ever growing demand for the conveniences that electricity could provide.
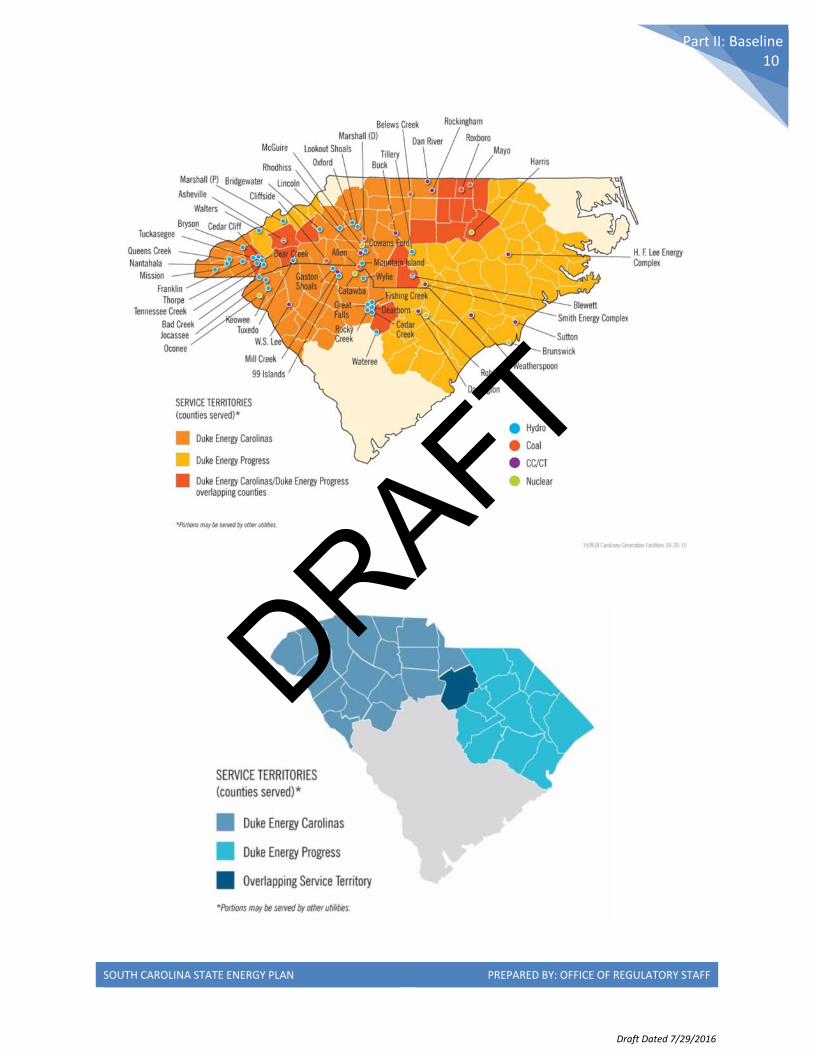
Today, Duke Energy utilities serve 30 counties in South Carolina and provide electric service to more
than 733,000 retail customers. This retail base is made up of approximately 612,000 residential, 119,000
commercial, and 2,100 industrial customers.
In 2015, DEP delivered 6,357 gigawatt‐hours (GWh=1,000,000 kilowatt‐hours) of electricity, and DEC
delivered 21,290 GWh to South Carolina retail customers.
DEC operates and maintains 25,546 miles of distribution lines and 5,031 miles of transmission lines in
South Carolina. DEP operates and maintains 9,034 miles of distribution lines and 930 miles of
transmission lines in South Carolina.
Duke Energy owns and operates nearly 34,400 megawatts (MW) of generation capacity across the
Carolinas. While Duke Energy provides power to South Carolina customers from sources in both North
Carolina and South Carolina, 9,779 MW of capacity is based in South Carolina.
Duke Energy is working to reduce the environmental impact of its existing plants and investing in
energy‐efficiency initiatives that can reduce the need to build new ones. The company is also developing
smart grid technologies that will create a digital, interconnected network – to provide customers with
new ways to save energy, money, and the environment. Duke Energy is investing in renewable energy
sources and has added wind and solar assets to its portfolio in the past decade.
See the map below for the locations of Duke’s North and South Carolina‐based generation.
DRAFT
Draft Dated 7/29/2016
SOUTH CAROLINA STATE ENERGY PLAN PREPARED BY: OFFICE OF REGULATORY STAFF
Part II: Baseline 10
DRAFT
Draft Dated 7/29/2016
SOUTH CAROLINA STATE ENERGY PLAN PREPARED BY: OFFICE OF REGULATORY STAFF
Part II: Baseline 11
Lockhart Power Company
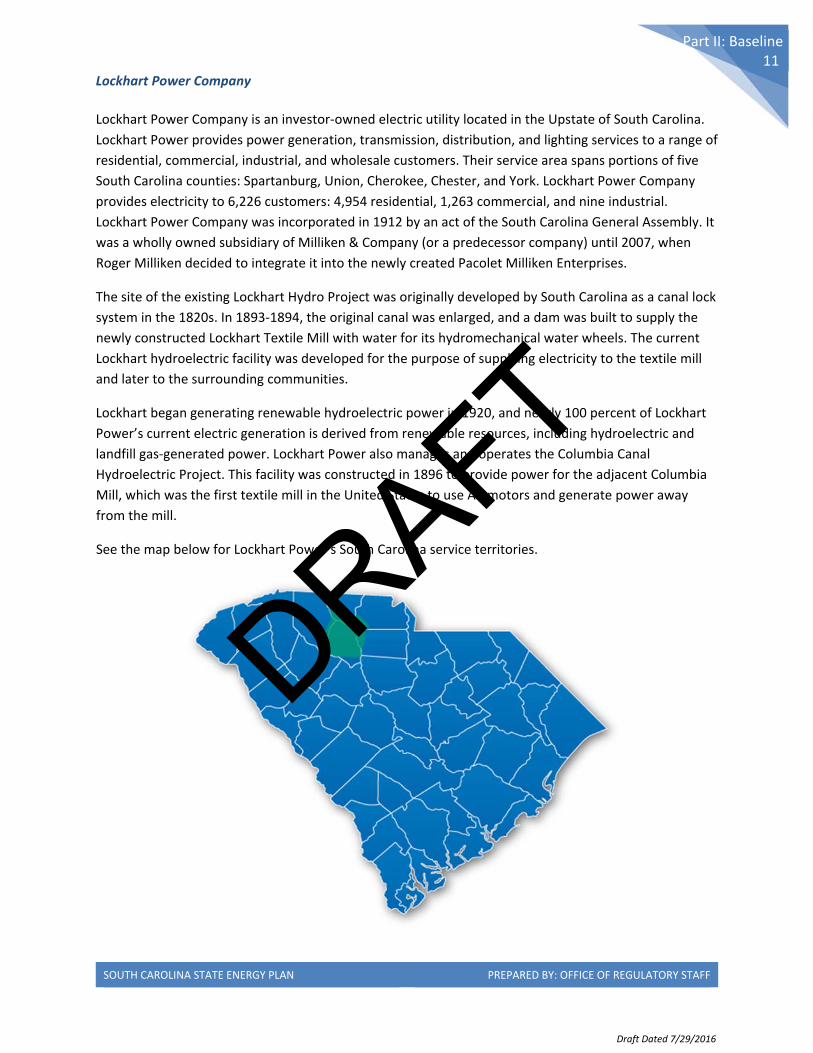
Lockhart Power Company is an investor‐owned electric utility located in the Upstate of South Carolina.
Lockhart Power provides power generation, transmission, distribution, and lighting services to a range of
residential, commercial, industrial, and wholesale customers. Their service area spans portions of five
South Carolina counties: Spartanburg, Union, Cherokee, Chester, and York. Lockhart Power Company
provides electricity to 6,226 customers: 4,954 residential, 1,263 commercial, and nine industrial.
Lockhart Power Company was incorporated in 1912 by an act of the South Carolina General Assembly. It
was a wholly owned subsidiary of Milliken & Company (or a predecessor company) until 2007, when
Roger Milliken decided to integrate it into the newly created Pacolet Milliken Enterprises.
The site of the existing Lockhart Hydro Project was originally developed by South Carolina as a canal lock
system in the 1820s. In 1893‐1894, the original canal was enlarged, and a dam was built to supply the
newly constructed Lockhart Textile Mill with water for its hydromechanical water wheels. The current
Lockhart hydroelectric facility was developed for the purpose of supplying electricity to the textile mill
and later to the surrounding communities.
Lockhart began generating renewable hydroelectric power in 1920, and nearly 100 percent of Lockhart
Power’s current electric generation is derived from renewable resources, including hydroelectric and
landfill gas‐generated power. Lockhart Power also manages and operates the Columbia Canal
Hydroelectric Project. This facility was constructed in 1896 to provide power for the adjacent Columbia
Mill, which was the first textile mill in the United States to use AC motors and generate power away
from the mill.
See the map below for Lockhart Power’s South Carolina service territories.
DRAFT
Draft Dated 7/29/2016
SOUTH CAROLINA STATE ENERGY PLAN PREPARED BY: OFFICE OF REGULATORY STAFF
Part II: Baseline 12
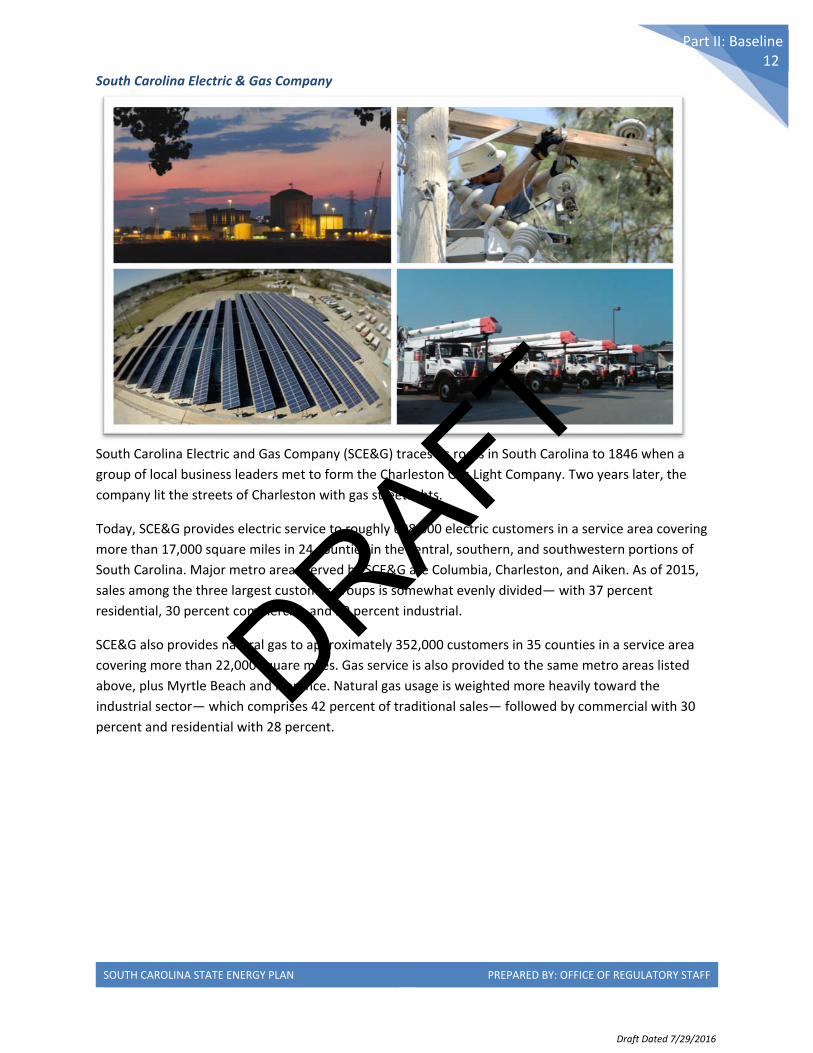
South Carolina Electric & Gas Company
South Carolina Electric and Gas Company (SCE&G) traces its roots in South Carolina to 1846 when a
group of local business leaders met to form the Charleston Gas Light Company. Two years later, the
company lit the streets of Charleston with gas streetlights.
Today, SCE&G provides electric service to roughly 698,000 electric customers in a service area covering
more than 17,000 square miles in 24 counties in the central, southern, and southwestern portions of
South Carolina. Major metro areas served by SCE&G are Columbia, Charleston, and Aiken. As of 2015,
sales among the three largest customer groups is somewhat evenly divided— with 37 percent
residential, 30 percent commercial, and 29 percent industrial.
SCE&G also provides natural gas to approximately 352,000 customers in 35 counties in a service area
covering more than 22,000 square miles. Gas service is also provided to the same metro areas listed
above, plus Myrtle Beach and Florence. Natural gas usage is weighted more heavily toward the
industrial sector— which comprises 42 percent of traditional sales— followed by commercial with 30
percent and residential with 28 percent.
DRAFT
Draft Dated 7/29/2016
SOUTH CAROLINA STATE ENERGY PLAN PREPARED BY: OFFICE OF REGULATORY STAFF
Part II: Baseline 13
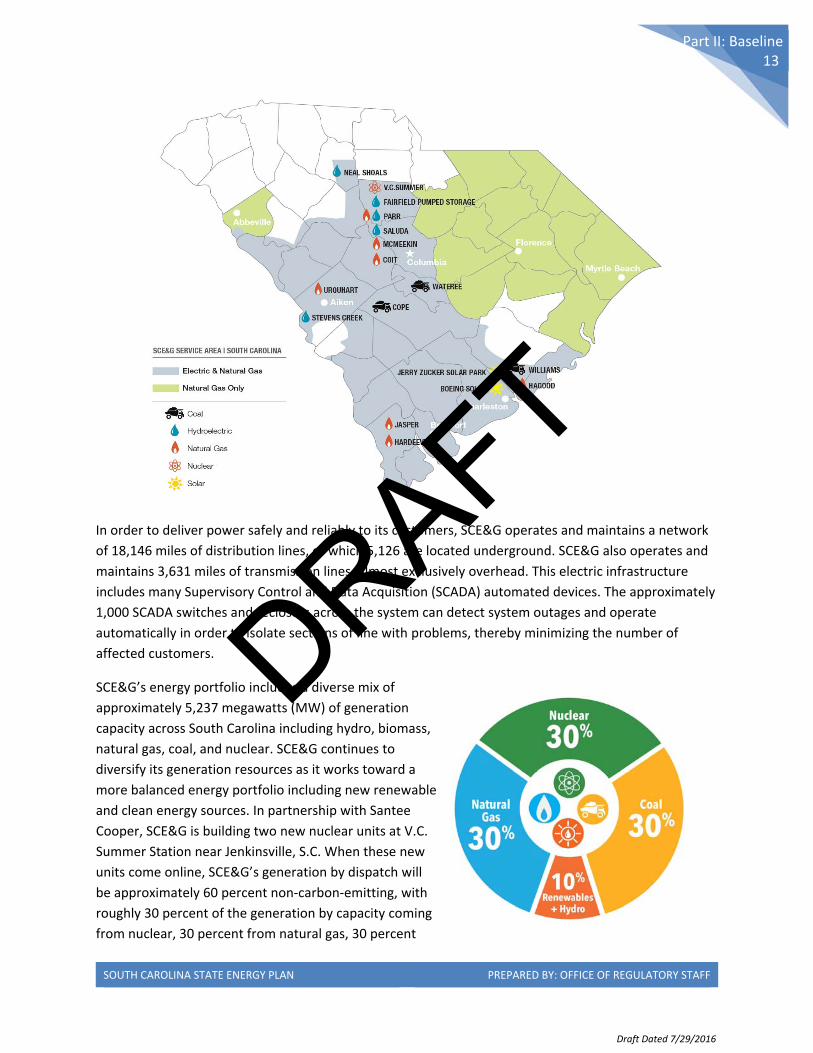
In order to deliver power safely and reliably to its customers, SCE&G operates and maintains a network
of 18,146 miles of distribution lines, of which 5,126 are located underground. SCE&G also operates and
maintains 3,631 miles of transmission lines, almost exclusively overhead. This electric infrastructure
includes many Supervisory Control and Data Acquisition (SCADA) automated devices. The approximately
1,000 SCADA switches and reclosers across the system can detect system outages and operate
automatically in order to isolate sections of line with problems, thereby minimizing the number of
affected customers.
SCE&G’s energy portfolio includes a diverse mix of
approximately 5,237 megawatts (MW) of generation
capacity across South Carolina including hydro, biomass,
natural gas, coal, and nuclear. SCE&G continues to
diversify its generation resources as it works toward a
more balanced energy portfolio including new renewable
and clean energy sources. In partnership with Santee
Cooper, SCE&G is building two new nuclear units at V.C.
Summer Station near Jenkinsville, S.C. When these new
units come online, SCE&G’s generation by dispatch will
be approximately 60 percent non‐carbon‐emitting, with
roughly 30 percent of the generation by capacity coming
from nuclear, 30 percent from natural gas, 30 percent
DRAFT
Draft Dated 7/29/2016
SOUTH CAROLINA STATE ENERGY PLAN PREPARED BY: OFFICE OF REGULATORY STAFF
Part II: Baseline 14
from coal, and 10 percent from renewables and hydro. This generation mix is expected to result in a
reduction of carbon emissions by SCE&G of almost 50 percent from 2005 levels.
Natural Gas Investor‐Owned Utilities (IOUs)
South Carolina has two natural gas IOUs: SCE&G and Piedmont Natural Gas (PNG).
South Carolina Electric & Gas SCE&G delivers gas to approximately 352,000 residential, commercial, and industrial customers in 35 of the 46 counties in the Midlands, Pee Dee, and coastal communities of South Carolina. In 2015, SCE&G purchased a total volume of 62 billion cubic feet (BCF) of natural gas from multiple suppliers that were transported into the state by Dominion Carolinas Gas Transmission (DCGT), Transco, and Southern Natural Gas (SNG).
SCE&G delivers natural gas through 447 miles of high‐pressure transmission pipelines and 9,064 miles of
distribution mains to serve South Carolina’s growing cities and communities. The transmission steel pipe
ranges from 4 inches to 20 inches in diameter and operates at 469 to 1,200 pounds per square inch (psi).
The distribution system consists of steel pipe, ranging from ¾ inch to 12 inches with pressure ranges
from 25 to 250 psi, and plastic pipe ranging from ½ inch to 8 inches with pressure ranges from 25 to 60
psi. The newer plastic pipe represents 57 percent of the overall distribution system.
SCE&G’s pipeline projects have led to an annual customer growth rate approaching 3 percent since
2014. As the demand for natural gas continues to grow, SCE&G is consistently improving and expanding
its infrastructure to ensure the delivery of natural gas.
SCE&G also operates two liquefied natural gas (LNG) facilities in Goose Creek, S.C. and Salley, S.C. These
facilities have the capacity to hold 23 million gallons of LNG, the equivalent of approximately 2 BCF of
natural gas. When required, these facilities can supply an additional 105 million cubic feet of natural gas
per day for delivery into the local distribution systems.
DRAFT
Draft Dated 7/29/2016
SOUTH CAROLINA STATE ENERGY PLAN PREPARED BY: OFFICE OF REGULATORY STAFF
Part II: Baseline 15
Piedmont Natural Gas
Founded in 1950, PNG Company provides regulated natural gas transmission and distribution service to
over one million residential, commercial, and industrial/power generation customers in North Carolina,
South Carolina, and Tennessee. The company’s South Carolina service area includes major portions of
Anderson, Greenville, Spartanburg, and Cherokee Counties. Total customer growth across the
company’s three‐state service area was approximately 2 percent in 2015. In South Carolina, Piedmont
serves approximately 139,000 customers. Due to its proximity and interconnection with major interstate
natural gas transmission pipeline infrastructure, Piedmont’s natural gas pipeline delivery system in
South Carolina has helped to establish the Upstate as South Carolina’s leading manufacturing and
industrial hub. Piedmont delivered approximately 20 BCF of natural gas to its South Carolina customers
in 2015.
In South Carolina, PNG operates and maintains 3,789 miles of transmission and distribution mains at
operating pressures between 15 and 800 psi. Coated and catholically protected steel distribution mains
account for 1,450 miles of the total with the remaining 2,228 miles being constructed in plastic. Steel
pipe diameters range from ¾ inch to 16 inches, and plastic pipe diameters are ½ inch to 8 inches. In
addition, PNG operates LNG facilities located in Huntersville, NC and Bentonville, NC. These facilities
have the capacity to hold the equivalent of 2 BCF of natural gas. When required, these facilities can
supply an additional 220,000 dekatherms of natural gas per day for delivery into local distribution
systems.
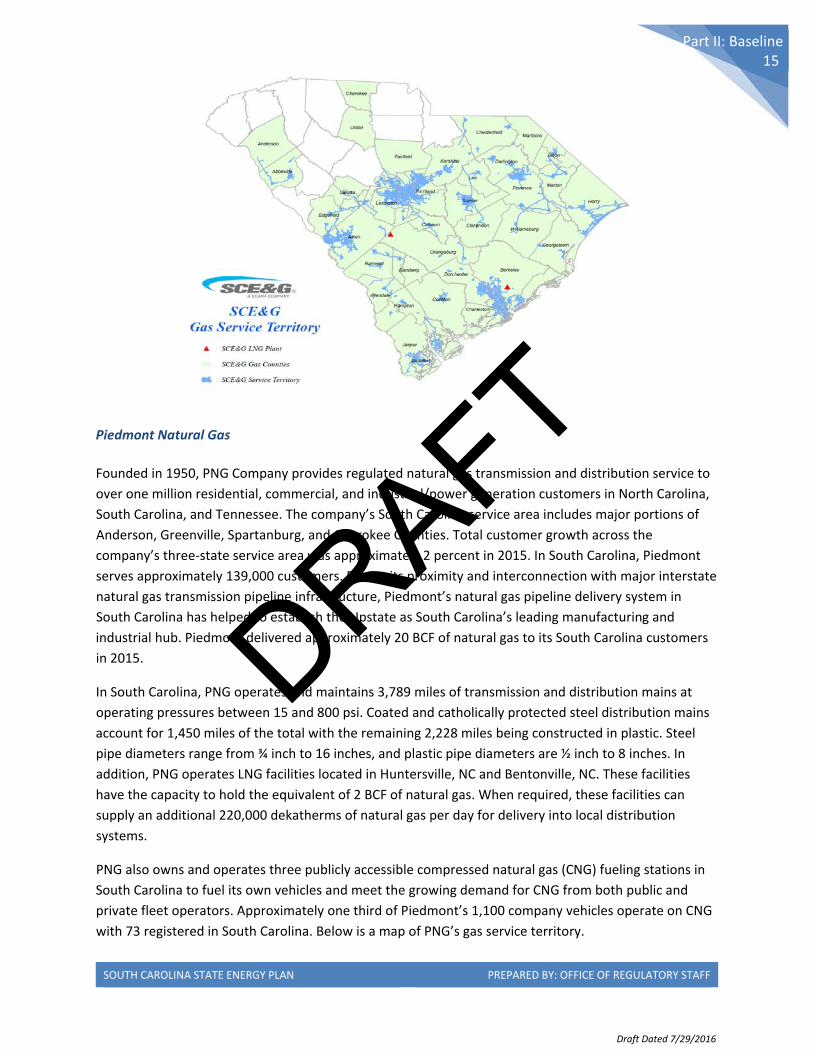
PNG also owns and operates three publicly accessible compressed natural gas (CNG) fueling stations in
South Carolina to fuel its own vehicles and meet the growing demand for CNG from both public and
private fleet operators. Approximately one third of Piedmont’s 1,100 company vehicles operate on CNG
with 73 registered in South Carolina. Below is a map of PNG’s gas service territory.
DRAFT
Draft Dated 7/29/2016
SOUTH CAROLINA STATE ENERGY PLAN PREPARED BY: OFFICE OF REGULATORY STAFF
Part II: Baseline 16
Source: Piedmont
State‐Owned Electric Utility
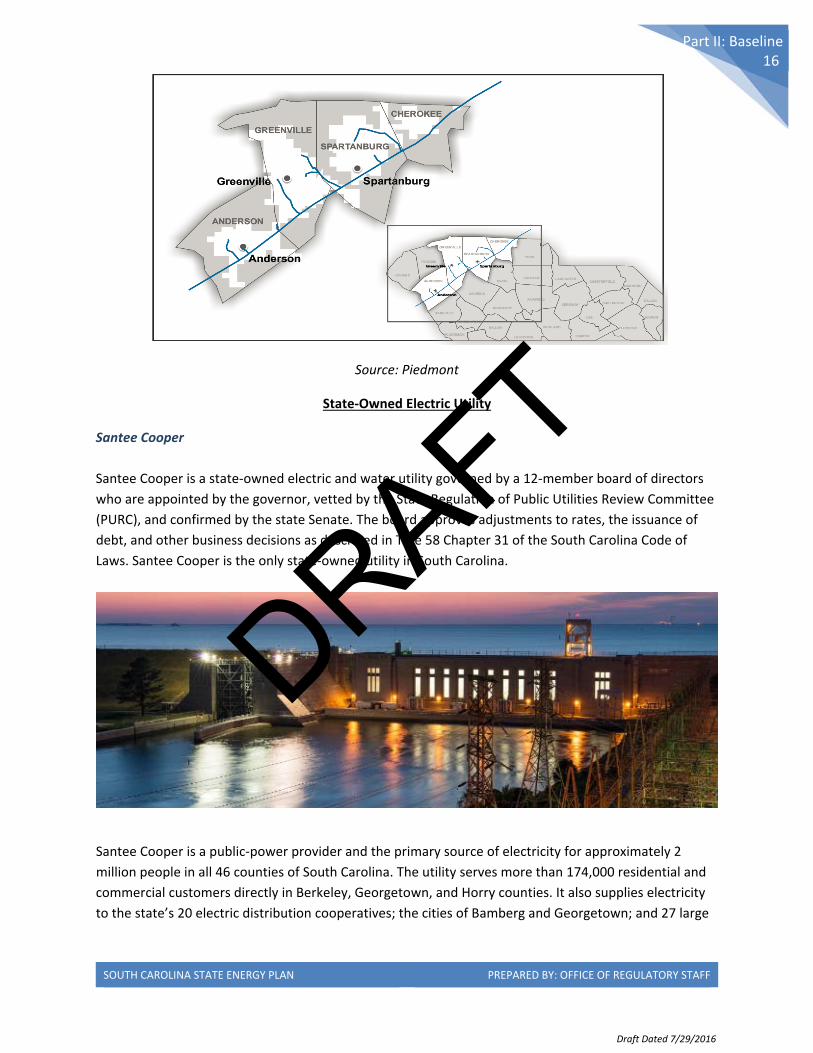
Santee Cooper
Santee Cooper is a state‐owned electric and water utility governed by a 12‐member board of directors
who are appointed by the governor, vetted by the State Regulation of Public Utilities Review Committee
(PURC), and confirmed by the state Senate. The board approves adjustments to rates, the issuance of
debt, and other business decisions as described in Title 58 Chapter 31 of the South Carolina Code of
Laws. Santee Cooper is the only state‐owned utility in South Carolina.
Santee Cooper is a public‐power provider and the primary source of electricity for approximately 2
million people in all 46 counties of South Carolina. The utility serves more than 174,000 residential and
commercial customers directly in Berkeley, Georgetown, and Horry counties. It also supplies electricity
to the state’s 20 electric distribution cooperatives; the cities of Bamberg and Georgetown; and 27 large
DRAFT
Draft Dated 7/29/2016
SOUTH CAROLINA STATE ENERGY PLAN PREPARED BY: OFFICE OF REGULATORY STAFF
Part II: Baseline 17
industrial customers including Joint Base Charleston, the Alabama Municipal Electric Authority, and the
10 member‐cities that form the Piedmont Municipal Power Agency.
Santee Cooper was created in 1934 as a rural electrification and public works project. The utility
generated its first electricity in February 1942. The project saw the creation of lakes Marion and
Moultrie, along with over 40 miles of dams and dikes, and the world’s highest single‐lift navigation lock at the time.
Santee Cooper operates an integrated transmission system that includes lines owned and leased by
Santee Cooper as well as those owned by Central Electric Power Cooperatives, Inc. The transmission
system includes approximately 1,285 miles of 230 kilovolt (kV); 1,847 miles of 115 kV; 1,753 miles of 69
kV; 10 miles of 46 kV; 97 miles of 34 kV; including both overhead and underground transmission lines.
Santee Cooper operates 104 transmission substations and switching stations serving 86 distribution
substations and 468 Central (Cooperative) delivery points. The utility has 5,029 line miles of
transmission and 2,841 line miles of distribution.
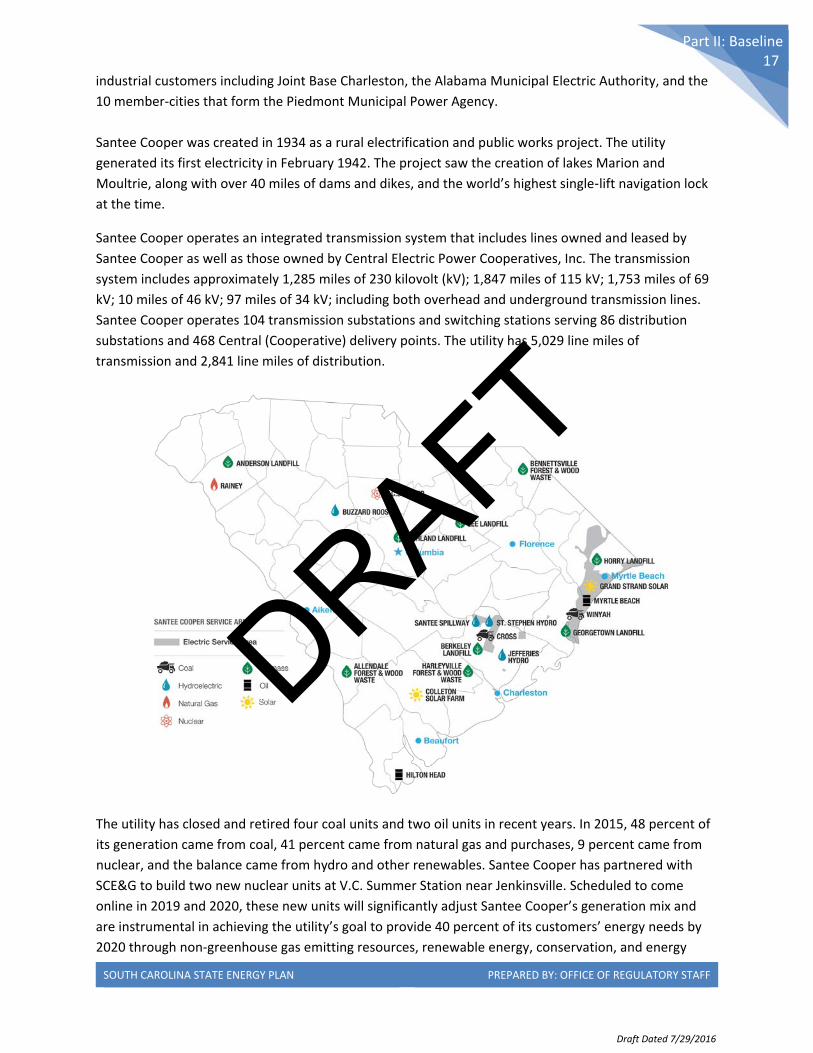
The utility has closed and retired four coal units and two oil units in recent years. In 2015, 48 percent of
its generation came from coal, 41 percent came from natural gas and purchases, 9 percent came from
nuclear, and the balance came from hydro and other renewables. Santee Cooper has partnered with
SCE&G to build two new nuclear units at V.C. Summer Station near Jenkinsville. Scheduled to come
online in 2019 and 2020, these new units will significantly adjust Santee Cooper’s generation mix and
are instrumental in achieving the utility’s goal to provide 40 percent of its customers’ energy needs by
2020 through non‐greenhouse gas emitting resources, renewable energy, conservation, and energy
DRAFT
Draft Dated 7/29/2016
SOUTH CAROLINA STATE ENERGY PLAN PREPARED BY: OFFICE OF REGULATORY STAFF
Part II: Baseline 18
efficiency. The new nuclear units also will contribute significantly to reducing the utility’s carbon dioxide
emissions nearly 40 percent based on 2005 levels.
Santee Cooper generates renewable power, with 130 megawatts online or under contract. The utility is
committed to helping customers use less electricity through its Reduce The Use energy‐efficiency
program. Santee Cooper also provides wholesale water through the Santee Cooper Regional Water
System and Lake Marion Regional Water System.
Electric Cooperatives
Twenty‐two (22) non‐profit electric cooperatives operate in South Carolina. Twenty (20) of these electric
cooperatives are distribution cooperatives, which only deliver electricity to retail customers. As
customer‐owned entities, the members of these distribution cooperatives (consumers) elect a board of
trustees to represent them in setting policies for their cooperatives and rates for their electricity.
Electric cooperatives are member‐owned and not‐for‐profit electric providers. The 20 independent
distribution cooperatives serve approximately 720,000 member accounts in all 46 counties in the state
and deliver electricity to more than 1.3 million South Carolinians. These distribution cooperatives
operate the largest distribution system in the state, including more than 72,000 miles of power lines
covering 70 percent of South Carolina’s land area.
South Carolina’s 20 distribution cooperatives are supported by two statewide organizations. Central
Electric Power Cooperative, Inc. provides planning and wholesale power aggregation services and
wholesale transmission delivery services to the 20 distribution cooperatives in South Carolina through
power purchase agreements with Santee Cooper, Duke Energy Carolinas, and the Southeastern Power
Administration. The Electric Cooperatives of South Carolina, Inc. (ECSC) is the statewide trade
association that provides political representation of member cooperatives’ energy and economic
development interests at the local, state, and federal policy levels. ECSC also provides member
cooperatives with a variety of ancillary programs and services and produces one of the state’s largest
print publications, South Carolina Living.
Municipal Electric Utilities
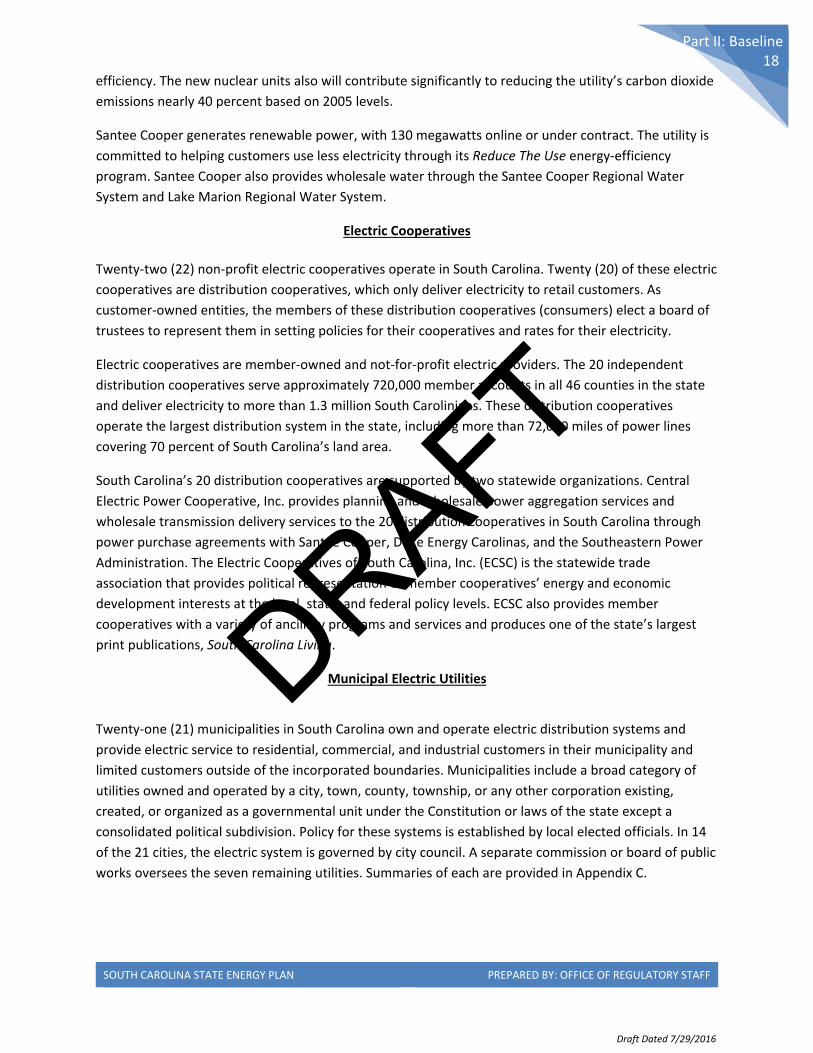
Twenty‐one (21) municipalities in South Carolina own and operate electric distribution systems and
provide electric service to residential, commercial, and industrial customers in their municipality and
limited customers outside of the incorporated boundaries. Municipalities include a broad category of
utilities owned and operated by a city, town, county, township, or any other corporation existing,
created, or organized as a governmental unit under the Constitution or laws of the state except a
consolidated political subdivision. Policy for these systems is established by local elected officials. In 14
of the 21 cities, the electric system is governed by city council. A separate commission or board of public
works oversees the seven remaining utilities. Summaries of each are provided in Appendix C.
DRAFT
Draft Dated 7/29/2016
SOUTH CAROLINA STATE ENERGY PLAN PREPARED BY: OFFICE OF REGULATORY STAFF
Part II: Baseline 19
The 21 independent electric systems serve approximately 170,000 customers or roughly 7 percent of the
state of South Carolina’s electric customers. The cities in total maintain more than 3,600 miles of
overhead and underground power lines operating at 2400/4160 volts, 7200/12,400 volts, or
14,400/24,900 volts, with a peak load of 996 megawatts occurring most often in the summer.
In 1979, 10 of the 21 electric cities located in the northwest section of South Carolina incorporated the
Piedmont Municipal Power Agency, a joint‐action agency. The agency provides wholesale electric
services to its members primarily through a 25 percent ownership interest in unit two of the Catawba
Nuclear Station, located in York County, South Carolina. The remaining cities purchase their electricity
on the wholesale market, typically through contracts with investor‐owned utilities.
All 21 municipal electric systems are members of the South Carolina Association of Municipal Power
Systems (SCAMPS). SCAMPS serves as an unincorporated nonprofit organization for the cooperation of
municipalities providing municipal electric utility services. Primary functions of SCAMPS include
coordinating emergency mutual aid assistance for municipal electric providers; promoting training and
education programs; collecting, compiling and distributing information concerning municipal electric
utilities; sharing legal services; advocating for municipal utilities on legislative issues and serving as a
forum for the discussion of issues of mutual concern. A board of directors elected by its membership
sets policy for and governs SCAMPS. The Municipal Association of South Carolina by contract operates
and manages SCAMPS under direction from the board. (www.masc.sc).
As part of the statewide organization, members participate in the Emergency Mutual Aid Assistance
Compact. This compact provides a centralized organization through which utilities can respond to or
receive aid from one another in times of emergencies and ensure compliance with Federal Emergency
Management Agency (FEMA) guidelines. It also provides a uniform way of handling emergencies.
DRAFT
Draft Dated 7/29/2016
SOUTH CAROLINA STATE ENERGY PLAN PREPARED BY: OFFICE OF REGULATORY STAFF
Part II: Baseline 20
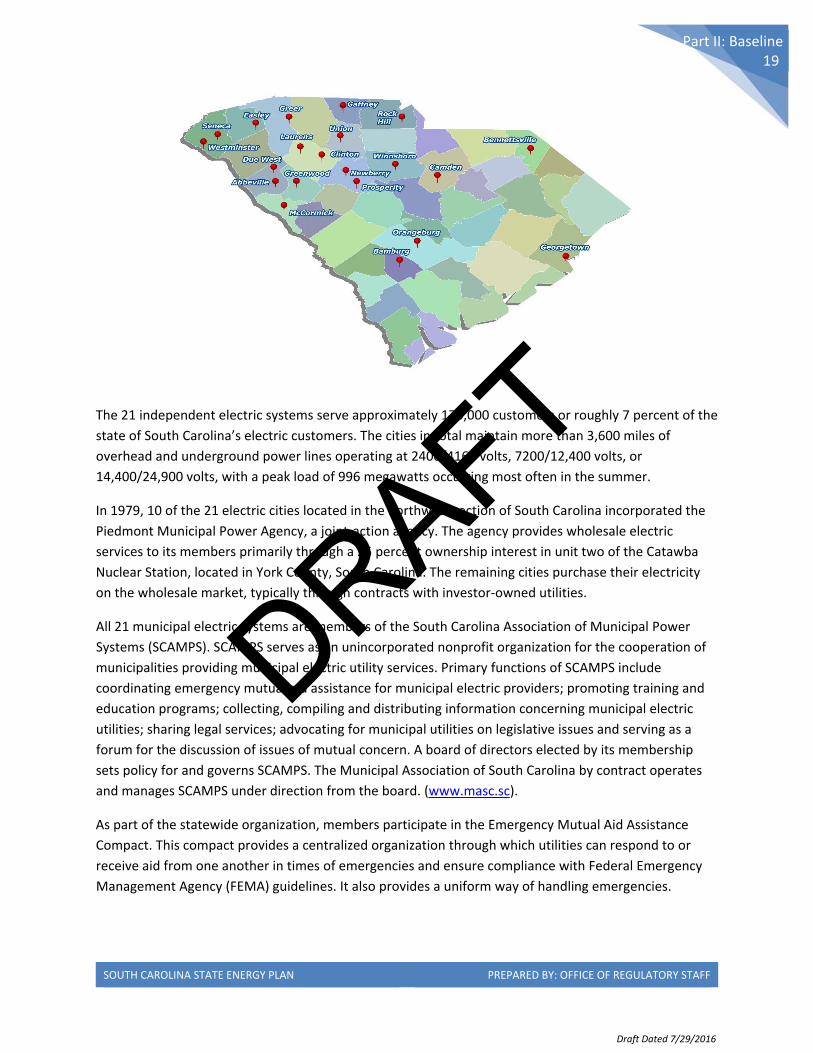
Municipal Natural Gas Utilities
Fourteen (14) natural gas systems operating in South Carolina are municipal systems, a broad term that
includes any system organized as governmental units under the state constitution and laws. Three (3)
distinct categories of municipal natural gas utilities exist. They are 1) departments or divisions of a city
or town governed by an elected council 2) a utility governed by an elected commission or board of
public works and 3) utility authorities established by state legislation. Details of each category, including
the systems contained in each, are provided in Appendix C.
Municipal gas systems in our state serve approximately 239,000 customers and operate and maintain
approximately 9,000 miles of natural gas pipelines that represent 61 percent of the statewide
distribution infrastructure. Collectively, these systems serve approximately 32 percent of the state’s
natural gas customers. Summaries of each are provided in Appendix C.
Electric Transmission System Overview The nation’s electric delivery system is more than 100 years old. Much of the equipment (for example,
transformers, capacitors, and regulators) was installed decades ago. In South Carolina, as well as for
South Carolina utilities operating in North Carolina, this delivery system, or electric grid, was primarily
designed to transport electricity from large centralized generation plants to customers across the
Carolinas, sometimes hundreds of miles way. This fundamental infrastructure is still the basis for an
electricity grid in the U.S.
South Carolina electric utility transmission planning practices develop and coordinate modifications to
the state’s transmission system to ensure the delivery of reliable and economical electrical energy.
These planning practices include determination of the current capacity of the electrical network and a
DRAFT
Draft Dated 7/29/2016
SOUTH CAROLINA STATE ENERGY PLAN PREPARED BY: OFFICE OF REGULATORY STAFF
Part II: Baseline 21
ten‐year schedule of future additions and modifications to the system. The purpose of these additions
and modifications is to support customer growth, provide emergency assistance, and maintain economic
opportunities for electric customers while meeting industry transmission performance standards.
Utility transmission systems are integrated into the regional transmission system serving the
southeastern area of the United States and the Eastern Interconnection. Each utility has separate
interchange agreements with each interconnected company; these agreements provide for mutual
exchanges of electrical power. In the Carolinas and Virginia, a special organization has been developed
called the Virginia‐Carolinas Reliability Agreement (VACAR).
Transmission organizations at utilities must follow the North American Electric Reliability Corporation
(NERC) Reliability Standards for Transmission Planning, as approved by the NERC Board of Trustees and
the Federal Energy Regulatory Commission (FERC), as well as practices put forth by the Southeastern
Electric Reliability Corporation (SERC).
Distribution system planning in South Carolina follows a similar process. Modeling studies are performed
to assess the capacity of distribution lines and other infrastructure to support expected load growth and
grid conditions. The results of these studies help identify any upgrades needed to fulfill reliability
standards and maintain the safety of the distribution system. Details regarding the electric transmission
system can be found in Appendix D.
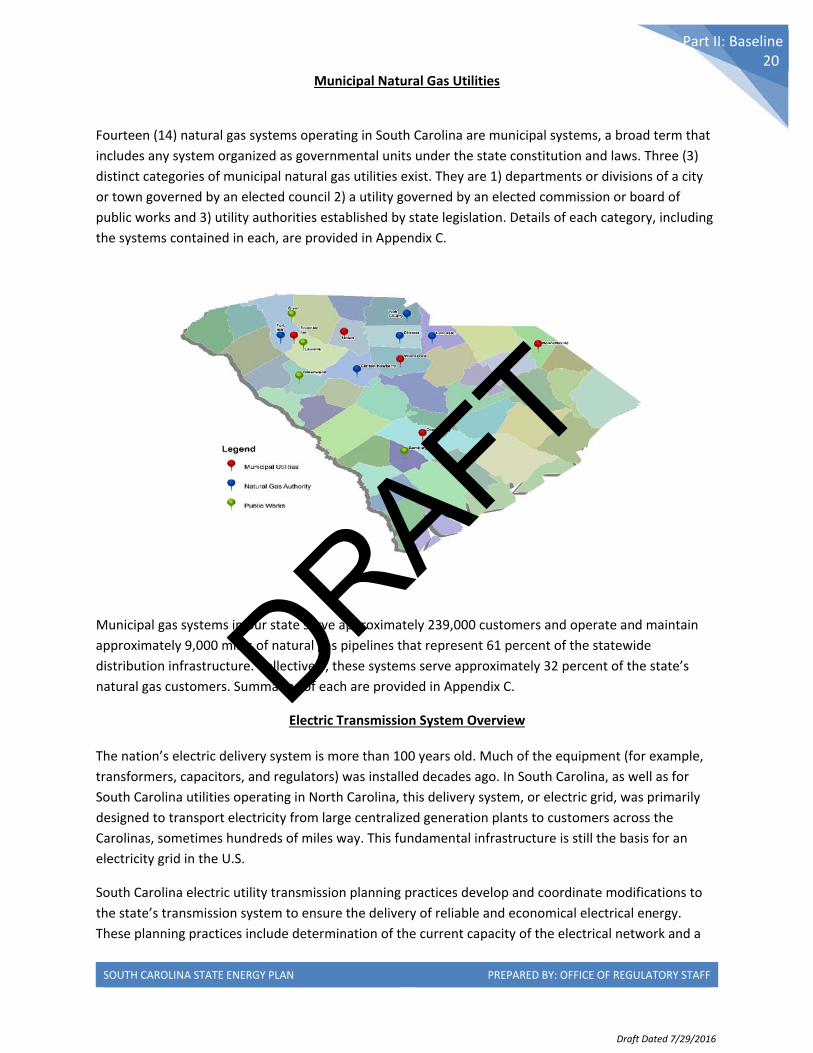
U.S. Natural Gas System Overview As illustrated below, the nation's natural gas system consists of production, processing, transmission,
storage, and distribution systems that provide for delivery to consumers. South Carolina has no in‐state
oil or natural gas production or processing facilities. The state's natural gas system begins at the
transmission portion of the supply chain.
High level overview of natural gas industry structure
Source: Energy Information Administration (EIA)
When natural gas leaves a processing plant, it often enters an interstate pipeline. These pipelines are
generally large systems that cross multiple states and are regulated by the FERC. Interstate pipelines
provide the transportation of natural gas from production zones to take‐away points and market
DRAFT
Draft Dated 7/29/2016
SOUTH CAROLINA STATE ENERGY PLAN PREPARED BY: OFFICE OF REGULATORY STAFF
Part II: Baseline 22
demand centers. These pipelines are critical for the delivery of natural gas to South Carolina since it has
no internal natural gas supply. An overview of the various South Carolina natural gas systems that exist
to provide for the delivery of natural gas are outlined in the next section.
South Carolina Natural Gas Infrastructure Overview South Carolina's natural gas systems are the transmission and distribution infrastructure that provides
for the delivery of natural gas to the state's residential, commercial, industrial, electrical generation, and
CNG end‐users. The state's natural gas infrastructure consists of four interstate pipelines, two IOUs, five
natural gas authorities (NGAs), four commissions of public works (CPWs), and five municipalities (see
Appendix C).
South Carolina’s IOUs, NGAs, and Municipalities are all responsible for the delivery of natural gas to
support the needs of end‐users. Gas distribution systems have general service area assignments, but no
specific state requirement exists that requires a duty or obligation to serve customers in those areas.
Interstate pipelines also deliver directly to industrial and electrical generation customers in the state.
IOUs are subject to the oversight and regulation of the PSC whereas the government‐owned gas utilities
are not.
The South Carolina Natural Gas Department of the ORS represents the public interest with regard to the
regulation of the two natural gas IOUs in South Carolina: Piedmont Natural Gas and SCE&G. Duties of
the ORS encompass rate, accounting, legal, technical, and certain service issues regarding the purchase,
sale, transportation, and storage of natural gas by all companies within the jurisdiction of the PSC. With
the exception of safety issues, the ORS does not have the responsibility for oversight of non‐
jurisdictional utilities including municipal systems, NGAs, and liquid propane systems. However, the ORS
does monitor overall activities in the state to provide information on policy matters. As outlined above,
interstate pipelines are regulated by the FERC. SCDHEC also oversees in‐state environmental regulatory
aspects of natural gas pipelines such as water‐discharge permits, land‐disturbing activities along the
coast, and permits to construct sources of air pollution (see Appendix G).
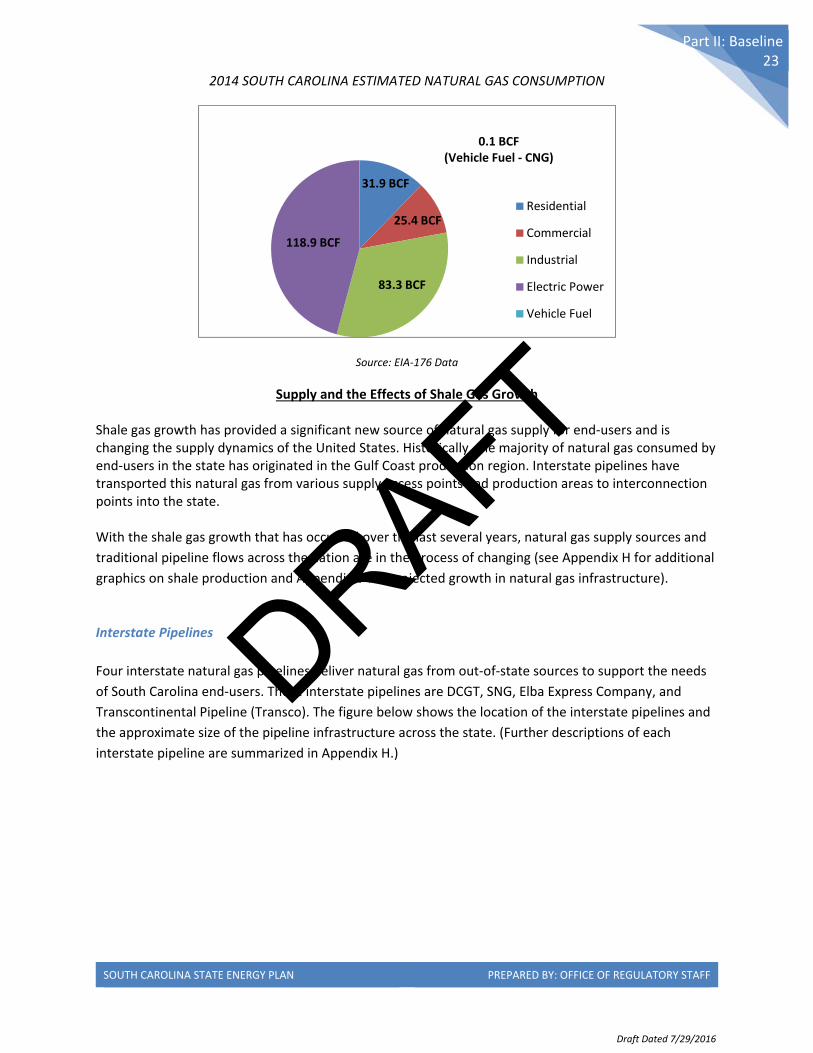
South Carolina Natural Gas Consumption and Supply According to the American Gas Association’s current South Carolina state profile, the state has
approximately 650,735 natural gas customers (see Appendix H for breakdown by utility and customer
category). This number consists of 593,286 residential, 55,997 commercial, and 1,452 industrial
customers. In 2014, state customers consumed approximately 259.6 BCF according to the EIA.
DRAFT
Draft Dated 7/29/2016
SOUTH CAROLINA STATE ENERGY PLAN PREPARED BY: OFFICE OF REGULATORY STAFF
Part II: Baseline 23
2014 SOUTH CAROLINA ESTIMATED NATURAL GAS CONSUMPTION
Source: EIA‐176 Data
Supply and the Effects of Shale Gas Growth Shale gas growth has provided a significant new source of natural gas supply for end‐users and is changing the supply dynamics of the United States. Historically, the majority of natural gas consumed by end‐users in the state has originated in the Gulf Coast production region. Interstate pipelines have transported this natural gas from various supply access points and production areas to interconnection points into the state. With the shale gas growth that has occurred over the last several years, natural gas supply sources and
traditional pipeline flows across the nation are in the process of changing (see Appendix H for additional
graphics on shale production and Appendix V for projected growth in natural gas infrastructure).
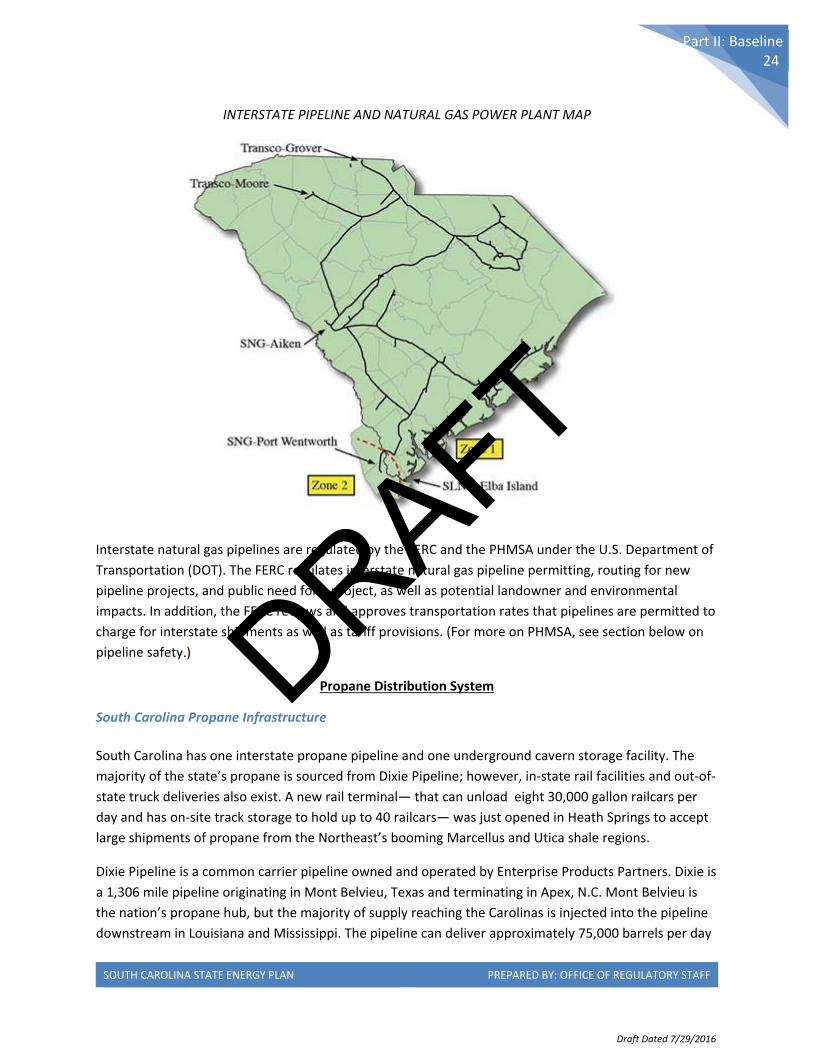
Interstate Pipelines
Four interstate natural gas pipelines deliver natural gas from out‐of‐state sources to support the needs
of South Carolina end‐users. These interstate pipelines are DCGT, SNG, Elba Express Company, and
Transcontinental Pipeline (Transco). The figure below shows the location of the interstate pipelines and
the approximate size of the pipeline infrastructure across the state. (Further descriptions of each
interstate pipeline are summarized in Appendix H.)
31.9 BCF
25.4 BCF
83.3 BCF
118.9 BCF
0.1 BCF(Vehicle Fuel ‐ CNG)
Residential
Commercial
Industrial
Electric Power
Vehicle Fuel
DRAFT
Draft Dated 7/29/2016
SOUTH CAROLINA STATE ENERGY PLAN PREPARED BY: OFFICE OF REGULATORY STAFF
Part II: Baseline 24
INTERSTATE PIPELINE AND NATURAL GAS POWER PLANT MAP
Interstate natural gas pipelines are regulated by the FERC and the PHMSA under the U.S. Department of
Transportation (DOT). The FERC regulates interstate natural gas pipeline permitting, routing for new
pipeline projects, and public need for a project, as well as potential landowner and environmental
impacts. In addition, the FERC reviews and approves transportation rates that pipelines are permitted to
charge for interstate shipments as well as tariff provisions. (For more on PHMSA, see section below on
pipeline safety.)
Propane Distribution System
South Carolina Propane Infrastructure
South Carolina has one interstate propane pipeline and one underground cavern storage facility. The
majority of the state’s propane is sourced from Dixie Pipeline; however, in‐state rail facilities and out‐of‐
state truck deliveries also exist. A new rail terminal— that can unload eight 30,000 gallon railcars per
day and has on‐site track storage to hold up to 40 railcars— was just opened in Heath Springs to accept
large shipments of propane from the Northeast’s booming Marcellus and Utica shale regions.
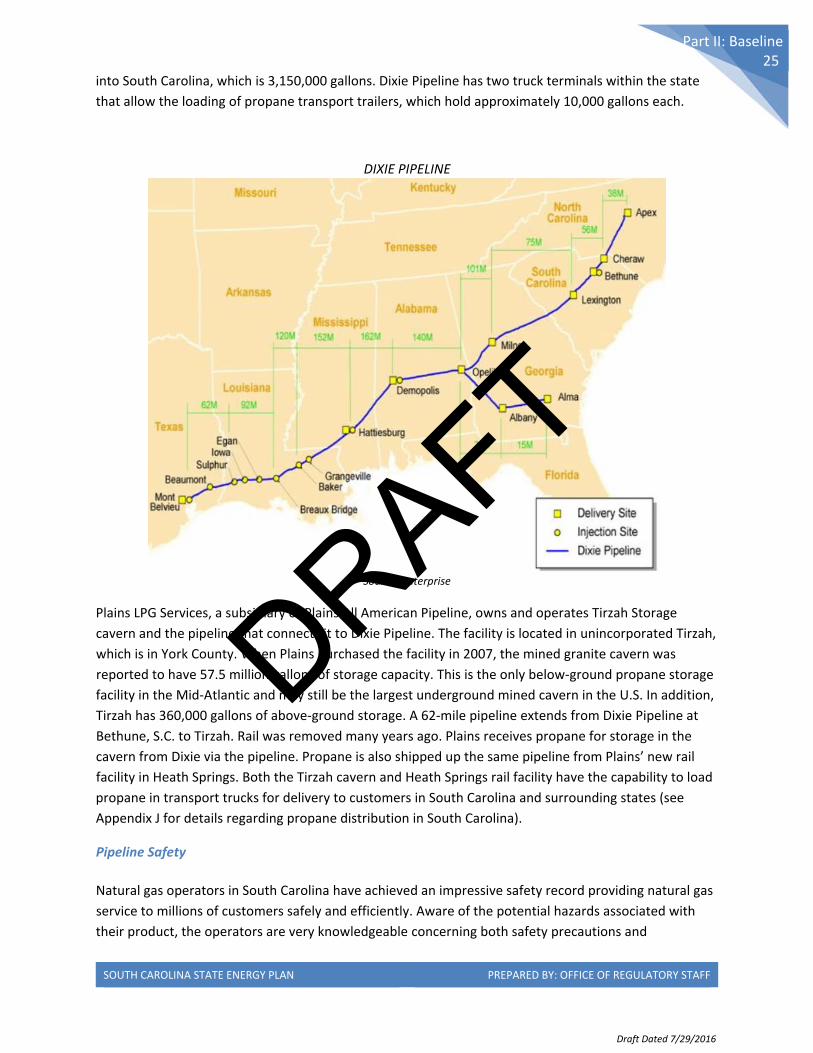
Dixie Pipeline is a common carrier pipeline owned and operated by Enterprise Products Partners. Dixie is
a 1,306 mile pipeline originating in Mont Belvieu, Texas and terminating in Apex, N.C. Mont Belvieu is
the nation’s propane hub, but the majority of supply reaching the Carolinas is injected into the pipeline
downstream in Louisiana and Mississippi. The pipeline can deliver approximately 75,000 barrels per day
DRAFT
Draft Dated 7/29/2016
SOUTH CAROLINA STATE ENERGY PLAN PREPARED BY: OFFICE OF REGULATORY STAFF
Part II: Baseline 25
into South Carolina, which is 3,150,000 gallons. Dixie Pipeline has two truck terminals within the state
that allow the loading of propane transport trailers, which hold approximately 10,000 gallons each.
DIXIE PIPELINE
Source: Enterprise
Plains LPG Services, a subsidiary of Plains All American Pipeline, owns and operates Tirzah Storage
cavern and the pipeline that connects it to Dixie Pipeline. The facility is located in unincorporated Tirzah,
which is in York County. When Plains purchased the facility in 2007, the mined granite cavern was
reported to have 57.5 million gallons of storage capacity. This is the only below‐ground propane storage
facility in the Mid‐Atlantic and may still be the largest underground mined cavern in the U.S. In addition,
Tirzah has 360,000 gallons of above‐ground storage. A 62‐mile pipeline extends from Dixie Pipeline at
Bethune, S.C. to Tirzah. Rail was removed many years ago. Plains receives propane for storage in the
cavern from Dixie via the pipeline. Propane is also shipped up the same pipeline from Plains’ new rail
facility in Heath Springs. Both the Tirzah cavern and Heath Springs rail facility have the capability to load
propane in transport trucks for delivery to customers in South Carolina and surrounding states (see
Appendix J for details regarding propane distribution in South Carolina).
Pipeline Safety
Natural gas operators in South Carolina have achieved an impressive safety record providing natural gas
service to millions of customers safely and efficiently. Aware of the potential hazards associated with
their product, the operators are very knowledgeable concerning both safety precautions and
DRAFT
Draft Dated 7/29/2016
SOUTH CAROLINA STATE ENERGY PLAN PREPARED BY: OFFICE OF REGULATORY STAFF
Part II: Baseline 26
operations‐and‐maintenance requirements that constantly must be observed. Many organizations,
volunteer groups, and associations — along with state and federal regulators — contribute to the
success of the natural gas industry.
The Pipeline Safety department of the ORS has pipeline safety oversight responsibility for the operators
of natural gas distribution and transmission pipeline systems, liquefied natural gas facilities, certain
liquefied propane systems, landfill gas systems, and lateral pipelines from interstate pipeline systems.
Other areas of responsibility include field inspections of facilities, accident investigation, and various
types of operator training.
The ORS Pipeline Safety department enforces the federal pipeline safety regulations set forth by the U.S.
DOT in addition to state rules and regulations governing gas systems. The state of South Carolina has an
agreement with PHMSA wherein all operators in the state must comply with these guidelines. The
Pipeline Safety department undergoes annual re‐certification by PHMSA.
Many gas‐related incidents result from damage to buried pipelines during excavation activities. Known
as "third party damage," this type of excavation incident is one of the leading causes of pipeline damage
industry‐wide each year. That is why one‐call programs, such as that provided by South Carolina 811, are
so valuable. Anyone planning to dig, excavate, bore, tunnel, blast, or disturb the earth in any manner in
which buried utilities may be damaged must call SC 811 by dialing 811. It is a state law.
DRAFT
Draft Dated 7/29/2016
SOUTH CAROLINA STATE ENERGY PLAN PREPARED BY: OFFICE OF REGULATORY STAFF
Part II: Baseline 27
V. ELECTRICITY AND NATURAL GAS DEMAND BY END USE SECTOR
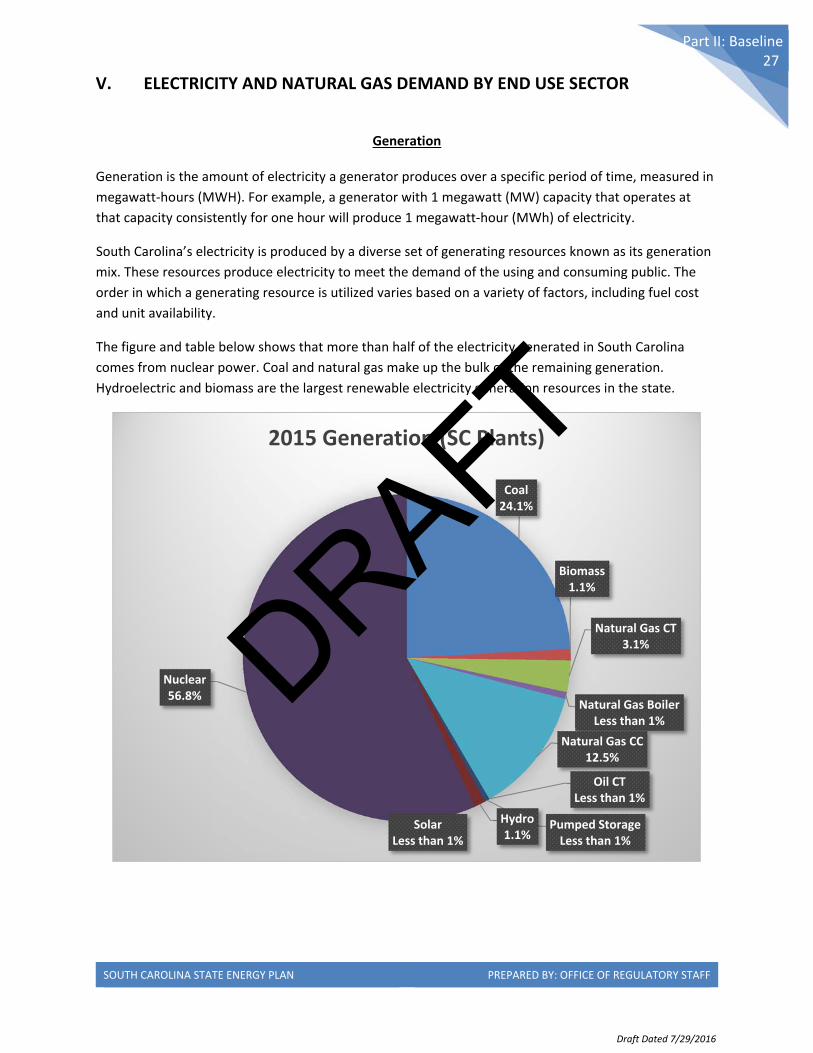
Generation Generation is the amount of electricity a generator produces over a specific period of time, measured in
megawatt‐hours (MWH). For example, a generator with 1 megawatt (MW) capacity that operates at
that capacity consistently for one hour will produce 1 megawatt‐hour (MWh) of electricity.
South Carolina’s electricity is produced by a diverse set of generating resources known as its generation
mix. These resources produce electricity to meet the demand of the using and consuming public. The
order in which a generating resource is utilized varies based on a variety of factors, including fuel cost
and unit availability.
The figure and table below shows that more than half of the electricity generated in South Carolina
comes from nuclear power. Coal and natural gas make up the bulk of the remaining generation.
Hydroelectric and biomass are the largest renewable electricity generation resources in the state.
Coal24.1%
Biomass1.1%
Natural Gas CT3.1%
Natural Gas BoilerLess than 1%
Natural Gas CC12.5%
Oil CTLess than 1%
Pumped StorageLess than 1%
Hydro1.1%
SolarLess than 1%
Nuclear56.8%
2015 Generation (SC Plants)
DRAFT
Draft Dated 7/29/2016
SOUTH CAROLINA STATE ENERGY PLAN PREPARED BY: OFFICE OF REGULATORY STAFF
Part II: Baseline 28
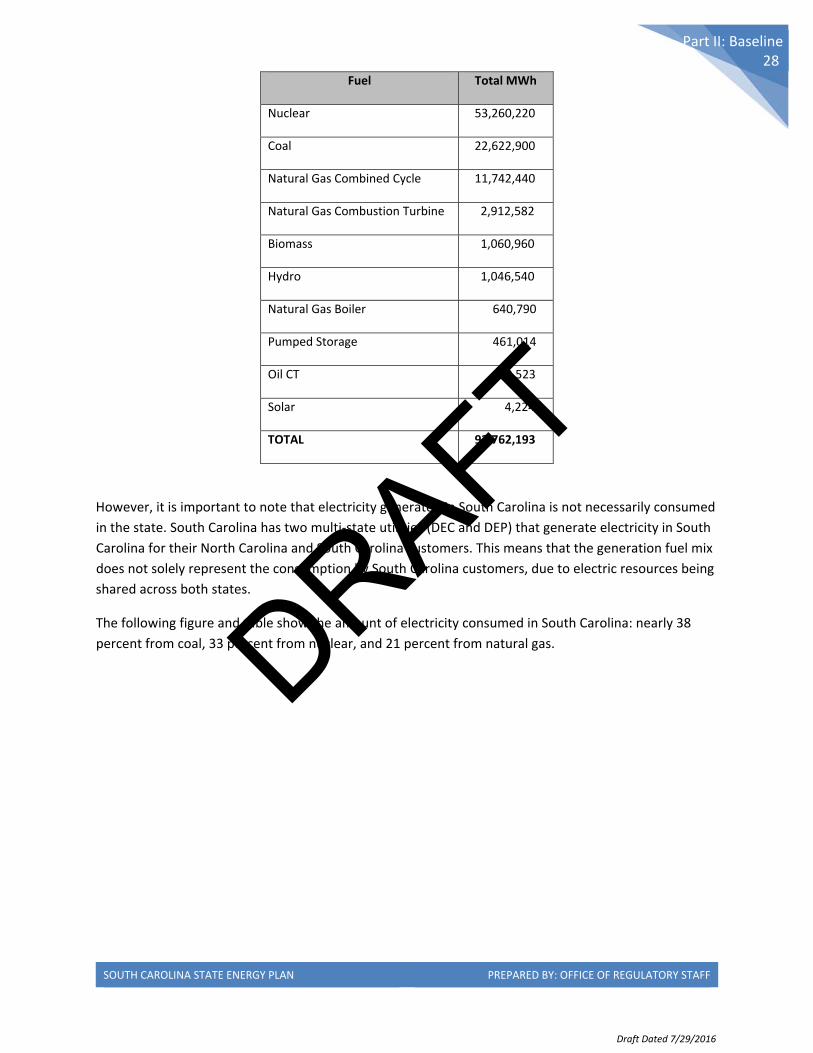
Fuel Total MWh
Nuclear 53,260,220
Coal 22,622,900
Natural Gas Combined Cycle 11,742,440
Natural Gas Combustion Turbine 2,912,582
Biomass 1,060,960
Hydro 1,046,540
Natural Gas Boiler 640,790
Pumped Storage 461,014
Oil CT 10,523
Solar 4,224
TOTAL 93,762,193
However, it is important to note that electricity generated in South Carolina is not necessarily consumed
in the state. South Carolina has two multi‐state utilities (DEC and DEP) that generate electricity in South
Carolina for their North Carolina and South Carolina customers. This means that the generation fuel mix
does not solely represent the consumption by South Carolina customers, due to electric resources being
shared across both states.
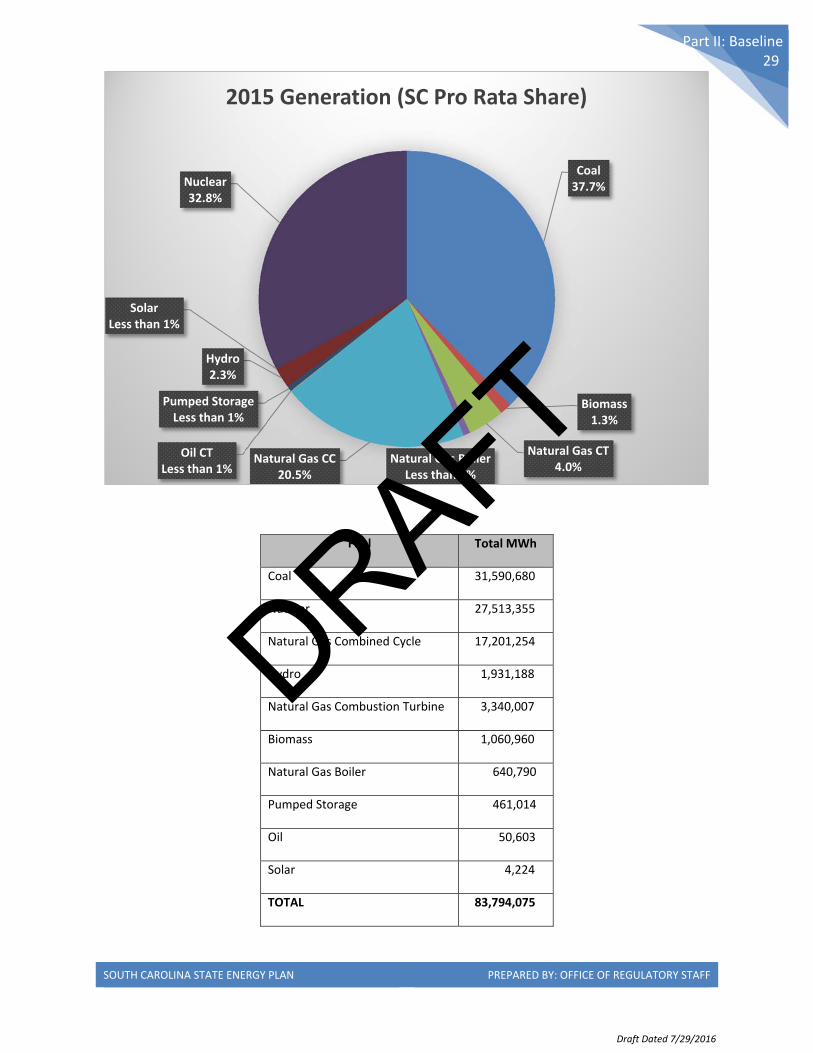
The following figure and table show the amount of electricity consumed in South Carolina: nearly 38
percent from coal, 33 percent from nuclear, and 21 percent from natural gas. DRAFT
Draft Dated 7/29/2016
SOUTH CAROLINA STATE ENERGY PLAN PREPARED BY: OFFICE OF REGULATORY STAFF
Part II: Baseline 29
Fuel Total MWh
Coal 31,590,680
Nuclear 27,513,355
Natural Gas Combined Cycle 17,201,254
Hydro 1,931,188
Natural Gas Combustion Turbine 3,340,007
Biomass 1,060,960
Natural Gas Boiler 640,790
Pumped Storage 461,014
Oil 50,603
Solar 4,224
TOTAL 83,794,075
Coal37.7%
Biomass1.3%
Natural Gas CT4.0%
Natural Gas BoilerLess than 1%
Natural Gas CC20.5%
Oil CTLess than 1%
Pumped StorageLess than 1%
Hydro2.3%
SolarLess than 1%
Nuclear32.8%
2015 Generation (SC Pro Rata Share)
DRAFT
Draft Dated 7/29/2016
SOUTH CAROLINA STATE ENERGY PLAN PREPARED BY: OFFICE OF REGULATORY STAFF
Part II: Baseline 30
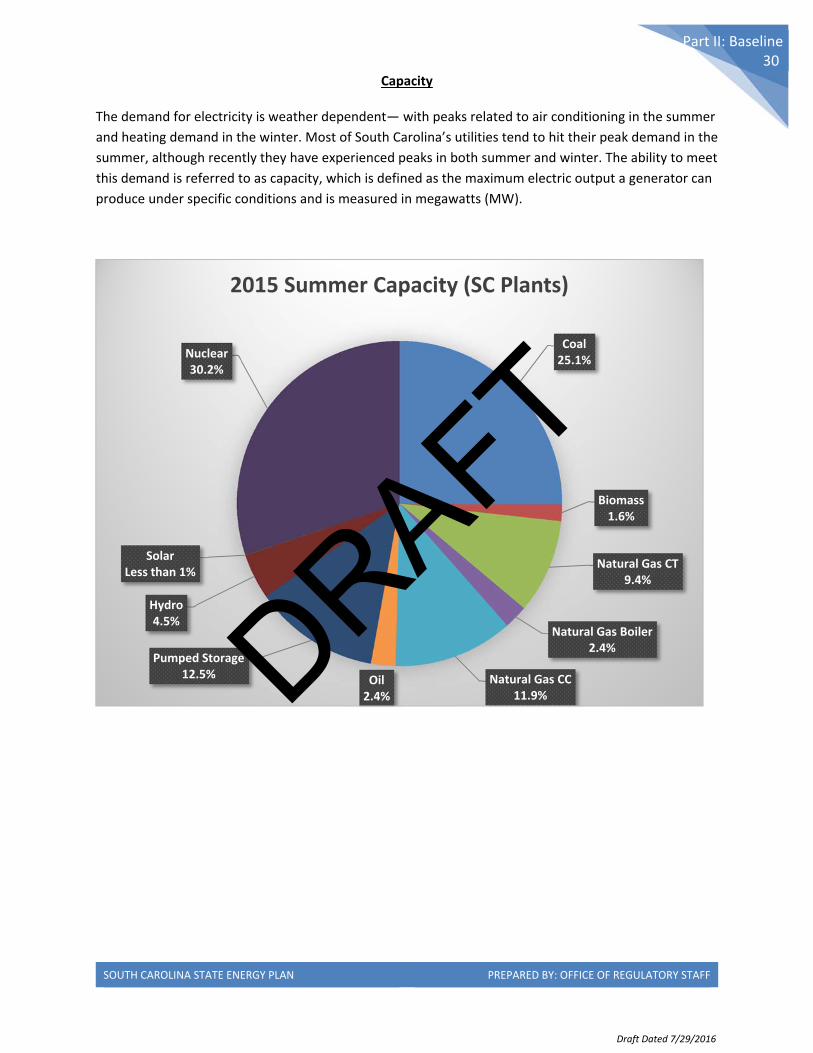
Capacity The demand for electricity is weather dependent— with peaks related to air conditioning in the summer
and heating demand in the winter. Most of South Carolina’s utilities tend to hit their peak demand in the
summer, although recently they have experienced peaks in both summer and winter. The ability to meet
this demand is referred to as capacity, which is defined as the maximum electric output a generator can
produce under specific conditions and is measured in megawatts (MW).
Coal25.1%
Biomass1.6%
Natural Gas CT9.4%
Natural Gas Boiler2.4%
Natural Gas CC11.9%
Oil2.4%
Pumped Storage12.5%
Hydro4.5%
SolarLess than 1%
Nuclear30.2%
2015 Summer Capacity (SC Plants)
DRAFT
Draft Dated 7/29/2016
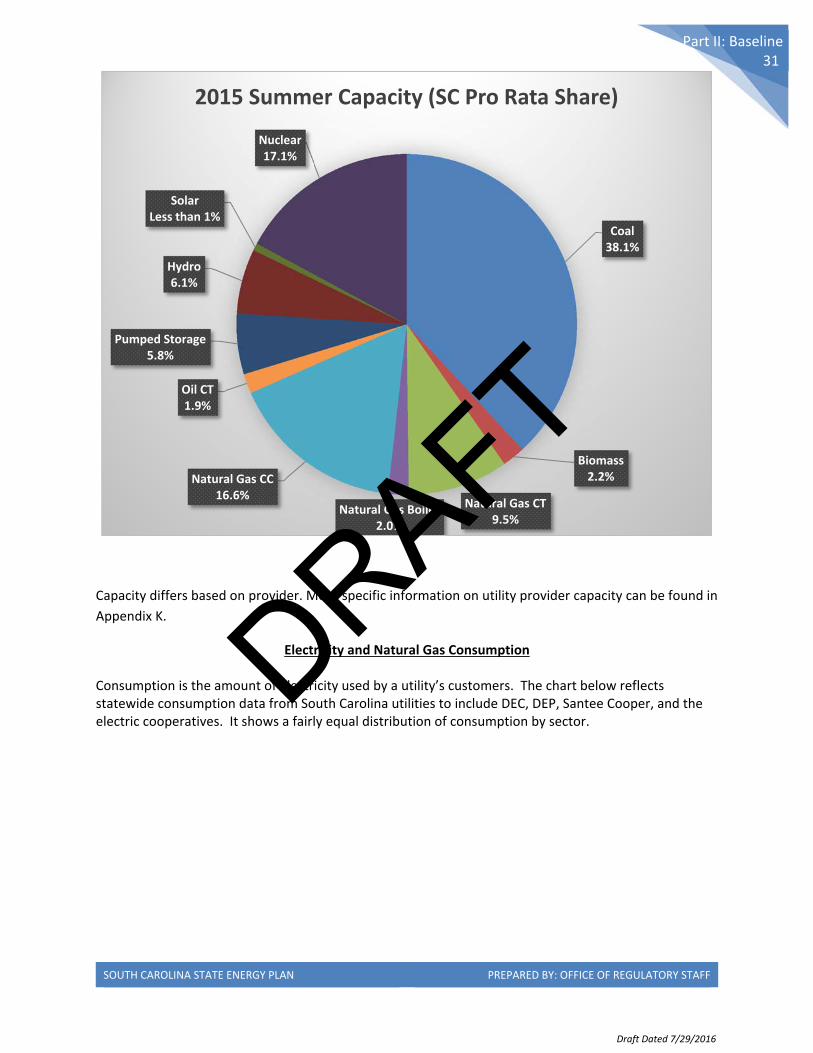
SOUTH CAROLINA STATE ENERGY PLAN PREPARED BY: OFFICE OF REGULATORY STAFF
Part II: Baseline 31
Capacity differs based on provider. More specific information on utility provider capacity can be found in
Appendix K.
Electricity and Natural Gas Consumption Consumption is the amount of electricity used by a utility’s customers. The chart below reflects statewide consumption data from South Carolina utilities to include DEC, DEP, Santee Cooper, and the electric cooperatives. It shows a fairly equal distribution of consumption by sector.
Coal38.1%
Biomass2.2%
Natural Gas CT9.5%
Natural Gas Boiler2.0%
Natural Gas CC16.6%
Oil CT1.9%
Pumped Storage5.8%
Hydro6.1%
SolarLess than 1%
Nuclear17.1%
2015 Summer Capacity (SC Pro Rata Share)
DRAFT
Draft Dated 7/29/2016
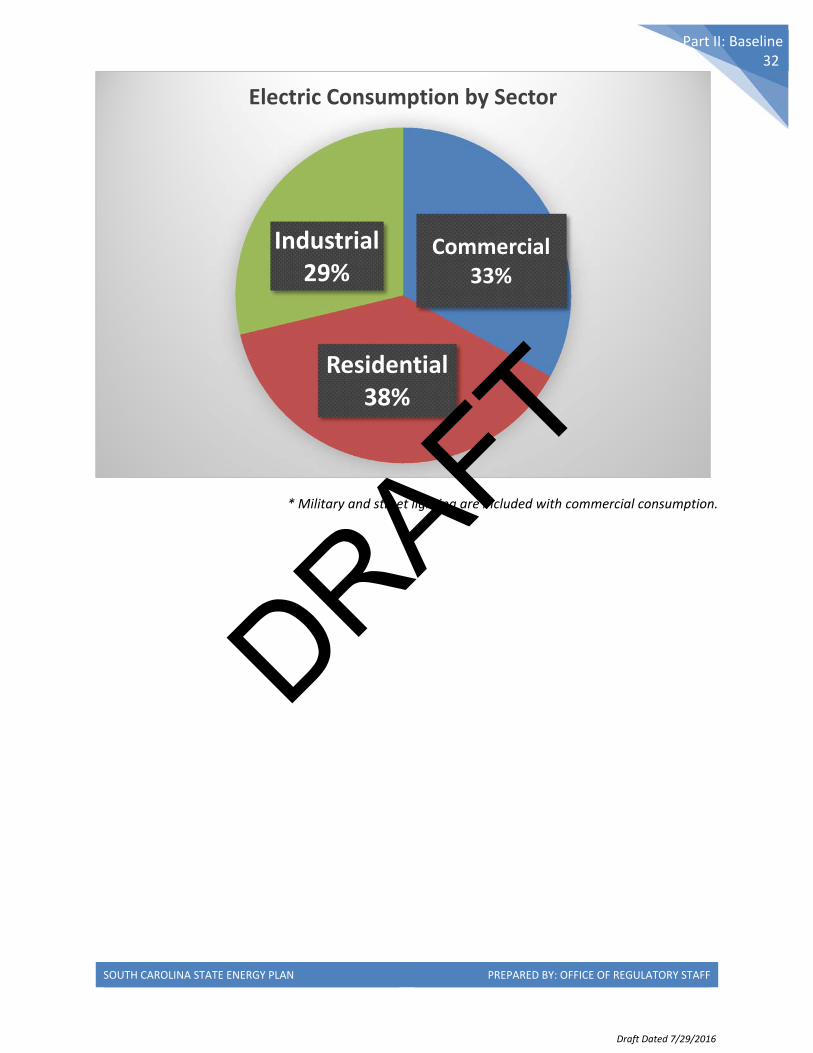
SOUTH CAROLINA STATE ENERGY PLAN PREPARED BY: OFFICE OF REGULATORY STAFF
Part II: Baseline 32
* Military and street lighting are included with commercial consumption.
Commercial33%
Residential38%
Industrial29%
Electric Consumption by Sector
DRAFT
Draft Dated 7/29/2016
SOUTH CAROLINA STATE ENERGY PLAN PREPARED BY: OFFICE OF REGULATORY STAFF
Part II: Baseline 33
VI. ENERGY EFFICIENCY PROGRAMS Energy efficiency is often recognized as the lowest cost option for reducing emissions. The Lawrence
Berkeley National Laboratory found that the average levelized cost of energy saved from efficiency
programs is 2.1 cents/kWH (using a 6 percent discount rate, to compare the future value of money to
current rates). A 2014 study by the American Council for an Energy‐Efficient Economy (ACEEE) also
found that, on average, the levelized cost is approximately 2.8 cents/kWH under a 5 percent discount
rate and 2.5 cents/kWH under a 3 percent discount rate.
In 2010, the South Carolina General Assembly passed a law that allows the state’s utilities to make on‐
bill financing available to their customers. Under S.C. Code 58‐37‐50, a utility may finance residential
energy efficiency improvements through a meter conservation charge that is tied to the account serving
the premises. If the customer moves, the meter conservation charge is assumed by the subsequent
account holder and remains in place until the energy efficiency measures are paid for.
Five of South Carolina’s electric cooperatives have on‐bill financing programs that use the common
brand, “Help My House” (http://www.helpmyhouse.org/). The programs use the “whole house”
approach to evaluate the house as a system. Efficiency improvements include air sealing the home and
ductwork, upgrading the HVAC system, and installing insulation. As of May 2015, 548 homes have been
retrofitted through the Help My House programs, with an average loan of $9,505. The programs have a
default rate of under 1% and are saving approximately 4,140 MWhs of electricity per year. Annual
average energy savings remain consistent over a three‐year period.
Santee Cooper also augments its “Reduce The Use” program with low‐interest loans to help eligible
customers make a variety of residential energy efficiency upgrades. Santee Cooper has loaned $41
million since the program began, and it has made 30 loans for renewable energy installations since
adding that component in 2008. Customers can repay the loans through their monthly bill payments.
Several South Carolina electric utility providers offer energy efficiency programs aimed at increasing
efficiency. These programs, a description of how they are measured, and their results are outlined in
Appendix M.
DRAFT
Draft Dated 7/29/2016
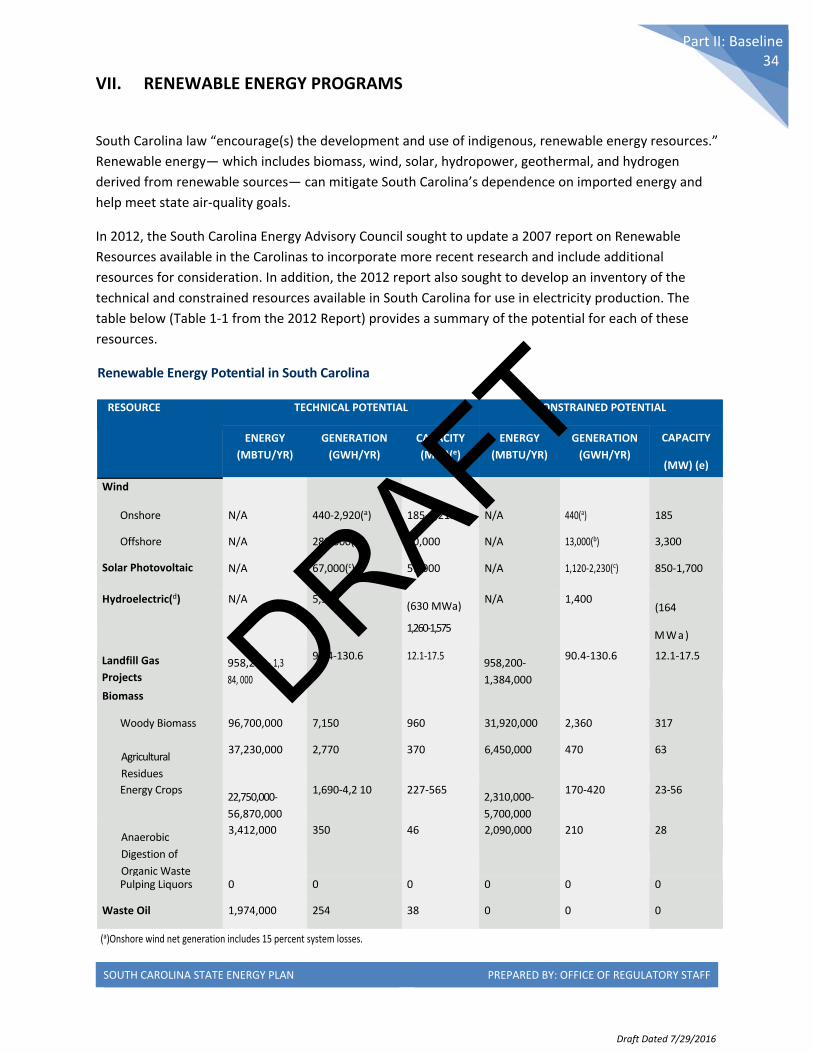
SOUTH CAROLINA STATE ENERGY PLAN PREPARED BY: OFFICE OF REGULATORY STAFF
Part II: Baseline 34
VII. RENEWABLE ENERGY PROGRAMS
South Carolina law “encourage(s) the development and use of indigenous, renewable energy resources.”
Renewable energy— which includes biomass, wind, solar, hydropower, geothermal, and hydrogen
derived from renewable sources— can mitigate South Carolina’s dependence on imported energy and
help meet state air‐quality goals.
In 2012, the South Carolina Energy Advisory Council sought to update a 2007 report on Renewable
Resources available in the Carolinas to incorporate more recent research and include additional
resources for consideration. In addition, the 2012 report also sought to develop an inventory of the
technical and constrained resources available in South Carolina for use in electricity production. The
table below (Table 1‐1 from the 2012 Report) provides a summary of the potential for each of these
resources.
Renewable Energy Potential in South Carolina
RESOURCE TECHNICAL POTENTIAL CONSTRAINED POTENTIAL
ENERGY
(MBTU/YR)
GENERATION
(GWH/YR)
CAPACITY
(MW)(e)
ENERGY
(MBTU/YR)
GENERATION
(GWH/YR)
CAPACITY
(MW) (e)
Wind
Onshore N/A 440‐2,920(a) 185‐1,215 N/A 440(a) 185
Offshore N/A 280,000(b) 70,000 N/A 13,000(b) 3,300
Solar Photovoltaic N/A 67,000(c) 51,000 N/A 1,120‐2,230(c) 850‐1,700
Hydroelectric(d) N/A 5,500 (630 MWa)
1,260‐1,575
N/A 1,400 (164
MWa)
Landfill Gas
Projects 958,200‐ 1,3
84, 000
90.4‐130.6 12.1‐17.5 958,200‐
1,384,000
90.4‐130.6 12.1‐17.5
Biomass
Woody Biomass 96,700,000 7,150 960 31,920,000 2,360 317
Agricultural
Residues
37,230,000 2,770 370 6,450,000 470 63
Energy Crops 22,750,000‐
56,870,000
1,690‐4,2 10 227‐565 2,310,000‐
5,700,000
170‐420 23‐56
Anaerobic
Digestion of
Organic Waste
3,412,000 350 46 2,090,000 210 28
Pulping Liquors 0 0 0 0 0 0
Waste Oil 1,974,000 254 38 0 0 0
(a)Onshore wind net generation includes 15 percent system losses.
DRAFT
Draft Dated 7/29/2016
SOUTH CAROLINA STATE ENERGY PLAN PREPARED BY: OFFICE OF REGULATORY STAFF
Part II: Baseline 35
(b)Offshore wind net generation includes 20 percent system losses. (c)Solar PV generation estimate is based on 15 percent annual capacity factor. (d)To convert the annual mean MW (MWa) of the hydroelectric potential to hydroelectric capacity potential, a range of capacity factors (40 to 50 percent) is assumed. (e)All generation capacity is measured in alternating current (AC).
Source: http://www.scstatehouse.gov/CommitteeInfo/EnergyAdvisoryCouncil/ResourceStudyComments/SCEACResourceStudy_FINAL.pdf
Based upon the analysis in this report, not all renewable resources as outlined above are being pursued
in an equal manner in South Carolina for the production of energy.
Biomass
Biomass energy is a renewable energy source that includes trees, farm crops, manure, plants, and
landfill gas. How biomass works is very simple. The waste wood, tree branches, and other scraps are
gathered together from factories and farms and transported to a biomass power plant. Here the
biomass is dumped into huge hoppers. This material is then fed into a furnace where it is burned. The
heat is used to boil water in a boiler, and the energy in the steam is used to turn turbines and
generators.
Biomass can also be tapped right at the landfill or in a digester. When garbage decomposes, it gives off
methane gas (natural gas is made up of methane). Pipelines are put into the landfills, and the methane
gas can be collected and then used in power plants to make electricity. This type of biomass is called
landfill gas. When organics are decomposed in the controlled anaerobic environment of a digester,
methane gas is also produced to make electricity in similar power plants as used for landfill gas.
Biomass is a renewable energy source because we can always grow more trees and crops, and waste will
always exist. For a list of current permitting biomass facilities, please see Appendix N.
Wind
In late 2008, the South Carolina General Assembly passed Act 318 to create the Wind Energy Production
Farms Feasibility Study Committee (Committee). The purpose of this Committee was to review, study
and make recommendations regarding the feasibility of wind farms in the state. The focus of the
Committee included, but was not limited to, whether South Carolina is a suitable site for wind
production on land or in offshore areas, the economic and environmental impact to the state and the
cost of wind farm installation and operation in the state. Committee members included elected officials
and other leaders knowledgeable about wind energy. The Committee was staffed by the SC Energy
Office. The state also created a Coastal Clean Energy Task Force in 2008, consisting of state regulators
and others likely to play a key role in regulating wind energy related infrastructure in state waters. The
intent of the task force was to be ready to address offshore wind development when and if it occurred.
In 2009, President Barack Obama announced the final regulations for the Outer Continental Shelf (OCS)
Renewable Energy Program, which was authorized by the Energy Policy Act of 2005 (EPAct). These
regulations provide a framework for issuing leases, easements, and rights‐of‐way for OCS activities that
support production and transmission of energy from sources other than oil and natural gas. The U.S.
Department of the Interior's Bureau of Ocean Energy Management (BOEM) is responsible for overseeing
offshore renewable energy development in federal waters.
DRAFT
Draft Dated 7/29/2016
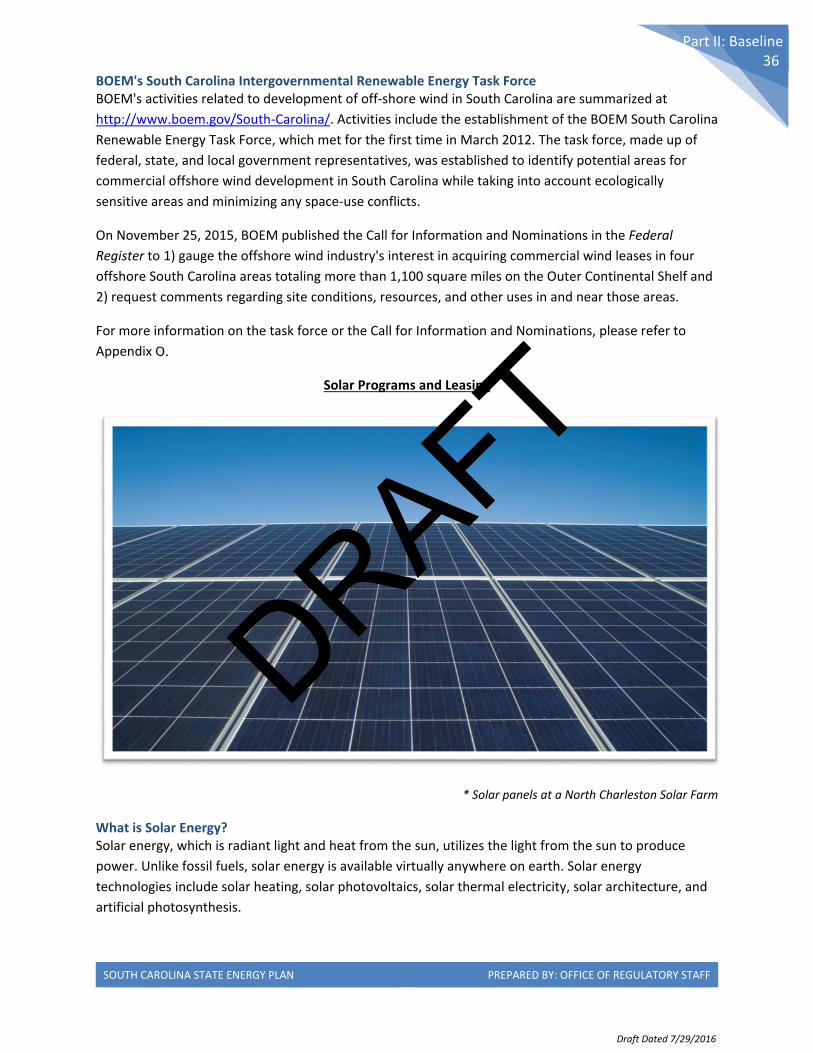
SOUTH CAROLINA STATE ENERGY PLAN PREPARED BY: OFFICE OF REGULATORY STAFF
Part II: Baseline 36
BOEM's South Carolina Intergovernmental Renewable Energy Task Force BOEM's activities related to development of off‐shore wind in South Carolina are summarized at
http://www.boem.gov/South‐Carolina/. Activities include the establishment of the BOEM South Carolina
Renewable Energy Task Force, which met for the first time in March 2012. The task force, made up of
federal, state, and local government representatives, was established to identify potential areas for
commercial offshore wind development in South Carolina while taking into account ecologically
sensitive areas and minimizing any space‐use conflicts.
On November 25, 2015, BOEM published the Call for Information and Nominations in the Federal
Register to 1) gauge the offshore wind industry's interest in acquiring commercial wind leases in four
offshore South Carolina areas totaling more than 1,100 square miles on the Outer Continental Shelf and
2) request comments regarding site conditions, resources, and other uses in and near those areas.
For more information on the task force or the Call for Information and Nominations, please refer to
Appendix O.
Solar Programs and Leasing
* Solar panels at a North Charleston Solar Farm
What is Solar Energy? Solar energy, which is radiant light and heat from the sun, utilizes the light from the sun to produce
power. Unlike fossil fuels, solar energy is available virtually anywhere on earth. Solar energy
technologies include solar heating, solar photovoltaics, solar thermal electricity, solar architecture, and
artificial photosynthesis.
DRAFT
Draft Dated 7/29/2016
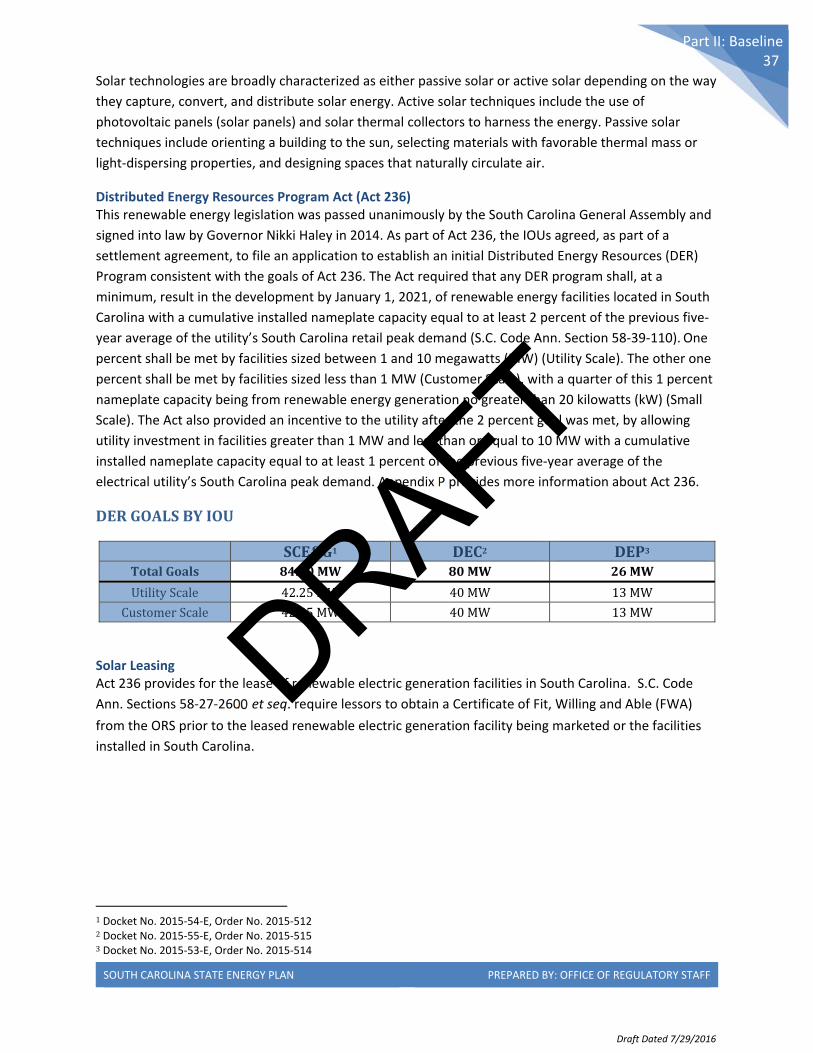
SOUTH CAROLINA STATE ENERGY PLAN PREPARED BY: OFFICE OF REGULATORY STAFF
Part II: Baseline 37
Solar technologies are broadly characterized as either passive solar or active solar depending on the way
they capture, convert, and distribute solar energy. Active solar techniques include the use of
photovoltaic panels (solar panels) and solar thermal collectors to harness the energy. Passive solar
techniques include orienting a building to the sun, selecting materials with favorable thermal mass or
light‐dispersing properties, and designing spaces that naturally circulate air.
Distributed Energy Resources Program Act (Act 236) This renewable energy legislation was passed unanimously by the South Carolina General Assembly and
signed into law by Governor Nikki Haley in 2014. As part of Act 236, the IOUs agreed, as part of a
settlement agreement, to file an application to establish an initial Distributed Energy Resources (DER)
Program consistent with the goals of Act 236. The Act required that any DER program shall, at a
minimum, result in the development by January 1, 2021, of renewable energy facilities located in South
Carolina with a cumulative installed nameplate capacity equal to at least 2 percent of the previous five‐
year average of the utility’s South Carolina retail peak demand (S.C. Code Ann. Section 58‐39‐110). One
percent shall be met by facilities sized between 1 and 10 megawatts (MW) (Utility Scale). The other one
percent shall be met by facilities sized less than 1 MW (Customer Scale), with a quarter of this 1 percent
nameplate capacity being from renewable energy generation no greater than 20 kilowatts (kW) (Small
Scale). The Act also provided an incentive to the utility after the 2 percent goal was met, by allowing
utility investment in facilities greater than 1 MW and less than or equal to 10 MW with a cumulative
installed nameplate capacity equal to at least 1 percent of the previous five‐year average of the
electrical utility’s South Carolina peak demand. Appendix P provides more information about Act 236.
DERGOALSBYIOU
SCE&G1 DEC2 DEP3TotalGoals 84.50MW 80MW 26MW
UtilityScale 42.25MW 40MW 13MW
CustomerScale 42.25MW 40MW 13MW
Solar Leasing Act 236 provides for the lease of renewable electric generation facilities in South Carolina. S.C. Code
Ann. Sections 58‐27‐2600 et seq. require lessors to obtain a Certificate of Fit, Willing and Able (FWA)
from the ORS prior to the leased renewable electric generation facility being marketed or the facilities
installed in South Carolina.
1 Docket No. 2015‐54‐E, Order No. 2015‐512 2 Docket No. 2015‐55‐E, Order No. 2015‐515 3 Docket No. 2015‐53‐E, Order No. 2015‐514
DRAFT
Draft Dated 7/29/2016
SOUTH CAROLINA STATE ENERGY PLAN PREPARED BY: OFFICE OF REGULATORY STAFF
Part II: Baseline 38
VIII. ENERGY FOR TRANSPORTATION
Transportation and its relationship to the State Energy Plan can be categorized as follows: fuel,
transportation choices, and land use.
Fuel: Transportation (and the energy used to support it) is crucial to South Carolina’s economic
development efforts and can also have a significant effect on regional air‐quality considerations.
Therefore, any plan for the state’s energy future must consider how changes in transportation will affect
the way we use transportation fuel— the mix of fuel needed, the distribution of transportation fuel
across the state, and the efficiency with which we use these fuels.
Choice: Transportation choices, or how we travel and move goods from point A to point B, also affect
the amount of energy consumed per person and affect regional mobility and congestion. Transit choices
that allow more people to share a vehicle – for example, rideshare, bus, bus‐rapid‐transit, and rail—
reduce individual fuel consumption. Choices about the fuel and mode used to move goods, as well as
intermodal considerations, will also have a significant effect on energy consumed per person or per unit
of gross state product.
Land Use: How our communities develop affects our transportation fuel use and choices. Long
distances between employment and home increase our daily fuel use. In addition, reliance on highways
and high‐speed roadways without bicycle and pedestrian infrastructure reduces our ability to travel
without a car, thus further adding to fuel consumption. Compact urban environments have proved to
create fewer vehicle miles traveled and fewer vehicle trips per day, thus reducing fuel use and
encouraging transportation choices such as transit, bicycling, and pedestrian activity.
Based on 2013 EIA data, approximately 28 percent by Btu of the total energy used in South Carolina is
used for transportation. Of the 482.6 trillion BTU of petroleum used in the state in 2013, 452.9 trillion
BTUs were accounted for by the transportation sector. According to the EIA, the state’s petroleum
consumption is at the national median. However, motor gasoline consumption per capita is among the
highest in the nation due to “extensive motor travel on the state’s major interstate corridors.”
Interestingly, although the state does not have any ethanol plants, and does not require ethanol to be
blended into conventional motor fuels, the EIA reports that approximately 2 percent of the nation’s fuel
ethanol consumption occurs in South Carolina.
The South Carolina Department of Transportation (SCDOT) maintains the fourth largest state‐owned
system of roads in the U.S., with 41,392 centerline miles and over 90,000 lane miles of roadway. Vehicle
miles traveled (VMT) on the state’s roads in 2013 were approximately 49 billion, a decrease from the
peak VMT in 2007 of 51 billion. Approximately 29 percent of VMT occurs on interstates, which
collectively account for only 2 percent of the public roads in the state. (Source: SC Multimodal
Transportation Plan 2040, SCDOT, 2016 State of DOT, SCDOT)
In addition to the state’s roads, transportation modes which will affect the state’s fuel demand include
the following:
DRAFT
Draft Dated 7/29/2016
SOUTH CAROLINA STATE ENERGY PLAN PREPARED BY: OFFICE OF REGULATORY STAFF
Part II: Baseline 39
Aviation: 53 airports (six primary commercial service airports, 45 general aviation facilities, and two
reliever airports that provide pilots with alternatives to congested hub airports)
Ports: The South Carolina Ports Authority owns and operates two seaports at Charleston and
Georgetown. The container traffic passing through the Port of Charleston increased approximately 10
percent between 2011 and 2012 and is projected to increase with major projects. The port is building a
new container terminal, expected to boost container capacity by 50 percent. Harbor dredging beyond 45
feet is permitted and will be completed by 2020; this improvement will allow the port to accommodate
post‐Panamax ships (larger vessels able to fit through the expanded Panama Canal) with greater
frequency.
Inland Port: An inland port was established in Greer, which allows shippers to access more than 95
million consumers within a one‐day drive. A second hub is being considered in Dillon.
Rail: Freight moves over 2,378 miles with 11 different rail carriers. The two largest, CSX and Norfolk
Southern, account for 2,044 miles of the system. The state has 11 Amtrak stations along three routes
that use track owned by CSX (2) and Norfolk Southern (1). Rail access for many of these projects, such as
the ports, is imperative in order to reduce energy consumption.
Efficiencies that may help to reduce the demand for fuel include the following: changes in CAFÉ
standards that specify target miles per gallon for the nation’s vehicles; state and local programs that
promote public transit, carpooling, or ridesharing; local programs including Park‐and‐Ride programs,
incentives for alternative‐fuel vehicles, and incentives for transit‐oriented development.
Public or Mass Transit Programs Mass Transit: Public transit is available to residents of 40 out of 46 counties, with 25 publicly supported
transit agencies operating in 27 areas of the state. Sixteen of these operate in rural or non‐urbanized
areas. SCDOT’s plan notes that “counties without established general public transit service were
Abbeville, Cherokee, Greenwood, Laurens, Saluda, and Union Counties.” A listing of public transit
services appears in Appendix Z of this report.
Intercity Bus: Greyhound Lines and Southeastern Stages serve Columbia, Greenville, Myrtle Beach, and
Orangeburg, with additional routes to regional destinations. The long distance Megabus also began
service in South Carolina recently.
Bicycle and Pedestrian Travel: Approximately 1,260 miles of bike lanes on state‐maintained and local
roads existed at the time the 2040 Multi‐Modal Transportation Plan was prepared in 2014. More than
7,000 additional miles have been proposed in regional plans.
Appendix Q includes specific information about available public transit in South Carolina.
Carpooling or Ridesharing
Those choosing to reduce personal vehicle miles traveled may be able to make use of Park and Ride or
SmartRide options—parking lots where motorists from a wide area may park and share public transit to
DRAFT
Draft Dated 7/29/2016
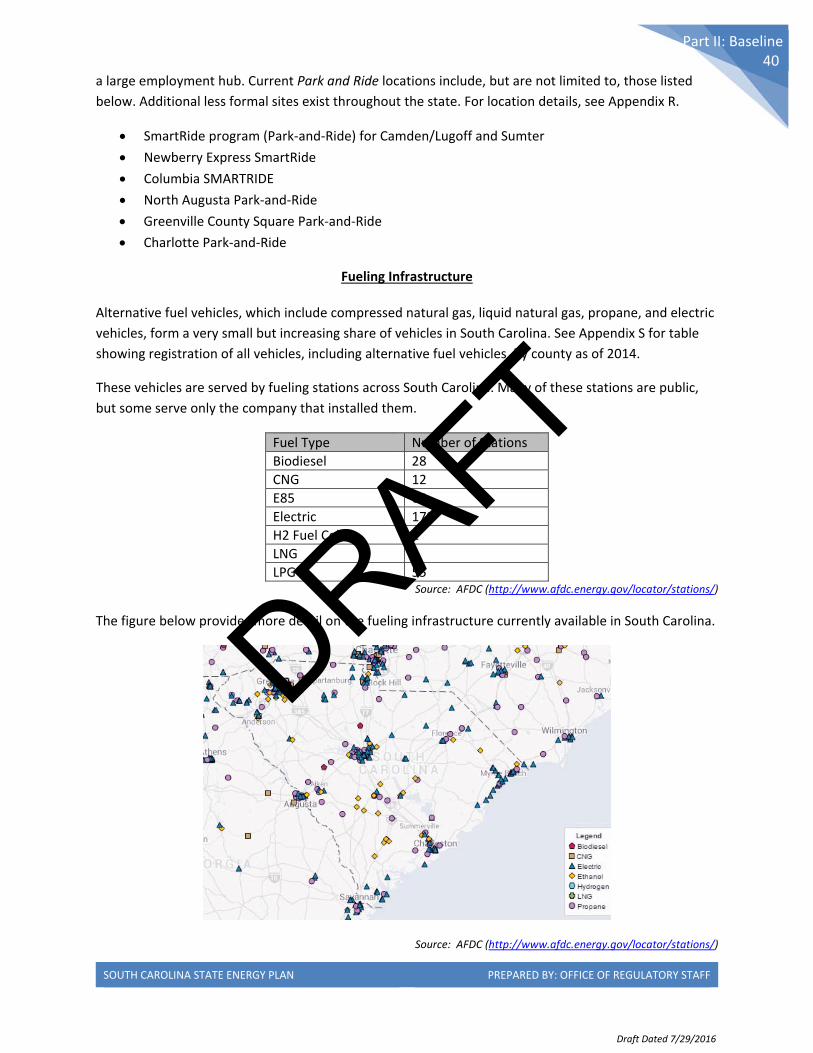
SOUTH CAROLINA STATE ENERGY PLAN PREPARED BY: OFFICE OF REGULATORY STAFF
Part II: Baseline 40
a large employment hub. Current Park and Ride locations include, but are not limited to, those listed
below. Additional less formal sites exist throughout the state. For location details, see Appendix R.
SmartRide program (Park‐and‐Ride) for Camden/Lugoff and Sumter
Newberry Express SmartRide
Columbia SMARTRIDE
North Augusta Park‐and‐Ride
Greenville County Square Park‐and‐Ride
Charlotte Park‐and‐Ride
Fueling Infrastructure
Alternative fuel vehicles, which include compressed natural gas, liquid natural gas, propane, and electric
vehicles, form a very small but increasing share of vehicles in South Carolina. See Appendix S for table
showing registration of all vehicles, including alternative fuel vehicles, by county as of 2014.
These vehicles are served by fueling stations across South Carolina. Many of these stations are public,
but some serve only the company that installed them.
Fuel Type Number of Stations
Biodiesel 28
CNG 12
E85 68
Electric 179
H2 Fuel Cell 2
LNG 2
LPG 55 Source: AFDC (http://www.afdc.energy.gov/locator/stations/)
The figure below provides more detail on the fueling infrastructure currently available in South Carolina.
Source: AFDC (http://www.afdc.energy.gov/locator/stations/)
DRAFT
Draft Dated 7/29/2016

SOUTH CAROLINA STATE ENERGY PLAN PREPARED BY: OFFICE OF REGULATORY STAFF
Part II: Baseline 41
IX. REGULATIONS AND STATUTES AFFECTING UTILITIES
Several federal and state statutes govern and affect the way utilities operate in South Carolina. These
laws and regulations have and will play a significant role in shaping energy production, infrastructure,
and planning in the state.
As already noted, the recent passage of the Distributed Energy Resources Program Act (see Appendix P)
has paved the way for increased renewable energy development in South Carolina. In addition, the Base
Load Review Act, which allows for South Carolina utilities to finance the cost to construct new base load
electric generating units, has also had a significant impact in shaping energy production with the
construction of new nuclear capacity.
See Appendix T for inventory of state and federal statutes.
DRAFT
Draft Dated 7/29/2016
SOUTH CAROLINA STATE ENERGY PLAN PREPARED BY: OFFICE OF REGULATORY STAFF
Part II: Baseline 42
X. RESOURCE PLANNING
Integrated Resource Plan
In accordance with S.C. Code Ann. Section 58‐37‐40, Integrated Resource Plans (IRPs) are prepared by
IOUs and the state‐owned electric utility, Santee Cooper, and are required to be submitted to the ORS
Energy Office for evaluation and comment. Each IOU is also required to submit an IRP to the PSC. Once
the IRPs are received by the PSC, a docket is established. Interested parties have 30 days to intervene.
IRPs must be submitted every three years, and updates must be submitted on an annual basis. The IRPs
articulate the utilities’ resource plans for meeting projected customer demand by using economically
priced energy and reliable combinations of conventional generation, renewable generation, and
demand side management/energy efficiency while maintaining system flexibility and considering
environmental laws and regulations.
IRPs include but are not limited to:
Statement of long‐term and short‐term objectives
Incorporation of lowest cost options
Customer incorporation
Evaluation of the cost effectiveness of supply‐side and demand‐side options
Environmental costs
Demand forecast
Energy forecast
Risk assessment
Transmission improvements and/or additions
The maintenance and refurbishment of existing units
Anticipated major problems
Explanation and/or description of any new technologies
Identification of future supply‐side options and anticipated locations
South Carolina electric utility transmission planning practices develop and coordinate modifications to
the state’s transmission system to ensure delivery of reliable and economical electrical energy. These
planning practices include determination of the current capacity of the electrical network and a ten‐year
schedule of future additions and modifications to the system. The purpose of these additions and
modifications is to support customer growth, provide emergency assistance, and maintain economic
opportunities for electric customers while meeting industry‐transmission performance standards – that
is, the NERC Reliability Standards for Transmission Planning, as approved by the NERC Board of Trustees
and the FERC.
Distribution system planning in South Carolina follows a similar process. Modeling studies are performed
to assess the capacity of distribution lines and other infrastructure to support expected load growth and
grid conditions. The results of these studies help identify any upgrades needed to fulfill reliability
standards and maintain the safety of the distribution system.
DRAFT
Draft Dated 7/29/2016
SOUTH CAROLINA STATE ENERGY PLAN PREPARED BY: OFFICE OF REGULATORY STAFF
Part II: Baseline 43
Statewide Generation Resources
South Carolina's energy portfolio includes a diverse mix of electricity generation plants across the many
utility fleets. Fuel diversity provides benefits to the citizens of South Carolina including 1) the economical
dispatch of generating facilities based on the lowest fuel prices at the time of consumer demand needs
2) the reliable and continuous base load power customers count on each day and each night and 3) the
incorporation of environmental aspects towards the reduction of emissions such as CO2. The continued
growth of South Carolina’s economy and its energy needs requires the continued and focused decisions
on clean, safe, reliable and economical sources of power throughout the state.
This strategy further relies upon increasing the amounts of non‐greenhouse gas emitting nuclear and
renewable electric generation, the increased use of natural gas for generation due to the lower cost of
natural gas, fuel switching at some plants from coal to natural gas, as well as existing fossil‐fuel fired
plants with proven emissions controls. Finally, the increased energy efficiencies of products and
measures implemented by South Carolina customers contribute toward lower energy demands.
Resource Roles Some generators are very good for base load power production such as nuclear, coal and combined‐
cycle natural gas plants. To a smaller degree, certain biomass facilities can provide meaningful
generation in a similar fashion; in other words, they provide the optimal 24x7 power production
extremely efficiently, reliably, and cost effectively. More than half of the electricity currently produced
in South Carolina comes from nuclear power, which has been providing power safely and reliably for
three decades.
Some generators provide intermediate power, and others provide peaking power. Typically, peaking
power plants do not run until it is really hot or really cold. They are called upon to meet loads for a few
hours, and on short notice, because of their fast‐ramping capabilities. They can be less efficient,
however, and represented by either oil, natural gas combustion turbines, or steam turbines.
Several pumped‐storage hydro facilities are used throughout South Carolina and provide an excellent
resource for peak shaving, or reducing the amount of energy purchased from a utility during peak hours.
Water is run downhill to produce power during peak periods, and then pumped uphill to a storage
reservoir when there is ample base load such as at night during the summer.
Renewable energy is self‐dispatching—when the wind blows or the sun shines, those generators make
electricity. With proper planning, system upgrades, and integration with the electric grid, these
resources can play a very positive role in furthering energy diversity and lowering environmental
impacts.
DRAFT
Draft Dated 7/29/2016
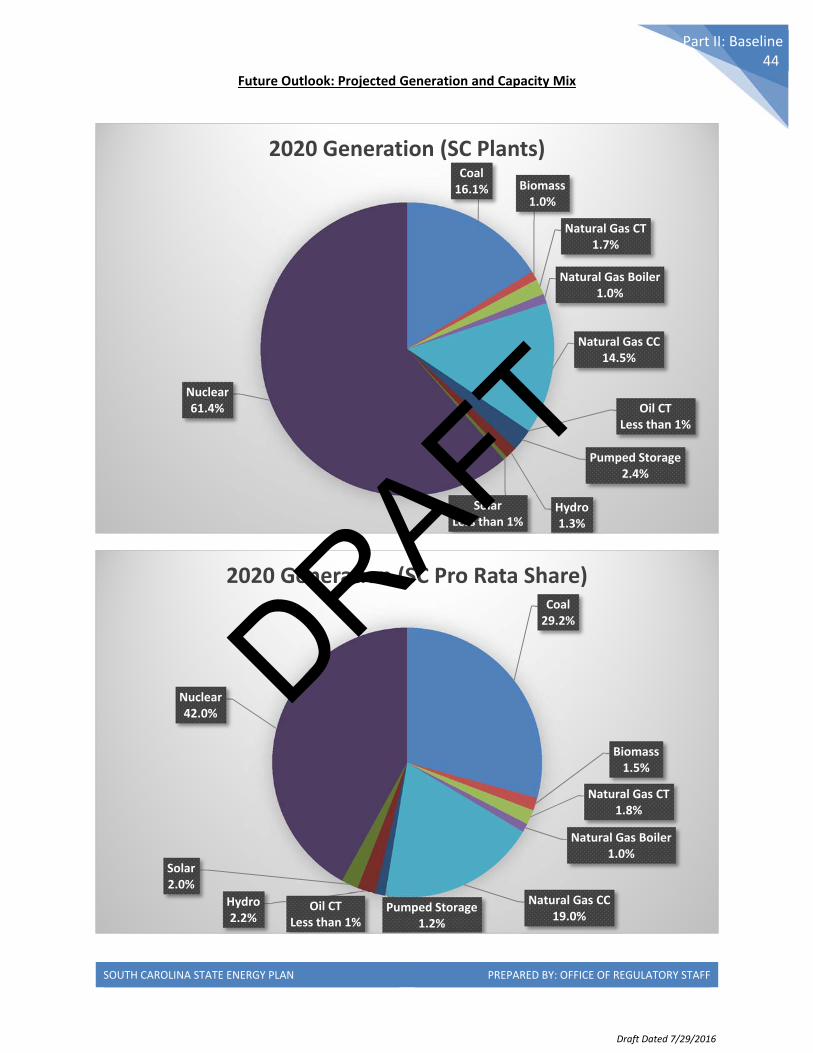
SOUTH CAROLINA STATE ENERGY PLAN PREPARED BY: OFFICE OF REGULATORY STAFF
Part II: Baseline 44
Future Outlook: Projected Generation and Capacity Mix
Coal16.1% Biomass
1.0%
Natural Gas CT1.7%
Natural Gas Boiler1.0%
Natural Gas CC14.5%
Oil CTLess than 1%
Pumped Storage2.4%
Hydro1.3%
SolarLess than 1%
Nuclear61.4%
2020 Generation (SC Plants)
Coal29.2%
Biomass1.5%
Natural Gas CT1.8%
Natural Gas Boiler1.0%
Natural Gas CC19.0%
Oil CTLess than 1%
Pumped Storage1.2%
Hydro2.2%
Solar2.0%
Nuclear42.0%
2020 Generation (SC Pro Rata Share)
DRAFT
Draft Dated 7/29/2016
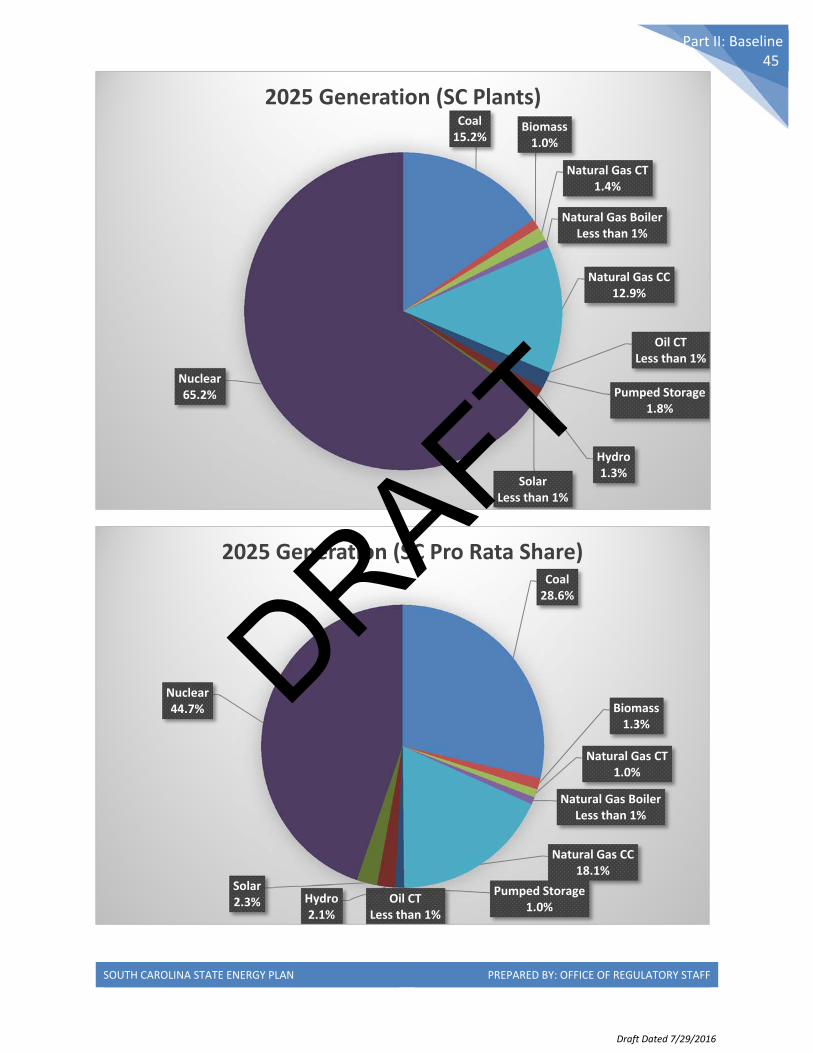
SOUTH CAROLINA STATE ENERGY PLAN PREPARED BY: OFFICE OF REGULATORY STAFF
Part II: Baseline 45
Coal15.2%
Biomass1.0%
Natural Gas CT1.4%
Natural Gas BoilerLess than 1%
Natural Gas CC12.9%
Oil CTLess than 1%
Pumped Storage1.8%
Hydro1.3%
SolarLess than 1%
Nuclear65.2%
2025 Generation (SC Plants)
Coal28.6%
Biomass1.3%
Natural Gas CT1.0%
Natural Gas BoilerLess than 1%
Natural Gas CC18.1%
Oil CTLess than 1%
Pumped Storage1.0%
Hydro2.1%
Solar2.3%
Nuclear44.7%
2025 Generation (SC Pro Rata Share)
DRAFT
Draft Dated 7/29/2016

SOUTH CAROLINA STATE ENERGY PLAN PREPARED BY: OFFICE OF REGULATORY STAFF
Part II: Baseline 46
Coal22.5%
Biomass1.8%
Natural Gas CT7.5%
Natural Gas Boiler2.2%
Natural Gas CC14.1%Oil
Less than 1%Pumped Storage
11.6%
Hydro4.1%
Solar0.6%
Nuclear34.8%
2020 Summer Capacity (SC Plants)
Coal33.5%
Biomass2.0%
Natural Gas CT8.6%
Natural Gas Boiler1.7%
Natural Gas CC15.8%
Oil CT1.5%
Pumped Storage5.1%
Hydro5.9%
Solar3.8%
Nuclear22.1%
2020 Summer Capacity (SC Pro Rata Share)
DRAFT
Draft Dated 7/29/2016
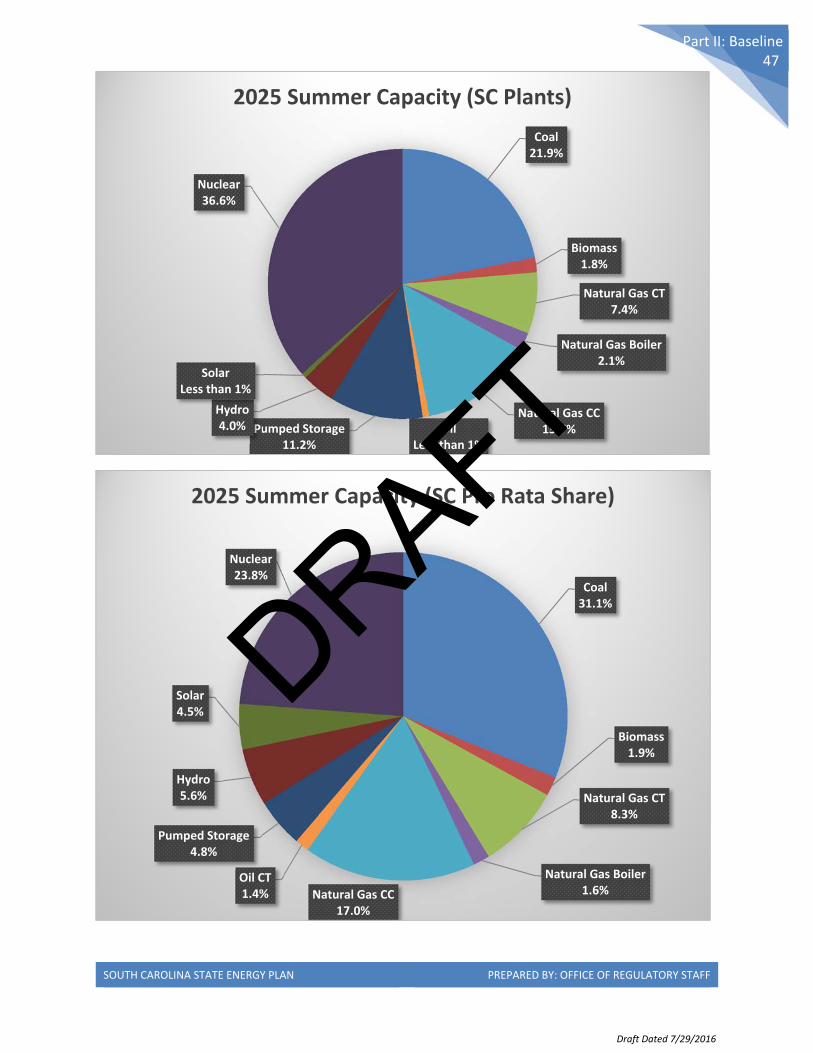
SOUTH CAROLINA STATE ENERGY PLAN PREPARED BY: OFFICE OF REGULATORY STAFF
Part II: Baseline 47
Coal21.9%
Biomass1.8%
Natural Gas CT7.4%
Natural Gas Boiler2.1%
Natural Gas CC13.7%Oil
Less than 1%Pumped Storage
11.2%
Hydro4.0%
SolarLess than 1%
Nuclear36.6%
2025 Summer Capacity (SC Plants)
Coal31.1%
Biomass1.9%
Natural Gas CT8.3%
Natural Gas Boiler1.6%Natural Gas CC
17.0%
Oil CT1.4%
Pumped Storage4.8%
Hydro5.6%
Solar4.5%
Nuclear23.8%
2025 Summer Capacity (SC Pro Rata Share)
DRAFT
Draft Dated 7/29/2016