Embed Size (px)
Citation preview
Sartorius AG Otto-Brenner-Strasse 2037079 Goettingen, Germany
Phone: +49.551.308.0Fax: +49.551.308.3289
Sartorius Group | 2017 Annual Report
©Sar
tori
us A
G |
Pri
nted
in G
erm
any
| Pu
blic
atio
n N
o. O
G-0
052-
e171
201
| O
rder
No.
860
00-0
02-1
9
Sartorius Group2017 Annual Report
d-GB2017-Konzern-Umschlag_einzeln.indd 1 14.02.18 15:30
Annual Shareholders’ Meeting in Goettingen, Germany April 5, 2018
Payment of dividends1) April 10, 2018
Publication of first-quarter figures for 2018 April 24, 2018
Publication of first-half figures for 2018 July 24, 2018
Publication of nine-month figures for 2018 October 24, 2018
German Equity Forum in Frankfurt | Main, Germany November 26 – 28, 2018
Publication of preliminary figures for fiscal 2018 January 2019
Annual press conference in Goettingen, Germany February 2019
Annual Shareholders’ Meeting in Goettingen, Germany March 28, 2019
Publication of first-quarter figures for 2019 April 2019
1) Subject to approval by the Annual Shareholders’ Meeting
Contacts
Petra KirchhoffVice President Corporate Communications & IR
Phone: [email protected]
Financial Schedule
About This Publication
Published bySartorius AGCorporate Communications37070 Goettingen, Germany
Editorial DeadlineFebruary 20, 2018
Published onFebruary 21, 2018
Financial Reporting System firesysfiresys GmbH Frankfurt | Main, Germany
PhotographyPeter GinterLohmar, Germany
Frank Stefan KimmelGoettingen, Germany
Benedikt OrzelekDirectorInvestor Relations
Phone: [email protected]
This is a translation of the original German-language annual report.
Key Figures
1) Underlying = excluding extraordinary items2) After non-controlling interest, adjusted for extraordinary items and non-cash amortization, as well as based on the normalized financial
result, including the corresponding tax effects for each of these items3) Restated4) Adjusted for stock split; rounded values5) Amounts suggested by the Supervisory Board and the Executive Board of Sartorius AG6) Including discontinued operation7) Excluding TAP Biosystems
All figures are given in millions of ¤ according 2017 2016 2015 2014 2013 2013 to the IFRS, unless otherwise specified restated
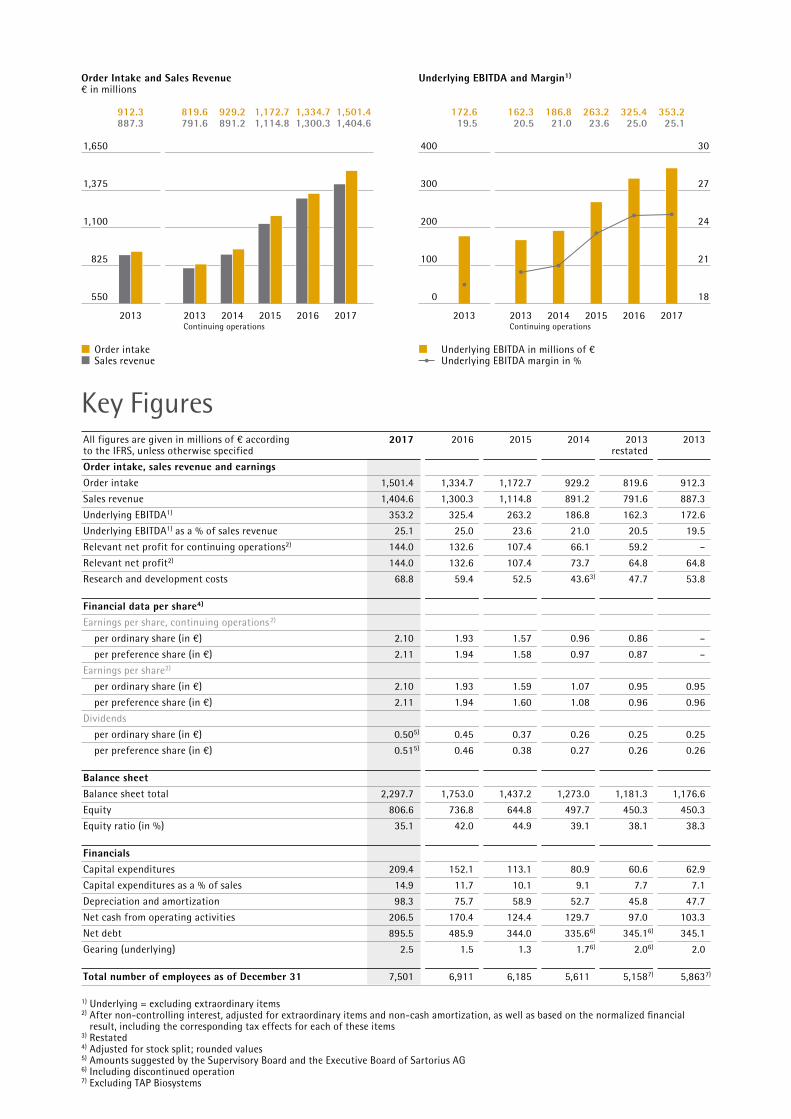
Order intake, sales revenue and earningsOrder intake 1,501.4 1,334.7 1,172.7 929.2 819.6 912.3
Sales revenue 1,404.6 1,300.3 1,114.8 891.2 791.6 887.3
Underlying EBITDA1) 353.2 325.4 263.2 186.8 162.3 172.6
Underlying EBITDA1) as a % of sales revenue 25.1 25.0 23.6 21.0 20.5 19.5
Relevant net profit for continuing operations2) 144.0 132.6 107.4 66.1 59.2 –
Relevant net profit2) 144.0 132.6 107.4 73.7 64.8 64.8
Research and development costs 68.8 59.4 52.5 43.63) 47.7 53.8
Financial data per share4)
Earnings per share, continuing operations 2)
per ordinary share (in ¤) 2.10 1.93 1.57 0.96 0.86 –
per preference share (in ¤) 2.11 1.94 1.58 0.97 0.87 –
Earnings per share2)
per ordinary share (in ¤) 2.10 1.93 1.59 1.07 0.95 0.95
per preference share (in ¤) 2.11 1.94 1.60 1.08 0.96 0.96
Dividends
per ordinary share (in ¤) 0.505) 0.45 0.37 0.26 0.25 0.25
per preference share (in ¤) 0.515) 0.46 0.38 0.27 0.26 0.26
Balance sheetBalance sheet total 2,297.7 1,753.0 1,437.2 1,273.0 1,181.3 1,176.6
Equity 806.6 736.8 644.8 497.7 450.3 450.3
Equity ratio (in %) 35.1 42.0 44.9 39.1 38.1 38.3
FinancialsCapital expenditures 209.4 152.1 113.1 80.9 60.6 62.9
Capital expenditures as a % of sales 14.9 11.7 10.1 9.1 7.7 7.1
Depreciation and amortization 98.3 75.7 58.9 52.7 45.8 47.7
Net cash from operating activities 206.5 170.4 124.4 129.7 97.0 103.3
Net debt 895.5 485.9 344.0 335.66) 345.16) 345.1
Gearing (underlying) 2.5 1.5 1.3 1.76) 2.06) 2.0
Total number of employees as of December 31 7,501 6,911 6,185 5,611 5,1587) 5,8637)
Order Intake and Sales Revenue ¤ in millions
912.3 819.6 929.2 1,172.7 1,334.7 1,501.4 887.3 791.6 891.2 1,114.8 1,300.3 1,404.6
1,650
1,375
1,100
825
550
2013 2013 2014 2015 2016 2017Continuing operations
■ Order intake ■Sales revenue
Underlying EBITDA and Margin1)
172.6 162.3 186.8 263.2 325.4 353.2 19.5 20.5 21.0 23.6 25.0 25.1
400 30
300 27
200 24
100 21
0 18
2013 2013 2014 2015 2016 2017Continuing operations
■ Underlying EBITDA in millions of ¤ Underlying EBITDA margin in %
Annual Shareholders’ Meeting in Goettingen, Germany April 5, 2018
Payment of dividends1) April 10, 2018
Publication of first-quarter figures for 2018 April 24, 2018
Publication of first-half figures for 2018 July 24, 2018
Publication of nine-month figures for 2018 October 24, 2018
German Equity Forum in Frankfurt | Main, Germany November 26 – 28, 2018
Publication of preliminary figures for fiscal 2018 January 2019
Annual press conference in Goettingen, Germany February 2019
Annual Shareholders’ Meeting in Goettingen, Germany March 28, 2019
Publication of first-quarter figures for 2019 April 2019
1) Subject to approval by the Annual Shareholders’ Meeting
Contacts
Petra KirchhoffVice President Corporate Communications & IR
Phone: [email protected]
Financial Schedule
About This Publication
Published bySartorius AGCorporate Communications37070 Goettingen, Germany
Editorial DeadlineFebruary 20, 2018
Published onFebruary 21, 2018
Financial Reporting System firesysfiresys GmbH Frankfurt | Main, Germany
PhotographyPeter GinterLohmar, Germany
Frank Stefan KimmelGoettingen, Germany
Benedikt OrzelekDirectorInvestor Relations
Phone: [email protected]
This is a translation of the original German-language annual report.
Key Figures
1) Underlying = excluding extraordinary items2) After non-controlling interest, adjusted for extraordinary items and non-cash amortization, as well as based on the normalized financial
result, including the corresponding tax effects for each of these items3) Restated4) Adjusted for stock split; rounded values5) Amounts suggested by the Supervisory Board and the Executive Board of Sartorius AG6) Including discontinued operation7) Excluding TAP Biosystems
All figures are given in millions of ¤ according 2017 2016 2015 2014 2013 2013 to the IFRS, unless otherwise specified restated
Order intake, sales revenue and earningsOrder intake 1,501.4 1,334.7 1,172.7 929.2 819.6 912.3
Sales revenue 1,404.6 1,300.3 1,114.8 891.2 791.6 887.3
Underlying EBITDA1) 353.2 325.4 263.2 186.8 162.3 172.6
Underlying EBITDA1) as a % of sales revenue 25.1 25.0 23.6 21.0 20.5 19.5
Relevant net profit for continuing operations2) 144.0 132.6 107.4 66.1 59.2 –
Relevant net profit2) 144.0 132.6 107.4 73.7 64.8 64.8
Research and development costs 68.8 59.4 52.5 43.63) 47.7 53.8
Financial data per share4)
Earnings per share continued operations2)
per ordinary share (in ¤) 2.10 1.93 1.57 0.96 0.86 –
per preference share (in ¤) 2.11 1.94 1.58 0.97 0.87 –
Earnings per share2)
per ordinary share (in ¤) 2.10 1.93 1.59 1.07 0.95 0.95
per preference share (in ¤) 2.11 1.94 1.60 1.08 0.96 0.96
Dividends
per ordinary share (in ¤) 0.505) 0.45 0.37 0.26 0.25 0.25
per preference share (in ¤) 0.515) 0.46 0.38 0.27 0.26 0.26
Balance sheetBalance sheet total 2,297.7 1,753.0 1,437.2 1,273.0 1,181.3 1,176.6
Equity 806.6 736.8 644.8 497.7 450.3 450.3
Equity ratio (in %) 35.1 42.0 44.9 39.1 38.1 38.3
FinancialsCapital expenditures 209.4 152.1 113.1 80.9 60.6 62.9
Capital expenditures as a % of sales 14.9 11.7 10.1 9.1 7.7 7.1
Depreciation and amortization 98.3 75.7 58.9 52.7 45.8 47.7
Net cash from operating activities 206.5 170.4 124.4 129.7 97.0 103.3
Net debt 895.5 485.9 344.0 335.66) 345.16) 345.1
Gearing (underlying) 2.5 1.5 1.3 1.76) 2.06) 2.0
Total number of employees as of December 31 7,501 6,911 6,185 5,611 5,1587) 5,8637)
Order Intake and Sales Revenue ¤ in millions
912.3 819.6 929.2 1,172.7 1,334.7 1,501.4 887.3 791.6 891.2 1,114.8 1,300.3 1,404.6
1,650
1,375
1,100
825
550
2013 2013 2014 2015 2016 2017Continued operations
■ Order intake ■Sales revenue
Underlying EBITDA and Margin1)
172.6 162.3 186.8 263.2 325.4 353.2 19.5 20.5 21.0 23.6 25.0 25.1
400 30
300 27
200 24
100 21
0 18
2013 2013 2014 2015 2016 2017Continued operations
■ Underlying EBITDA in millions of ¤ Underlying EBITDA margin in %
d-GB2017-Konzern-Umschlag_einzeln.indd 2 14.02.18 15:30
Sartorius is a leading international pharmaceutical and laboratory equipment supplier. With our wide array of products, we help our customers in the biopharmaceu-tical industry to manufacture innovative medications safely and economically. In laboratories for research and quality assurance, the name Sartorius is synony-mous with premium lab instruments, consumables and services that make sophisticated tasks easier and more efficient. As partners, we understand our customers’ requirements down to the last detail and are already working on solutions to meet their needs, both today and tomorrow.
We will seek to systematically expand our position as an application-oriented technology group in the fu-ture as well. Based on our clear-cut strategy, we will continue to sustainably create value for customers and shareholders alike and translate our growth into high profitability.
Our Mission
Our Divisions at a Glance
Sartorius is a leading international technology partner of the biopharmaceutical industry and research laboratories, with around 7,500 employees worldwide and Group companies in more than 30 countries. We offer integrated solutions for biopharmaceutical process development and manufacture. With our bioanalytics systems, premium instruments, consumables and services, we primarily serve the needs of laboratories performing research and quality control. We report on the business development of our two divisions, Bioprocess Solutions and Lab Products & Services, starting on page 42, and provide insights into their strategies on pages 25 and 26.
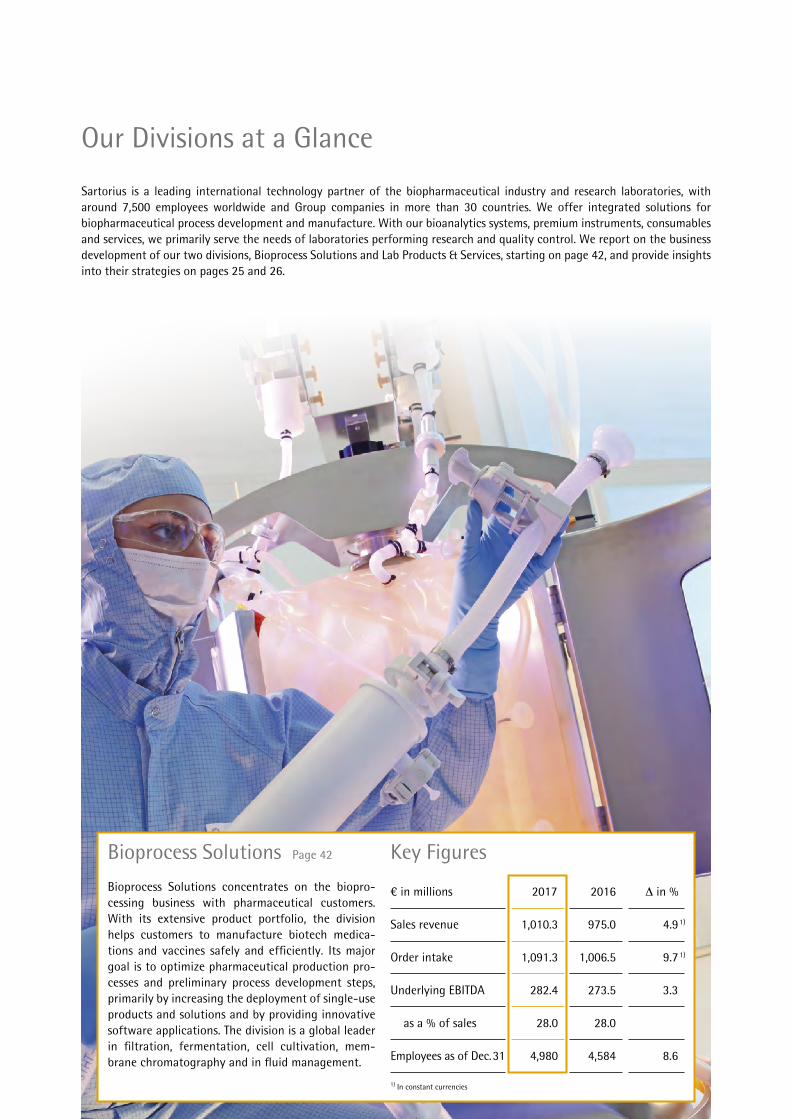
Bioprocess Solutions Page 42
Bioprocess Solutions concentrates on the biopro-cessing business with pharmaceutical customers. With its extensive product portfolio, the division helps customers to manufacture biotech medica-tions and vaccines safely and efficiently. Its major goal is to optimize pharmaceutical production pro-cesses and preliminary process development steps, primarily by increasing the deployment of single-use products and solutions and by providing innovative software applications. The division is a global leader in filtration, fermentation, cell cultivation, mem-brane chromatography and in fluid management.
1) In constant currencies
¤ in millions 2017 2016 Δ D in %
Sales revenue 1,010.3 975.0 4.9 1)
Order intake 1,091.3 1,006.5 9.7 1)
Underlying EBITDA 282.4 273.5 3.3
as a % of sales 28.0 28.0
Employees as of Dec. 31 4,980 4,584 8.6
Key Figures
e-GB2017-Konzern-Sparten.indd 2 15.02.18 10:01
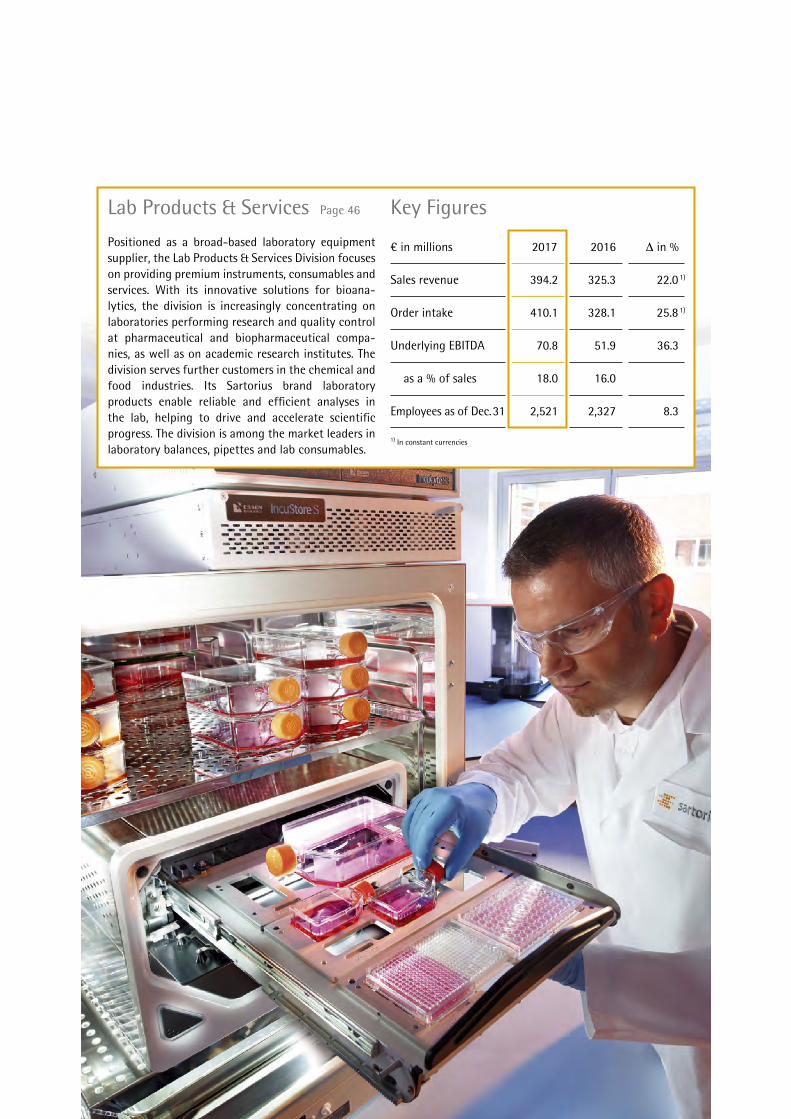
Lab Products & Services Page 46
Positioned as a broad-based laboratory equipment supplier, the Lab Products & Services Division focuses on providing premium instruments, consumables and services. With its innovative solutions for bioana-lytics, the division is increasingly concentrating on laboratories performing research and quality control at pharmaceutical and biopharmaceutical compa-nies, as well as on academic research institutes. The division serves further customers in the chemical and food industries. Its Sartorius brand laboratory products enable reliable and efficient analyses in the lab, helping to drive and accelerate scientific progress. The division is among the market leaders in laboratory balances, pipettes and lab consumables.
1) In constant currencies
¤ in millions 2017 2016 Δ D in %
Sales revenue 394.2 325.3 22.0 1)
Order intake 410.1 328.1 25.8 1)
Underlying EBITDA 70.8 51.9 36.3
as a % of sales 18.0 16.0
Employees as of Dec. 31 2,521 2,327 8.3
Key Figures
e-GB2017-Konzern-Sparten.indd 3 15.02.18 10:01
This annual report contains statements concerning the Sartorius Group’s future performance. These statements are based on assumptions and estimates. Although we are convinced that these forward-looking statements are realistic, we cannot guarantee that they will actually apply. This is because our assumptions harbor risks and uncertainties that could lead to actual results diverging substantially from the expected ones. It is not planned to update our forward-looking statements.
This is a translation of the original German-language annual report. Sartorius shall not assume any liability for the correctness of this translation. The original German annual report is the legally binding version. Furthermore, Sartorius reserves the right not to be responsible for the topicality, correctness, completeness or quality of the information provided. Liability claims regarding damage caused by the use of any informa-tion provided, including any kind of information which is incomplete or incorrect, will therefore be rejected.
Throughout the Annual Report, differences may be apparent as a result of rounding during addition.
01 To Our Shareholders
8 Report of the Executive Board
10 Sartorius Group Executive Committee
12 Report of the Supervisory Board
16 Sartorius Shares
e-GB2017-Konzern_Inhalt.indd 2 15.02.18 09:23
Contents
02 CombinedGroupManagementReport
22 StructureandManagementoftheGroup
24 StrategyandGoals
28 MacroeconomicEnvironmentandConditionsintheSectors
32 GroupBusinessDevelopment
39 NetWorthandFinancialPosition
42 BusinessDevelopmentofBioprocessSolutions
46 BusinessDevelopmentofLabProducts&Services
50 AssessmentoftheEconomicPosition
51 AnnualFinancialStatementsofSartoriusAG
54 OpportunityandRiskReport
63 ForecastReport
67 ReportonMaterialEvents
68 DescriptionoftheKeyFeaturesoftheInternalControlandRiskManagementSystem
70 ExplanatoryReportoftheExecutiveBoard
71 CorporateGovernanceReport
76 RemunerationReport
Non-FinancialDeclaration
86 SustainabilityatSartorius
90 ShapingtheFuture
105 AReliablePartner
114 GRIStandardIndex
118 IndependentAuditors’Report
03 ConsolidatedFinancial StatementsandNotes
122 StatementofProfitorLoss|OtherComprehensiveIncome
124 StatementofFinancialPosition
125 StatementofCashFlows
126 StatementofChangesinEquity
128 NotestotheFinancialStatements
147 NotestotheStatementofProfitorLoss
150 NotestotheStatementofFinancialPosition
171 OtherDisclosures
173 DeclarationoftheExecutiveBoard
174 IndependentAuditors’Report
180 ExecutiveBoardandSupervisoryBoard
04 SupplementaryInformation
185 Glossary
188 Index
190 ALocalPresenceWorldwide
192 Addresses
e-GB2017-Konzern_Inhalt.indd 3 15.02.18 09:24

[Dummy]
Leerseite

To Our Shareholders
Konzern_Trennseiten.indd 13 26.03.12 16:12
I am pleased to report that Sartorius continued on its profitable growth track in 2017, with sales up a good 9% to around €1.4 billion and with an underlying EBITDA margin of 25.1%. Our company executed two strategically important acquisitions, moved forward on its extensive investment program and created a considerable number of new jobs.
As in the previous years, we intend to have our shareholders participate adequately in the success of our company. Accordingly, the Supervisory Board and the Executive Board will submit a proposal to the Annual General Shareholders' Meeting on April 5, 2018, to raise dividends to €0.51 per preference share and €0.50 euros per ordinary share. If approved, this would be the eighth dividend increase in succession. Sartorius share prices also showed positive development in the reporting year, with preference shares up 12.8% and ordinary shares rising by 3.6%.
Growth in the Bioprocess Solutions Division, which specializes in single-use products for the manufacture of biopharmaceuticals, normalized as expected following two exceptionally strong years of expansion in 2015 and 2016. Sales development was additionally dampened by several simultaneous effects that, however, were of a temporary nature and weighed particularly on the Americas region. After a strong year-end quarter, the division's full-year sales increased by 4.9% and, despite headwinds due to exchange rates, its underlying EBITDA margin reached the very strong prior-year level of 28.0%.
We expanded the division's portfolio by an attractive component through our acquisition of Umetrics. This Swedish software company is a highly specialized, globally leading provider of data analytics software for modeling and optimizing biopharmaceutical development and manufacturing processes. The acquisition perfectly matches our existing portfolio and comes at the right time: Our biopharmaceutical customers are increasingly driving the automation of their processes by integrating data analytics software
to better monitor, automatically control and predict their biomanufacturing processes. Umetrics is a market leader for such applications, and we are highly confident of harnessing the power of this software over the medium term for use in a number of additional process steps beyond its existing applications.
Our Lab Products & Services Division, which offers products and technologies for laboratories primarily in the pharma sector and in life science research, recorded exceptionally dynamic growth due to its strong organic development and to a further key acquisition in the area of bioanalytics. The division's sales revenue rose by 22.0% and its earnings margin climbed to 18.0%. All regions and product areas contributed to this strong growth.
The acquisition of Essen BioScience in bioanalytics sharpened the strategic positioning of the division as a partner to biopharma research yet again and also contributes toward substantially strengthening the division's growth and profitability profile. Faster, more powerful procedures for cell analysis are considered essential prerequisites for achieving further medical progress, for example, in immuno-oncology and in stem cell research. Essen offers a platform of instruments, software and reagents for fully automated, real-time analysis of biological processes in live cells. Based on the data obtained, our customers can now gain new insights into the mechanisms in diseased and healthy cells that will help considerably accelerate the often very time-intensive discovery of new medical drugs.
We continued to move forward on our extensive, multi-year investment program. Besides extending our Group headquarters in Göttingen, Germany, we focused in 2017 on expanding our filter and single-use bag production facility in Yauco, Puerto Rico, which we plan to complete at the end of 2018. Hurricane Maria that hit the country in September of the past year, hardly did any damage to the site's existing
Report of the Executive Board
Dear Shareholders and Business Partners,
buildings or those under construction. We are happy that our staff survived the hurricane without sustaining any physical injuries, and are impressed by, and proud of, how much hard work all contributed toward getting our facility back up and running just after four weeks.
In the reporting year, we created 600 jobs, including substitutes for staff on extended leave, and even more than 1,000 new employees have joined us. Although the majority of our sites are not located in large cities, we continue to succeed in attracting creative, talented and, often, highly specialized, bright people who appreciate the professional level, the freedom and the flexibility at Sartorius and who share our ambitions. It is precisely because of this strong team that I look confidently toward the future.
Which targets has Sartorius set for 2018 and beyond?
The growth prospects for our products are excellent in view of the great innovation dynamics in the biopharmaceutical sector, the high numbers of approvals for new biologics and the scientific progress, such as in cell and gene therapies. The market for replica products of biologics, so-called biosimilars, is making significant strides and is expected to lead to an increase in the quantities of biopharmaceuticals produced over the medium term and thus to an expansion of the market we are addressing.
Looking at our financial targets for the full year of 2018, we plan to increase consolidated sales revenue in constant currencies by about 9% to 12% and our underlying EBITDA margin by about half of a percentage point. Our capex ratio as part of our mid-range expansion plans is projected to be around 15%, at approximately the prior-year level, and thus over our long-term average.
I would like to congratulate our staff members on yet another successful year, despite facing a number of considerable challenges, and to thank them for their extraordinary commitment and important personal contribution they have made to the company's success. Dear shareholders, customers and business partners, I would like to express my appreciation to you for your trust, often extending back many years. We look forward to having you to continue with us on our road to further success as an innovative and highly profitable technology group.
Yours sincerely,
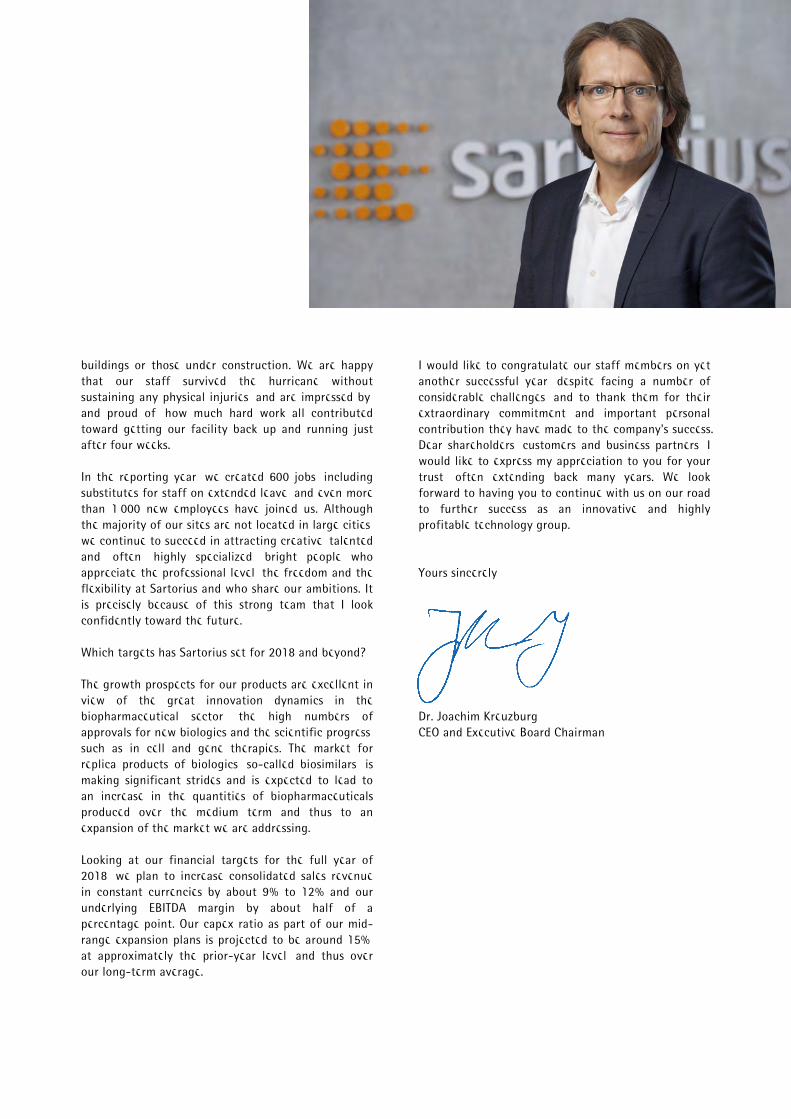
Dr. Joachim Kreuzburg CEO and Executive Board Chairman
Sartorius Group Executive Committee
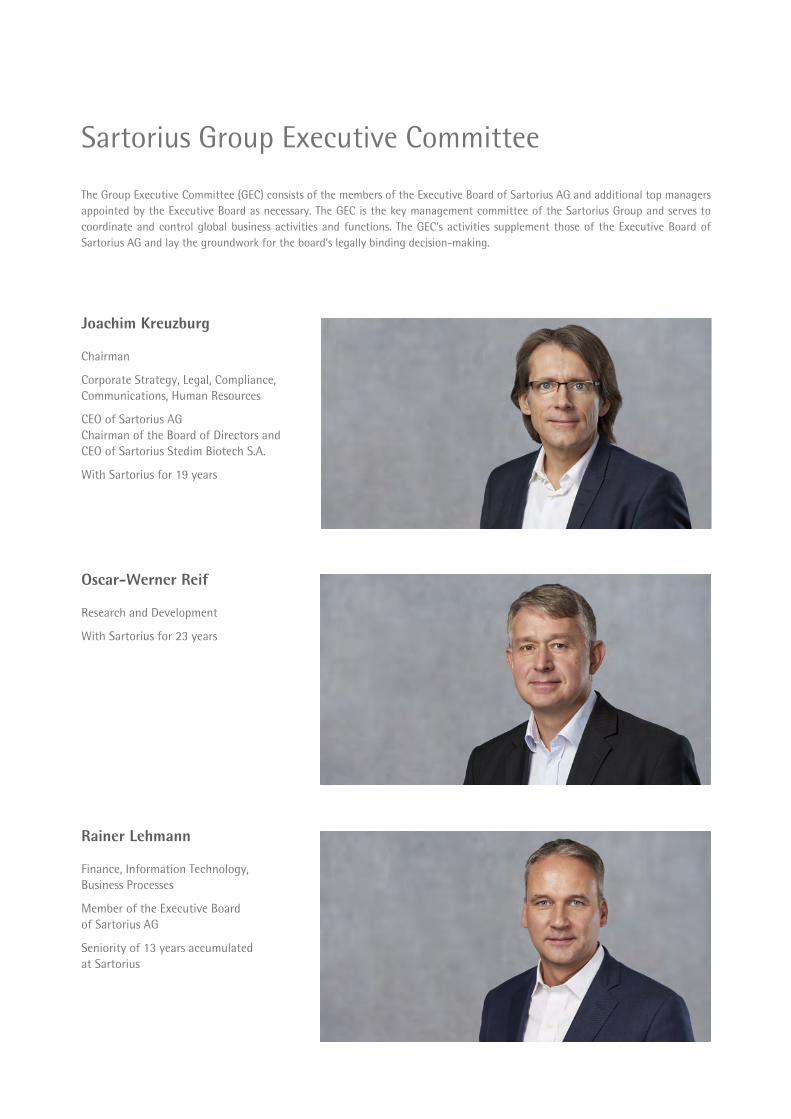
Oscar-Werner Reif
Research and Development
With Sartorius for 23 years
Joachim Kreuzburg
Chairman
Corporate Strategy, Legal, Compliance, Communications, Human Resources
CEO of Sartorius AGChairman of the Board of Directors and CEO of Sartorius Stedim Biotech S.A.
With Sartorius for 19 years
The Group Executive Committee (GEC) consists of the mem bers of the Executive Board of Sartorius AG and additional top managers appointed by the Executive Board as necessary. The GEC is the key management committee of the Sartorius Group and serves to coordinate and control global business activities and functions. The GEC’s activities supplement those of the Executive Board of Sartorius AG and lay the groundwork for the board’s legally binding decision-making.
Rainer Lehmann
Finance, Information Technology, Business Processes
Member of the Executive Board of Sartorius AG
Seniority of 13 years accumulated at Sartorius
e-GB2017-Konzern-Vorstand.indd 2 15.02.18 09:25
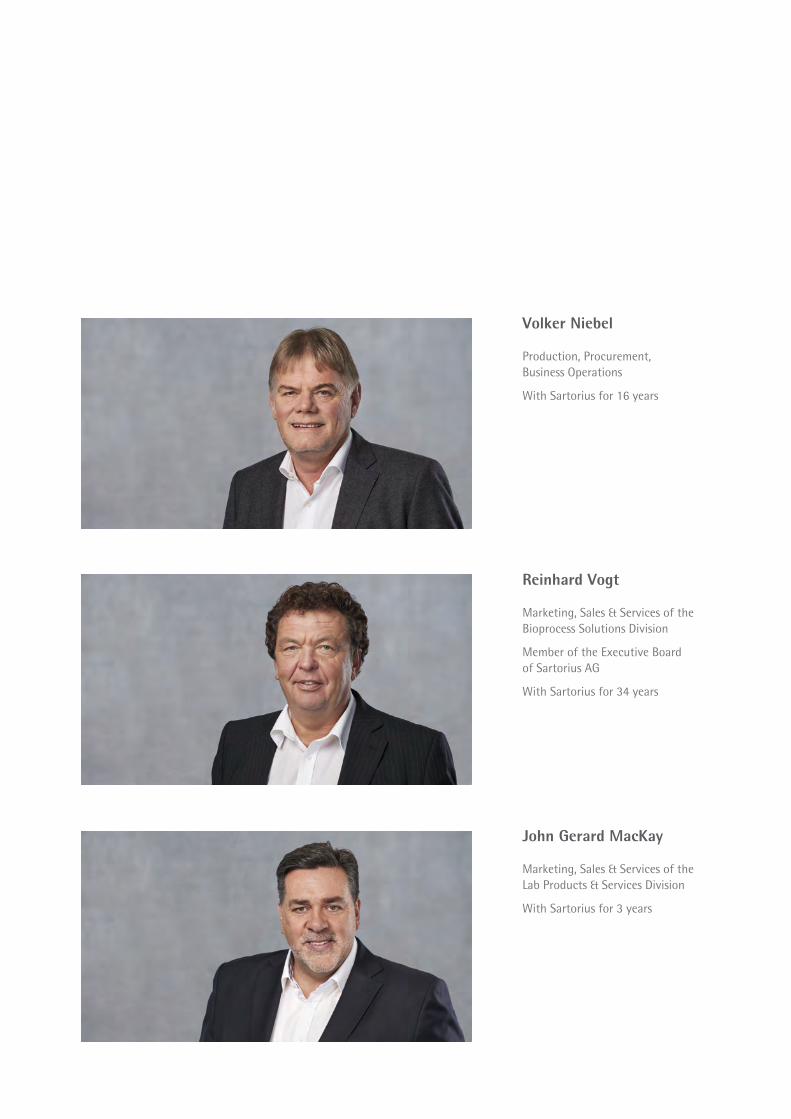
Reinhard Vogt
Marketing, Sales & Services of the Bioprocess Solutions Division
Member of the Executive Board of Sartorius AG
With Sartorius for 34 years
Volker Niebel
Production, Procurement, Business Operations
With Sartorius for 16 years
John Gerard MacKay
Marketing, Sales & Services of the Lab Products & Services Division
With Sartorius for 3 years
e-GB2017-Konzern-Vorstand.indd 3 15.02.18 09:26
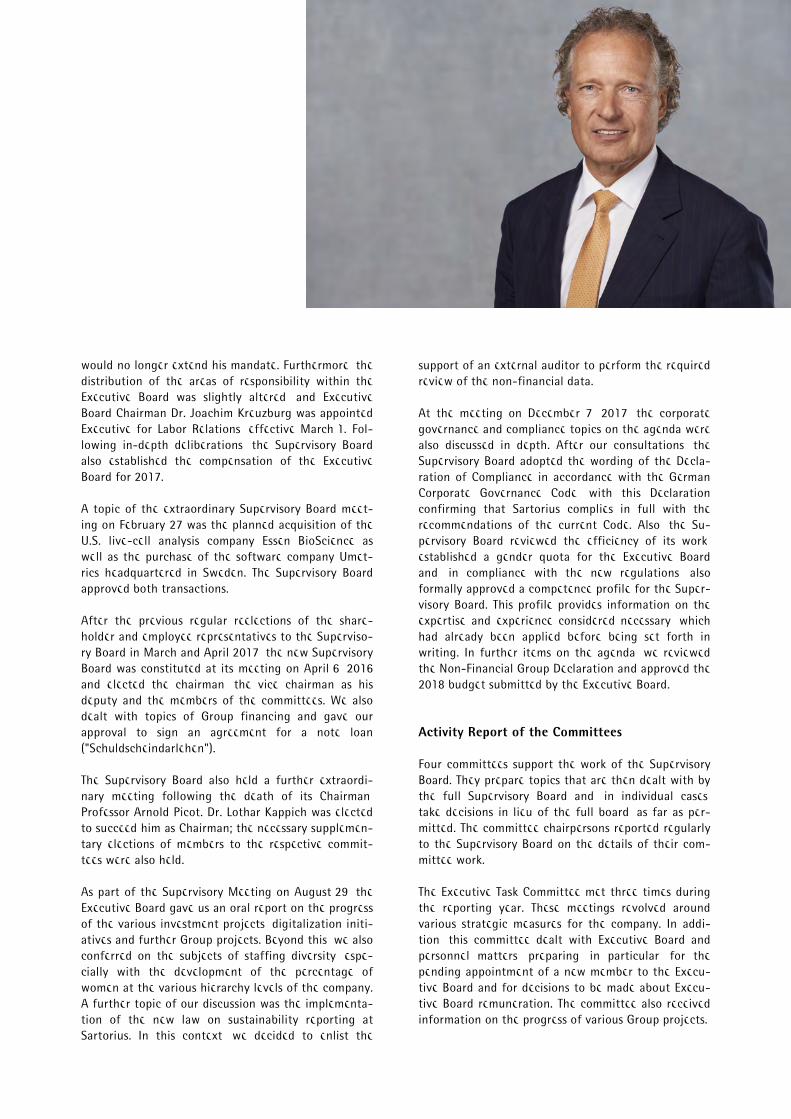
For the first time, I am reporting to you as Supervisory Board Chairman about the work of this board in 2017. The change in the office of Chairman had become necessary following the unexpected death of my pre-decessor, Professor Arnold Picot, Ph.D., in July 2017. Arnold Picot shaped the development of Sartorius throughout more than two decades and was a major driving force in propelling the transformation of the company into one of the most innovative global part-ners of the biopharmaceutical sector. It is a great honor and, at the same time, a great commitment for me to take up where Dr. Picot left off, both as admin-istrator of Horst Sartorius' estate and as Chairman of the Supervisory Board.
Again, we look back upon a highly successful fiscal year for Sartorius. The company impressively contin-ued its strategic realignment that it had begun in the prior year in the Lab Products & Services Division and strengthened this process by a further promising ac-quisition. The Bioprocess Solutions Division also saw robust development, with normalized growth follow-ing the two exceptionally strong years of growth in 2015 and 2016 and despite a few temporary, dampen-ing effects. This division's strategic positioning was likewise reinforced by a relatively small acquisition.
In fiscal 2017, the Supervisory Board intensively dealt with the situation and prospects of the company. We advised the Executive Board concerning corporate management and performed the tasks assigned by German corporate law and the company’s Articles of Association. The Executive Board kept us informed by providing regular, prompt and detailed reports, both written and verbal, about all relevant corporate plan-ning and strategic development issues, the progress of business in the divisions, the situation of the Group, including its risk situation, risk management and in-ternal control systems, and about compliance. All of the company's significant transactions were discussed in depth by the respective committee responsible, as well as by the full Supervisory Board, on the basis of the reports provided by the Executive Board. Following
thorough review of the Executive Board's reports and proposed resolutions, we voted on these to the extent that our vote was required.
Cooperation between the Supervisory Board and the Executive Board was always characterized by openness, constructive dialogue and trust.
Focus of the Supervisory Board’s Conferences
In the reporting year, the Supervisory Board convened at four ordinary meetings and three extraordinary conferences, which the Executive Board also attended, provided these meetings did not concern the latter board's matters. We regularly conferred on the devel-opment of sales revenue, earnings and employment for the Group; the financial situation of the company and of its affiliates; and on strategic projects.
The first extraordinary meeting of the Supervisory Board took place on January 30, 2017, which focused on the presentation and discussion of various acquisi-tion projects.
At our meeting on February 21, 2017, we fully re-viewed the annual and consolidated financial state-ments for fiscal 2016 and endorsed them based on the reports given by the Audit Committee and the inde-pendent auditors who were present during this item of the agenda. Moreover, we thoroughly discussed and approved the agenda, along with the proposed resolu-tions, for the 2017 Annual Shareholders' Meeting and the proposal for appropriation of the annual profit. In addition, the Executive Board gave us an oral report on the progress of negotiations for the acquisition projects. We also thoroughly dealt with staffing of the Executive Board and issues concerning remuneration of this board; both topics had been prepared by the Executive Task Committee. Effective March 1, 2017, the Supervisory Board appointed Rainer Lehmann to succeed Executive Board member Jörg Pfirrmann, who had already announced at the end of 2016 that he
Report of the Supervisory Board
Dear Shareholders and Business Partners,
would no longer extend his mandate. Furthermore, the distribution of the areas of responsibility within the Executive Board was slightly altered, and Executive Board Chairman Dr. Joachim Kreuzburg was appointed Executive for Labor Relations, effective March 1. Fol-lowing in-depth deliberations, the Supervisory Board also established the compensation of the Executive Board for 2017.
A topic of the extraordinary Supervisory Board meet-ing on February 27 was the planned acquisition of the U.S. live-cell analysis company Essen BioScience as well as the purchase of the software company Umet-rics headquartered in Sweden. The Supervisory Board approved both transactions.
After the previous regular reelections of the share-holder and employee representatives to the Superviso-ry Board in March and April 2017, the new Supervisory Board was constituted at its meeting on April 6, 2016 and elected the chairman, the vice chairman as his deputy and the members of the committees. We also dealt with topics of Group financing and gave our approval to sign an agreement for a note loan ("Schuldscheindarlehen").
The Supervisory Board also held a further extraordi-nary meeting following the death of its Chairman, Professor Arnold Picot. Dr. Lothar Kappich was elected to succeed him as Chairman; the necessary supplemen-tary elections of members to the respective commit-tees were also held.
As part of the Supervisory Meeting on August 29, the Executive Board gave us an oral report on the progress of the various investment projects, digitalization initi-atives and further Group projects. Beyond this, we also conferred on the subjects of staffing diversity, espe-cially with the development of the percentage of women at the various hierarchy levels of the company. A further topic of our discussion was the implementa-tion of the new law on sustainability reporting at Sartorius. In this context, we decided to enlist the
support of an external auditor to perform the required review of the non-financial data.
At the meeting on December 7, 2017, the corporate governance and compliance topics on the agenda were also discussed in depth. After our consultations, the Supervisory Board adopted the wording of the Decla-ration of Compliance in accordance with the German Corporate Governance Code, with this Declaration confirming that Sartorius complies in full with the recommendations of the current Code. Also, the Su-pervisory Board reviewed the efficiency of its work, established a gender quota for the Executive Board and, in compliance with the new regulations, also formally approved a competence profile for the Super-visory Board. This profile provides information on the expertise and experience considered necessary, which had already been applied before being set forth in writing. In further items on the agenda, we reviewed the Non-Financial Group Declaration and approved the 2018 budget submitted by the Executive Board.
Activity Report of the Committees
Four committees support the work of the Supervisory Board. They prepare topics that are then dealt with by the full Supervisory Board and, in individual cases, take decisions in lieu of the full board, as far as per-mitted. The committee chairpersons reported regularly to the Supervisory Board on the details of their com-mittee work.
The Executive Task Committee met three times during the reporting year. These meetings revolved around various strategic measures for the company. In addi-tion, this committee dealt with Executive Board and personnel matters, preparing, in particular, for the pending appointment of a new member to the Execu-tive Board and for decisions to be made about Execu-tive Board remuneration. The committee also received information on the progress of various Group projects.
Furthermore, the Executive Task Committee thorough-ly considered succession planning for top managers, as well as amendments to the Corporate Governance Code, to prepare resolution proposals to be approved by the full Supervisory Board.
In the year under review, the Audit Committee held four meetings. The committee prepared for the full Supervisory Board's conference on endorsement and approval of the consolidated annual financial state-ments for fiscal 2016 and discussed the quarterly and first-half financial reports of 2017. A further focus was on monitoring the effectiveness of in-house au-diting and the Group-wide risk management and in-ternal control system, as well as on measures for further improvement of compliance. The committee also conferred on the subjects of Group financing.
Beyond these items, the committee reviewed the In-ternal Auditing department report, which did not indicate any material discrepancies in business trans-actions, and also considered the department's plans for the upcoming months. With respect to the audit of the annual financial statements for fiscal 2017, the com-mittee confirmed the independence of the auditors and deliberated in detail on selecting auditors to rec-ommend at the Annual Shareholders' Meeting for appointment and commissioning to perform an audit review, as well as on defining and monitoring the audit procedure and the focal points of the audit.
The Nomination Committee that draws up election proposals to be submitted to the Annual Shareholders' Meeting for shareholder representatives on the Super-visory Board met four times in the year under review. With respect to the required appointment to succeed Professor Arnold Picot who had passed away, the committee prepared a corresponding proposal for an appointment by the court.
Audit of the Annual and Consolidated Financial Statements; Review of the Non-Financial Group Declaration
The annual and consolidated financial statements prepared by the Executive Board for fiscal 2017 and the management report of Sartorius AG were reviewed by the independent auditing company KPMG Wirtschaftsprüfungsgesellschaft based in Hanover, Germany. This company had been commissioned by the Audit Committee of the Supervisory Board pursuant to the resolution passed at the Annual Shareholders’ Meeting on April 6, 2017. The independent auditors issued an unqualified audit certificate.
They attended the Audit Committee meeting on Febru-ary 19, 2018, and the Supervisory Board Meeting on February 20, 2018, and reported on the essential re-sults of their audits. Sufficient time was allotted for discussion of all issues with the auditors. Written in-formation and audit reports had been sent to all Su-pervisory Board members on time and were discussed in detail during the meetings mentioned. On the basis of its own examination of the annual Sartorius AG and consolidated financial statements, the Sartorius AG management report and the Group management re-port, the Supervisory Board concurred with the results of the audit conducted by KPMG and, at the meeting on February 20, 2018, endorsed the financial state-ments of Sartorius AG and the Group on recommenda-tion by the Audit Committee. The annual financial statements were thus approved. The Supervisory Board and the Executive Board will submit a proposal at the Annual Shareholders’ Meeting on April 5, 2018, to pay dividends of €0.50 per preference share and €0.51 per ordinary share from the retained profit to shareholders.
Moreover, due to the German Transparency Directive Implementation Act (European CSR Directive requiring implementation) in the reporting year, the Executive Board extended the combined Group Management Report to include a Non-Financial Group Declaration for the first time. This Declaration was voluntarily
submitted as a limited assurance engagement to a full content review by the independent auditing company KPMG AG Wirtschaftsprüfungsgesellschaft. Based on this review, KPMG issued an unqualified opinion. The auditing company attended the Supervisory Board meeting on February 20 and reported on the results of the audit review. Following intensive discussions and examination, the non-financial Group report was en-dorsed by the Supervisory Board members. Composi-tion of the Supervisory Board and the Executive Board.
Composition of the Supervisory Board and the Executive Board
In fiscal 2017, regular new elections of the shareowner and employee representatives to the Supervisory Board were held. Representing the shareholders, Dr. Dirk Basting and Professor Gerd Krieger, Ph.D., retired from the Supervisory Board at the end of the Annual Gen-eral Shareholders' Meeting on April 6, 2017, on the grounds of age. We would like to thank Dr. Basting and Professor Krieger for their many years of dedicat-ed service on this board. We gained the services of Ms. Hildegard Panzer and Dr. Daniela Favoccia as their successors, who took up their new posts at the Super-visory Board meeting on April 6. The other shareholder representatives as well as all employee representatives were reelected. Furthermore, after Professor Picot had passed away, Dr. Guido Oelkers was appointed a mem-ber of the Supervisory Board by the court, effective November 6.
Regarding the Executive Board, Jörg Pfirrmann re-signed from office on the best of terms and by mutual agreement as of February 28, 2017. At its meeting on February 21, 2017, the Supervisory Board appointed Rainer Lehmann as his successor to the Executive Board, who took office effective March 1, 2017. In addition, Executive Board Chairman Dr. Joachim Kreuzburg was appointed the Executive for Labor Relations as of March 1.
The Supervisory Board would like to thank the Execu-tive Board and all employees across the globe for their great commitment and successful hard work through-out the fiscal year ended. In addition, the Supervisory Board expresses its appreciation to its shareholders for the confidence they have shown yet again in the company.
Hamburg, February 2018
For the Supervisory Board
Dr. Lothar Kappich
Chairman
16 To Our Shareholders Sartorius Shares
Global Stock Markets Reach Record Heights
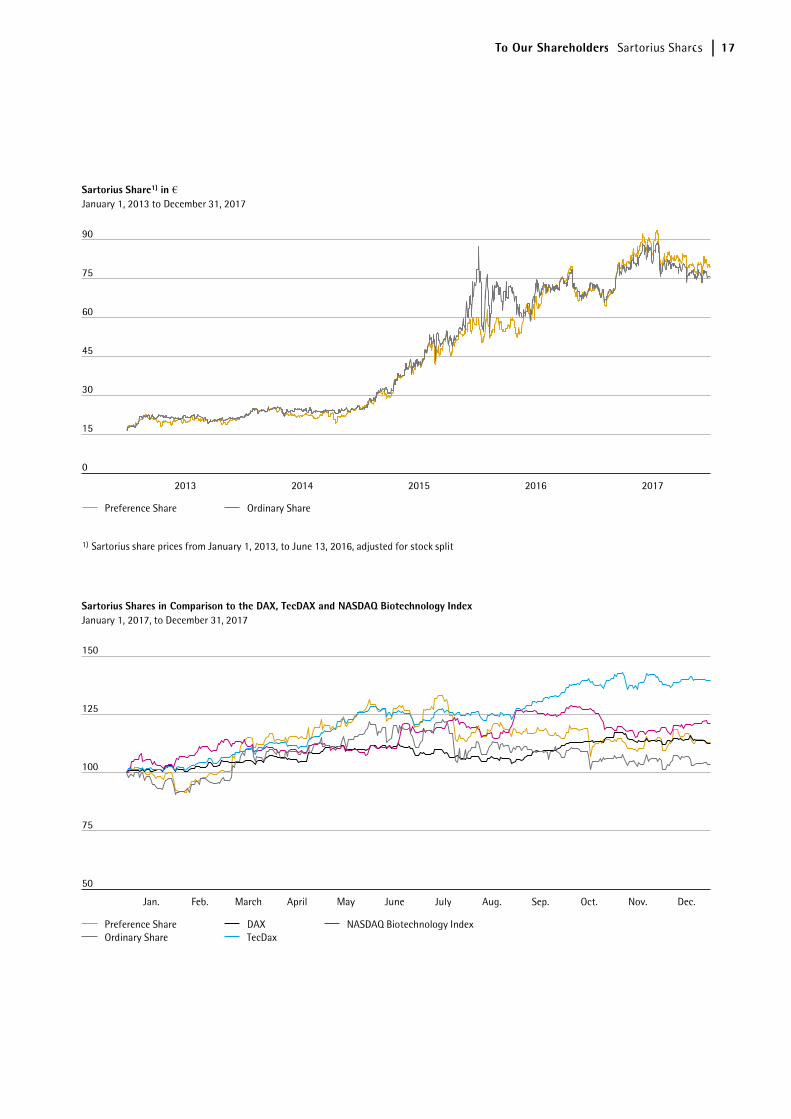
Almost without exception, the world’s stock markets chalked up substantial price increases during the re-porting year against a backdrop of good global eco-nomic data and the continuation of expansive fiscal policy on the part of the the most important central banks. New highs on the U.S. stock market drove the leading German stock index DAX to reach a record high in early November at 13,505 points, and end the year at 12,917 points – a plus of 12.5%. The German technology index TecDAX, to which the Sartorius pref-erence shares also belong, bounced back from its 2016 decline to chart a significant gain of 39.6% in 2017, and the industry-specific index NASDAQ Biotechnolo-gy registered a plus of 21.1% following significantly above-average development the years before.
Sartorius Share Price Continues Positive Development
The prices of both classes of Sartorius AG shares de-veloped positively during the reporting year, even if the above-average value growth of the years before was not achieved completely. The price of the prefer-ence shares rose year on year by 12.8% to €79.5, and ordinary shares gained in value as well. Shares ended trading on December 29, 2017, at €75.4 and thus 3.6% higher than their closing price the year before.
At the end of the reporting year, the position of the Sartorius preference share in the TecDAX was about the same as the year before. In terms of market capi-talization, the preference share was ranked 8th at the end of 2017 compared with 7th the previous year. With respect to trading volume – that is, the volume traded on the Frankfurt Stock Exchange over the pre-ceding twelve months – the company’s share certifi-cates took 14th place (previous year: 12th).
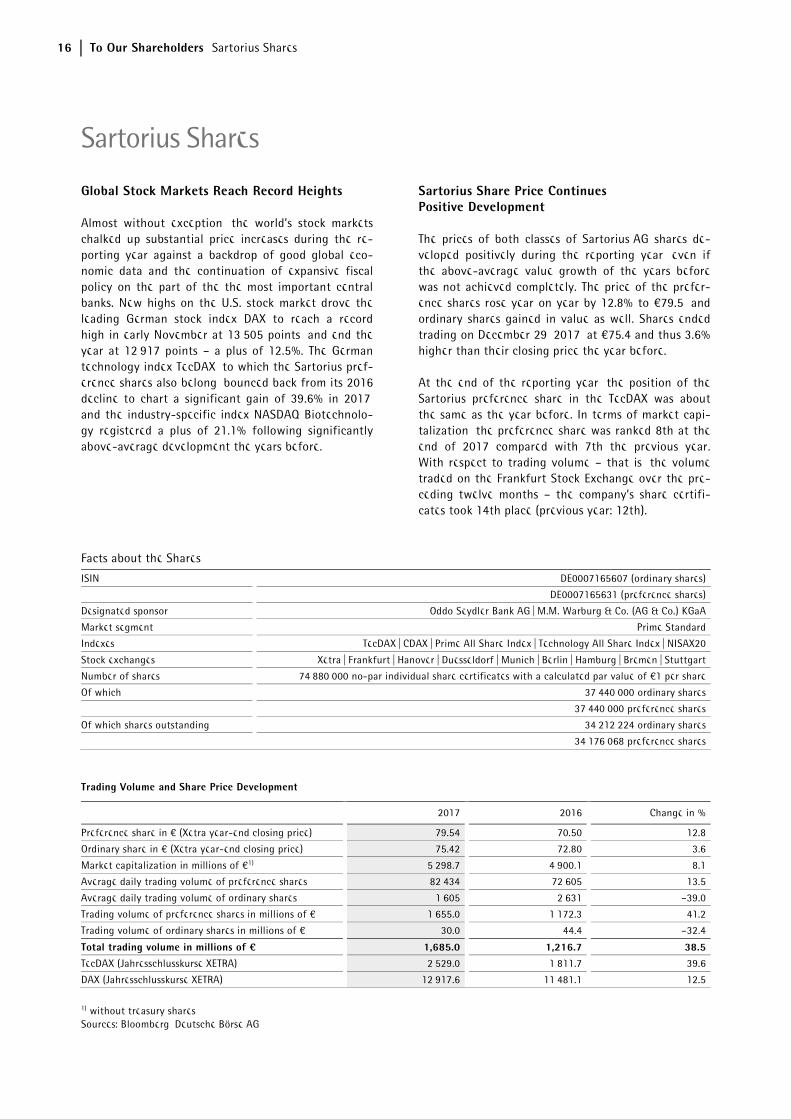
Facts about the Shares
ISIN DE0007165607 (ordinary shares)
DE0007165631 (preference shares)
Designated sponsor Oddo Seydler Bank AG | M.M. Warburg & Co. (AG & Co.) KGaA
Market segment Prime Standard
Indexes TecDAX | CDAX | Prime All Share Index | Technology All Share Index | NISAX20
Stock exchanges Xetra | Frankfurt | Hanover | Duesseldorf | Munich | Berlin | Hamburg | Bremen | Stuttgart
Number of shares 74,880,000 no-par individual share certificates with a calculated par value of €1 per share
Of which 37,440,000 ordinary shares
37,440,000 preference shares
Of which shares outstanding 34,212,224 ordinary shares
34,176,068 preference shares
Trading Volume and Share Price Development
2017 2016 Change in %
Preference share in € (Xetra year-end closing price) 79.54 70.50 12.8
Ordinary share in € (Xetra year-end closing price) 75.42 72.80 3.6
Market capitalization in millions of €1) 5,298.7 4,900.1 8.1
Average daily trading volume of preference shares 82,434 72,605 13.5
Average daily trading volume of ordinary shares 1,605 2,631 –39.0
Trading volume of preference shares in millions of € 1,655.0 1,172.3 41.2
Trading volume of ordinary shares in millions of € 30.0 44.4 –32.4
Total trading volume in millions of ¤ 1,685.0 1,216.7 38.5TecDAX (Jahresschlusskurse XETRA) 2,529.0 1,811.7 39.6
DAX (Jahresschlusskurse XETRA) 12,917.6 11,481.1 12.5
1) without treasury shares Sources: Bloomberg, Deutsche Börse AG
Sartorius Shares
To Our Shareholders Sartorius Shares 17
18 To Our Shareholders Sartorius Shares
Market Capitalization and Trading Volume
The market capitalization of the Sartorius ordinary and preference shares rose by around 8.1% in the reporting year and stood at €5.3 billion as of December 31, 2017, up from €4.9 billion in 2016.
The average number of preference shares traded daily on the Frankfurt Stock Exchange (Xetra and trading floor) increased substantially during the year under review from 72,605 to 82,434 shares. Trading volume in euros rose even more strongly in the reporting year, reaching €1.7 billion, up from €1.2 billion a year earlier.
Due to the low free float of Sartorius’ ordinary shares, they are traded only to a limited extent. Thus, the average number of ordinary shares traded daily was 1,605 compared with 2,631 the previous year. The corresponding trading volume was around €30 million (previous year: €44 million).
The 2016 figures of the average number of Sartorius shares traded daily were adjusted in accordance with the stock split.
Investor Relations
Sartorius investor relations activities follow the objec-tive of making the current and future development of the company transparent for its stakeholders. To achieve this objective, Sartorius maintains an ongoing, open dialog with shareholders, potential investors and financial analysts.
Besides providing quarterly, first-half and annual reports, we inform the capital market and the inter-ested public at quarterly teleconferences and in regu-larly published press releases about the current development of our business and other material events at the company. Moreover, our management team was available to capital market participants at our sites in Göttingen, Germany, and in Aubagne, France, and took part regularly in conferences and roadshows conduct-ed in international financial market centers, such as London, Paris, Frankfurt am Main and New York. Dur-ing the reporting year, our communication focused on the extension of our portfolio through acquisitions, the implementation of our Group and division strate-gies and general industry developments. In Novem-ber 2017, Sartorius received the Investors’ Darling prize, which is awarded yearly by Manager Magazin in conjunction with the HHL Leipzig Graduate School of Management.
All information and publications about our company and its shares are available on our website at www.sartorius.com.
Analysts
The assessments and recommendations of financial analysts serve as an important foundation for the decisions of private and institutional investors when acquiring shares. During the reporting year, we main-tained an ongoing dialog with a total of eighteen institutions.
Research Coverage
Date InstitutePrice target
in €Recommend
ation
Feb. 01, 2018 Metzler 110.00 Buy
Feb. 01, 2018 ODDO BHF 81.00 Sell
Jan. 31, 2018 Deutsche Bank 90.00 Hold
Jan. 31, 2018 Janney 100.00 Hold
Jan. 31, 2018 Kepler Cheuvreux 78.00 Hold
Jan. 31, 2018 Mainfirst 110.00 Buy
Jan. 31, 2018 M.M. Warburg 90.00 Buy
Jan. 31, 2018 Equita 79.00 Hold
Jan. 31, 2018 Berenberg 85.00 Buy
Oct. 26, 2017 Hauck & Aufhäuser 60.00 Sell
Oct. 26, 2017 HSBC 78.00 Hold
Oct. 25, 2017 UBS 85.00 Hold
Oct. 25, 2017 Nord LB 70.00 Sell
Oct. 18, 2017 Commerzbank 76.00 Hold
Oct. 17, 2017 DZ Bank 59.00 Sell
Oct. 17, 2017 LBBW 88.00 Buy
Aug. 10, 2017 AlphaValue 77.70 Sell
Feb. 01, 2017 EQUI.TS 68.00 Hold
To Our Shareholders Sartorius Shares 19
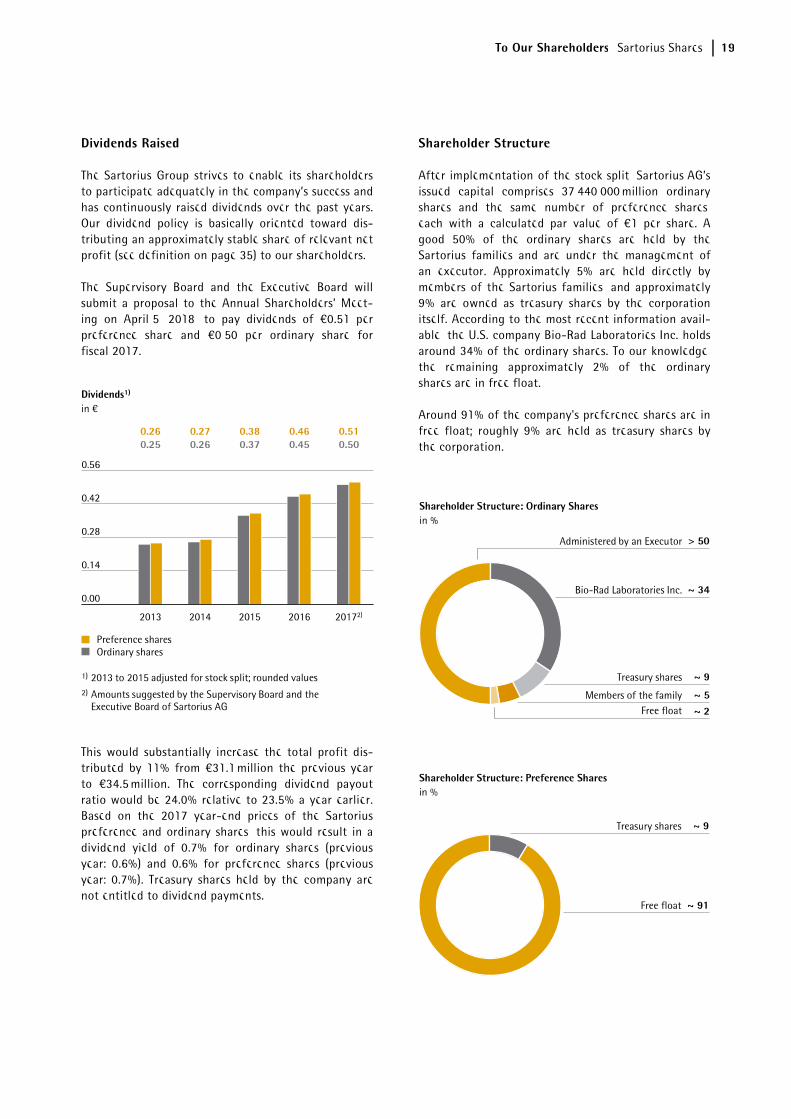
Dividends Raised
The Sartorius Group strives to enable its shareholders to participate adequately in the company’s success and has continuously raised dividends over the past years. Our dividend policy is basically oriented toward dis-tributing an approximately stable share of relevant net profit (see definition on page 35) to our shareholders.
The Supervisory Board and the Executive Board will submit a proposal to the Annual Shareholders’ Meet-ing on April 5, 2018, to pay dividends of €0.51 per preference share and €0,50 per ordinary share for fiscal 2017.
This would substantially increase the total profit dis-tributed by 11% from €31.1 million the previous year to €34.5 million. The corresponding dividend payout ratio would be 24.0% relative to 23.5% a year earlier. Based on the 2017 year-end prices of the Sartorius preference and ordinary shares, this would result in a dividend yield of 0.7% for ordinary shares (previous year: 0.6%) and 0.6% for preference shares (previous year: 0.7%). Treasury shares held by the company are not entitled to dividend payments.
Shareholder Structure
After implementation of the stock split, Sartorius AG’s issued capital comprises 37,440,000 million ordinary shares and the same number of preference shares, each with a calculated par value of €1 per share. A good 50% of the ordinary shares are held by the Sartorius families and are under the management of an executor. Approximately 5% are held directly by members of the Sartorius families, and approximately 9% are owned as treasury shares by the corporation itself. According to the most recent information avail-able, the U.S. company Bio-Rad Laboratories Inc. holds around 34% of the ordinary shares. To our knowledge, the remaining approximately 2% of the ordinary shares are in free float.
Around 91% of the company's preference shares are in free float; roughly 9% are held as treasury shares by the corporation.
20 To Our Shareholders Sartorius Shares
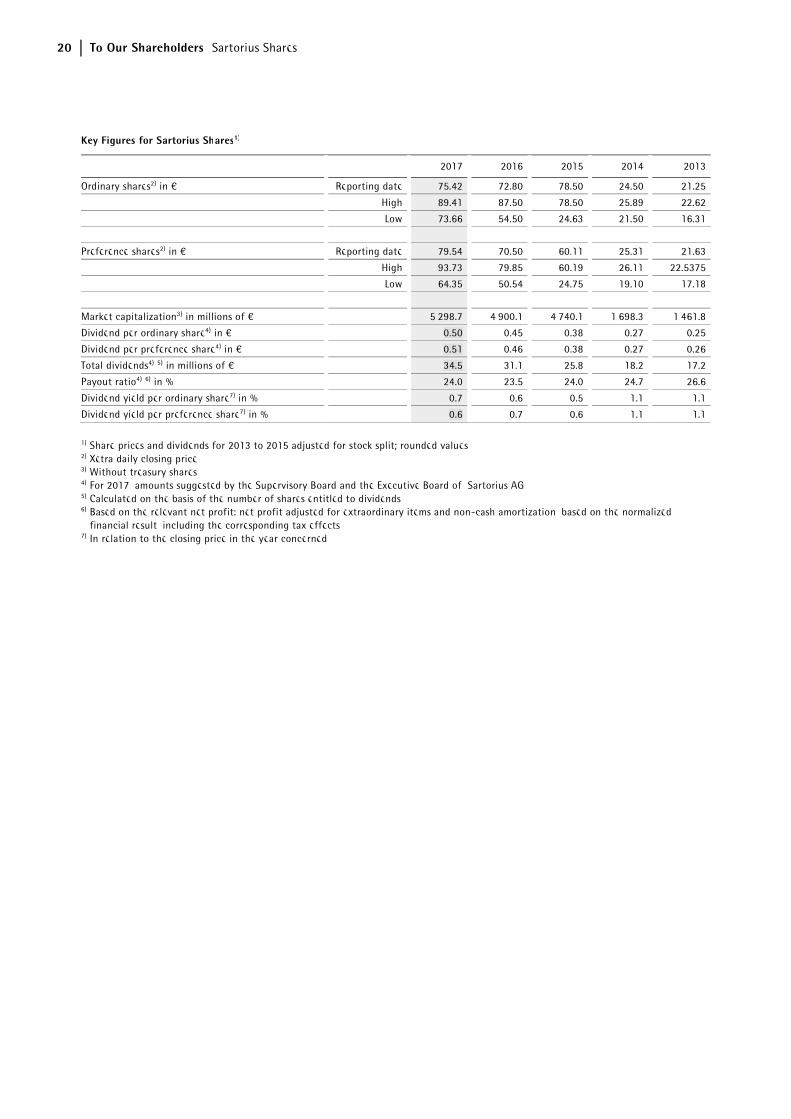
Key Figures for Sartorius Shares1)
2017 2016 2015 2014 2013
Ordinary shares2) in € Reporting date 75.42 72.80 78.50 24.50 21.25
High 89.41 87.50 78.50 25.89 22.62
Low 73.66 54.50 24.63 21.50 16.31
Preference shares2) in € Reporting date 79.54 70.50 60.11 25.31 21.63
High 93.73 79.85 60.19 26.11 22.5375
Low 64.35 50.54 24.75 19.10 17.18
Market capitalization3) in millions of € 5,298.7 4,900.1 4,740.1 1,698.3 1,461.8
Dividend per ordinary share4) in € 0.50 0.45 0.38 0.27 0.25
Dividend per preference share4) in € 0.51 0.46 0.38 0.27 0.26
Total dividends4) 5) in millions of € 34.5 31.1 25.8 18.2 17.2
Payout ratio4) 6) in % 24.0 23.5 24.0 24.7 26.6
Dividend yield per ordinary share7) in % 0.7 0.6 0.5 1.1 1.1
Dividend yield per preference share7) in % 0.6 0.7 0.6 1.1 1.1
1) Share prices and dividends for 2013 to 2015 adjusted for stock split; rounded values 2) Xetra daily closing price 3) Without treasury shares 4) For 2017, amounts suggested by the Supervisory Board and the Executive Board of Sartorius AG 5) Calculated on the basis of the number of shares entitled to dividends 6) Based on the relevant net profit: net profit adjusted for extraordinary items and non-cash amortization, based on the normalized
financial result, including the corresponding tax effects 7) In relation to the closing price in the year concerned
Combined Group Management Report
Konzern_Trennseiten.indd 15 05.03.15 10:28
22 Group Management Report Structure and Management of the Group
Group Legal Structure
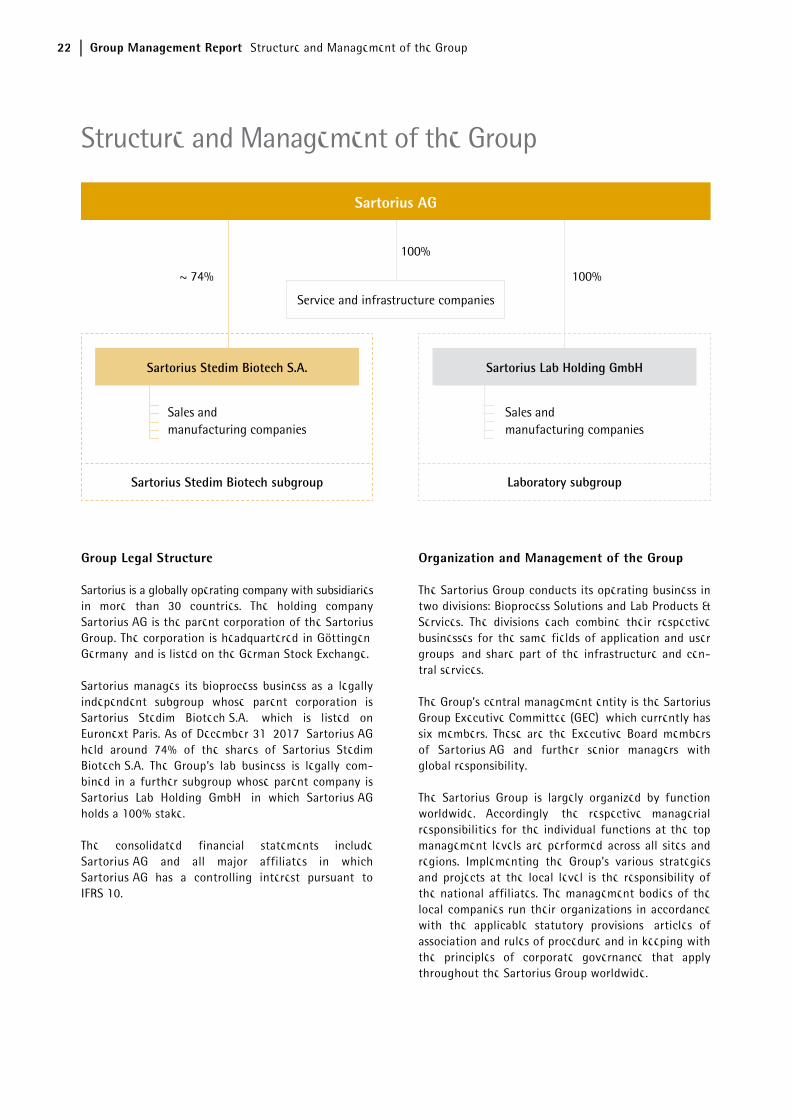
Sartorius is a globally operating company with subsidiaries in more than 30 countries. The holding company Sartorius AG is the parent corporation of the Sartorius Group. The corporation is headquartered in Göttingen, Germany, and is listed on the German Stock Exchange.
Sartorius manages its bioprocess business as a legally independent subgroup whose parent corporation is Sartorius Stedim Biotech S.A., which is listed on Euronext Paris. As of December 31, 2017, Sartorius AG held around 74% of the shares of Sartorius Stedim Biotech S.A. The Group’s lab business is legally com-bined in a further subgroup whose parent company is Sartorius Lab Holding GmbH, in which Sartorius AG holds a 100% stake.
The consolidated financial statements include Sartorius AG and all major affiliates in which Sartorius AG has a controlling interest pursuant to IFRS 10.
Organization and Management of the Group
The Sartorius Group conducts its operating business in two divisions: Bioprocess Solutions and Lab Products & Services. The divisions each combine their respective businesses for the same fields of application and user groups, and share part of the infrastructure and cen-tral services.
The Group’s central management entity is the Sartorius Group Executive Committee (GEC), which currently has six members. These are the Executive Board members of Sartorius AG and further senior managers with global responsibility.
The Sartorius Group is largely organized by function worldwide. Accordingly, the respective managerial responsibilities for the individual functions at the top management levels are performed across all sites and regions. Implementing the Group’s various strategies and projects at the local level is the responsibility of the national affiliates. The management bodies of the local companies run their organizations in accordance with the applicable statutory provisions, articles of association and rules of procedure and in keeping with the principles of corporate governance that apply throughout the Sartorius Group worldwide.
Structure and Management of the Group
Sartorius Stedim Biotech S.A. Sartorius Lab Holding GmbH
Service and infrastructure companies
Sartorius Stedim Biotech subgroup Laboratory subgroup
Sales and manufacturing companies
Sales and manufacturing companies
~ 74% 100%
Sartorius AG
100%
Group Management Report Structure and Management of the Group 23
Changes in the Group Portfolio
In the reporting year, Sartorius acquired three companies.
The portfolio of the Lab Products & Services Division was expanded in the area of bioanalytics in March 2017 by the acquisition of Essen BioScience Inc. Head-quartered in Ann Arbor, Michigan, USA, this company develops and markets innovative real-time live-cell imaging and analysis systems for drug research.
Sartorius through its subgroup Sartorius Stedim Bio-tech additionally acquired MKS Instruments AB (Umet-rics) based in Umeå, Sweden. This company, a leading specialist in data analytics software for modeling and optimizing biopharmaceutical development and manu-facturing processes, had already been cooperating with Sartorius for around five years before the take-over. Umetrics was initially consolidated upon comple-tion of the acquisition in April 2017.
Financial Controlling and Key Performance Indicators
The Sartorius Group is managed using a number of key performance indicators, which are also decisive for the determination of the variable remuneration compo-nent for the Executive Board and managers.
A key management parameter that Sartorius uses to measure the development of its size is currency-adjusted growth of sales revenue. The key profitability measure is EBITDA adjusted for extraordinary items, i.e. underlying EBITDA, and the corresponding margin.
Regarding the debt financing potential of the Sartorius Group, the key indicator is the ratio of net debt to underlying EBITDA for the last twelve months. Furthermore, the capex ratio, i.e., capital expenditures in proportion to sales revenue, represents a key control parameter.
In addition, the following financial and non-financial indicators are reported on a regular basis:
– Order intake – Relevant net profit | Earnings per share – Annual net profit | Earnings per share – Equity ratio – Net working capital – Net cash flow from operating activities – Number of employees
As a rule, the annual financial forecast that is pub-lished at the beginning of a fiscal year for the Group and the divisions refers to the development of sales revenue and of the underlying EBITDA margin. The expected capex ratio, as well as a directional forecast for the ratio of net debt to underlying EBITDA, is addi-tionally indicated for the Group.
24 Group Management Report Strategy and Goals
The Sartorius Group is a leading international supplier of products and services covering a range from re-search and development to safe and efficient produc-tion of medications and vaccines using biotech methods.
Sartorius is increasingly focusing on the attractive biopharma market that is characterized by long-term and stable trends. For years, the global pharmaceutical market has been showing positive development pri-marily driven by the so-called pharmerging markets such as China, India and Russia in which access to medications was fueled by the expansion of national healthcare as well as higher private-sector spending. Additional significant trends are the demographic development in the Western industrialized countries and increasing life expectancy, which entail a greater need for medications.
The market for biotechnologically produced medica-tions and vaccines has been expanding overpropor-tionately for many years within the growing pharmaceutical market as a result of the introduction of new biopharmaceuticals and their further market penetration, among others. Biosimilars, or biological medications highly similar to already approved refer-ence medicines, are considered factors for continued positive development in the future.
As part of its strategy as a total solutions provider, Sartorius has built up a broad and innovative portfolio of products and technologies across the entire value-added chain of its biopharmaceutical customers, both through the company's proprietary research and ac-quisitions. With this range, Sartorius aims to make complex, lengthy and expensive development of bio-pharmaceuticals and their production more efficient and less expensive for its customers. Moreover, Sartorius addresses the needs of laboratories of public research, defined as "academia."
The Sartorius Group conducts its operating business in two divisions: Bioprocess Solutions and Lab Products & Services. The divisions' market positioning and strategy are outlined as follows:
Strategy and Goals
Group Management Report Strategy and Goals 25
Bioprocess Solutions
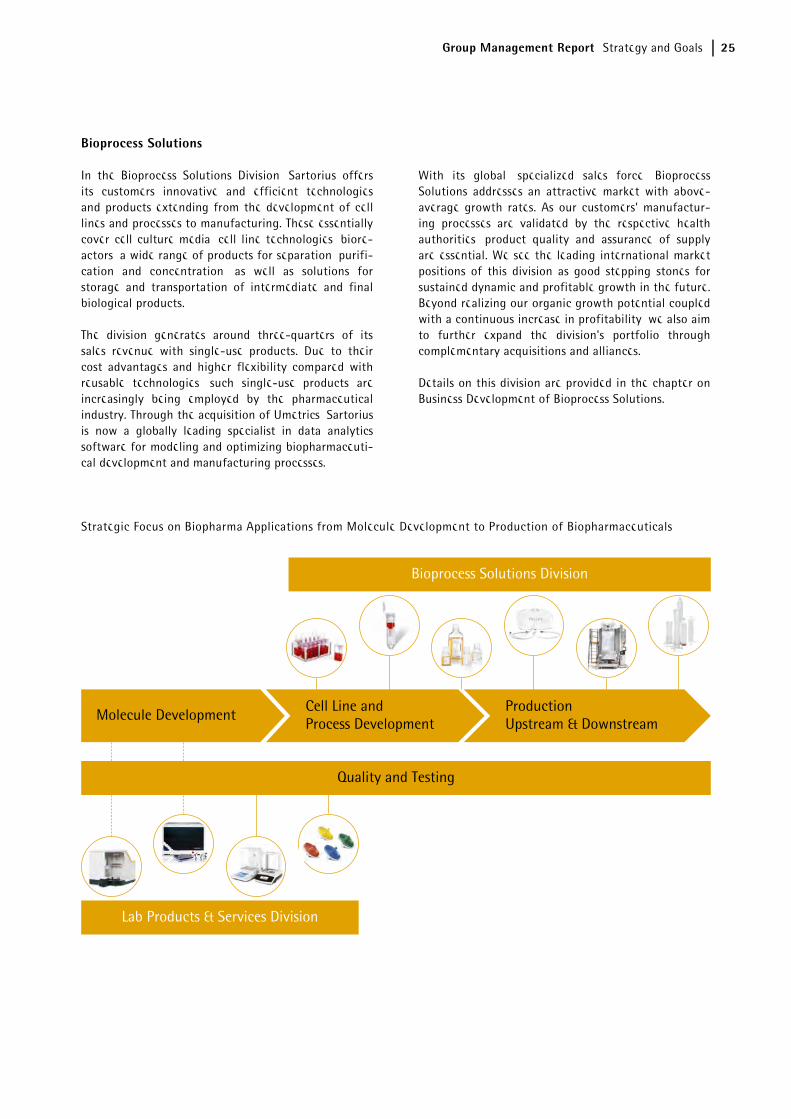
In the Bioprocess Solutions Division, Sartorius offers its customers innovative and efficient technologies and products extending from the development of cell lines and processes to manufacturing. These essentially cover cell culture media, cell line technologies, biore-actors, a wide range of products for separation, purifi-cation and concentration, as well as solutions for storage and transportation of intermediate and final biological products.
The division generates around three-quarters of its sales revenue with single-use products. Due to their cost advantages and higher flexibility compared with reusable technologies, such single-use products are increasingly being employed by the pharmaceutical industry. Through the acquisition of Umetrics, Sartorius is now a globally leading specialist in data analytics software for modeling and optimizing biopharmaceuti-cal development and manufacturing processes.
With its global, specialized sales force, Bioprocess Solutions addresses an attractive market with above-average growth rates. As our customers' manufactur-ing processes are validated by the respective health authorities, product quality and assurance of supply are essential. We see the leading international market positions of this division as good stepping stones for sustained dynamic and profitable growth in the future. Beyond realizing our organic growth potential coupled with a continuous increase in profitability, we also aim to further expand the division's portfolio through complementary acquisitions and alliances.
Details on this division are provided in the chapter on Business Development of Bioprocess Solutions.
Strategic Focus on Biopharma Applications from Molecule Development to Production of Biopharmaceuticals
Bioprocess Solutions Division
Lab Products & Services Division
Quality and Testing
Molecule DevelopmentCell Line and Process Development
Production Upstream & Downstream
26 Group Management Report Strategy and Goals
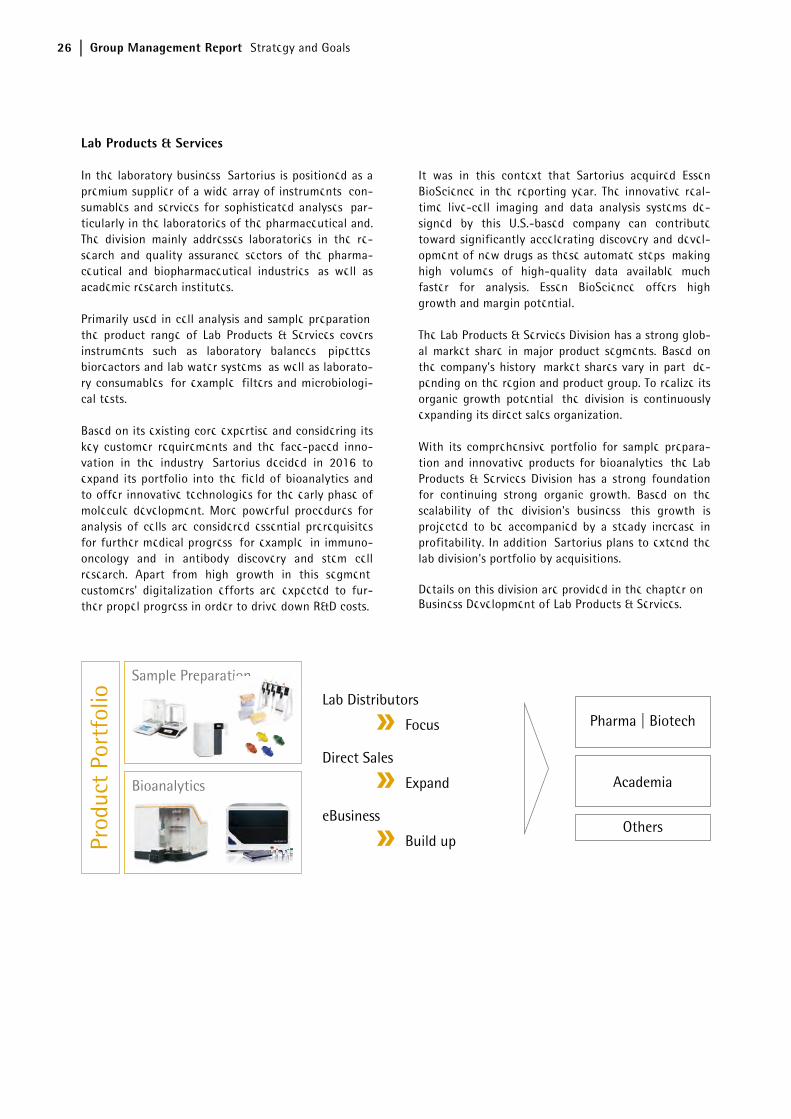
Lab Products & Services
In the laboratory business, Sartorius is positioned as a premium supplier of a wide array of instruments, con-sumables and services for sophisticated analyses, par-ticularly in the laboratories of the pharmaceutical and. The division mainly addresses laboratories in the re-search and quality assurance sectors of the pharma-ceutical and biopharmaceutical industries, as well as academic research institutes.
Primarily used in cell analysis and sample preparation, the product range of Lab Products & Services covers instruments such as laboratory balances, pipettes, bioreactors and lab water systems, as well as laborato-ry consumables, for example, filters and microbiologi-cal tests.
Based on its existing core expertise and considering its key customer requirements and the face-paced inno-vation in the industry, Sartorius decided in 2016 to expand its portfolio into the field of bioanalytics and to offer innovative technologies for the early phase of molecule development. More powerful procedures for analysis of cells are considered essential prerequisites for further medical progress, for example, in immuno-oncology and in antibody discovery and stem cell research. Apart from high growth in this segment, customers' digitalization efforts are expected to fur-ther propel progress in order to drive down R&D costs.
It was in this context that Sartorius acquired Essen BioScience in the reporting year. The innovative real-time live-cell imaging and data analysis systems de-signed by this U.S.-based company can contribute toward significantly accelerating discovery and devel-opment of new drugs as these automate steps, making high volumes of high-quality data available much faster for analysis. Essen BioScience offers high growth and margin potential.
The Lab Products & Services Division has a strong glob-al market share in major product segments. Based on the company's history, market shares vary in part, de-pending on the region and product group. To realize its organic growth potential, the division is continuously expanding its direct sales organization.
With its comprehensive portfolio for sample prepara-tion and innovative products for bioanalytics, the Lab Products & Services Division has a strong foundation for continuing strong organic growth. Based on the scalability of the division's business, this growth is projected to be accompanied by a steady increase in profitability. In addition, Sartorius plans to extend the lab division's portfolio by acquisitions.
Details on this division are provided in the chapter on Business Development of Lab Products & Services.
Sample Preparation
Bioanalytics
Prod
uct
Port
folio
Pharma | Biotech
Academia
Others
Lab Distributors
Focus
Direct Sales
Expand
eBusiness
Build up
Group Management Report Strategy and Goals 27
Sartorius 2020 Strategy
In 2011, Sartorius defined its strategy and long-term targets for 2020 to achieve profitable growth. At the beginning of 2016, close to the mid-point of this timeline, this 2020 plan was reviewed and updated.
The company's sales target of around €2 billion has been maintained despite the divestiture of the Indus-trial Technology Division in the interim. Growth is predominantly expected to be generated by Sartorius' existing portfolio, i.e., organically, and supplemented by acquisitions. In view of its profitability, Sartorius upgraded its margin target related to underlying EBITDA from around 23% to about 26% to 27% for 2020. This is assuming that the profitability of any future acquisitions would be at a level comparable to that of the existing business and that no significant changes in key exchange rates would occur.
Sartorius' 2020 targets are being implemented by various growth initiatives with the following areas of focus:
Regional Growth Initiatives
Regionally, North America and selected countries in Asia are at the focus of Sartorius' growth strategy.
North America is the world’s largest market for the manufacture of biopharmaceuticals and laboratory products. Because North America is home to the main competitors for both company divisions, Sartorius has historically lower market shares in this region than in Europe and Asia. Accordingly, the company is striving to further gain market share, primarily by strengthen-ing its sales and service capacities. Our second regional focus is on Asia, especially on China, South Korea and India. These markets have tremendous growth poten-tial due to their expanding healthcare systems and increased spending by private households. Moreover, major production facilities for biosimilars are being set up in these countries, and contract manufacturers are strengthening their presence in this region. To partici-pate in the momentum of the Asian markets in the best possible way, Sartorius already invested substan-tially in its sales infrastructure in this region.
Expansion of Product Portfolio
Regarding the further development of our portfolio, the 2020 strategy also provides for making acquisi-tions for both Group divisions. Such acquisitions will be primarily focused on adding complementary tech-nologies and products that enhance the attractiveness of the company's portfolio even more from a customer perspective.
Infrastructure
The foundation for future profitable growth is consti-tuted by efficient business processes, a powerful IT infrastructure and sufficient production capacities. Based on standardized business processes worldwide, Sartorius will be rolling out a new ERP system up to 2019 and is additionally investing continuously in the digitalization of its processes. Moreover, the company is considerably extending its production capacities at various locations, especially for filter and bag products. At the end of 2017, the two sites located in separate areas were combined for the most part into one loca-tion at the company's headquarters in Göttingen, Germany. This consolidation is expected to be com-pleted by the end of 2018.
28 Group Management Report Macroeconomic Environment and Conditions in the Sectors
The sectors in which the Sartorius Group is active differ in their dependence on the economy. The Bio-process Solutions Division, for instance, operates in an environment that is largely independent of economic fluctuations. The Lab Products & Services Division, in contrast, is active in sectors whose development is more strongly affected by economic factors.
Macroeconomic Environment
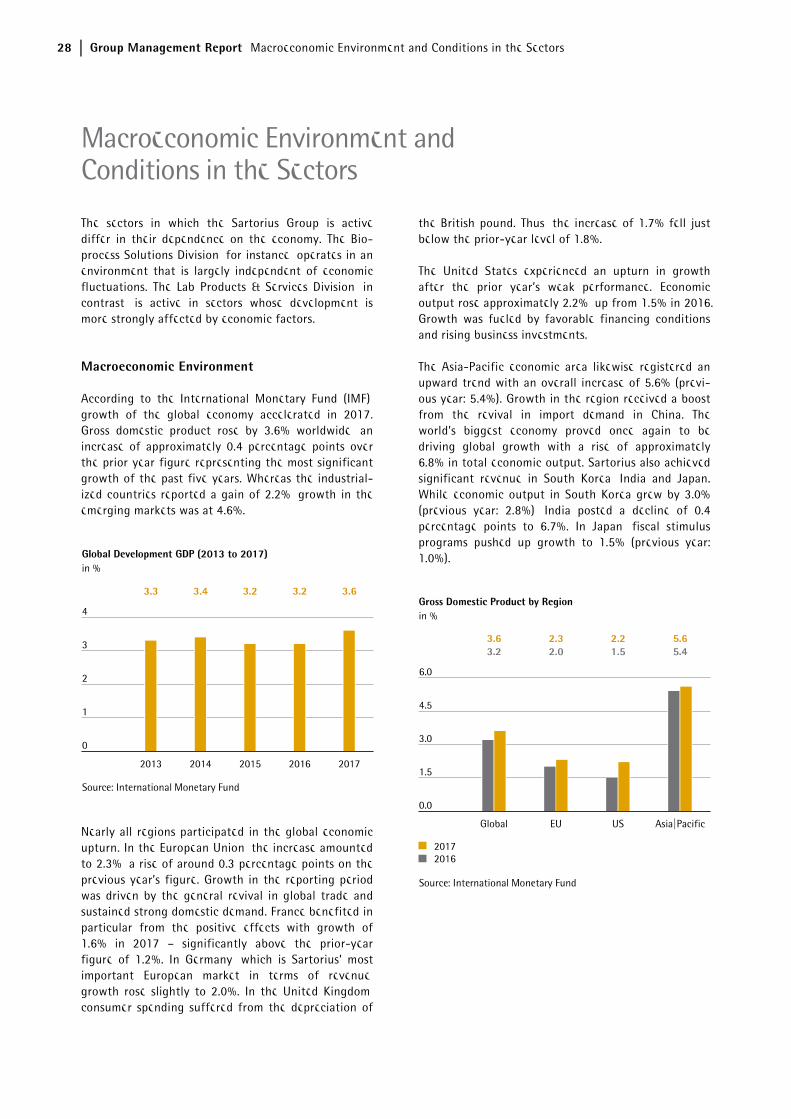
According to the International Monetary Fund (IMF), growth of the global economy accelerated in 2017. Gross domestic product rose by 3.6% worldwide, an increase of approximately 0.4 percentage points over the prior year figure representing the most significant growth of the past five years. Whereas the industrial-ized countries reported a gain of 2.2%, growth in the emerging markets was at 4.6%.
Nearly all regions participated in the global economic upturn. In the European Union, the increase amounted to 2.3%, a rise of around 0.3 percentage points on the previous year’s figure. Growth in the reporting period was driven by the general revival in global trade and sustained strong domestic demand. France benefited in particular from the positive effects with growth of 1.6% in 2017 – significantly above the prior-year figure of 1.2%. In Germany, which is Sartorius’ most important European market in terms of revenue, growth rose slightly to 2.0%. In the United Kingdom, consumer spending suffered from the depreciation of
the British pound. Thus, the increase of 1.7% fell just below the prior-year level of 1.8%.
The United States experienced an upturn in growth after the prior year’s weak performance. Economic output rose approximately 2.2%, up from 1.5% in 2016. Growth was fueled by favorable financing conditions and rising business investments.
The Asia-Pacific economic area likewise registered an upward trend with an overall increase of 5.6% (previ-ous year: 5.4%). Growth in the region received a boost from the revival in import demand in China. The world’s biggest economy proved once again to be driving global growth with a rise of approximately 6.8% in total economic output. Sartorius also achieved significant revenue in South Korea, India and Japan. While economic output in South Korea grew by 3.0% (previous year: 2.8%), India posted a decline of 0.4 percentage points to 6.7%. In Japan, fiscal stimulus programs pushed up growth to 1.5% (previous year: 1.0%).
Macroeconomic Environment and Conditions in the Sectors
Group Management Report Macroeconomic Environment and Conditions in the Sectors 29
Exchange Rate Trends
In addition to the euro, the currencies relevant to the Sartorius Group include the U.S. dollar in particular as well as the South Korean won, the Chinese renminbi, the Swiss franc and the British pound.
The U.S. dollar lost considerable ground against the euro in the year under review. The exchange rate for the currency pair rose sharply in the second and third quarters of 2017 to reach a multi-year high of U.S. $ 1.20 in September. The EUR/USD exchange rate fell back slightly after the U.S. Federal Reserve an-nounced, as expected, plans to reduce its bond buying program, thus taking the first concrete steps towards initiating a reversal in monetary policy. Over the course of December the temporary drop was fully recovered. The exchange rate for the currency pair ended the year at U.S. $ 1.20 as of December 31, 2017 compared with U.S. $ 1.06 at the end of 2016.
The euro also made headway during the reporting year against the other currencies of relevance for Sartorius. For instance, it gained 1.2% on the South Korean won year-on-year. Compared with the Chinese renminbi and the Swiss franc, the euro rose 7.3% and 9.0%, respectively. The British pound fell 4.3% against the euro in 2017.
Interest Rate Trends
Interest rates remained at a very low level on average throughout the reporting year. The European Central Bank kept its key interest rate at 0.00%. The 3 -month EURIBOR – i.e., the rate of interest on fixed-term de-posits denominated in euros in interbank business – stood at - 0.33% on December 31, 2017 (Decem-ber 31, 2016: - 0.32%).
Sources: International Monetary Fund: World Economic Outlook
October 2017; Bloomberg.
Conditions in the Sectors
Sartorius’ key customer groups include the biopharma-ceutical and pharmaceutical industries as well as pub-lic research institutions. In addition, the company counts quality assurance laboratories in the chemicals and food industries among its customers. The progress of the Group's business accordingly depends on devel-opments in these industries.
Continued Growth in the World’s Pharmaceutical Markets
According to estimates from several market observers, the global pharmaceutical showed a positive develop-ment once again in 2017, with growth of approxi-mately 4% to 5%. The market was again fueled by better access to health services in emerging markets and rising median ages in industrial countries, which led to an increasing demand for medications. By con-trast, growth of the pharmaceutical market was damp-ened by government initiatives directed at reducing health spending as well as expiring patents for high-margin pharmaceutical products.
All the regions contributed to sector growth in the year under review. The United States continues to represent the biggest single market, followed by China, Japan and Germany. The strongest growth, though with a slower tempo, took place as in previous years in the “pharmerging markets”, which include China, India, Brazil and Russia, among others. Performance of the European pharmaceutical market was impacted by increased efforts to control costs in the health sector. In the United States, expiring patents and tough com-petition among pharmaceutical manufacturers led to a moderate slowdown in market growth. Rising expendi-tures for newly launched medications had a positive impact.
Above-Average Growth in the Biopharmaceutical Market
Given the company’s highly specialized product port-folio, the trend in the biopharmaceutical market is especially relevant for Sartorius. The market for medi-cations and vaccinations manufactured using biotech methods has grown faster than the rest of the phar-maceutical market for many years now. In 2017, the biopharmaceutical market was estimated by industry observers to have a volume of €214 billion, an increase of approximately 6% over the previous year. Overall, the proportion of sales revenue of the world's pharma-ceutical market from medications manufactured using
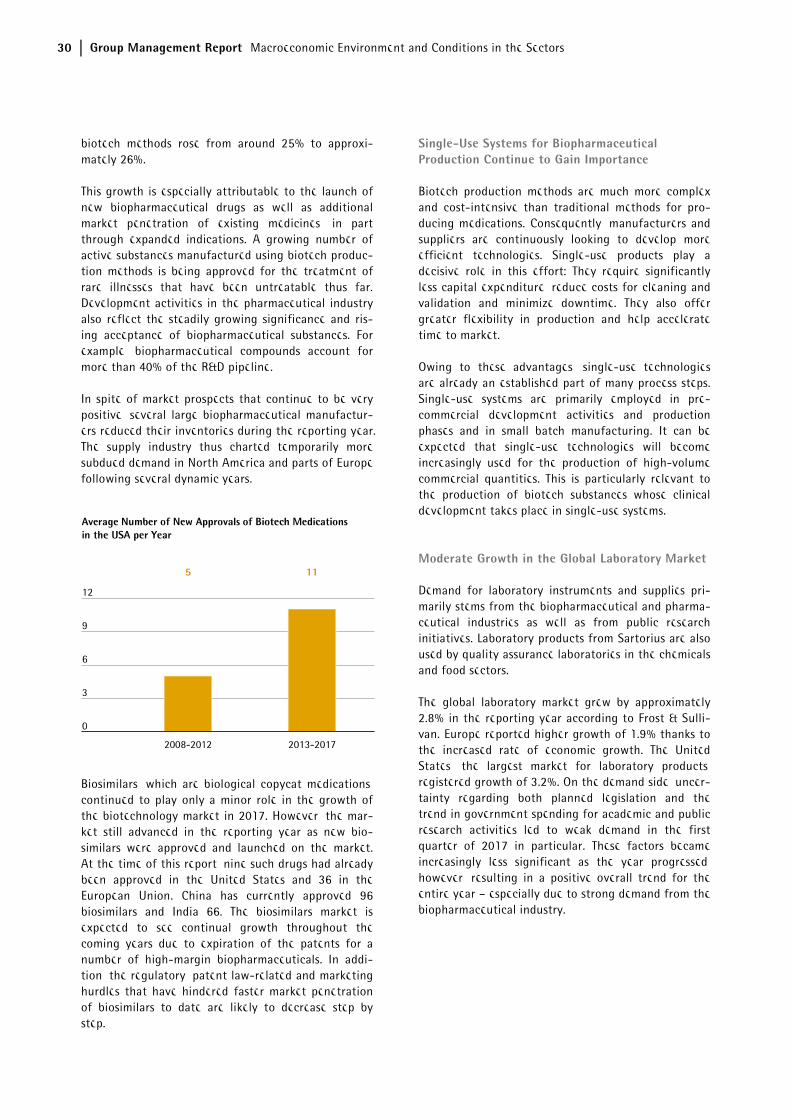
30 Group Management Report Macroeconomic Environment and Conditions in the Sectors
biotech methods rose from around 25% to approxi-mately 26%.
This growth is especially attributable to the launch of new biopharmaceutical drugs as well as additional market penetration of existing medicines, in part through expanded indications. A growing number of active substances manufactured using biotech produc-tion methods is being approved for the treatment of rare illnesses that have been untreatable thus far. Development activities in the pharmaceutical industry also reflect the steadily growing significance and ris-ing acceptance of biopharmaceutical substances. For example, biopharmaceutical compounds account for more than 40% of the R&D pipeline.
In spite of market prospects that continue to be very positive, several large biopharmaceutical manufactur-ers reduced their inventories during the reporting year. The supply industry thus charted temporarily more subdued demand in North America and parts of Europe following several dynamic years.
Biosimilars, which are biological copycat medications, continued to play only a minor role in the growth of the biotechnology market in 2017. However, the mar-ket still advanced in the reporting year as new bio-similars were approved and launched on the market. At the time of this report, nine such drugs had already been approved in the United States and 36 in the European Union. China has currently approved 96 biosimilars and India 66. The biosimilars market is expected to see continual growth throughout the coming years due to expiration of the patents for a number of high-margin biopharmaceuticals. In addi-tion, the regulatory, patent law-related and marketing hurdles that have hindered faster market penetration of biosimilars to date are likely to decrease step by step.
Single-Use Systems for Biopharmaceutical Production Continue to Gain Importance
Biotech production methods are much more complex and cost-intensive than traditional methods for pro-ducing medications. Consequently, manufacturers and suppliers are continuously looking to develop more efficient technologies. Single-use products play a decisive role in this effort: They require significantly less capital expenditure, reduce costs for cleaning and validation and minimize downtime. They also offer greater flexibility in production and help accelerate time to market.
Owing to these advantages, single-use technologies are already an established part of many process steps. Single-use systems are primarily employed in pre-commercial development activities and production phases and in small batch manufacturing. It can be expected that single-use technologies will become increasingly used for the production of high-volume commercial quantities. This is particularly relevant to the production of biotech substances whose clinical development takes place in single-use systems.
Moderate Growth in the Global Laboratory Market
Demand for laboratory instruments and supplies pri-marily stems from the biopharmaceutical and pharma-ceutical industries as well as from public research initiatives. Laboratory products from Sartorius are also used by quality assurance laboratories in the chemicals and food sectors.
The global laboratory market grew by approximately 2.8% in the reporting year according to Frost & Sulli-van. Europe reported higher growth of 1.9% thanks to the increased rate of economic growth. The United States, the largest market for laboratory products, registered growth of 3.2%. On the demand side, uncer-tainty regarding both planned legislation and the trend in government spending for academic and public research activities led to weak demand in the first quarter of 2017 in particular. These factors became increasingly less significant as the year progressed, however, resulting in a positive overall trend for the entire year – especially due to strong demand from the biopharmaceutical industry.
Group Management Report Macroeconomic Environment and Conditions in the Sectors 31
Significant growth was once again reported in Asian countries such as China and India, in which the la-boratory market enjoyed an above-average expansion of 7.6% (China) and 8.6% (India).
Competitive Position
The competitive environment in each of our two divi-sions is as follows:
The Bioprocess Solutions Division operates as a total solution provider, covering the core process steps in biopharmaceutical production and upstream process development. It holds a leading global position in key technological fields, and offers the sector’s most ex-tensive portfolio of single-use technologies. The Bio-process Solutions Division's principal competitors include Merck KGaA, Danaher, General Electric and Thermo Fisher.
The Lab Products & Services Division is positioned as a premium provider of laboratory instruments along with excellent services, and serves both R&D laborato-ries and quality assurance laboratories, with a focus on the biopharmaceutical industry. The product range includes laboratory balances, pipettes, and instruments for bioanalytics as well as a wide range of consuma-bles. The division ranks among the leading providers worldwide in most of these areas. Principal competi-tors include Mettler Toledo Intl. Inc., Thermo Fisher Inc., Merck KGaA, Danaher Corp. and Eppendorf AG.
Sources: QuintilesIMS Institute: Outlook for Global Medicines through 2021, December 2016; Evaluate Pharma: World Preview 2017, Outlook to 2022, June 2017; BioPlan: 14th Annual Report and Survey of Biopharmaceutical Manufacturing Capacity and Production, April 2017; Deloitte: 2017 Global Life Science Outlook, October 2016; Frost & Sullivan: 2017 Mid-year Report: Forecast and Analysis of the Global Market for Laboratory Products, October 2017; www.fda.gov; FDA-Approves-Fifth-Biosimilar-in-US-First-for-Amgens-Blockbuster-Enbrel, www.raps.org
.
32 Group Management Report Group Business Development
Sales Revenue and Order Intake
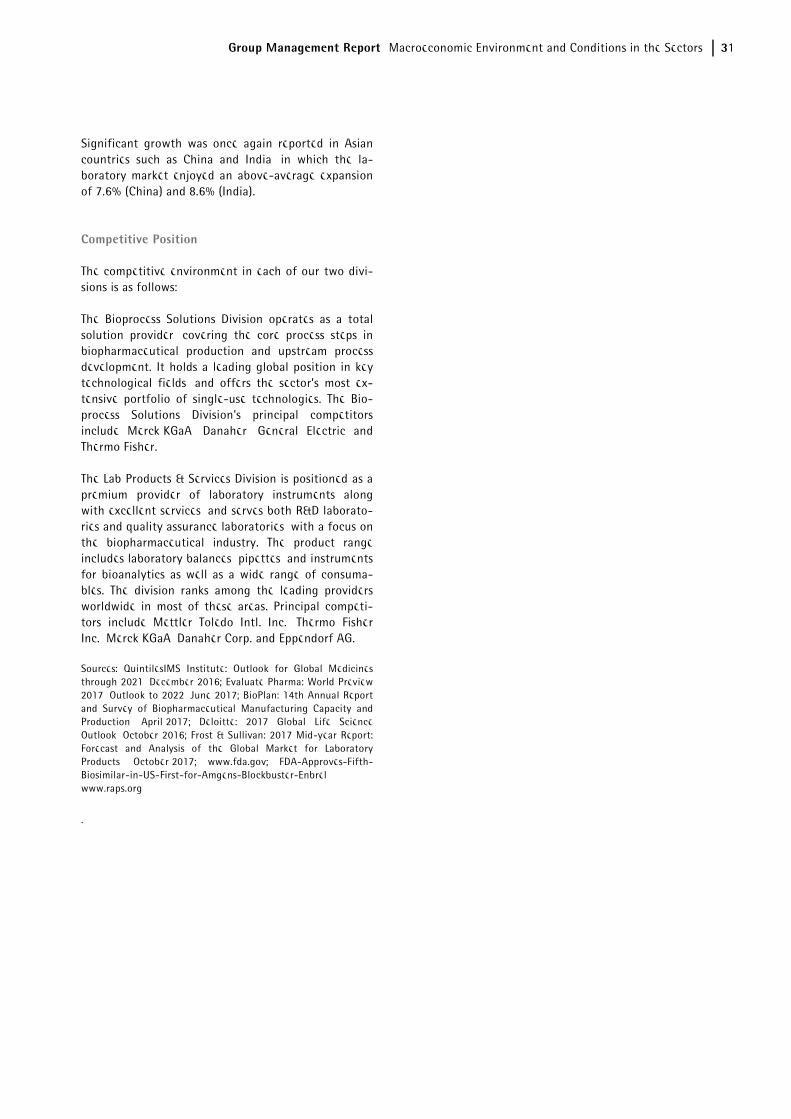
In the reporting year, the Sartorius Group continued to show positive development. Sales revenue thus rose 9.3% in constant currencies to €1,404.6 million, with the amounts contributed by organic growth and by acquisitions being approximately equal. On a reported basis, i.e., including currency effects, sales grew by 8.0%. Sartorius therefore reached its adjusted forecast for the third quarter of 2017.
Order intake also showed positive development in the reporting period, considerably exceeding sales. In 2017, orders increased 13.7% in constant currencies to €1,501.4 million. On a reported basis, this gain was 12.5%.
For a full comparison of the Group’s business devel-opment with its forecast, see page 50.
Sales Revenue and Order Intake
€ in millions 2017 2016 in %
reportedin % wb1)
Sales revenue 1,404.6 1,300.3 8.0 9.3
Order intake 1,501.4 1,334.7 12.5 13.7
1) In constant currencies
Sales Driven by Both Divisions
After two years of exceptionally high growth in 2015 and 2016, sales revenue for the Bioprocess Solutions Division increased in the reporting year at a slightly more moderate rate of 4.9% to €1,010.3 million. The division's business performance was impacted by sev-eral simultaneous, temporary effects, primarily in the Americas region. Therefore, transient bottlenecks in the business for cell culture media, inventory destock-ing by a few relatively large customers and interrup-tion of production at the plant in Puerto Rico in the wake of Hurricane Maria all had a dampening effect. As a result of these impacts, the division's growth was lower than originally expected. Acquisitions of the two companies kSep and Umetrics contributed around one percentage point to the division's growth.
The Lab Products & Services Division also saw excep-tionally dynamic growth due to strong development of organic sales and the expansion of its portfolio into bioanalytics. Sales revenue rose year over year by 22.0% to €394.2 million, with around 14 percentage points attributable to the consolidation of IntelliCyt and ViroCyt acquired in 2016, as well as of Essen BioScience taken over in 2017. Growth was driven by all regions and all product areas.
Sales by Division
€ in millions 2017 2016 in %
reportedin %
cc
Bioprocess Solutions 1,010.3 975.0 3.6 4.9
Lab Products & Services 394.2 325.3 21.2 22.0
Further information on the business development of the Group divisions is given on pages 42 et seq. for the Bioprocess Solutions Division and on pages 46 et seq. for the Lab Products & Services Division.
Group Business Development
Group Management Report Group Business Development 33
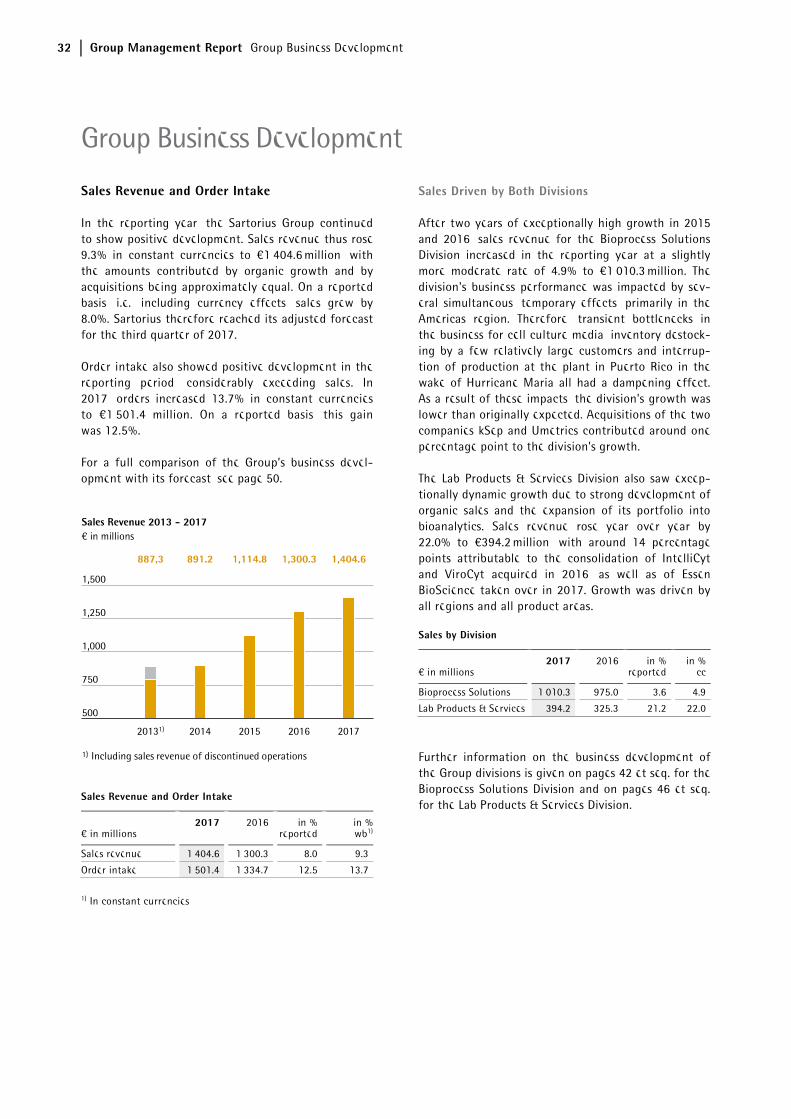
Significant Gains in All Regions
In the reporting year, Sartorius recorded gains in all regions. In EMEA, the region contributing the highest share of revenue of around 43%, sales rose 6.8% to €604.5 million. While the Bioprocess Solutions Division achieved a gain of 2.5%, sales revenue for the Lab Products & Services Division was up 17.7% year over year.
The Americas region, in which sales grew at an espe-cially strong rate over the past years, accounted for around 32% of consolidated revenue in 2017. Sales were up 3.5% to €455.5 million. Development of the Bioprocess Solutions Division was especially impacted by the temporary effects mentioned above; as a result, the division reported that sales decreased by 3.3% to €357.1 million. By contrast, the Lab Products & Ser-vices Division showed exceptionally dynamic develop-ment. Fueled by strong organic growth and by the acquisition of Essen BioScience, the division's sales were up 39.5%.
Business development for the Asia | Pacific region, which accounted for around 25% of Group revenue, showed the highest dynamics in the reporting year, with sales growing by 22.5% to €344.6 million. Sales revenue for the Bioprocess Solutions Division rose sharply by 25.3%, partly due to equipment shipments to fill relatively large orders. The Lab Products & Ser-vices Division also reported a double-digit gain of 16.6%. All growth rates are in constant currencies unless otherwise stated.
Sales by Region
€ in millions 2017 2016in %
reportedin %
cc
EMEA 604.5 569.1 6.2 6.8
Americas 455.5 445.4 2.3 3.5
Asia | Pacific 344.6 285.8 20.6 22.5
Development of Costs and Earnings
In the reporting year, the cost of sales stood at €697.7 million. In comparison with sales revenue growth of 8.0%, the cost of sales increased underpro-portionately by 4.4%, which was due to product mix effects and economies of scale. The cost of sales ratio was 49.7% relative to 51.4% a year ago.
Selling and distribution costs rose overproportionately relative to sales revenue, by 15.7% to €296.8 million. Accordingly, the ratio of selling and distribution costs to sales revenue increased from 19.7% in the previous year to 21.1%.
Expenses for research and development rose year over year by 15.8% to €68.8 million. The ratio of R&D ex-penses to sales revenue was 4.9%, slightly above the prior-year level of 4.6%.
Concerning general administrative expenses, Sartorius reported an 11.5% increase to €83.3 million, which can be primarily attributed to the expansion of the IT functional area. In relation to sales revenue, general administrative expenses rose from 5.7% in the previous year to 5.9% in the reporting year.
In fiscal 2017, the balance of other operating income and expenses was - €38.6 million relative to -€20.6 million a year earlier. This year-on-year change was driven, inter alia, by extraordinary items that totaled -€35.5 million in the reporting year (2016: -€30.7 million). These items were essentially incurred due to various cross-divisional projects, ex-penses related to the most recent acquisitions and to the consequences of Hurricane Maria.
In the year under review, the Group’s EBIT edged down slightly by 0.5% to €219.4 million, especially due to higher PPA amortization in connection with the acqui-sition of Essen BioScience. The Group's EBIT margin was 15.6% because of higher depreciation as well as extraordinary items (2016: 17.0%).
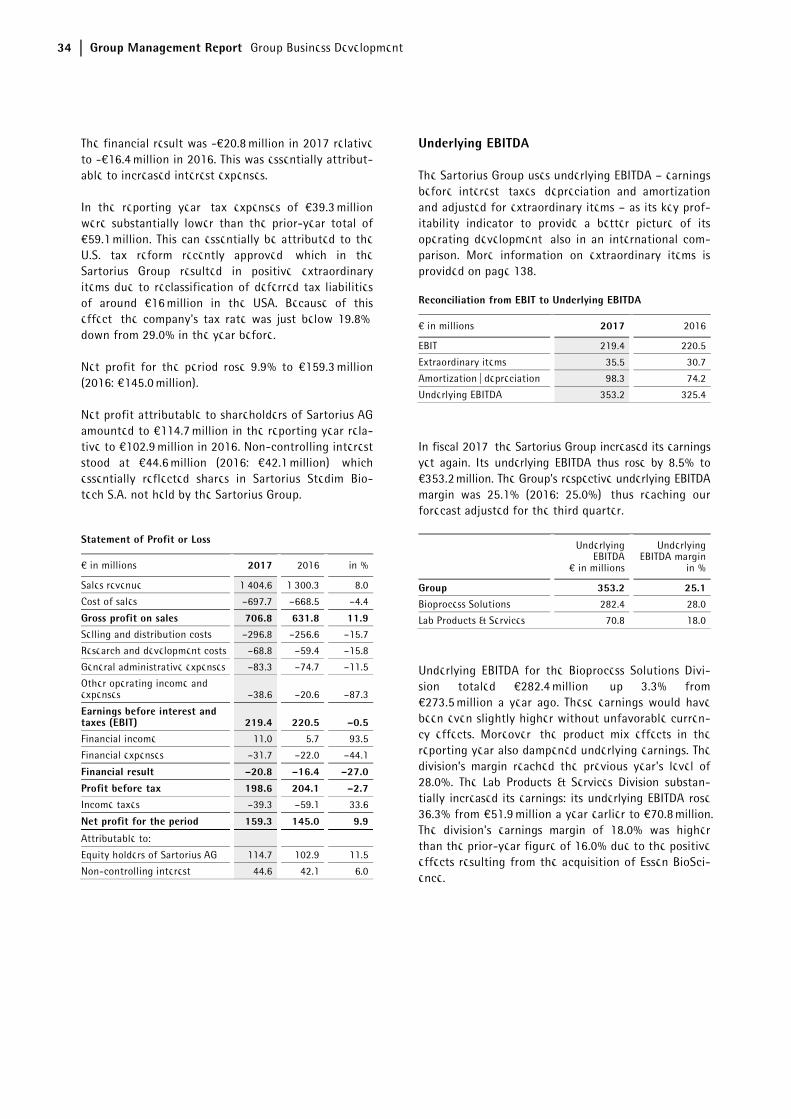
34 Group Management Report Group Business Development
The financial result was -€20.8 million in 2017 relative to -€16.4 million in 2016. This was essentially attribut-able to increased interest expenses.
In the reporting year, tax expenses of €39.3 million were substantially lower than the prior-year total of €59.1 million. This can essentially be attributed to the U.S. tax reform recently approved, which in the Sartorius Group resulted in positive extraordinary items due to reclassification of deferred tax liabilities of around €16 million in the USA. Because of this effect, the company's tax rate was just below 19.8%, down from 29.0% in the year before.
Net profit for the period rose 9.9% to €159.3 million (2016: €145.0 million).
Net profit attributable to shareholders of Sartorius AG amounted to €114.7 million in the reporting year rela-tive to €102.9 million in 2016. Non-controlling interest stood at €44.6 million (2016: €42.1 million), which essentially reflected shares in Sartorius Stedim Bio-tech S.A. not held by the Sartorius Group.
Statement of Profit or Loss
€ in millions 2017 2016 in %
Sales revenue 1,404.6 1,300.3 8.0
Cost of sales –697.7 –668.5 –4.4
Gross profit on sales 706.8 631.8 11.9Selling and distribution costs –296.8 –256.6 –15.7
Research and development costs –68.8 –59.4 –15.8
General administrative expenses –83.3 –74.7 –11.5
Other operating income and expenses –38.6 –20.6 –87.3
Earnings before interest and taxes (EBIT) 219.4 220.5 –0.5Financial income 11.0 5.7 93.5
Financial expenses –31.7 –22.0 –44.1
Financial result –20.8 –16.4 –27.0
Profit before tax 198.6 204.1 –2.7Income taxes –39.3 –59.1 33.6
Net profit for the period 159.3 145.0 9.9
Attributable to:
Equity holders of Sartorius AG 114.7 102.9 11.5
Non-controlling interest 44.6 42.1 6.0
Underlying EBITDA
The Sartorius Group uses underlying EBITDA – earnings before interest, taxes, depreciation and amortization and adjusted for extraordinary items – as its key prof-itability indicator to provide a better picture of its operating development, also in an international com-parison. More information on extraordinary items is provided on page 138.
Reconciliation from EBIT to Underlying EBITDA
€ in millions 2017 2016
EBIT 219.4 220.5
Extraordinary items 35.5 30.7
Amortization | depreciation 98.3 74.2
Underlying EBITDA 353.2 325.4
In fiscal 2017, the Sartorius Group increased its earnings yet again. Its underlying EBITDA thus rose by 8.5% to €353.2 million. The Group's respective underlying EBITDA margin was 25.1% (2016: 25.0%), thus reaching our forecast adjusted for the third quarter.
UnderlyingEBITDA
€ in millions
Underlying EBITDA margin
in %
Group 353.2 25.1Bioprocess Solutions 282.4 28.0
Lab Products & Services 70.8 18.0
Underlying EBITDA for the Bioprocess Solutions Divi-sion totaled €282.4 million, up 3.3% from €273.5 million a year ago. These earnings would have been even slightly higher without unfavorable curren-cy effects. Moreover, the product mix effects in the reporting year also dampened underlying earnings. The division’s margin reached the previous year's level of 28.0%. The Lab Products & Services Division substan-tially increased its earnings: its underlying EBITDA rose 36.3% from €51.9 million a year earlier to €70.8 million. The division's earnings margin of 18.0% was higher than the prior-year figure of 16.0% due to the positive effects resulting from the acquisition of Essen BioSci-ence.
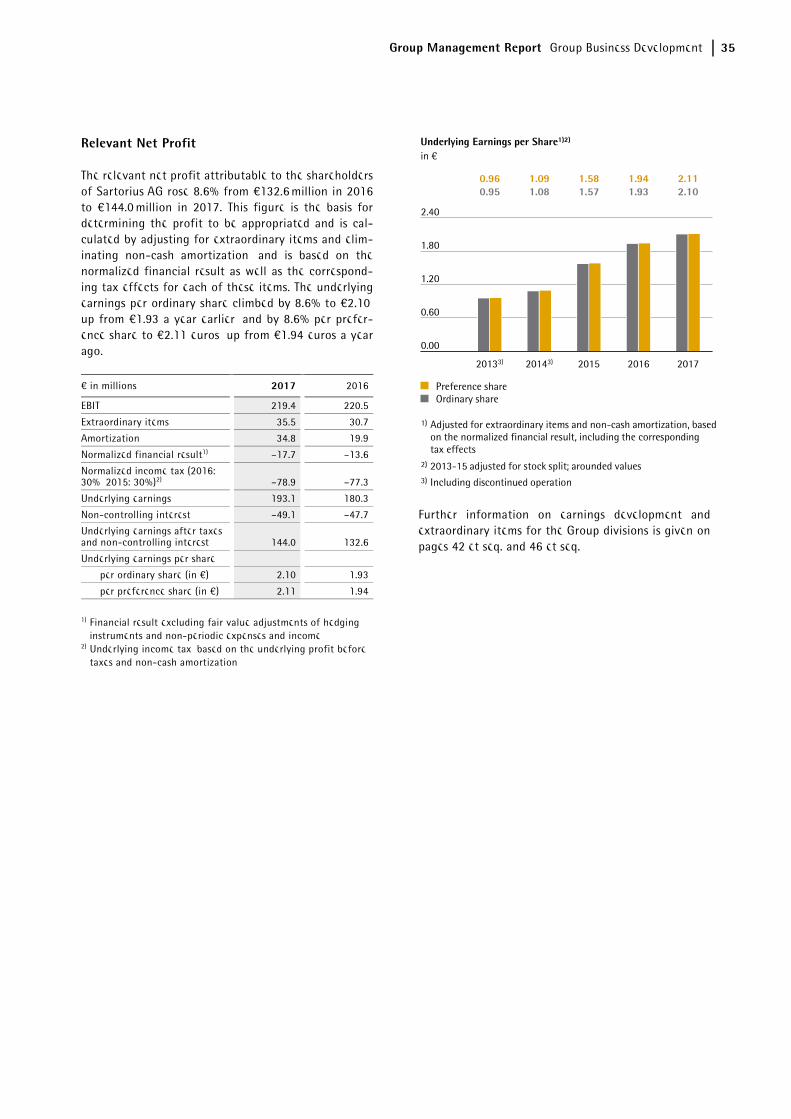
Group Management Report Group Business Development 35
Relevant Net Profit
The relevant net profit attributable to the shareholders of Sartorius AG rose 8.6% from €132.6 million in 2016 to €144.0 million in 2017. This figure is the basis for determining the profit to be appropriated and is cal-culated by adjusting for extraordinary items and elim-inating non-cash amortization, and is based on the normalized financial result as well as the correspond-ing tax effects for each of these items. The underlying earnings per ordinary share climbed by 8.6% to €2.10, up from €1.93 a year earlier, and by 8.6% per prefer-ence share to €2.11 euros, up from €1.94 euros a year ago.
€ in millions 2017 2016
EBIT 219.4 220.5
Extraordinary items 35.5 30.7
Amortization 34.8 19.9
Normalized financial result1) –17.7 –13.6
Normalized income tax (2016: 30%, 2015: 30%)2) –78.9 –77.3
Underlying earnings 193.1 180.3
Non-controlling interest –49.1 –47.7
Underlying earnings after taxes and non-controlling interest 144.0 132.6
Underlying earnings per share
per ordinary share (in €) 2.10 1.93
per preference share (in €) 2.11 1.94
1) Financial result excluding fair value adjustments of hedging instruments and non-periodic expenses and income
2) Underlying income tax, based on the underlying profit before taxes and non-cash amortization
Further information on earnings development and extraordinary items for the Group divisions is given on pages 42 et seq. and 46 et seq.
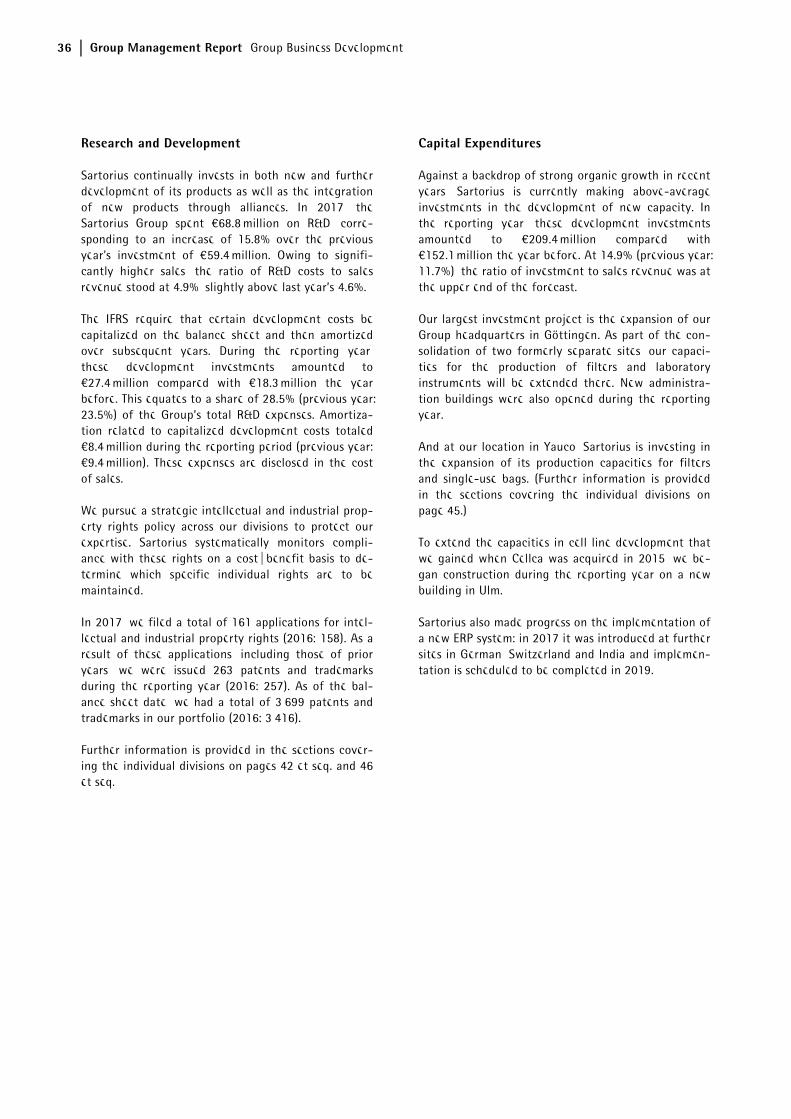
36 Group Management Report Group Business Development
Research and Development
Sartorius continually invests in both new and further development of its products as well as the integration of new products through alliances. In 2017, the Sartorius Group spent €68.8 million on R&D, corre-sponding to an increase of 15.8% over the previous year's investment of €59.4 million. Owing to signifi-cantly higher sales, the ratio of R&D costs to sales revenue stood at 4.9%, slightly above last year’s 4.6%.
The IFRS require that certain development costs be capitalized on the balance sheet and then amortized over subsequent years. During the reporting year, these development investments amounted to €27.4 million compared with €18.3 million the year before. This equates to a share of 28.5% (previous year: 23.5%) of the Group’s total R&D expenses. Amortiza-tion related to capitalized development costs totaled €8.4 million during the reporting period (previous year: €9.4 million). These expenses are disclosed in the cost of sales.
We pursue a strategic intellectual and industrial prop-erty rights policy across our divisions to protect our expertise. Sartorius systematically monitors compli-ance with these rights on a cost | benefit basis to de-termine which specific individual rights are to be maintained.
In 2017, we filed a total of 161 applications for intel-lectual and industrial property rights (2016: 158). As a result of these applications, including those of prior years, we were issued 263 patents and trademarks during the reporting year (2016: 257). As of the bal-ance sheet date, we had a total of 3,699 patents and trademarks in our portfolio (2016: 3,416).
Further information is provided in the sections cover-ing the individual divisions on pages 42 et seq. and 46 et seq.
Capital Expenditures
Against a backdrop of strong organic growth in recent years, Sartorius is currently making above-average investments in the development of new capacity. In the reporting year, these development investments amounted to €209.4 million compared with €152.1 million the year before. At 14.9% (previous year: 11.7%), the ratio of investment to sales revenue was at the upper end of the forecast.
Our largest investment project is the expansion of our Group headquarters in Göttingen. As part of the con-solidation of two formerly separate sites, our capaci-ties for the production of filters and laboratory instruments will be extended there. New administra-tion buildings were also opened during the reporting year.
And at our location in Yauco, Sartorius is investing in the expansion of its production capacities for filters and single-use bags. (Further information is provided in the sections covering the individual divisions on page 45.)
To extend the capacities in cell line development that we gained when Cellca was acquired in 2015, we be-gan construction during the reporting year on a new building in Ulm.
Sartorius also made progress on the implementation of a new ERP system: in 2017 it was introduced at further sites in German, Switzerland and India and implemen-tation is scheduled to be completed in 2019.
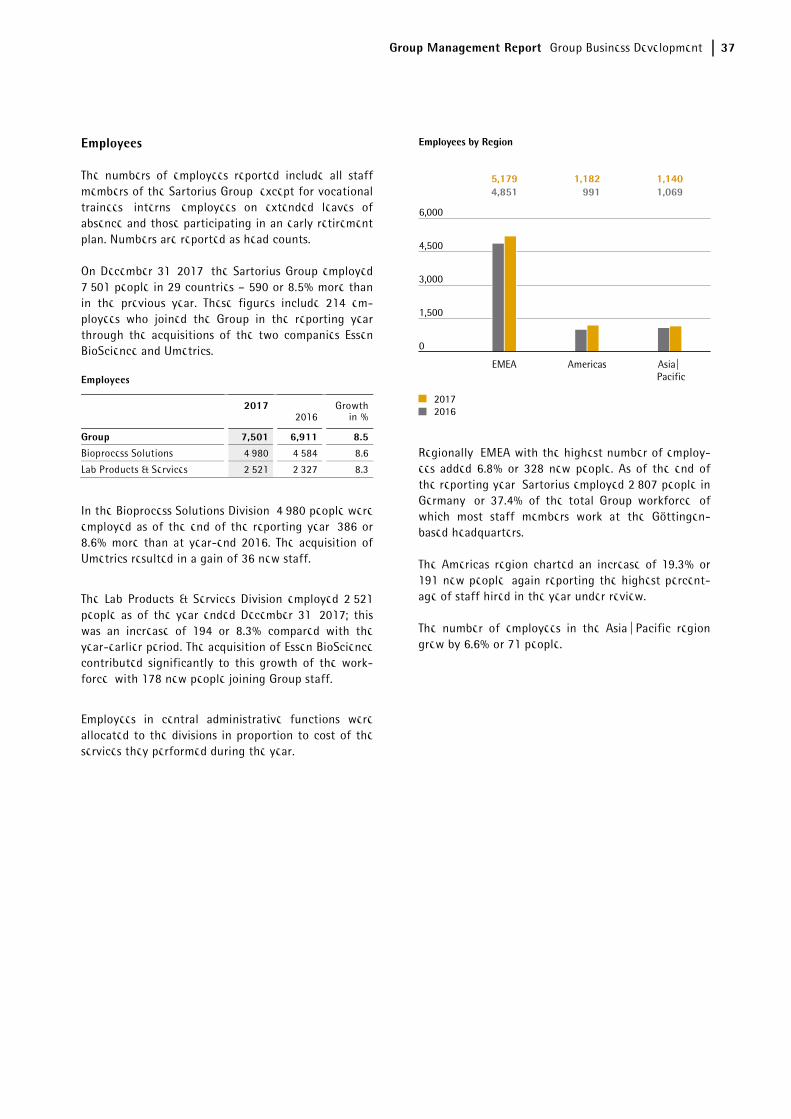
Group Management Report Group Business Development 37
Employees
The numbers of employees reported include all staff members of the Sartorius Group, except for vocational trainees, interns, employees on extended leaves of absence and those participating in an early retirement plan. Numbers are reported as head counts.
On December 31, 2017, the Sartorius Group employed 7,501 people in 29 countries – 590 or 8.5% more than in the previous year. These figures include 214 em-ployees who joined the Group in the reporting year through the acquisitions of the two companies Essen BioScience and Umetrics.
Employees
20172016
Growthin %
Group 7,501 6,911 8.5Bioprocess Solutions 4,980 4,584 8.6
Lab Products & Services 2,521 2,327 8.3
In the Bioprocess Solutions Division, 4,980 people were employed as of the end of the reporting year, 386 or 8.6% more than at year-end 2016. The acquisition of Umetrics resulted in a gain of 36 new staff.
The Lab Products & Services Division employed 2,521 people as of the year ended December 31, 2017; this was an increase of 194 or 8.3% compared with the year-earlier period. The acquisition of Essen BioScience contributed significantly to this growth of the work-force, with 178 new people joining Group staff.
Employees in central administrative functions were allocated to the divisions in proportion to cost of the services they performed during the year.
Regionally, EMEA with the highest number of employ-ees added 6.8% or 328 new people. As of the end of the reporting year, Sartorius employed 2,807 people in Germany, or 37.4% of the total Group workforce, of which most staff members work at the Göttingen-based headquarters.
The Americas region charted an increase of 19.3% or 191 new people, again reporting the highest percent-age of staff hired in the year under review.
The number of employees in the Asia | Pacific region grew by 6.6% or 71 people.
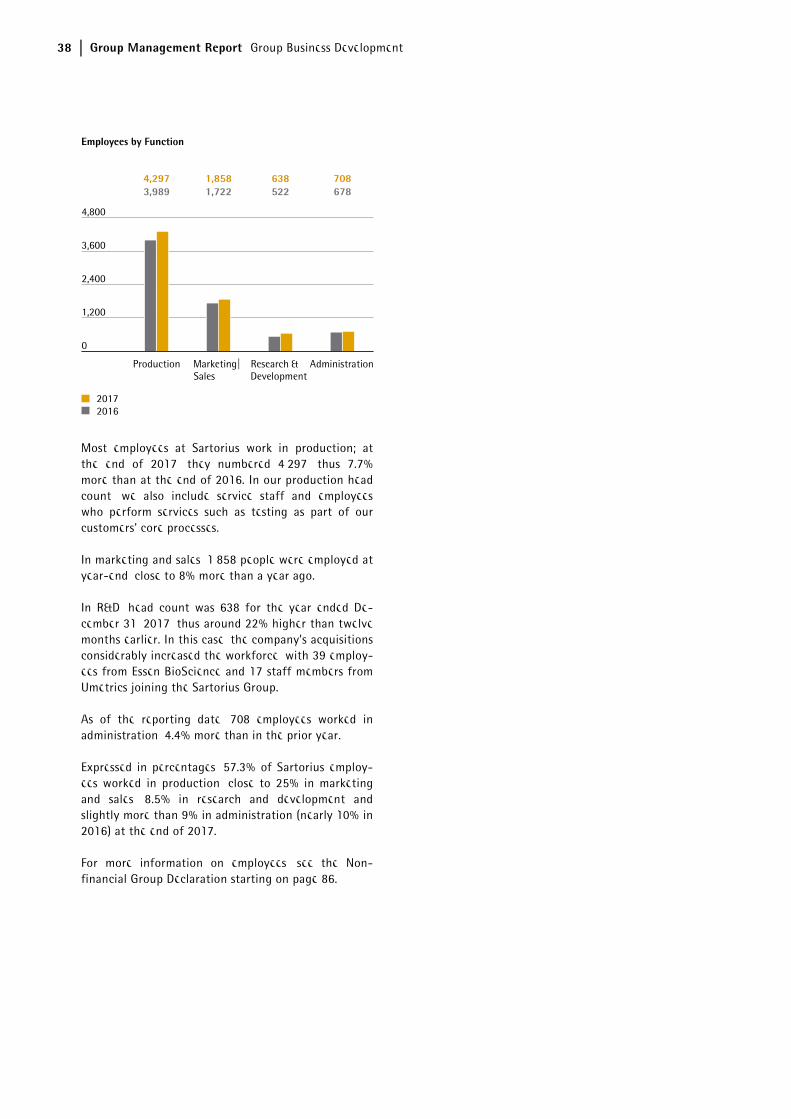
38 Group Management Report Group Business Development
Most employees at Sartorius work in production; at the end of 2017, they numbered 4,297, thus 7.7% more than at the end of 2016. In our production head count, we also include service staff and employees who perform services such as testing as part of our customers' core processes.
In marketing and sales, 1,858 people were employed at year-end, close to 8% more than a year ago.
In R&D, head count was 638 for the year ended De-cember 31, 2017, thus around 22% higher than twelve months earlier. In this case, the company's acquisitions considerably increased the workforce, with 39 employ-ees from Essen BioScience and 17 staff members from Umetrics joining the Sartorius Group.
As of the reporting date, 708 employees worked in administration, 4.4% more than in the prior year.
Expressed in percentages, 57.3% of Sartorius employ-ees worked in production, close to 25% in marketing and sales, 8.5% in research and development and slightly more than 9% in administration (nearly 10% in 2016) at the end of 2017.
For more information on employees, see the Non-financial Group Declaration starting on page 86.
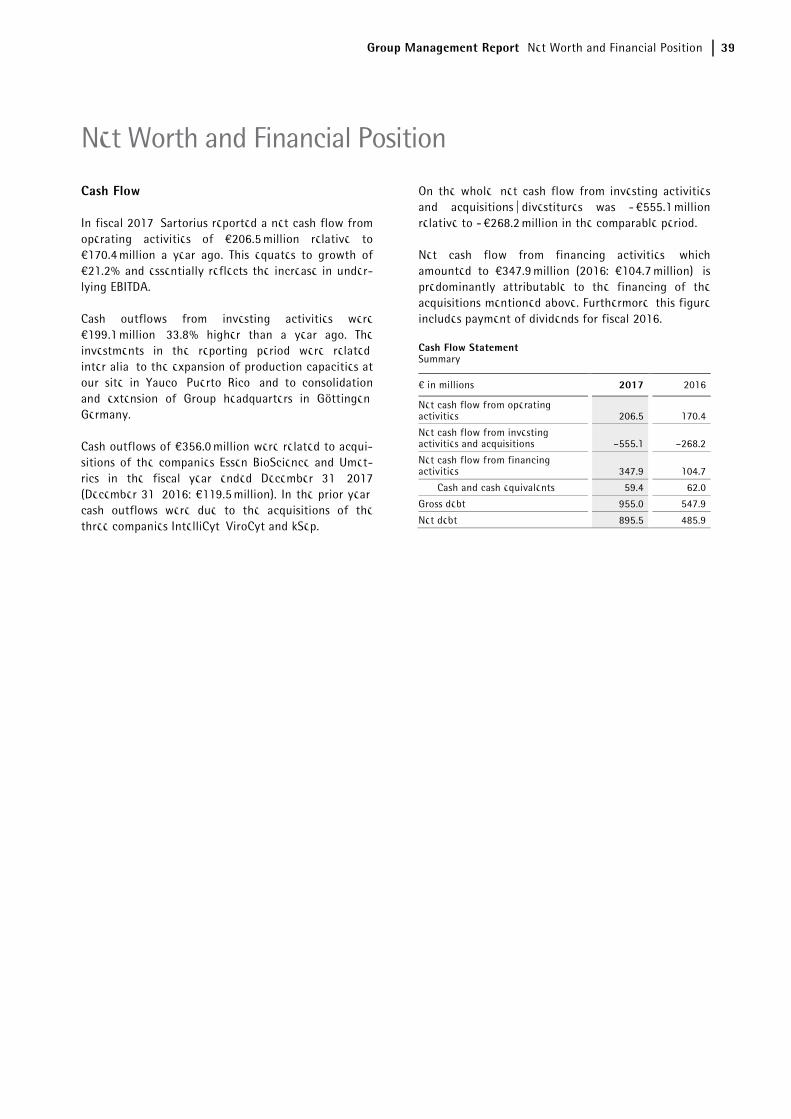
Group Management Report Net Worth and Financial Position 39
Cash Flow
In fiscal 2017, Sartorius reported a net cash flow from operating activities of €206.5 million relative to €170.4 million a year ago. This equates to growth of €21.2% and essentially reflects the increase in under-lying EBITDA.
Cash outflows from investing activities were €199.1 million, 33.8% higher than a year ago. The investments in the reporting period were related, inter alia, to the expansion of production capacities at our site in Yauco, Puerto Rico, and to consolidation and extension of Group headquarters in Göttingen, Germany.
Cash outflows of €356.0 million were related to acqui-sitions of the companies Essen BioScience and Umet-rics in the fiscal year ended December 31, 2017 (December 31, 2016: €119.5 million). In the prior year, cash outflows were due to the acquisitions of the three companies IntelliCyt, ViroCyt and kSep.
On the whole, net cash flow from investing activities and acquisitions | divestitures was - €555.1 million relative to - €268.2 million in the comparable period.
Net cash flow from financing activities, which amounted to €347.9 million (2016: €104.7 million), is predominantly attributable to the financing of the acquisitions mentioned above. Furthermore, this figure includes payment of dividends for fiscal 2016.
Cash Flow StatementSummary
€ in millions 2017 2016
Net cash flow from operating activities 206.5 170.4
Net cash flow from investing activities and acquisitions –555.1 –268.2
Net cash flow from financing activities 347.9 104.7
Cash and cash equivalents 59.4 62.0
Gross debt 955.0 547.9
Net debt 895.5 485.9
Net Worth and Financial Position
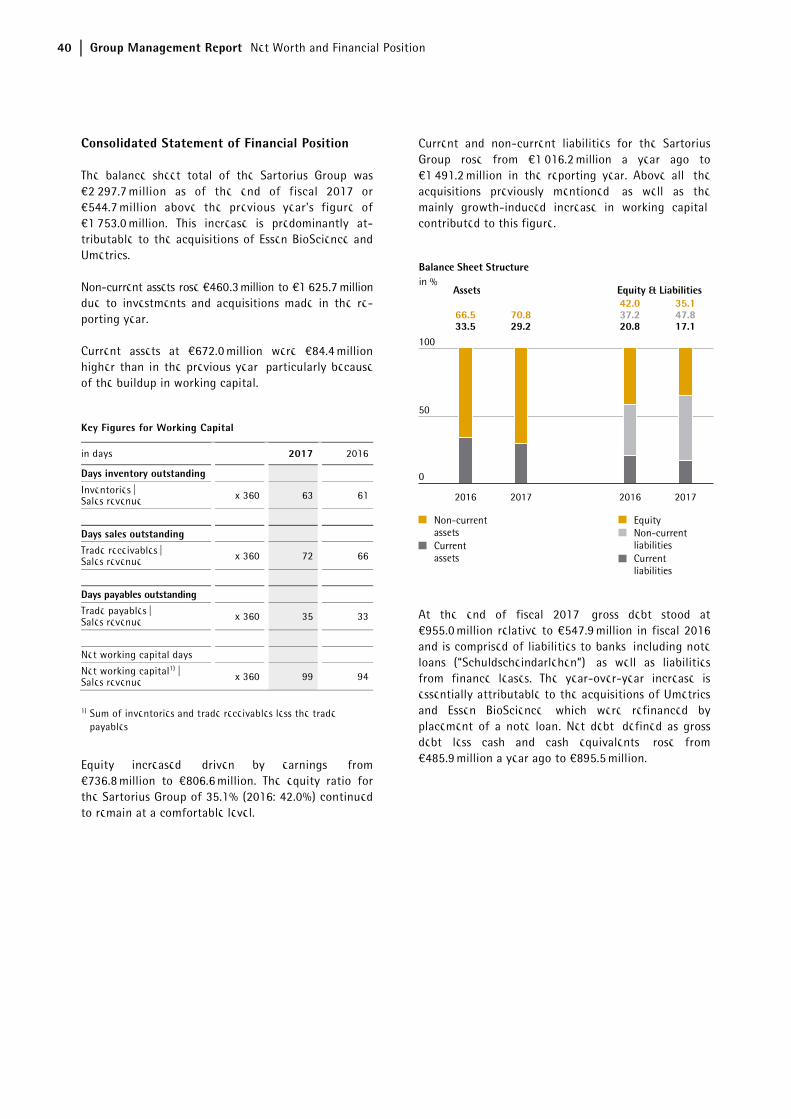
40 Group Management Report Net Worth and Financial Position
Consolidated Statement of Financial Position
The balance sheet total of the Sartorius Group was €2,297.7 million as of the end of fiscal 2017 or €544.7 million above the previous year's figure of €1,753.0 million. This increase is predominantly at-tributable to the acquisitions of Essen BioScience and Umetrics.
Non-current assets rose €460.3 million to €1,625.7 million due to investments and acquisitions made in the re-porting year.
Current assets at €672.0 million were €84.4 million higher than in the previous year, particularly because of the buildup in working capital.
Key Figures for Working Capital
in days 2017 2016
Days inventory outstanding
Inventories | Sales revenue x 360 63 61
Days sales outstanding Trade receivables | Sales revenue x 360 72 66
Days payables outstanding Trade payables | Sales revenue x 360 35 33
Net working capital days
Net working capital1) | Sales revenue x 360 99 94
1) Sum of inventories and trade receivables less the trade payables
Equity increased, driven by earnings, from €736.8 million to €806.6 million. The equity ratio for the Sartorius Group of 35.1% (2016: 42.0%) continued to remain at a comfortable level.
Current and non-current liabilities for the Sartorius Group rose from €1,016.2 million a year ago to €1,491.2 million in the reporting year. Above all, the acquisitions previously mentioned, as well as the mainly growth-induced increase in working capital, contributed to this figure.
At the end of fiscal 2017, gross debt stood at €955.0 million relative to €547.9 million in fiscal 2016 and is comprised of liabilities to banks, including note loans (“Schuldscheindarlehen”), as well as liabilities from finance leases. The year-over-year increase is essentially attributable to the acquisitions of Umetrics and Essen BioScience, which were refinanced by placement of a note loan. Net debt, defined as gross debt less cash and cash equivalents, rose from €485.9 million a year ago to €895.5 million.
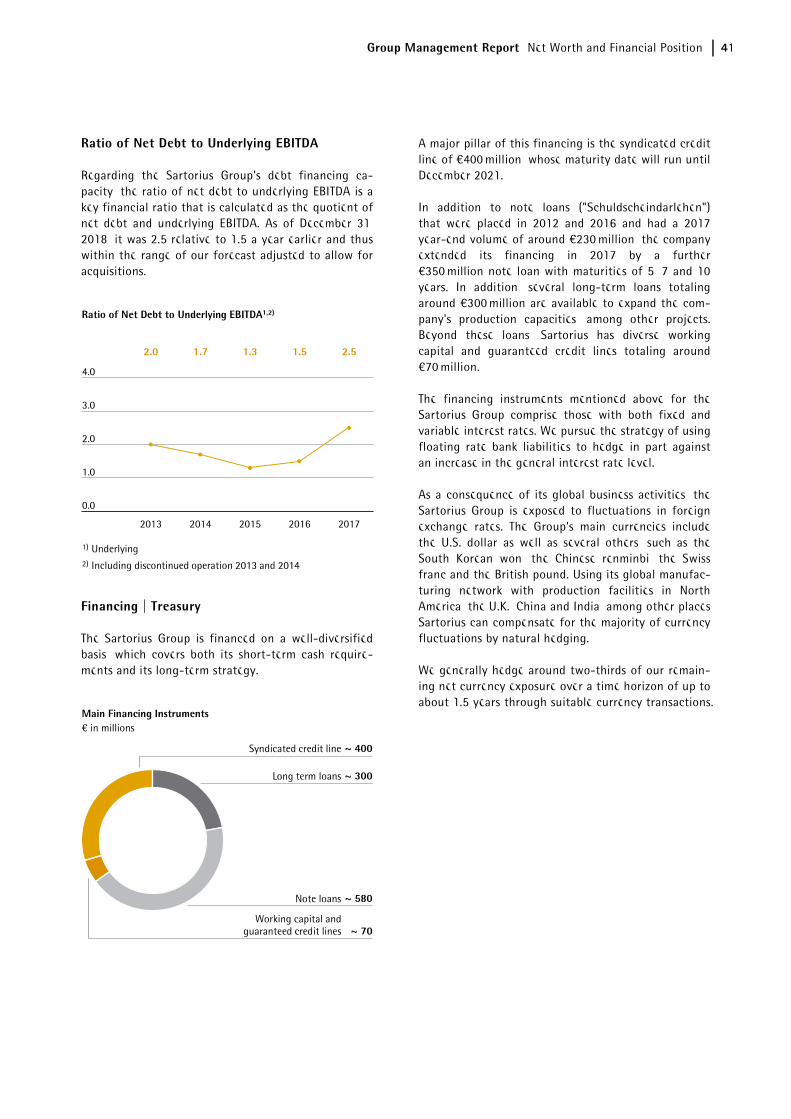
Group Management Report Net Worth and Financial Position 41
Ratio of Net Debt to Underlying EBITDA
Regarding the Sartorius Group's debt financing ca-pacity, the ratio of net debt to underlying EBITDA is a key financial ratio that is calculated as the quotient of net debt and underlying EBITDA. As of December 31, 2018, it was 2.5 relative to 1.5 a year earlier and thus within the range of our forecast adjusted to allow for acquisitions.
Financing | Treasury
The Sartorius Group is financed on a well-diversified basis, which covers both its short-term cash require-ments and its long-term strategy.
A major pillar of this financing is the syndicated credit line of €400 million, whose maturity date will run until December 2021.
In addition to note loans ("Schuldscheindarlehen") that were placed in 2012 and 2016 and had a 2017 year-end volume of around €230 million, the company extended its financing in 2017 by a further €350 million note loan with maturities of 5, 7 and 10 years. In addition, several long-term loans totaling around €300 million are available to expand the com-pany's production capacities, among other projects. Beyond these loans, Sartorius has diverse working capital and guaranteed credit lines totaling around €70 million.
The financing instruments mentioned above for the Sartorius Group comprise those with both fixed and variable interest rates. We pursue the strategy of using floating rate bank liabilities to hedge in part against an increase in the general interest rate level.
As a consequence of its global business activities, the Sartorius Group is exposed to fluctuations in foreign exchange rates. The Group’s main currencies include the U.S. dollar as well as several others, such as the South Korean won, the Chinese renminbi, the Swiss franc and the British pound. Using its global manufac-turing network with production facilities in North America, the U.K., China and India, among other places, Sartorius can compensate for the majority of currency fluctuations by natural hedging.
We generally hedge around two-thirds of our remain-ing net currency exposure over a time horizon of up to about 1.5 years through suitable currency transactions.
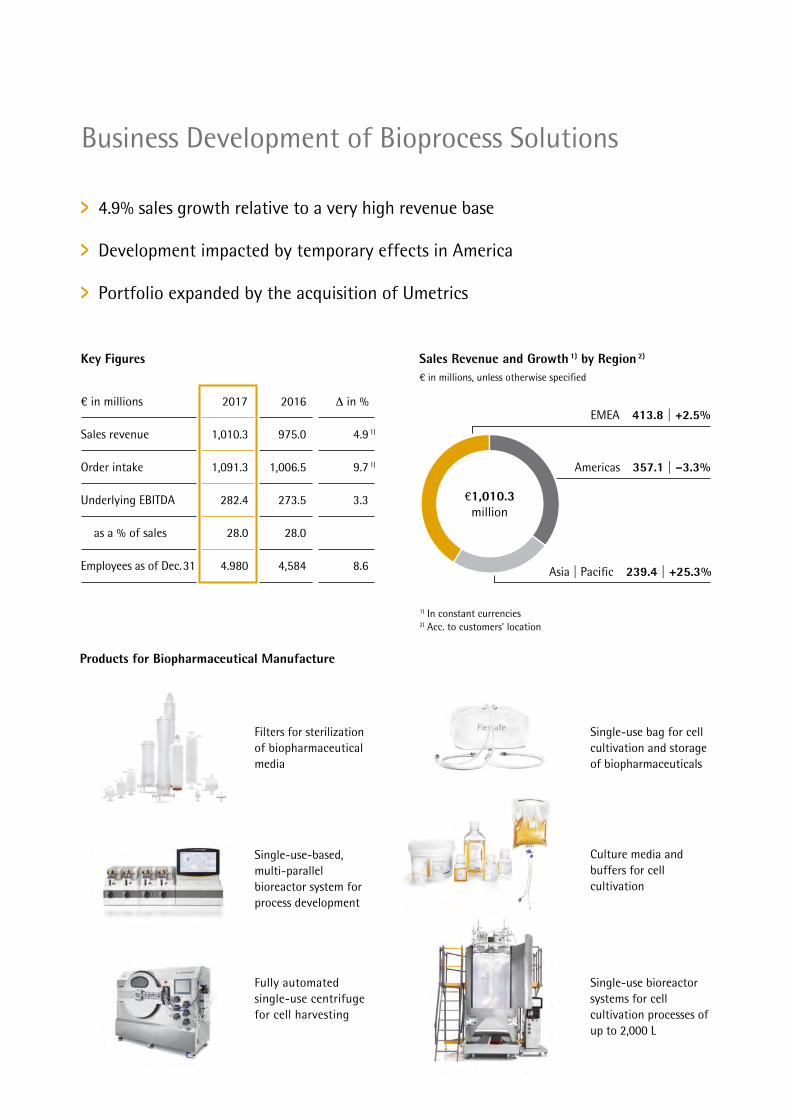
Filters for sterilization of biopharmaceutical media
Business Development of Bioprocess Solutions
4.9% sales growth relative to a very high revenue base
Development impacted by temporary effects in America
Portfolio expanded by the acquisition of Umetrics
Sales Revenue and Growth 1) by Region 2)
EMEA 413.8 | +2.5%
Asia | Pacific 239.4 | +25.3%
Americas 357.1 | –3.3%
¤ in millions, unless otherwise specified
¤ in millions 2017 2016 Δ D in %
Sales revenue 1,010.3 975.0 4.9 1)
Order intake 1,091.3 1,006.5 9.7 1)
Underlying EBITDA 282.4 273.5 3.3
as a % of sales 28.0 28.0
Employees as of Dec. 31 4.980 4,584 8.6
Key Figures
Single-use bag for cell cultivation and storage of biopharmaceuticals
Single-use bioreactor systems for cell cultivation processes of up to 2,000 L
Culture media and buffers for cell cultivation
Products for Biopharmaceutical Manufacture
Fully automated single-use centrifuge for cell harvesting
Single-use-based, multi-parallel bioreactor system for process development
€1,010.3 million
1) In constant currencies2) Acc. to customers’ location
e-GB2017-Konzern-Sparteneinstiegsseiten.indd 1 15.02.18 15:50
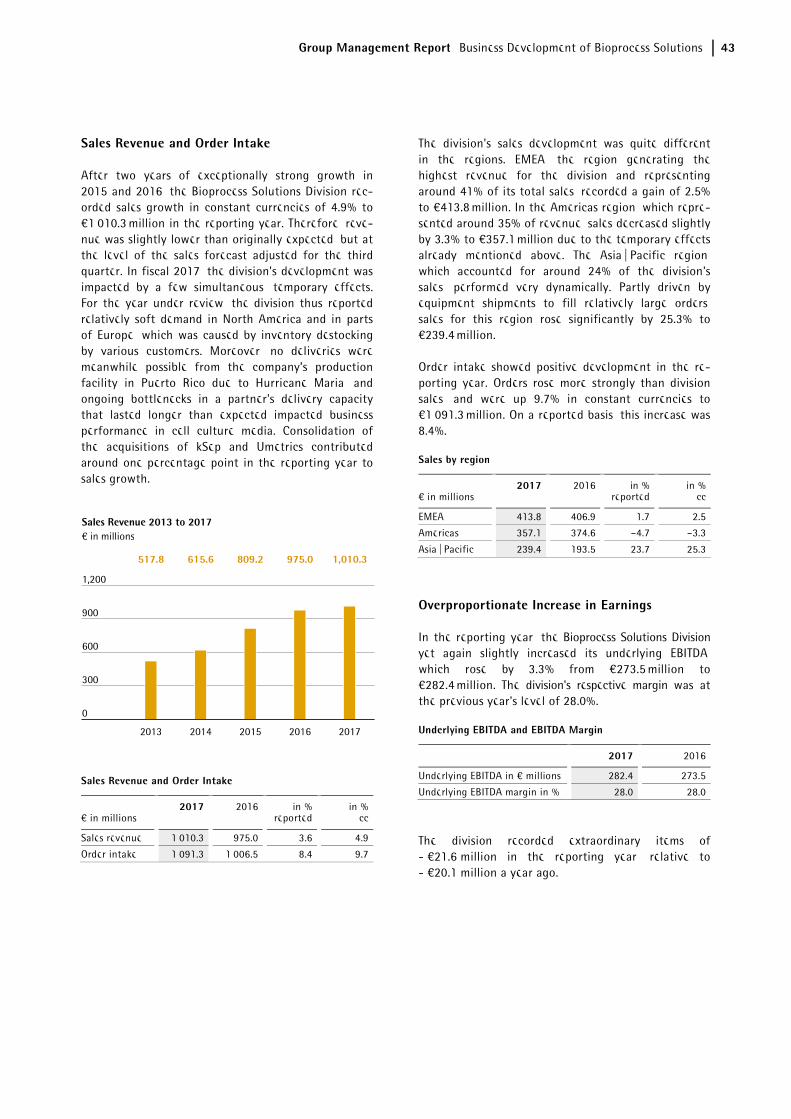
Group Management Report Business Development of Bioprocess Solutions 43
Sales Revenue and Order Intake
After two years of exceptionally strong growth in 2015 and 2016, the Bioprocess Solutions Division rec-orded sales growth in constant currencies of 4.9% to €1,010.3 million in the reporting year. Therefore, reve-nue was slightly lower than originally expected, but at the level of the sales forecast adjusted for the third quarter. In fiscal 2017, the division's development was impacted by a few simultaneous, temporary effects. For the year under review, the division thus reported relatively soft demand in North America and in parts of Europe, which was caused by inventory destocking by various customers. Moreover, no deliveries were meanwhile possible from the company’s production facility in Puerto Rico due to Hurricane Maria, and ongoing bottlenecks in a partner's delivery capacity that lasted longer than expected impacted business performance in cell culture media. Consolidation of the acquisitions of kSep and Umetrics contributed around one percentage point in the reporting year to sales growth.
Sales Revenue and Order Intake
€ in millions 2017 2016 in %
reportedin %
cc
Sales revenue 1,010.3 975.0 3.6 4.9
Order intake 1,091.3 1,006.5 8.4 9.7
The division's sales development was quite different in the regions. EMEA, the region generating the highest revenue for the division and representing around 41% of its total sales, recorded a gain of 2.5% to €413.8 million. In the Americas region, which repre-sented around 35% of revenue, sales decreased slightly by 3.3% to €357.1 million due to the temporary effects already mentioned above. The Asia | Pacific region, which accounted for around 24% of the division's sales, performed very dynamically. Partly driven by equipment shipments to fill relatively large orders, sales for this region rose significantly by 25.3% to €239.4 million.
Order intake showed positive development in the re-porting year. Orders rose more strongly than division sales, and were up 9.7% in constant currencies to €1,091.3 million. On a reported basis, this increase was 8.4%.
Sales by region
€ in millions 2017 2016 in %
reportedin %
cc
EMEA 413.8 406.9 1.7 2.5
Americas 357.1 374.6 –4.7 –3.3
Asia | Pacific 239.4 193.5 23.7 25.3
Overproportionate Increase in Earnings
In the reporting year, the Bioprocess Solutions Division yet again slightly increased its underlying EBITDA, which rose by 3.3% from €273.5 million to €282.4 million. The division's respective margin was at the previous year's level of 28.0%.
Underlying EBITDA and EBITDA Margin
2017 2016
Underlying EBITDA in € millions 282.4 273.5
Underlying EBITDA margin in % 28.0 28.0
The division recorded extraordinary items of - €21.6 million in the reporting year, relative to - €20.1 million a year ago.
44 Group Management Report Business Development of Bioprocess Solutions
Product and Sales
The product portfolio of the Bioprocess Solutions Division covers virtually all steps in biopharmaceutical production process, and increasingly its upstream process development as well. The portfolio includes cell culture media, cell lines, bioreactors, a wide range of products for separation, purification and concen-tration, and systems for the storage and transport of intermediate and finished biological products. We also offer an extensive range of services to support our customers in complying with regulatory requirements.
Well-Developed Portfolio Supports Customers
The Bioprocess Solutions Division expanded its portfo-lio in the reporting year via product upgrades and new generations of existing product lines as well as through the acquisition of Umetrics.
Furthermore, Umetrics provides software solutions that enable biopharmaceutical customers to increase efficiency as well as assisting them in digitalizing their processes, especially during scale-up.
In the product area, Sartorius presented the second generation of its BIOSTAT STR single-use bioreactor series in the year under review. The second generation is designed for the new single-use bags and can han-dle a working volume of 12.5 to 2,000 liters. The scala-ble series saves customers a significant amount of time in developing production processes.
In addition, a newly developed single-use system of-fers users an innovative, comprehensive solution for the filtration of biopharmaceutical media on a large scale. The new system makes filtration processes even easier and less time consuming.
The area of membrane chromatography was expanded as well. Now also available as cassettes, membrane adsorbers can be combined on a large scale to form a production system for the purification of biopharma-ceutical media, thus eliminating the previous limita-tions inherent in the smaller sizes.
Sales Activities Expanded
The Bioprocess Solutions Division markets its product portfolio directly through its own field sales repre-sentatives. Sales activities for key accounts are coordi-nated and supported by global key account management. As part of our regional initiatives for implementing our mid-term strategy, we stepped up our sales activities in North America during the year under review.
Research and Development
The Division’s research and development (R&D) activi-ties encompass both new and advanced in-house product developments in our own core technologies as well as the integration of new products through alli-ances and acquisitions. Sartorius aims to help custom-ers continually optimize their processes and steadily increase their efficiency.
Development activities at Sartorius focus in particular on the following technology areas: membranes, which are the core component of all types of filter products; various base technologies such as single-use contain-ers and sensors; and control technologies, for instance for fermentation.
During the reporting year, one focus of the R&D activ-ities was the development of a new software platform for the control of individual process steps. It enables the generation of consistent data in real time for optimized monitoring and control of both upstream and downstream processes from laboratory scale all the way to commercial production.
Another key task is ongoing integration of the soft-ware portfolio acquired in the takeover of Umetrics. Even prior to the acquisition, Sartorius had already spent several years working with Umetrics data analysis specialists for the purpose of modeling and optimizing biopharmaceutical development and production processes. Additional data-based software analysis tools are planned for the future to enable customers to work more efficiently and cost-effectively.
From a regional perspective, the largest R&D site is located at our headquarters in Göttingen, with other key R&D activities taking place in Aubagne (France) Guxhagen (Germany) and Bangalore (India) as well as Bohemia (USA), Royston (UK) and Umeå (Sweden).
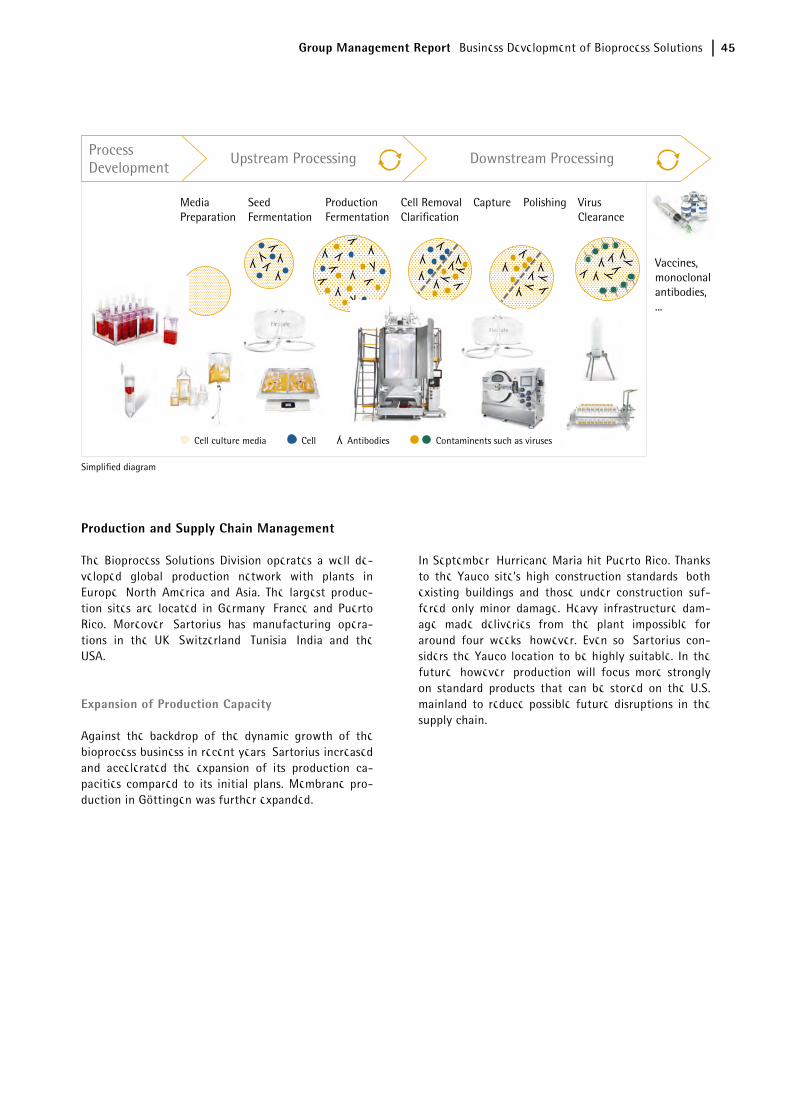
Group Management Report Business Development of Bioprocess Solutions 45
Production and Supply Chain Management
The Bioprocess Solutions Division operates a well de-veloped global production network with plants in Europe, North America and Asia. The largest produc-tion sites are located in Germany, France and Puerto Rico. Moreover, Sartorius has manufacturing opera-tions in the UK, Switzerland, Tunisia, India and the USA.
Expansion of Production Capacity
Against the backdrop of the dynamic growth of the bioprocess business in recent years, Sartorius increased and accelerated the expansion of its production ca-pacities compared to its initial plans. Membrane pro-duction in Göttingen was further expanded.
In September, Hurricane Maria hit Puerto Rico. Thanks to the Yauco site’s high construction standards, both existing buildings and those under construction suf-fered only minor damage. Heavy infrastructure dam-age made deliveries from the plant impossible for around four weeks, however. Even so, Sartorius con-siders the Yauco location to be highly suitable. In the future, however, production will focus more strongly on standard products that can be stored on the U.S. mainland to reduce possible future disruptions in the supply chain.
Process Development
Upstream Processing Downstream Processing
Media Preparation
Seed Fermentation
Production Fermentation
Cell Removal Clarification
Capture Polishing Virus Clearance
y
y
y y
y y
y
y y
y
y y
y y y
y y
Simplified diagram
Cell culture media Cell
y
Antibodies Contaminents such as viruses
Vaccines, monoclonal antibodies, ...
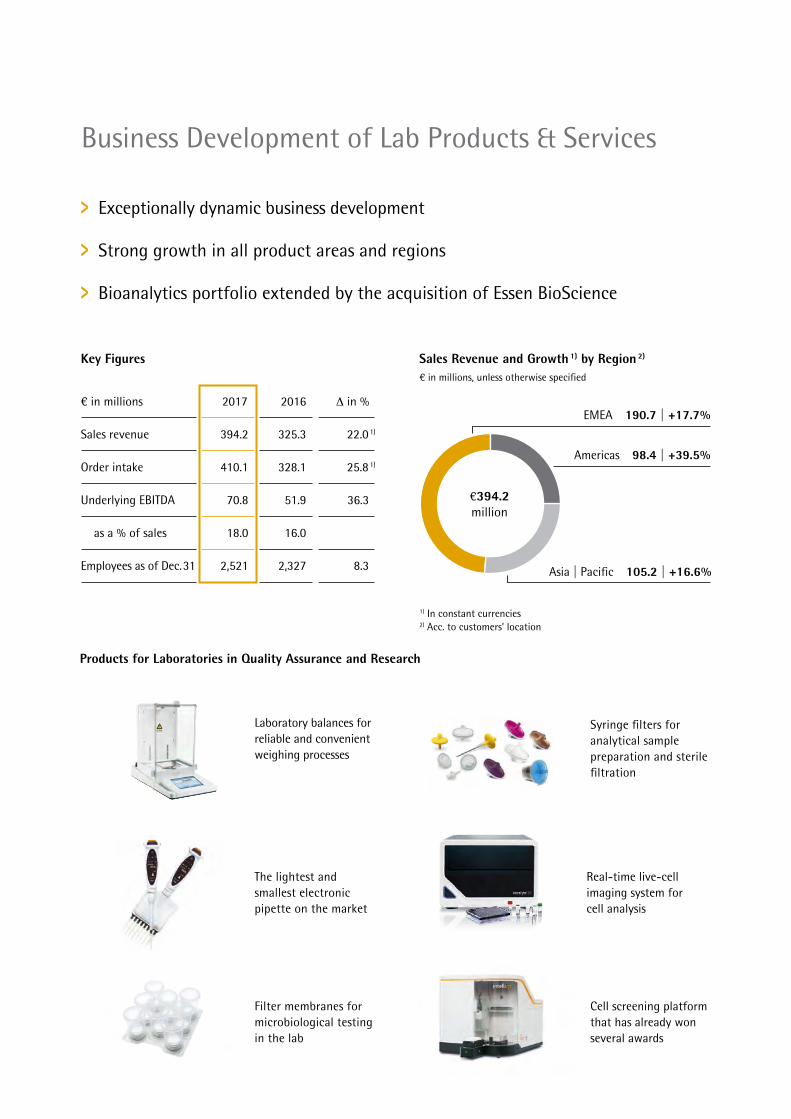
Laboratory balances for reliable and convenient weighing processes
The lightest and smallest electronic pipette on the market
Filter membranes for microbiological testing in the lab
Business Development of Lab Products & Services
Exceptionally dynamic business development
Strong growth in all product areas and regions
Bioanalytics portfolio extended by the acquisition of Essen BioScience
Sales Revenue and Growth 1) by Region 2)
EMEA 190.7 | +17.7%
Asia | Pacific 105.2 | +16.6%
Americas 98.4 | +39.5%
¤ in millions, unless otherwise specified
¤ in millions 2017 2016 Δ D in %
Sales revenue 394.2 325.3 22.0 1)
Order intake 410.1 328.1 25.8 1)
Underlying EBITDA 70.8 51.9 36.3
as a % of sales 18.0 16.0
Employees as of Dec. 31 2,521 2,327 8.3
Key Figures
Products for Laboratories in Quality Assurance and Research
Syringe filters for analytical sample preparation and sterile filtration
Cell screening platform that has already won several awards
Real-time live-cell imaging system for cell analysis
€394.2 million
1) In constant currencies2) Acc. to customers’ location
e-GB2017-Konzern-Sparteneinstiegsseiten.indd 2 15.02.18 15:51
Group Management Report Business Development of Lab Products & Services 47
Sales Revenue and Order Intake
In the reporting year, the Lab Products & Services Division recorded a substantial increase in sales reve-nue by 22.0% to €394.2 million. The division's portfolio expansion into bioanalytics by the acquisition of Essen BioScience at the end of March 2017, as well as of IntelliCyt and ViroCyt in 2016 contributed close to 14 percentage points to this increase. Driven by strong demand in all regions and in all product areas, organic growth for the division was around 8%. Therefore, sales development was within the range of the com-pany's forecast that was adjusted in April 2017 due to its acquisitions.
Sales Revenue and Order Intake
€ in millions 2017 2016 in %
reportedin %
cc
Sales revenue 394.2 325.3 21.2 22.0
Order intake 410.1 328.1 25.0 25.8
In EMEA, the region contributing the highest share of revenue of around 48%, the division achieved a 17.8% increase in sales to €190.7 million. The Americas region, whose share of revenue rose to around 25%, reported the highest growth dynamics due to the acquisition of Essen BioScience, recording an uptick of 39.5% in sales to €98.4 million. Besides the division's excellent organ-ic performance, the acquisitions previously mentioned contributed an above-average proportion to the re-gion's growth. The Asia | Pacific region, which accounts for a good 27% of business for the Lab Products & Services Division, reported a double-digit gain of 16.6% to €105.2 million.
During the reporting period, order intake showed especially encouraging development and grew to €410.1 million at a considerably stronger rate, 25.8%, than did the division's sales revenue. On a reported basis, this growth rate was 25.0%.
Sales by region
€ in millions 2017 2016 in %
reportedin %
cc
EMEA 190.7 162.2 17.6 17.7
Americas 98.4 70.8 39.0 39.5
Asia | Pacific 105.2 92.3 14.0 16.6
Earnings
The Lab Products & Services Division increased its un-derlying EBITDA in the reporting period by 36.3%, from €51.9 million a year ago to €70.8 million, which was due to economies of scale in connection with the division's strong organic growth, as well as to growth contributed by its acquisitions. Despite unfavorable currency effects, the division’s corresponding margin improved from 16.0% in the previous year to 18.0%. This increase was likewise attributable to economies of scale related to strong organic growth as well as growth contributed by acquisitions.
Underlying EBITDA and EBITDA Margin
2017 2016
Underlying EBITDA in € millions 70.8 51.9
Underlying EBITDA margin in % 18.0 16.0
The division recorded extraordinary items of -€13.9 million in the reporting year relative to -€10.6 million a year ago.
48 Group Management Report Business Development of Lab Products & Services
Products and Sales
The Lab Products & Services Division focuses on both research laboratories and quality assurance laborato-ries in the pharmaceutical and biopharmaceutical sectors, as well as on academic research institutes.
Significant additions were made to the division’s port-folio in the area of bioanalytics in the year under review. The remaining product portfolio is used espe-cially for sample preparation and other standard appli-cations, and includes instruments such as laboratory balances, pipettes and bioreactors, in addition to con-sumables like laboratory filters and microbiological tests. Extensive services round out the portfolio.
The division sells its products through three channels: laboratory dealers, direct sales and e-business. The dealer sales channel is already well established; direct sales and the digital channels are being expanded continually.
Expanded Bioanalytics Portfolio
Sartorius significantly extended its expertise in the field of bioanalytics through the acquisition of Essen BioScience, which further improves the company’s positioning among biopharmaceutical customers and life science research institutes in particular. The acqui-sition will lead to growing synergies between the Lab Products & Services and Bioprocess Solutions divisions.
Essen BioScience offers a platform consisting of in-struments, software and reagents for fully automated, real-time analysis and visual depiction of biological processes using high-resolution imaging. The data obtained provides new insight and understanding into the mechanisms of healthy and diseased cells, which helps to significantly accelerate the often time-consuming development process for new substances.
Range of Services and Test Laboratories in All Regions
The Lab Products & Services Division offers a wide range of services covering the entire life cycle of la-boratory products, from device installation and com-missioning to verification, calibration, regular maintenance and repair. Our services are not limited to Sartorius instruments; they are offered for devices from other manufacturers as well. This extensive range enables our customers to minimize the number of service providers they use and to reduce complexity and costs.
Our application laboratories in all regions offer cus-tomers the opportunity to test Sartorius products, even using their own samples, and to take training courses.
Growing Importance of Bioanalytics
Sartorius enjoys a strong presence in the lab market in essential product areas, but for historical reasons, its market share varies by product group and region. This situation offers significant potential for growth. In particular, the company’s products in the area of bio-analytics offer strong unique selling points. We aim to use our global sales platform to accelerate the pene-tration of these technologies across the laboratory market.
However, ongoing improvements in sales efficiency are just as important as expanded sales structures. The Lab Products & Service Division is also benefiting from the customer access established for biopharmaceutical customers by the Bioprocess Solutions Division.
Group Management Report Business Development of Lab Products & Services 49
Research and Development
Within the scope of its laboratory business, Sartorius has extensive technological expertise in the area of laboratory instruments and laboratory consumables. A further technology focus is bioanalytics.
Most of the division’s R&D takes place centrally at the Göttingen site, but additional R&D activities are pur-sued at our facilities in Helsinki, Stonehouse, Ann Arbor and Albuquerque.
Products and services from Sartorius help users make laboratory processes more productive, efficient as well as safer. Compliance with regulatory requirements is critical. Product development priorities for Sartorius therefore include data management, connectivity and process automation.
As part of its increasing focus on the biopharmaceuti-cal sector, Sartorius develops weighing technology and equipment optimized for pharmaceutical applications. In further development stages, its instruments are specially adapted to these applications, for example, by combining a comparatively high weighing capacity and exceptionally high accuracy.
For example, special software routines already guide laboratory employees through work processes and transfer measurement and process data to laboratory management systems. Intuitive user interfaces in la-boratory instruments enable safer and faster work.
Production and Supply Chain Management
The Lab Products & Services Division operates plants in Germany, China, Finland, the U.K. and the U.S. The plants serve as centers of competence and tend to focus on one product group or a small set of product groups. Laboratory balances are manufactured in Göttingen and Beijing, for example, while pipettes are made at our Helsinki and Souzhou sites. Microbio-logical tests kits are produced in Stonehouse, and most membrane-based products are manufactured in Göttingen.
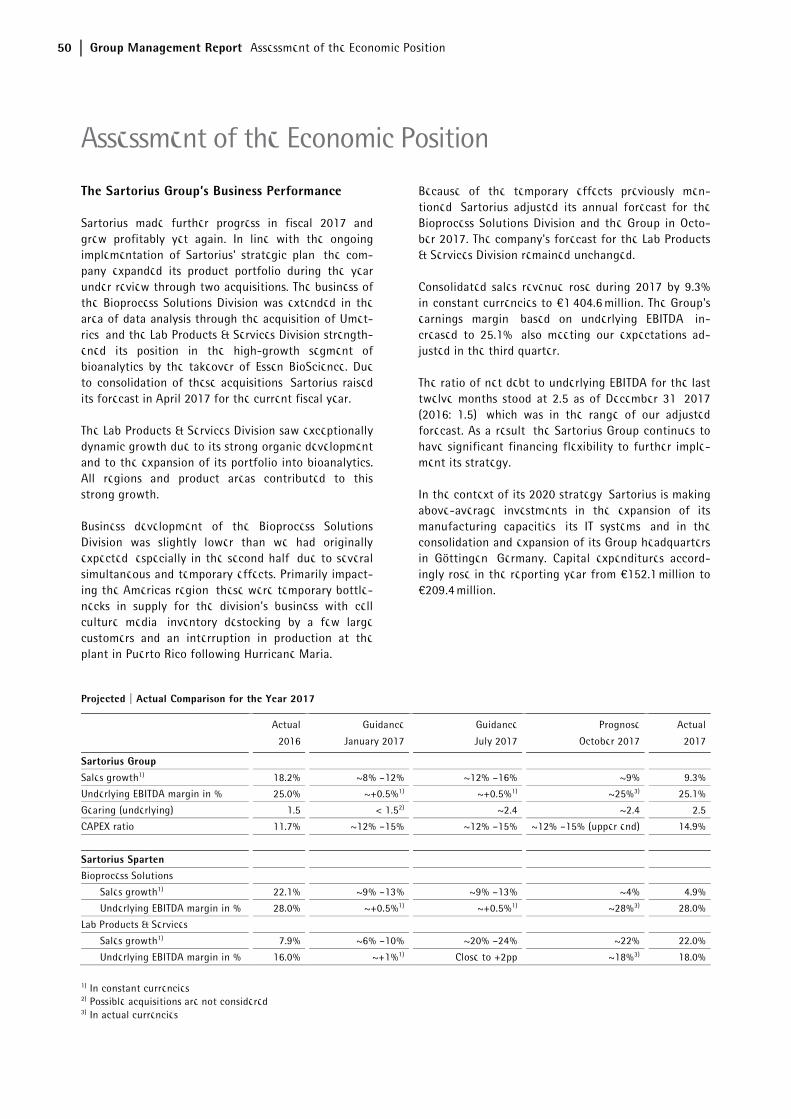
50 Group Management Report Assessment of the Economic Position
The Sartorius Group’s Business Performance
Sartorius made further progress in fiscal 2017 and grew profitably yet again. In line with the ongoing implementation of Sartorius' strategic plan, the com-pany expanded its product portfolio during the year under review through two acquisitions. The business of the Bioprocess Solutions Division was extended in the area of data analysis through the acquisition of Umet-rics, and the Lab Products & Services Division strength-ened its position in the high-growth segment of bioanalytics by the takeover of Essen BioScience. Due to consolidation of these acquisitions, Sartorius raised its forecast in April 2017 for the current fiscal year.
The Lab Products & Services Division saw exceptionally dynamic growth due to its strong organic development and to the expansion of its portfolio into bioanalytics. All regions and product areas contributed to this strong growth.
Business development of the Bioprocess Solutions Division was slightly lower than we had originally expected, especially in the second half, due to several simultaneous and temporary effects. Primarily impact-ing the Americas region, these were temporary bottle-necks in supply for the division's business with cell culture media, inventory destocking by a few large customers and an interruption in production at the plant in Puerto Rico following Hurricane Maria.
Because of the temporary effects previously men-tioned, Sartorius adjusted its annual forecast for the Bioprocess Solutions Division and the Group in Octo-ber 2017. The company's forecast for the Lab Products & Services Division remained unchanged.
Consolidated sales revenue rose during 2017 by 9.3% in constant currencies to €1,404.6 million. The Group's earnings margin, based on underlying EBITDA, in-creased to 25.1%, also meeting our expectations ad-justed in the third quarter.
The ratio of net debt to underlying EBITDA for the last twelve months stood at 2.5 as of December 31, 2017 (2016: 1.5), which was in the range of our adjusted forecast. As a result, the Sartorius Group continues to have significant financing flexibility to further imple-ment its strategy.
In the context of its 2020 strategy, Sartorius is making above-average investments in the expansion of its manufacturing capacities, its IT systems, and in the consolidation and expansion of its Group headquarters in Göttingen, Germany. Capital expenditures accord-ingly rose in the reporting year from €152.1 million to €209.4 million.
Projected | Actual Comparison for the Year 2017
Actual Guidance Guidance Prognose Actual
2016 January 2017 July 2017 October 2017 2017
Sartorius Group
Sales growth1) 18.2% ~8% –12% ~12% –16% ~9% 9.3%
Underlying EBITDA margin in % 25.0% ~+0.5%1) ~+0.5%1) ~25%3) 25.1%
Gearing (underlying) 1.5 < 1.52) ~2.4 ~2.4 2.5
CAPEX ratio 11.7% ~12% –15% ~12% –15% ~12% –15% (upper end) 14.9%
Sartorius Sparten Bioprocess Solutions
Sales growth1) 22.1% ~9% –13% ~9% –13% ~4% 4.9%
Underlying EBITDA margin in % 28.0% ~+0.5%1) ~+0.5%1) ~28%3) 28.0%
Lab Products & Services
Sales growth1) 7.9% ~6% –10% ~20% –24% ~22% 22.0%
Underlying EBITDA margin in % 16.0% ~+1%1) Close to +2pp ~18%3) 18.0%
1) In constant currencies 2) Possible acquisitions are not considered 3) In actual currencies
Assessment of the Economic Position
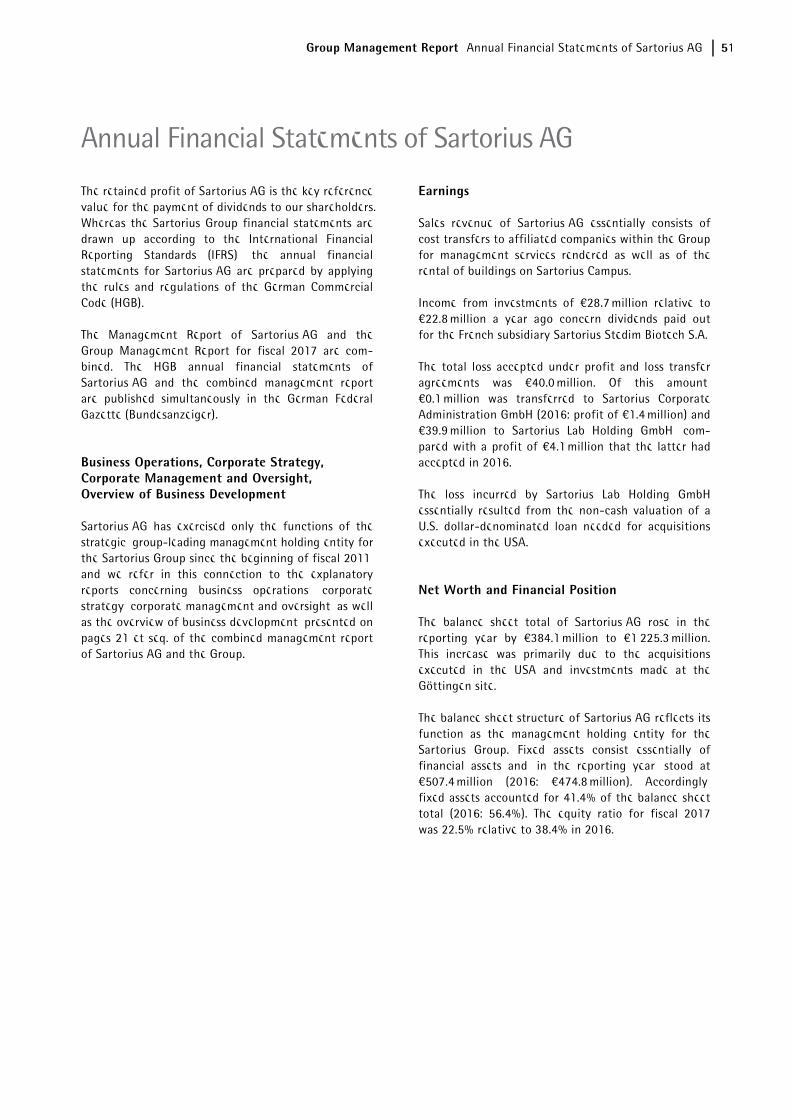
Group Management Report Annual Financial Statements of Sartorius AG 51
The retained profit of Sartorius AG is the key reference value for the payment of dividends to our shareholders. Whereas the Sartorius Group financial statements are drawn up according to the International Financial Reporting Standards (IFRS), the annual financial statements for Sartorius AG are prepared by applying the rules and regulations of the German Commercial Code (HGB).
The Management Report of Sartorius AG and the Group Management Report for fiscal 2017 are com-bined. The HGB annual financial statements of Sartorius AG and the combined management report are published simultaneously in the German Federal Gazette (Bundesanzeiger).
Business Operations, Corporate Strategy, Corporate Management and Oversight, Overview of Business Development
Sartorius AG has exercised only the functions of the strategic, group-leading management holding entity for the Sartorius Group since the beginning of fiscal 2011, and we refer in this connection to the explanatory reports concerning business operations, corporate strategy, corporate management and oversight, as well as the overview of business development, presented on pages 21 et seq. of the combined management report of Sartorius AG and the Group.
Earnings
Sales revenue of Sartorius AG essentially consists of cost transfers to affiliated companies within the Group for management services rendered as well as of the rental of buildings on Sartorius Campus.
Income from investments of €28.7 million relative to €22.8 million a year ago concern dividends paid out for the French subsidiary Sartorius Stedim Biotech S.A.
The total loss accepted under profit and loss transfer agreements was €40.0 million. Of this amount, €0.1 million was transferred to Sartorius Corporate Administration GmbH (2016: profit of €1.4 million) and €39.9 million to Sartorius Lab Holding GmbH, com-pared with a profit of €4.1 million that the latter had accepted in 2016.
The loss incurred by Sartorius Lab Holding GmbH essentially resulted from the non-cash valuation of a U.S. dollar-denominated loan needed for acquisitions executed in the USA.
Net Worth and Financial Position
The balance sheet total of Sartorius AG rose in the reporting year by €384.1 million to €1,225.3 million. This increase was primarily due to the acquisitions executed in the USA and investments made at the Göttingen site.
The balance sheet structure of Sartorius AG reflects its function as the management holding entity for the Sartorius Group. Fixed assets consist essentially of financial assets and, in the reporting year, stood at €507.4 million (2016: €474.8 million). Accordingly, fixed assets accounted for 41.4% of the balance sheet total (2016: 56.4%). The equity ratio for fiscal 2017 was 22.5% relative to 38.4% in 2016.
Annual Financial Statements of Sartorius AG
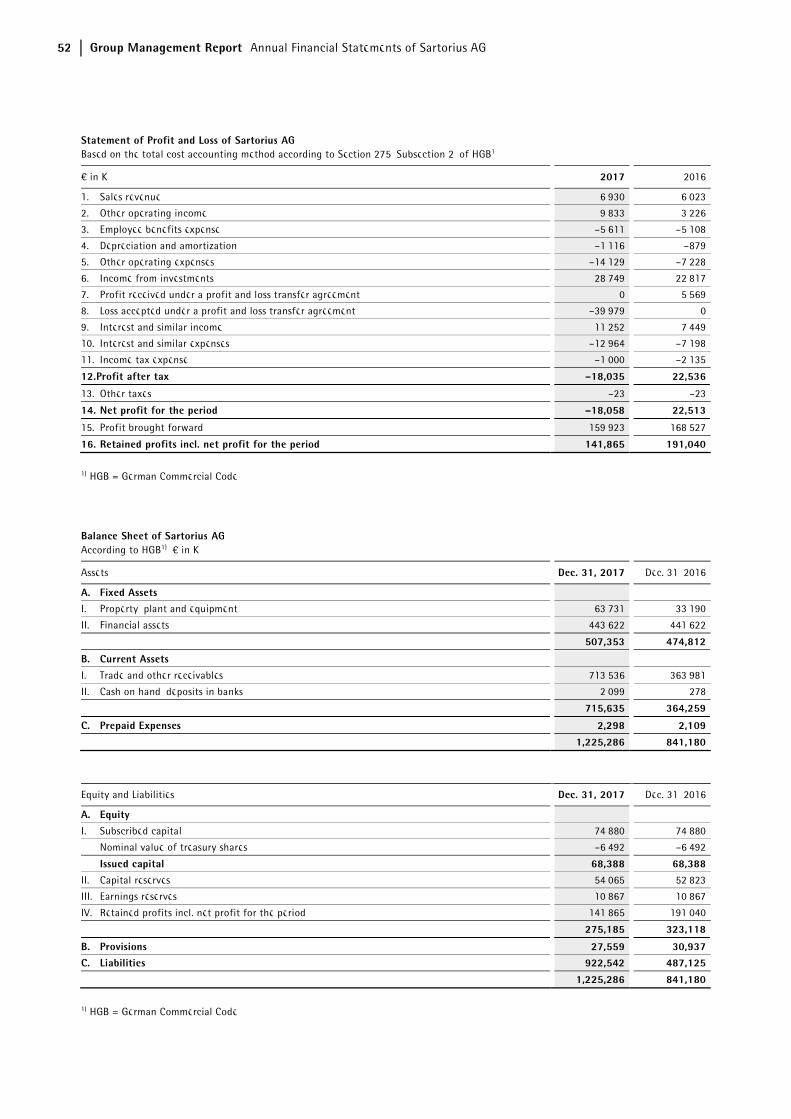
52 Group Management Report Annual Financial Statements of Sartorius AG
Statement of Profit and Loss of Sartorius AGBased on the total cost accounting method according to Section 275, Subsection 2, of HGB1
€ in K 2017 2016
1. Sales revenue 6,930 6,023
2. Other operating income 9,833 3,226
3. Employee benefits expense –5,611 –5,108
4. Depreciation and amortization –1,116 –879
5. Other operating expenses –14,129 –7,228
6. Income from investments 28,749 22,817
7. Profit received under a profit and loss transfer agreement 0 5,569
8. Loss accepted under a profit and loss transfer agreement –39,979 0
9. Interest and similar income 11,252 7,449
10. Interest and similar expenses –12,964 –7,198
11. Income tax expense –1,000 –2,135
12. Profit after tax –18,035 22,536
13. Other taxes –23 –23
14. Net profit for the period –18,058 22,513
15. Profit brought forward 159,923 168,527
16. Retained profits incl. net profit for the period 141,865 191,040
1) HGB = German Commercial Code
Balance Sheet of Sartorius AGAccording to HGB1), € in K
Assets Dec. 31, 2017 Dec. 31, 2016
A. Fixed Assets I. Property, plant and equipment 63,731 33,190
II. Financial assets 443,622 441,622
507,353 474,812
B. Current Assets
I. Trade and other receivables 713,536 363,981
II. Cash on hand, deposits in banks 2,099 278
715,635 364,259
C. Prepaid Expenses 2,298 2,109
1,225,286 841,180
Equity and Liabilities Dec. 31, 2017 Dec. 31, 2016
A. Equity
I. Subscribed capital 74,880 74,880
Nominal value of treasury shares –6,492 –6,492
Issued capital 68,388 68,388II. Capital reserves 54,065 52,823
III. Earnings reserves 10,867 10,867
IV. Retained profits incl. net profit for the period 141,865 191,040
275,185 323,118
B. Provisions 27,559 30,937C. Liabilities 922,542 487,125
1,225,286 841,180
1) HGB = German Commercial Code
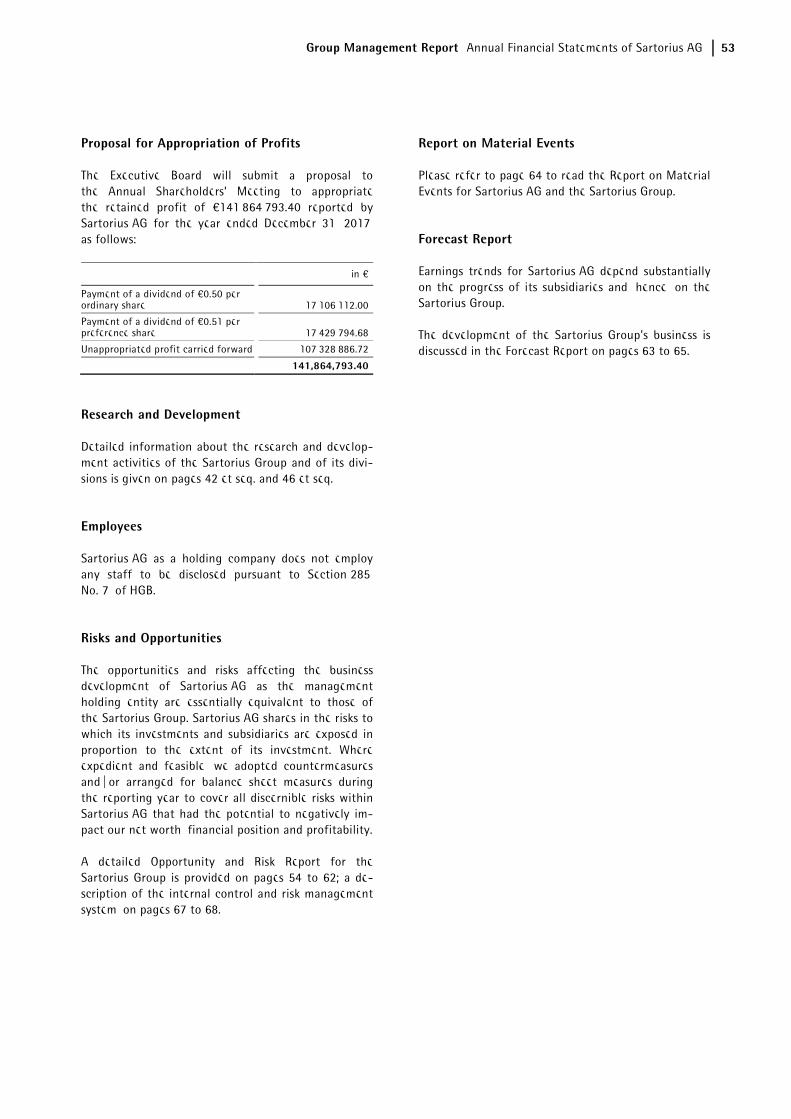
Group Management Report Annual Financial Statements of Sartorius AG 53
Proposal for Appropriation of Profits
The Executive Board will submit a proposal to the Annual Shareholders’ Meeting to appropriate the retained profit of €141,864,793.40 reported by Sartorius AG for the year ended December 31, 2017, as follows:
in €
Payment of a dividend of €0.50 per ordinary share 17,106,112.00
Payment of a dividend of €0.51 per preference share 17,429,794.68
Unappropriated profit carried forward 107,328,886.72
141,864,793.40
Research and Development
Detailed information about the research and develop-ment activities of the Sartorius Group and of its divi-sions is given on pages 42 et seq. and 46 et seq.
Employees
Sartorius AG as a holding company does not employ any staff to be disclosed pursuant to Section 285, No. 7, of HGB.
Risks and Opportunities
The opportunities and risks affecting the business development of Sartorius AG as the management holding entity are essentially equivalent to those of the Sartorius Group. Sartorius AG shares in the risks to which its investments and subsidiaries are exposed in proportion to the extent of its investment. Where expedient and feasible, we adopted countermeasures and | or arranged for balance sheet measures during the reporting year to cover all discernible risks within Sartorius AG that had the potential to negatively im-pact our net worth, financial position and profitability.
A detailed Opportunity and Risk Report for the Sartorius Group is provided on pages 54 to 62; a de-scription of the internal control and risk management system, on pages 67 to 68.
Report on Material Events
Please refer to page 64 to read the Report on Material Events for Sartorius AG and the Sartorius Group.
Forecast Report
Earnings trends for Sartorius AG depend substantially on the progress of its subsidiaries and, hence, on the Sartorius Group.
The development of the Sartorius Group's business is discussed in the Forecast Report on pages 63 to 65.
54 Group Management Report Opportunity and Risk Report
Principles
Every business activity entails opportunities and risks, which have to be managed. The skill with which this is done goes a long way in determining the future devel-opment of a company's shareholder value. The central element of risk management is systematic identifica-tion and realization of opportunities, as well as avoid-ance of risks that could jeopardize the success of the company.
In managing risks and opportunities, Sartorius aims to identify and use business opportunities systematically, as well as to recognize and evaluate risks at an early stage and take measures to counter them where possi-ble. It is not the task of risk management to eliminate all risks: rather, our approach is to intentionally to take a certain measure of risk in our business activities in order to be successful in unlocking opportunities. However, in this endeavor, it is important to keep risks contained within acceptable limits and to control them carefully. Through appropriate guidelines, we ensure that risk assessments are taken into account in the decision-making processes from the very beginning.
Sartorius has no single organizational unit tasked with identifying and managing opportunities and risks. Instead, it prefers to make this a cross-functional component of Group management. To this extent, our risk management organization reflects a global func-tional matrix organization in which individuals head-ing a functional area, so-called "risk owners," are each responsible for their own management of opportuni-ties and risks. The Finance & Controlling department is responsible for the organization of the respective reporting process, including the further development of the Group's risk management system.
Managing Opportunities
Our opportunity management centers on the analysis of target markets and sector environments, as well as the assessment of trends, both of which give strong indications as to future business opportunities. The identification of the potential for development in this context is one of the key roles of the relevant manag-ers and initially takes place at the local rather than the central level. The market-facing functions, such as strategic marketing and product management in the individual divisions, play a leading role in this respect. The central Business Development unit additionally supports these areas with market monitoring, data analysis and the implementation of strategic projects.
As part of strategy reviews, the members of the Group Executive Committee regularly meet with the manag-ers having operational responsibility and with the Business Development unit to discuss short-, medium- and long-term opportunity potential for the various business areas. The subsequent steps of prioritizing the opportunities and evaluating them from a business management perspective, deriving strategic measures and allocating resources proceed in accordance with a standardized decision-making process that applies throughout the Group. If the opportunities are short-term in nature, they are considered in annual budget planning. Medium- and longer-term opportunities are tracked systematically as part of strategic planning. The status of opportunity management as a permanent fixture of the corporate management system means that it also features in the discussions and decision-making processes of top-level management, such as the Executive Board and the Supervisory Board.
Key areas of opportunity are presented below. Where appropriate, reference is made to the relevant section of the Group Management Report in order to avoid repetition. Most of the risks we describe in the section on specific risks represent opportunities, should events develop in the opposite, positive direction. For this reason, we discuss these opportunities in the section on specific risks and opportunities at the end of this chapter.
Areas of Opportunity
As a supplier for the pharmaceutical and laboratory industries, Sartorius operates in future-oriented and high-growth sectors. The significant opportunities generated by the various market and technology trends are described in detail in the sections entitled "Sector Conditions" and "Outlook for the Sectors" on pages 29 and 63, respectively.
Our assessments rank the company as one of the glob-al market leaders in many subsegments and product areas. We believe the high quality of our products, our strong brand recognition and our established customer relationships give us strong opportunities to continue extending our market leadership. The corresponding division strategies and the growth opportunities and initiatives based on them are discussed in the section on the strategy of the Bioprocess Solutions Division, which begins on page 25, and in the section on the strategy of the Lab Products & Services Division, which starts on page 26.
Opportunity and Risk Report
Group Management Report Opportunity and Risk Report 55
Strict management of processes and costs provides opportunities to further increase our profitability. Key target areas in this respect include continued en-hancements of our procurement chain and ongoing efforts to optimize production, which we present on pages 45 and 49.
Other opportunities are discussed in the context of the presentation of specific risks and opportunities begin-ning on page 56.
Risk Management
Just as for opportunity management, overall responsi-bility for the maintenance of an effective risk man-agement system ensuring comprehensive and consistent management of all material risks rests with the Executive Board. Coordinating and developing this system and combined risk reporting are the responsi-bilities of the Finance & Controlling department, while the particular functional areas are responsible for identifying and reporting risks, as well as for assessing their potential impact and for taking the appropriate countermeasures.
The Supervisory Board of Sartorius AG monitors the effectiveness of the risk management system, with the preparatory work necessary for it to do so being per-formed by the Audit Committee of this board. Fur-thermore, while carrying out their statutory audit mandate for the annual financial statements and con-solidated financial statements, the independent audi-tors examine whether the early warning system in place is capable of prompt identification of risks that could jeopardize the future of the company.
Risk Management System and Risk Reporting
At the heart of the risk management system is the Sartorius Group Risk Management Handbook, which applies throughout the entire Group organization. The Handbook, which includes definitions of the frame-work, the structural organization, processes, risk re-porting and monitoring and control of the effectiveness of the risk management system, is based on the internationally recognized COSO standard. There are also a number of other sources that contain stipulations for handling risks, including the articles of association and rules of procedure of the Group com-panies and other internal guidelines.
The Group-wide risk reporting system forms the corner-stone of internal risk communication. The object is to make it possible to address risks in a structured, con-tinuous manner and to document them in accordance
with the relevant statutory and regulatory requirements. The strong growth of the Group over the past years and the rising demands of customers and regulators meanwhile require that we continue to adapt our guidelines and rules.
A key element of our internal communication of risks is Group-wide risk reporting. The objective of this is to enable structured, continuous tracking of risks and to document them in compliance with legal and regula-tory requirements.
The prescribed reporting process in the risk categories subsequently described establishes the rules for the ongoing review of and information on risk situations. Those responsible for functional areas at the Group subsidiaries continually review and assess their respec-tive risk situations. If any specific risks are discernible, these are documented with respect to their assessment, probability of occurrence and measures to be taken to eliminate such risks or to mitigate their impact. In addition, as soon as these risks reach defined size criteria, they are reported to the central risk manage-ment system. Appropriate insurance policies are taken out to reduce any remaining risk situations, where feasible. New organizational units joining the consoli-dated Group companies are successively integrated into our risk reporting process.
We have an urgent reporting procedure in place to ensure that when a new or emerging significant risk to our net worth, financial position and profitability is identified and estimated as involving €2.5 million or higher, the Executive Board of Sartorius AG receives all of the necessary details without undue delay.
Risk Classification
The first level of risk management relates to the four main risk categories defined by Sartorius: external risks, operating risks, financial risks and corporate govern-ance risks.
The second level consists of additional subcategories that we classify within these main categories, such as supply chain risks, sales and distribution risks, and quality risks.
We categorize risks according to the scale of their implications too, and also perform a specific evalua-tion in which all risks are assigned the value of their maximum impact at the time of risk analysis. In other words, we record the maximum risks without consider-ing the probability of occurrence or the effects of risk mitigation measures.
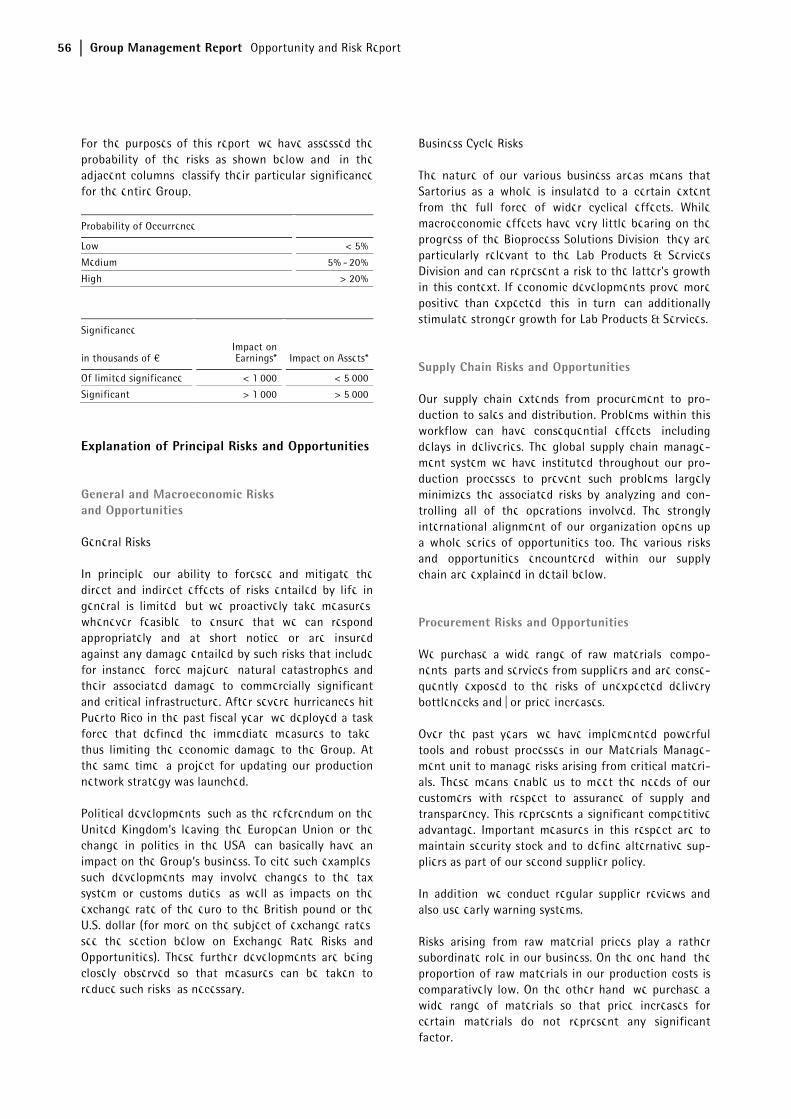
56 Group Management Report Opportunity and Risk Report
For the purposes of this report, we have assessed the probability of the risks as shown below and, in the adjacent columns, classify their particular significance for the entire Group.
Probability of Occurrence
Low < 5%
Medium 5% - 20%
High > 20%
Significance
in thousands of € Impact on Earnings* Impact on Assets*
Of limited significance < 1,000 < 5,000
Significant > 1,000 > 5,000
Explanation of Principal Risks and Opportunities
General and Macroeconomic Risks and Opportunities
General Risks
In principle, our ability to foresee and mitigate the direct and indirect effects of risks entailed by life in general is limited, but we proactively take measures, whenever feasible, to ensure that we can respond appropriately and at short notice or are insured against any damage entailed by such risks that include, for instance, force majeure, natural catastrophes and their associated damage to commercially significant and critical infrastructure. After severe hurricances hit Puerto Rico in the past fiscal year, we deployed a task force that defined the immediate measures to take, thus limiting the economic damage to the Group. At the same time, a project for updating our production network strategy was launched.
Political developments, such as the referendum on the United Kingdom’s leaving the European Union or the change in politics in the USA, can basically have an impact on the Group’s business. To cite such examples, such developments may involve changes to the tax system or customs duties, as well as impacts on the exchange rate of the euro to the British pound or the U.S. dollar (for more on the subject of exchange rates, see the section below on Exchange Rate Risks and Opportunities). These further developments are being closely observed so that measures can be taken to reduce such risks, as necessary.
Business Cycle Risks
The nature of our various business areas means that Sartorius as a whole is insulated to a certain extent from the full force of wider cyclical effects. While macroeconomic effects have very little bearing on the progress of the Bioprocess Solutions Division, they are particularly relevant to the Lab Products & Services Division and can represent a risk to the latter's growth in this context. If economic developments prove more positive than expected, this, in turn, can additionally stimulate stronger growth for Lab Products & Services.
Supply Chain Risks and Opportunities
Our supply chain extends from procurement to pro-duction to sales and distribution. Problems within this workflow can have consequential effects, including delays in deliveries. The global supply chain manage-ment system we have instituted throughout our pro-duction processes to prevent such problems largely minimizes the associated risks by analyzing and con-trolling all of the operations involved. The strongly international alignment of our organization opens up a whole series of opportunities too. The various risks and opportunities encountered within our supply chain are explained in detail below.
Procurement Risks and Opportunities
We purchase a wide range of raw materials, compo-nents, parts and services from suppliers and are conse-quently exposed to the risks of unexpected delivery bottlenecks and | or price increases.
Over the past years, we have implemented powerful tools and robust processes in our Materials Manage-ment unit to manage risks arising from critical materi-als. These means enable us to meet the needs of our customers with respect to assurance of supply and transparency. This represents a significant competitive advantage. Important measures in this respect are to maintain security stock and to define alternative sup-pliers as part of our second supplier policy.
In addition, we conduct regular supplier reviews and also use early warning systems.
Risks arising from raw material prices play a rather subordinate role in our business. On the one hand, the proportion of raw materials in our production costs is comparatively low. On the other hand, we purchase a wide range of materials so that price increases for certain materials do not represent any significant factor.
Group Management Report Opportunity and Risk Report 57
Opportunities can arise in the area of procurement when our growth enables us to increase order quanti-ties and thereby strengthen our position with our suppliers, such as by receiving price discounts or pref-erential treatment as a "preferred customer." In addi-tion, we maintain a list of preferred suppliers in parallel, which permits us to enter into long-term business relationships with key suppliers to our mutual benefit.
Increased globalization of our supplier pool holds the prospect of purchasing on more favorable terms, moreover, and there is also a possibility of our ex-panded purchasing activities in the international mar-kets leading us to identify suppliers with special product and technical expertise that could eventually enhance our own competitive edge.
Production Risks and Opportunities
Based on our core technology expertise, we ourselves manufacture a large proportion of the products that involve a high level of vertical integration. Examples include filters and laboratory balances. Other products, such as reusable fermenters and bioreactors, are man-ufactured in collaboration with suppliers so that some of the production risks are transferred to external third parties. When we manufacture products our-selves, we also bear the associated risks of capacity bottlenecks or overcapacity, production downtimes, excessive reject rates and high levels of tied-up work-ing capital, as well as dependency on individual manu-facturig sites. We contain and reduce these risks by planning production capacities carefully, using versa-tile machines, semi-automated individual workstations and flextime work schedules, and by continuously monitoring production processes. Moreover, our global manufacturing network enables us to compensate for any capacity bottlenecks by shifting production to other regional plants and to minimize our dependency on individual local manufacturing sites.
Furthermore, we have taken out policies for business interruption insurance to compensate for any possible losses due to production downtimes.
Beyond this, we work closely together with our cus-tomers to gain a better understanding of their needs and to schedule our production capacities optimally.
We consider it an opportunity that our investments in infrastructure and production resources, among other things, have given us high flexibility in our manufac-turing operations and that we are capable of meeting our customers' requirements and regulatory standards with respect to business continuity concepts. In addi-
tion, this approach ensures that our individual produc-tion sites can concentrate on specific manufacturing technologies, gaining added efficiency as a result. Our international manufacturing network also makes it possible to capitalize on the cost advantages offered by individual sites. Furthermore, continuous improve-ments in production, such as simplifying processes and increasing levels of automation, help drive manufac-turing efficiency even higher.
Over the past years, we have substantially enhanced our production workflows at our largest production facility at Göttingen corporate headquarters by con-solidating individual manufacturing sites at Sartorius Campus and by optimizing process sequences when operations were started up at the new laboratory production building, thus minimizing the associated risks.
Sales and Distribution Risks and Opportunities
We use a variety of channels to sell and distribute our products around the world. The potential risks entailed are unexpected changes in the demand structure, growing price pressure and non-compliance with sup-ply agreements concluded with customers. We employ targeted market analyses to identify emerging demand trends in individual segments early on so that we have time to respond appropriately. Our technical innova-tions and our focus on less price-sensitive sales mar-kets, such as products for validated production processes in the biopharmaceutical industry, reduce our exposure to the risk of growing price pressure. We have minimized our risk exposure in the area of logis-tics in recent years by setting up and using central warehouses to optimize distribution logistics.
Opportunities arise in the area of sales and distribu-tion when the increasing breadth of our product range – in both bioprocess and lab segments – puts us in a position to sell new products to existing customers. Our business relationships, most of which are estab-lished for the long term, and our global presence pro-vide opportunities, moreover, and our ongoing project to strengthen direct sales, especially in the lab seg-ment, also promises to enhance our sales prospects.
With our acquisitions in cell analytics, we have strengthened the synergies between both divisions and offer our biopharmaceutical customers comprehensive solutions for research laboratories all the way to pro-duction processes.
58 Group Management Report Opportunity and Risk Report
Quality Risks and Opportunities
Our customers use Sartorius products in a wide range of critical production processes, including the manu-facture of pharmaceuticals, foods and chemicals, and in research and development laboratories. The main risk encountered in these areas is non-compliance with agreed quality criteria, which can lead to losses for our customers, or their customers, for which we may be made liable through compensation claims. We employ rigorous quality checks and advanced produc-tion methods and processes, such as cleanroom tech-nology, to ensure that our products satisfy the most stringent quality standards and high regulatory re-quirements. These manufacturing methods and pro-cesses are subject to constant review under our continuous improvement processes, moreover, and are optimized as requirements evolve. Our successful com-pletion of a host of annual audits by customers and our certification under ISO 9001 and ISO 13485 to-gether document the high level of quality achieved in Sartorius products and processes. Irrespective of these measures, we also maintain significant insurance cov-erage against product liability risks. Sartorius has established a traceability system that enables us to recall an entire production batch immediately, if nec-essary, and minimize any adverse consequences in the event of defects being discovered in a product.
We have installed a complaints management system to deal with customer requests and to ensure full docu-mentation.
Quality requirements are growing more and more stringent all the time, not least as a result of increas-ing requirements on protection of medical patients and on product safety by regulatory authorities, so we regard this first and foremost as an opportunity that opens up new market prospects. Also, challenging quality demands represent a considerable barrier to entry for potential new competitors and provide stim-ulus for further technical innovation to which we actively respond.
R&D Risks and Opportunities
We devote a considerable share of our resources to research and development. Potential risks in this area may arise from development results that diverge from market needs and application requirements and from exceeding planned development deadlines. Our ad-vanced project management, intensive R&D controlling and early involvement of our customers in the devel-opment process substantially limit these R&D risks. Patents and continuous tracking of the technologies
and competitors relevant to us secure our technology and marketing position.
On the other hand, the R&D sphere also offers a num-ber of opportunities. Our intensive collaboration with partners that rank among the global market leaders in their own fields opens up the opportunity for us to jointly develop products with an especially high level of innovation. In areas such as membrane technology and plastics technology, sensorics and biopharmaceu-tical process engineering, as well as weighing technol-ogy, in turn, the expertise of our own specialists puts us at the very forefront of global research and devel-opment, presenting us with an opportunity to turn this technical knowledge into potential sales and an even stronger position on the market.
Customer Risks and Opportunities
Sartorius sources its key customers from the pharma-ceutical, chemical and food industries and from re-search and educational institutions of the public sector. These customers are usually relatively large organizations that have been in existence for some time and have strong credit ratings. Most of our busi-ness areas have a highly diversified customer base, so the Group as a whole is not dependent on individual key accounts to any significant degree.
Competitive Risks and Opportunities
Sartorius has a leading competitive position in most of its markets and competes with mainly larger rivals sharing our status as a globally operating company. As we serve a large number of customers from highly regulated sectors like the pharmaceutical and food industries, and the technology barriers to market entry are substantially high, we regard the probability of new competitors emerging within the short term as low. Overall, the competitive environment is therefore very stable.
The fact that many of our products are used in vali-dated processes, especially those in the biopharmaceu-tical industry, ensures a robust revenue stream, reducing the risk of losing significant market share within a short timeframe. At the same time, it is not possible for us to quickly force out the competition that serves customers in this area.
Group Management Report Opportunity and Risk Report 59
Changes in the competitive environment, for example, consolidation in the markets, can pose opportunities. Our sectors find themselves in an ongoing process of change in which Sartorius has been actively partici-pating. We have been continuously making acquisi-tions in recent years to reinforce our market position and open up new potential synergies.
Acquisition Risks and Opportunities
By nature, acquisitions provide many opportunities, such as sales growth, extension of our product portfo-lio and development of new markets. By contrast, the purchase and sale of companies or parts of companies entail a number of typical risks, such as incorrect valu-ation assumptions or insufficient usage of anticipated synergy effects. To prevent these risks, we take various measures, such as performing a standard due diligence review of important areas and carrying out compre-hensive analysis of the market concerned. In addition, we involve external consultants and experts in the purchase or sales process as required. We especially focus on drafting transaction contracts so that they adequately counter such risks, especially by clauses assuring specific characteristics or by contractual warranty or guarantee provisions, as well as agree-ments on mechanisms for adjustment of the purchase price and on liability clauses or by taking out the ap-propriate insurance policies. Immediately after an acquisition has taken place, an integration phase is initiated in which any potential risks can likewise be detected as early as possible and prevented or mini-mized by taking the appropriate counteractions.
Personnel Risks and Opportunities
As an innovative technology group, Sartorius employs a large percentage of highly qualified people. We counter the risks of a possible scarcity of required specialists, especially those in key positions, and of demographic change by offering performance-related remuneration models, targeted continuing professional development options, further attractive social benefits, continuous education and training for junior staff members within our organization and interesting peo-ple development opportunities.
The success of these measures is apparent in the low attrition rates of recent years and the many years of seniority our people accumulate on average. Employ-ment contracts in certain cases contain a clause pro-hibiting any move to a direct competitor.
Opportunities for Sartorius primarily arise in that it can further qualify its staff by offering its own train-ing courses and retain such staff over the long term, thus covering company needs for qualified personnel particularly well.
Financial Risks and Opportunities
The global nature of the Sartorius Group’s operations means that its business activities are inevitably ex-posed to financial risks. The most significant of these, aside from risks associated with Group accounting, are exchange rate risks, interest rate risks and liquidity risks, all of which are described below and addressed in detail in the Notes to the Consolidated Financial Statements. Vice versa, financial risks, most notably exchange rate risks and interest rate risks, are bal-anced by opportunities of approximately equal magni-tude.
Risks Associated with Group Accounting
Except for the general, typical risks inherent in any accounting process, no specific risks concerning Group accounting are discernible. Typical accounting errors in this connection are, for example, incorrect discre-tionary decisions in the measurement of assets and liabilities. The use of various standardized, partially automated control mechanisms largely ensures that such errors are recognized and corrected at an early stage. A highly detailed monthly reporting and analy-sis process, as well as regular legal audits, essentially contributes to these targets.
Exchange Rate Risks and Opportunities
As we generate around half of consolidated sales reve-nue in foreign currencies and two-thirds of this total revenue in U.S. dollars or in currencies pegged to the U.S. dollar, we are positively or negatively impacted by currency effects, especially when converting the cur-rencies of balance sheet items and profit or loss items, respectively. To largely compensate for the general risk resulting from the impact of individual foreign curren-cies, we have taken a number of measures besides hedging currencies. Our global production network thus enables us to offset the lion’s share of sales reve-nues received in foreign currency within the Group against costs likewise incurred in foreign currency. For example, we manufacture many of our products for the North American market locally, and are not disad-vantaged in competition with our U.S. rivals, insofar as this general currency risk is concerned. We continu-ously monitor both exchange rates and our net cur-
60 Group Management Report Opportunity and Risk Report
rency exposure – i.e. that proportion of our foreign currency sales revenue that remains after we have settled our costs, likewise in a foreign currency – and use derivative financial instruments for hedging. These instruments are primarily spot, forward and swap transactions, on the basis of current and anticipated net currency exposure and foreign currency levels. We make it a policy to hedge up to 70% of our exposure in advance for the following 18 months. Hedging transactions are set up by one group of staff and monitored by another, separate group.
Interest Rate Risks and Opportunities
We have concluded fixed interest agreements for ap-proximately two-thirds of our outstanding loans to eliminate the risk posed by variable interest payments. The remaining portion of the financial instruments outstanding on the reporting date is subject to varia-ble interest based on the market rate. Almost one-third of these is currently covered by interest rate swaps. We monitor interest rate trends and our interest rate expo-sure constantly and have the facility to arrange for additional hedging transactions where we consider it necessary and economically advisable to do so for individual loans.
Liquidity Risks and Opportunities
The Sartorius Group actively manages liquidity central-ly in order to check and minimize liquidity risks and optimize liquidity management within the organization. For this purpose, we use various long- and short-term financial instruments. Regarding the maturities of our loans, we make it a policy to take a risk-averse ap-proach.
For short-term liquidity procurement, we also employ various instruments. In addition to the syndicated credit line that can be accessed and repaid at short notice, we have a number of bilateral credit lines in place on a smaller scale for individual Group compa-nies. Furthermore, we use cash pooling agreements between selected Group companies as the primary tool to manage liquidity within the Group.
Under the present loan agreements, the Group is re-quired to comply with standard financial key ratios, or covenants. In this context, the ratio of net debt to underlying EBITDA may not be greater than 3.25 and 4.00, respectively. There is a basic risk in this connec-tion that the Group might not comply with these covenants, which could lead to a termination of the loan agreements. Based on the current information available, this is considered unlikely.
Regulatory Risks
Our role as a supplier to the biopharmaceutical indus-try and health care providers means that Sartorius can also be affected by underlying developments in these areas. The possibility of the regulatory authorities (FDA, EMA) adopting a more restrictive approach to the approval of new medications remains the principal source of risk in this context. Such a move would reduce the number of new pharmaceutical products to be marketed and would consequently downgrade future prospects for Sartorius over the medium term.
Environmental Risks
Sartorius has established an environmental manage-ment system that encompasses, and is integrated into, all divisions and covers a whole series of environmen-tally relevant regulations to minimize environmental risks. This management system has been certified for compliance with ISO 14001 at a number of the com-pany's relatively large manufacturing sites. The respec-tive company organizational units ensure at the particular sites that the laws and regulations relating to environmental protection are observed and that further technical possibilities for limiting environmen-tal risks are identified on an ongoing basis.
The increasing importance of sustainability considera-tions in many industries represents an opportunity. That is why this aspect is a key element in our supplier selection process for assessing the suitability of a particular company as a business partner. For further information on this group of topics, please refer to our Non-Financial Group Declaration.
IT Risks and Opportunities
Besides the risks already described, the Sartorius Group is exposed to potential risks in the area of IT as a re-sult of its pronounced dependence on these systems, since their error-free operation is essential for the smooth functioning of the company's business pro-cesses. We reduce IT security risks by continuously enhancing and implementing IT security guidelines and policies. These rules and measures are based on the requirements of ISO 27001 and the standards of the German Federal Office for Information Security (BSI Standards). Furthermore, our company's existing IT applications and IT systems are checked for potential risks in regular external and internal IT audits, and appropriate measures are taken to minimize any risks identified. Continuous alignment of our IT strategy and business strategy, tracking of new technical developments and the use of advanced hardware and
Group Management Report Opportunity and Risk Report 61
software minimize the risk inherent in the operation of our IT system environment. A new ERP system commissioned by Sartorius at its Göttingen Group headquarters in 2012 has been successively rolled out to the Group sites around the world. Up to the end of 2017, approximately 75% of the Group's global sales transactions have been processed using the new sys-tem. In conducting this IT project, we have continued to focus on controlling the risks involved, such as by maintaining a precautionary backup system. The im-plementation of the new system brings with it a whole series of opportunities, especially in relation to effi-ciency gains and the standardization and harmoniza-tion of business processes worldwide.
Process Risks
Process risks for Sartorius can arise from pending or forthcoming legal disputes or from administrative proceedings. All judicial or extrajudicial disputes are attended to by the company’s own attorneys and legal experts, who engage external lawyers as needed.
At present, there are no pending or discernible legal disputes or proceedings that lack any cost coverage allowances in the statement of financial position or that could have a substantial negative impact on Group.
Insurance
We have taken out insurance policies to cover a wide range of risks where possible and economically advisa-ble. These insurance policies include coverage against liability, property damage, business interruption, transport, material and pecuniary damages and other risks, and provide comprehensive coverage for legal costs. An independent department working in conjunc-tion with an external insurance broker regularly re-views the nature and extent of our insurance protection and makes any adjustments necessary.
When choosing our insurers, we particularly consider the credit rating of these entities as potential contrac-tual partners, as well as aim to achieve a high degree of diversity in order to mitigate the related risks.
Assessment of the Overall Risk Situation and Risk Outlook
Where feasible, we adopted countermeasures and | or arranged for balance sheet measures during the report-ing year to cover all discernible risks within the Sartorius Group, and those of a defined probability of occur-rence, that had the potential to damage our net worth, financial situation and profitability.
For the purposes of this report, we have assessed the probability of occurrence of the risks as shown below and, in the adjacent columns, classify their particular significance for the entire Group.
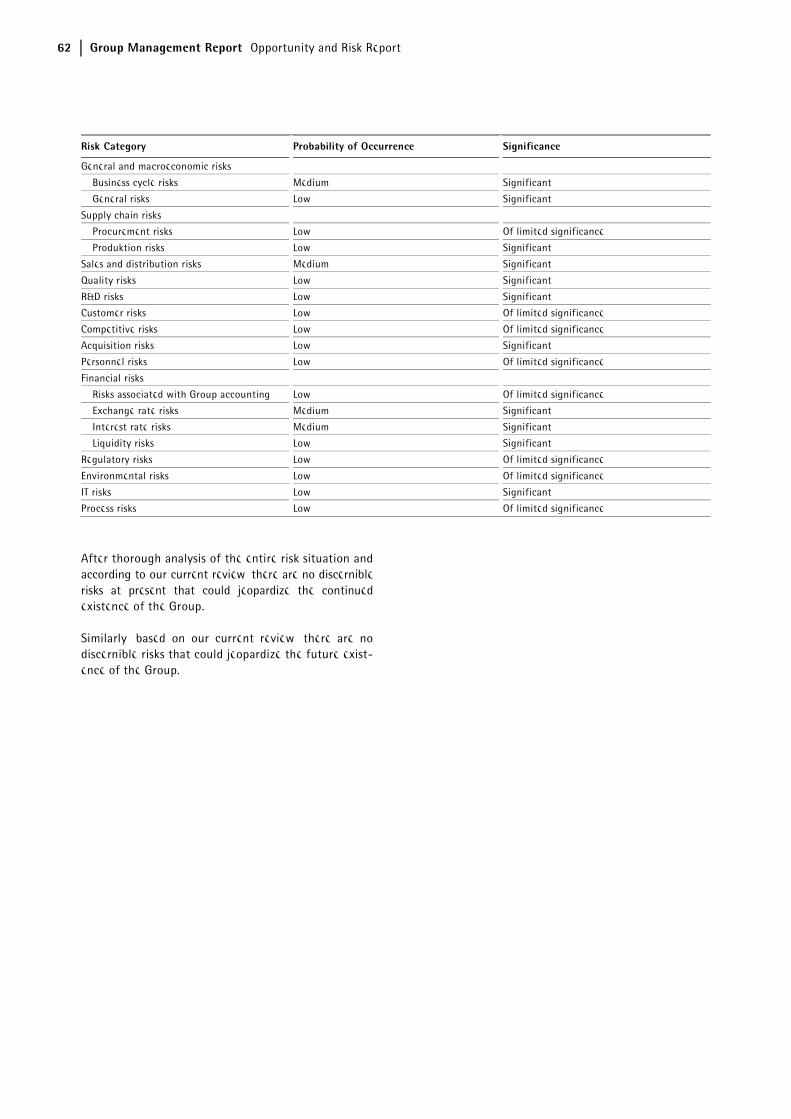
62 Group Management Report Opportunity and Risk Report
Risk Category Probability of Occurrence Significance
General and macroeconomic risks
Business cycle risks Medium Significant
General risks Low Significant
Supply chain risks
Procurement risks Low Of limited significance
Produktion risks Low Significant
Sales and distribution risks Medium Significant
Quality risks Low Significant
R&D risks Low Significant
Customer risks Low Of limited significance
Competitive risks Low Of limited significance
Acquisition risks Low Significant
Personnel risks Low Of limited significance
Financial risks
Risks associated with Group accounting Low Of limited significance
Exchange rate risks Medium Significant
Interest rate risks Medium Significant
Liquidity risks Low Significant
Regulatory risks Low Of limited significance
Environmental risks Low Of limited significance
IT risks Low Significant
Process risks Low Of limited significance
After thorough analysis of the entire risk situation and according to our current review, there are no discernible risks at present that could jeopardize the continued existence of the Group.
Similarly, based on our current review, there are no discernible risks that could jeopardize the future exist-ence of the Group.
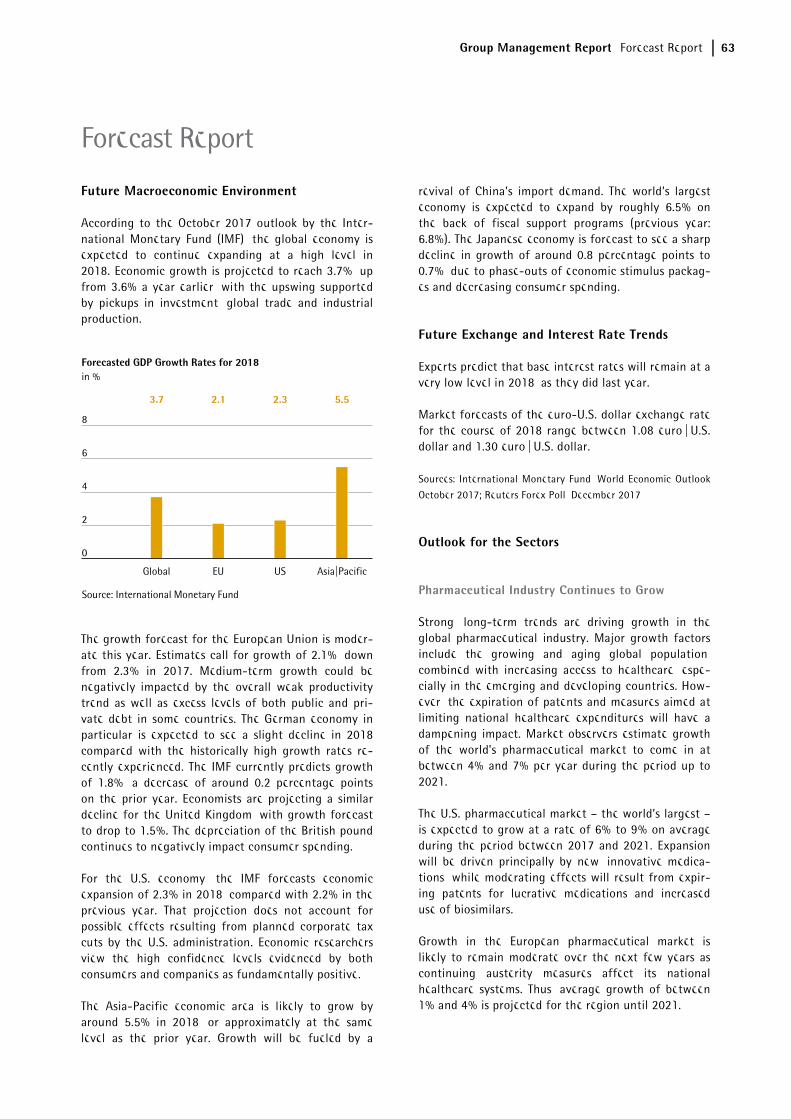
Group Management Report Forecast Report 63
Future Macroeconomic Environment
According to the October 2017 outlook by the Inter-national Monetary Fund (IMF), the global economy is expected to continue expanding at a high level in 2018. Economic growth is projected to reach 3.7%, up from 3.6% a year earlier, with the upswing supported by pickups in investment, global trade and industrial production.
The growth forecast for the European Union is moder-ate this year. Estimates call for growth of 2.1%, down from 2.3% in 2017. Medium-term growth could be negatively impacted by the overall weak productivity trend as well as excess levels of both public and pri-vate debt in some countries. The German economy in particular is expected to see a slight decline in 2018 compared with the historically high growth rates re-cently experienced. The IMF currently predicts growth of 1.8%, a decrease of around 0.2 percentage points on the prior year. Economists are projecting a similar decline for the United Kingdom, with growth forecast to drop to 1.5%. The depreciation of the British pound continues to negatively impact consumer spending.
For the U.S. economy, the IMF forecasts economic expansion of 2.3% in 2018, compared with 2.2% in the previous year. That projection does not account for possible effects resulting from planned corporate tax cuts by the U.S. administration. Economic researchers view the high confidence levels evidenced by both consumers and companies as fundamentally positive.
The Asia-Pacific economic area is likely to grow by around 5.5% in 2018, or approximately at the same level as the prior year. Growth will be fueled by a
revival of China’s import demand. The world’s largest economy is expected to expand by roughly 6.5% on the back of fiscal support programs (previous year: 6.8%). The Japanese economy is forecast to see a sharp decline in growth of around 0.8 percentage points to 0.7%, due to phase-outs of economic stimulus packag-es and decreasing consumer spending.
Future Exchange and Interest Rate Trends
Experts predict that base interest rates will remain at a very low level in 2018, as they did last year.
Market forecasts of the euro-U.S. dollar exchange rate for the course of 2018 range between 1.08 euro | U.S. dollar and 1.30 euro | U.S. dollar.
Sources: International Monetary Fund, World Economic Outlook
October 2017; Reuters Forex Poll, December 2017
Outlook for the Sectors
Pharmaceutical Industry Continues to Grow
Strong, long-term trends are driving growth in the global pharmaceutical industry. Major growth factors include the growing and aging global population, combined with increasing access to healthcare, espe-cially in the emerging and developing countries. How-ever, the expiration of patents and measures aimed at limiting national healthcare expenditures will have a dampening impact. Market observers estimate growth of the world's pharmaceutical market to come in at between 4% and 7% per year during the period up to 2021.
The U.S. pharmaceutical market – the world’s largest – is expected to grow at a rate of 6% to 9% on average during the period between 2017 and 2021. Expansion will be driven principally by new, innovative medica-tions, while moderating effects will result from expir-ing patents for lucrative medications and increased use of biosimilars.
Growth in the European pharmaceutical market is likely to remain moderate over the next few years as continuing austerity measures affect its national healthcare systems. Thus, average growth of between 1% and 4% is projected for the region until 2021.
Forecast Report
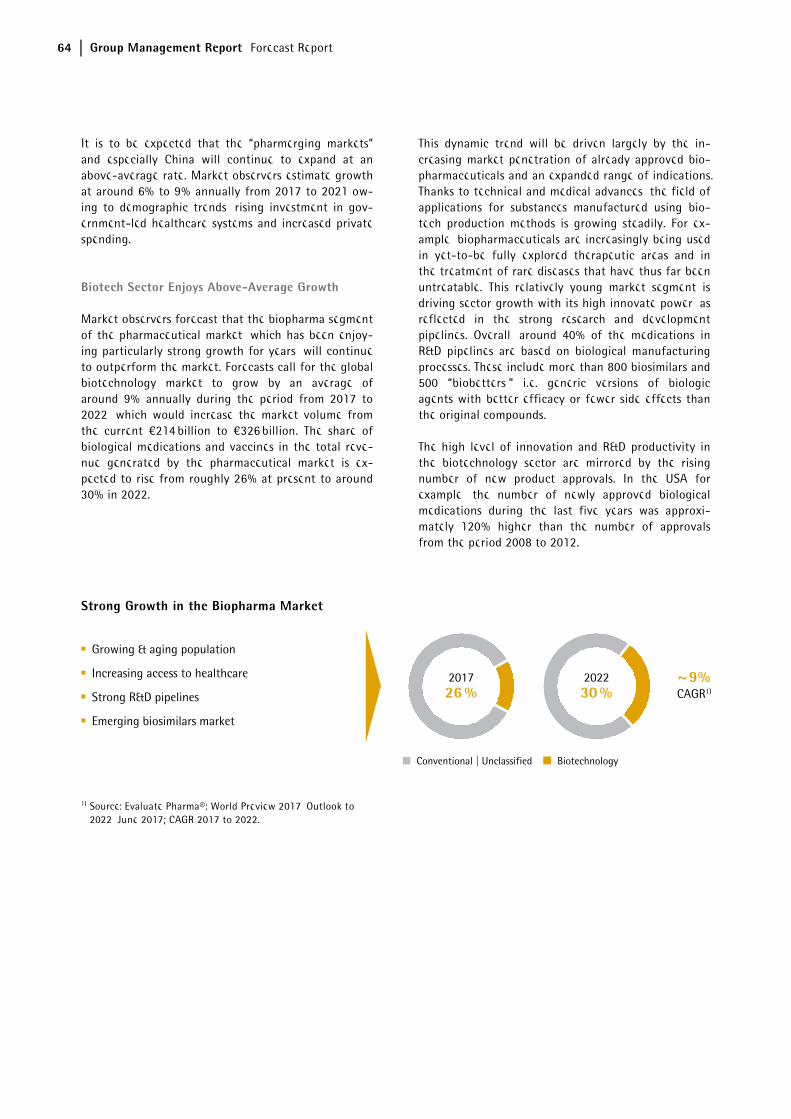
64 Group Management Report Forecast Report
It is to be expected that the “pharmerging markets” and especially China will continue to expand at an above-average rate. Market observers estimate growth at around 6% to 9% annually from 2017 to 2021 ow-ing to demographic trends, rising investment in gov-ernment-led healthcare systems and increased private spending.
Biotech Sector Enjoys Above-Average Growth
Market observers forecast that the biopharma segment of the pharmaceutical market, which has been enjoy-ing particularly strong growth for years, will continue to outperform the market. Forecasts call for the global biotechnology market to grow by an average of around 9% annually during the period from 2017 to 2022, which would increase the market volume from the current €214 billion to €326 billion. The share of biological medications and vaccines in the total reve-nue generated by the pharmaceutical market is ex-pected to rise from roughly 26% at present to around 30% in 2022.
This dynamic trend will be driven largely by the in-creasing market penetration of already approved bio-pharmaceuticals and an expanded range of indications. Thanks to technical and medical advances, the field of applications for substances manufactured using bio-tech production methods is growing steadily. For ex-ample, biopharmaceuticals are increasingly being used in yet-to-be fully explored therapeutic areas and in the treatment of rare diseases that have thus far been untreatable. This relatively young market segment is driving sector growth with its high innovate power, as reflected in the strong research and development pipelines. Overall, around 40% of the medications in R&D pipelines are based on biological manufacturing processes. These include more than 800 biosimilars and 500 “biobetters,” i.e. generic versions of biologic agents with better efficacy or fewer side effects than the original compounds.
The high level of innovation and R&D productivity in the biotechnology sector are mirrored by the rising number of new product approvals. In the USA for example, the number of newly approved biological medications during the last five years was approxi-mately 120% higher than the number of approvals from the period 2008 to 2012.
Strong Growth in the Biopharma Market
1) Source: Evaluate Pharma®: World Preview 2017, Outlook to 2022, June 2017; CAGR 2017 to 2022.
■ Growing & aging population
■ Increasing access to healthcare
■ Strong R&D pipelines
■ Emerging biosimilars market
~ 9% CAGR1)
■ Conventional | Unclassified ■ Biotechnology
2017 26 %
2022 30 %
Group Management Report Forecast Report 65
Biosimilars which are biological copycat medications, will continue to increase in importance during the years to come. They are less expensive than the refer-ence compound, while having similar properties in terms of their application, dosage and efficacy. In-creased use of biosimilars thus brings the prospect of lower individual treatment costs and financial relief for national healthcare systems. This is a goal likely to be pursued by the industrialized countries, where aging populations are leading to rising demand for medications and notably higher expenditures. In many developing countries, biosimilars offer the initial ac-cess to biopharmaceutical substances. The develop-ment of national production capacities is receiving political support. Regulatory requirements are general-ly much less strict in developing countries than in the industrialized countries, thus the biosimilars market could experience substantial growth in the emerging economies over the next few years.
Eight of the strongest selling biopharmaceuticals are due to lose their patent protection in the United States and Europe by the year 2020. Various pharma-ceutical manufacturers have therefore announced the market launch of those biosimilars that have already been approved. At present, around 30 compa-nies are actively working on the development of biopharmaceutical copycat products for 16 different molecules. At the same time, the biosimilars market will also see a gradual decline in regulatory and patent-related barriers and challenges to marketing the products – factors that have thus far slowed de-velopment of the market. Against this backdrop, cur-rent estimates call for accelerated growth over the next few years. By 2020, sales of biosimilars could multiply to between U.S. $25 billion and U.S. $35 billion.
Furthermore, some spectacular achievements have been made in the field of cell therapy lately. The goal of cell therapy is to prevent, treat, heal or mitigate human disease or injury through the use of autologous, allogenic or xenogenic cells that have been manipulat-ed ex vivo or otherwise altered. Regardless of the type of cell therapy, the production technologies used for the manufacturing of the respective therapeutic prod-ucts are similar to those used for the manufacturing of biopharmaceuticals. The growing number of cell-based therapies currently in clinical development and the rising number of approved cell therapies already in use could lead to increasing demand for the corresponding production capacities in the future.
Stable Growth Expected in the World's Laboratory Market
According to Frost & Sullivan, global demand for la-boratory products is likely to remain stable, with growth of 2.8% in 2018. The key U.S. market is ex-pected to generate growth of 3.0%, in part due to the sustained strength of the biopharmaceutical industry and the business-friendly climate. In Europe, experts anticipate an increase of just 1.7% owing to the com-paratively moderate economic growth and as a result of uncertainties in the wake of the Brexit referendum. However, the European Union’s increased budget for academic research will likely spur mid-term growth. As before, market observers expect the highest growth rates in Asian countries such as China and India, in which the individual labor markets are likely to grow around 7.5% to 8.8% in 2018.
Sources: QuintilesIMS Institute: Outlook for Global Medicines
through 2021, December 2016; Evaluate Pharma: World Preview
2017, Outlook to 2022, June 2017; BioPlan: 14th Annual Report
and Survey of Biopharmaceutical Manufacturing Capacity and
Production, April 2017; Deloitte: 2017 Global Life Science Out-
look, October 2016; Frost & Sullivan: 2017 Mid-year Report:
Forecast and Analysis of the Global Market for Laboratory
Products, May 2017
66 Group Management Report Forecast Report
Outlook for 2018
The outlook for 2018 considers the sector environment, economic trends and the opportunities and risks out-lined in this Annual Report. The following forecast is provided under the assumption that we have accurate-ly anticipated the relevant trends for Sartorius:
Sartorius Group
Sartorius expects to grow profitably again in 2018. Specifically, management projects that Group sales revenue for the full year will grow by about 9% to 12% in constant currencies. Regarding profitability, management forecasts that the company's underlying EBITDA margin will increase by around half a percent-age point over the prior-year figure of 25.1%.
In view of continued strong organic growth, Sartorius had already started in 2016 to expand its production capacities earlier and to a greater extent than initially planned. Accordingly, the Group projects that it will invest overproportionately in its worldwide infrastruc-ture in 2018 as well, at a ratio of capital expenditures to sales revenue of around 15%. The focal areas of its investments will be to extend the Yauco site for manu-facturing single-use filters and bags, as well as to combine and expand Group headquarters in Göttingen, Germany.
With regard to our financial position, we forecast that our ratio of net debt to underlying EBITDA will be slightly below the previous year's level (Dec. 31, 2017: 2.5) at the end of 2018. This ratio does not take any potential acquisitions into account.
Division Forecasts
For the Bioprocess Solutions Division, management expects significant increases for the full year of 2018 as well. The division's sales revenue is projected to grow by about 8% to 11%. The division's underlying EBITDA margin is anticipated to rise by around 0.5 of a percentage point over the prior-year figure of 28.0%.
The Lab Products & Services Division in some parts of its portfolio depends on general economic cycles. For this division, management projects that, assuming an overall stable economic environment, sales will in-crease by about 12% to 15%. The division's underlying EBITDA margin is forecasted to rise by about one per-centage point from 18.0% in the previous year.
All forecasted figures are given in constant currencies. Due to the latest currency developments, especially in the exchange rate between the U.S. dollar and the euro, our reported figures in actual currencies might differ from our constant currency guidance in which we will provide additional details during the full year of 2018.
Sustained Reduction in Tax Rate
Sartorius' corporate tax rate is expected to be reduced by about 2 percentage points to around 27% from 2018 onwards as a future effect of the U.S. tax reform approved in December 2017, which essentially lowers the U.S. corporate tax rate from 35% to 21%. Since the changes in American tax legislation are very ex-tensive, and further explanations and instructions for application by the U.S. tax authorities are still pending, this estimate is to be considered tentative.

Group Management Report Report on Material Events 67
No material events occurred after the close of fiscal 2017.
Report on Material Events
68 Group Management Report Description of the Key Features of the Internal Control Management System
In relation to the Group Accounting Process (Sec-tion 289, Subsection 4, and Section 315, Subsection 4, of the German Commercial Code [HGB])
Definitions and Elements of the Internal Control Management System at the Sartorius Group
The internal control system of Sartorius AG and the Sartorius Group encompasses all of the principles, procedures and measures adopted to ensure the or-ganizational implementation of management decisions. The main priority of the system as it relates to Sartorius AG’s and the Group’s accounting process is to make sure that accounting is effective, cost-efficient and formally correct and that it complies with the pertinent legal provisions.
The internal control system of the Sartorius AG and the Sartorius Group consists of a combination of pro-cess-integrated and non-process-integrated monitor-ing measures. The process-integrated safeguarding measures are subdivided, in turn, into organizational measures and other control measures. The Supervisory Board, specifically in this case the Audit Committee of Sartorius AG, and the Legal Affairs & Compliance unit with its Group Auditing department are involved in the Sartorius Group’s internal control system through their non-process-integrated audit activities. The Au-dit Committee regularly reviews quarterly reports besides the annual financial statements of the parent corporation and of the consolidated annual financial statements.
Moreover, to ensure systematic, early identification of risks across the entire Group, a “monitoring system for early group-wide detection of risks with the potential to jeopardize the company’s continued existence” as defined in Section 91, Subsection 2, of the German Stock Corporation Law (AktG) is in place at the Sartorius Group. The efficacy of the early risk detec-tion system, which the Sartorius Group adapts promptly in response to any relevant changes in cir-cumstances, is assessed by the independent auditors of Sartorius AG in accordance with Section 317, Subsec-tion 4, of the German Commercial Code (HGB). An integral component of this system is also operational risk management, which involves activities such as the transfer of risk to insurance companies through cover-age for damage and liability risks and the arrangement of suitable hedges to limit currency and interest rate risks.
Organizational Measures
Accounting processes are strictly organized according to the principle of segregation of functions, taking into account the “four-eyes” principle – i.e. review by two individuals. Duties and responsibilities are clearly assigned to different specialized units, companies and regional units. The separation of administrative, ex-ecutive, settlement and approval functions reduces the possibility of fraud. It also continues to play a signifi-cant role in ensuring that any possible errors are dis-covered early and any potential misconduct is prevented.
The IT applications used in the company's accounting processes have access restrictions, which allow only authorized persons to have controlled access to the accounting system and data. Each access right is as-signed specifically according to the tasks to be per-formed and will be subject to annual review in the future. Furthermore, the four-eyes principle is also applied in IT process designing and assignment of access rights.
In addition, defined written local and global operating procedures exist, particularly the Group accounting guidelines, which are regularly updated and communi-cated throughout the Group. The scope of regulation at Group level also extends to the central definition of measurement rules and parameters, among other fac-tors. Additional data for the presentation of external information in the notes to the financial statements and in the Group management report is also prepared and aggregated at Group level.
Continuous coordination of internal accounting during the year for planning and control with external ac-counting significantly contributes to the quality of Group financial reporting. Reporting itself is done through a standardized management reporting system implemented throughout the Group. This system visu-alizes all consolidation processes. Internal controls, on the one hand, and the Group auditors of Sartorius AG, on the other hand, ensure that Group financial reports are accurately generated from the consolidated Group companies' financial statements.
The employees involved in the accounting process meet qualitative standards and receive regular training. The Group Financial Reporting department assists the local units in resolving complex accounting issues, such as measuring fair value, to ensure consistent and
Description of the Key Features of the Internal Control Management System
Group Management Report Description of the Key Features of the Internal Control Management System 69
accurate reporting in the consolidated financial statements. Complex evaluations, such as actuarial reports and company valuations or purchase price allocations, are assigned to specialized service provid-ers who involve the respectively qualified in-house staff.
Control Measures
Comprehensive control activities are performed by managers and staff to ensure effective and reliable accounting. As a result, this ensures compliance with legal requirements and internal guidelines, as well as properly conducted business transactions. Examples of such control activities include the analysis of situa-tions and developments with reference to specific key indicators. Moreover, individual reporting units monthly comment on and explain special characteris-tics or variances using Group-wide standardized ana-lytical tools as the basis. Further specific control activities performed to ensure effective and reliable Group accounting encompass the analysis and, where applicable, correction of the individual financial statements submitted by the Sartorius Group compa-nies. A large number of control mechanisms already incorporated into the consolidated reporting system enable erroneous information to be identified and corrected at Group level. Impairment tests are con-ducted centrally for the specific cash-generating units, known as CGUs, from the Group's perspective to en-sure that consistent, standardized evaluation criteria are applied.
The Legal Affairs & Compliance unit annually draws up a risk-based audit plan and reviews in spot checks whether basic legal requirements and internal group guidelines are complied with for the entire control and risk management system of the Group. This monitoring function covers, in particular, auditing the functional efficiency and effectiveness of defined control measures. The results of these audits are reported directly to the Executive Board and enable any defi-ciencies determined to be corrected and the company’s internal control system (ICS) to be further enhanced.
A manual on the company's internal control system that focuses on the business processes of our company further contributes toward strengthening ICS. As a result, this manual combines all ICS-relevant require-ments that we consider of material importance into one standardized document and will be supplemented by further appropriate rules as necessary.
Qualifying Statements
The internal control and risk management system enables the complete recording, processing and evalu-ation of company-related matters, on the basis of the organizational, control and monitoring structures defined in the Sartorius Group, as well as their accu-rate presentation in Group accounting.
In particular, decisions based personal judgment, erro-neous controls, criminal acts and other circumstances that can impair the efficacy and reliability of the in-ternal control and risk management system in place cannot be ruled out, however, so even the application throughout the Group of the systems adopted cannot provide an absolute assurance as to the accurate, complete and timely recording of matters in Group accounting.
The statements made relate solely to the subsidiaries included in the consolidated financial statements of Sartorius AG, whose financial and business policies Sartorius AG can directly or indirectly determine in order to obtain benefits from their activities.
70 Group Management Report Explanatory Report of the Executive Board
On the Disclosures Pursuant to Section 289a, Subsec-tion 1, and Section 315a, Subsection 1, of the German Commercial Code (HGB)
Composition of the Issued Capital | Limitations to Voting Rights
Sartorius AG’s capital stock totals €74,800,000. It comprises 74,800,000 no par value individual bearer shares, 37,440,000 of which are ordinary shares and 37,440,000 of which are non-voting preference shares. Each share certificate repre-sents a calculated proportion of €1 of the issued capital.
The rights and obligations associated with these shares are governed by the provisions of the German Stock Corporation Law (Aktiengesetz, abbreviated “AktG”). According to the company’s Articles of Association, preference shares are entitled to a dividend payment that is one euro cent higher per share than that for ordinary shares. However, this enti-tlement to receive dividends shall be at least two euro cents per preference share. Apart from the cases provided for in Sections 140 and 141 of AktG, preference shares are non-voting. Beyond this, preference shares grant all other rights to which every shareholder is entitled.
The company holds 3,227,776 ordinary shares and 3,263,932 preference shares; these do not entitle the company to any membership rights.
Direct or Indirect Equity Ownership Exceeding 10% of Voting Rights
The community of heirs consisting of Mrs. U. Baro, resident of Munich, Germany; Mrs. C. Franken, resident of Bovenden, Germany; Mr. A. Franken, resident of Riemerling, Germany; Mr. K.-C. Franken, resident of Göttingen, Germany; and Mrs. K. Sartorius-Herbst, resident of Northeim, Germany, holds a voting percentage of approximately 50.1% in Sartorius AG (18,754,160 votes; source: according to the list of at-tendees at the Annual Shareholders’ Meeting on April 6, 2017). The decedent Horst Sartorius ordered that his will be administered by an executor. Dr. Lothar Kappich, resident of Hamburg, Germany, was appointed execu-tor to succeed Prof. Dr. Dres. h.c. Arnold Picot who unex-pectedly passed away on July 9, 2017. The executor exercises the specified voting rights at his own discretion as defined by Section 22, Subsection 1, sentence 1, item no. 6, of the German Securities Trading Act (Wertpapierhan-delsgesetz, abbreviated “WpHG”).
According to a mandatory announcement dated April 1, 2011, Bio-Rad Laboratories Inc., 1000 Alfred Nobel Drive, Hercules, California 94547, USA, to which the voting rights of Bio-Rad Laboratories GmbH, Heidemannstr. 164,
80939 Munich, Germany, are ascribed according to Sec-tion 22, Subsection 1, sentence 1, item no. 1, of WpHG, holds 30.01% of the voting rights in Sartorius AG (11,237,196 votes, taking into account the share capital increase from retained earnings that went into effect as of June 1, 2016).
Appointment and Dismissal of Executive Board Members | Amendment to the Articles of Association
Executive Board members of Sartorius AG are nominated and|or appointed as well as removed from office in accord-ance with Sections 84 et seq. of the German Stock Corpora-tion Law (AktG) and Sections 31 and 33 of the German Codetermination Law (Mitbestimmungsgesetz, abbreviated “MitBestG”). Amendments to Sartorius AG’s Articles of Association are regulated by Sections 133 and 179 of the German Stock Corporation Law (AktG).
Powers of the Executive Board to Issue Shares
Subject to approval by the Supervisory Board, the Executive Board is authorized to sell treasury shares held by the corpo-ration, including selling them through channels other than the stock exchange or by tendering an offer to all share-holders in proportion to their participation in the company, provided that these shares are transferred to third parties as contribution in kind, particularly in the (indirect) acquisition of companies, in return. Under these circumstances, the preemptive rights of the shareholders are excluded.
Material Agreements with Clauses Regulating the Event of a Change of Control
Sartorius AG has material loan agreements containing customary market clauses regulating the possible event of a change of control and giving the participating lenders the option of extraordinary termination of a particular agreement or to request complete repayment of the re-spective loan:
These are a syndicated loan agreement concluded in 2014 for a current volume of €400 million and a term until December 2021; two note loans (“Schuldschein-darlehen”), for the amount of €200 million placed in 2016 and 2017, respectively; and a €350 million note loan for a maturity term of five to ten years; two pro-motional loans, each for €90 million, concluded in 2015 and 2016 for maturity terms of 8 years; and a note loan originally for €100 and placed in 2012 for a maturity term of five to ten years. The repayment sum outstanding for these material loan agreements stands at approximately €760 million as of December 31, 2017.
Explanatory Report of the Executive Board
Group Management Report Report and Declaration on Corporate Governance 71
Corporate Governance Report
Corporate government aligned with the interests of stakeholders, lawful and responsible conduct, and constructive cooperation between the managerial bodies and within the company in a spirit of mutual trust constitute the essential cornerstones of Sartorius' corporate culture.
The Executive Board and the Supervisory Board report in the following declaration on the key aspects of corporate management and governance pursuant to § 289f of the German Commercial Code ("HGB") and to Article 3.10 of the German Corporate Governance Code.
Declaration of Compliance with Corporate Governance
Declaration of the Executive Board and of the Supervi-sory Board of Sartorius AG Concerning the Recom-mendations of the Government Commission on the German Corporate Governance Code Pursuant to § 161 of the German Stock Corporation Law ("Aktiengesetz"):
The Executive Board and the Supervisory Board declare that full compliance will be achieved with the recommen-dations made by the Government Commission on the German Corporate Governance Code and published by the German Federal Ministry of Justice in the official section of the German Federal Gazette (“Bundesanzeiger”), as amended on February 7, 2017.
Since last year’s Declaration of Compliance was issued, Sartorius AG has complied with the recommendations in the valid version of the Government Commission on the German Corporate Governance Code to the full extent.
Göttingen, December 7, 2017
For the Supervisory Board For the Executive Board
Dr. Lothar Kappich Dr. Joachim Kreuzburg
Further Remarks Concerning Corporate Governance
Sartorius AG is a joint stock corporation founded un-der German law and headquartered in Göttingen, Germany. With the Annual General Shareholders' Meeting, Supervisory Board and Executive Board, it has three corporate managerial bodies whose tasks and powers are essentially derived from the German Stock Corporation Law ("Aktiengesetz") and the company's Articles of Association.
As owners of the company, the shareholders exercise their rights at its Annual General Shareholders' Meet-ing, where they decide, in particular, on the appropria-tion of profits, measures concerning share capital, amendments to the Articles of Association, discharge of the Supervisory Board and the Executive Board and on the appointment of statutory auditors, as well as elect shareholder representatives to the Supervisory Board. The Annual General Shareholders' meeting is held at least once a year within the first eight months of the respective fiscal year. Any shareholder who registers in due time may attend the Annual General Shareholders' Meeting in person or can be represented by a proxy according to the various options provided by law.
In managing the company, the Supervisory Board and the Executive Board perform their tasks in a two-tier board structure, each with separate duties and powers.
The Supervisory Board appoints members to the Execu-tive Board, determines their remuneration and moni-tors and advises the Executive Board in its management of the company. The Supervisory Board is not authorized to take any operational management measures for the business.
The Executive Board is responsible for independently managing the company. In particular, it defines corpo-rate strategy, coordinates and agrees on this approach with the Supervisory Board and implements such cor-porate strategy. In line with established reporting obligations, the Executive Board regularly informs the Supervisory Board promptly and comprehensively, and requests the latter's approval for certain key business transactions.
Composition and Operating Mode of the Supervisory Board and Its Committees
The Supervisory Board has an equal number of share-holder representatives and employee representatives:
Report and Declaration on Corporate Governance
72 Group Management Report Report and Declaration on Corporate Governance
six shareowner representatives elected by the Annual General Shareholders' Meeting and six employee rep-resentatives elected according to the German Code-termination Law ("Mitbestimmungsgesetz"). Details on the members of the Supervisory Board and its commit-tees are provided on pages 180 to 181.
The Supervisory Board Chairman coordinates the work within this board, as well as convokes and conducts Supervisory Board meetings. Furthermore, he is the first individual for the Executive Board to contact and externally represents the matters of the Supervisory Board.
The Supervisory Board holds at least two meetings every six months; as a rule, four or more conferences take place, as required. This board has established four committees: the Executive Task Committee, the Audit Committee, the Conciliation Committee and the Nom-ination Committee. The Executive Task Committee, Audit Committee and Conciliation Committee each have four members and have an equal number of shareholder representatives and employee representa-tives. The Executive Task Committee and Audit Com-mittee hold regular meetings; the Conciliation Committee and the Nomination Committee meet only as necessary.
The Executive Task Committee carries out preparatory work for resolutions and issues to be addressed in the meetings of the Supervisory Board. It also oversees the preparations for appointments, including the remu-neration and employment contract conditions of members of the Executive Board. The Audit Committee supports the Supervisory Board in performing its su-pervisory function. The chairperson of the Audit Com-mittee is an independent member of the Supervisory Board and has detailed knowledge and extensive expe-rience in the application of accounting standards and internal control systems from his or her own profes-sional practice. The Conciliation Committee meets if the majority required in connection with the appoint-ment of members to the bodies authorized to repre-sent the company for legal purposes is not reached. The Nomination Committee comprises representatives of the shareholders only. Its function is to propose suitable candidates to the Supervisory Board for the latter’s election proposals submitted to the Annual Shareholders’ Meeting. More information on the indi-vidual meetings held in the reporting year by the Su-pervisory Board and its committees is given in the Report of the Supervisory Board on pages 12 to 15.
The Supervisory Board regularly reviews the efficiency of its work based on a questionnaire sent in advance and by a discussion of the results of this questionnaire in a plenary session.
Appointment Objectives for the Supervisory Board; Diversity Policy and Competence Profile
Members of the Supervisory Board of Sartorius AG are to be appointed such that they, on the whole, have the knowledge, skills and experience that are necessary to perform the board's duties properly.
For this purpose and based on the recommendations of the German Corporate Governance Code, the Supervi-sory Board decided on the following appointment objectives:
– Independent members shall account for no less than 25% of the Supervisory Board.
– The upper age limit of 70 at the time of election should be taken into consideration, but may be waived in exceptional cases, provided there are no reservations about the suitability of the persons proposed and their election is expedient to the interests of the company in spite of the age limit being exceeded.
– As a matter of principle, no member may serve on the Supervisory Board for longer than five elected terms. This limit can be exceeded in individual cases if the Supervisory Board does not have any reservations about the suitability of an individual for serving longer and election of this person is apparently in the interest of the company.
– Care must be taken to ensure that each Supervisory Board member has sufficient time available to perform his or her mandate.
In addition, the Supervisory Board also defined a com-petence profile for itself. This also covers aspects such as diversity, for example, with regard to professional background and international experience. In view of achieving an appropriate gender balance, the legal quotas of at least 30% women and at least 30% men apply to the Sartorius Supervisory Board. The share-holder representatives and the employee representa-tives decided to fulfill these legal targets separately.
– In its election proposals for membership, the Supervisory Board is required to consider whether candidates have international experience or an international background within the scope of its current members.
– The Supervisory Board must have members with expertise in one or several of the international markets relevant for Sartorius.
Group Management Report Report and Declaration on Corporate Governance 73
– Members of the Supervisory Board need to bring in knowledge of technologies and products relevant to the Group, as well as of digitalization, and experience in research and development, particularly in the biopharmaceutical industry.
– The Supervisory Board must have members who have expertise in setting up and developing innovative business models, as well as knowledge of corporate strategies.
– Members of the Supervisory Board need to have in-depth knowledge of financial business processes and competences in financial controlling and risk management; at least one independent member of the Supervisory Board must have expert knowledge of accounting or auditing (§ 100, Subsection 5, of AktG).
– Members of the Supervisory Board must have expertise in law, corporate governance and compliance.
– The Supervisory Board needs to have in-depth knowledge and a thorough background in issues concerning human resources.
According to the Supervisory's self-assessment, the members on its board meet the diversity and compe-tency requirements. The appointment objectives previ-ously mentioned regarding independence and the age and membership limits are also met:
Concerning the criterion of independence, this is met by all members of the Supervisory Board with one exception in the past and the present: the executor of Horst Sartorius' estate. This individual was Dr. Arnold Picot, Ph.D., until July 9, 2017, who was also the Chairman of the Supervisory Board, and is now Dr. Lothar Kappich, likewise its current Chairman. In the opinion of the Supervisory Board, an appointment as an employee representative to this board or an existing employment contract with the company alone does not preclude the independence of this member because an employee is protected by the laws in force in performing his or her duties on the Supervisory Board.
In one instance, the company diverged from the estab-lished statutory retirement age and the statutory limit of five elected terms when Dr. Arnold Picot was reelected. There were no doubts about his suitability, and his reelection was also in interest of the company in the context of his capacity as executor of Horst Sartorius' estate. Currently, there are no Supervisory Board members over the age of 70 or who have served for more than five elected terms.
In view of achieving an equal balance of gender, the Supervisory Board meets the quota of 30% set for the underrepresented gender. Since the election of mem-bers to the Supervisory Board in April 2017, seven men total (around 58%) are on the board, of whom four are shareholder representatives and three employee repre-sentatives. In addition, five women (around 42%) are members of this board, among them two representa-tives of the share owners and three representatives of the employees. As a result, the gender quota require-ments are met on both sides of Supervisory Board representation and on the full Supervisory Board itself.
The proposal of the Supervisory Board submitted to the Annual General Shareholders' Meeting for election of shareholder representatives to this board was based on the target quotas stated above.
To facilitate comparison of the appointment objectives, brief resumés of the Supervisory Board members are available on the Sartorius website.
Composition and Operating Mode of the Executive Board
The Executive Board of Sartorius AG manages the company under its own responsibility, with the goal of increasing the company's sustainable value. It develops the company's strategy, coordinates it with the Super-visory Board and ensures implementation of this strat-egy. Beyond that, the rules of procedure for the Executive Board define the legal transactions requiring approval by the Supervisory Board in order for such transactions to be effected. The Executive Board is responsible for compliance with all provisions of the law and the company's internal policies, as well as for appropriate risk management.
Decision-making by the Executive Board is done at its regular meetings, which are convoked and conducted by the Chairman. As a rule, the members of the Group Executive Committee attend these meetings, and, if required, further specialists and mangers are invited to provide advice.
The Executive Board members are jointly responsible as a collegiate body for matters of special significance. As for the board's remaining responsibilities, each member independently manages the area assigned to him or her according to the plan for allocation of areas of responsibilities, and is required to notify the Chairman of all material transactions and events.
74 Group Management Report Report and Declaration on Corporate Governance
Composition of the Executive Board, Diversity and Competency Requirements
In the opinion of the Supervisory Board, the basic qualification criteria for appointments to positions on the Executive Board are professional qualifications for heading each particular area of responsibility, a prov-en track record in the individual's career path and convincing managerial skills. In addition, the Supervi-sory Board also considers the aspect of diversity in its appointment decisions. Therefore, the Supervisory Board strives to appoint people with complementary profiles, professional and personal life experiences and in different age brackets to the Executive Board. Moreover, the latter board is required to have broad international experience.
Pursuant to the German Act on Equal Participation of Women and Men in Executive Positions in the Private and the Public Sectors (abbreviated as "German Act on Equal Participation of Women and Men" below), the Supervisory Board defined a target quota for the Ex-ecutive Board that is defined in the following section.
Disclosures Concerning the German Act on Equal Participation of Women and Men
The Sartorius Executive Board is a committee that presently consists of three members and is therefore relatively small so establishment of a rigid gender quota can be problematic. The current members of this board of Sartorius AG are male. Given that the Execu-tive Board contracts are still in force, the Supervisory Board had defined a quota of 0% up to June 30, 2022. For the current target achievement deadline by June 30, 2022, the Supervisory Board decided to ap-point at least one woman to the Executive Board.
Also regarding the appointment of women to the Executive Board of Sartorius AG, the Supervisory Board supports the activities of the Executive Board to further increase the percentage of female executives at the first two management levels in the company. The Executive Task Committee responsible and the full Supervisory Board regularly receive reports on the development of the proportions of women in senior-level management positions.
First and Second Management Levels Below the Executive Board
Disclosures Concerning the German Act on Equal Participation of Women and Men
Over the past years, the percentage of women at the first two management levels below the Executive
Board has considerably increased on the whole and is already at a comparably high level. To achieve the intended communications effect, the Executive Board had deliberately set ambitious targets for the first target achievement deadline by June 30, 2017, despite this short time horizon and the risk that these targets might not be completely met. Thus, this quota for the first management level was set at 25% and for the second level, at around 30%.
Although the percentage of women at these levels increased, both targets were not quite reached. At the end of June 2017, the proportion of women at the first management level was around 19%; that at the second level, around 28%. The reasons these targets were not met were the low fluctuation in the man-agement team and, therefore, a lower number of posi-tions to be filled, on the one hand, and consolidation of the companies acquired slightly diluted the progress achieved, on the other hand.
For the next deadline by June 30, 2022, the Executive Board resolved in the reporting year to increase the proportion of women at both levels of management below this board to around 30%.
Further Corporate Governance Practices
Risk Management
Conscientious management of commercial risks is a key principle of good corporate governance. Sartorius AG and the Group have at their disposal enterprise-wide and company-specific reporting and control systems designed to facilitate the recording, assessment and management of commercial risks. These systems are developed and adapted continuously as conditions evolve. The Executive Board informs the Supervisory Board regularly of existing risks and their development. The Audit Committee is concerned, in particular, with monitoring of the following: the accounting process including reporting; the efficacy of the internal con-trol system; risk management and the internal auditing system; compliance; and the independent statutory audit. Details on risk management are presented in the Opportunity and Risk Report.
Transparency
Sartorius AG places great importance on disclosing consistent and complete information promptly. Infor-mation about the economic position of the Group and new developments is consequently released regularly, without delay, as it becomes known in order to inform
Group Management Report Report and Declaration on Corporate Governance 75
participants in the capital market and interested members of the public at large. The annual report, first-half financial report and quarterly reports are published within the timeframes specified for this purpose. Current developments and material events are publicized as press releases and, where appropriate, ad hoc announcements. This information is usually made available in German and English simultaneously and published via suitable media and on the internet.
The chief recurring events and publications, such as the Annual General Shareholders’ Meeting, the annual report and the interim reports, are listed on a financial calendar that may be viewed at any time on the Group website.
Share Trading Activities of Supervisory and Executive Board Members
We did not receive any reports, under the applicable mandatory disclosure requirements, of any purchases or sales of shares in Sartorius AG or related financial instruments made by the members of the Executive Board and the Supervisory Board or other persons with management responsibilities or their related parties.
Supervisory Board Chairman Dr. Lothar Kappich in his capacity as executor of the estate of Horst Sartorius holds approximately 50.1% of the ordinary shares issued by the company, but otherwise no member of the Executive Board or Supervisory Board has any holding of shares or financial instruments subject to the mandatory reporting requirements that directly or indirectly exceeds 1% of the shares issued by the com-pany.
Considering the share capital increase, by use of re-tained earnings, that became effective June 1, 2016, the CEO and Chairman of the Executive Board Dr. Joachim Kreuzburg holds 100,000 ordinary shares and 100,000 preference shares in the company. These were transferred to him based on a corresponding agreement arising from his employment contract of December 18, 2015, and are subject to a minimum holding period of four years. For further information on this transfer, please see the Remuneration Report on pp. 76 et seq.
Accounting and Independent Statutory Audit
The consolidated financial statements and the Group Management Report, as well as the consolidated inter-im financial statements and reports, are prepared in accordance with the International Financial Reporting Standards (IFRS) as they are to be applied within the
EU, and according to the commercial law regulations to be applied under Section 315a, Subsection 1, of the German Commercial Code, HGB. The annual financial statements of Sartorius AG are prepared in accordance with German commercial law, HGB. The consolidated financial statements and the annual financial state-ments are prepared by the Executive Board, audited by the independent auditors elected by the Annual Gen-eral Shareholders’ Meeting and approved by the Su-pervisory Board.
It has been agreed with the independent auditors that they will notify the Supervisory Board directly of any potential disqualification or bias issues and any mate-rial findings and incidents identified during the audit. This also encompasses the corporate governance re-porting duties pursuant to § 161 of the German Stock Corporation Law (Aktiengesetz).
Basic Principles of Our Compliance Management System | Code of Conduct
With its compliance management system that is valid worldwide, Sartorius ensures that the members of its individual boards, executives and employees comply with all legal regulations and codes, and perform their activities in accordance with the company’s internal rules and guidelines. Targeted training and awareness-raising prevent any misconduct, as well as economic damage and loss of image.
Sartorius makes every effort to ensure optimal risk management by using a combination of approaches: a preventive compliance approach designed to proac-tively stop any potential breaches before they occur and a repressive compliance approach intended to continuously monitor compliance with the company's rules. These processes are closely intermeshed, creating a standardized compliance management system that aims to offer the best possible protection against potential violations of rules and regulations. Sartorius has developed a Code of Conduct as a preventive com-ponent of its compliance management system and has committed to an Anti-Corruption Code. An internal system is available for reporting any suspicious cir-cumstances involving potential compliance violations.
Further information is given in the Sustainability Report on pp. 68 et seq. and on the company’s inter-net website at www.sartorius.com.
The Supervisory Board | The Executive Board
76 Group Management Report Remuneration Report
1. Main Features of the Remuneration Plan for the Executive Board
General Information
The full Supervisory Board is responsible for establish-ing the remuneration paid to members of the Execu-tive Board of Sartorius AG. The total value of the remuneration of an Executive Board member reflects the scope of the responsibilities of the Executive Board member concerned, the Executive Board member’s personal performance, the company’s economic situa-tion and sustainable progress. In addition, the extent to which this amount of remuneration is typical is considered, taking into account peer companies and the remuneration structure in place in other areas of the company and in similar companies.
Remuneration is comprised of both fixed non-performance-based components and of variable per-formance-based components, and is reviewed annually to ensure that it remains appropriate. The variable performance-based remuneration components consist of those to be paid annually and of multi-year compo-nents intended to have a long-term incentive. Fixed non-performance-based remuneration is paid in the year in which it is granted. For 100% target achieve-ment, the variable annual and long-term performance-based components generally represent half of total remuneration, which excludes pension commitments under a defined benefit plan as well as fringe benefits.
Variable Performance-Based Remuneration
The portion of the variable performance-based remu-neration that is paid annually is based on the follow-ing weighted components: sales revenue | order intake, underlying EBITDA and the ratio of net debt to EBITDA. Minimum target achievement is required for these components. The amount to be paid out depends on the degree to which the target is achieved, which the Supervisory Board defines by setting each individual subordinate target. A cap is provided for each variable component to be paid out. Variable performance-based remuneration is calculated upon approval of the company’s annual financial statements for the respec-tive fiscal year and not settled and paid out until the following fiscal year.
Multi-year Components as Long-term Incentives
Weighted components determined by multi-year as-sessment depend on the development of consolidated net profit in a multi-year period, on the one hand, and on the development of the company’s share prices, on the other hand. Multi-year components providing a long-term incentive are based on a three-year average of consolidated net profit and on a four-year average of share prices, respectively. These components are paid out after two fiscal years for net profit and at the earliest after three fiscal years for share prices.
a) Consolidated Net Profit
For this subordinate target, the basis for assessment is the consolidated net profit after non-controlling in-terest excluding amortization (impairment of the value of intangible assets due to business combinations pursuant to IFRS 3). Target achievement for assessing annual variable remuneration in the particular year under review is based on the average taken over a period of three fiscal years, beginning with the partic-ular year under review. To smooth the amounts to be paid out, a partial payment amounting to 50% of the target achievement for the first fiscal year of each respective average period will be effected. Any over-payments as a result of these partial payments will be offset against other remuneration components once the total target achievement has been determined after the third fiscal year of an average period. A cap for this component is provided as well.
b) Phantom Stock Plan
Through the issue of shadow shares, called phantom stock, Executive Board members are treated as if they were owners of a certain number of shares in Sartori-us AG, without, however, being entitled to receive dividends. The development of the value of this phan-tom stock is linked with the development of the Sartorius share; both increases and decreases in the share price are taken into account. Later, the value of this phantom stock is assessed based on the share price at the time, and its equivalent is paid out, pro-vided that the associated conditions are met. Phantom stock cannot be traded and does not entail any share subscription rights.
According to the Sartorius phantom stock plan, each Executive Board member is credited at the beginning of every year with phantom stock units valued at an
Remuneration Report
Group Management Report Remuneration Report 77
agreed monetary sum. The value of this phantom stock can be paid out only as an entire annual tranche. Payment can be requested, at the earliest, after a period of four years and no later than after eight years.
An Executive Board member is entitled to receive payment for phantom stock units only if the share price at the time of such payment request has appre-ciated at least 7.5% per year relative to the time the phantom stock was assigned or if the share price out-performed the TecDAX as a comparative index. The phantom stock plan rules out subsequent changes to the parameters used for comparative stock valuation. The amount to be paid is capped at a maximum of 2.5 times the share price at the time the phantom stock was assigned, based in each case on the actual annual tranche concerned.
Assignment of this phantom stock and later payment of its monetary equivalent depend on the mean value calculated from the average prices of both classes of Sartorius AG share, up to the year 2015, and as of the year 2016, on the mean value calculated from the average prices of the preference share, with said prices quoted in the closing auction of Xetra trading on the Frankfurt Stock Exchange over the last 20 days of trading of the previous year or over the last 20 days of trading prior to submission of a payment request. This serves to compensate for any short-term fluctua-tions in the share prices.
Payment for phantom stock is blocked for the four weeks preceding the scheduled publication date of quarterly and preliminary year-end results and for 20 days of trading on the stock exchange following the actual publication of quarterly and preliminary year-end results. These blackout periods are intended to prevent Executive Board members' profiting from their insider knowledge.
Pension Commitments
According to the company’s remuneration policy, Executive Board members of Sartorius AG receive performance-related benefit commitments under a defined benefit plan when reappointed for the first time. In addition to including a basic pension, these commitments provide for the Executive Board member to make his own contribution from his variable earn-ings and for the company to match this contribution by a bonus amount. An Executive Board member may choose to receive such defined benefits in the form of a retirement pension for old age or as a one-time payment to cover the member’s retirement pension for old age and invalidity as well as in the form of survi-
vor’s benefits for the surviving spouse and children of the decedent.
Beyond such commitments, an Executive Board member is additionally entitled under a former company pen-sion scheme to receive performance-based retirement benefits based on the salary of a German federal civil servant classified as grade 10 of salary class B for ministry officials according to the Federal Civil Service Remuneration Act (Bundesbesoldungsgesetz). Such bene-fits are paid in the form of a retirement pension or old age and invalidity as well as in the form of survivors' benefits for the surviving spouse and children of the decedent.
After a member has turned 65, this shall be considered the regular age limit at which this member shall auto-matically be entitled to receive all such benefits.
Other Remuneration Components
The remuneration system provides that the Supervisory Board of Sartorius AG at its discretion may grant an Executive Board member special compensation based on that member's exceptional performance.
Early Termination of Executive Board Duties
In the event of any early termination of Executive Board duties, the employment contracts of Executive Board members provide for severance to be capped to a maximum of two annual salaries.
Non-competition Clause
The employment contracts provide for a post-contractual non-competition clause for a duration of two years upon termination of employment with the company. In the event that this non-competition clause is not waived or is nullified, half of the remu-neration last paid shall be granted for the duration of the non-competition period.
Fringe Benefits
Beyond the remuneration components stated above, the members of the Executive Board are each entitled to use a company car, reclaim expenses incurred on business travel and to be covered by accident insur-ance and D&O insurance as fringe benefits. D&O insurance provides for the application of a de-ductible or excess in the amount required by law.
78 Group Management Report Remuneration Report
Share-based Payment
As a rule, the remuneration policy for Executive Board members does not provide for the transfer of Sartori-us AG shares as compensation for members. An excep-tion to this policy rule was made in December 2014 for Dr. Kreuzburg, who was granted entitlement to receive share-based remuneration due to the third extension of his appointment as a member of the Executive Board and as its Chairman and CEO; please refer to Section 3 in this chapter.
2. Remuneration of the Executive Board Members in the Reporting Year
In 2017, the total remuneration for active service provided by all Executive Board members totaled €3,492 K relative to €3,299 K in 2016. Of this aggre-gate total, €1,892 K accounted for non-performance-based components as “fixed remuneration” (2016: €1,672 K) and €1,600 K for variable performance-based components and multi-year components with a long-term incentive (2016: €1,627 K). Furthermore, as part of the pension commitments to the Executive Board members, the pension service cost totaling €430 K in the reporting year was expensed, following on €393 K in the prior year.
Total Remuneration of the Executive Board Pursuant to § 314, Subsec. 1, No. 6, of the German Commercial Code (HGB)
Executive Board (total)
Dr. Joachim Kreuzburg
Rainer Lehmann(as of
March 1, 2017)
Jörg Pfirrmann(until
Feb. 28, 2017)
Reinhard Vogt
€ in K 2017 2016 2017 2016 2017 2016 2017 2016 2017 2016
Fixed remuneration 1,739 1,625 832 800 333 0 54 325 520 500
Fringe benefits1) 153 47 15 15 117 0 2 13 19 19
Fixed remuneration 1,892 1,672 847 815 450 0 56 338 539 519Variable performance-based remuneration (1 year)2) 759 850
363 418145 0 24 170 227 262
Variable multi-year components w/ long-term incentive
Consolidated net profit (3 years)3) 375 371 184 182 0 0 79 78 112 111
Phantom stock plan (4 - 8 years)4) 466 406 208 200 83 0 45 81 130 125
1,600 1,627 755 800 228 0 148 329 469 498
Total remuneration 3,492 3,299 1,602 1,615 678 0 204 667 1,008 1,017
1) The amounts contributed to D&O insurance totaling €161 K (2016: €171 K) are not included as these refer to the executive bodies of all companies of the Sartorius Group and are not allocated to the individual insurees.
2) Amount corresponds to actual target achievement 3) Amount corresponds to actual target achievement of the plan in which a fiscal year ended; i.e., for 2017, consolidated net profits for
2015 –2017 (2016: consolidated net profits for 2014–2016) 4) Fair value at the time granted
As part of the remuneration component based on the consolidated net profit of three consecutive fiscal years, each Executive Board member receives a partial compensation payment of 50% of his respective target achievement for the first fiscal year under review. Once the total target achievement has been deter-mined after the third fiscal year, final payment is then effected by deducting the particular partial payment already made. The amounts of the partial payments made in total at the end of the reporting year are shown as follows:
2017¤ in K
2016€ in K
Balance as of Jan. 1 of a fiscal year 387 311
Partial payments deducted –165 –146
Partial payments effected 169 222
Balance as of Dec. 31 of a fiscal year 391 387
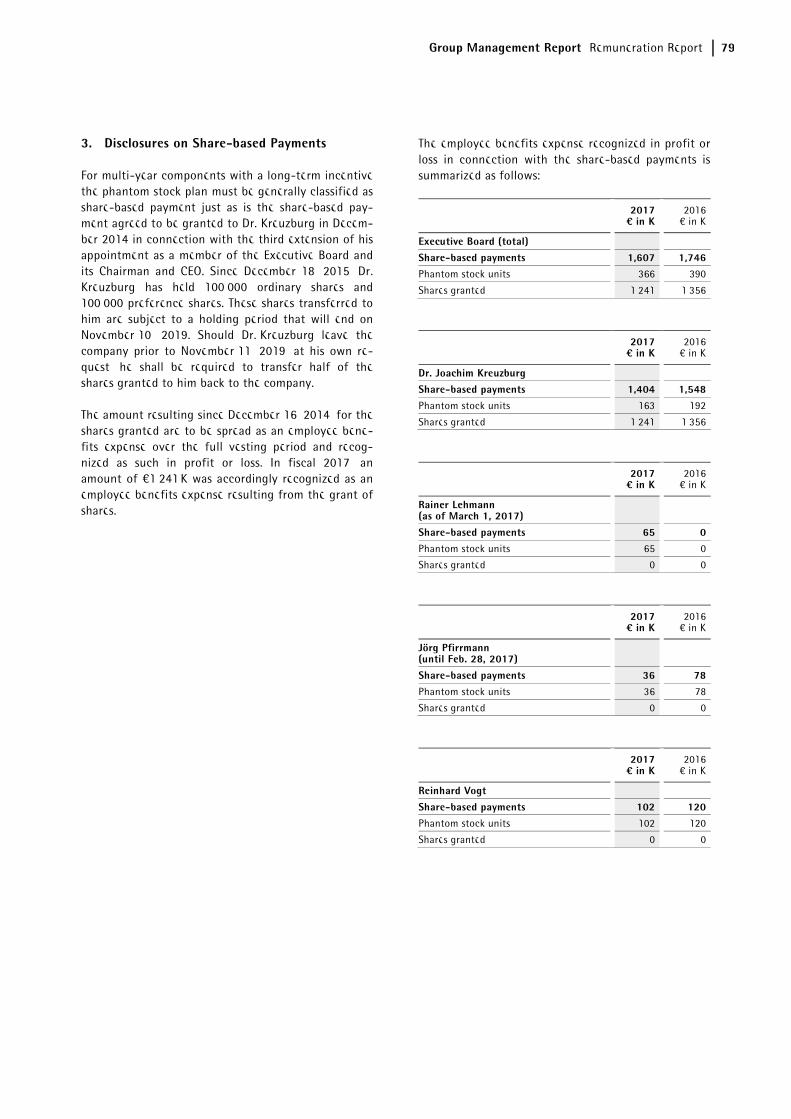
Group Management Report Remuneration Report 79
3. Disclosures on Share-based Payments
For multi-year components with a long-term incentive, the phantom stock plan must be generally classified as share-based payment just as is the share-based pay-ment agreed to be granted to Dr. Kreuzburg in Decem-ber 2014 in connection with the third extension of his appointment as a member of the Executive Board and its Chairman and CEO. Since December 18, 2015, Dr. Kreuzburg has held 100,000 ordinary shares and 100,000 preference shares. These shares transferred to him are subject to a holding period that will end on November 10, 2019. Should Dr. Kreuzburg leave the company prior to November 11, 2019, at his own re-quest, he shall be required to transfer half of the shares granted to him back to the company.
The amount resulting since December 16, 2014, for the shares granted are to be spread as an employee bene-fits expense over the full vesting period and recog-nized as such in profit or loss. In fiscal 2017, an amount of €1,241 K was accordingly recognized as an employee benefits expense resulting from the grant of shares.
The employee benefits expense recognized in profit or loss in connection with the share-based payments is summarized as follows:
2017¤ in K
2016€ in K
Executive Board (total) Share-based payments 1,607 1,746Phantom stock units 366 390
Shares granted 1,241 1,356
2017¤ in K
2016€ in K
Dr. Joachim Kreuzburg Share-based payments 1,404 1,548Phantom stock units 163 192
Shares granted 1,241 1,356
2017¤ in K
2016€ in K
Rainer Lehmann (as of March 1, 2017)
Share-based payments 65 0Phantom stock units 65 0
Shares granted 0 0
2017¤ in K
2016€ in K
Jörg Pfirrmann (until Feb. 28, 2017)
Share-based payments 36 78Phantom stock units 36 78
Shares granted 0 0
2017¤ in K
2016€ in K
Reinhard Vogt
Share-based payments 102 120Phantom stock units 102 120
Shares granted 0 0
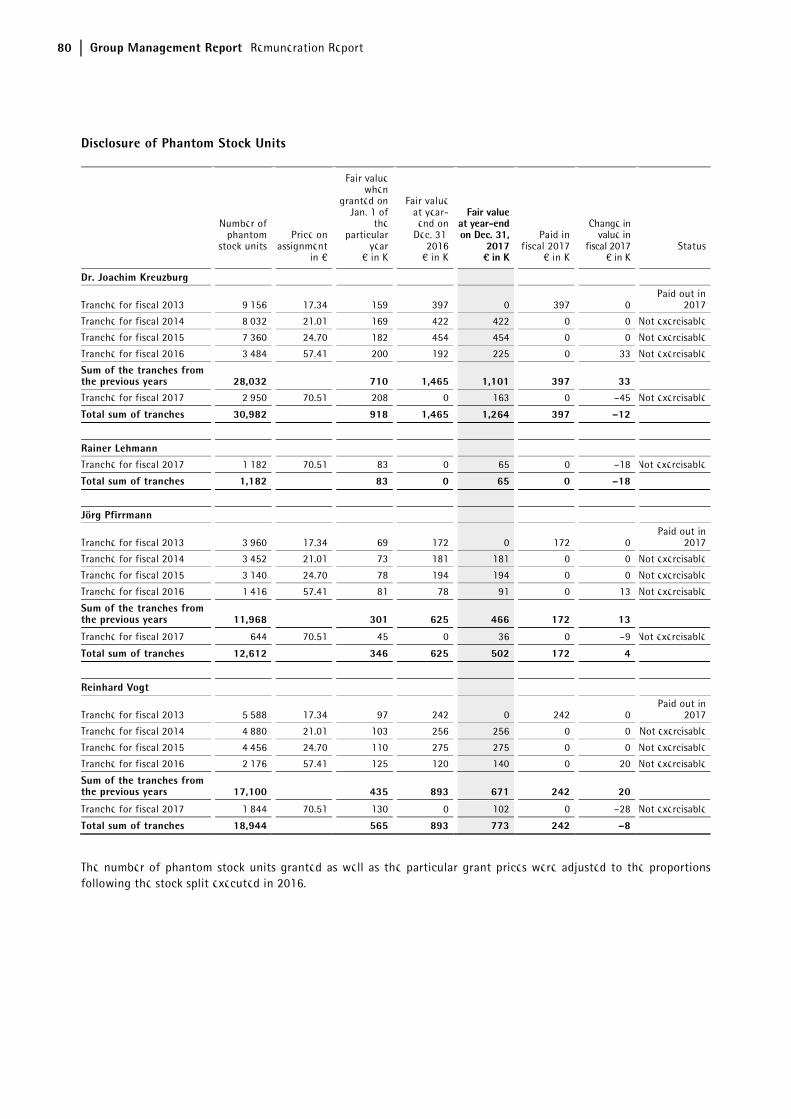
80 Group Management Report Remuneration Report
Disclosure of Phantom Stock Units
Number of phantom
stock unitsPrice on
assignmentin €
Fair value when
granted on Jan. 1 of
the particular
year€ in K
Fair value at year-end on
Dec. 31, 2016
€ in K
Fair value at year-endon Dec. 31,
2017¤ in K
Paid in fiscal 2017
€ in K
Change in value in
fiscal 2017€ in K
Status
Dr. Joachim Kreuzburg
Tranche for fiscal 2013 9,156 17.34 159 397 0 397 0Paid out in
2017
Tranche for fiscal 2014 8,032 21.01 169 422 422 0 0 Not exercisable
Tranche for fiscal 2015 7,360 24.70 182 454 454 0 0 Not exercisable
Tranche for fiscal 2016 3,484 57.41 200 192 225 0 33 Not exercisable
Sum of the tranches from the previous years 28,032 710 1,465 1,101 397 33Tranche for fiscal 2017 2,950 70.51 208 0 163 0 –45 Not exercisable
Total sum of tranches 30,982 918 1,465 1,264 397 –12
Rainer Lehmann Tranche for fiscal 2017 1,182 70.51 83 0 65 0 –18 Not exercisable
Total sum of tranches 1,182 83 0 65 0 –18
Jörg Pfirrmann
Tranche for fiscal 2013 3,960 17.34 69 172 0 172 0Paid out in
2017
Tranche for fiscal 2014 3,452 21.01 73 181 181 0 0 Not exercisable
Tranche for fiscal 2015 3,140 24.70 78 194 194 0 0 Not exercisable
Tranche for fiscal 2016 1,416 57.41 81 78 91 0 13 Not exercisable
Sum of the tranches from the previous years 11,968 301 625 466 172 13
Tranche for fiscal 2017 644 70.51 45 0 36 0 –9 Not exercisable
Total sum of tranches 12,612 346 625 502 172 4
Reinhard Vogt
Tranche for fiscal 2013 5,588 17.34 97 242 0 242 0Paid out in
2017
Tranche for fiscal 2014 4,880 21.01 103 256 256 0 0 Not exercisable
Tranche for fiscal 2015 4,456 24.70 110 275 275 0 0 Not exercisable
Tranche for fiscal 2016 2,176 57.41 125 120 140 0 20 Not exercisable
Sum of the tranches from the previous years 17,100 435 893 671 242 20
Tranche for fiscal 2017 1,844 70.51 130 0 102 0 –28 Not exercisable
Total sum of tranches 18,944 565 893 773 242 –8
The number of phantom stock units granted as well as the particular grant prices were adjusted to the proportions following the stock split executed in 2016.
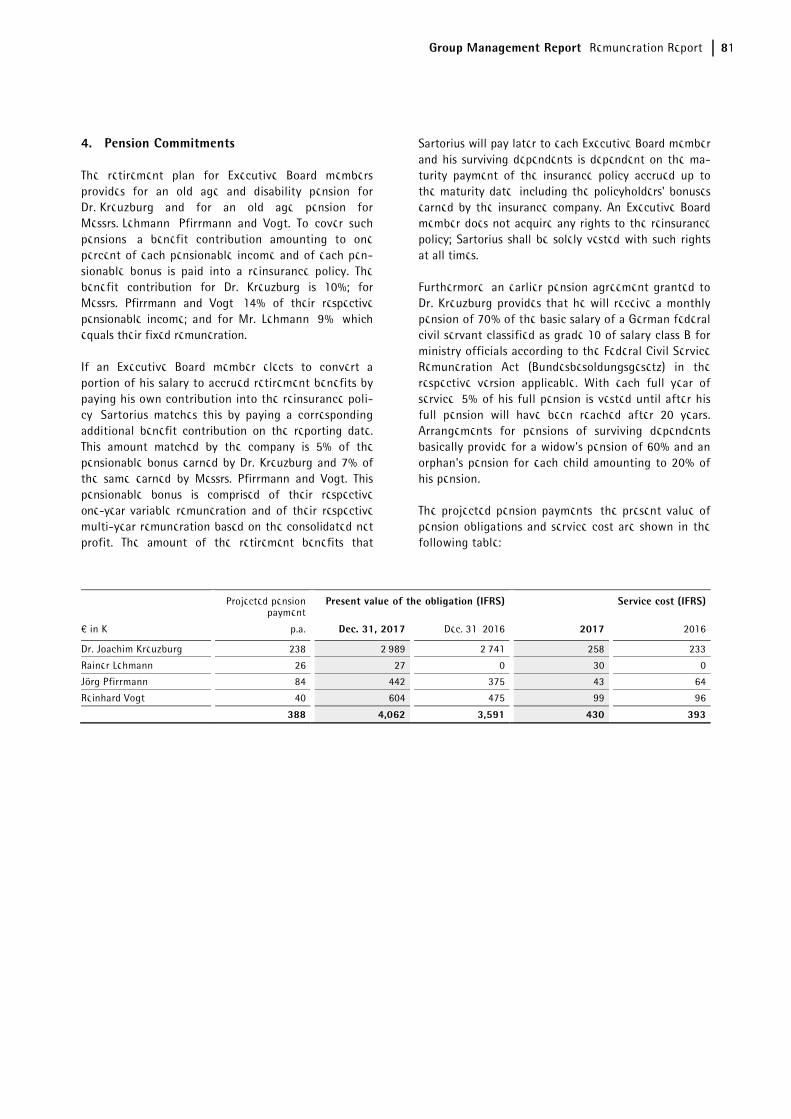
Group Management Report Remuneration Report 81
4. Pension Commitments
The retirement plan for Executive Board members provides for an old age and disability pension for Dr. Kreuzburg and for an old age pension for Messrs. Lehmann, Pfirrmann and Vogt. To cover such pensions, a benefit contribution amounting to one percent of each pensionable income and of each pen-sionable bonus is paid into a reinsurance policy. The benefit contribution for Dr. Kreuzburg is 10%; for Messrs. Pfirrmann and Vogt, 14% of their respective pensionable income; and for Mr. Lehmann, 9%, which equals their fixed remuneration.
If an Executive Board member elects to convert a portion of his salary to accrued retirement benefits by paying his own contribution into the reinsurance poli-cy, Sartorius matches this by paying a corresponding additional benefit contribution on the reporting date. This amount matched by the company is 5% of the pensionable bonus earned by Dr. Kreuzburg and 7% of the same earned by Messrs. Pfirrmann and Vogt. This pensionable bonus is comprised of their respective one-year variable remuneration and of their respective multi-year remuneration based on the consolidated net profit. The amount of the retirement benefits that
Sartorius will pay later to each Executive Board member and his surviving dependents is dependent on the ma-turity payment of the insurance policy accrued up to the maturity date, including the policyholders' bonuses earned by the insurance company. An Executive Board member does not acquire any rights to the reinsurance policy; Sartorius shall be solely vested with such rights at all times.
Furthermore, an earlier pension agreement granted to Dr. Kreuzburg provides that he will receive a monthly pension of 70% of the basic salary of a German federal civil servant classified as grade 10 of salary class B for ministry officials according to the Federal Civil Service Remuneration Act (Bundesbesoldungsgesetz) in the respective version applicable. With each full year of service, 5% of his full pension is vested until after his full pension will have been reached after 20 years. Arrangements for pensions of surviving dependents basically provide for a widow's pension of 60% and an orphan's pension for each child amounting to 20% of his pension.
The projected pension payments, the present value of pension obligations and service cost are shown in the following table:
Projected pension payment
Present value of the obligation (IFRS) Service cost (IFRS)
€ in K p.a. Dec. 31, 2017 Dec. 31, 2016 2017 2016
Dr. Joachim Kreuzburg 238 2,989 2,741 258 233
Rainer Lehmann 26 27 0 30 0
Jörg Pfirrmann 84 442 375 43 64
Reinhard Vogt 40 604 475 99 96
388 4,062 3,591 430 393
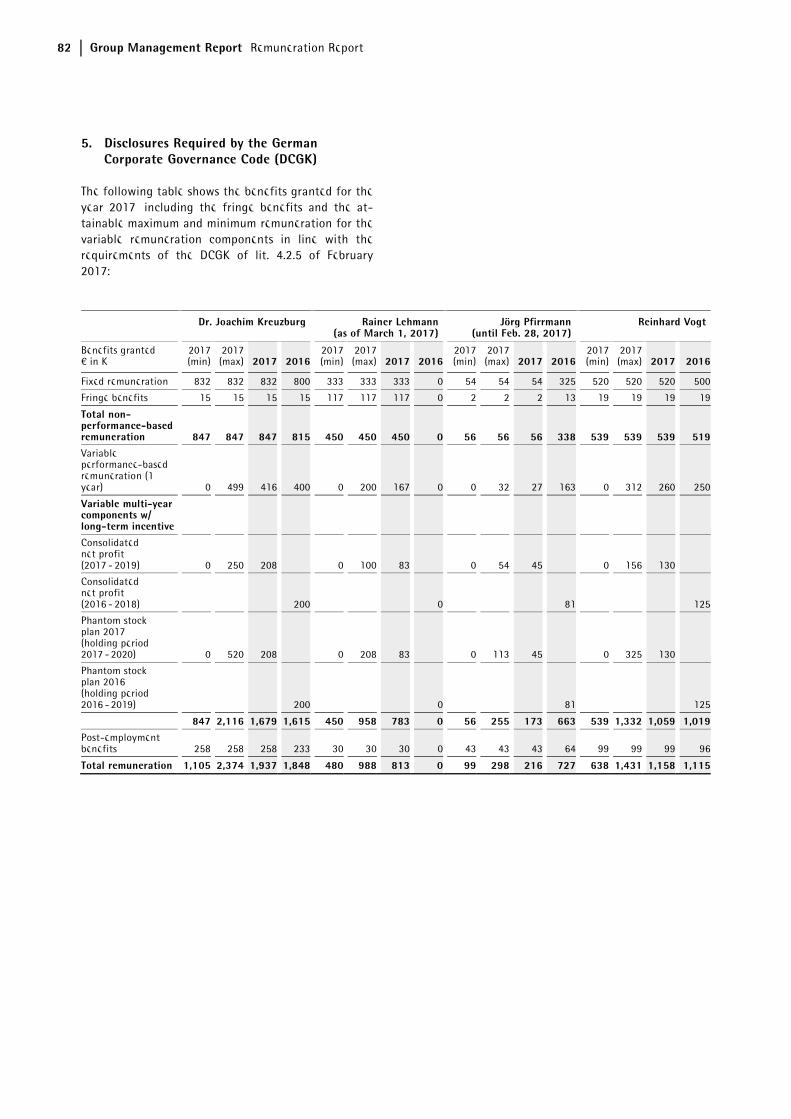
82 Group Management Report Remuneration Report
5. Disclosures Required by the German Corporate Governance Code (DCGK)
The following table shows the benefits granted for the year 2017, including the fringe benefits and the at-tainable maximum and minimum remuneration for the variable remuneration components in line with the requirements of the DCGK of lit. 4.2.5 of February 2017:
Dr. Joachim Kreuzburg Rainer Lehmann(as of March 1, 2017)
Jörg Pfirrmann(until Feb. 28, 2017)
Reinhard Vogt
Benefits granted € in K
2017 (min)
2017 (max) 2017 2016
2017 (min)
2017 (max) 2017 2016
2017 (min)
2017 (max) 2017 2016
2017 (min)
2017 (max) 2017 2016
Fixed remuneration 832 832 832 800 333 333 333 0 54 54 54 325 520 520 520 500
Fringe benefits 15 15 15 15 117 117 117 0 2 2 2 13 19 19 19 19
Total non-performance-based remuneration 847 847 847 815 450 450 450 0 56 56 56 338 539 539 539 519Variable performance-based remuneration (1 year) 0 499 416 400 0 200 167 0 0 32 27 163 0 312 260 250
Variable multi-year components w/ long-term incentive
Consolidated net profit (2017 - 2019) 0 250 208 0 100 83 0 54 45 0 156 130
Consolidated net profit (2016 - 2018) 200 0 81 125
Phantom stock plan 2017 (holding period 2017 - 2020) 0 520 208 0 208 83 0 113 45 0 325 130
Phantom stock plan 2016 (holding period 2016 - 2019) 200 0 81 125
847 2,116 1,679 1,615 450 958 783 0 56 255 173 663 539 1,332 1,059 1,019Post-employment benefits 258 258 258 233 30 30 30 0 43 43 43 64 99 99 99 96
Total remuneration 1,105 2,374 1,937 1,848 480 988 813 0 99 298 216 727 638 1,431 1,158 1,115
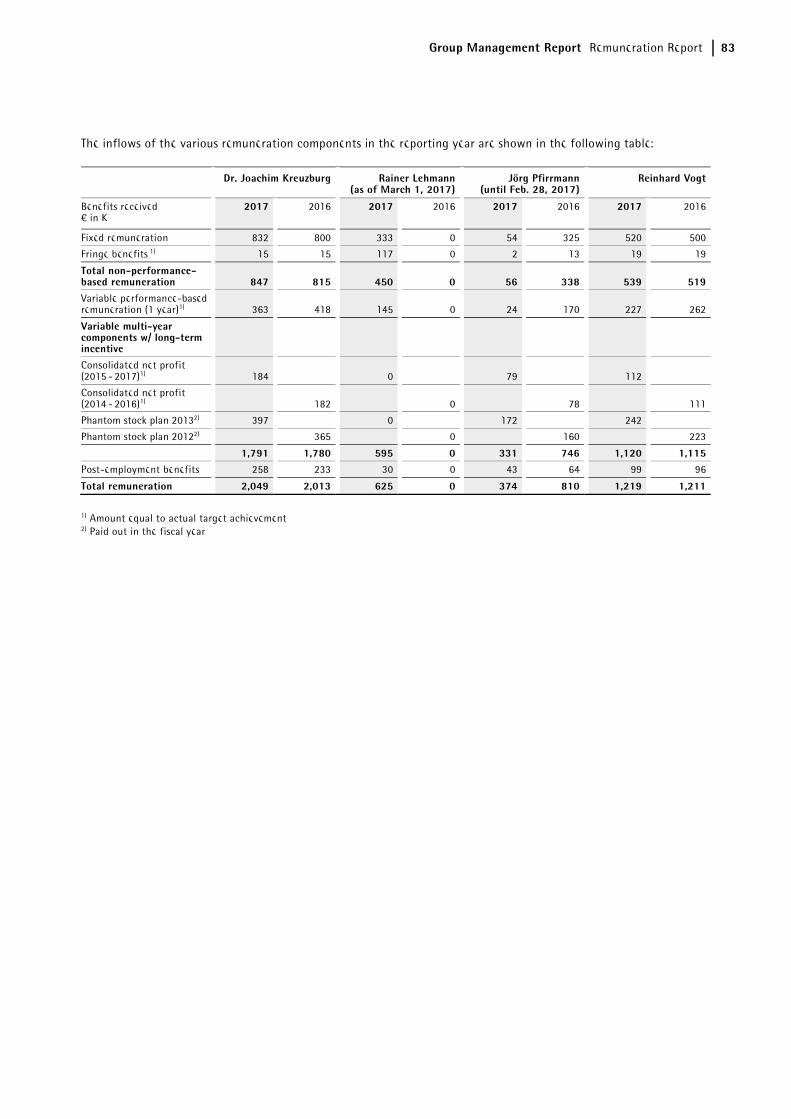
Group Management Report Remuneration Report 83
The inflows of the various remuneration components in the reporting year are shown in the following table:
Dr. Joachim Kreuzburg Rainer Lehmann(as of March 1, 2017)
Jörg Pfirrmann(until Feb. 28, 2017)
Reinhard Vogt
Benefits received € in K
2017 2016 2017 2016 2017 2016 2017 2016
Fixed remuneration 832 800 333 0 54 325 520 500
Fringe benefits 1) 15 15 117 0 2 13 19 19
Total non-performance-based remuneration 847 815 450 0 56 338 539 519
Variable performance-based remuneration (1 year)1) 363 418 145 0 24 170 227 262
Variable multi-year components w/ long-term incentive
Consolidated net profit (2015 - 2017)1) 184 0 79 112
Consolidated net profit (2014 - 2016)1) 182 0 78 111
Phantom stock plan 20132) 397 0 172 242
Phantom stock plan 20122) 365 0 160 223
1,791 1,780 595 0 331 746 1,120 1,115Post-employment benefits 258 233 30 0 43 64 99 96
Total remuneration 2,049 2,013 625 0 374 810 1,219 1,211
1) Amount equal to actual target achievement 2) Paid out in the fiscal year
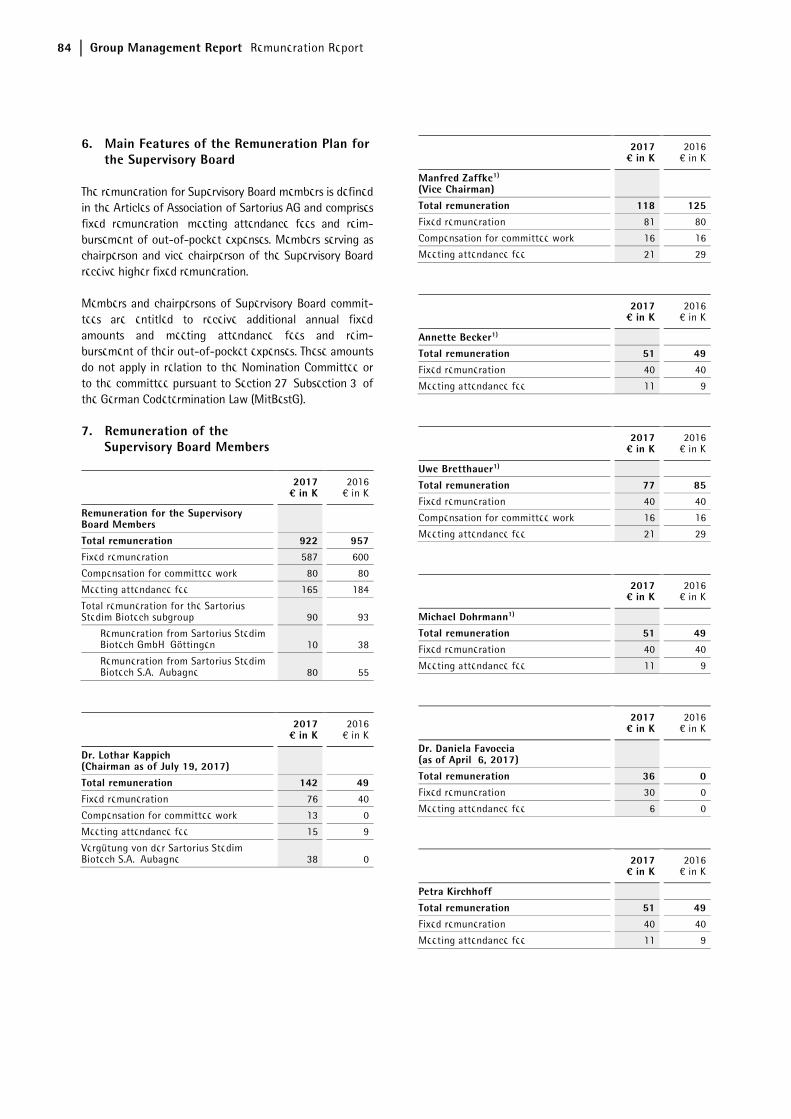
84 Group Management Report Remuneration Report
6. Main Features of the Remuneration Plan for the Supervisory Board
The remuneration for Supervisory Board members is defined in the Articles of Association of Sartorius AG and comprises fixed remuneration, meeting attendance fees and reim-bursement of out-of-pocket expenses. Members serving as chairperson and vice chairperson of the Supervisory Board receive higher fixed remuneration.
Members and chairpersons of Supervisory Board commit-tees are entitled to receive additional annual fixed amounts and meeting attendance fees and reim-bursement of their out-of-pocket expenses. These amounts do not apply in relation to the Nomination Committee or to the committee pursuant to Section 27, Subsection 3, of the German Codetermination Law (MitBestG).
7. Remuneration of the Supervisory Board Members
2017¤ in K
2016€ in K
Remuneration for the Supervisory Board Members
Total remuneration 922 957Fixed remuneration 587 600
Compensation for committee work 80 80
Meeting attendance fee 165 184
Total remuneration for the Sartorius Stedim Biotech subgroup 90 93
Remuneration from Sartorius Stedim Biotech GmbH, Göttingen 10 38
Remuneration from Sartorius Stedim Biotech S.A., Aubagne 80 55
2017¤ in K
2016€ in K
Dr. Lothar Kappich (Chairman as of July 19, 2017)
Total remuneration 142 49Fixed remuneration 76 40
Compensation for committee work 13 0
Meeting attendance fee 15 9
Vergütung von der Sartorius Stedim Biotech S.A., Aubagne 38 0
2017¤ in K
2016€ in K
Manfred Zaffke1)
(Vice Chairman)
Total remuneration 118 125Fixed remuneration 81 80
Compensation for committee work 16 16
Meeting attendance fee 21 29
2017¤ in K
2016€ in K
Annette Becker1)
Total remuneration 51 49Fixed remuneration 40 40
Meeting attendance fee 11 9
2017¤ in K
2016€ in K
Uwe Bretthauer1)
Total remuneration 77 85Fixed remuneration 40 40
Compensation for committee work 16 16
Meeting attendance fee 21 29
2017¤ in K
2016€ in K
Michael Dohrmann1)
Total remuneration 51 49Fixed remuneration 40 40
Meeting attendance fee 11 9
2017¤ in K
2016€ in K
Dr. Daniela Favoccia (as of April 6, 2017)
Total remuneration 36 0Fixed remuneration 30 0
Meeting attendance fee 6 0
2017¤ in K
2016€ in K
Petra Kirchhoff Total remuneration 51 49Fixed remuneration 40 40
Meeting attendance fee 11 9
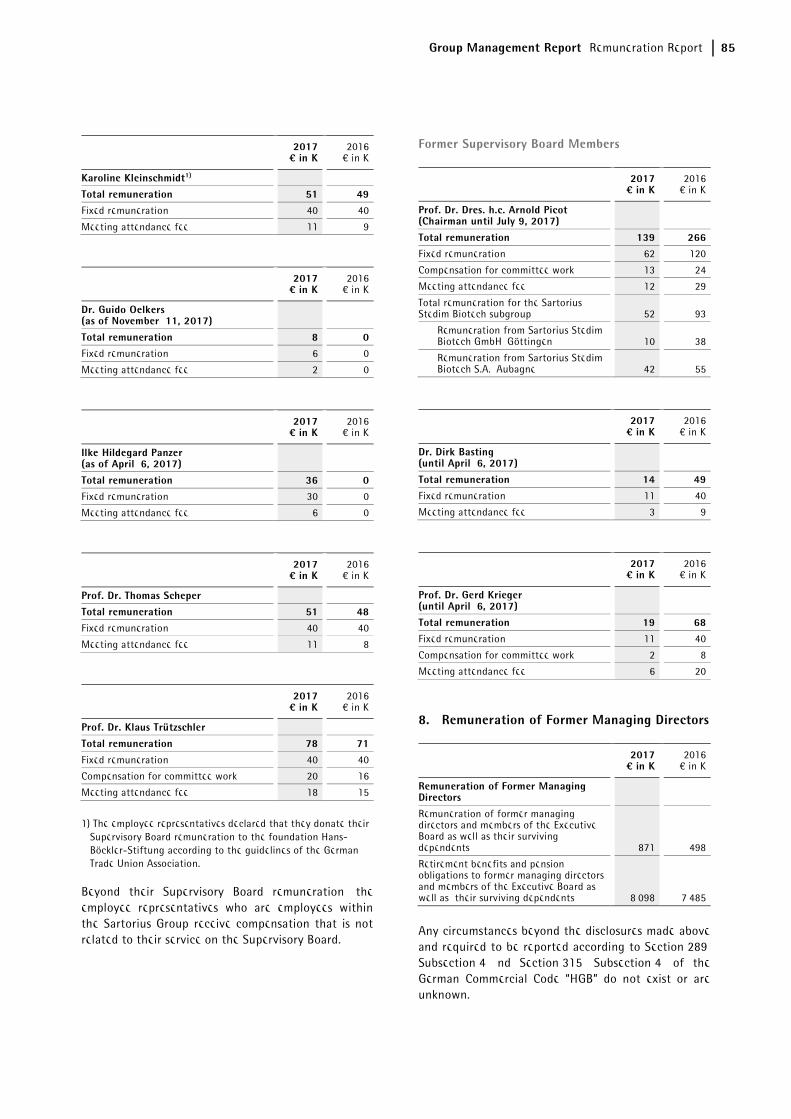
Group Management Report Remuneration Report 85
2017¤ in K
2016€ in K
Karoline Kleinschmidt1)
Total remuneration 51 49Fixed remuneration 40 40
Meeting attendance fee 11 9
2017¤ in K
2016€ in K
Dr. Guido Oelkers (as of November 11, 2017)
Total remuneration 8 0Fixed remuneration 6 0
Meeting attendance fee 2 0
2017¤ in K
2016€ in K
Ilke Hildegard Panzer (as of April 6, 2017)
Total remuneration 36 0Fixed remuneration 30 0
Meeting attendance fee 6 0
2017¤ in K
2016€ in K
Prof. Dr. Thomas Scheper Total remuneration 51 48Fixed remuneration 40 40
Meeting attendance fee 11 8
2017¤ in K
2016€ in K
Prof. Dr. Klaus Trützschler
Total remuneration 78 71Fixed remuneration 40 40
Compensation for committee work 20 16
Meeting attendance fee 18 15
1) The employee representatives declared that they donate their Supervisory Board remuneration to the foundation Hans-Böckler-Stiftung according to the guidelines of the German Trade Union Association.
Beyond their Supervisory Board remuneration, the employee representatives who are employees within the Sartorius Group receive compensation that is not related to their service on the Supervisory Board.
Former Supervisory Board Members
2017¤ in K
2016€ in K
Prof. Dr. Dres. h.c. Arnold Picot (Chairman until July 9, 2017)
Total remuneration 139 266Fixed remuneration 62 120
Compensation for committee work 13 24
Meeting attendance fee 12 29
Total remuneration for the Sartorius Stedim Biotech subgroup 52 93
Remuneration from Sartorius Stedim Biotech GmbH, Göttingen 10 38
Remuneration from Sartorius Stedim Biotech S.A., Aubagne 42 55
2017¤ in K
2016€ in K
Dr. Dirk Basting (until April 6, 2017)
Total remuneration 14 49Fixed remuneration 11 40
Meeting attendance fee 3 9
2017¤ in K
2016€ in K
Prof. Dr. Gerd Krieger (until April 6, 2017)
Total remuneration 19 68Fixed remuneration 11 40
Compensation for committee work 2 8
Meeting attendance fee 6 20
8. Remuneration of Former Managing Directors
2017¤ in K
2016€ in K
Remuneration of Former Managing Directors
Remuneration of former managing directors and members of the Executive Board as well as their surviving dependents 871 498
Retirement benefits and pension obligations to former managing directors and members of the Executive Board as well as their surviving dependents 8,098 7,485
Any circumstances beyond the disclosures made above and required to be reported according to Section 289, Subsection 4, nd Section 315, Subsection 4, of the German Commercial Code “HGB” do not exist or are unknown.
86 Group Management Report | Non-Financial Group Statement Our Approach to Sustainability
Sartorius is an internationally leading partner to the pharmaceutical industry. Our technologies play a sig-nificant role in helping the industry to promote hu-man health.
We contribute in many different ways to deliver bene-fits to society: our laboratory instruments and con-sumables are used in research, where they support scientific progress. Beyond this, our products are used in the biopharmaceutical industry to produce medical drugs safely and efficiently as well as to ensure their quality.
We want to advance scientific progress by recognizing new trends in our industry and by combining and further developing technologies, thus contributing to the acceleration of development and production pro-cesses in pharmaceutical companies. In this way, inno-vative medications can be launched on the market more quickly and made available to larger groups of people. Biopharmaceutical drugs, in particular, present new therapy options, especially for individuals with serious or rare diseases.
Apart from our own development work, which focuses primarily on our core technologies, we have tradition-ally relied on development partnerships with other companies and research institutions. This enables us to integrate new technologies and products into our portfolio quickly and to bring our experience and knowledge to bear in furthering general scientific progress.
Ensuring that our manufacturing operations and our products also meet ecological sustainability criteria is a key aspect underpinning our long-term financial success. Sartorius designs its manufacturing processes and products with resource efficiency in mind. We implement our objective of achieving growth coupled with an underproportional use of natural resources at various levels. The expansion of our infrastructure also reflects the importance we place on environmental sustainability and adding value to society.
From a customer perspective, our flexible, cost-optimized single-use technologies contribute to the environmental element of our sustainability strategy. Not only do such technologies reduce the risk of con-tamination, but they also negate the need for chemi-cals-based cleaning – which enables manufacturers to save significant resources in production while reduc-ing the use of hazardous materials.
We maintain an open, constructive dialog with our stakeholders, whose perspectives and opinions offer us valuable input that enables us to continuously im-prove our business workflows, implement our sustain-ability strategy and achieve our goals.
Our business is built on a desire to shape the future combined with reliability and a commitment to quality, and our sustainability strategy reflects those qualities.
We want use our pioneering spirit to shape the futureby turning science and innovation into solutions tai-lored precisely to our customers’ needs. We also want to advance scientific progress in society and improve access to medical care and innovative pharmaceutical products. Our employees are the key factor in ensuring our future viability. We appreciate them and support them in their professional development.
We want to be a reliable partner. This means managing the Group responsibly, maintaining high standards of environmental protection and serving the needs of society.
For the Sartorius Group, a company nearing its 150th year in business, sustainability is an inherent value embedded in its DNA. Our business model is one that supports sustainability and delivers benefits to society. One of the factors in our success is our ability to closely interweave social and environmental objectives with the company’s financial targets on a lasting basis. We have established indicators for our key action areas designed to measure our business performance and help plan for the future.
Sartorius has made sustainability a responsibility of the Chief Executive Officer in recognition of its over-arching importance for the company.
About the Non-financial Group Statement
In addition to the key financial performance indicators used to manage the Sartorius Group, we have defined non-financial indicators that enable us to assess the impact of our business activities on stakeholders, the environment and society.
This non-financial Group statement was prepared in accordance with the disclosures set out in Sec-tion 315b and 315c in conjunction with Sections 289c to 289e of the German Commercial Code (HGB). Pur-suant to Section 315b, Subsection 1, Sentence 3 HGB, reference is also made to individual non-financial
Our Approach to Sustainability
Group Management Report | Non-Financial Group Statement Our Approach to Sustainability 87
aspects contained elsewhere in the Group Manage-ment Report.
For the “non-financial group statement,” we orient ourselves toward the reporting framework developed by the Global Reporting Initiative (GRI) – the Sustain-ability Reporting Standards – using the “in accord-ance” (core) option. Our goal is to conform to the GRI Standard “core” as of next year so that we can ensure transparency and comparability. The GRI Content In-dex that starts on page 114 offers an overview of the standard disclosures in addition to economic, envi-ronmental and social performance indicators.
The reporting period for the non-financial Group statement is the fiscal year. Unless otherwise indicated, the employee-related data covers all Sartorius compa-nies. Unless otherwise specified, the environmental indicators encompass all our production companies, representing 73.3% of the total headcount. Most of the data has been gathered internally; in addition, data on consumption is provided by our utility companies.
This non-financial group statement was audited by KPMG in the form of an audit with limited assurance. A sustainability report for our subgroup Sartorius Stedim Biotech S.A. accounting for over two-thirds of all Sartorius activities is an integral part of the audit of the former’s annual financial statements.
Organizational Profile
Please refer to page 22 - 27, sections "Structure and Managementof the Group" and "Strategy and Goals" of the Management Report.
Stakeholder Involvement
The Global Reporting Initiative guidelines focus in particular on identifying relevant stakeholders and material topics.
We define stakeholders as those persons, companies, institutions and interest groups that are able to influ-ence the success of the Sartorius Group or that are impacted by the actions of our company.
Due to its business model, Sartorius engages in a very close ongoing dialog with its stakeholders. The compa-ny takes advantage of this exchange to identify the specific aspects of sustainability and responsible cor-porate governance that are most relevant to the vari-ous groups.
With respect to sustainability, we view our customers, employees, investors and society as our most im-portant stakeholders. Beyond these, suppliers and business partners have a stake in the prosperous de-velopment of our company and in our responsible conduct.
As we earn around 80% of our revenue through direct sales, we are in close contact with our customers. We also obtain ongoing information about our customers’ current requirements and priorities through audits, product demonstrations and tests that we perform in our application laboratories as well as through coop-eration with customers in product development.
Motivated and efficient employees are indispensable in ensuring our business success. Regional and Group-wide employee surveys, annual performance reviews and an open working atmosphere help us discover what our employees find satisfying about the company, and where they see potential for improvement. The results of these surveys suggest relevant topics that we implement as specific plans of action at our local sites.
Investor relations activities at Sartorius aim to create transparency and continuity for our investors. We engage in a dialog with our investors about our envi-ronmental and social responsibility as well as corpo-rate governance topics at investor conferences and roadshows and as part of capital market days. Sartorius participates in sustainability analyses and ratings to gauge its performance with respect to its environmental, social and governance-related business practices (ESG). MSCI ESG Research, for example, one of the world’s largest rating agencies in this field, rated Sartorius as AA with respect to sustainability aspects in 2016 – the second best evaluation.
Sartorius maintains good relationships with local resi-dents and public authorities, and considers their inter-ests and expectations of our business activities. Such interests and expectations relate, in particular, to paying our fair share of taxes, maintaining job security, complying with legal requirements, conserving and protecting environmental resources and promoting infrastructure.
To us, potential employees are a special social group. Young and qualified employees in particular appreci-ate companies that take social responsibility. A value-oriented corporate culture and sustained employee commitment help convey a positive image of Sartorius to social communities, thus increasing our attractive-ness as an employer.
88 Group Management Report | Non-Financial Group Statement Our Approach to Sustainability
Materiality Analysis
Materiality identification process
Topics material to the business activities of the Sartorius Group were first discussed with the Execu-tive Board and risk management.
Thanks to the close dialog we maintain with our stakeholders, we have gained a good understanding of their needs and their views. We took these views into account in deciding on materiality.
Finally, experts from Sartorius identified topics of particular relevance in two workshops attended by the functions of Research and Development, Sales, Mar-keting, Corporate Communication, Investor Relations, Human Resources Management, Purchasing, Legal Affairs and Compliance along with the employees’ council.
The topics defined as material were those that are important for the business activities of Sartorius and the resultant outcomes.
To determine which environmental, social and govern-ance (ESG) topics are material for Sartorius, we con-ducted a survey of 87 potentially relevant topics. We consulted a number of sources in compiling the list of topics, including
– various reporting standards, such as the GRI and the German Sustainability Code;
– input from our stakeholders gained from many contacts (see “Stakeholder Involvement”);
– content from ESG ratings questionnaires;
– web research and CSR reports from our peer group; and
– internal expert report, including assessments by the Executive Board and managers
In a structured, online survey, participants were able to rate the proposed topics as “not relevant,” “rele-vant,” or “highly relevant” or to leave the question unanswered.
The final step was to discuss the outcome of this pro-cess with the Executive Board for validation purposes. The results of the workshops confirmed the assessment of the Executive Board and risk management with respect to the relevance of the topics.
Stakeholder expectations for companies are constantly evolving. We therefore survey our stakeholders regu-larly in order to ensure that our prioritization of topics is in line with their own ideas.
Material areas
We have classified all areas as “material” that were rated as “material” or “highly material” by more than 50% of those surveyed.
The following areas have been identified as material:
Access to and Availability of Medical Care
Research and Development
Innovation and the setting of technological standards, knowledge management, and measures to combat product piracy/counterfeiting/illicit trade
Acquisitions
Company market presence, long-term increase in en-terprise value, job security, innovation and setting technology standards
Cooperations and Partnerships
Research alliances and cooperations, knowledge man-agement in the company, performance of workshops and seminars, cooperations with schools and universi-ties
Digitalization and Automation
Application Orientation and Service
Technology partnerships, meeting our customers’ needs, steadily improving service quality, trust and reputation, responsible marketing, clear and transpar-ent customer information, customer health and safety
Product Quality and Safety
Lifecycle Management and Recycling
Identifying Talent
Offering Opportunities
Career promotion, leadership programs, performance evaluations and feedback, lifelong learning, vertical and global mobility
Group Management Report | Non-Financial Group Statement Our Approach to Sustainability 89
Diversity and Equal Opportunity
Discrimination-free workplace, diversity and equal opportunity, social dialog and employee co-determination, transparent remuneration system, value-driven corporate culture
Health & Safety
Workplace safety, maintaining employability
Life Balance and Job Satisfaction
Maintaining a life balance (personal and professional), flexible working time models
Corporate Governance and Compliance
Adhering to laws and regulations, safeguarding cus-tomer data, fair contract practices, complaint pro-cessing and management, observing human rights, following ethical principles, anti-corruption measures, supplier management
High Environmental Protection Standards
Waste avoidance and waste separation, waste man-agement in the production chain, hazardous substanc-es management in R&D and production, emissions in production and operations, emissions management in the supply chain
Social Commitment
Promotion of education and scientific research
Ongoing Dialog with Stakeholders
90 Group Management Report | Non-Financial Group Statement Shaping the Future
Access to and Availability of Medical Care
Why it’s important
Many people in industrialized countries suffer from diseases for which there is as yet no effective treat-ment. These include types of cancer, Alzheimer’s dis-ease, autoimmune diseases and congenital metabolic disorders, as well as infectious diseases.
At the same time, many diseases that would have proved fatal just a few generations ago can now be cured or treated effectively. Falling death rates cou-pled with declining birth rates have resulted in an aging population in the industrialized nations. Healthy aging and social participation into old age are particu-larly desirable social objectives. The availability and affordability of innovative biopharmaceutical drugs for the treatment of serious and sometimes rare dis-eases is consequently hugely important.
In developing and emerging countries, the availability and affordability of any form of healthcare is fraught with problems: more than half the world’s population has either no or inadequate access to medical care. Every day, people die of entirely preventable diseases. One in every ten children did not receive the vaccines recommended by the WHO in 2016.
We want to live up to our responsibility for the good of the community and contribute to the innovative treatment methods offered by modern medicine.
Our approach
The manufacture of biopharmaceuticals is complex, time-consuming and cost-intensive. The aim of our two divisions is to render research and development in this field faster and more efficient and to make manu-facture safe and more affordable. Our diverse technol-ogies enable us to offer our customers an integrated approach and to optimize the interplay of many indi-vidual steps in the process of developing and manu-facturing medicines. This ensures that innovative medications reach the market faster, in greater num-bers and at lower prices, giving more people access to medicine.
As one of the leading companies in our sector, our approach is to function not just as a developer and manufacturer, but also to bring experts together with a view to promoting dialog and networking. This is conducive to the generation of new and creative ideas and thus supports scientific progress.
We obtain the know-how required for the develop-ment of our product range also through cooperations and acquisitions. We are actively approaching new, attractive partners and also organize our own events with experts to this end.
Our performance
With its Research Xchange Forum, Sartorius has creat-ed a platform for interdisciplinary exchanges between industry and science. The first event in February 2017 focused on trends and challenges in oncology. The core issue was how to improve and accelerate the transfer of knowledge from basic research to the commercial manufacture of products – and thus its translation to patient therapy. This question has tech-nical, legal and economic backgrounds, but it also highlights a challenge facing society in general. More intensive communication and a regular exchange of ideas will offer a foundation for progress on this issue.
The second Research Xchange Forum in March 2018 will focus on the interdisciplinary exchange between industry and science on the topics of regenerative medicine and cell therapy.
Our Approach to Innovation
Innovation at the Sartorius Group rests on three pillars: our own specialized research and development activity, the integration of innovations via acquisitions, and cooperations and partnerships in complementary fields.
Own R&D Activity
Why it’s important
We are one of the market leaders in our sector be-cause we pursue intensive in-house R&D in our core technologies and continually develop our products further.
Shaping the Future
Group Management Report | Non-Financial Group Statement Shaping the Future 91
One of the decisive success factors at Sartorius is the use of technology to differentiate ourselves from our competitors, including spotting trends at an early stage and combining them in innovative ways.
Our above-average R&D performance results from our bringing know-how into the company in systematic fashion and extending, keeping and protecting it, but also from being fast and agile.
Our approach
Research and development has overarching im-portance in the Sartorius Group, and is overseen by a specially appointed member of the Group Executive Committee. The department is in a good financial position: the Sartorius Group spent €68.9 million on R&D in the reporting year. A total of 638 people worked in R&D during 2017, 116 more than in the previous year. This represents an increase of 22%, while the total headcount grew by 8.5%.
Our R&D activities concentrate on our core competen-cies, such as membrane and cell culture technology, and the automation and control of instruments in laboratory and process scale. Knowledge and technol-ogies that the company gains through cooperations or acquisitions are developed further within the company and thus lead to new and differentiating technologies.
Each of our production sites fundamentally serves as a center of competence for particular technologies. The Group’s plant in Göttingen, for example, concentrates chiefly on the production of membrane filters, where-as the Aubagne and Mohamdia sites primarily manu-facture single-use bags. Our facility in Yauco supplies both membrane filters and single-use bags principally for the U.S. market. The Guxhagen site specializes in bioreactors and other systems for bioprocess applica-tions. It collaborates closely with the plant in Banga-lore (India), which mainly produces stainless steel components for those systems.
In Ulm, construction has begun on a new Cell Culture Technology Center for the purpose of expanding the development of cell lines and protein production pro-cesses. The new laboratory building is scheduled for completion at the end of 2019 and will approximately double present capacities.
Regenerative medicine is a relatively new biomedical field which uses the body’s own self-healing powers to replace or restore diseased tissue or cells and establish normal function. We see high growth opportunities in this field and have consequently set up our own re-search and development team to look into it with the aim of expanding our product portfolio for relevant customers. A global sales team for regenerative medi-cine applications was also established in the reporting year.
In general, we are increasingly pursuing the approach of linking our individual technologies as a basis for the development of new products and solutions. Owing to our broad product portfolio, we have extensive exper-tise in the development of bioprocess applications.
We pursue a targeted intellectual and industrial prop-erty rights policy to protect our knowledge and sys-tematically check for infringements of those rights.
Our performance
Sartorius pursues strong R&D in its core technologies. Our experts play a significant role in the industry and ensure that the Sartorius Group maintains a leading position around the world.
In 2017, more than 85% of our revenue was generated in areas in which Sartorius is among the top three players.
Complementary Acquisitions
Why it’s important
We operate in a rapidly developing and expanding industry. The biopharmaceutical market is an area in which breakthroughs leading to new therapies come at a rapid pace. Production processes and technologies are also subject to ongoing innovation.
Against this backdrop, we are constantly looking to expand our portfolio, among other things through acquisitions. We constantly scour the market for inno-vative and differentiating technologies to help our customers develop and manufacture their drugs even more quickly and efficiently.
92 Group Management Report | Non-Financial Group Statement Shaping the Future
We operate in an environment in which consolidation is a crucial factor. As one of the smaller competitors, our differentiating acquisition strategy is what enables us to succeed in business.
Our approach
We want to grow through acquisitions, particularly when it comes to innovative technologies that com-plement our own expertise. We buy and develop key technologies with a view to entering into lines of business that will differentiate us from the competi-tion. These technologies develop their full potential once Sartorius takes over ongoing development, in-cluding combining the technologies into new products.
When deciding on an acquisition, we always keep our basic strategic approach in mind: we want to position ourselves more broadly along the value chains of our biopharmaceutical customers and become involved in their development processes at an increasingly early stage.
Start-ups are frequently at the forefront of innovation. These fledgling companies not only provide us with new technologies, but also deliver inspiration. We attempt to retain our start-up company founders at Sartorius, to keep their abilities and expertise within the Group.
Such collaboration is also beneficial for the acquired companies, which gain financing capacity, an interna-tional network, access to customers and a variety of other resources, all of which translates into a future within the Sartorius Group
Because we take a long-term approach, we don’t merely aim to gain a differentiating technology from a market leader in the field when acquiring a company, but also set great store by finding a good fit in terms of corporate culture. The valuation of the company also has to be fair: we expect it to reach Sartorius’ level of profitability within two to three years.
Due diligence
With respect to acquisitions, Sartorius’ standard policy is to include non-financial aspects in the due diligence process. These include compliance with legal standards and maintaining effective compliance systems, among other things. Moreover, we include HR and environ-mental aspects in our assessment of risks and oppor-tunities of such potential takeover candidates.
Our performance
Acquisitions and mergers have been major milestones in Sartorius’ corporate development. In 2000, the company took a significant step into the biopharma-ceutical industry with its acquisition of B. Braun Bio-tech, the world’s leading manufacturer of fermenters and cell culture systems. Bioprocess Solutions now accounts for approximately 75% of Sartorius’ revenue and 85% of its underlying EBITDA. The merger with Stedim Biosystems’ biotechnology business in 2007, which saw Sartorius combine its biotechnology divi-sion with Stedim, resulted in the creation of Sartorius Stedim Biotech S.A.
Since 2011, we have acquired and successfully inte-grated eleven companies. In these cases, as well as those that preceded them, major locations have been expanded and additional jobs created in the wake of the acquisitions. Our approach to acquisitions also includes offering the employees of acquired companies career and development opportunities in the Group – this extends all the way to membership of the Group Executive Committee (GEC), to which a manager from an earlier acquisition was appointed in 2017.
Sartorius has complemented its existing portfolio with miniature bioreactors, cell culture media and cell lines, thereby making it even more valuable to customers.
Furthermore, the addition of bioanalytics to the com-pany’s portfolio has given customers a tool with which they can speed up their product developments consid-erably.
The acquisitions of IntelliCyt in 2016 and Essen BioSci-ence in 2017 enabled Sartorius to gain a solid foot-hold in this field.
kSep was also purchased in 2016 and Umetrics in 2017.
Cooperations and Partnerships
Why it’s important
The integration of external innovations is one of the factors that has enabled Sartorius to evolve from a small mechanics’ shop into an international undertak-ing boasting more than 7,500 employees. What makes Sartorius special is its close cooperation with custom-ers and business partners, and these are qualities that the Group has kept intact.
Group Management Report | Non-Financial Group Statement Shaping the Future 93
Thanks to its close alliances with scientific research institutions and universities, Sartorius is a technology leader that sets standards in many market segments. The company has worked to maintain an open ex-change with the scientific community ever since its formation. In this way, it has driven forward scientific insight and precisely tailored product development.
Our approach
We see ourselves not just as a supplier, but as a part-ner and problem solver for our customers. This is an approach best implemented via direct partnerships.
We have access to the latest research via joint projects designed to study specific issues, and can incorporate this research in our product development.
In addition to research alliances, technology partner-ships are another important component of our re-search and development work. We also maintain technology partnerships with our suppliers to promote common learning and development processes.
Our performance
Well in excess of 100 research alliances and coopera-tions, including partnerships with the University of Weihenstephan, the TCI at the University of Hanover, Hanover Medical University and institutes of the Fraunhofer Society, provide a steady stream of new ideas and contribute to the identification of new fields of development. Sartorius awarded its annual Sartorius & Science Prize for Regenerative Medicine and Cell Therapy for the first time in 2017. The award, which comes with €25,000 prize money, is geared toward outstanding scientists concentrating on basic or trans-lational research in these fields.
Besides the honoring of outstanding achievements, another objective of the award is to consolidate ef-forts to draw attention to these research topics and their significance for the future.
At our French site in Aubagne, we have been collabo-rating for many years with eminent schools and uni-versities such as the École Nationale Supérieure de Technologie des Biomolécules in Bordeaux to support the education and training of biotechnology engineers and business administrators and help young graduates ease into their careers.
Sartorius collaborates with strategic customers and suppliers in technology partnerships.
Sartorius acquired exclusive global sales and market-ing rights from Lonza in 2012. Lonza has retained the manufacture of cell culture media, while both compa-nies collaborate on product developments. Cell culture media are an ideal addition to the portfolio of Sartorius subgroup Stedim Biotech. Like bioreactors, they are of crucial importance in the safe and efficient manufacture of biopharmaceuticals, and the collabo-ration benefits customers by ensuring that all compo-nents interact perfectly.
94 Group Management Report | Non-Financial Group Statement Shaping the Future
Focus on Customer Benefit and Application
Application Orientation and Service
Why it’s important
For us at Sartorius, customer centricity means focusing primarily on practical application. The difference be-tween a supplier and a partner, or a seller and a solu-tion provider, lies in the desire to understand customers, to speak their language and to be at home in their world. We operate as a partner and a problem solver for our customers.
It is imperative that we enjoy the trust of our custom-ers and a good reputation in the market. We maintain and improve our reputation by consistently focusing on the needs of our customers and excellent service.
Our approach
If the core competency of Sartorius in the past was technology, today it is application expertise. We orient ourselves to the market, our customers, and their applications.
Instead of focusing primarily on our products, we look at our customers with their entire value creation chains – and thus the interactivity of all the systems in those chains. This is why the development of our products always begins with a stakeholder analysis that includes all the customer’s demands as well as those of our own service team and sales staff. This applies to our Lab Products & Services Division and to our Bioprocess Solutions Division in equal measure. Thanks to this approach, we are able to minimize the risk of bypassing the needs of the market in our devel-opment efforts.
Over 10,000 biopharmaceuticals around the globe are in the pre-release stage, and this number is increasing. For this reason, reducing the period from the initial development to the market launch of a medication is a primary concern of our customers. Time-to-market is thus a decisive factor for the manufacturer’s subse-quent ROI. It is the goal of every biopharmaceuticals producer to be the fastest and best in its class.
Our objective is to accelerate our customers’ develop-ment activities and make them more efficient. Devel-oping a new pharmaceutical drug takes many years and is extremely cost-intensive. The technologies we develop for subsequent manufacture enhance quality and minimize errors, thus saving both time and money.
A key technology in this regard is bioanalytics, which improves the precision and thus the speed and effi-ciency of initial development processes. We have cre-ated an integrated process solution with our Connect Upstream approach, for instance, and address the entire bandwidth of our customers’ expectations in the biopharmaceutical arena.
Our entry into the field of bioanalytics has increased the significance of our laboratory division for the biopharmaceutical market, a target group on which the division now focuses. This results in even more synergies between our two divisions Bioprocess Solu-tions and Lab Products & Services, as well as the op-tion of offering joint solutions.
Ever since Sartorius was founded 147 years ago, the Group has steadily expanded its international presence. Today, Sartorius is a global player with some 50 pro-duction sites, distribution offices and local sales repre-sentatives around the globe to ensure geographical proximity to our customers.
Our application laboratories in all regions offer our customers the opportunity to test Sartorius products, even using their own samples, and to take training courses.
At the end of 2016, we opened a new laboratory for bioanalytical services in Boston, where biotech sub-stances can be tested for safety and quality on behalf of our customers.
The Lab Products & Services Division offers a wide range of services covering the entire life cycle of la-boratory products, from device installation and com-missioning to verification, calibration, regular maintenance and repair. Our services are not limited to Sartorius instruments; they are offered for devices from other manufacturers as well. This extensive range enables our customers to minimize the number of service providers they use and thus reduce complexity and costs.
Our performance
In the biopharmaceuticals area, our Connect Upstream approach enables us to reduce the time-to-market of a biopharmaceutical significantly.
We have more than 700 customer service employees in 28 countries. This decentralized structure means that they can be on our customers’ premises quickly to service their equipment and installations under real-life conditions.
Group Management Report | Non-Financial Group Statement Shaping the Future 95
Digitalization
Why it’s important
For Sartorius, digitalization is critical to our success in two respects: we support our customers in digitalizing their bioprocesses, while also driving the digitalization and automation of our own internal processes forward.
At product level, digitalization has played a minor role in the pharmaceutical industry compared with other industries to date. This is gradually changing, with IT processes now having the potential to act as a differ-entiator in competition.
In addition to sufficient production capacities, effi-cient business processes and a strong IT infrastructure are the main internal factors driving profitable future growth. This is why digitalization is so crucial for in-ternal processes too.
Our approach
It is important for the development of Sartorius to play an active role in introducing digital processes in the development of medicines as well as in manufac-turing processes and the management of those pro-cesses.
Developing bioanalytics into a core competence is a declared Sartorius management objective. Close col-laboration with our biopharmaceutical customers has demonstrated that bioanalytics can make a vital con-tribution to closing a significant gap in demand, mak-ing the first steps toward development of a new biopharmaceutical faster and more effective.
Sartorius is therefore targeting the acquisition of young companies with core competencies in the field of bioanalytics. Our approach involves integrating these companies in our portfolio with the aim of en-hancing the latter. Recent months have seen Sartorius acquire both IntelliCyt and Essen BioScience with a view to expanding our cell analysis business. The key to success is the application knowledge and know-how needed to combine the companies’ software expertise.
The development of biopharmaceutical medicines requires a number of trials, the majority of which have been conducted manually thus far. With respect to cell analysis, the idea is to automate the main analysis steps in order to compress drug development timelines. Cell analysis instruments can also speed up the process of establishing whether, and if so how, a specific sub-stance will affect cells. Optical technologies can be used to evaluate experiments in petri dishes, with a software program determining when the substance has interacted with the cell.
In 2017, Sartorius also acquired Umetrics for its Bio-process Solutions Division. The Swedish company is a leading global specialist in data analysis for the pur-pose of modeling and optimizing biopharmaceutical development and production processes. The software systems are used as control mechanisms in cell cultiva-tion and purification processes in the biopharmaceuti-cal industry. Statistical and mathematical methods make it possible to evaluate a wide range of data simultaneously and to compile analyses of the complex correlations between various types of data. The goal is to make the customer’s production process as cost-efficient as possible.
In addition, Sartorius is working to digitalize and au-tomate internal processes along our entire value chain. The company plans to introduce a new ERP and CRM system based on global business process standards.
Our performance
Sartorius was able to start building up its promising cell analysis segment with the acquisition of Intellicyt in 2016 and Essen Bioscience in 2017.
The company’s products in the area of bioanalytics offer strong unique selling points, and we expect this segment to make a significant contribution to revenue in 2018. We want to use our global sales platform to accelerate the penetration of these technologies across the laboratory market. Since Sartorius enjoys a strong presence in the lab market, we see clear poten-tial for future growth here.
Sartorius is also making progress on the implementa-tion of its new ERP system: in 2017 it was introduced at further sites in Germany, Switzerland and India, and implementation is scheduled to be completed in 2019.
96 Group Management Report | Non-Financial Group Statement Shaping the Future
Product Quality and Safety
Why it’s important
Sartorius supplies its products to manufacturers of pharmaceuticals, foods and chemicals as well as to research and development laboratories. A high level of product quality and delivery reliability is vital for our customers in these industries, which are strictly regu-lated in part. This is particularly true of drug manufac-turers, whose production lines have to be certified.
Our approach
At Sartorius, the products and services we offer our customers are of the highest quality. We developed a global quality policy in 2014 with a view to maintain-ing this high level of quality around the globe. It was updated in 2017. This policy is oriented toward the interests of our stakeholders and an analysis of opera-tional requirements, and considers our products and services. It defines three principles and is binding for all company employees. In concrete terms, it is under-pinned by 32 global procedures.
Sartorius subscribes to the following principles:
– Maximization of customer satisfaction, fulfillment of industry expectations, and compliance with statutory provisions
– Recognition of ISO 9001 as a minimum standard for all company locations
– Focus on continuous improvements and innovation in our processes and products
Adherence to these principles is monitored at each location and measured on the basis of quality targets which are defined in the company’s business plan.
Quality management is dealt with by two departments:
Customer Audit Management looks after audits that our customers perform at our facilities. We also carry out collaboration projects together with our customers to improve quality, for instance by optimizing com-plaint processing.
Supplier Management addresses the question of how suppliers should be evaluated. We carry out over 100 audits of suppliers every year, and it is our goal in the future to examine environmental and employee con-cerns as part of these audits, too. Sartorius has a de-clared interest in establishing long-term partnerships. If critical points emerge from an audit, we support our suppliers actively through an improvement process.
The company employs rigorous quality checks and advanced manufacturing methods and processes to ensure that, when used as intended, these products comply with our customers’ needs and pose no risk to health or safety. Detailed application brochures and our Services unit support customers in the correct use of our products. Sartorius has established a traceabil-ity system that enables us to recall entire product batches immediately in the event of any major non-conforming items or defects.
Our efforts to enhance the environmental perfor-mance of our products and production methods begin at the research and development stage. We decrease our use of materials and increase the proportion of environmentally friendly raw materials whenever this can be done without compromising the safety or func-tionality of our products or packaging. Sartorius also works with partners from industry and the scientific community in this respect.
Our performance
Fully 17 of our 20 production companies are certified under ISO 9001 – an 85% certification rate. This figure does not take into account companies acquired in 2017. In addition, 23 of our 48 sales companies are certified under ISO 9001.
In 2017, a total of 195 audits were performed on our premises by our customers, 194 of which revealed no critical findings. Accordingly, we achieved an audit satisfaction or compliance rate of 99.5%.
In 2017, we performed a total of 113 audits at our suppliers, six of which were failed. This resulted in a compliance level of 94.7%.
Group Management Report | Non-Financial Group Statement Shaping the Future 97
Lifecycle Management and Recycling
Why it’s important
Sartorius produces both single-use products and those with useful lives of up to 20 years. This means widely disparate challenges, but in any case it spotlights lifecycle management and recycling as part of our development activities.
Our approach
Lifecycle management and the recyclability of our products are a key aspect of our research and devel-opment activities and also involve members of the Group Executive Committee. In the case of products with long useful lives, we consider the future as early as the development phase: what should the product be able to do in 20 years? Is its design compatible with updates and upgrades? Service and spare parts must also be ensured across the product’s useful life. As a rule, we guarantee service for up to seven years even after production of a product is discontinued.
On the other hand, single-use products are becoming increasingly widespread in the manufacture of bio-pharmaceutical medications for economic reasons. Across their product life cycles, single-use products made of plastic are far superior to complex reusable systems in their consumption of energy, water and chemicals. Although single-use products have clear environmental benefits in terms of energy and water consumption, their use generates more waste. For this reason, recycling is of central importance to both ourselves and our customers and is consequently con-sidered as early as the product development stage.
The integrated solutions of the Sartorius FlexAct prod-uct line combine the ecological benefits fundamental-ly offered by single-use technologies and the advantages of lower material usage thanks to adapta-ble and space-saving systems. The central FlexAct control unit, for example, can be used in a number of different biopharmaceutical processes. Manufacturers no longer need to define a specific production volume in advance; they can adjust it on an ongoing basis without having to install new production facilities and decommission old ones.
Our performance
Rigorous recycling of raw materials improves the envi-ronmental performance of our single-use products. The ultrapure plastics we utilize to manufacture vari-ous single-use products contain around 80% to 90% of the energy of pure crude oil and are thus valuable secondary raw materials. The high energy content of polymers, for example, means that they can be reused as fuel in heat or power generation.
Technical refinements to its membrane filter series have enabled Sartorius to slash consumption of ul-trapure water for wetting and rinsing the membranes by up to 95%. The filters’ significantly lower absorp-tion lessens the loss of expensive protein solution. As a result, pharmaceutical manufacturers can substantially reduce the use of resources, while achieving higher yields.
98 Group Management Report | Non-Financial Group Statement Shaping the Future
Staff for Unlocking Future Potential
Why it’s important
Sartorius is growing strongly. We add around 1,000 new employees to our staff every year. We continually acquire talented and well-qualified employees and build their loyalty to ensure the success of the compa-ny in the future. In the process, one particular chal-lenge all over the world is to recruit suitable and experienced specialists for the company.
Our approach
A central success factor in recruiting new employees is our worldwide employer branding. Sartorius is less well-known as an employer in the international arena as it is in Germany. This is why we are defining and communicating the things that are critical to potential employees when they make employment decisions. According to our analysis, all of them are factors that are likely to create trust in the future: the company's brand leadership, its sales growth and margin devel-opment, its internationality and innovation activities and – last but not least – the individual's opportuni-ties for development within the company.
We specifically address people who contribute not only their expertise, but also an open attitude, a sense of responsibility and a proactive willingness to actively develop their own fields of work.
Sartorius uses digital professional networks to attract the attention of talented people, collaborates with the respective universities, institutes and organiza-tions,and makes use of its own extensive contacts in the industry.
Promoting Young Academics
The aim of our own international Sartorius Scholarship program is to gain qualified young academics for our company, particularly from the global growth markets. For many years, we have been supporting talented students and graduates in scientific and technical disciplines. Students from sales and marketing can also apply for a Sartorius scholarship. The company aids these recipients not just financially, but also helps them technically and personally. For example, each Sartorius scholarship holder is assigned a mentor from within our own organization.
Sartorius participates regularly in European Union funding initiatives, such as the Leonardo da Vinci program for international vocational education. We enable our interns to participate in a variety of train-ing courses. Thanks to an alliance with the Kedge Business School in Marseille, France, the interns at our Aubagne site, for example, can attend the Master of Business Administration courses offered there.
Initial Qualification of Trainees
Sartorius has traditionally attached great importance to sound initial vocational training. And because it is becoming increasingly important for the company to attract qualified staff, Sartorius launched the #Start series of events in 2017. Here, young people can ob-tain details of opportunities for study and training at Sartorius and enter into a dialog with in-house train-ees and students on the more than 20 different voca-tional and study programs.
In the year under review, Sartorius offered positions with the company to all trainees after they passed their final examinations. Essentially, Sartorius gears its programs to company requirements and takes on more than 95% of the people it trains.
Alliances with schools and universities
Sartorius cooperates with local schools and universi-ties in order to inform young people of their training options and to prepare them for their working lives by offering targeted measures such as interview training.
Our performance
The last five years has seen Sartorius take on 5,004 new recruits and thus significantly strengthen its human capital.
In Germany, the Group currently offers vocational training and education in a total of 17 different pro-fessions via five work-study programs. As of the De-cember 31, 2017 reporting date, Sartorius had a total of 130 vocational trainees and 8 university students, of whom 96 were male and 42 female. This number also includes one trainee who is registered as disabled.
Five of the trainees are refugees, all of whom are now being trained in various professions.
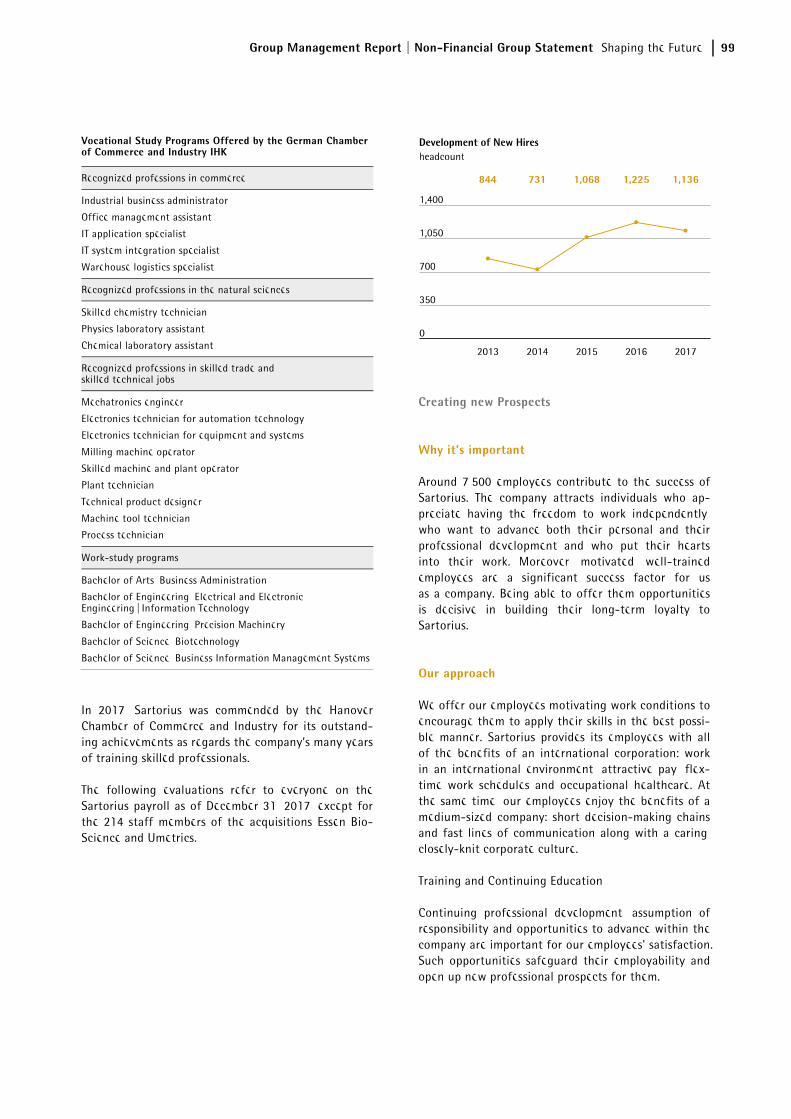
Group Management Report | Non-Financial Group Statement Shaping the Future 99
Vocational Study Programs Offered by the German Chamber of Commerce and Industry IHK
Recognized professions in commerce
Industrial business administrator
Office management assistant
IT application specialist
IT system integration specialist
Warehouse logistics specialist
Recognized professions in the natural sciences
Skilled chemistry technician
Physics laboratory assistant
Chemical laboratory assistant
Recognized professions in skilled trade and skilled technical jobs
Mechatronics engineer
Electronics technician for automation technology
Electronics technician for equipment and systems
Milling machine operator
Skilled machine and plant operator
Plant technician
Technical product designer
Machine tool technician
Process technician
Work-study programs
Bachelor of Arts, Business Administration
Bachelor of Engineering, Electrical and Electronic Engineering | Information Technology
Bachelor of Engineering, Precision Machinery
Bachelor of Science, Biotechnology
Bachelor of Science, Business Information Management Systems
In 2017, Sartorius was commended by the Hanover Chamber of Commerce and Industry for its outstand-ing achievements as regards the company’s many years of training skilled professionals.
The following evaluations refer to everyone on the Sartorius payroll as of December 31, 2017, except for the 214 staff members of the acquisitions Essen Bio-Science and Umetrics.
Creating new Prospects
Why it’s important
Around 7,500 employees contribute to the success of Sartorius. The company attracts individuals who ap-preciate having the freedom to work independently, who want to advance both their personal and their professional development and who put their hearts into their work. Moreover, motivated, well-trained employees are a significant success factor for us as a company. Being able to offer them opportunities is decisive in building their long-term loyalty to Sartorius.
Our approach
We offer our employees motivating work conditions to encourage them to apply their skills in the best possi-ble manner. Sartorius provides its employees with all of the benefits of an international corporation: work in an international environment, attractive pay, flex-time work schedules and occupational healthcare. At the same time, our employees enjoy the benefits of a medium-sized company: short decision-making chains and fast lines of communication along with a caring, closely-knit corporate culture.
Training and Continuing Education
Continuing professional development, assumption of responsibility and opportunities to advance within the company are important for our employees' satisfaction. Such opportunities safeguard their employability and open up new professional prospects for them.
100 Group Management Report | Non-Financial Group Statement Shaping the Future
Sartorius retains its qualified employees by offering targeted continuing education courses and opportuni-ties for development, also at its international locations.
The Sartorius continuing education program covers a broad diversity of subjects. Specialized courses and targeted on-the-job training teach required skills and expertise. Sartorius College offers all employees a wide range of training and continuing personal develop-ment opportunities in a number of different languages to help enhance their methodological and language skills. We custom-design our programs and continu-ously adapt them to the changing needs of our em-ployees and the company.
Annual performance reviews between employees and their managers provide a forum for discussing perfor-mance, targets and individual development opportuni-ties. We conduct all annual performance reviews worldwide using the same criteria.
Training Management Staff
Sartorius fills management vacancies from within its own ranks whenever possible. Four of the six members of the GEC have been with the company for 15 years or longer. We use Sartorius’ leadership guidelines as the basis for a management development program in which all first-time managers participate with the goal of developing a common leadership culture. The pro-gram is already available at our companies in Germany, the U.K., France, Belgium, Italy, Spain, India and China. A development program for production managers has been established in Germany.
As an alternative to the classic manager career, Sartorius enables scientists and engineers in R&D as well as IT specialists, in particular, to pursue an expert career path that helps recognize the value of their expert knowledge for the success of the company, and offers experts and project managers adequate devel-opment prospects.
Mentorship Programs
Our mentorship programs and knowledge transfer partnerships ensure that expertise is passed on within the company efficiently and systematically. We offer conventional mentoring programs at our companies in Germany, China and India, as well as in France and Tunisia, during which the mentee is able to benefit from the know-how and expertise of his/her mentor. In contrast, knowledge transfer partnerships are a “partnership of equals” that focus on mutual learning and the sharing of expertise. For example, this enables older staff to learn from younger employees, too, and this makes sense given the demographic trend. So far,
we have pursued the concept of knowledge transfer partnerships in Germany only.
Global Mobility
Sartorius encourages its employees to network within the company and to transfer temporarily to its other departments or sites. Our internal job market also offers a variety of prospects to further develop and even change jobs. The basic conditions for temporary assignments in foreign countries are transparently defined for all staff members.
We promote international opportunities for our em-ployees’ development, for instance through temporary deployment at other sites and international project work.
Sartorius continues to expand its programs to promote temporary assignments and global mobility as an in-vestment in the company’s future.
Our performance
At the company's major sites in France, Germany, India, Puerto Rico and Tunisia, where 66.9% of the workforce is employed, a total of 69,222.06 hours were invested in further training initiatives during the reporting year. On average, each employee completed 14.5 hours of further training.
Making the Most of Diversity
Why it’s important
As a globally operating company, we do business in many different regions and markets. Sartorius employ-ees cooperate across six continents in performing their work. The company’s global network shapes our daily work. Many of our departments cover multiple com-pany locations and countries, and project teams are often composed internationally.
The diversity of our procurement and sales markets is reflected in our corporate culture. The productive interplay of a variety of perspectives and experiences helps us understand our customers better, develop tailored solutions and remain competitive in a global economy. When filling management positions, we likewise aim to achieve a mix of cultures, genders and age groups.
Group Management Report | Non-Financial Group Statement Shaping the Future 101
Our approach
One of our guiding principles is respecting the value of our different employees and creating the same opportunities for all.
Our diversity and inclusion approach involves having a good mix, a common goal, an open attitude towards differences, trust and flexibility.
Entry-level opportunities and career opportunities are awarded on the basis of achievement. When filling key positions, we often search the international market for a suitable individual and, for example, look at a candi-date’s qualifications before considering language barriers or physical distance. At Sartorius, everyone has the same opportunities, irrespective of their origin, religion, gender, age, sexual orientation, or any physi-cal impairment.
Our employees should be able to develop personally and professionally throughout their professional lives. To create the same opportunities for people regardless of their life situations, we have installed a flexible work scheduling model at many of our German com-panies. Employees are able to take advantage of flex-time, part-time and teleworking options.
In addition to flexible work schedules, our response to the need for work-life balance includes child care opportunities. In Göttingen, for example, we have offers for school-age children during school vacation periods. And in 2017, Sartorius commenced construc-tion of a new daycare center on the Sartorius Campus in Göttingen. The center is integrative, meaning it offers spots for handicapped children as well. Sartorius has already won a number of awards for its family-friendly policies. It’s part of our corporate culture that fathers also take family leave at Sartorius.
In line with the German Act on Equal Participation of Women and Men in Executive Positions in the Private and Public Sectors, Sartorius has set targets for the proportion of women at the first level of management below the Executive Board. By 2022, the company plans to increase the proportion of women in the first management tier below the Executive Board from currently 19% to 25%, and the proportion in the sec-ond management tier from currently 25% to 30%. Regarding the number of women to be appointed to the Supervisory Board, the statutory quota of at least 30% applies.
Sartorius actively endeavors to integrate disabled employees into its workforce. All newly built Sartorius locations in Germany are designed to be barrier-free. A Group disability officer has represented the interests
of handicapped employees in the German companies since 2014. The Group disability officer is supported by local disability officers at our German locations. While Sartorius meets the statutory requirements in all its companies, it surpasses them by some way in the Ger-man companies.
Measures that promote equal opportunity in our com-pany include the creation of transparency on salary structures. The majority of salaries at the German companies are linked to the rates agreed with the IG Metall trade union, with some paid in accordance with rates established for IG Bergbau, Chemie, Energie. The remuneration paid to employees in France and Austria is also based on trade union rates. Using the union rates makes our remuneration more transparent.
Sartorius designs career paths for individual career fields in order to ensure that opportunities for em-ployee development are transparent and to improve our employees’ ability to manage their own personal development. The IT and R&D career paths have been established worldwide, and plans call for the introduc-tion of corresponding career paths for other Group functions as well. This measure will likewise increase the transparency of wages and salaries.
Our performance
People from nearly 70 countries currently work well together at Sartorius. Alone our Group headquarters in Göttingen, Germany is home to employees from 42 nations. As of December 31, 2017, 62.6% of the Group's employees were employed outside Germany, 0.6 percentage points more than in the year before. Throughout its sites, Sartorius relies on local manage-ment. Almost 70% of the around 730 managers at Sartorius are not of German nationality.
The proportion of women in our workforce has been steadily increasing in recent years and, at the end of the reporting year, was 38.2%, a slight decrease 0.4 percentage points on the figure for the previous year.
In the reporting year, 5.5% or 404 people were work-ing part-time at the Sartorius Group, 25 more than in 2016 and most of which in Germany.
In the reporting period, Sartorius employed 178 people who are registered as severely disabled, 173 in the EMEA region, 3 in the Americas and 2 in Asia/Pacific. This is an increase of 10.6% over the prior-year period.
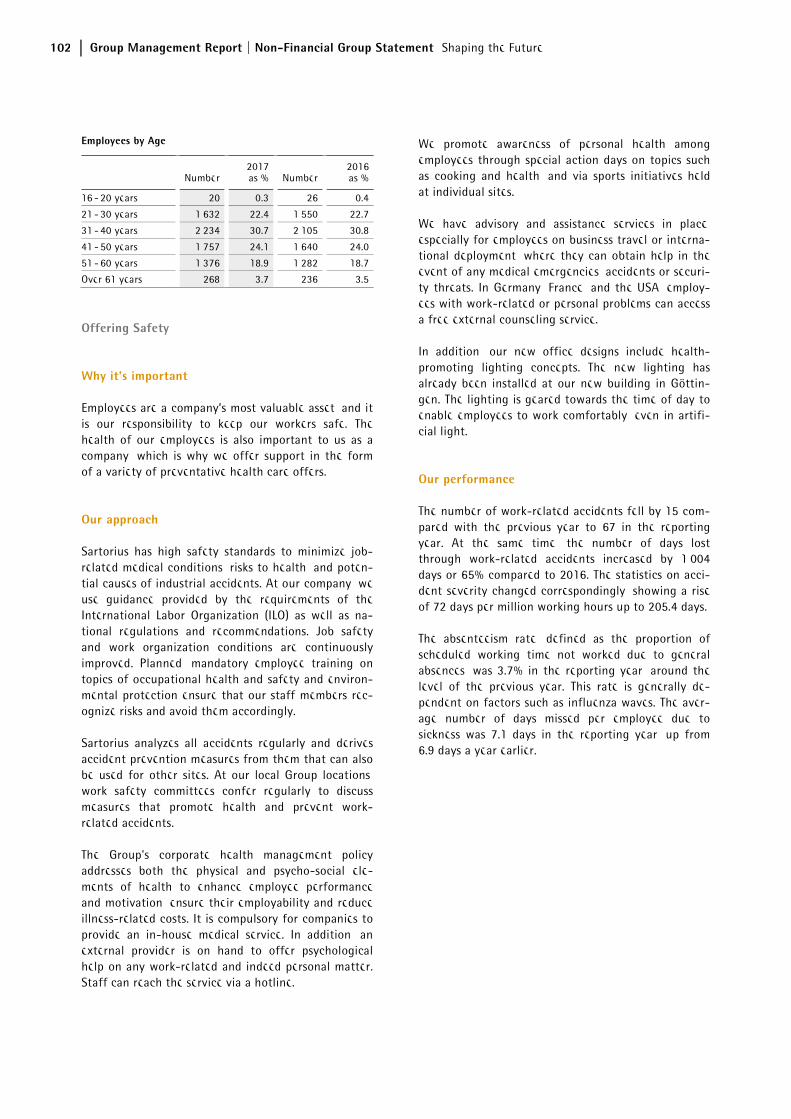
102 Group Management Report | Non-Financial Group Statement Shaping the Future
Employees by Age
Number2017 as % Number
2016 as %
16 - 20 years 20 0.3 26 0.4
21 - 30 years 1,632 22.4 1,550 22.7
31 - 40 years 2,234 30.7 2,105 30.8
41 - 50 years 1,757 24.1 1,640 24.0
51 - 60 years 1,376 18.9 1,282 18.7
Over 61 years 268 3.7 236 3.5
Offering Safety
Why it’s important
Employees are a company’s most valuable asset, and it is our responsibility to keep our workers safe. The health of our employees is also important to us as a company, which is why we offer support in the form of a variety of preventative health care offers.
Our approach
Sartorius has high safety standards to minimize job-related medical conditions, risks to health, and poten-tial causes of industrial accidents. At our company, we use guidance provided by the requirements of the International Labor Organization (ILO) as well as na-tional regulations and recommendations. Job safety and work organization conditions are continuously improved. Planned, mandatory employee training on topics of occupational health and safety and environ-mental protection ensure that our staff members rec-ognize risks and avoid them accordingly.
Sartorius analyzes all accidents regularly and derives accident prevention measures from them that can also be used for other sites. At our local Group locations, work safety committees confer regularly to discuss measures that promote health and prevent work-related accidents.
The Group's corporate health management policy addresses both the physical and psycho-social ele-ments of health to enhance employee performance and motivation, ensure their employability and reduce illness-related costs. It is compulsory for companies to provide an in-house medical service. In addition, an external provider is on hand to offer psychological help on any work-related and indeed personal matter. Staff can reach the service via a hotline.
We promote awareness of personal health among employees through special action days on topics such as cooking and health, and via sports initiatives held at individual sites.
We have advisory and assistance services in place, especially for employees on business travel or interna-tional deployment, where they can obtain help in the event of any medical emergencies, accidents or securi-ty threats. In Germany, France, and the USA, employ-ees with work-related or personal problems can access a free external counseling service.
In addition, our new office designs include health-promoting lighting concepts. The new lighting has already been installed at our new building in Göttin-gen. The lighting is geared towards the time of day to enable employees to work comfortably, even in artifi-cial light.
Our performance
The number of work-related accidents fell by 15 com-pared with the previous year to 67 in the reporting year. At the same time, the number of days lost through work-related accidents increased by 1,004 days or 65% compared to 2016. The statistics on acci-dent severity changed correspondingly, showing a rise of 72 days per million working hours up to 205.4 days.
The absenteeism rate, defined as the proportion of scheduled working time not worked due to general absences, was 3.7% in the reporting year, around the level of the previous year. This rate is generally de-pendent on factors such as influenza waves. The aver-age number of days missed per employee due to sickness was 7.1 days in the reporting year, up from 6.9 days a year earlier.
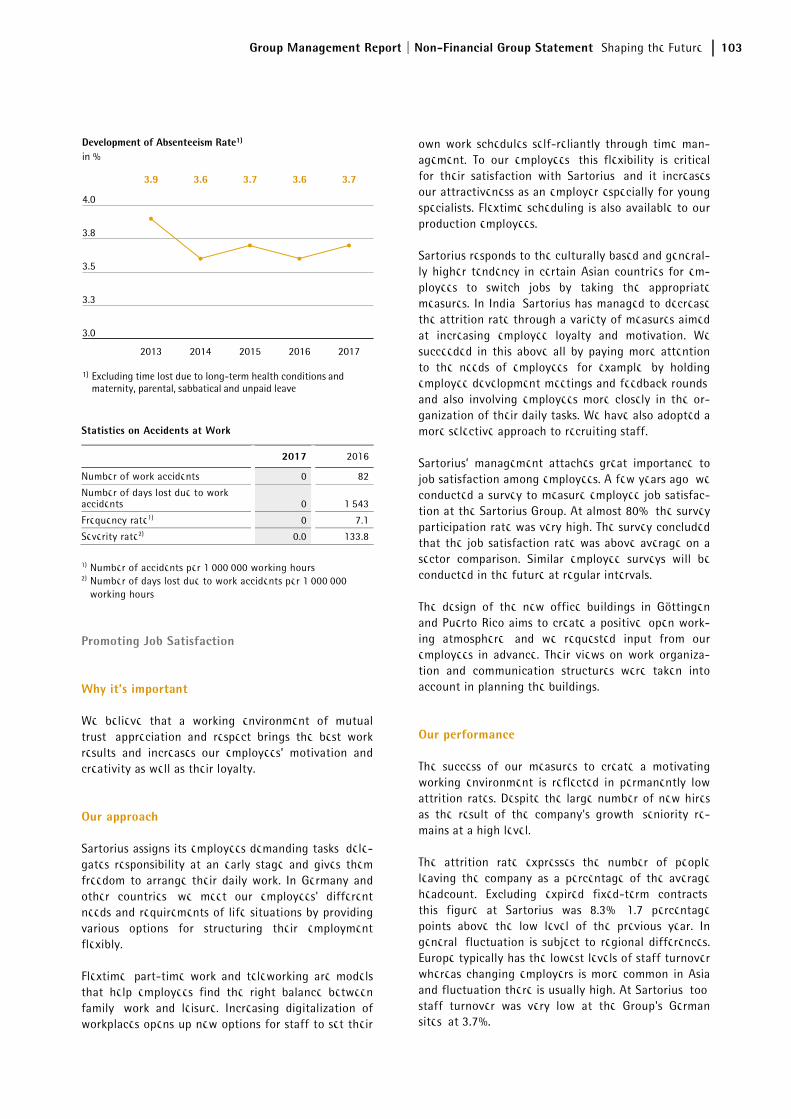
Group Management Report | Non-Financial Group Statement Shaping the Future 103
Statistics on Accidents at Work
2017 2016
Number of work accidents 0 82
Number of days lost due to work accidents 0 1,543
Frequency rate1) 0 7.1
Severity rate2) 0.0 133.8
1) Number of accidents per 1,000,000 working hours 2) Number of days lost due to work accidents per 1,000,000
working hours
Promoting Job Satisfaction
Why it’s important
We believe that a working environment of mutual trust, appreciation and respect brings the best work results and increases our employees’ motivation and creativity as well as their loyalty.
Our approach
Sartorius assigns its employees demanding tasks, dele-gates responsibility at an early stage and gives them freedom to arrange their daily work. In Germany and other countries, we meet our employees' different needs and requirements of life situations by providing various options for structuring their employment flexibly.
Flextime, part-time work and teleworking are models that help employees find the right balance between family, work and leisure. Increasing digitalization of workplaces opens up new options for staff to set their
own work schedules self-reliantly through time man-agement. To our employees, this flexibility is critical for their satisfaction with Sartorius, and it increases our attractiveness as an employer especially for young specialists. Flextime scheduling is also available to our production employees.
Sartorius responds to the culturally based and general-ly higher tendency in certain Asian countries for em-ployees to switch jobs by taking the appropriate measures. In India, Sartorius has managed to decrease the attrition rate through a variety of measures aimed at increasing employee loyalty and motivation. We succeeded in this above all by paying more attention to the needs of employees, for example, by holding employee development meetings and feedback rounds, and also involving employees more closely in the or-ganization of their daily tasks. We have also adopted a more selective approach to recruiting staff.
Sartorius’ management attaches great importance to job satisfaction among employees. A few years ago, we conducted a survey to measure employee job satisfac-tion at the Sartorius Group. At almost 80%, the survey participation rate was very high. The survey concluded that the job satisfaction rate was above average on a sector comparison. Similar employee surveys will be conducted in the future at regular intervals.
The design of the new office buildings in Göttingen and Puerto Rico aims to create a positive, open work-ing atmosphere, and we requested input from our employees in advance. Their views on work organiza-tion and communication structures were taken into account in planning the buildings.
Our performance
The success of our measures to create a motivating working environment is reflected in permanently low attrition rates. Despite the large number of new hires as the result of the company's growth, seniority re-mains at a high level.
The attrition rate expresses the number of people leaving the company as a percentage of the average headcount. Excluding expired fixed-term contracts, this figure at Sartorius was 8.3%, 1.7 percentage points above the low level of the previous year. In general, fluctuation is subject to regional differences. Europe typically has the lowest levels of staff turnover, whereas changing employers is more common in Asia and fluctuation there is usually high. At Sartorius, too, staff turnover was very low at the Group's German sites, at 3.7%.
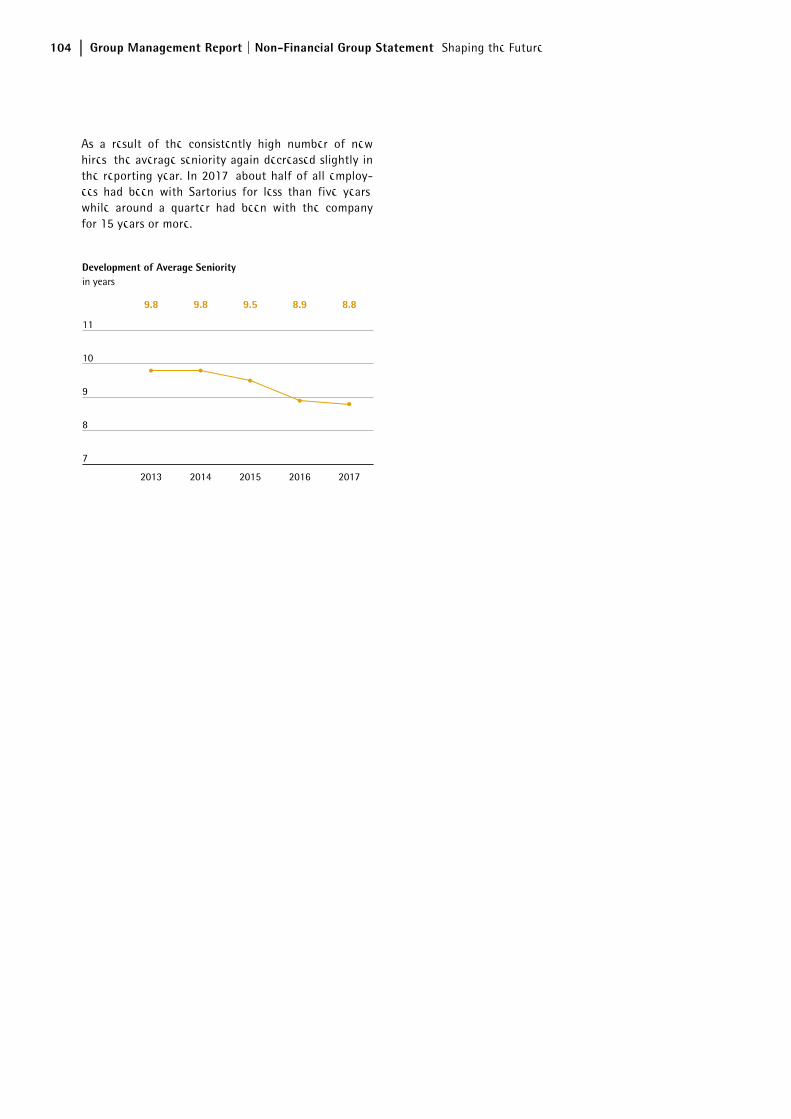
104 Group Management Report | Non-Financial Group Statement Shaping the Future
As a result of the consistently high number of new hires, the average seniority again decreased slightly in the reporting year. In 2017, about half of all employ-ees had been with Sartorius for less than five years, while around a quarter had been with the company for 15 years or more.
Group Management Report | Non-Financial Group Statement A Reliable Partner 105
Our activities are based on our corporate values: sus-tainability, openness and enjoyment. These values govern how we interact daily inside our company and connect us outside – with our customers, investors and society at large. In addition, they guide us in the defi-nition of our strategies and their implementation.
Sartorius works in sectors in which high quality and safety standards are imperative. That’s why benefiting from cooperative relationships with our partners, including developing longstanding trust, are key to our business.
It’s important to us to be a reliable partner for all of our internal and external stakeholders.
Responsible Management
Why it’s important
The trust of our customers, business partners and investors along with our reputation in the market are among our most valuable assets. That’s why we place absolute priority on upholding our good reputation and conducting our business with the utmost integrity.
Corruption undermines the trust of all involved in the business cycle in the efficiency of the economic sys-tem, and also causes substantial financial losses. Con-doning corruption is unacceptable given its damaging impact on the economic system.
Sartorius is highly people-focused in its values and its strategy. This not only extends to the people working for the company and its customers, but includes any-one who derives benefit from research and develop-ment or efficient production in the pharmaceutical industry. Respect for people and their dignity is em-bedded in our DNA. As a global organization, we hold ourselves responsible for upholding that conviction wherever we operate.
Sartorius expects all of its business partners, particu-larly its suppliers, to conduct themselves similarly.
Our approach
Sartorius conducts its business in compliance with globally accepted ethical standards and applicable national legal requirements. Our actions reflect the principles of responsible corporate governance and control that seeks to create sustainable added value. These principles include the protection of our stake-holders’ interests, transparent communications, appro-priate risk management and proper accounting and auditing. Sartorius follows the rules and recommenda-tions of the German Corporate Governance Code in its current version of February 7, 2017.
Our globally applicable compliance system is intended to ensure that our Supervisory and Executive Board members, management and employees comply with all legal regulations and codes, and act according to our internal guidelines. We systematically raise awareness of relevant compliance issues among our staff to pre-vent misconduct, financial losses and damage to our image. The Legal Affairs & Compliance department is responsible for legal consulting, internal auditing, corporate security, data protection, anti-corruption, customs and export control.
Respect for Human Rights
We are committed to upholding human rights and advocate their preservation throughout our sphere of influence. As a supplier to the pharmaceutical industry, we see our greatest opportunities for influence in the area of employee rights, such as the freedom of asso-ciation and the right to collective bargaining. Another important point is improvement in the availability of medical products. The company rejects all forms of forced, compulsory or child labor. As a business part-ner, we act with integrity and fairness in our dealings with competitors, suppliers and customers.
Sartorius adheres to the principles of the United Na-tions Universal Declaration of Human Rights, the con-ventions of the International Labor Organization (ILO) and the United Nations Global Compact – the world’s largest initiative for human rights, work standards, environmental protection and anti-corruption. Our internal principles such as our Code of Conduct and our Supplier Code of Conduct have been derived from the above principles.
A Reliable Partner
106 Group Management Report | Non-Financial Group Statement A Reliable Partner
Code of Conduct
The Sartorius Code of Conduct defines the require-ments we place on our employees with respect to responsible conduct. The code helps employees act ethically and in accordance with the law in their daily work.
In everything they do, employees are required to ask themselves the following questions: Are my actions legal? Does my conduct correspond to our values and guidelines? Is it free of personal interests (that are not covered by labor-law regulations)? Will it stand up to public scrutiny?
The Code of Conduct covers compliance with interna-tional social and environmental standards, general rules of conduct and dealing with conflicts of interest.
Supplier Code of Conduct
We expect our suppliers and service providers in par-ticular to comply with internationally recognized social and environmental standards, to respect the law and to uphold the tenets of fair competition. The company excludes existing or new suppliers who are identified as posing a considerable risk in terms of compulsory, forced or child labor, other violations of human rights or negative effects on society. We have set out our requirements in our Code of Conduct for Suppliers and Service Providers.
Sartorius reserves the right to review its supplier re-quirements on a regular basis and at any time without advance notification.
Suppliers are obliged to support the review process and to disclose all information requested. If such sup-port is not forthcoming or the requirements are not met, Sartorius looks into whether the business rela-tionship can be maintained or not. The Purchasing department sees to it that all suppliers acknowledge and sign the Sartorius Code of Conduct for Suppliers. Not only is the code presented for signing to all new customers, but all existing customers have been con-tacted and are required to sign the code as well. If a supplier does not sign our Code of Conduct for Suppli-ers, we check whether that supplier has an equivalent code in place that can be used as the contractual basis. Should that not be the case, further action is taken.
Sartorius has standardized its procurement channels worldwide, and contracts are awarded in a transparent process that complies with all current regulations.
In 2018, we plan to expand our supplier evaluation to include the areas of environmental management, energy management and occupational health and safety as well as conformity/ethics.
Export Control
As part of good corporate governance, we keep an eye on both our upstream and downstream chains. As soon as a new customer is entered into our ERP system, a check is run in the Global Trade System against sanc-tions lists for the customer and embargoes for the countries in question. Products leaving the company are also checked against the goods lists of the EC Dual Use Regulation. It is important to ensure that fermen-tation and cross flow systems in particular are used for their legitimate purpose, as goods produced by these systems could potentially have a dual use.
Anti-Corruption Code
The Anti-Corruption Code forms the basis for raising employee awareness about corruption risks. It also serves as a guideline, instruction manual and aid in taking the necessary action to both prevent and fight corruption at specific companies or in specific sectors.
In addition to systematically following up on any incidents of corruption, the management’s main ob-jective is to counter corruption before it even occurs with the help of preventive measures and by creating and reinforcing the relevant organizational structures.
Departments are regarded as vulnerable to corruption if they are privy to information or take decisions that could present a material or immaterial advantage to a third party outside the company.
An anti-corruption officer has been appointed by Group management as a contact person for corruption prevention. This officer pursues his or her duties inde-pendently.
We ensure that each and every one of our employees is familiar with the Code of Conduct and Anti-Corruption Code by having them complete an online training course, for which they are awarded a certifi-cate. The course teaches employees how to deal with ethically or legally problematic situations.
The application of the double-checking principle is fundamentally obligatory at the Sartorius Group as a control function that protects individual employees and their colleagues.
Group Management Report | Non-Financial Group Statement A Reliable Partner 107
Data Protection
The EU General Data Protection Regulation ensures that uniform data protection legislation is in place throughout the European Union. It entered into force on May 25, 2016, largely replacing national legislation. The transition period ends on May 25, 2018, on which date the requirements of the regulation become bind-ing.
In the departments that deal with personal data, pro-jects are under way with a view to ensuring compli-ance with the requirements of the General Data Protection Regulation. Directories of procedures help to render the processing of personal data more trans-parent and consequently make the data more secure. Directories of this nature are currently being created at Sartorius.
When joining the company, every employee must participate in an online training course to ensure that all our employees are sensitized to the topic of data protection and are familiar with the corresponding rules of conduct.
Employee Interests
The Group Employees’ Council represents the interests of our staff in Germany. Five of our six operating companies in Germany also have a local employees’ council. In addition to the employee council members, numerous representatives are available to Sartorius employees. In 2017, three employee council meetings were held at which employees were provided with information and were able to voice their concerns.
Compliance Management System
Our corporate compliance team is currently being enlarged. From January 2018 onwards, a number of employees will dedicate themselves to the implemen-tation of all Group compliance topics. A whistleblower system already ensures that those responsible for compliance can be contacted and that all instances of damaging behavior such as corruption, unequal treat-ment or sexual harassment can be reported. The com-pliance team can be contacted face-to-face, via a telephone hotline, the department’s electronic mailbox or – in the case of anonymous reports – the whistle-blower system. The relevant contact options are listed on the company’s website and are thus available com-pany-wide.
Our performance
Code of Conduct training takes place in 24 countries and is available in 16 languages. As of mid-2017, every new employee must complete an online Code of Con-duct training course. Employees who have not yet done so will be requested to tackle the course in the coming months. Our Anti-Corruption Code training is conducted in the same manner.
No significant fines or non-monetary penalties result-ing from violations of laws or regulations were im-posed in the reporting year and no cases of corruption came to light.
High Environmental Protection Standards
Why it’s important
Sartorius is a manufacturing company in the technol-ogy sector with 23 production sites at which we con-sume energy and produce greenhouse gases. Our production activities also produce waste.
We classify the environmental impact of our activities as comparatively low. However, we are also aware of our responsibility for the environment and set high standards for environmental protection. The modern building technologies installed at our sites often ex-ceed the requirements of national environmental protection regulations.
We have identified the primary environmental con-cerns at Sartorius as “energy consumption and green-house gases” and “waste and hazardous materials.”
Our approach
The focal points of our environmental sustainability management are compliance with environmental regulations, efficient handling of energy and water resources, and responsible waste and recycling man-agement. Environmentally friendly product develop-ment is another core issue at Sartorius.
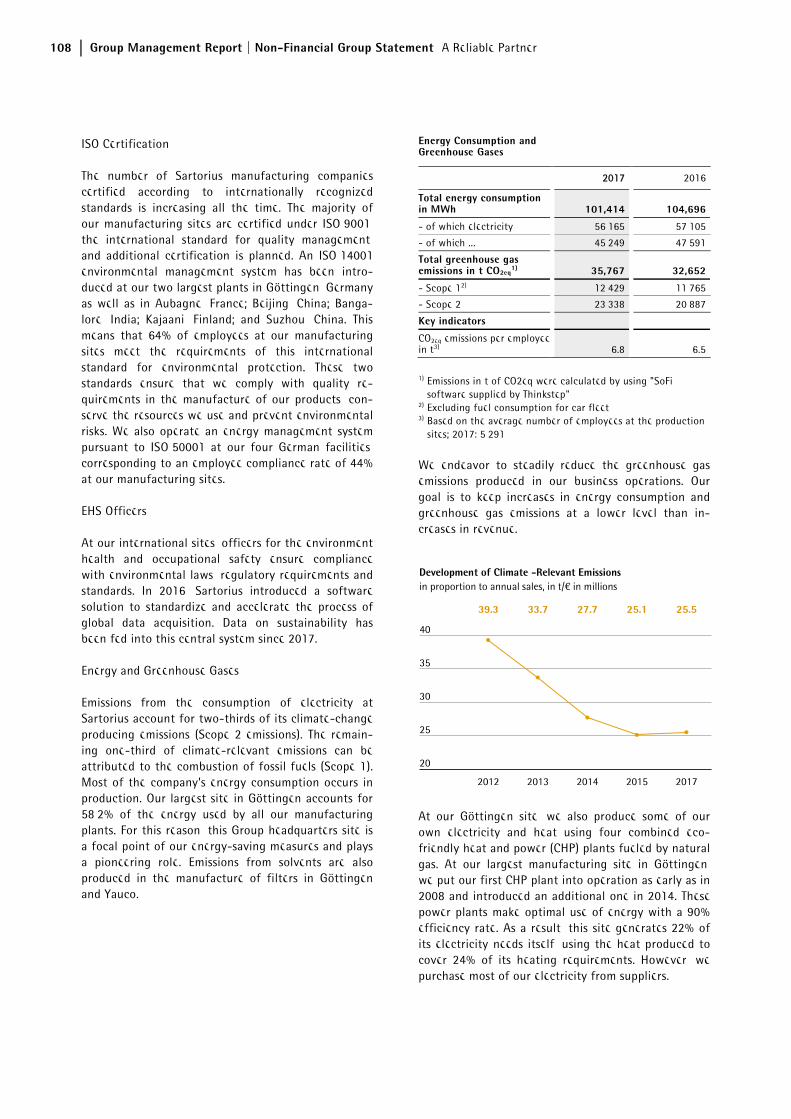
108 Group Management Report | Non-Financial Group Statement A Reliable Partner
ISO Certification
The number of Sartorius manufacturing companies certified according to internationally recognized standards is increasing all the time. The majority of our manufacturing sites are certified under ISO 9001, the international standard for quality management, and additional certification is planned. An ISO 14001 environmental management system has been intro-duced at our two largest plants in Göttingen, Germany, as well as in Aubagne, France; Beijing, China; Banga-lore, India; Kajaani, Finland; and Suzhou, China. This means that 64% of employees at our manufacturing sites meet the requirements of this international standard for environmental protection. These two standards ensure that we comply with quality re-quirements in the manufacture of our products, con-serve the resources we use and prevent environmental risks. We also operate an energy management system pursuant to ISO 50001 at our four German facilities, corresponding to an employee compliance rate of 44% at our manufacturing sites.
EHS Officers
At our international sites, officers for the environment, health and occupational safety ensure compliance with environmental laws, regulatory requirements and standards. In 2016, Sartorius introduced a software solution to standardize and accelerate the process of global data acquisition. Data on sustainability has been fed into this central system since 2017.
Energy and Greenhouse Gases
Emissions from the consumption of electricity at Sartorius account for two-thirds of its climate-change producing emissions (Scope 2 emissions). The remain-ing one-third of climate-relevant emissions can be attributed to the combustion of fossil fuels (Scope 1). Most of the company’s energy consumption occurs in production. Our largest site in Göttingen accounts for 58,2% of the energy used by all our manufacturing plants. For this reason, this Group headquarters site is a focal point of our energy-saving measures and plays a pioneering role. Emissions from solvents are also produced in the manufacture of filters in Göttingen and Yauco.
Energy Consumption and Greenhouse Gases
2017 2016
Total energy consumption in MWh 101,414 104,696
- of which electricity 56,165 57,105
- of which ... 45,249 47,591
Total greenhouse gas emissions in t CO2eq
1) 35,767 32,652
- Scope 12) 12,429 11,765
- Scope 2 23,338 20,887
Key indicators
CO2eq emissions per employee in t3) 6.8 6.5
1) Emissions in t of CO2eq were calculated by using "SoFi software supplied by Thinkstep"
2) Excluding fuel consumption for car fleet 3) Based on the average number of employees at the production
sites; 2017: 5,291
We endeavor to steadily reduce the greenhouse gas emissions produced in our business operations. Our goal is to keep increases in energy consumption and greenhouse gas emissions at a lower level than in-creases in revenue.
At our Göttingen site, we also produce some of our own electricity and heat using four combined eco-friendly heat and power (CHP) plants fueled by natural gas. At our largest manufacturing site in Göttingen, we put our first CHP plant into operation as early as in 2008 and introduced an additional one in 2014. These power plants make optimal use of energy with a 90% efficiency rate. As a result, this site generates 22% of its electricity needs itself, using the heat produced to cover 24% of its heating requirements. However, we purchase most of our electricity from suppliers.
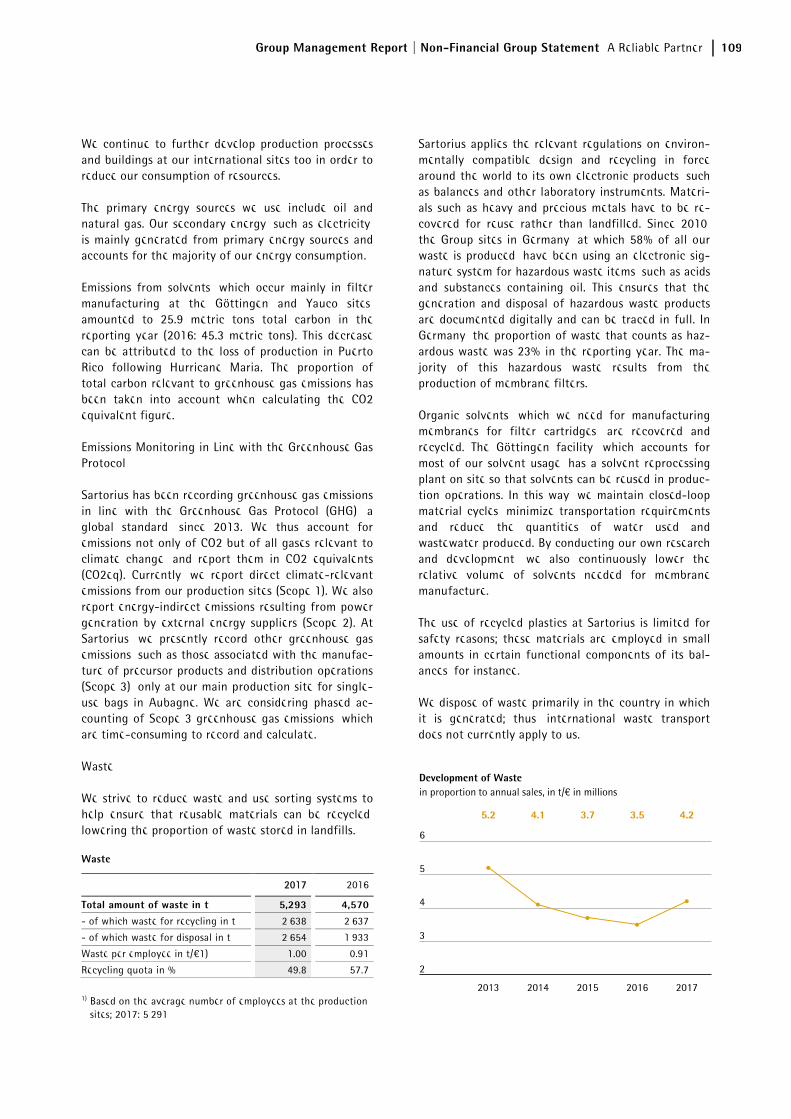
Group Management Report | Non-Financial Group Statement A Reliable Partner 109
We continue to further develop production processes and buildings at our international sites too in order to reduce our consumption of resources.
The primary energy sources we use include oil and natural gas. Our secondary energy, such as electricity, is mainly generated from primary energy sources and accounts for the majority of our energy consumption.
Emissions from solvents, which occur mainly in filter manufacturing at the Göttingen and Yauco sites, amounted to 25.9 metric tons total carbon in the reporting year (2016: 45.3 metric tons). This decrease can be attributed to the loss of production in Puerto Rico following Hurricane Maria. The proportion of total carbon relevant to greenhouse gas emissions has been taken into account when calculating the CO2 equivalent figure.
Emissions Monitoring in Line with the Greenhouse Gas Protocol
Sartorius has been recording greenhouse gas emissions in line with the Greenhouse Gas Protocol (GHG), a global standard, since 2013. We thus account for emissions not only of CO2 but of all gases relevant to climate change, and report them in CO2 equivalents (CO2eq). Currently, we report direct climate-relevant emissions from our production sites (Scope 1). We also report energy-indirect emissions resulting from power generation by external energy suppliers (Scope 2). At Sartorius, we presently record other greenhouse gas emissions, such as those associated with the manufac-ture of precursor products and distribution operations (Scope 3), only at our main production site for single-use bags in Aubagne. We are considering phased ac-counting of Scope 3 greenhouse gas emissions, which are time-consuming to record and calculate.
Waste
We strive to reduce waste and use sorting systems to help ensure that reusable materials can be recycled, lowering the proportion of waste stored in landfills.
Waste
2017 2016
Total amount of waste in t 5,293 4,570
- of which waste for recycling in t 2,638 2,637
- of which waste for disposal in t 2,654 1,933
Waste per employee in t/€1) 1.00 0.91
Recycling quota in % 49.8 57.7
1) Based on the average number of employees at the production sites; 2017: 5,291
Sartorius applies the relevant regulations on environ-mentally compatible design and recycling in force around the world to its own electronic products, such as balances and other laboratory instruments. Materi-als such as heavy and precious metals have to be re-covered for reuse rather than landfilled. Since 2010, the Group sites in Germany, at which 58% of all our waste is produced, have been using an electronic sig-nature system for hazardous waste items, such as acids and substances containing oil. This ensures that the generation and disposal of hazardous waste products are documented digitally and can be traced in full. In Germany, the proportion of waste that counts as haz-ardous waste was 23% in the reporting year. The ma-jority of this hazardous waste results from the production of membrane filters.
Organic solvents, which we need for manufacturing membranes for filter cartridges, are recovered and recycled. The Göttingen facility, which accounts for most of our solvent usage, has a solvent reprocessing plant on site so that solvents can be reused in produc-tion operations. In this way, we maintain closed-loop material cycles, minimize transportation requirements and reduce the quantities of water used and wastewater produced. By conducting our own research and development, we also continuously lower the relative volume of solvents needed for membrane manufacture.
The use of recycled plastics at Sartorius is limited for safety reasons; these materials are employed in small amounts in certain functional components of its bal-ances, for instance.
We dispose of waste primarily in the country in which it is generated; thus, international waste transport does not currently apply to us.
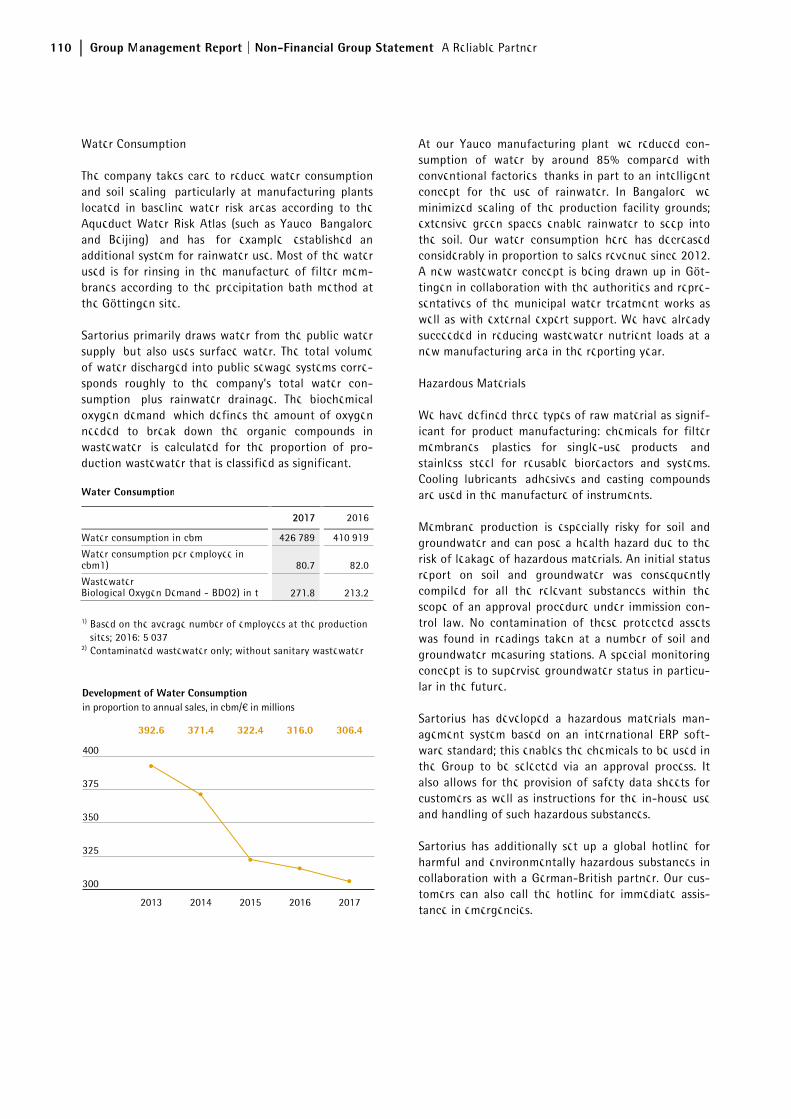
110 Group Management Report | Non-Financial Group Statement A Reliable Partner
Water Consumption
The company takes care to reduce water consumption and soil sealing, particularly at manufacturing plants located in baseline water risk areas according to the Aqueduct Water Risk Atlas (such as Yauco, Bangalore and Beijing), and has, for example, established an additional system for rainwater use. Most of the water used is for rinsing in the manufacture of filter mem-branes according to the precipitation bath method at the Göttingen site.
Sartorius primarily draws water from the public water supply, but also uses surface water. The total volume of water discharged into public sewage systems corre-sponds roughly to the company’s total water con-sumption, plus rainwater drainage. The biochemical oxygen demand, which defines the amount of oxygen needed to break down the organic compounds in wastewater, is calculated for the proportion of pro-duction wastewater that is classified as significant.
Water Consumption
2017 2016
Water consumption in cbm 426,789 410,919
Water consumption per employee in cbm1) 80.7 82.0
Wastewater Biological Oxygen Demand - BDO2) in t 271.8 213.2
1) Based on the average number of employees at the production sites; 2016: 5,037
2) Contaminated wastewater only; without sanitary wastewater
At our Yauco manufacturing plant, we reduced con-sumption of water by around 85% compared with conventional factories, thanks in part to an intelligent concept for the use of rainwater. In Bangalore, we minimized sealing of the production facility grounds; extensive green spaces enable rainwater to seep into the soil. Our water consumption here has decreased considerably in proportion to sales revenue since 2012. A new wastewater concept is being drawn up in Göt-tingen in collaboration with the authorities and repre-sentatives of the municipal water treatment works as well as with external expert support. We have already succeeded in reducing wastewater nutrient loads at a new manufacturing area in the reporting year.
Hazardous Materials
We have defined three types of raw material as signif-icant for product manufacturing: chemicals for filter membranes, plastics for single-use products, and stainless steel for reusable bioreactors and systems. Cooling lubricants, adhesives and casting compounds are used in the manufacture of instruments.
Membrane production is especially risky for soil and groundwater and can pose a health hazard due to the risk of leakage of hazardous materials. An initial status report on soil and groundwater was consequently compiled for all the relevant substances within the scope of an approval procedure under immission con-trol law. No contamination of these protected assets was found in readings taken at a number of soil and groundwater measuring stations. A special monitoring concept is to supervise groundwater status in particu-lar in the future.
Sartorius has developed a hazardous materials man-agement system based on an international ERP soft-ware standard; this enables the chemicals to be used in the Group to be selected via an approval process. It also allows for the provision of safety data sheets for customers as well as instructions for the in-house use and handling of such hazardous substances.
Sartorius has additionally set up a global hotline for harmful and environmentally hazardous substances in collaboration with a German-British partner. Our cus-tomers can also call the hotline for immediate assis-tance in emergencies.
Group Management Report | Non-Financial Group Statement A Reliable Partner 111
In the areas of R&D and applications, Sartorius also works with biological agents such as viruses and cyto-static agents. Unlike membrane and instrument manu-facturing facilities, laboratories use numerous hazardous chemicals and biological agents. These are also subject to the hazardous materials management process governing substance approval. Since the anal-ysis of customers’ chemicals involves multiple steps, substitution testing with a view to the use of less hazardous materials can only be performed to a lim-ited extent in such cases. Appropriate technical re-quirements are in place to guarantee health and environmental protection in the course of the approv-al process. These include a special safety workbench for handling cytostatic agents.
Environmentally Friendly Infrastructure Expansion
We invest continuously in new plants and plant ex-pansions to accommodate our constant growth. In constructing new facilities, we follow recognized standards for sustainable building as guidance. For example, our site in Yauco, Puerto Rico, which was expanded in 2012 to serve as the central manufactur-ing and logistics hub for the North American market, meets the highest U.S. standards for green, resource-saving and efficient construction. We even became the first pharmaceutical industry supplier worldwide to achieve Platinum-level certification of our production building in Yauco under the U.S. Green Building Coun-cil’s LEED initiative. Moreover, Sartorius considers environmental, economic and social factors when developing and expanding the Group headquarters in Göttingen. We are pursuing certification by the Ger-man Sustainable Building Council (DGNB) for the new building at which we started manufacturing opera-tions of laboratory instruments in 2016. The primary energy needed to heat this new facility alone lies 45% below the value prescribed for Germany. With our electricity charging stations, we have also have creat-ed the infrastructure to increase electromobility.
Our performance
The success of our measures is reflected in the compa-ny’s overall energy consumption and greenhouse gas emissions, which have increased at a much lower rate over the few last years than the company’s expansion in terms of sales revenue. We have also steadily re-duced waste production.
Climate Footprint at the Aubagne Site
For several years, Scope 1, 2 and 3 emissions at the Aubagne site for manufacturing single-use bags have been assessed according to the “Bilan Carbone” meth-od developed by the French Environment and Energy Management Agency (ADEME). This also includes indi-rect greenhouse gas emissions generated by upstream and downstream steps along the value chain. The evaluation of Scope 1, 2 and 3 emissions in 2015, the most recent year analyzed, yields the following distri-bution: over half of our ecological footprint is caused by freight transport (29%) and
by preliminary products and raw materials that Sartorius sources from its suppliers (22%). Business travel and work-related commuting by employees contributes 20% to the generation of greenhouse gas emissions; packaging contributes 9%, and energy con-sumption in buildings 10%. Based on this data, the site has implemented a plan of action for the ongoing reduction of CO2 emissions.
Social Commitment
Corporate Citizenship
Together with its cooperation partners, Sartorius is actively involved in shaping the economic and social environment around its sites.
Our social outreach activities targeting areas beyond our home regions concentrate on fields linked to our core business. Promoting research and education and supporting events for the scientific community remain our chief priorities.
On a regional basis, we focus on increasing the attrac-tiveness of the respective region. Our business opera-tions have many positive effects on the cities and communities in which we are based, the great majority of which have been home to Sartorius for many years. We rank among the biggest private employers at our production facilities located in small to mid-sized cities and communities such as Göttingen, Aubagne and Yauco in particular and contribute to growth and purchasing power in those regions. In addition, it’s important to us to be good citizens by providing fi-nancial support for projects in education, culture, social affairs and sports.
112 Group Management Report | Non-Financial Group Statement A Reliable Partner
Sartorius is politically independent and does not pro-vide financial or in-kind support to politicians or po-litical parties.
Promoting Education and Academic Excellence
Promoting academic excellence and interdisciplinary communication are key aspects of our long-term alli-ances with research and educational institutions. To honor outstanding academic achievement, the Florenz Sartorius Prize is awarded twice per year to the best in class at the Faculty of Economic Sciences at Göttin-gen’s Georg-August University. Within the scope of the German federal government’s scholarship program, “Deutschlandstipendium,” Sartorius also provided financial aid and practical assistance in career coun-seling to outstanding students in the reporting year.
At our French site in Aubagne, we have been collabo-rating for many years with eminent schools and uni-versities such as the École Nationale Supérieure de Technologie des Biomolécules in Bordeaux to support the education and training of biotechnology engineers and business administrators and help young graduates ease into their careers.
As a partner to the pharmaceutical industry, Sartorius takes part in symposiums, conventions, annual confer-ences and events for this industry. For instance, we regularly support the international and regional annu-al conferences of the International Society for Phar-maceutical Engineering (ISPE), an independent not-for-profit association dedicated to employee educa-tion and information sharing across the pharmaceuti-cal industry worldwide. In 2016, Sartorius also participated in several events on quality assurance of medications, such as the Drug Quality & Safety Con-ference in China and the Pharmaceutical Quality Week in Belarus.
Dedicated to the Local Environment
Together with representatives of politics, industry and society, our local subsidiaries at a number of our larg-er sites in Göttingen, Aubagne, Bohemia and Yauco are involved in initiatives to strengthen the competitive-ness of their regions. Long-term partnerships ensure reliable business relationships for regional organiza-tions. We maintain an open and constructive dialog with the various local stakeholder groups and notify them promptly and in full of any activities and devel-opments that touch upon their areas of concern. Sev-eral examples from Göttingen and Yauco are presented below.
At the Göttingen Group headquarters site, we are a longstanding member of the local logistics network and the Measurement Valley business association, an alliance of small and midsize measurement technology companies established to boost the local economy. We are also involved in the local climate protection initia-tive to reduce CO2 emissions, collaborate with Göttin-gen's Georg-August University and various scientific institutions, and are an industrial partner to several Göttingen high schools. In addition, we are a sponsor of the internationally renowned Göttingen Handel Festival, the city's "Literaturherbst" fall literature fes-tival, and the men's team of the local basketball club BG Göttingen, which currently plays in Germany's top division, as well as the women’s team, which plays in the second division.
At our subsidiary in Yauco, Puerto Rico, Sartorius works with more than ten local schools, and awards around 20 scholarships annually to especially talented high-school and university students from low-income families. In addition, visits to the company are orga-nized to motivate these young people to begin voca-tional training or university studies. Sartorius also sponsored a variety of youth sports teams and other local sporting events, and also supported two local organizations that look after homeless people in Yauco.
Integration Prize of the State of Lower Saxony
In 2017, Sartorius received the integration prize awarded by the German state of Lower Saxony, which is given to companies for their efforts on behalf of the integration of refugees. Since 2015, Sartorius has supported more than 30 new arrivals to Germany from eleven different countries. Their first steps consisting of "exploring" the company's operations and complet-ing paid internships, and the interns were also sup-ported through intensive German language courses. In addition, mentors were established and intercultural training on working with Germans was offered. Sartorius also offers support with residency issues and the official recognition of qualifications.
Of the interns who predominantly had backgrounds in natural sciences and technology, four have already become permanent employees, four have fixed-term employment and three are completing measures to prepare them for training programs.
Group Management Report | Non-Financial Group Statement A Reliable Partner 113
Christmas Donations Instead of Gifts
Sartorius has been supporting internationally active non-profit organizations as part of its “Christmas Donations Instead of Gifts” initiative since 2014. In the reporting year, Sartorius again donated €75,000 to the global medical aid organization action medeor, which supplies life-saving medications to a mobile health clinic in difficult-to-access regions of northern Iraq.
114 Group Management Report | Non-Financial Group Statement GRI Content Index
Organization and Report Profile
General Standard Disclosures
Page Externally
audited
Organizational Profile 102 - 1 102 - 2 102 - 3 102 - 4
102 - 5 102 - 6 102 - 7 102 - 8 102 - 9 102 - 10 102 - 11
102 - 12
102 - 13
Name of the organization Primary brands, products, and services Location of the organization’s headquarters Number of countries where the organization operates, and names of countries where either the organization has significant operations or that are specifically relevant to the sustainability topics covered in the report Nature of ownership and legal form Markets served Scale of the organization Employees profile, total number of employees Supply Chain Significant changes to the organisation and ist supply chain Precautionary principle or approach
Externally developed economic, environmental and social charters, principles, or other initiatives to which the organization subscribes or which it endorses Membership of associations
Combined Group management report, p. 22 Strategy and Goals, pp. 24ff. Combined Group management report, p. 22. Notes to the financial statements, pp. 143ff.; Supplementary information, pp. 190ff.
Combined Group management report, p. 22 Strategy and Goals, p. 27f. Combined Group management report, pp. 22ff. Group Business Development, p. 37f. Opportunity and risk report, pp. 56ff. Combined Group management report, p. 23 Sustainable corporate management, p. 86.; Shaping the Future, pp. 102ff. GRI Content Index, p. 112
GRI Content Index, p. 112
YesYesYesYes
YesYesYesYesYesYesYesYesYes
Yes
Strategy and Analysis 102 - 14
102 - 15
Executive Board statement concerning the relevance of sustainability to Sartorius Description of the key impacts, risks, and opportunities
Report of the Executive Board, p. 8; Sustainability at Sartorius p. 86 Opportunity and risk report, pp. 54ff.
Yes
Yes
Ethics and Integrity 102 - 16 Organization’s values, principles, standards and norms of
behavior such as codes of conduct and codes of ethics Report and declaration on corporate governance, pp. 71ff.; Sustainable corporate management, p. 86
YesYes
Governance 102 - 18 Governance structure of the organization, including
committees of the highest governance body Combined Group management report, p. 22 Yes
Stakeholder Engagement 102 - 40 102 - 41 102 - 42
102 - 43 102 - 44
List of stakholders groups Collective bargaining agreements Basis for identification and selection of stakeholders with whom to engage Approach to stakeholder engagement Key topics and concerns that have been raised through stakeholder engagement
Sustainable corporate management, p. 87f. GRI Content Index, p. 107 Sustainable corporate management, p. 87f.
Sustainable corporate management, p. 87f. Sustainable corporate management, p. 88f.
YesYesYes
YesYes
1 Reference to additional information voluntarily provided
GRI Content Index1
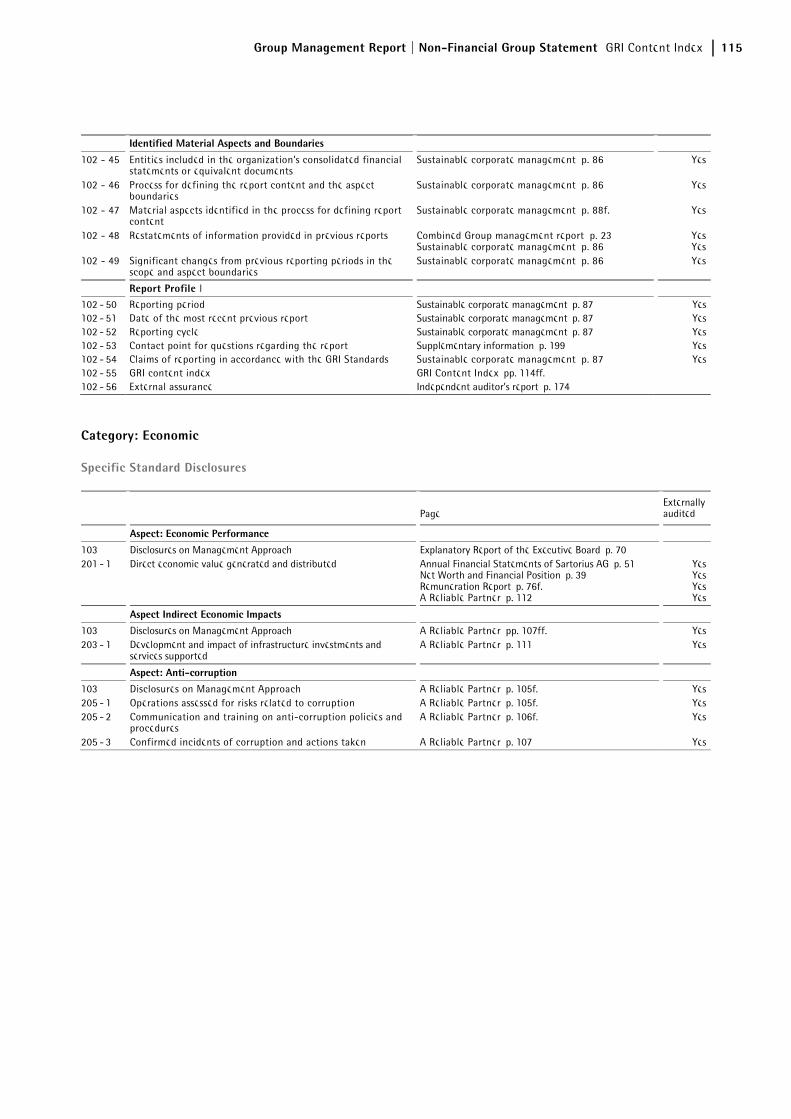
Group Management Report | Non-Financial Group Statement GRI Content Index 115
Identified Material Aspects and Boundaries
102 - 45
102 - 46
102 - 47
102 - 48
102 - 49
Entities included in the organization’s consolidated financial statements or equivalent documents Process for defining the report content and the aspect boundaries Material aspects identified in the process for defining report content Restatements of information provided in previous reports
Significant changes from previous reporting periods in the scope and aspect boundaries
Sustainable corporate management, p. 86
Sustainable corporate management, p. 86
Sustainable corporate management, p. 88f.
Combined Group management report, p. 23 Sustainable corporate management, p. 86 Sustainable corporate management, p. 86
Yes
Yes
Yes
YesYesYes
Report Profile l 102 - 50 102 - 51 102 - 52 102 - 53 102 - 54 102 - 55 102 - 56
Reporting period Date of the most recent previous report Reporting cycle Contact point for questions regarding the report Claims of reporting in accordance with the GRI Standards GRI content index External assurance
Sustainable corporate management, p. 87 Sustainable corporate management, p. 87 Sustainable corporate management, p. 87 Supplementary information, p. 199 Sustainable corporate management, p. 87 GRI Content Index, pp. 114ff. Independent auditor’s report, p. 174
YesYesYesYesYes
Category: Economic
Specific Standard Disclosures
Page Externally audited
Aspect: Economic Performance 103 201 - 1
Disclosures on Management Approach Direct economic value generated and distributed
Explanatory Report of the Executive Board, p. 70 Annual Financial Statements of Sartorius AG, p. 51 Net Worth and Financial Position, p. 39 Remuneration Report, p. 76f. A Reliable Partner, p. 112
YesYesYesYes
Aspect Indirect Economic Impacts 103 203 - 1
Disclosures on Management Approach Development and impact of infrastructure investments and services supported
A Reliable Partner, pp. 107ff. A Reliable Partner, p. 111
YesYes
Aspect: Anti-corruption 103 205 - 1 205 - 2
205 - 3
Disclosures on Management Approach Operations assessed for risks related to corruption Communication and training on anti-corruption policies and procedures Confirmed incidents of corruption and actions taken
A Reliable Partner, p. 105f. A Reliable Partner, p. 105f. A Reliable Partner, p. 106f.
A Reliable Partner, p. 107
YesYesYes
Yes
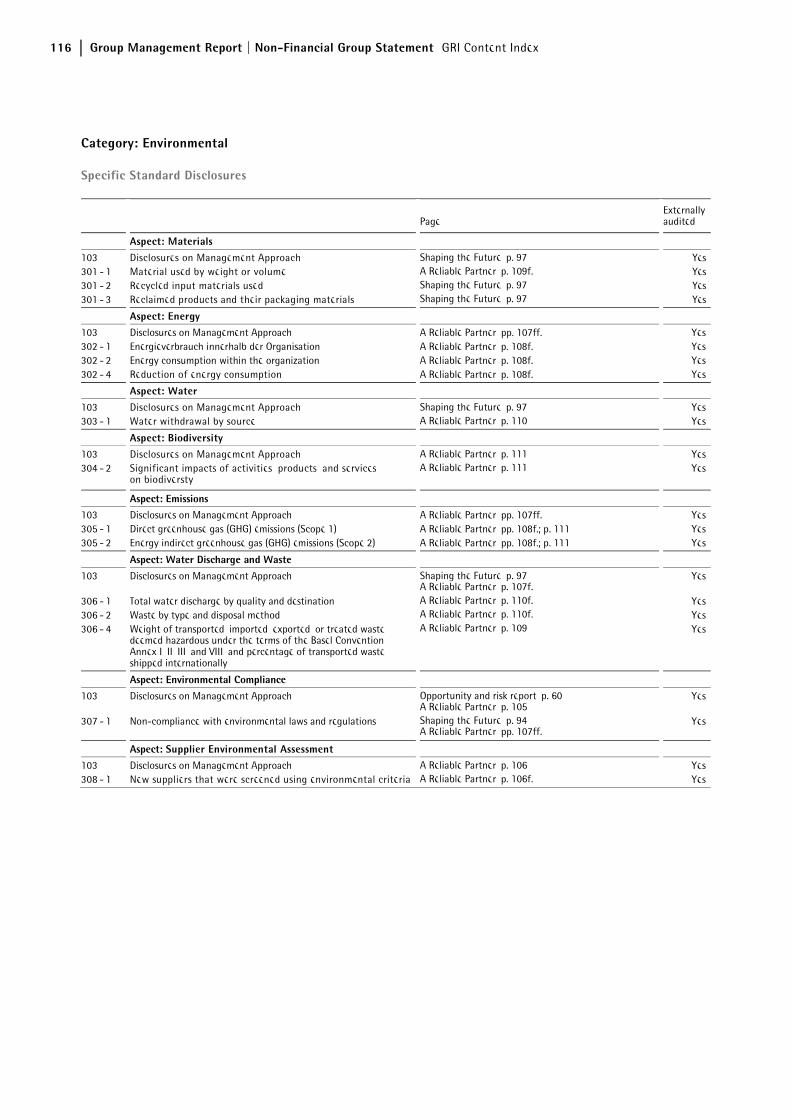
116 Group Management Report | Non-Financial Group Statement GRI Content Index
Category: Environmental
Specific Standard Disclosures
Page Externallyaudited
Aspect: Materials 103 301 - 1 301 - 2 301 - 3
Disclosures on Management Approach Material used by weight or volume Recycled input materials used Reclaimed products and their packaging materials
Shaping the Future, p. 97 A Reliable Partner, p. 109f. Shaping the Future, p. 97 Shaping the Future, p. 97
YesYesYesYes
Aspect: Energy 103 302 - 1 302 - 2 302 - 4
Disclosures on Management Approach Energieverbrauch innerhalb der Organisation Energy consumption within the organization Reduction of energy consumption
A Reliable Partner, pp. 107ff. A Reliable Partner, p. 108f. A Reliable Partner, p. 108f. A Reliable Partner, p. 108f.
YesYesYesYes
Aspect: Water 103 303 - 1
Disclosures on Management Approach Water withdrawal by source
Shaping the Future, p. 97 A Reliable Partner, p. 110
YesYes
Aspect: Biodiversity 103 304 - 2
Disclosures on Management Approach Significant impacts of activities, products, and services on biodiversty
A Reliable Partner, p. 111 A Reliable Partner, p. 111
YesYes
Aspect: Emissions 103 305 - 1 305 - 2
Disclosures on Management Approach Direct greenhouse gas (GHG) emissions (Scope 1) Energy indirect greenhouse gas (GHG) emissions (Scope 2)
A Reliable Partner, pp. 107ff. A Reliable Partner, pp. 108f.; p. 111 A Reliable Partner, pp. 108f.; p. 111
YesYesYes
Aspect: Water Discharge and Waste 103
306 - 1 306 - 2 306 - 4
Disclosures on Management Approach
Total water discharge by quality and destination Waste by type and disposal method Weight of transported, imported, exported, or treated waste deemed hazardous under the terms of the Basel Convention Annex I, II, III, and VIII, and percentage of transported waste shipped internationally
Shaping the Future, p. 97 A Reliable Partner, p. 107f. A Reliable Partner, p. 110f. A Reliable Partner, p. 110f. A Reliable Partner, p. 109
Yes
YesYesYes
Aspect: Environmental Compliance 103
307 - 1
Disclosures on Management Approach
Non-compliance with environmental laws and regulations
Opportunity and risk report, p. 60 A Reliable Partner, p. 105 Shaping the Future, p. 94 A Reliable Partner, pp. 107ff.
Yes
Yes
Aspect: Supplier Environmental Assessment 103 308 - 1
Disclosures on Management Approach New suppliers that were screened using environmental criteria
A Reliable Partner, p. 106 A Reliable Partner, p. 106f.
YesYes
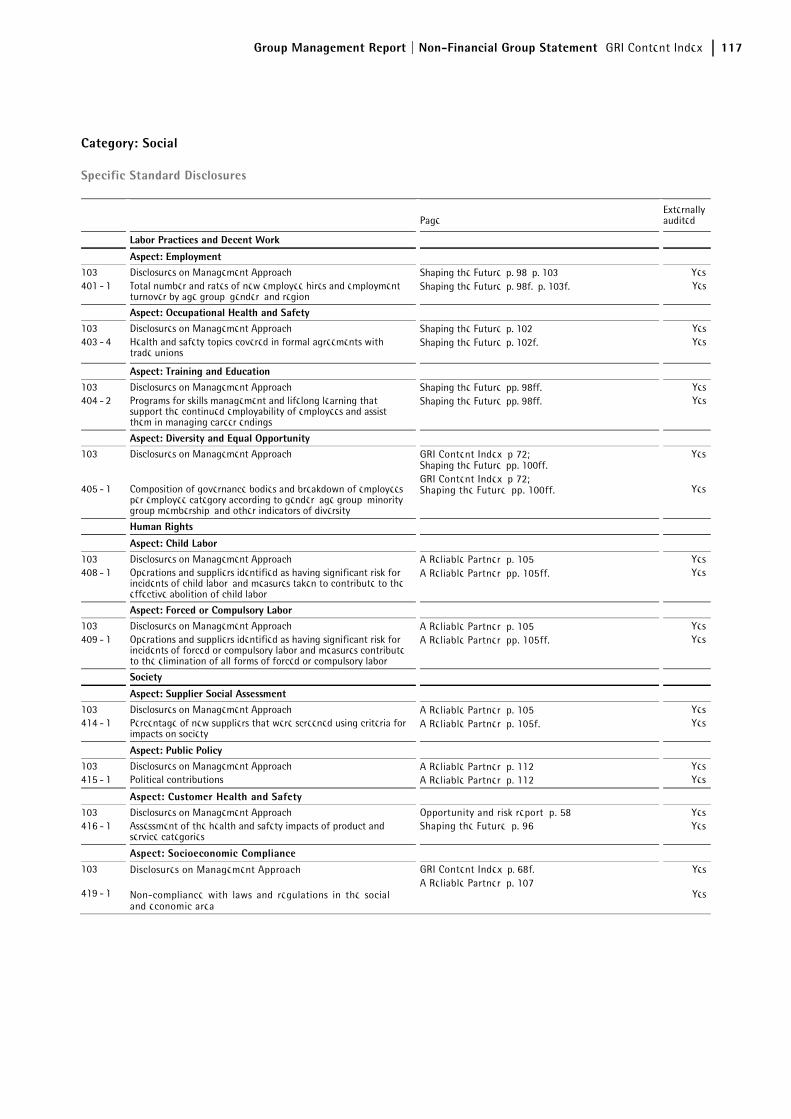
Group Management Report | Non-Financial Group Statement GRI Content Index 117
Category: Social
Specific Standard Disclosures
Page Externally audited
Labor Practices and Decent Work
Aspect: Employment 103 401 - 1
Disclosures on Management Approach Total number and rates of new employee hires and employment turnover by age group, gender, and region
Shaping the Future, p. 98, p. 103 Shaping the Future, p. 98f., p. 103f.
YesYes
Aspect: Occupational Health and Safety 103 403 - 4
Disclosures on Management Approach Health and safety topics covered in formal agreements with trade unions
Shaping the Future, p. 102 Shaping the Future, p. 102f.
YesYes
Aspect: Training and Education 103 404 - 2
Disclosures on Management Approach Programs for skills management and lifelong learning that support the continued employability of employees and assist them in managing career endings
Shaping the Future, pp. 98ff. Shaping the Future, pp. 98ff.
YesYes
Aspect: Diversity and Equal Opportunity 103
405 - 1
Disclosures on Management Approach
Composition of governance bodies and breakdown of employees per employee category according to gender, age group, minority group membership, and other indicators of diversity
GRI Content Index, p 72; Shaping the Future, pp. 100ff. GRI Content Index, p 72; Shaping the Future, pp. 100ff.
Yes
Yes
Human Rights
Aspect: Child Labor 103 408 - 1
Disclosures on Management Approach Operations and suppliers identified as having significant risk for incidents of child labor, and measures taken to contribute to the effective abolition of child labor
A Reliable Partner, p. 105 A Reliable Partner, pp. 105ff.
YesYes
Aspect: Forced or Compulsory Labor 103 409 - 1
Disclosures on Management Approach Operations and suppliers identified as having significant risk for incidents of forced or compulsory labor and measures contribute to the elimination of all forms of forced or compulsory labor
A Reliable Partner, p. 105 A Reliable Partner, pp. 105ff.
YesYes
Society
Aspect: Supplier Social Assessment 103 414 - 1
Disclosures on Management Approach Percentage of new suppliers that were screened using criteria for impacts on society
A Reliable Partner, p. 105 A Reliable Partner, p. 105f.
YesYes
Aspect: Public Policy 103 415 - 1
Disclosures on Management Approach Political contributions
A Reliable Partner, p. 112 A Reliable Partner, p. 112
YesYes
Aspect: Customer Health and Safety 103 416 - 1
Disclosures on Management Approach Assessment of the health and safety impacts of product and service categories
Opportunity and risk report, p. 58 Shaping the Future, p. 96
YesYes
Aspect: Socioeconomic Compliance 103
419 - 1
Disclosures on Management Approach
Non-compliance with laws and regulations in the social and economic area
GRI Content Index, p. 68f. A Reliable Partner, p. 107
Yes
Yes
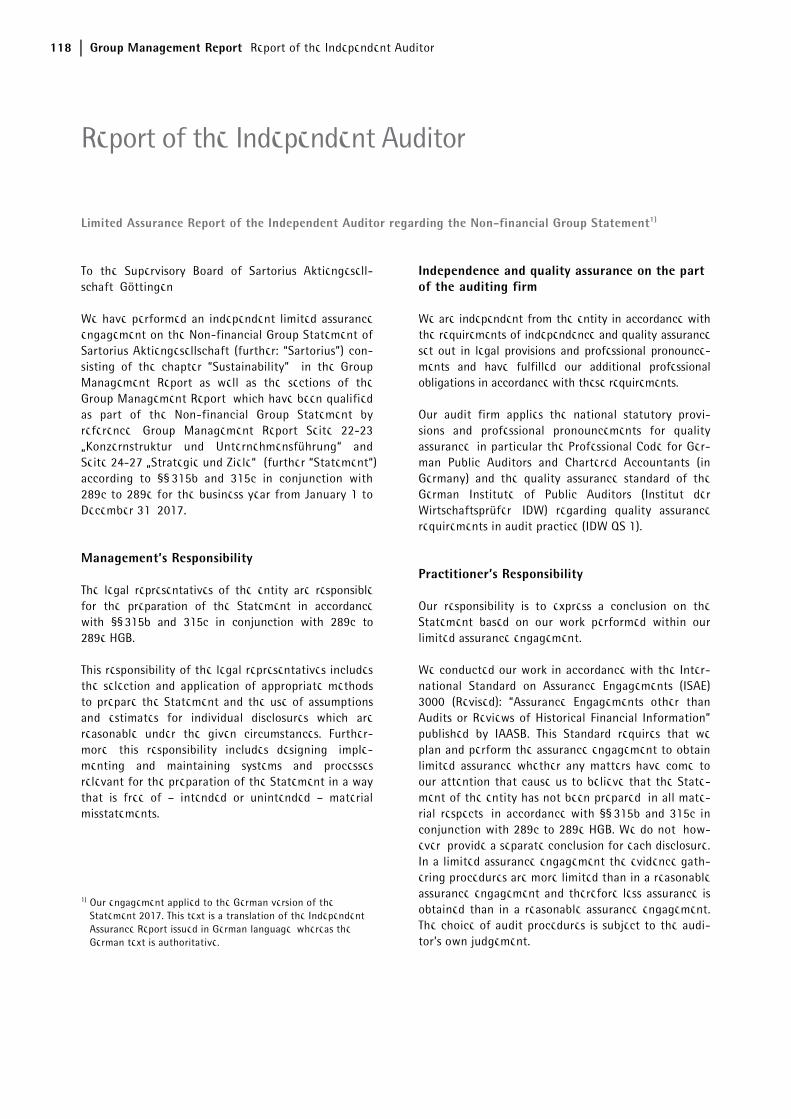
118 Group Management Report Report of the Independent Auditor
Limited Assurance Report of the Independent Auditor regarding the Non-financial Group Statement1)
To the Supervisory Board of Sartorius Aktiengesell-schaft, Göttingen
We have performed an independent limited assurance engagement on the Non-financial Group Statement of Sartorius Aktiengesellschaft (further: “Sartorius”) con-sisting of the chapter “Sustainability” in the Group Management Report as well as the sections of the Group Management Report, which have been qualified as part of the Non-financial Group Statement by reference, Group Management Report Seite 22-23 „Konzernstruktur und Unternehmensführung“ and Seite 24-27 „Strategie und Ziele“ (further “Statement“) according to §§ 315b and 315c in conjunction with 289c to 289e for the business year from January 1 to December 31, 2017.
Management’s Responsibility
The legal representatives of the entity are responsible for the preparation of the Statement in accordance with §§ 315b and 315c in conjunction with 289c to 289e HGB.
This responsibility of the legal representatives includes the selection and application of appropriate methods to prepare the Statement and the use of assumptions and estimates for individual disclosures which are reasonable under the given circumstances. Further-more, this responsibility includes designing, imple-menting and maintaining systems and processes relevant for the preparation of the Statement in a way that is free of – intended or unintended – material misstatements.
1) Our engagement applied to the German version of the Statement 2017. This text is a translation of the Independent Assurance Report issued in German language, whereas the German text is authoritative.
Independence and quality assurance on the part of the auditing firm
We are independent from the entity in accordance with the requirements of independence and quality assurance set out in legal provisions and professional pronounce-ments and have fulfilled our additional professional obligations in accordance with these requirements.
Our audit firm applies the national statutory provi-sions and professional pronouncements for quality assurance, in particular the Professional Code for Ger-man Public Auditors and Chartered Accountants (in Germany) and the quality assurance standard of the German Institute of Public Auditors (Institut der Wirtschaftsprüfer, IDW) regarding quality assurance requirements in audit practice (IDW QS 1).
Practitioner’s Responsibility
Our responsibility is to express a conclusion on the Statement based on our work performed within our limited assurance engagement.
We conducted our work in accordance with the Inter-national Standard on Assurance Engagements (ISAE) 3000 (Revised): “Assurance Engagements other than Audits or Reviews of Historical Financial Information” published by IAASB. This Standard requires that we plan and perform the assurance engagement to obtain limited assurance whether any matters have come to our attention that cause us to believe that the State-ment of the entity has not been prepared, in all mate-rial respects, in accordance with §§ 315b and 315c in conjunction with 289c to 289e HGB. We do not, how-ever, provide a separate conclusion for each disclosure. In a limited assurance engagement the evidence gath-ering procedures are more limited than in a reasonable assurance engagement and therefore less assurance is obtained than in a reasonable assurance engagement. The choice of audit procedures is subject to the audi-tor’s own judgement.
Report of the Independent Auditor
Group Management Report Report of the Independent Auditor 119
Within the scope of our engagement, we performed amongst others the following procedures:
– Inquiries of personnel on corporate level, who are responsible for the materiality analysis, in order to gain an understanding of the processes for determining material sustainability topics and respective reporting boundaries of Sartorius
– A risk analysis, including a media search, to identify relevant information on Sartorius’s sustainability performance in the reporting period
– Evaluation of the design and implementation of the systems and processes for determining, processing and monitoring of disclosures relating to environmental, employee and social matters, respect for human rights, and combating corruption and bribery, including the consolidation of the data
– Inquiries of personnel on corporate level who are responsible for determining disclosures on concepts, due diligence processes, results and risks, for conducting internal controls and consolidation of the disclosures
– Evaluation of selected internal and external documentation
– Analytical evaluation of data and trends of quantitative disclosures, which are submitted by all sites for consolidation on corporate level
– Evaluation of local data collection, validation and reporting processes as well as the reliability of reported data based on a sample of the sites Sartorius Stedim Biotech GmbH in Germany and Sartorius Stedim Lab Ltd.in the United Kingdom
– Assessment of the overall presentation of the disclosures
Conclusion
Based on the procedures performed and the evidence obtained, nothing has come to our attention that causes us to believe that the Statement of Sartorius, for the business year from January 1 to December 31, 2017, is not prepared, in all material respects, in ac-cordance with §§ 315b and 315c in conjunction with 289c to 289e HGB.
Restriction of use / AAB clause
This assurance report is issued for purposes of the Supervisory Board of Sartorius Aktiengesellschaft, Göttingen, only. We assume no responsibility with regard to any third parties.
Our assignment for the Supervisory Board of Sartorius Aktiengesellschaft and professional liability is governed by the General Conditions of Assignment for Wirtschaftsprüfer and Wirtschaftsprüfungsgesell-schaften (Allgemeine Auftragsbedingungen für Wirtschaftsprüfer und Wirtschaftsprüfungsgesell-schaften) in the version dated January 1, 2017 (https://www.kpmg.de/bescheinigungen/lib/aab_english.pdf). By reading and using the information contained in this assurance report, each recipient confirms notice of provisions of the General Conditions of Assignment (including the limitation of our liability for negligence to EUR 4 Mio as stipulated in No. 9) and accepts the validity of the attached General Conditions of Assignment with respect to us.
Düsseldorf, February 5, 2018
KPMG AG Wirtschaftsprüfungsgesellschaft
Signed by
Laue ppa. Hell Wirtschaftsprüfer Auditor

120 Group Management Report Report of the Independent Auditor
Consolidated Financial Statements and Notes
Konzern_Trennseiten.indd 17 15.02.18 09:27
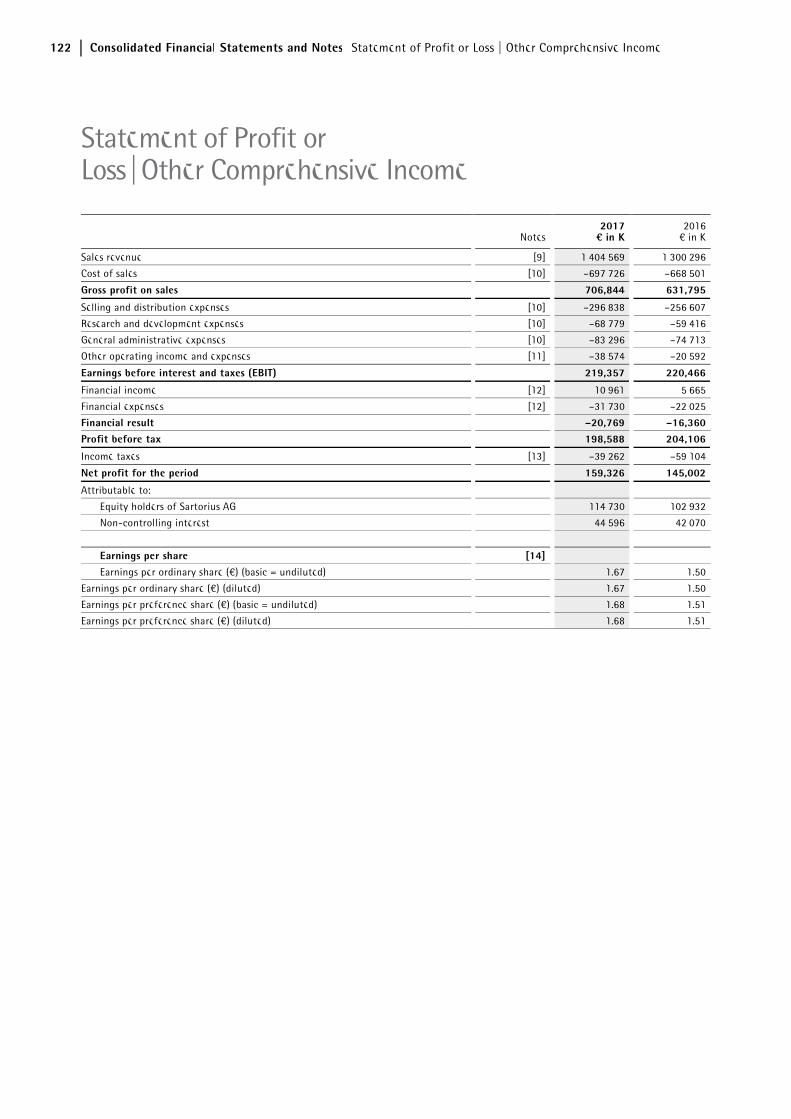
122 Consolidated Financial Statements and Notes Statement of Profit or Loss | Other Comprehensive Income
Notes2017¤ in K
2016€ in K
Sales revenue [9] 1,404,569 1,300,296
Cost of sales [10] –697,726 –668,501
Gross profit on sales 706,844 631,795
Selling and distribution expenses [10] –296,838 –256,607
Research and development expenses [10] –68,779 –59,416
General administrative expenses [10] –83,296 –74,713
Other operating income and expenses [11] –38,574 –20,592
Earnings before interest and taxes (EBIT) 219,357 220,466
Financial income [12] 10,961 5,665
Financial expenses [12] –31,730 –22,025
Financial result –20,769 –16,360Profit before tax 198,588 204,106
Income taxes [13] –39,262 –59,104
Net profit for the period 159,326 145,002
Attributable to:
Equity holders of Sartorius AG 114,730 102,932
Non-controlling interest 44,596 42,070
Earnings per share [14]
Earnings per ordinary share (€) (basic = undiluted) 1.67 1.50
Earnings per ordinary share (€) (diluted) 1.67 1.50
Earnings per preference share (€) (basic = undiluted) 1.68 1.51
Earnings per preference share (€) (diluted) 1.68 1.51
Statement of Profit or Loss|Other Comprehensive Income
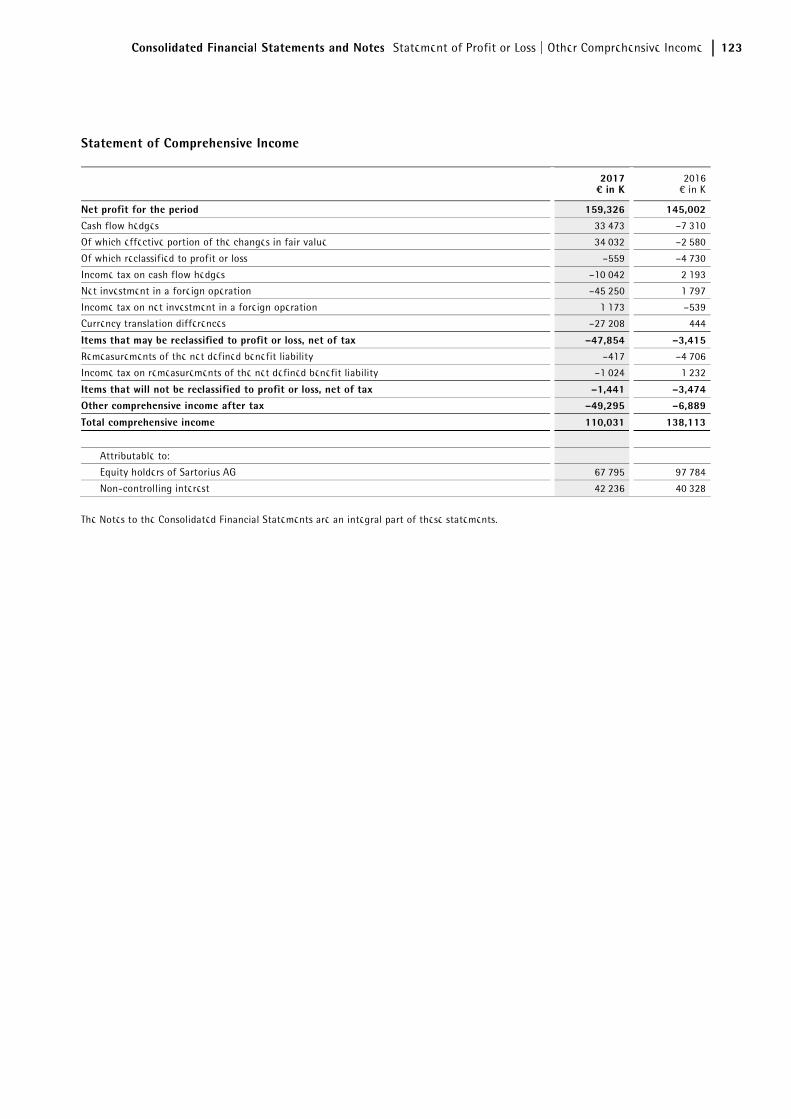
Consolidated Financial Statements and Notes Statement of Profit or Loss | Other Comprehensive Income 123
Statement of Comprehensive Income
2017¤ in K
2016€ in K
Net profit for the period 159,326 145,002Cash flow hedges 33,473 –7,310
Of which effective portion of the changes in fair value 34,032 –2,580
Of which reclassified to profit or loss –559 –4,730
Income tax on cash flow hedges –10,042 2,193
Net investment in a foreign operation –45,250 1,797
Income tax on net investment in a foreign operation 1,173 –539
Currency translation differences –27,208 444
Items that may be reclassified to profit or loss, net of tax –47,854 –3,415Remeasurements of the net defined benefit liability –417 –4,706
Income tax on remeasurements of the net defined benefit liability –1,024 1,232
Items that will not be reclassified to profit or loss, net of tax –1,441 –3,474Other comprehensive income after tax –49,295 –6,889
Total comprehensive income 110,031 138,113
Attributable to:
Equity holders of Sartorius AG 67,795 97,784
Non-controlling interest 42,236 40,328
The Notes to the Consolidated Financial Statements are an integral part of these statements.
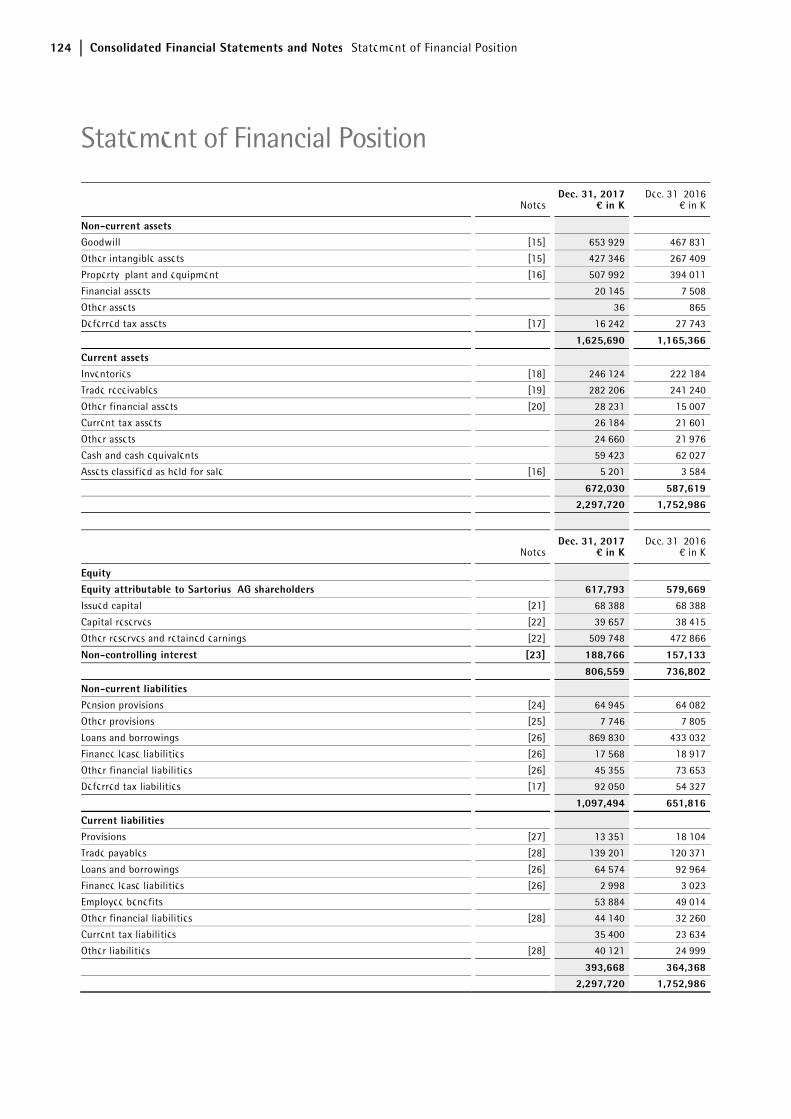
124 Consolidated Financial Statements and Notes Statement of Financial Position
NotesDec. 31, 2017
¤ in KDec. 31, 2016
€ in K
Non-current assets Goodwill [15] 653,929 467,831
Other intangible assets [15] 427,346 267,409
Property, plant and equipment [16] 507,992 394,011
Financial assets 20,145 7,508
Other assets 36 865
Deferred tax assets [17] 16,242 27,743
1,625,690 1,165,366
Current assets Inventories [18] 246,124 222,184
Trade receivables [19] 282,206 241,240
Other financial assets [20] 28,231 15,007
Current tax assets 26,184 21,601
Other assets 24,660 21,976
Cash and cash equivalents 59,423 62,027
Assets classified as held for sale [16] 5,201 3,584
672,030 587,6192,297,720 1,752,986
NotesDec. 31, 2017
¤ in KDec. 31, 2016
€ in K
Equity Equity attributable to Sartorius AG shareholders 617,793 579,669Issued capital [21] 68,388 68,388
Capital reserves [22] 39,657 38,415
Other reserves and retained earnings [22] 509,748 472,866
Non-controlling interest [23] 188,766 157,133
806,559 736,802
Non-current liabilities Pension provisions [24] 64,945 64,082
Other provisions [25] 7,746 7,805
Loans and borrowings [26] 869,830 433,032
Finance lease liabilities [26] 17,568 18,917
Other financial liabilities [26] 45,355 73,653
Deferred tax liabilities [17] 92,050 54,327
1,097,494 651,816
Current liabilities Provisions [27] 13,351 18,104
Trade payables [28] 139,201 120,371
Loans and borrowings [26] 64,574 92,964
Finance lease liabilities [26] 2,998 3,023
Employee benefits 53,884 49,014
Other financial liabilities [28] 44,140 32,260
Current tax liabilities 35,400 23,634
Other liabilities [28] 40,121 24,999
393,668 364,3682,297,720 1,752,986
Statement of Financial Position
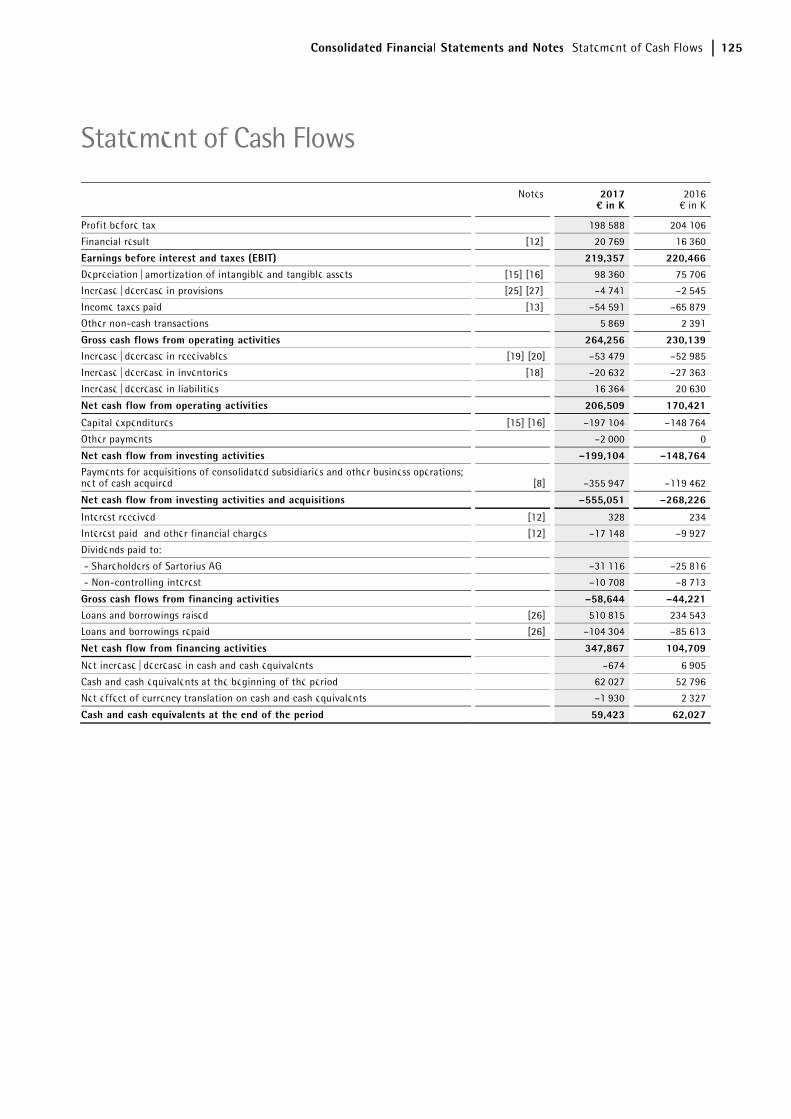
Consolidated Financial Statements and Notes Statement of Cash Flows 125
Notes 2017¤ in K
2016€ in K
Profit before tax 198,588 204,106
Financial result [12] 20,769 16,360
Earnings before interest and taxes (EBIT) 219,357 220,466
Depreciation | amortization of intangible and tangible assets [15] [16] 98,360 75,706
Increase | decrease in provisions [25] [27] –4,741 –2,545
Income taxes paid [13] –54,591 –65,879
Other non-cash transactions 5,869 2,391
Gross cash flows from operating activities 264,256 230,139Increase | decrease in receivables [19] [20] –53,479 –52,985
Increase | decrease in inventories [18] –20,632 –27,363
Increase | decrease in liabilities 16,364 20,630
Net cash flow from operating activities 206,509 170,421
Capital expenditures [15] [16] –197,104 –148,764
Other payments –2,000 0
Net cash flow from investing activities –199,104 –148,764Payments for acquisitions of consolidated subsidiaries and other business operations; net of cash acquired [8] –355,947 –119,462
Net cash flow from investing activities and acquisitions –555,051 –268,226
Interest received [12] 328 234
Interest paid and other financial charges [12] –17,148 –9,927
Dividends paid to:
- Shareholders of Sartorius AG –31,116 –25,816
- Non-controlling interest –10,708 –8,713
Gross cash flows from financing activities –58,644 –44,221Loans and borrowings raised [26] 510,815 234,543
Loans and borrowings repaid [26] –104,304 –85,613
Net cash flow from financing activities 347,867 104,709
Net increase | decrease in cash and cash equivalents –674 6,905
Cash and cash equivalents at the beginning of the period 62,027 52,796
Net effect of currency translation on cash and cash equivalents –1,930 2,327
Cash and cash equivalents at the end of the period 59,423 62,027
Statement of Cash Flows
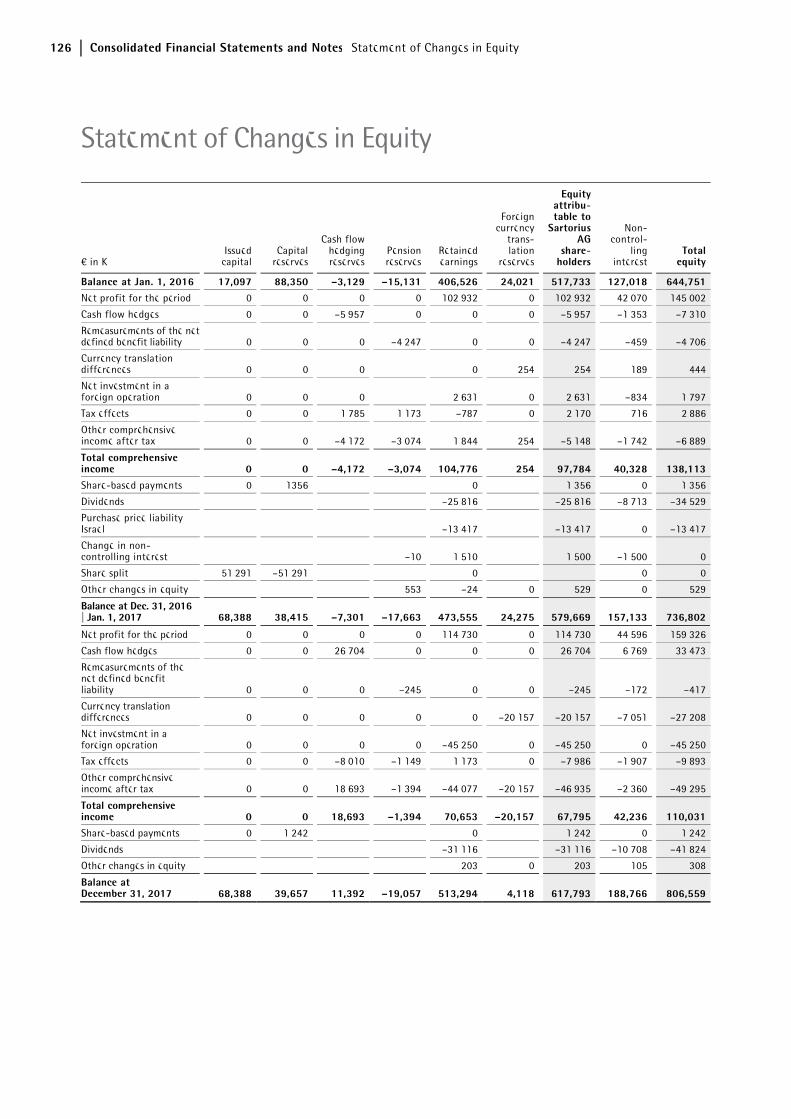
126 Consolidated Financial Statements and Notes Statement of Changes in Equity
€ in K Issued
capitalCapital
reserves
Cash flow hedgingreserves
Pensionreserves
Retained earnings
Foreign currency
trans-lation
reserves
Equity attribu-table to
Sartorius AG
share-holders
Non-control-
ling interest
Total equity
Balance at Jan. 1, 2016 17,097 88,350 –3,129 –15,131 406,526 24,021 517,733 127,018 644,751Net profit for the period 0 0 0 0 102,932 0 102,932 42,070 145,002
Cash flow hedges 0 0 –5,957 0 0 0 –5,957 –1,353 –7,310
Remeasurements of the net defined benefit liability 0 0 0 –4,247 0 0 –4,247 –459 –4,706
Currency translation differences 0 0 0 0 254 254 189 444
Net investment in a foreign operation 0 0 0 2,631 0 2,631 –834 1,797
Tax effects 0 0 1,785 1,173 –787 0 2,170 716 2,886
Other comprehensive income after tax 0 0 –4,172 –3,074 1,844 254 –5,148 –1,742 –6,889
Total comprehensive income 0 0 –4,172 –3,074 104,776 254 97,784 40,328 138,113Share-based payments 0 1356 0 1,356 0 1,356
Dividends –25,816 –25,816 –8,713 –34,529
Purchase price liability Israel –13,417 –13,417 0 –13,417
Change in non-controlling interest –10 1,510 1,500 –1,500 0
Share split 51,291 –51,291 0 0 0
Other changes in equity 553 –24 0 529 0 529
Balance at Dec. 31, 2016 | Jan. 1, 2017 68,388 38,415 –7,301 –17,663 473,555 24,275 579,669 157,133 736,802
Net profit for the period 0 0 0 0 114,730 0 114,730 44,596 159,326
Cash flow hedges 0 0 26,704 0 0 0 26,704 6,769 33,473
Remeasurements of the net defined benefit liability 0 0 0 –245 0 0 –245 –172 –417
Currency translation differences 0 0 0 0 0 –20,157 –20,157 –7,051 –27,208
Net investment in a foreign operation 0 0 0 0 –45,250 0 –45,250 0 –45,250
Tax effects 0 0 –8,010 –1,149 1,173 0 –7,986 –1,907 –9,893
Other comprehensive income after tax 0 0 18,693 –1,394 –44,077 –20,157 –46,935 –2,360 –49,295
Total comprehensive income 0 0 18,693 –1,394 70,653 –20,157 67,795 42,236 110,031Share-based payments 0 1,242 0 1,242 0 1,242
Dividends –31,116 –31,116 –10,708 –41,824
Other changes in equity 203 0 203 105 308
Balance at December 31, 2017 68,388 39,657 11,392 –19,057 513,294 4,118 617,793 188,766 806,559
Statement of Changes in Equity
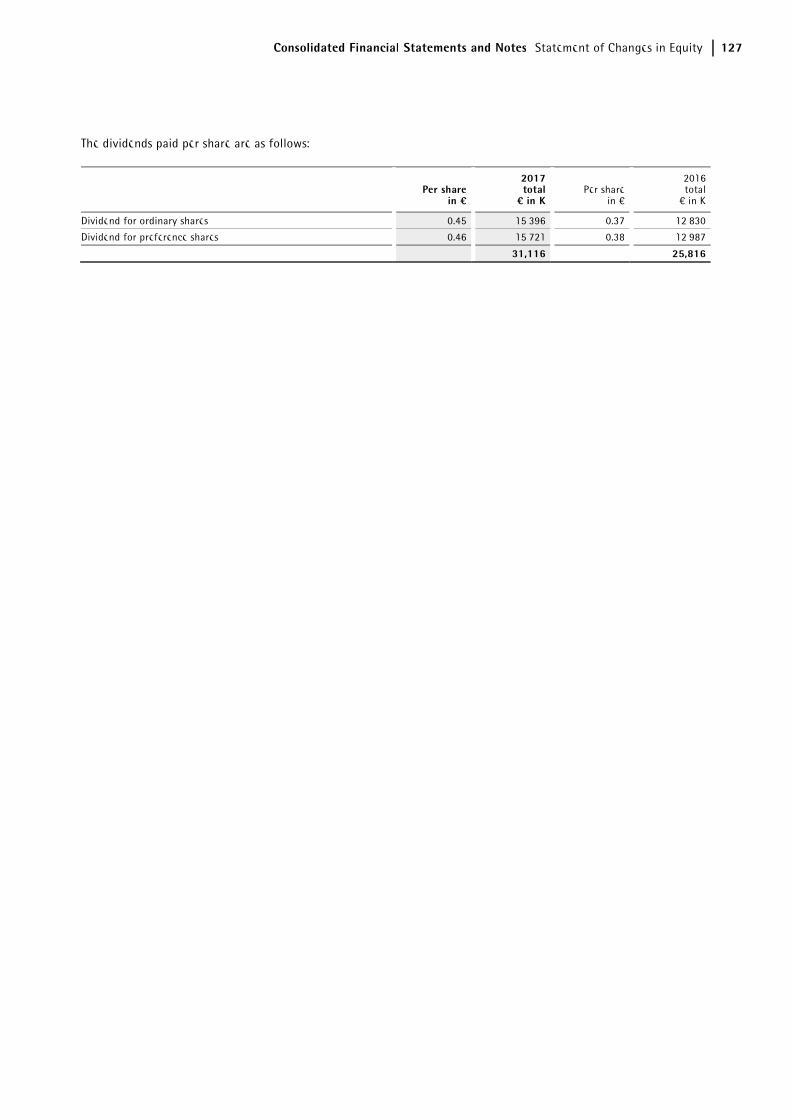
Consolidated Financial Statements and Notes Statement of Changes in Equity 127
The dividends paid per share are as follows:
Per sharein ¤
2017total¤ in K
Per sharein €
2016total
€ in K
Dividend for ordinary shares 0.45 15,396 0.37 12,830
Dividend for preference shares 0.46 15,721 0.38 12,987
31,116 25,816
128 Consolidated Financial Statements and Notes Notes to the Financial Statements
1. General Information
Sartorius AG is a listed joint stock corporation estab-lished according to German law and is the highest-level parent company of the Sartorius Group. The corporation is recorded in the German Commercial Register of the District Court of Göttingen (HRB 1970) and is headquartered at Otto-Brenner-Str. 20 in Göt-tingen, Federal Republic of Germany.
The Sartorius Group organizes its business in two divi-sions: Bioprocess Solutions and Lab Products & Ser-vices. With its Bioprocess Solutions Division, Sartorius is a leading international supplier of products and technologies for the manufacture of medications and vaccines on a biological basis, so-called biopharma-ceuticals. As part of its total solutions provider strate-gy, the Bioprocess Solutions Division offers the biopharmaceutical industry a product portfolio that covers nearly all process steps of the industry's manu-facture. These encompass cell culture media for the cultivation of cells, bioreactors of various sizes for cell propagation and different technologies, such as filters and bags for cell harvesting, purification and concen-tration, all the way to filling. The Lab Products & Ser-vices Division focuses on laboratories in the research and quality assurance sectors of pharmaceutical and biopharmaceutical companies and on academic re-search institutes. It serves further customers in the chemical and food industries. The division's portfolio covers instruments and consumables that laboratories use, for example, in sample preparation or in other standard applications.
In compliance with § 315a, Subsection 1, of the Ger-man Commercial Code (HGB) in conjunction with Art. 4 of the Regulation (EC) No. 1606/2002 of the European Parliament and Council, dated July 19, 2002 (OJ L243 p. 1), the consolidated financial statements of the Sartorius Group for the year ended December 31, 2017, were prepared according to the IFRS and IFRIC Standards and Interpretations of the International Accounting Standards Board (IASB) as required to be applied by the European Union. These are available on the following site:
https://ec.europa.eu/info/business-economy-euro/company-reporting-and-auditing/company-reporting/financial-reporting_en.
The consolidated financial statements are prepared in euros. Unless otherwise specified, all amounts are disclosed in thousands of euros (abbreviated as € in K). In some cases, the sums of the figures given in this report may not precisely equal the stated totals, and percentages may not be exact due to rounding.
The Executive Board is scheduled to submit the consol-idated financial statements on February 20, 2018, to the Supervisory Board.
2. Effects from New or Amended Standards
Standards to Be Applied for the First Time in 2017
Compared to the year-earlier consolidated financial statements, the following new or revised accounting standards were generally required to be applied for the first time and did not result in any material im-pacts on the consolidated financial statements:
– Amendments to IAS 7, Disclosure Initiative
The objective of these Amendments is to improve information provided to users of financial statements about an entity's financing activities. Additional dis-closures are intended to enable such users to assess changes in liabilities resulting from financing activities (see Section 6).
– Amendments to IAS 12, Recognition of Deferred Tax Assets for Unrealised Losses
The Amendments to IAS 12 clarify how to account for deferred tax assets for unrealized losses on debt in-struments.
New Standards and Interpretations Not Yet Applied
The Standards, Interpretations and Amendments to standards in the following were not yet applied to the consolidated financial statements of the reporting year as they had not yet been adopted by the EU or their application was not obligatory for 2017:
IFRS 15, Revenue from Contracts with Customers
This Standard defines a comprehensive model to de-termine when to recognize revenue and at what
Notes to the Financial Statements
Consolidated Financial Statements and Notes Notes to the Financial Statements 129
amount. It replaces existing guidelines for measure-ment of revenue, including IAS 18, Revenue; IAS 11, Construction Contracts; and IFRIC 13, Customer Loyal-ty Programmes.
The Group conducted a project to analyze the effects arising from the application of new standards in the future. At this time, the Group does not expect any material changes regarding the amount and timing of revenue for the major part of the Group's business. However, especially in the case of construction con-tracts accounted for so far under IAS 11, the timing of recognition may change as a result of the new criteria of IFRS 15 for revenue recognition over time.
The Group does not use the full retrospective approach in applying this new standard. Instead, the Group recognizes the cumulative effect of applying IFRS 15 at the date of initial application as an adjustment to the opening balance of equity. Furthermore, upon initial adoption, the Group applies IFRS 15 only to contracts that are not considered completed contracts at the date of initial application. Assessment of in-complete construction contracts in our project busi-ness on the date of initial application of IFRS 15 yielded that sales revenue of approximately €5 million was not to be recognized over time according to this Standard so that revenue will now be recognized at a point in time upon completion of a project. As a result, revenue in future periods will be higher by this amount than when accounted for according to the earlier approach. If revenue in our project business is recognized over time, the progress of a project will continue to be measured according to the costs in-curred in proportion to the planned project costs.
Moreover, as a result of initial application of IFRS 15, the Group has extended disclosure obligations in view of revenues from contracts with customers as defined by IFRS 15.
IFRS 9, Financial Instruments
This Standard issued in July 2014 replaces the existing guidelines in IAS 39, Financial Instruments: Recogni-tion and Measurement. IFRS 9 contains the revised guidance for classification and measurement of finan-cial instruments, including a new model of expected credit losses for calculation of the impairment of fi-nancial assets, as well as the new, general hedge ac-counting requirements. The Standard also adopts the guidance from IAS 39 for measurement and derecog-nition of financial instruments. IFRS 9 is to be applied starting in 2018.
Classification and Measurement
IFRS 9 contains a new classification and measurement approach for financial assets, which reflects both the entity’s business model (held-to-collect, held-to-collect-and-sell, other) within the scope of which assets are held and the contractual cash flow charac-teristics (SPPI criterion).
The Group's financial instruments were inventoried and classified according to the business models, and the measurement categories were determined accord-ing to IFRS 9. Essentially, as of the reporting date, financial assets are reported according to the hold-to-collect business model in the consolidated financial statements in order to collect contractual cash flows. Moreover, the cash flows of the financial assets essen-tially consist of interest and principal payments (SPPI). In the overall audit review, there are thus no material impacts due to the Amendments to IFRS 9 concerning classification and measurement of the Group's finan-cial assets.
Impairments
The Standard replaces the incurred loss model for impairment measurement by the expected loss model. The new impairment model applies to financial assets that are measured at amortized cost or fair value with changes recognized in other comprehensive income. According to IFRS 9, loss allowances are either meas-ured on the basis of the 12-month expected credit losses or on the basis of the full lifetime expected credit losses. Impairment in the amount of lifetime expected credit losses must be recognized for all fi-nancial instruments for which there have been signifi-cant increases in credit risk since initial recognition. The same applies irrespectively of an increase in the credit risk for trade receivables that do not contain a significant financing component in accordance with IFRS 15 (simplified approach).
In the Sartorius Group, the simplified impairment approach is used, in particular, to measure trade re-ceivables. The new impairment model starts with an analysis of the actual historical credit loss rates. These are adjusted, if significant, and taking into considera-tion forward-looking information, by the effects of current changes in the macroeconomic environment. In view of insignificant past credit losses due to cred-it-impaired assets, it is assumed that no material addi-tional impairment will be recognized if the economic outlook remains constant. Besides trade receivables, cash and cash equivalents represent the most signifi-cant financial assets as of the reporting date in view of the consolidated statement of financial position. Regarding the high creditworthiness of the Group's
130 Consolidated Financial Statements and Notes Notes to the Financial Statements
contractual partners and short-term maturities by definition and contractual periods, the impairement to be measured for these assets in the future is of an insignificant amount according to present knowledge. The impacts of the new requirements of this Standard are therefore currently assessed as low.
Hedge Accounting
For first-time application of IFRS 9, the Group may elect to continue to apply the hedge accounting re-quirements of IAS 39 instead of the requirements of IFRS 9. The Group applies the new requirements of IFRS 9. As part of its hedge accounting, the Group uses forward exchange contracts to hedge against fluctua-tions in cash flows in connection with changes in foreign exchange rates from product disposals and changes in the procurement of manufacturing equip-ment, in these cases designating only the spot element of hedging instruments. In applying IFRS 9, the Group will recognize the change in the time value component in other comprehensive income in order to amortize in parallel with the impact of the hedged underlying transaction on the revenue results. Conversion of the Group's accounting treatment of time value compo-nents is likely to result in lower profit or loss volatility. For the year ended December 31, 2017, the non-designated components in hedge accounting were about €4 million.
First-time Application
The Group intends to make use of the exception of not adjusting its comparative information concerning the disclosure and measurement (including impairment) for previous reporting periods. At the beginning of the first reporting period (January 1, 2018), differences between the carrying amounts so far and those at the beginning of the first reporting period would have to be recognized without effect on profit or loss due to the application of IFRS 9. In view of the impacts de-scribed above, this entails adjustment of the carrying value of trade receivables by the expected credit losses, as well as reclassification of the time value component of hedging instruments existing as of the reporting date to the "cost of hedging reserves." By contrast, no impairment of cash and cash equivalents is expected based on materiality considerations. Apart from this, IFRS 9 requires considerable new information, particu-larly for hedge accounting, as well as on credit risk and expected credit losses.
IFRS 16, Leases
IFRS 16 introduces a standardized accounting model according to which leases are to be recognized on the lessee's balance sheet. A lessee measures a right-of-use asset representing his right to use a lease asset, as well as a liability resulting from the lease, which rep-resents his obligation to make lease payments. There are exemptions for short-term leases and leases of low-value assets. Accounting for the lessor is compa-rable with that of the current standard; i.e., lessors continue to classify leases as financial or operating leases.
The Group has started to analyze the effects of this new Standard and plans to use the exemptions for short-term leases and leases of low-value assets and to recognize lease payments as an expense generally on a straight-line basis over the particular lease term.
IFRS 16 will likely lead to an increase in fixed assets and financial liabilities. Based on its present level of knowledge, the Group does not expect any significant impacts overall on its key figures, such as equity ratio or underlying EBITDA. For example, on the basis of the Group's future financial obligations in relation to operating leases (see Section 29) as reported on De-cember 31, 2017, its equity ratio would be reduced by about 1% and its underlying EBITDA margin would slighly increase.
IFRS 16 is required to be applied for the first time as of 2019. Currently, there are no plans for earlier appli-cation.
Consolidated Financial Statements and Notes Notes to the Financial Statements 131
Standard | Interpretation Title
Applicablefor financial years from1)
Endorsement by the
EU Commission
IFRS 14 Regulatory Deferral Accounts January 1, 2016 No
Amendments to IFRS 12 Annual Improvements to IFRSs 2014 - 2016 Cycle (issued in Dec. 2016) January 1, 2017 No
Amendments to IFRS 1 and IAS 28 Annual Improvements to IFRSs 2014 - 2016 Cycle (issued in Dec. 2016) January 1, 2018 No
IFRS 15 Revenue from Contracts with Customers January 1, 2018 Yes
IFRS 9 Financial Instruments January 1, 2018 Yes
Clarifications to IFRS 15 Revenue from Contracts with Customers January 1, 2018 Yes
Amendments to IFRS 2 Classification and Measurement of Share-based Payment Transactions January 1, 2018 No
Amendments to IFRS 4 Applying IFRS 9 Financial Instruments with IFRS 4 Insurance Contracts January 1, 2018 Yes
Amendments to IAS 40 Transfers of Investmenty Property January 1, 2018 No
IFRIC 22 Foreign Currency Transactions and Advance Consideration January 1, 2018 No
IFRS 16 Leases January 1, 2019 Yes
IFRIC 23 Uncertainty over Income Tax Treatments January 1, 2019 No
Amendments to IFRS 9 Prepayment Features with Negative Compensation January 1, 2019 No
Amendments to IAS 28 Long-term Interests in Associates and Joint Ventures January 1, 2019 No
Amendments to IFRS 3, IFRS 11, IAS 12 and IAS 23 Annual Improvements to IFRSs 2015 - 2017 Cycle (issued in Dec. 2017) January 1, 2019 No
IFRS 17 Insurance Contracts January 1, 2021 No
Amendments to IFRS 10 and IAS 28 Sale or Contribution of Assets between an Investor and its Associate or Joint Venture n/a No
1) Application mandatory as adopted by the EU Commission. The standards themselves require earlier compulsory application.
3. Significant Accounting Policies
Basis of Preparation
The consolidated financial statements of the Group are based on the principle of the historical cost of acquisi-tion, construction or production, with the exception of the items disclosed at fair value, such as financial assets held for trading or available for sale, and derivatives.
Scope of Consolidated Financial Statements
The consolidated financial statements of Sartorius AG include the annual financial statements of all major companies, which are controlled directly or indirectly by Sartorius AG. In terms of IFRS 10, Consolidated Financial Statements, a controlling interest exists if the following criteria are met:
– Power, i.e., an investor must have existing rights that give it the current ability to direct the relevant activities of an investee with respect to the latter's returns
– Exposure, or rights, to variable returns from an investee
– Ability to use power in such a way that significantly affects the investee's returns
Such investees are included in the consolidated finan-cial statements from the time when Sartorius AG or its subsidiaries acquire such control. They are no longer included as of the time control is transferred to an entity outside the Group.
132 Consolidated Financial Statements and Notes Notes to the Financial Statements
Subsidiaries are included on the basis of their annual financial statements for the same reporting period as the parent company, using uniform Group recognition and measurement methods.
All intragroup assets and liabilities, equity, income, expenses and cash flows relating to transactions be-tween members of the Group are eliminated in full on consolidation.
Business Combinations
Business combinations are measured according to the acquisition method. The identifiable assets acquired by the Group as well as liabilities and contingent liabili-ties assumed are recorded at fair value on the date of combination.
For significant acquisitions, the purchase price alloca-tion is generally carried out with the assistance of independent third-party valuation specialists. The valuations are based on the information available at the acquisition date.
Expenses directly related to business combinations are reported in the profit for the period.
Foreign Currency Translation
Subsidiaries’ annual financial statements prepared in foreign currencies have been translated pursuant to IAS 21, The Effects of Changes in Foreign Exchange Rates, in accordance with the concept of a functional currency. Foreign subsidiaries are regarded as inde-pendent subdivisions of the Sartorius Group. Items on the statement of financial position are translated at the exchange rates on the reporting date. An excep-tion to this is equity of consolidated subsidiaries, which is translated at historical cost. Income and ex-pense items are converted at the average rates. Any translation differences resulting from the use of dif-ferent exchange rates for items on the statement of financial position and the statement of profit or loss are recognized in the other comprehensive income in shareholders’ equity. By contrast, currency gains and losses in connection with financing activities, for ex-ample, from loans in foreign currencies, are recognized in the financial result.
In the individual financial statements of the consoli-dated companies, transactions in foreign currencies are translated to the functional currency of the com-pany at the exchange rate on the date of the transac-tion. Monetary assets and liabilities denominated in a foreign currency are translated at the closing rate on
the reporting date. Gains and losses on foreign currency transactions are recognized in other operating income or expenses. By contrast, currency gains and losses in connection with financing activities, such as loans in a foreign currency, are recognized in the financial result.
For certain defined loans granted on a long-term basis and for which repayment is neither planned nor prob-able, the Group applies the principle of "net invest-ments in a foreign operation." The foreign currency translation differences resulting from these loans are recognized in other comprehensive income according to IAS 21.32. In the case of net investment repayments, the currency translation differences recorded up to such repayment are not reclassified to profit or loss as there has been no disposal of a foreign operation.
The exchange rates for major currencies against the euro were considered as follows:
Year-end exchange ratesAverage annual exchange rates
2017 2016 2017 2016
USD 1.19930 1.05410 1.12955 1.10659
GBP 0.88723 0.85618 0.87670 0.81952
CHF 1.17020 1.07390 1.11173 1.09004
JPY 135.01000 123.40000 126.70218 120.20024
INR 76.60550 71.59350 73.52751 74.35823
KRW 1279.6100 1269.3600 1276.62397 1283.96650
CNY 7.80440 7.32020 7.62790 7.35117
Sales Revenue
All revenues derived from the selling of products and rendering of services are recognized as sales. Other operational revenues are recognized as other operat-ing income. Revenue from the sale of goods is recog-nized in the statement of profit or loss when the significant risks and rewards of ownership of the goods have been transferred to the customer, the company retains neither continuing managerial nor effective control over the goods sold, the amount of revenue and costs incurred or to be incurred can be measured reliably, and it is sufficiently probable that the economic benefits associated with the transaction will flow to the company.
Revenues derived from the rendering of services are recognized according to the stage of completion of the transaction as of the reporting date.
Consolidated Financial Statements and Notes Notes to the Financial Statements 133
Construction Contracts
A construction contract is a contract specifically nego-tiated for the construction of an asset or a combina-tion of assets that are closely interrelated or interdependent in terms of their design, technology and function or their ultimate purpose or use. If the outcome of a construction contract can be estimated reliably, revenues from construction-type projects are generally recognized under the percentage-of-completion method, based on the percentage of costs to date compared to the total estimated contract costs. An expected loss on the construction contract is im-mediately recognized as an expense.
If cumulative work (contract costs and contract result) exceeds the advance payments received in individual cases, the construction contracts are recognized under receivables as amounts due from customers for such contracts. If the balance after deduction of advance payments received is negative, this obligation from construction contracts is recognized as a liability under amounts due from customers.
Functional Costs
In general, operating expenses are assigned to the individual functions according to the functional area of the corresponding profit and cost centers. Expenses relating to cross-functional initiatives or projects are assigned to the respective functional costs based on an appropriate allocation principle.
The item “Cost of sales” reports the costs of products sold and the acquisition costs of merchandise sold. Besides the directly imputable expenses, such as raw materials and supplies, employee benefits expense and energy expenses, the cost of sales also includes overhead, which can be allocated to the manufac-turing area, and the corresponding depreciation and amortization.
The selling and distribution expenses pertain, in par-ticular, to the costs of the sales organization, distribu-tion, advertising and marketing.
Research and development expenses comprise the costs for research and product and process develop-ment, insofar as these are not capitalized. Amortiza-tion on capitalized development costs is also indicated in this item.
The item “General administrative expenses” primarily comprises employee benefits expense and the cost of materials of the general administrative area.
All profit and loss items that cannot be allocated to one of the functional areas mentioned are recognized as other operating income and expenses. These essen-tially include effects from currency translation, dis-posal of fixed assets, allowances on trade receivables, and extraordinary expenses. Income from grants relat-ed to expenses are recognized as other income, when there is reasonable assurance that the conditions at-tached to the grants will be complied with and the grants will be received.
Borrowing Costs
Borrowing costs are expensed as incurred unless they are directly attributable to the acquisition, construc-tion or production of a qualifying asset and are there-fore part of the cost of that asset. An asset is deemed to be a qualified asset if a substantial period of time (6 or 12 months) is required to ensure that it will be in the intended state ready for use or sale.
Income Taxes
Current income taxes are determined based on the respective local taxable income of the period and local tax rules. In addition, current income taxes may in-clude adjustments for uncertain tax payments or tax refunds for periods not yet assessed.
Deferred tax assets and liabilities are determined based on temporary differences between the carrying amounts and the tax bases of assets and liabilities, including differences from consolidation. In addition, loss carry-forwards and tax credits are considered. Measurement is based on the tax rates expected to be effective in the period in which an asset is realized or a liability is settled. Changes in deferred tax assets and liabilities are reflected in income taxes in the state-ment of profit or loss. Exceptions to this are changes that must be recognized in other comprehensive in-come directly in equity, as well as effects from acqui-sitions and currency effects.
134 Consolidated Financial Statements and Notes Notes to the Financial Statements
On principle, the tax rates and tax rules are used which have been enacted or substantively enacted at the reporting date. Deferred tax assets are recognized to the extent that it is probable that taxable profit at the level of the relevant tax authority will be available for the utilization of the deductible temporary differ-ences or losses carried forward.
Goodwill
Goodwill represents the future economic benefits arising from assets acquired in a business combination that are not individually identified and separately recognized.
According to IAS 36, goodwill acquired in a business combination may not be amortized, but rather must be tested annually for impairment and as soon as there is any indication of asset impairment.
For the purpose of impairment testing, goodwill must be allocated to each of the acquirer’s cash-generating units (CGUs). A CGU represents the lowest level within the entity at which goodwill is monitored for internal management purposes and may not be larger than a segment.
Other Intangible Assets
Intangible assets acquired are stated at cost less the accumulated, regular amortization that is calculated according to the straight-line method. The useful life of an intangible asset is the period over which this asset is expected to contribute directly or indirectly to the cash flows of that entity.
Costs incurred within the scope of the development of new products and methods are capitalized as internally generated intangible assets if the following criteria are met:
– The technical feasibility of completing the intangible assets so that it will be available for use or sale;
– The intention to complete the intangible asset and use or sell it;
– The ability to use or sell the intangible asset;
– The demonstration of how the intangible asset will generate probable future economic benefits;.
– The availability of adequate technical, financial and other resources to complete the development and to use or sell the intangible asset;
– The ability to measure reliably the expenditure at-tributable to the intangible asset during its devel-opment.
The capitalized development costs essentially cover the costs that were allocated to the staff involved in R&D, to raw materials and supplies, outside services and to directly attributable overhead.
If an internally generated intangible asset may not be capitalized, the development costs are recognized as expenses in the period in which they are incurred. Costs for research activities are reported as expenses in the period in which they are incurred.
Amortization of intangible assets is based on the fol-lowing periods of useful life:
Software 2 to 10 years
Customer relationships and technologies 5 to 15 years
Capitalized development expenses 4 to 6 years
Brand name 10 years to an
indefinite period
Property, Plant and Equipment
The item “Property, plant and equipment” is reported at cost, and if subject to depreciation, is depreciated as scheduled. The straight-line method is applied to depreciation reported in the consolidated financial statements.
Grants related to assets are generally deducted from the cost of assets.
Depreciation of fixed assets is based on the following periods of useful life:
Buildings 15 to 50 years
Machinery 5 to 15 years
Factory and office equipment 3 to 13 years
Consolidated Financial Statements and Notes Notes to the Financial Statements 135
Impairment of Intangible and Tangible Assets
The book values (carrying amounts) of property, plant and equipment and intangible assets are examined on whether there is any indication that an asset might be impaired, pursuant to IAS 36, Impairment of Assets. If there is any indication that an asset is impaired, the recoverable amount of the asset is estimated. The recoverable amount of an asset or a cash-generating unit is the higher of its fair value – less costs to sell the asset or its CGU – and its value in use. In the event
the individual asset’s recoverable amount cannot be estimated, the recoverable amount of the asset’s cash-generating unit (CGU) is estimated.
If the estimated recoverable amount of an asset (or a CGU) goes below its book value (carrying amount), this carrying amount must be reduced to the recoverable amount.
If the causes of the asset impairment are removed, the book value of the asset (or the CGU) is credited to the newly estimated recoverable amount (except for good-will). However, the book value increase is limited to the value that the asset (or CGU) would have had if no asset impairment loss would have been assessed in previous financial years.
Leases
A lease is considered an agreement whereby the lessor conveys to the lessee in return for a payment or series of payments the right to use an asset for an agreed period of time. According to IAS 17, a lease is classi-fied as either an operating lease or a finance lease. A finance lease is a lease that transfers substantially all the risks and rewards incidental to ownership of an asset. All other leases are designated as operating leases.
If the Group is a lessee in a finance lease, the amount equal to the fair value of the leased asset, or if lower, the present value of the minimum lease payments is recognized as an asset on the statement of financial position and simultaneously recognized as a financial liability, each at the inception of the lease. The mini-mum lease payments essentially consist of the finance charge and the reduction of the outstanding liability. A leased asset is depreciated on a straight-line basis over the period of its expected useful life or over the shorter lease term.
For an operating lease, the lease rates to be paid by the lessee are recognized as expenses and the lease rates received by the lessor are recognized as income, respectively. The leased asset continues to be recog-nized on the lessor's statement of financial position as fixed assets.
Inventories
Raw materials and supplies, including merchandise, are reported under “Inventories” at average cost. On prin-ciple, finished goods and work in progress are reported at cost of conversion. This cost includes direct costs, which can be allocated to these materials, and the appropriate portion of production and materials han-dling overhead, general administrative expenses and fixed assets at normal depreciation and | or amortiza-tion rates, provided that these expenses are caused by production.
Inventories must be evaluated at the lower amount of cost and the net realizable value. The net realizable value represents the estimated selling price in the ordinary course of business less the estimated costs of completion and the estimated costs necessary for marketing, sales and distribution. Where inventory risks exist, such as the risk of reduced shelf life as a result of storage periods or limited usability, invento-ries are marked down accordingly.
Provisions for Pensions and Similar Obligations
Pension provisions and similar obligations are recog-nized in the consolidated financial statements of the Sartorius Group in accordance with actuarial principles. IAS 19, Employee Benefits, stipulates the Projected Unit Credit Method as the method of measurement. In addition to known pensions and life expectancies, this expected cash value method takes into account future salary and pension increases.
All effects from remeasurement of the net defined benefit liability are recognized in other comprehensive income directly in equity (pension reserves) according to the IAS 19 Standard.
136 Consolidated Financial Statements and Notes Notes to the Financial Statements
Provisions
A provision is recognized when a liability to third parties has been incurred, an outflow of resources is probable and the amount of the obligation can be reasonably estimated. The amount recognized as a provision represents the best estimate of the obliga-tion at the end of the reporting period. Provisions with a term or maturity of more than one year are dis-counted to the present value of the expenditures ex-pected to settle the obligation at the end of the reporting period.
Provisions are regularly reviewed and adjusted as fur-ther information becomes available or circumstances change. The provision for warranty costs is based on expected values that reflect past experience.
Restructuring provisions are set up in connection with programs that materially change the scope of business performed by a segment or business unit or the man-ner in which business is conducted. In most cases, restructuring expenses include termination benefits due to the termination of employment and leases as well as and compensation payments due to agree-ments with suppliers and dealers. Restructuring provi-sions are recognized when the Group has a detailed formal plan that it has either commenced to imple-ment or announced.
Financial Instruments
A financial instrument is any contract that gives rise to a financial asset of one entity and a financial liability or equity instrument of another entity and is recognized on the trade date. Financial assets mainly include cash and cash equivalents, available-for-sale financial assets, trade and loan receivables and deriv-ative financial instruments with a positive fair value.
Financial liabilities of the Group mainly comprise loans from banks, trade payables, finance lease payables and derivative financial instruments with a negative fair value.
Financial instruments are initially recognized at their fair value. Transaction costs directly attributable to the acquisition or issue of financial instruments are only recognized in determining the carrying amount, if the financial instruments are not measured at fair value through profit or loss. Financial assets and liabil-ities are subsequently measured according to the cat-egory to which they are assigned: cash and cash
equivalents, available-for-sale financial assets, loans and receivables, financial liabilities measured at amor-tized cost or financial assets and liabilities classified as held for trading. The fair value option is not used.
Cash and Cash Equivalents
The Group considers all highly liquid investments with up to three months' maturity from the date of acquisi-tion to be cash or cash equivalents. These mainly com-prise checks, cash on hand and deposits in banks. Cash and cash equivalents are measured at cost.
Investments
Investments in non-consolidated subsidiaries, associ-ates and securities are measured at cost because no active market exists for these shares and securities and the fair values of these assets cannot be reliably measured.
Trade Receivables
Trade receivables and other assets are reported so that all discernible risks are covered. The book values of trade receivables and other receivables approximate their fair value considering the maturity date and the credit risks. In determining the recoverability of trade receivables, the Group considers any change in the credit quality from the date the credit was originally granted up to the reporting date.
Loans and Receivables
Financial assets classified as loans and receivables are measured at amortized cost, less any impairment losses, by application of the effective interest method. Im-pairment losses on trade and other receivables are recognized using separate allowance accounts.
Consolidated Financial Statements and Notes Notes to the Financial Statements 137
Financial Liabilities
Financial liabilities, except for derivative financial instruments, are measured at amortized cost using the effective interest method.
Derivative Financial Instruments
Derivative financial instruments, such as forward ex-change contracts and interest rate swap contracts, are measured at fair value. Instruments not classified as hedging instruments and for which hedge accounting is not applied, are classified by the company as held for trading. Changes in the fair value of derivative financial instruments are recognized either in profit or loss or, in the case of hedges, in other comprehensive income.
Cash Flow Hedges
The effective portion of changes in the fair value of derivative instruments designated as cash flow hedges is recognized in other comprehensive income. Any ineffective portion is recognized immediately in the profit for the period. Amounts accumulated in equity are reclassified into net income in the same periods in which the hedged item affects net income.
Statement of Cash Flows
In the statement of cash flows, cash flows are present-ed according to their allocation to operating activities, investing activities and financing activities.
In this instance, cash flows from operating activities are determined using the indirect method; i.e., expens-es without an effect on payments are added to profit before tax, while income without an effect on pay-ments is subtracted. The cash flows from financing activities are composed primarily of changes in equity and additions or repayments of loans.
Non-current Assets and Disposal Groups Held for Sale and Discontinued Operations
According to IFRS 5, a non-current asset (or a disposal group) must be classified as held for sale if its carrying amount will be recovered principally through a sale transaction rather than through continuing use. This is the case if the asset (or disposal group) is available for immediate sale in its present condition and its sale is highly probable. A sale is considered highly probable if the appropriate level of management has committed to a plan to sell the asset; an active program to locate a buyer and complete the plan has already been initi-ated; an offer to sell the asset or disposal group at a reasonable price has been made; the sale is expected to be recognized as completed within twelve months from the date of classification; and if it is unlikely that significant changes to the plan will be made or that the plan will be withdrawn.
Non-current assets (or disposal groups) classified as held for sale are to be measured at the lower of their carrying amount and fair value less costs to sell. These assets are then no longer depreciated or amortized.
A component of an entity is disclosed as a discontin-ued operation that either has been disposed of or is classified as held for sale and
– represents a separate major line of business or geographical area of operations, or
– is part of a single coordinated plan to dispose of a separate major line of business or geographical area of operations; or
– is a subsidiary acquired exclusively with a view to resale.
4. Critical Accounting Judgment and Key Sources of Estimation Uncertainty
During the preparation of consolidated financial statements, management uses estimates and assump-tions based on their best knowledge of the current and future situation of the period. However, actual results may differ from these estimates. These estimates and assumptions are therefore revised on a regular basis, and the impact of all changes is immediately recog-nized in the statement of profit or loss for the period.
138 Consolidated Financial Statements and Notes Notes to the Financial Statements
In addition, Group management exercises its judgment in defining the accounting treatment of specific transac-tions when the existing standards and interpretations do not explicitly treat the accounting problems concerned.
Assumptions and estimates primarily concern the fol-lowing facts:
Business Combinations
Accounting for acquisitions requires certain estimates and assumptions to be made, especially concerning the fair value of the intangible assets and the property, plant and equipment acquired, the liabilities assumed on the acquisition date, as well as the useful lives of the intangible assets and of the property, plant and equipment acquired.
Their measurement is largely based on projected cash flows. Differences between the expected and actual cash flows may have a material impact on future Group results.
Impairment of Assets
An impairment test is conducted, if certain events lead to the assumption that an asset might be impaired. In this case, the carrying amount of the asset is com-pared to its recoverable amount, which is the higher of the net realizable value and the value in use. The cal-culation of the value in use is generally based on dis-counted cash flow methods that use cash flow projections of up to five years. These projections take into account past experiences and represent manage-ment's best estimates about future sales revenue and cost developments. Cash flows after the planning period are extrapolated using individual growth rates. Key assumptions on which management has based its determination of the value in use include estimated growth rates, weighted average cost of capital and tax rates. These estimates can have a material impact on the respective values and ultimately on the amount of any impairment. If the carrying amount exceeds the recoverable amount, an impairment loss is recognized.
Intangible Assets
The capitalization of self-constructed intangible assets includes a certain level of estimates and assumptions, e.g., the evaluation of the technical feasibility of a development project, its expected market prospects and determination of its useful live.
Trade and Other Receivables
The allowance for doubtful accounts involves signifi-cant management judgment and review of individual receivables based on individual customer creditworthi-ness and current economic developments, as well as an analysis of historical bad debts on a portfolio basis.
Employee Benefits – Provisions for Pension Obligations
Obligations for pensions and other post-employment benefits are determined in accordance with actuarial valuations. These valuations rely on key assumptions including discount rates, expected salary increases and mortality rates. The discount rate assumptions are determined by reference to market yields on high-quality, fixed-interest corporate bonds of appropriate duration and currency at the end of the reporting period.
Due to changing market and economic conditions, the underlying key assumptions may differ from actual developments and may lead to significant changes in pension obligations and other post-employment benefit obligations.
Such differences are recognized in full directly in equity in the period in which they occur without af-fecting profit or loss. For a sensitivity analysis, see Section 24 "Pension and Employee Benefits Provisions."
Consolidated Financial Statements and Notes Notes to the Financial Statements 139
Provisions, Contingent Liabilities and Contingent Assets
Provisions are recognized for legal or constructive obligations that exist with respect to third parties at the end of the reporting date. To determine the amount of the obligations, certain estimates and as-sumptions have to be applied, including the evaluation of the probability that this obligation will occur and the amount of costs incurred. Typically, significant uncertainties are involved in the determination of provisions related to onerous contracts, warranty costs, closure of business locations, asset retirement obliga-tions and legal proceedings.
Income Taxes
The Group operates in various tax jurisdictions and therefore must determine tax positions under respec-tive local tax laws and tax authorities’ views, which can be complex and subject to different interpreta-tions of taxpayers and local tax authorities.
Deferred tax assets have to be recognized for all de-ductible temporary differences and unused tax losses to the extent that it is probable that future taxable profit will be available against which the deductible temporary differences and unused tax losses can be utilized. As future developments are uncertain and partly beyond management’s control, assumptions are necessary to estimate future taxable profits as well as the period in which deferred tax assets will be recovered.
Estimates are revised in the period in which there is sufficient evidence to revise the assumption. If man-agement considers it probable that all or a portion of a deferred tax asset cannot be realized, a correspond-ing valuation allowance is taken into account.
Fair Value Measurement
A number of the Group’s accounting policies and dis-closures require the measurement of fair values, for both financial and non-financial assets and liabilities, including Level 3 fair values (unobservable inputs).
If third party information, such as broker quotes or pricing services, is used to measure fair values, then management assesses the evidence obtained from the third parties to support the conclusion that these valuations meet the requirements of IFRS, including the level in the fair value hierarchy in which the valu-ations should be classified.
When measuring the fair value of an asset or a liability, the Group uses observable market data as far as possible.
If the inputs used to measure the fair value of an asset or a liability fall into different levels of the fair value hierarchy, then the fair value measurement is catego-rized in its entirety in the same level of the fair value hierarchy as the lowest level input that is significant to the entire measurement.
5. Operating Segments
According to IFRS 8, Operating Segments, the identifi-cation of reportable operating segments is based on the "management approach"; i.e., the segments are defined analogously to the internal control and re-porting structure of an entity. Therefore, an area of activity is to be considered an operating segment if its business activities may result in revenues and expenses, its operating results are regularly reviewed by the entity's chief operating decision maker (= the Execu-tive Board of Sartorius AG) and discrete financial in-formation is available in its internal reporting. Consequently, the divisions called Bioprocess Solutions and Lab Products & Services are to be considered op-erating segments. Essential criteria for their definition are the products sold in the divisions and their par-ticular customer groups.
“Underlying EBITDA" is the key performance indicator of the operating segments of the Group, as manage-ment uses this performance measure to control the Group and segments. EBITDA corresponds to earnings before interest (financial result), taxes, depreciation and amortization. “Underlying EBITDA” means EBITDA adjusted for extraordinary items. In this connection, extraordinary items are expenses and income that are of an exceptional or a one-time nature and according-ly distort the sustainable profitability of a segment and have a material impact on the net worth, financial position and earnings of the Group. Examples of such items are restructuring expenses, large Group projects and proceeds or losses from the disposal, sale or other transfer of financial assets or of property, plant and equipment, provided that these are not of a recurrent nature.
140 Consolidated Financial Statements and Notes Notes to the Financial Statements
"Underlying EBITDA" is not a defined performance measure in IFRS. The Group’s definition of underlying EBITDA might not be comparable with similarly titled performance measures and disclosures by other entities.
Apart from that, the recognition and measurement methods for the reportable segments conform to the general Group accounting principles.
For intersegment receivables and payables, internal transfer prices are set at prices corresponding to those that would have been agreed upon with external third parties in the particular situation and under the given framework conditions. Essentially, these prices are calculated by applying the cost-plus-margin method and the resale price method or a combination of the two methods. The methods for determining the internal transfer prices are documented promptly and continuously maintained. The volume of such inter-segment receivables and payables is immaterial.
Segment assets and segment liabilities are not report-ed on a regular basis to the chief operating decision maker and are therefore not part of the segment report.
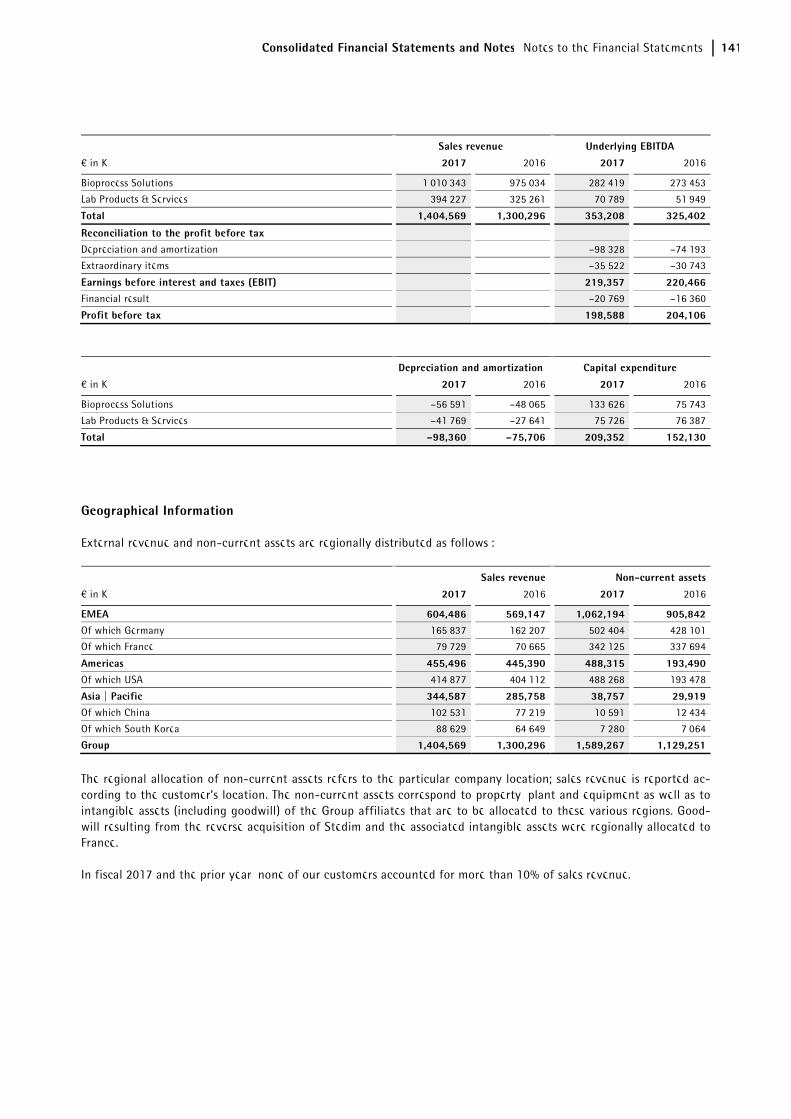
Consolidated Financial Statements and Notes Notes to the Financial Statements 141
Sales revenue Underlying EBITDA
€ in K 2017 2016 2017 2016
Bioprocess Solutions 1,010,343 975,034 282,419 273,453
Lab Products & Services 394,227 325,261 70,789 51,949
Total 1,404,569 1,300,296 353,208 325,402
Reconciliation to the profit before tax Depreciation and amortization –98,328 –74,193
Extraordinary items –35,522 –30,743
Earnings before interest and taxes (EBIT) 219,357 220,466Financial result –20,769 –16,360
Profit before tax 198,588 204,106
Depreciation and amortization Capital expenditure
€ in K 2017 2016 2017 2016
Bioprocess Solutions –56,591 –48,065 133,626 75,743
Lab Products & Services –41,769 –27,641 75,726 76,387
Total –98,360 –75,706 209,352 152,130
Geographical Information
External revenue and non-current assets are regionally distributed as follows :
Sales revenue Non-current assets
€ in K 2017 2016 2017 2016
EMEA 604,486 569,147 1,062,194 905,842Of which Germany 165,837 162,207 502,404 428,101
Of which France 79,729 70,665 342,125 337,694
Americas 455,496 445,390 488,315 193,490Of which USA 414,877 404,112 488,268 193,478
Asia | Pacific 344,587 285,758 38,757 29,919Of which China 102,531 77,219 10,591 12,434
Of which South Korea 88,629 64,649 7,280 7,064
Group 1,404,569 1,300,296 1,589,267 1,129,251
The regional allocation of non-current assets refers to the particular company location; sales revenue is reported ac-cording to the customer’s location. The non-current assets correspond to property, plant and equipment as well as to intangible assets (including goodwill) of the Group affiliates that are to be allocated to these various regions. Good-will resulting from the reverse acquisition of Stedim and the associated intangible assets were regionally allocated to France.
In fiscal 2017 and the prior year, none of our customers accounted for more than 10% of sales revenue.
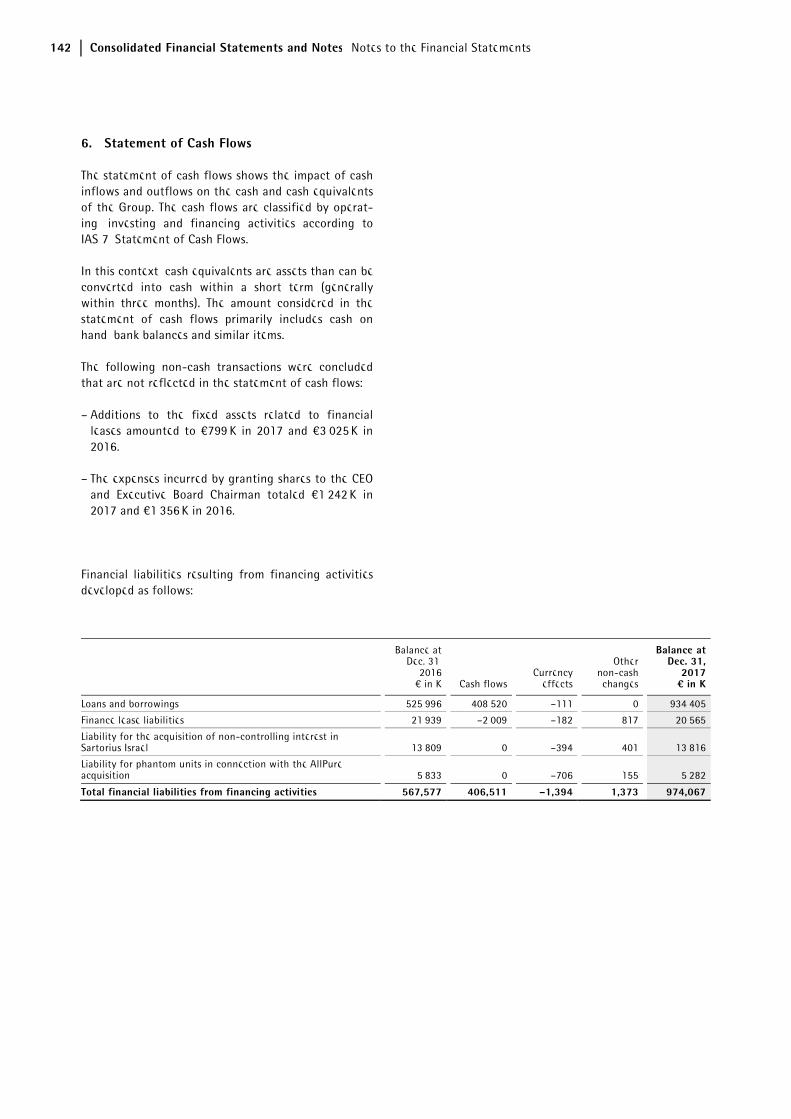
142 Consolidated Financial Statements and Notes Notes to the Financial Statements
6. Statement of Cash Flows
The statement of cash flows shows the impact of cash inflows and outflows on the cash and cash equivalents of the Group. The cash flows are classified by operat-ing, investing and financing activities according to IAS 7, Statement of Cash Flows.
In this context, cash equivalents are assets than can be converted into cash within a short term (generally within three months). The amount considered in the statement of cash flows primarily includes cash on hand, bank balances and similar items.
The following non-cash transactions were concluded that are not reflected in the statement of cash flows:
– Additions to the fixed assets related to financial leases amounted to €799 K in 2017 and €3,025 K in 2016.
– The expenses incurred by granting shares to the CEO and Executive Board Chairman totaled €1,242 K in 2017 and €1,356 K in 2016.
Financial liabilities resulting from financing activities developed as follows:
Balance atDec. 31,
2016€ in K Cash flows
Currency effects
Other non-cash changes
Balance atDec. 31,
2017¤ in K
Loans and borrowings 525,996 408,520 –111 0 934,405
Finance lease liabilities 21,939 –2,009 –182 817 20,565
Liability for the acquisition of non-controlling interest in Sartorius Israel 13,809 0 –394 401 13,816
Liability for phantom units in connection with the AllPure acquisition 5,833 0 –706 155 5,282
Total financial liabilities from financing activities 567,577 406,511 –1,394 1,373 974,067
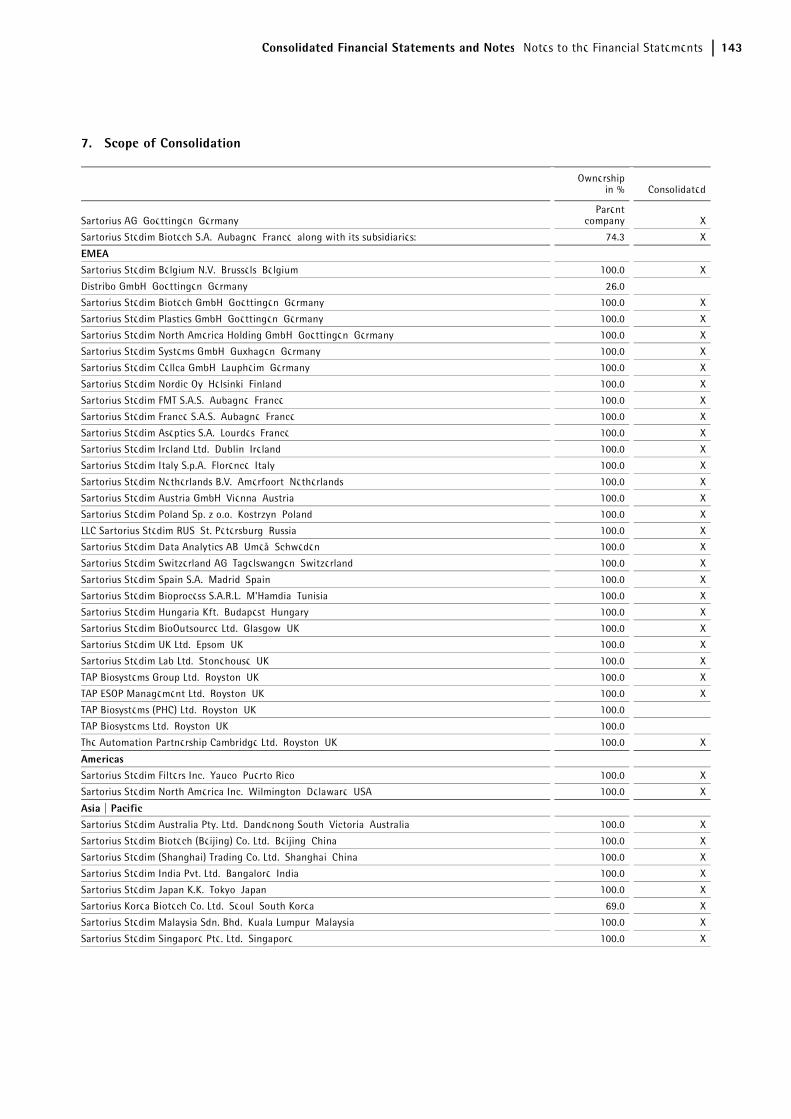
Consolidated Financial Statements and Notes Notes to the Financial Statements 143
7. Scope of Consolidation
Ownershipin % Consolidated
Sartorius AG, Goettingen, Germany Parent
company X
Sartorius Stedim Biotech S.A., Aubagne, France, along with its subsidiaries: 74.3 X
EMEA Sartorius Stedim Belgium N.V., Brussels, Belgium 100.0 X
Distribo GmbH, Goettingen, Germany 26.0
Sartorius Stedim Biotech GmbH, Goettingen, Germany 100.0 X
Sartorius Stedim Plastics GmbH, Goettingen, Germany 100.0 X
Sartorius Stedim North America Holding GmbH, Goettingen, Germany 100.0 X
Sartorius Stedim Systems GmbH, Guxhagen, Germany 100.0 X
Sartorius Stedim Cellca GmbH, Laupheim, Germany 100.0 X
Sartorius Stedim Nordic Oy, Helsinki, Finland 100.0 X
Sartorius Stedim FMT S.A.S., Aubagne, France 100.0 X
Sartorius Stedim France S.A.S., Aubagne, France 100.0 X
Sartorius Stedim Aseptics S.A., Lourdes, France 100.0 X
Sartorius Stedim Ireland Ltd., Dublin, Ireland 100.0 X
Sartorius Stedim Italy S.p.A., Florence, Italy 100.0 X
Sartorius Stedim Netherlands B.V., Amerfoort, Netherlands 100.0 X
Sartorius Stedim Austria GmbH, Vienna, Austria 100.0 X
Sartorius Stedim Poland Sp. z o.o., Kostrzyn, Poland 100.0 X
LLC Sartorius Stedim RUS, St. Petersburg, Russia 100.0 X
Sartorius Stedim Data Analytics AB, Umeå, Schweden 100.0 X
Sartorius Stedim Switzerland AG, Tagelswangen, Switzerland 100.0 X
Sartorius Stedim Spain S.A., Madrid, Spain 100.0 X
Sartorius Stedim Bioprocess S.A.R.L., M'Hamdia, Tunisia 100.0 X
Sartorius Stedim Hungaria Kft., Budapest, Hungary 100.0 X
Sartorius Stedim BioOutsource Ltd., Glasgow, UK 100.0 X
Sartorius Stedim UK Ltd., Epsom, UK 100.0 X
Sartorius Stedim Lab Ltd., Stonehouse, UK 100.0 X
TAP Biosystems Group Ltd., Royston, UK 100.0 X
TAP ESOP Management Ltd., Royston, UK 100.0 X
TAP Biosystems (PHC) Ltd., Royston, UK 100.0
TAP Biosystems Ltd., Royston, UK 100.0
The Automation Partnership Cambridge Ltd., Royston, UK 100.0 X
Americas Sartorius Stedim Filters Inc., Yauco, Puerto Rico 100.0 X
Sartorius Stedim North America Inc., Wilmington, Delaware, USA 100.0 X
Asia | Pacific Sartorius Stedim Australia Pty. Ltd., Dandenong South, Victoria, Australia 100.0 X
Sartorius Stedim Biotech (Beijing) Co. Ltd., Beijing, China 100.0 X
Sartorius Stedim (Shanghai) Trading Co. Ltd., Shanghai, China 100.0 X
Sartorius Stedim India Pvt. Ltd., Bangalore, India 100.0 X
Sartorius Stedim Japan K.K., Tokyo, Japan 100.0 X
Sartorius Korea Biotech Co. Ltd., Seoul, South Korea 69.0 X
Sartorius Stedim Malaysia Sdn. Bhd., Kuala Lumpur, Malaysia 100.0 X
Sartorius Stedim Singapore Pte. Ltd., Singapore 100.0 X
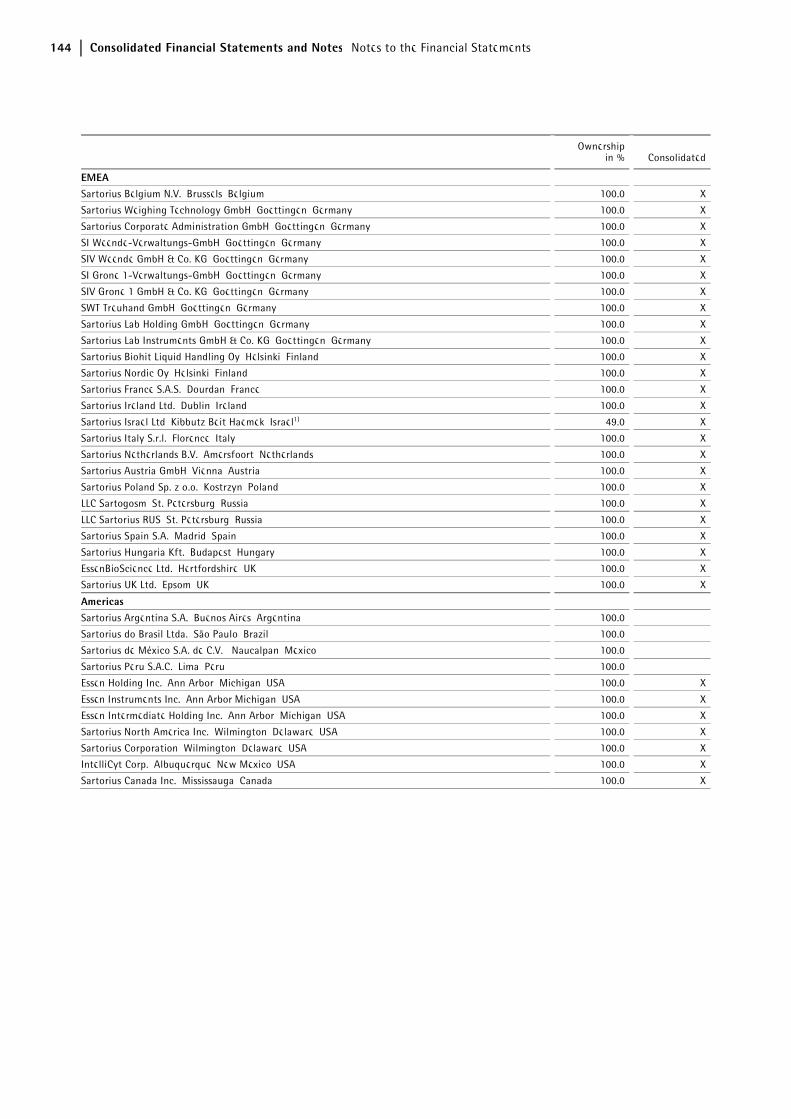
144 Consolidated Financial Statements and Notes Notes to the Financial Statements
Ownershipin % Consolidated
EMEA Sartorius Belgium N.V., Brussels, Belgium 100.0 X
Sartorius Weighing Technology GmbH, Goettingen, Germany 100.0 X
Sartorius Corporate Administration GmbH, Goettingen, Germany 100.0 X
SI Weende-Verwaltungs-GmbH, Goettingen, Germany 100.0 X
SIV Weende GmbH & Co. KG, Goettingen, Germany 100.0 X
SI Grone 1-Verwaltungs-GmbH, Goettingen, Germany 100.0 X
SIV Grone 1 GmbH & Co. KG, Goettingen, Germany 100.0 X
SWT Treuhand GmbH, Goettingen, Germany 100.0 X
Sartorius Lab Holding GmbH, Goettingen, Germany 100.0 X
Sartorius Lab Instruments GmbH & Co. KG, Goettingen, Germany 100.0 X
Sartorius Biohit Liquid Handling Oy, Helsinki, Finland 100.0 X
Sartorius Nordic Oy, Helsinki, Finland 100.0 X
Sartorius France S.A.S., Dourdan, France 100.0 X
Sartorius Ireland Ltd., Dublin, Ireland 100.0 X
Sartorius Israel Ltd, Kibbutz Beit Haemek, Israel1) 49.0 X
Sartorius Italy S.r.l., Florence, Italy 100.0 X
Sartorius Netherlands B.V., Amersfoort, Netherlands 100.0 X
Sartorius Austria GmbH, Vienna, Austria 100.0 X
Sartorius Poland Sp. z o.o., Kostrzyn, Poland 100.0 X
LLC Sartogosm, St. Petersburg, Russia 100.0 X
LLC Sartorius RUS, St. Petersburg, Russia 100.0 X
Sartorius Spain S.A., Madrid, Spain 100.0 X
Sartorius Hungaria Kft., Budapest, Hungary 100.0 X
EssenBioScience Ltd., Hertfordshire, UK 100.0 X
Sartorius UK Ltd., Epsom, UK 100.0 X
Americas Sartorius Argentina S.A., Buenos Aires, Argentina 100.0
Sartorius do Brasil Ltda., São Paulo, Brazil 100.0
Sartorius de México S.A. de C.V., Naucalpan, Mexico 100.0
Sartorius Peru S.A.C., Lima, Peru 100.0
Essen Holding Inc., Ann Arbor, Michigan, USA 100.0 X
Essen Instruments Inc., Ann Arbor,Michigan, USA 100.0 X
Essen Intermediate Holding Inc., Ann Arbor, Michigan, USA 100.0 X
Sartorius North America Inc., Wilmington, Delaware, USA 100.0 X
Sartorius Corporation, Wilmington, Delaware, USA 100.0 X
IntelliCyt Corp., Albuquerque, New Mexico, USA 100.0 X
Sartorius Canada Inc., Mississauga, Canada 100.0 X
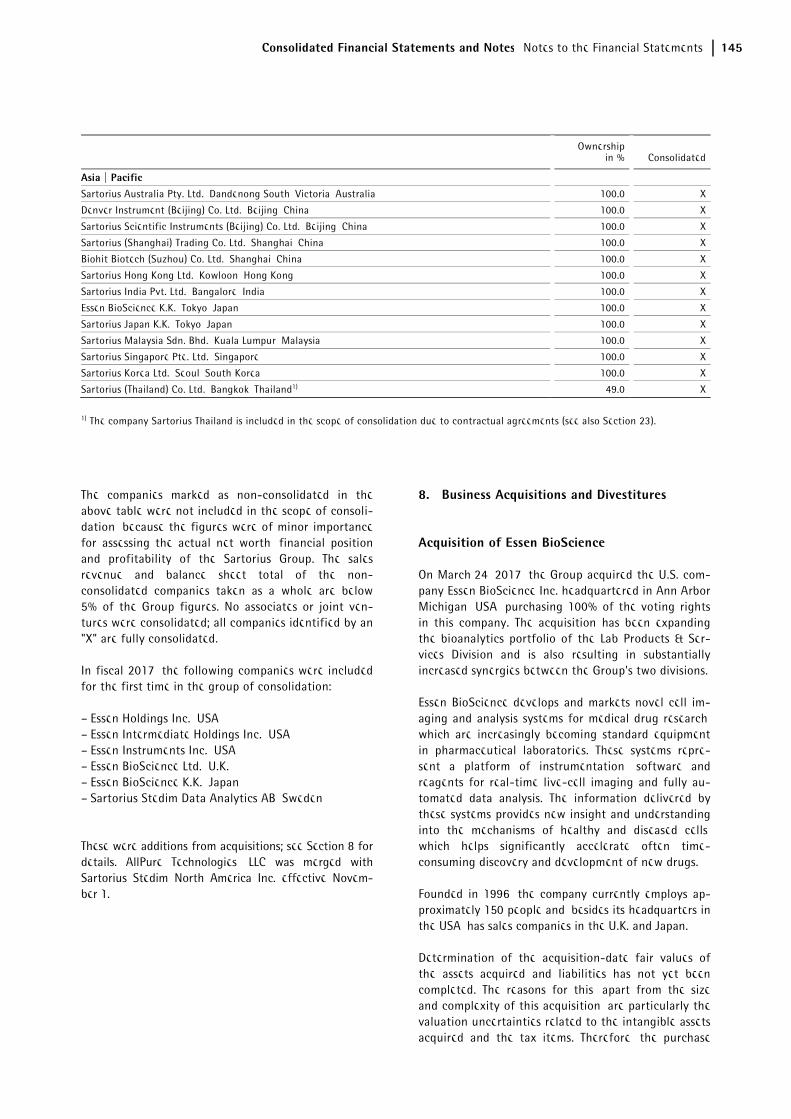
Consolidated Financial Statements and Notes Notes to the Financial Statements 145
Ownershipin % Consolidated
Asia | Pacific Sartorius Australia Pty. Ltd., Dandenong South, Victoria, Australia 100.0 X
Denver Instrument (Beijing) Co. Ltd., Beijing, China 100.0 X
Sartorius Scientific Instruments (Beijing) Co. Ltd., Beijing, China 100.0 X
Sartorius (Shanghai) Trading Co. Ltd., Shanghai, China 100.0 X
Biohit Biotech (Suzhou) Co. Ltd., Shanghai, China 100.0 X
Sartorius Hong Kong Ltd., Kowloon, Hong Kong 100.0 X
Sartorius India Pvt. Ltd., Bangalore, India 100.0 X
Essen BioScience K.K., Tokyo, Japan 100.0 X
Sartorius Japan K.K., Tokyo, Japan 100.0 X
Sartorius Malaysia Sdn. Bhd., Kuala Lumpur, Malaysia 100.0 X
Sartorius Singapore Pte. Ltd., Singapore 100.0 X
Sartorius Korea Ltd., Seoul, South Korea 100.0 X
Sartorius (Thailand) Co. Ltd., Bangkok, Thailand1) 49.0 X
1) The company Sartorius Thailand is included in the scope of consolidation due to contractual agreements (see also Section 23).
The companies marked as non-consolidated in the above table were not included in the scope of consoli-dation, because the figures were of minor importance for assessing the actual net worth, financial position and profitability of the Sartorius Group. The sales revenue and balance sheet total of the non-consolidated companies taken as a whole are below 5% of the Group figures. No associates or joint ven-tures were consolidated; all companies identified by an "X" are fully consolidated.
In fiscal 2017, the following companies were included for the first time in the group of consolidation:
– Essen Holdings Inc., USA – Essen Intermediate Holdings Inc., USA – Essen Instruments Inc., USA – Essen BioScience Ltd., U.K. – Essen BioScience K.K., Japan – Sartorius Stedim Data Analytics AB, Sweden
These were additions from acquisitions; see Section 8 for details. AllPure Technologies, LLC was merged with Sartorius Stedim North America Inc. effective Novem-ber 1.
8. Business Acquisitions and Divestitures
Acquisition of Essen BioScience
On March 24, 2017, the Group acquired the U.S. com-pany Essen BioScience Inc. headquartered in Ann Arbor, Michigan, USA, purchasing 100% of the voting rights in this company. The acquisition has been expanding the bioanalytics portfolio of the Lab Products & Ser-vices Division and is also resulting in substantially increased synergies between the Group's two divisions.
Essen BioScience develops and markets novel cell im-aging and analysis systems for medical drug research, which are increasingly becoming standard equipment in pharmaceutical laboratories. These systems repre-sent a platform of instrumentation, software and reagents for real-time live-cell imaging and fully au-tomated data analysis. The information delivered by these systems provides new insight and understanding into the mechanisms of healthy and diseased cells, which helps significantly accelerate often time-consuming discovery and development of new drugs.
Founded in 1996, the company currently employs ap-proximately 150 people and, besides its headquarters in the USA, has sales companies in the U.K. and Japan.
Determination of the acquisition-date fair values of the assets acquired and liabilities has not yet been completed. The reasons for this, apart from the size and complexity of this acquisition, are particularly the valuation uncertainties related to the intangible assets acquired and the tax items. Therefore, the purchase
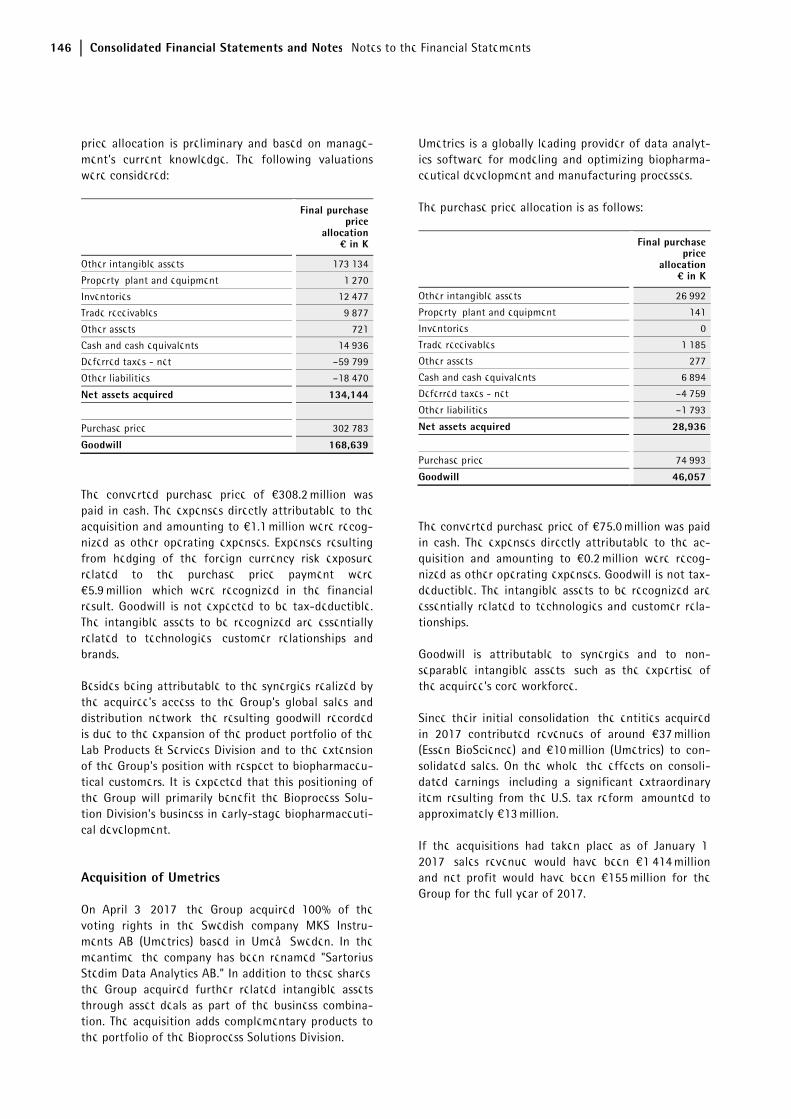
146 Consolidated Financial Statements and Notes Notes to the Financial Statements
price allocation is preliminary and based on manage-ment's current knowledge. The following valuations were considered:
Final purchase price
allocation¤ in K
Other intangible assets 173,134
Property, plant and equipment 1,270
Inventories 12,477
Trade receivables 9,877
Other assets 721
Cash and cash equivalents 14,936
Deferred taxes - net –59,799
Other liabilities –18,470
Net assets acquired 134,144
Purchase price 302,783
Goodwill 168,639
The converted purchase price of €308.2 million was paid in cash. The expenses directly attributable to the acquisition and amounting to €1.1 million were recog-nized as other operating expenses. Expenses resulting from hedging of the foreign currency risk exposure related to the purchase price payment were €5.9 million, which were recognized in the financial result. Goodwill is not expected to be tax-deductible. The intangible assets to be recognized are essentially related to technologies, customer relationships and brands.
Besides being attributable to the synergies realized by the acquiree's access to the Group's global sales and distribution network, the resulting goodwill recorded is due to the expansion of the product portfolio of the Lab Products & Services Division and to the extension of the Group's position with respect to biopharmaceu-tical customers. It is expected that this positioning of the Group will primarily benefit the Bioprocess Solu-tion Division's business in early-stage biopharmaceuti-cal development.
Acquisition of Umetrics
On April 3, 2017, the Group acquired 100% of the voting rights in the Swedish company MKS Instru-ments AB (Umetrics) based in Umeå, Sweden. In the meantime, the company has been renamed "Sartorius Stedim Data Analytics AB." In addition to these shares, the Group acquired further related intangible assets through asset deals as part of the business combina-tion. The acquisition adds complementary products to the portfolio of the Bioprocess Solutions Division.
Umetrics is a globally leading provider of data analyt-ics software for modeling and optimizing biopharma-ceutical development and manufacturing processes.
The purchase price allocation is as follows:
Final purchase price
allocation¤ in K
Other intangible assets 26,992
Property, plant and equipment 141
Inventories 0
Trade receivables 1,185
Other assets 277
Cash and cash equivalents 6,894
Deferred taxes - net –4,759
Other liabilities –1,793
Net assets acquired 28,936
Purchase price 74,993
Goodwill 46,057
The converted purchase price of €75.0 million was paid in cash. The expenses directly attributable to the ac-quisition and amounting to €0.2 million were recog-nized as other operating expenses. Goodwill is not tax-deductible. The intangible assets to be recognized are essentially related to technologies and customer rela-tionships.
Goodwill is attributable to synergies and to non-separable intangible assets, such as the expertise of the acquiree's core workforce.
Since their initial consolidation, the entities acquired in 2017 contributed revenues of around €37 million (Essen BioScience) and €10 million (Umetrics) to con-solidated sales. On the whole, the effects on consoli-dated earnings, including a significant extraordinary item resulting from the U.S. tax reform, amounted to approximately €13 million.
If the acquisitions had taken place as of January 1, 2017, sales revenue would have been €1,414 million and net profit would have been €155 million for the Group for the full year of 2017.
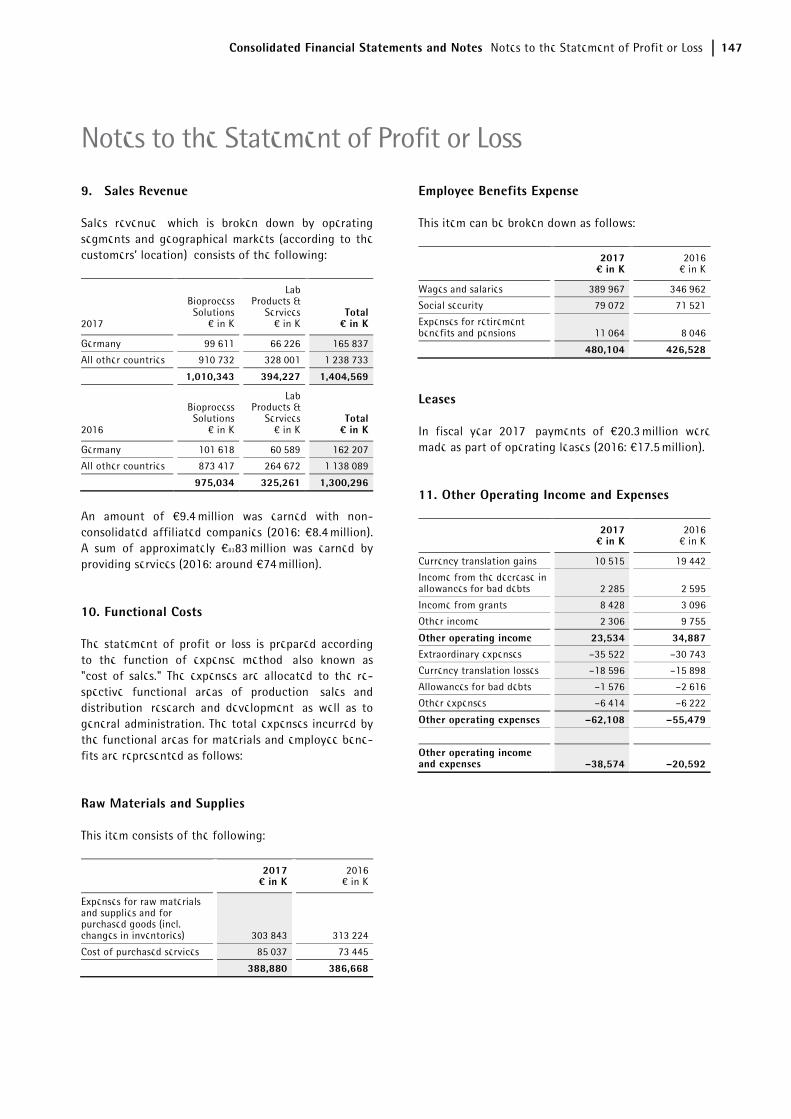
Consolidated Financial Statements and Notes Notes to the Statement of Profit or Loss 147
9. Sales Revenue
Sales revenue, which is broken down by operating segments and geographical markets (according to the customers’ location), consists of the following:
2017
Bioprocess Solutions
€ in K
Lab Products &
Services€ in K
Total¤ in K
Germany 99,611 66,226 165,837
All other countries 910,732 328,001 1,238,733
1,010,343 394,227 1,404,569
2016
Bioprocess Solutions
€ in K
Lab Products &
Services€ in K
Total¤ in K
Germany 101,618 60,589 162,207
All other countries 873,417 264,672 1,138,089
975,034 325,261 1,300,296
An amount of €9.4 million was earned with non-consolidated affiliated companies (2016: €8.4 million). A sum of approximately €8383 million was earned by providing services (2016: around €74 million).
10. Functional Costs
The statement of profit or loss is prepared according to the function of expense method, also known as "cost of sales." The expenses are allocated to the re-spective functional areas of production, sales and distribution, research and development, as well as to general administration. The total expenses incurred by the functional areas for materials and employee bene-fits are represented as follows:
Raw Materials and Supplies
This item consists of the following:
2017¤ in K
2016€ in K
Expenses for raw materials and supplies and for purchased goods (incl. changes in inventories) 303,843 313,224
Cost of purchased services 85,037 73,445
388,880 386,668
Employee Benefits Expense
This item can be broken down as follows:
2017¤ in K
2016€ in K
Wages and salaries 389,967 346,962
Social security 79,072 71,521
Expenses for retirement benefits and pensions 11,064 8,046
480,104 426,528
Leases
In fiscal year 2017, payments of €20.3 million were made as part of operating leases (2016: €17.5 million).
11. Other Operating Income and Expenses
2017¤ in K
2016€ in K
Currency translation gains 10,515 19,442
Income from the decrease in allowances for bad debts 2,285 2,595
Income from grants 8,428 3,096
Other income 2,306 9,755
Other operating income 23,534 34,887Extraordinary expenses –35,522 –30,743
Currency translation losses –18,596 –15,898
Allowances for bad debts –1,576 –2,616
Other expenses –6,414 –6,222
Other operating expenses –62,108 –55,479
Other operating income and expenses –38,574 –20,592
Notes to the Statement of Profit or Loss
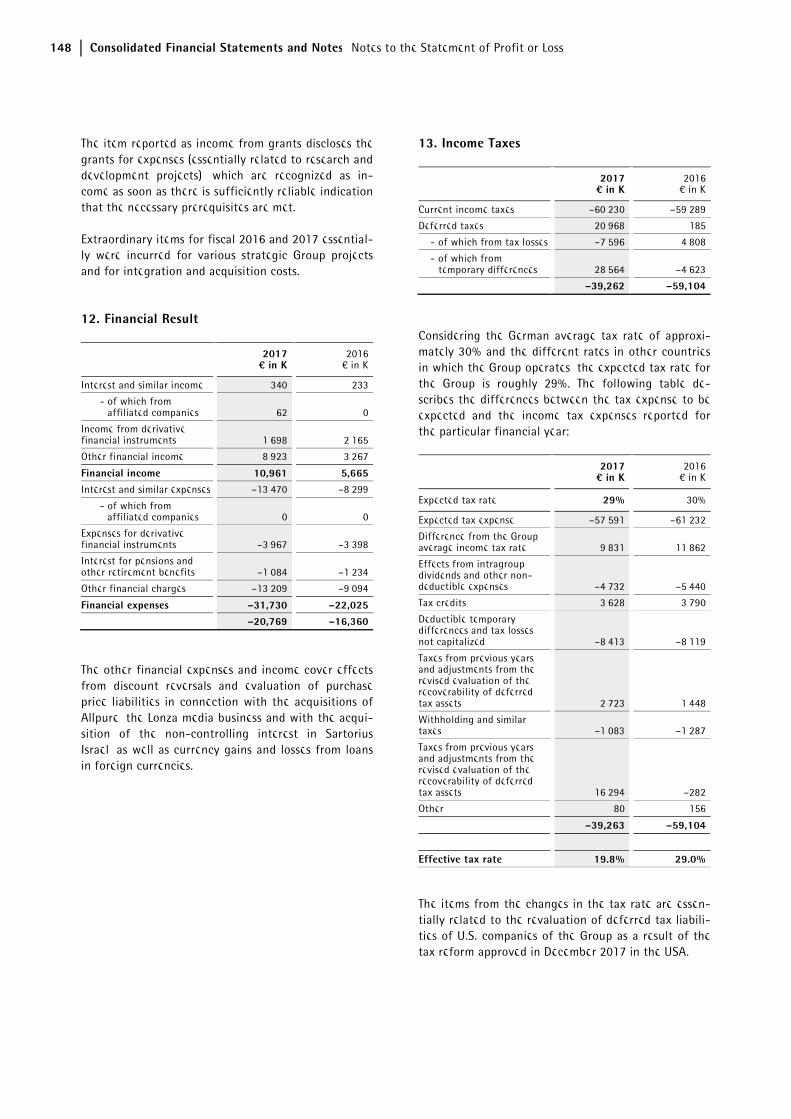
148 Consolidated Financial Statements and Notes Notes to the Statement of Profit or Loss
The item reported as income from grants discloses the grants for expenses (essentially related to research and development projects), which are recognized as in-come as soon as there is sufficiently reliable indication that the necessary prerequisites are met.
Extraordinary items for fiscal 2016 and 2017 essential-ly were incurred for various strategic Group projects and for integration and acquisition costs.
12. Financial Result
2017¤ in K
2016€ in K
Interest and similar income 340 233
- of which from affiliated companies 62 0
Income from derivative financial instruments 1,698 2,165
Other financial income 8,923 3,267
Financial income 10,961 5,665Interest and similar expenses –13,470 –8,299
- of which from affiliated companies 0 0
Expenses for derivative financial instruments –3,967 –3,398
Interest for pensions and other retirement benefits –1,084 –1,234
Other financial charges –13,209 –9,094
Financial expenses –31,730 –22,025
–20,769 –16,360
The other financial expenses and income cover effects from discount reversals and evaluation of purchase price liabilities in connection with the acquisitions of Allpure, the Lonza media business and with the acqui-sition of the non-controlling interest in Sartorius Israel, as well as currency gains and losses from loans in foreign currencies.
13. Income Taxes
2017¤ in K
2016€ in K
Current income taxes –60,230 –59,289
Deferred taxes 20,968 185
- of which from tax losses –7,596 4,808
- of which from temporary differences 28,564 –4,623
–39,262 –59,104
Considering the German average tax rate of approxi-mately 30% and the different rates in other countries in which the Group operates, the expected tax rate for the Group is roughly 29%. The following table de-scribes the differences between the tax expense to be expected and the income tax expenses reported for the particular financial year:
2017¤ in K
2016€ in K
Expected tax rate 29% 30%
Expected tax expense –57,591 –61,232
Difference from the Group average income tax rate 9,831 11,862
Effects from intragroup dividends and other non-deductible expenses –4,732 –5,440
Tax credits 3,628 3,790
Deductible temporary differences and tax losses not capitalized –8,413 –8,119
Taxes from previous years and adjustments from the revised evaluation of the recoverability of deferred tax assets 2,723 1,448
Withholding and similar taxes –1,083 –1,287
Taxes from previous years and adjustments from the revised evaluation of the recoverability of deferred tax assets 16,294 –282
Other 80 156
–39,263 –59,104
Effective tax rate 19.8% 29.0%
The items from the changes in the tax rate are essen-tially related to the revaluation of deferred tax liabili-ties of U.S. companies of the Group as a result of the tax reform approved in December 2017 in the USA.
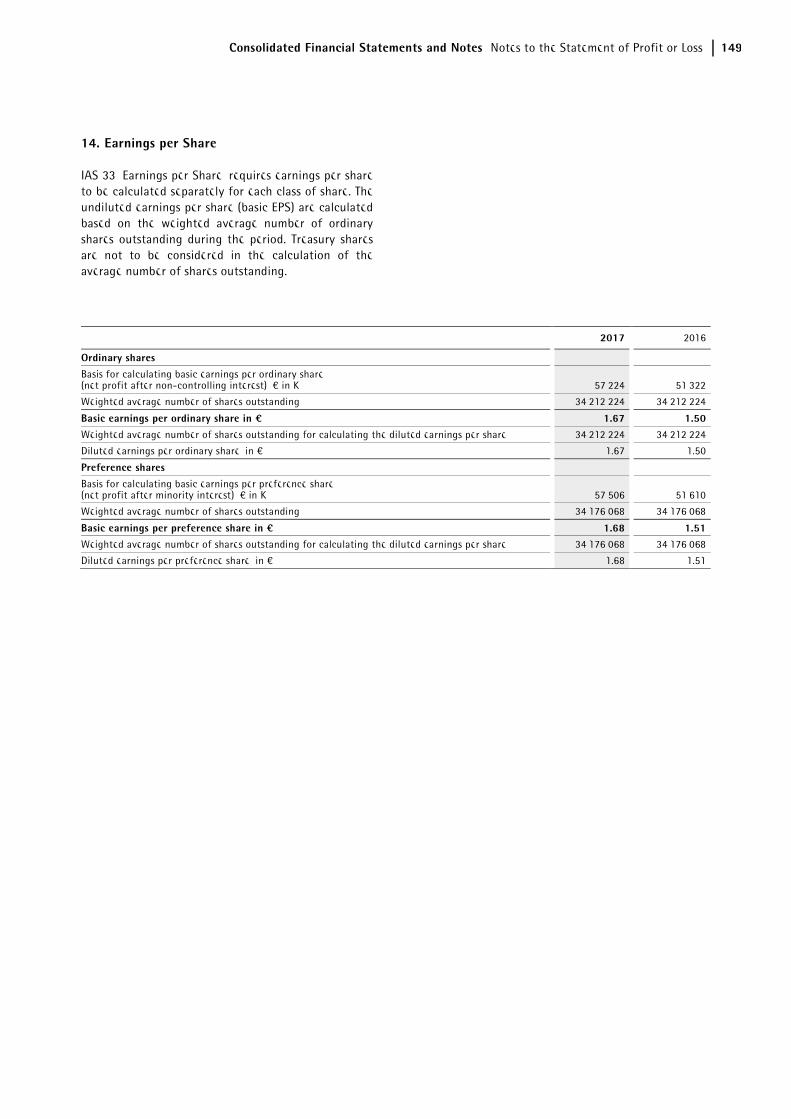
Consolidated Financial Statements and Notes Notes to the Statement of Profit or Loss 149
14. Earnings per Share
IAS 33, Earnings per Share, requires earnings per share to be calculated separately for each class of share. The undiluted earnings per share (basic EPS) are calculated based on the weighted average number of ordinary shares outstanding during the period. Treasury shares are not to be considered in the calculation of the average number of shares outstanding.
2017 2016
Ordinary shares
Basis for calculating basic earnings per ordinary share (net profit after non-controlling interest), € in K 57,224 51,322
Weighted average number of shares outstanding 34,212,224 34,212,224
Basic earnings per ordinary share in ¤ 1.67 1.50Weighted average number of shares outstanding for calculating the diluted earnings per share 34,212,224 34,212,224
Diluted earnings per ordinary share, in € 1.67 1.50
Preference shares
Basis for calculating basic earnings per preference share (net profit after minority interest), € in K 57,506 51,610
Weighted average number of shares outstanding 34,176,068 34,176,068
Basic earnings per preference share in ¤ 1.68 1.51Weighted average number of shares outstanding for calculating the diluted earnings per share 34,176,068 34,176,068
Diluted earnings per preference share, in € 1.68 1.51
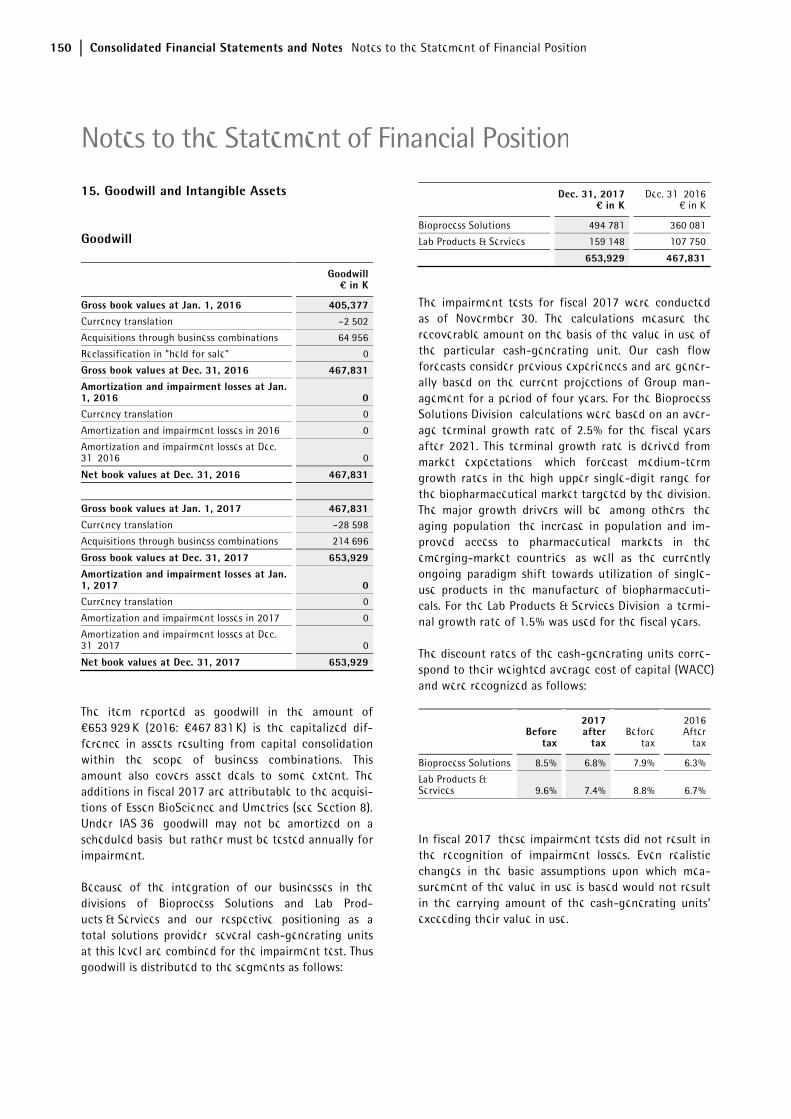
150 Consolidated Financial Statements and Notes Notes to the Statement of Financial Position
15. Goodwill and Intangible Assets
Goodwill
Goodwill¤ in K
Gross book values at Jan. 1, 2016 405,377Currency translation –2,502
Acquisitions through business combinations 64,956
Reclassification in "held for sale" 0
Gross book values at Dec. 31, 2016 467,831
Amortization and impairment losses at Jan. 1, 2016 0Currency translation 0
Amortization and impairment losses in 2016 0
Amortization and impairment losses at Dec. 31, 2016 0
Net book values at Dec. 31, 2016 467,831
Gross book values at Jan. 1, 2017 467,831Currency translation –28,598
Acquisitions through business combinations 214,696
Gross book values at Dec. 31, 2017 653,929
Amortization and impairment losses at Jan. 1, 2017 0Currency translation 0
Amortization and impairment losses in 2017 0
Amortization and impairment losses at Dec. 31, 2017 0
Net book values at Dec. 31, 2017 653,929
The item reported as goodwill in the amount of €653,929 K (2016: €467,831 K) is the capitalized dif-ference in assets resulting from capital consolidation within the scope of business combinations. This amount also covers asset deals to some extent. The additions in fiscal 2017 are attributable to the acquisi-tions of Essen BioScience and Umetrics (see Section 8). Under IAS 36, goodwill may not be amortized on a scheduled basis, but rather must be tested annually for impairment.
Because of the integration of our businesses in the divisions of Bioprocess Solutions and Lab Prod-ucts & Services and our respective positioning as a total solutions provider, several cash-generating units at this level are combined for the impairment test. Thus, goodwill is distributed to the segments as follows:
Dec. 31, 2017¤ in K
Dec. 31, 2016€ in K
Bioprocess Solutions 494,781 360,081
Lab Products & Services 159,148 107,750
653,929 467,831
The impairment tests for fiscal 2017 were conducted as of Novermber 30. The calculations measure the recoverable amount on the basis of the value in use of the particular cash-generating unit. Our cash flow forecasts consider previous experiences and are gener-ally based on the current projections of Group man-agement for a period of four years. For the Bioprocess Solutions Division, calculations were based on an aver-age terminal growth rate of 2.5% for the fiscal years after 2021. This terminal growth rate is derived from market expectations, which forecast medium-term growth rates in the high upper single-digit range for the biopharmaceutical market targeted by the division. The major growth drivers will be, among others, the aging population, the increase in population and im-proved access to pharmaceutical markets in the emerging-market countries, as well as the currently ongoing paradigm shift towards utilization of single-use products in the manufacture of biopharmaceuti-cals. For the Lab Products & Services Division, a termi-nal growth rate of 1.5% was used for the fiscal years.
The discount rates of the cash-generating units corre-spond to their weighted average cost of capital (WACC) and were recognized as follows:
Beforetax
2017after
taxBefore
tax
2016After
tax
Bioprocess Solutions 8.5% 6.8% 7.9% 6.3%
Lab Products & Services 9.6% 7.4% 8.8% 6.7%
In fiscal 2017, these impairment tests did not result in the recognition of impairment losses. Even realistic changes in the basic assumptions upon which mea-surement of the value in use is based would not result in the carrying amount of the cash-generating units' exceeding their value in use.
Notes to the Statement of Financial Position
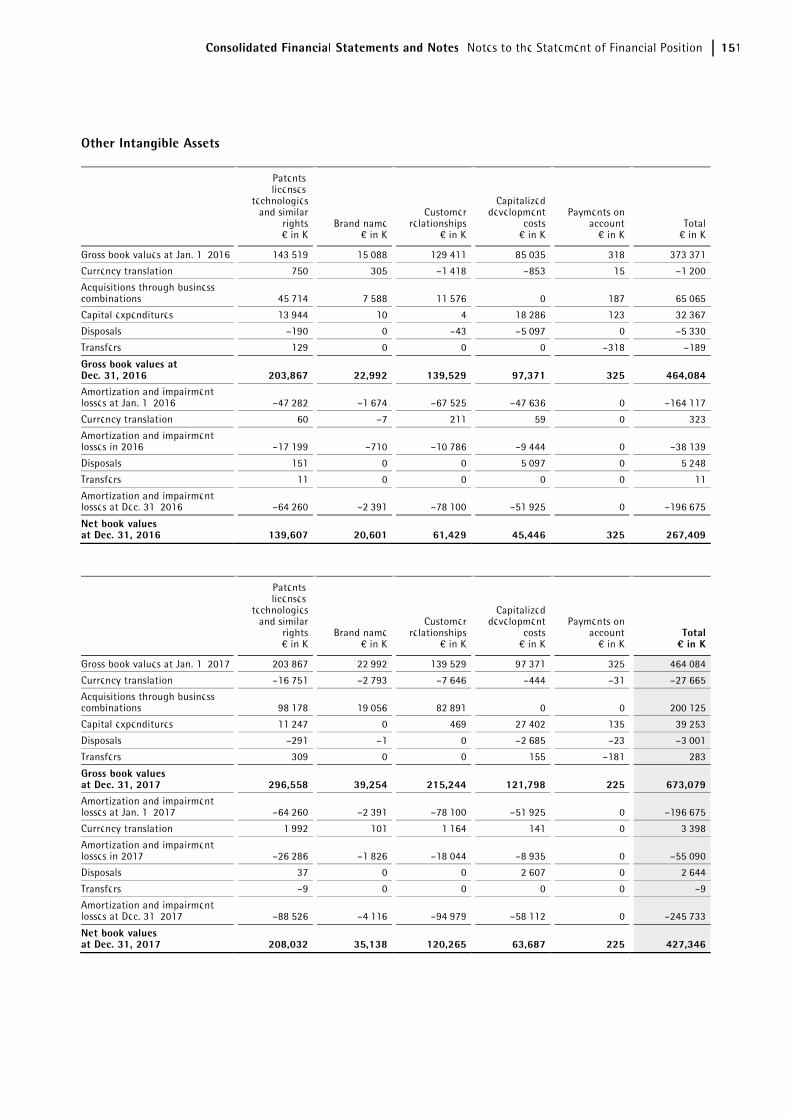
Consolidated Financial Statements and Notes Notes to the Statement of Financial Position 151
Other Intangible Assets
Patents, licenses,
technologies and similar
rights€ in K
Brand name€ in K
Customer relationships
€ in K
Capitalizeddevelopment
costs€ in K
Payments on account
€ in KTotal
€ in K
Gross book values at Jan. 1, 2016 143,519 15,088 129,411 85,035 318 373,371
Currency translation 750 305 –1,418 –853 15 –1,200
Acquisitions through business combinations 45,714 7,588 11,576 0 187 65,065
Capital expenditures 13,944 10 4 18,286 123 32,367
Disposals –190 0 –43 –5,097 0 –5,330
Transfers 129 0 0 0 –318 –189
Gross book values at Dec. 31, 2016 203,867 22,992 139,529 97,371 325 464,084Amortization and impairment losses at Jan. 1, 2016 –47,282 –1,674 –67,525 –47,636 0 –164,117
Currency translation 60 –7 211 59 0 323
Amortization and impairment losses in 2016 –17,199 –710 –10,786 –9,444 0 –38,139
Disposals 151 0 0 5,097 0 5,248
Transfers 11 0 0 0 0 11
Amortization and impairment losses at Dec. 31, 2016 –64,260 –2,391 –78,100 –51,925 0 –196,675
Net book values at Dec. 31, 2016 139,607 20,601 61,429 45,446 325 267,409
Patents, licenses,
technologies and similar
rights€ in K
Brand name€ in K
Customer relationships
€ in K
Capitalizeddevelopment
costs€ in K
Payments on account
€ in KTotal¤ in K
Gross book values at Jan. 1, 2017 203,867 22,992 139,529 97,371 325 464,084
Currency translation –16,751 –2,793 –7,646 –444 –31 –27,665
Acquisitions through business combinations 98,178 19,056 82,891 0 0 200,125
Capital expenditures 11,247 0 469 27,402 135 39,253
Disposals –291 –1 0 –2,685 –23 –3,001
Transfers 309 0 0 155 –181 283
Gross book values at Dec. 31, 2017 296,558 39,254 215,244 121,798 225 673,079
Amortization and impairment losses at Jan. 1, 2017 –64,260 –2,391 –78,100 –51,925 0 –196,675
Currency translation 1,992 101 1,164 141 0 3,398
Amortization and impairment losses in 2017 –26,286 –1,826 –18,044 –8,935 0 –55,090
Disposals 37 0 0 2,607 0 2,644
Transfers –9 0 0 0 0 –9
Amortization and impairment losses at Dec. 31, 2017 –88,526 –4,116 –94,979 –58,112 0 –245,733
Net book values at Dec. 31, 2017 208,032 35,138 120,265 63,687 225 427,346
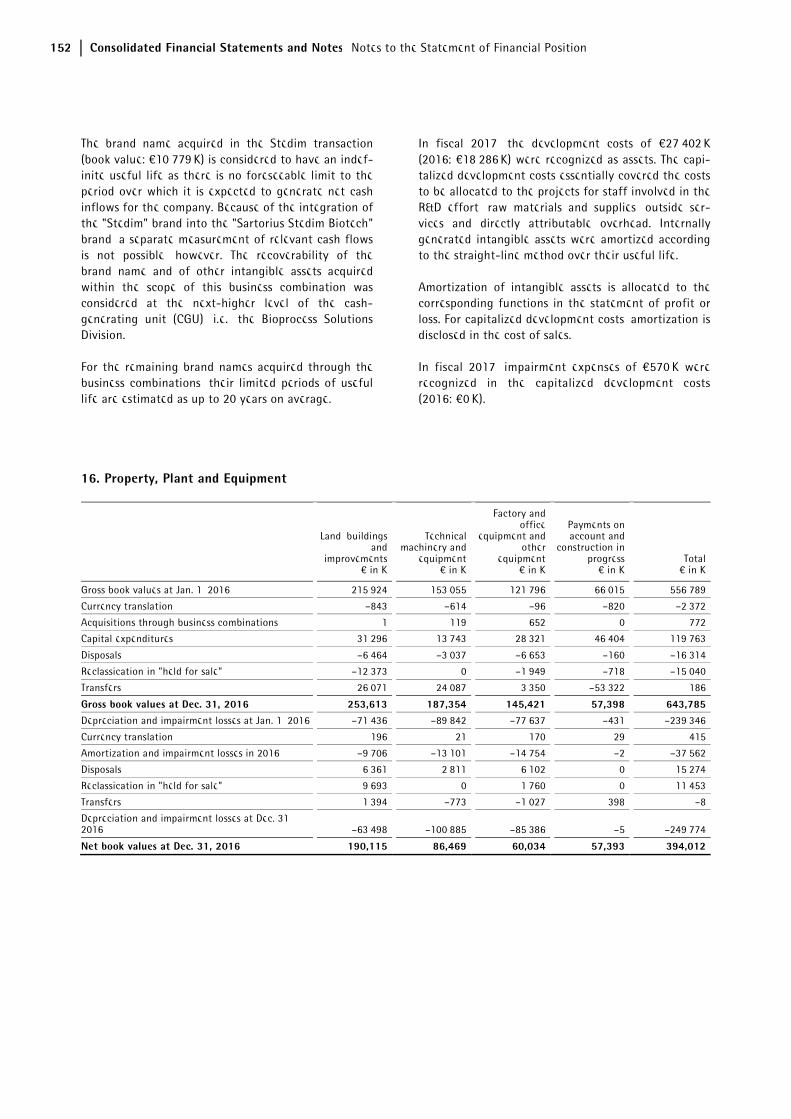
152 Consolidated Financial Statements and Notes Notes to the Statement of Financial Position
The brand name acquired in the Stedim transaction (book value: €10,779 K) is considered to have an indef-inite useful life as there is no foreseeable limit to the period over which it is expected to generate net cash inflows for the company. Because of the integration of the "Stedim" brand into the "Sartorius Stedim Biotech" brand, a separate measurement of relevant cash flows is not possible, however. The recoverability of the brand name and of other intangible assets acquired within the scope of this business combination was considered at the next-higher level of the cash-generating unit (CGU), i.e., the Bioprocess Solutions Division.
For the remaining brand names acquired through the business combinations, their limited periods of useful life are estimated as up to 20 years on average.
In fiscal 2017, the development costs of €27,402 K (2016: €18,286 K) were recognized as assets. The capi-talized development costs essentially covered the costs to be allocated to the projects for staff involved in the R&D effort, raw materials and supplies, outside ser-vices and directly attributable overhead. Internally generated intangible assets were amortized according to the straight-line method over their useful life.
Amortization of intangible assets is allocated to the corresponding functions in the statement of profit or loss. For capitalized development costs, amortization is disclosed in the cost of sales.
In fiscal 2017, impairment expenses of €570 K were recognized in the capitalized development costs (2016: €0 K).
16. Property, Plant and Equipment
Land, buildings and
improvements€ in K
Technical machinery and
equipment€ in K
Factory and office
equipment and other
equipment€ in K
Payments on account and
construction in progress
€ in KTotal
€ in K
Gross book values at Jan. 1, 2016 215,924 153,055 121,796 66,015 556,789
Currency translation –843 –614 –96 –820 –2,372
Acquisitions through business combinations 1 119 652 0 772
Capital expenditures 31,296 13,743 28,321 46,404 119,763
Disposals –6,464 –3,037 –6,653 –160 –16,314
Reclassication in "held for sale" –12,373 0 –1,949 –718 –15,040
Transfers 26,071 24,087 3,350 –53,322 186
Gross book values at Dec. 31, 2016 253,613 187,354 145,421 57,398 643,785Depreciation and impairment losses at Jan. 1, 2016 –71,436 –89,842 –77,637 –431 –239,346
Currency translation 196 21 170 29 415
Amortization and impairment losses in 2016 –9,706 –13,101 –14,754 –2 –37,562
Disposals 6,361 2,811 6,102 0 15,274
Reclassication in "held for sale" 9,693 0 1,760 0 11,453
Transfers 1,394 –773 –1,027 398 –8
Depreciation and impairment losses at Dec. 31, 2016 –63,498 –100,885 –85,386 –5 –249,774
Net book values at Dec. 31, 2016 190,115 86,469 60,034 57,393 394,012
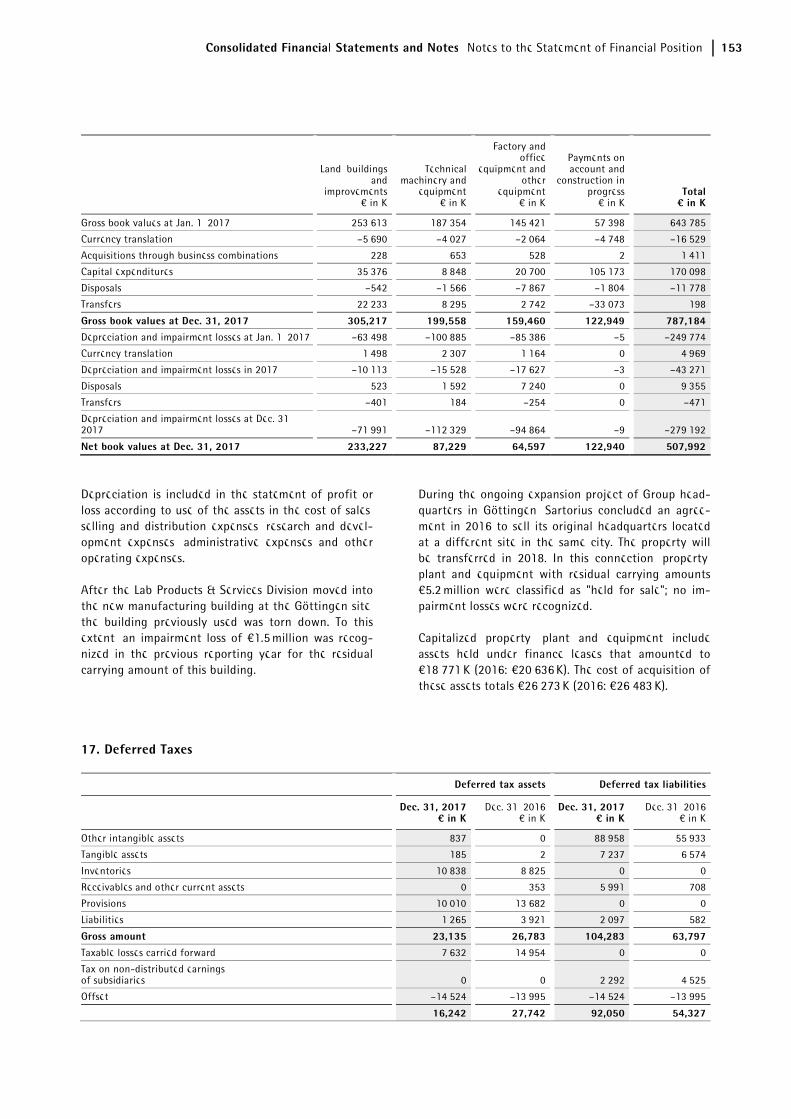
Consolidated Financial Statements and Notes Notes to the Statement of Financial Position 153
Land, buildings and
improvements€ in K
Technical machinery and
equipment€ in K
Factory and office
equipment and other
equipment€ in K
Payments on account and
construction in progress
€ in KTotal¤ in K
Gross book values at Jan. 1, 2017 253,613 187,354 145,421 57,398 643,785
Currency translation –5,690 –4,027 –2,064 –4,748 –16,529
Acquisitions through business combinations 228 653 528 2 1,411
Capital expenditures 35,376 8,848 20,700 105,173 170,098
Disposals –542 –1,566 –7,867 –1,804 –11,778
Transfers 22,233 8,295 2,742 –33,073 198
Gross book values at Dec. 31, 2017 305,217 199,558 159,460 122,949 787,184Depreciation and impairment losses at Jan. 1, 2017 –63,498 –100,885 –85,386 –5 –249,774
Currency translation 1,498 2,307 1,164 0 4,969
Depreciation and impairment losses in 2017 –10,113 –15,528 –17,627 –3 –43,271
Disposals 523 1,592 7,240 0 9,355
Transfers –401 184 –254 0 –471
Depreciation and impairment losses at Dec. 31, 2017 –71,991 –112,329 –94,864 –9 –279,192
Net book values at Dec. 31, 2017 233,227 87,229 64,597 122,940 507,992
Depreciation is included in the statement of profit or loss according to use of the assets in the cost of sales, selling and distribution expenses, research and devel-opment expenses, administrative expenses and other operating expenses.
After the Lab Products & Services Division moved into the new manufacturing building at the Göttingen site, the building previously used was torn down. To this extent, an impairment loss of €1.5 million was recog-nized in the previous reporting year for the residual carrying amount of this building.
During the ongoing expansion project of Group head-quarters in Göttingen, Sartorius concluded an agree-ment in 2016 to sell its original headquarters located at a different site in the same city. The property will be transferred in 2018. In this connection, property, plant and equipment with residual carrying amounts €5.2 million were classified as "held for sale"; no im-pairment losses were recognized.
Capitalized property, plant and equipment include assets held under finance leases that amounted to €18,771 K (2016: €20,636 K). The cost of acquisition of these assets totals €26,273 K (2016: €26,483 K).
17. Deferred Taxes
Deferred tax assets Deferred tax liabilities
Dec. 31, 2017¤ in K
Dec. 31, 2016€ in K
Dec. 31, 2017¤ in K
Dec. 31, 2016€ in K
Other intangible assets 837 0 88,958 55,933
Tangible assets 185 2 7,237 6,574
Inventories 10,838 8,825 0 0
Receivables and other current assets 0 353 5,991 708
Provisions 10,010 13,682 0 0
Liabilities 1,265 3,921 2,097 582
Gross amount 23,135 26,783 104,283 63,797
Taxable losses carried forward 7,632 14,954 0 0
Tax on non-distributed earnings of subsidiaries 0 0 2,292 4,525
Offset –14,524 –13,995 –14,524 –13,995
16,242 27,742 92,050 54,327
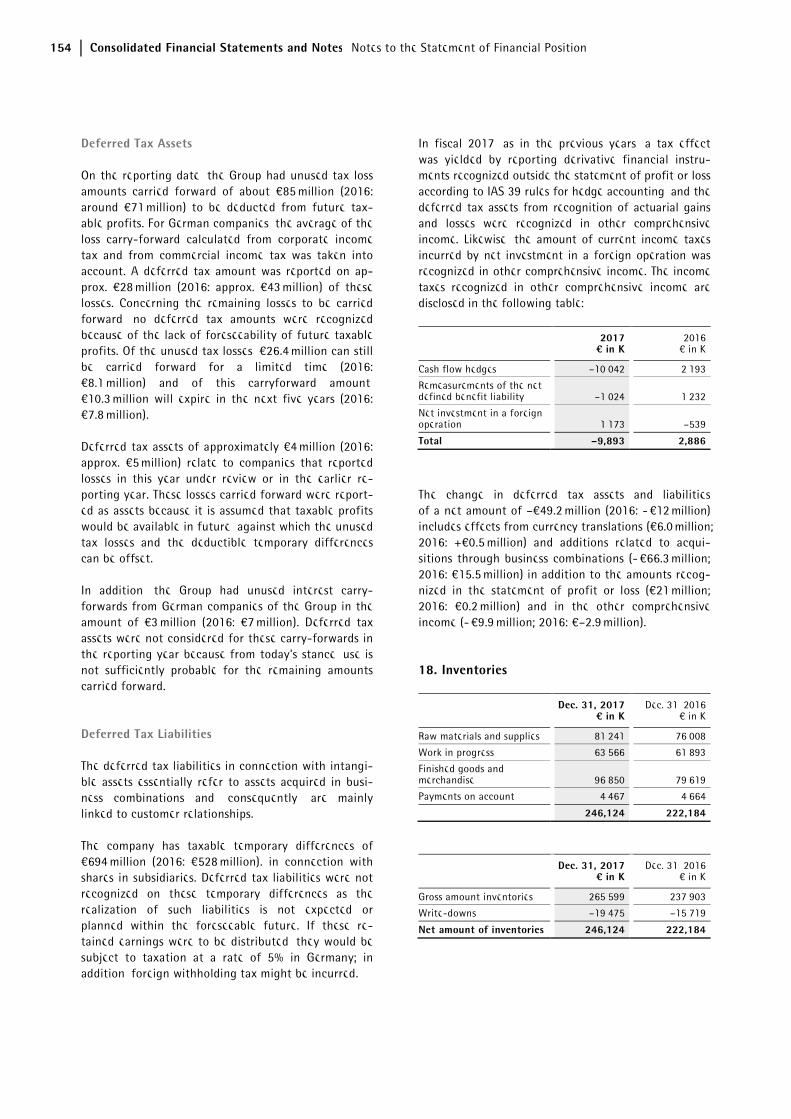
154 Consolidated Financial Statements and Notes Notes to the Statement of Financial Position
Deferred Tax Assets
On the reporting date, the Group had unused tax loss amounts carried forward of about €85 million (2016: around €71 million) to be deducted from future tax-able profits. For German companies, the average of the loss carry-forward calculated from corporate income tax and from commercial income tax was taken into account. A deferred tax amount was reported on ap-prox. €28 million (2016: approx. €43 million) of these losses. Concerning the remaining losses to be carried forward, no deferred tax amounts were recognized because of the lack of foreseeability of future taxable profits. Of the unused tax losses, €26.4 million can still be carried forward for a limited time (2016: €8.1 million) and of this carryforward amount, €10.3 million will expire in the next five years (2016: €7.8 million).
Deferred tax assets of approximately €4 million (2016: approx. €5 million) relate to companies that reported losses in this year under review or in the earlier re-porting year. These losses carried forward were report-ed as assets because it is assumed that taxable profits would be available in future, against which the unused tax losses and the deductible temporary differences can be offset.
In addition, the Group had unused interest carry-forwards from German companies of the Group in the amount of €3 million (2016: €7 million). Deferred tax assets were not considered for these carry-forwards in the reporting year because from today's stance, use is not sufficiently probable for the remaining amounts carried forward.
Deferred Tax Liabilities
The deferred tax liabilities in connection with intangi-ble assets essentially refer to assets acquired in busi-ness combinations and, consequently, are mainly linked to customer relationships.
The company has taxable temporary differences of €694 million (2016: €528 million). in connection with shares in subsidiaries. Deferred tax liabilities were not recognized on these temporary differences as the realization of such liabilities is not expected or planned within the foreseeable future. If these re-tained earnings were to be distributed, they would be subject to taxation at a rate of 5% in Germany; in addition, foreign withholding tax might be incurred.
In fiscal 2017, as in the previous years, a tax effect was yielded by reporting derivative financial instru-ments recognized outside the statement of profit or loss according to IAS 39 rules for hedge accounting, and the deferred tax assets from recognition of actuarial gains and losses were recognized in other comprehensive income. Likewise, the amount of current income taxes incurred by net investment in a foreign operation was recognized in other comprehensive income. The income taxes recognized in other comprehensive income are disclosed in the following table:
2017¤ in K
2016€ in K
Cash flow hedges –10,042 2,193
Remeasurements of the net defined benefit liability –1,024 1,232
Net investment in a foreign operation 1,173 –539
Total –9,893 2,886
The change in deferred tax assets and liabilities of a net amount of –€49.2 million (2016: - €12 million) includes effects from currency translations (€6.0 million; 2016: +€0.5 million) and additions related to acqui-sitions through business combinations (- €66.3 million; 2016: €15.5 million) in addition to the amounts recog-nized in the statement of profit or loss (€21 million; 2016: €0.2 million) and in the other comprehensive income (- €9.9 million; 2016: €–2.9 million).
18. Inventories
Dec. 31, 2017¤ in K
Dec. 31, 2016€ in K
Raw materials and supplies 81,241 76,008
Work in progress 63,566 61,893
Finished goods and merchandise 96,850 79,619
Payments on account 4,467 4,664
246,124 222,184
Dec. 31, 2017¤ in K
Dec. 31, 2016€ in K
Gross amount inventories 265,599 237,903
Write-downs –19,475 –15,719
Net amount of inventories 246,124 222,184
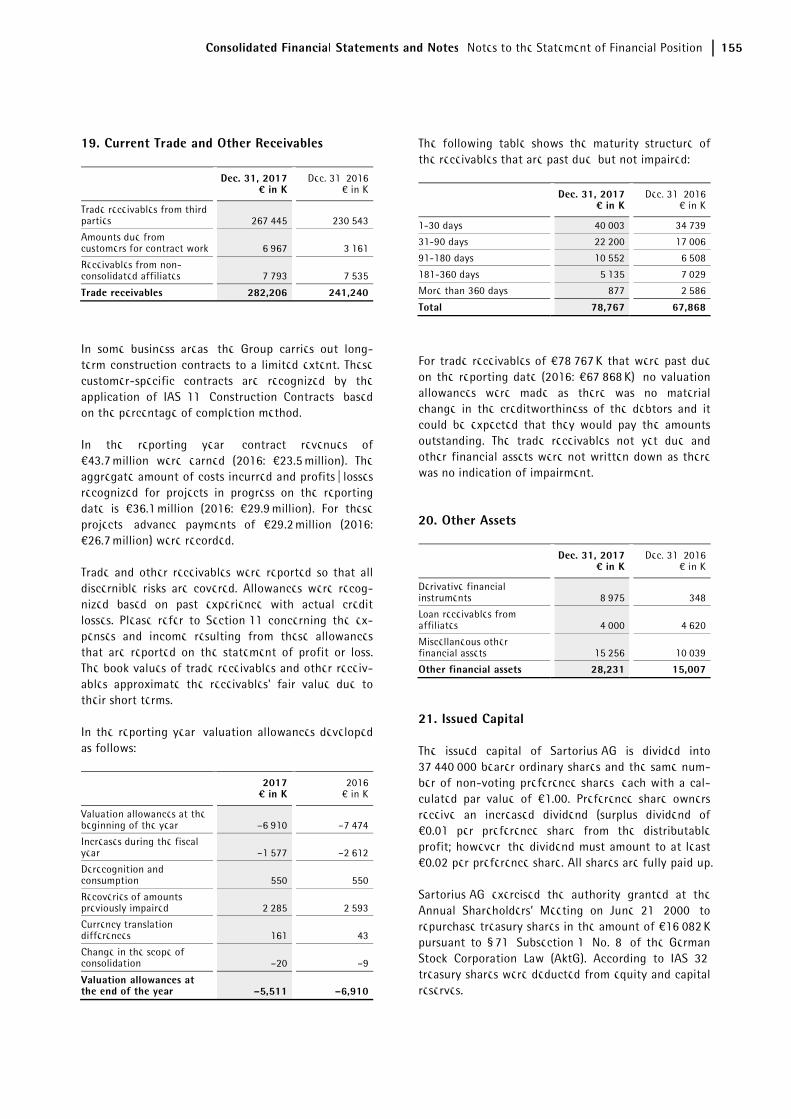
Consolidated Financial Statements and Notes Notes to the Statement of Financial Position 155
19. Current Trade and Other Receivables
Dec. 31, 2017¤ in K
Dec. 31, 2016€ in K
Trade receivables from third parties 267,445 230,543
Amounts due from customers for contract work 6,967 3,161
Receivables from non-consolidated affiliates 7,793 7,535
Trade receivables 282,206 241,240
In some business areas, the Group carries out long-term construction contracts to a limited extent. These customer-specific contracts are recognized by the application of IAS 11, Construction Contracts, based on the percentage of completion method.
In the reporting year, contract revenues of €43.7 million were earned (2016: €23.5 million). The aggregate amount of costs incurred and profits | losses recognized for projects in progress on the reporting date is €36.1 million (2016: €29.9 million). For these projects, advance payments of €29.2 million (2016: €26.7 million) were recorded.
Trade and other receivables were reported so that all discernible risks are covered. Allowances were recog-nized based on past experience with actual credit losses. Please refer to Section 11 concerning the ex-penses and income resulting from these allowances that are reported on the statement of profit or loss. The book values of trade receivables and other receiv-ables approximate the receivables' fair value due to their short terms.
In the reporting year, valuation allowances developed as follows:
2017¤ in K
2016€ in K
Valuation allowances at the beginning of the year –6,910 –7,474
Increases during the fiscal year –1,577 –2,612
Derecognition and consumption 550 550
Recoveries of amounts previously impaired 2,285 2,593
Currency translation differences 161 43
Change in the scope of consolidation –20 –9
Valuation allowances at the end of the year –5,511 –6,910
The following table shows the maturity structure of the receivables that are past due, but not impaired:
Dec. 31, 2017¤ in K
Dec. 31, 2016€ in K
1-30 days 40,003 34,739
31-90 days 22,200 17,006
91-180 days 10,552 6,508
181-360 days 5,135 7,029
More than 360 days 877 2,586
Total 78,767 67,868
For trade receivables of €78,767 K that were past due on the reporting date (2016: €67,868 K), no valuation allowances were made as there was no material change in the creditworthiness of the debtors and it could be expected that they would pay the amounts outstanding. The trade receivables not yet due and other financial assets were not written down as there was no indication of impairment.
20. Other Assets
Dec. 31, 2017¤ in K
Dec. 31, 2016€ in K
Derivative financial instruments 8,975 348
Loan receivables from affiliates 4,000 4,620
Miscellaneous other financial assets 15,256 10,039
Other financial assets 28,231 15,007
21. Issued Capital
The issued capital of Sartorius AG is divided into 37,440,000 bearer ordinary shares and the same num-ber of non-voting preference shares, each with a cal-culated par value of €1.00. Preference share owners receive an increased dividend (surplus dividend of €0.01 per preference share from the distributable profit; however, the dividend must amount to at least €0.02 per preference share. All shares are fully paid up.
Sartorius AG exercised the authority granted at the Annual Shareholders’ Meeting on June 21, 2000, to repurchase treasury shares in the amount of €16,082 K pursuant to § 71, Subsection 1, No. 8, of the German Stock Corporation Law (AktG). According to IAS 32, treasury shares were deducted from equity and capital reserves.
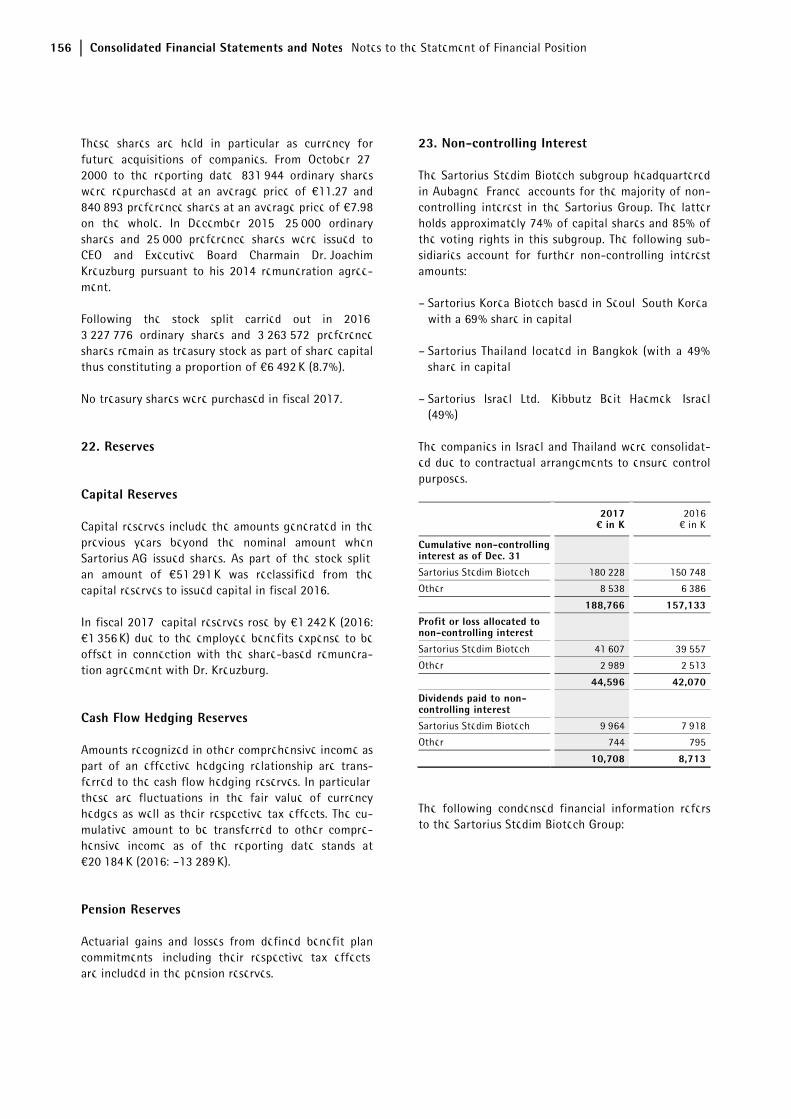
156 Consolidated Financial Statements and Notes Notes to the Statement of Financial Position
These shares are held in particular as currency for future acquisitions of companies. From October 27, 2000 to the reporting date, 831,944 ordinary shares were repurchased at an average price of €11.27 and 840,893 preference shares at an average price of €7.98 on the whole. In December 2015, 25,000 ordinary shares and 25,000 preference shares were issued to CEO and Executive Board Charmain Dr. Joachim Kreuzburg pursuant to his 2014 remuneration agree-ment.
Following the stock split carried out in 2016, 3,227,776 ordinary shares and 3,263,572 preference shares remain as treasury stock as part of share capital, thus constituting a proportion of €6,492 K (8.7%).
No treasury shares were purchased in fiscal 2017.
22. Reserves
Capital Reserves
Capital reserves include the amounts generated in the previous years beyond the nominal amount when Sartorius AG issued shares. As part of the stock split, an amount of €51,291 K was reclassified from the capital reserves to issued capital in fiscal 2016.
In fiscal 2017, capital reserves rose by €1,242 K (2016: €1,356 K) due to the employee benefits expense to be offset in connection with the share-based remunera-tion agreement with Dr. Kreuzburg.
Cash Flow Hedging Reserves
Amounts recognized in other comprehensive income as part of an effective hedgeing relationship are trans-ferred to the cash flow hedging reserves. In particular, these are fluctuations in the fair value of currency hedges as well as their respective tax effects. The cu-mulative amount to be transferred to other compre-hensive income as of the reporting date stands at €20,184 K (2016: –13,289 K).
Pension Reserves
Actuarial gains and losses from defined benefit plan commitments, including their respective tax effects, are included in the pension reserves.
23. Non-controlling Interest
The Sartorius Stedim Biotech subgroup headquartered in Aubagne, France, accounts for the majority of non-controlling interest in the Sartorius Group. The latter holds approximately 74% of capital shares and 85% of the voting rights in this subgroup. The following sub-sidiaries account for further non-controlling interest amounts:
– Sartorius Korea Biotech based in Seoul, South Korea, with a 69% share in capital
– Sartorius Thailand located in Bangkok (with a 49% share in capital
– Sartorius Israel Ltd., Kibbutz Beit Haemek, Israel (49%)
The companies in Israel and Thailand were consolidat-ed due to contractual arrangements to ensure control purposes.
2017¤ in K
2016€ in K
Cumulative non-controlling interest as of Dec. 31
Sartorius Stedim Biotech 180,228 150,748
Other 8,538 6,386
188,766 157,133
Profit or loss allocated to non-controlling interest
Sartorius Stedim Biotech 41,607 39,557
Other 2,989 2,513
44,596 42,070Dividends paid to non-controlling interest
Sartorius Stedim Biotech 9,964 7,918
Other 744 795
10,708 8,713
The following condensed financial information refers to the Sartorius Stedim Biotech Group:
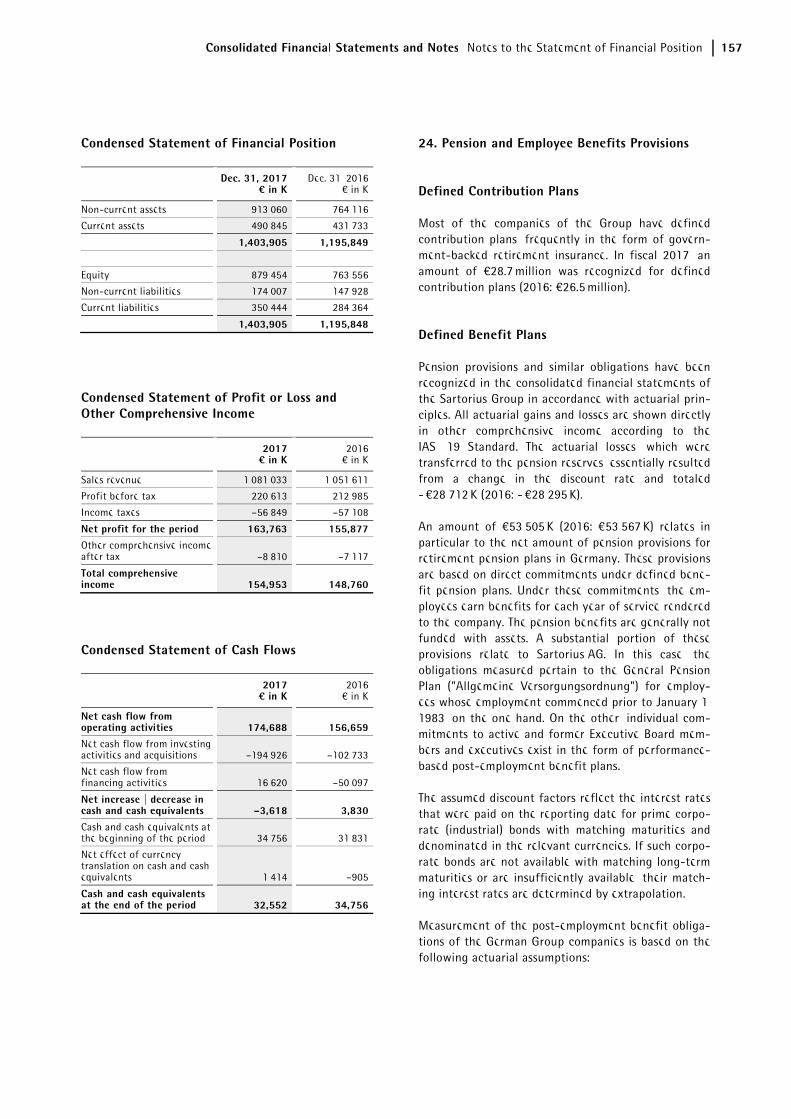
Consolidated Financial Statements and Notes Notes to the Statement of Financial Position 157
Condensed Statement of Financial Position
Dec. 31, 2017¤ in K
Dec. 31, 2016€ in K
Non-current assets 913,060 764,116
Current assets 490,845 431,733
1,403,905 1,195,849
Equity 879,454 763,556
Non-current liabilities 174,007 147,928
Current liabilities 350,444 284,364
1,403,905 1,195,848
Condensed Statement of Profit or Loss and Other Comprehensive Income
2017¤ in K
2016€ in K
Sales revenue 1,081,033 1,051,611
Profit before tax 220,613 212,985
Income taxes –56,849 –57,108
Net profit for the period 163,763 155,877
Other comprehensive incomeafter tax –8,810 –7,117
Total comprehensive income 154,953 148,760
Condensed Statement of Cash Flows
2017¤ in K
2016€ in K
Net cash flow from operating activities 174,688 156,659Net cash flow from investing activities and acquisitions –194,926 –102,733
Net cash flow from financing activities 16,620 –50,097
Net increase | decrease in cash and cash equivalents –3,618 3,830
Cash and cash equivalents at the beginning of the period 34,756 31,831
Net effect of currency translation on cash and cash equivalents 1,414 –905
Cash and cash equivalents at the end of the period 32,552 34,756
24. Pension and Employee Benefits Provisions
Defined Contribution Plans
Most of the companies of the Group have defined contribution plans, frequently in the form of govern-ment-backed retirement insurance. In fiscal 2017, an amount of €28.7 million was recognized for defined contribution plans (2016: €26.5 million).
Defined Benefit Plans
Pension provisions and similar obligations have been recognized in the consolidated financial statements of the Sartorius Group in accordance with actuarial prin-ciples. All actuarial gains and losses are shown directly in other comprehensive income according to the IAS 19 Standard. The actuarial losses, which were transferred to the pension reserves, essentially resulted from a change in the discount rate and totaled - €28,712 K (2016: - €28,295 K).
An amount of €53,505 K (2016: €53,567 K) relates in particular to the net amount of pension provisions for retirement pension plans in Germany. These provisions are based on direct commitments under defined bene-fit pension plans. Under these commitments, the em-ployees earn benefits for each year of service rendered to the company. The pension benefits are generally not funded with assets. A substantial portion of these provisions relate to Sartorius AG. In this case, the obligations measured pertain to the General Pension Plan ("Allgemeine Versorgungsordnung") for employ-ees whose employment commenced prior to January 1, 1983, on the one hand. On the other, individual com-mitments to active and former Executive Board mem-bers and executives exist in the form of performance-based post-employment benefit plans.
The assumed discount factors reflect the interest rates that were paid on the reporting date for prime corpo-rate (industrial) bonds with matching maturities and denominated in the relevant currencies. If such corpo-rate bonds are not available with matching long-term maturities or are insufficiently available, their match-ing interest rates are determined by extrapolation.
Measurement of the post-employment benefit obliga-tions of the German Group companies is based on the following actuarial assumptions:
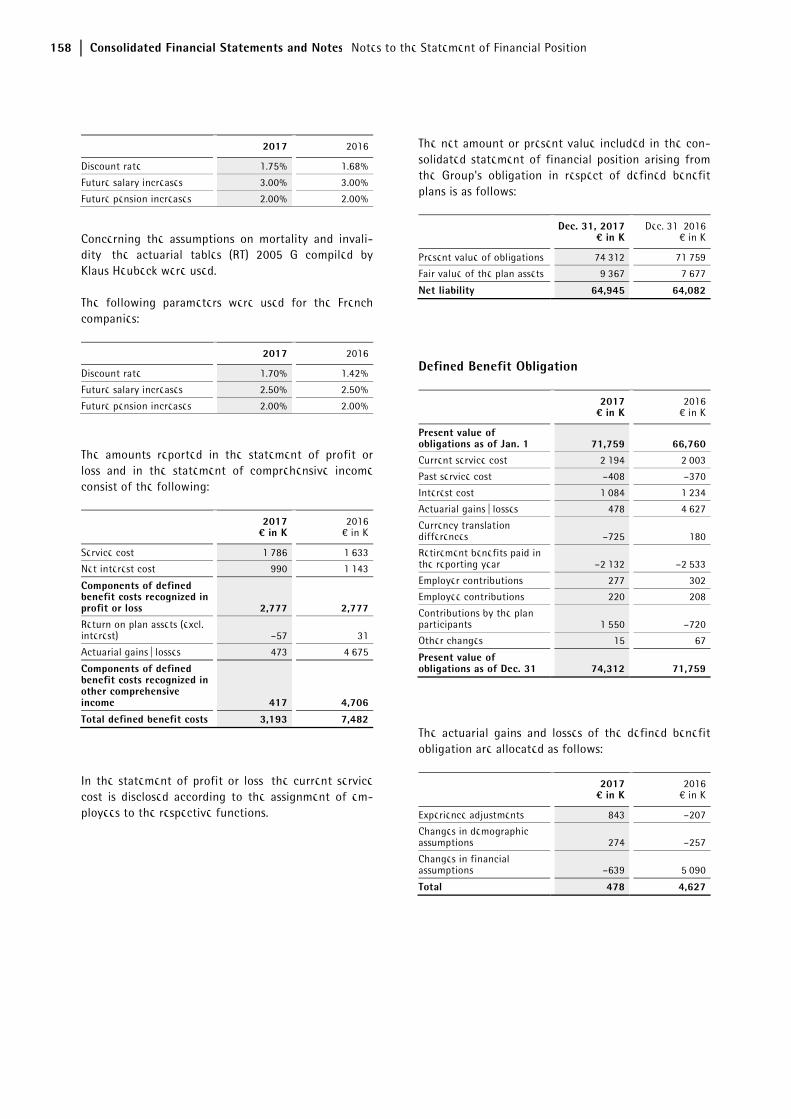
158 Consolidated Financial Statements and Notes Notes to the Statement of Financial Position
2017 2016
Discount rate 1.75% 1.68%
Future salary increases 3.00% 3.00%
Future pension increases 2.00% 2.00%
Concerning the assumptions on mortality and invali-dity, the actuarial tables (RT) 2005 G compiled by Klaus Heubeck were used.
The following parameters were used for the French companies:
2017 2016
Discount rate 1.70% 1.42%
Future salary increases 2.50% 2.50%
Future pension increases 2.00% 2.00%
The amounts reported in the statement of profit or loss and in the statement of comprehensive income consist of the following:
2017¤ in K
2016€ in K
Service cost 1,786 1,633
Net interest cost 990 1,143
Components of defined benefit costs recognized in profit or loss 2,777 2,777Return on plan assets (excl. interest) –57 31
Actuarial gains | losses 473 4,675
Components of defined benefit costs recognized in other comprehensive income 417 4,706
Total defined benefit costs 3,193 7,482
In the statement of profit or loss, the current service cost is disclosed according to the assignment of em-ployees to the respective functions.
The net amount or present value included in the con-solidated statement of financial position arising from the Group's obligation in respect of defined benefit plans is as follows:
Dec. 31, 2017¤ in K
Dec. 31, 2016€ in K
Present value of obligations 74,312 71,759
Fair value of the plan assets 9,367 7,677
Net liability 64,945 64,082
Defined Benefit Obligation
2017¤ in K
2016€ in K
Present value of obligations as of Jan. 1 71,759 66,760Current service cost 2,194 2,003
Past service cost –408 –370
Interest cost 1,084 1,234
Actuarial gains | losses 478 4,627
Currency translation differences –725 180
Retirement benefits paid in the reporting year –2,132 –2,533
Employer contributions 277 302
Employee contributions 220 208
Contributions by the plan participants 1,550 –720
Other changes 15 67
Present value of obligations as of Dec. 31 74,312 71,759
The actuarial gains and losses of the defined benefit obligation are allocated as follows:
2017¤ in K
2016€ in K
Experience adjustments 843 –207
Changes in demographic assumptions 274 –257
Changes in financial assumptions –639 5,090
Total 478 4,627
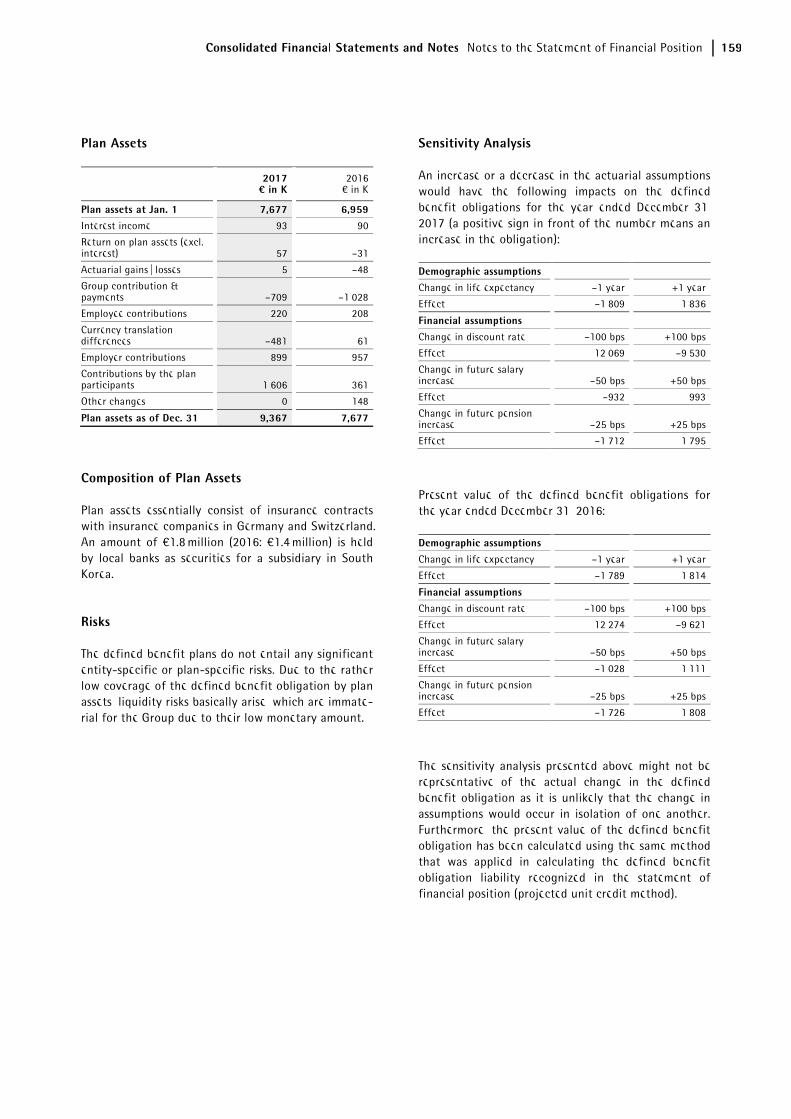
Consolidated Financial Statements and Notes Notes to the Statement of Financial Position 159
Plan Assets
2017¤ in K
2016€ in K
Plan assets at Jan. 1 7,677 6,959Interest income 93 90
Return on plan assets (excl. interest) 57 –31
Actuarial gains | losses 5 –48
Group contribution & payments –709 –1,028
Employee contributions 220 208
Currency translation differences –481 61
Employer contributions 899 957
Contributions by the plan participants 1,606 361
Other changes 0 148
Plan assets as of Dec. 31 9,367 7,677
Composition of Plan Assets
Plan assets essentially consist of insurance contracts with insurance companies in Germany and Switzerland. An amount of €1.8 million (2016: €1.4 million) is held by local banks as securities for a subsidiary in South Korea.
Risks
The defined benefit plans do not entail any significant entity-specific or plan-specific risks. Due to the rather low coverage of the defined benefit obligation by plan assets, liquidity risks basically arise, which are immate-rial for the Group due to their low monetary amount.
Sensitivity Analysis
An increase or a decrease in the actuarial assumptions would have the following impacts on the defined benefit obligations for the year ended December 31, 2017 (a positive sign in front of the number means an increase in the obligation):
Demographic assumptions Change in life expectancy –1 year +1 year
Effect –1,809 1,836
Financial assumptions Change in discount rate –100 bps +100 bps
Effect 12,069 –9,530
Change in future salary increase –50 bps +50 bps
Effect –932 993
Change in future pension increase –25 bps +25 bps
Effect –1,712 1,795
Present value of the defined benefit obligations for the year ended December 31, 2016:
Demographic assumptions
Change in life expectancy –1 year +1 year
Effect –1,789 1,814
Financial assumptions Change in discount rate –100 bps +100 bps
Effect 12,274 –9,621
Change in future salary increase –50 bps +50 bps
Effect –1,028 1,111
Change in future pension increase –25 bps +25 bps
Effect –1,726 1,808
The sensitivity analysis presented above might not be representative of the actual change in the defined benefit obligation as it is unlikely that the change in assumptions would occur in isolation of one another. Furthermore, the present value of the defined benefit obligation has been calculated using the same method that was applied in calculating the defined benefit obligation liability recognized in the statement of financial position (projected unit credit method).
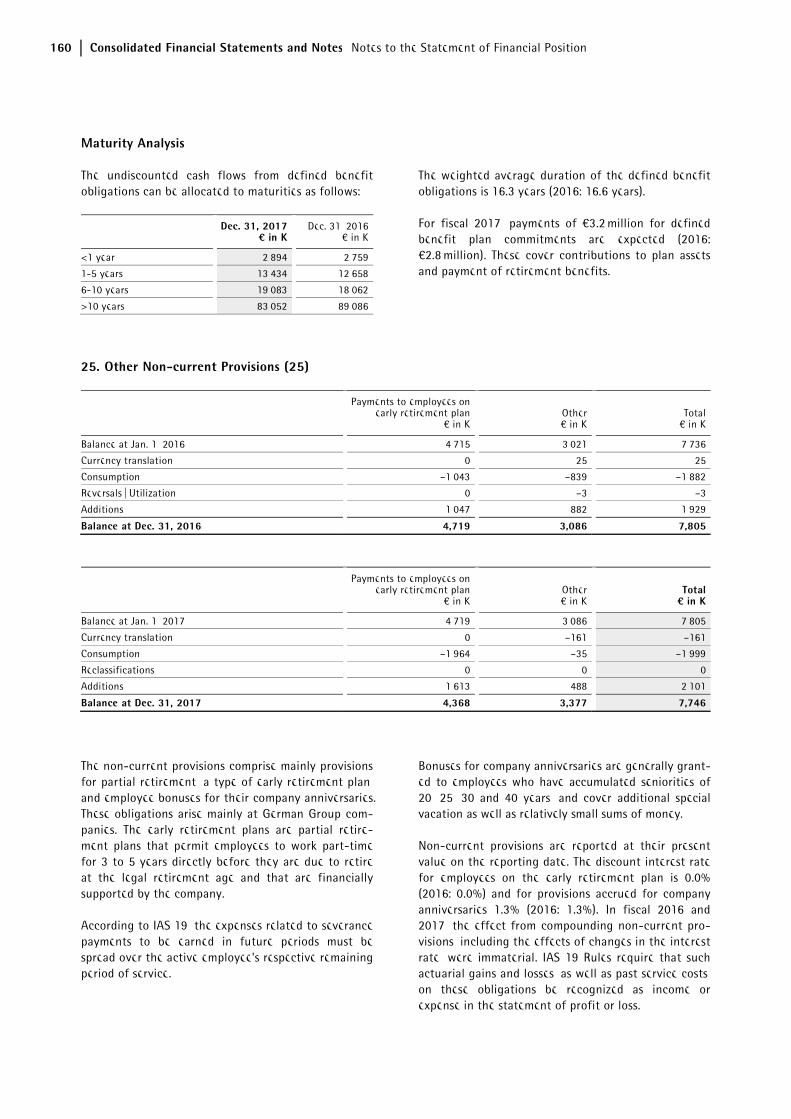
160 Consolidated Financial Statements and Notes Notes to the Statement of Financial Position
Maturity Analysis
The undiscounted cash flows from defined benefit obligations can be allocated to maturities as follows:
Dec. 31, 2017¤ in K
Dec. 31, 2016€ in K
<1 year 2,894 2,759
1-5 years 13,434 12,658
6-10 years 19,083 18,062
>10 years 83,052 89,086
The weighted average duration of the defined benefit obligations is 16.3 years (2016: 16.6 years).
For fiscal 2017, payments of €3.2 million for defined benefit plan commitments are expected (2016: €2.8 million). These cover contributions to plan assets and payment of retirement benefits.
25. Other Non-current Provisions (25)
Payments to employees onearly retirement plan
€ in KOther€ in K
Total€ in K
Balance at Jan. 1, 2016 4,715 3,021 7,736
Currency translation 0 25 25
Consumption –1,043 –839 –1,882
Reversals | Utilization 0 –3 –3
Additions 1,047 882 1,929
Balance at Dec. 31, 2016 4,719 3,086 7,805
Payments to employees onearly retirement plan
€ in KOther€ in K
Total¤ in K
Balance at Jan. 1, 2017 4,719 3,086 7,805
Currency translation 0 –161 –161
Consumption –1,964 –35 –1,999
Reclassifications 0 0 0
Additions 1,613 488 2,101
Balance at Dec. 31, 2017 4,368 3,377 7,746
The non-current provisions comprise mainly provisions for partial retirement, a type of early retirement plan, and employee bonuses for their company anniversaries. These obligations arise mainly at German Group com-panies. The early retirement plans are partial retire-ment plans that permit employees to work part-time for 3 to 5 years directly before they are due to retire at the legal retirement age and that are financially supported by the company.
According to IAS 19, the expenses related to severance payments to be earned in future periods must be spread over the active employee's respective remaining period of service.
Bonuses for company anniversaries are generally grant-ed to employees who have accumulated seniorities of 20, 25, 30 and 40 years, and cover additional special vacation as well as relatively small sums of money.
Non-current provisions are reported at their present value on the reporting date. The discount interest rate for employees on the early retirement plan is 0.0% (2016: 0.0%) and for provisions accrued for company anniversaries 1.3% (2016: 1.3%). In fiscal 2016 and 2017, the effect from compounding non-current pro-visions, including the effects of changes in the interest rate, were immaterial. IAS 19 Rules require that such actuarial gains and losses, as well as past service costs, on these obligations be recognized as income or expense in the statement of profit or loss.
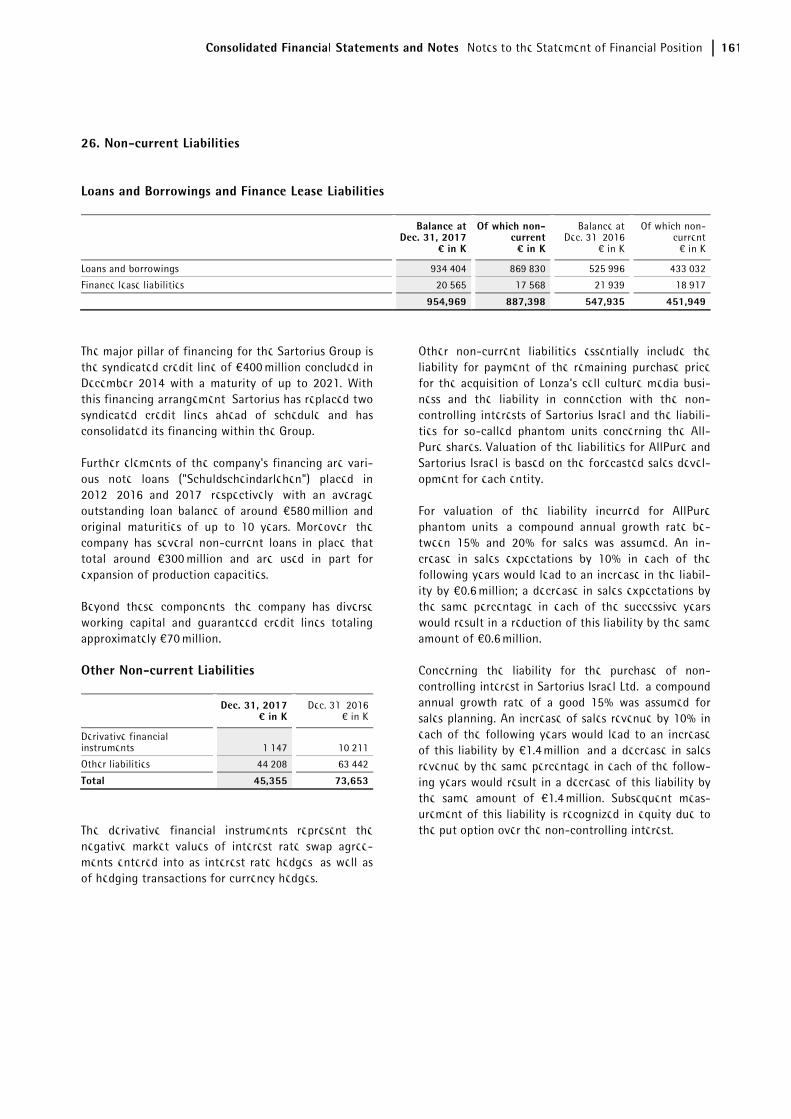
Consolidated Financial Statements and Notes Notes to the Statement of Financial Position 161
26. Non-current Liabilities
Loans and Borrowings and Finance Lease Liabilities
Balance atDec. 31, 2017
¤ in K
Of which non-current¤ in K
Balance atDec. 31, 2016
€ in K
Of which non-current
€ in K
Loans and borrowings 934,404 869,830 525,996 433,032
Finance lease liabilities 20,565 17,568 21,939 18,917
954,969 887,398 547,935 451,949
The major pillar of financing for the Sartorius Group is the syndicated credit line of €400 million concluded in December 2014 with a maturity of up to 2021. With this financing arrangement, Sartorius has replaced two syndicated credit lines ahead of schedule and has consolidated its financing within the Group.
Further elements of the company's financing are vari-ous note loans ("Schuldscheindarlehen") placed in 2012, 2016 and 2017, respectively, with an average outstanding loan balance of around €580 million and original maturities of up to 10 years. Moreover, the company has several non-current loans in place that total around €300 million and are used in part for expansion of production capacities.
Beyond these components, the company has diverse working capital and guaranteed credit lines totaling approximately €70 million.
Other Non-current Liabilities
Dec. 31, 2017¤ in K
Dec. 31, 2016€ in K
Derivative financial instruments 1,147 10,211
Other liabilities 44,208 63,442
Total 45,355 73,653
The derivative financial instruments represent the negative market values of interest rate swap agree-ments entered into as interest rate hedges, as well as of hedging transactions for currency hedges.
Other non-current liabilities essentially include the liability for payment of the remaining purchase price for the acquisition of Lonza's cell culture media busi-ness and the liability in connection with the non-controlling interests of Sartorius Israel and the liabili-ties for so-called phantom units concerning the All-Pure shares. Valuation of the liabilities for AllPure and Sartorius Israel is based on the forecasted sales devel-opment for each entity.
For valuation of the liability incurred for AllPure phantom units, a compound annual growth rate be-tween 15% and 20% for sales was assumed. An in-crease in sales expectations by 10% in each of the following years would lead to an increase in the liabil-ity by €0.6 million; a decrease in sales expectations by the same percentage in each of the successive years would result in a reduction of this liability by the same amount of €0.6 million.
Concerning the liability for the purchase of non-controlling interest in Sartorius Israel Ltd., a compound annual growth rate of a good 15% was assumed for sales planning. An increase of sales revenue by 10% in each of the following years would lead to an increase of this liability by €1.4 million, and a decrease in sales revenue by the same percentage in each of the follow-ing years would result in a decrease of this liability by the same amount of €1.4 million. Subsequent meas-urement of this liability is recognized in equity due to the put option over the non-controlling interest.
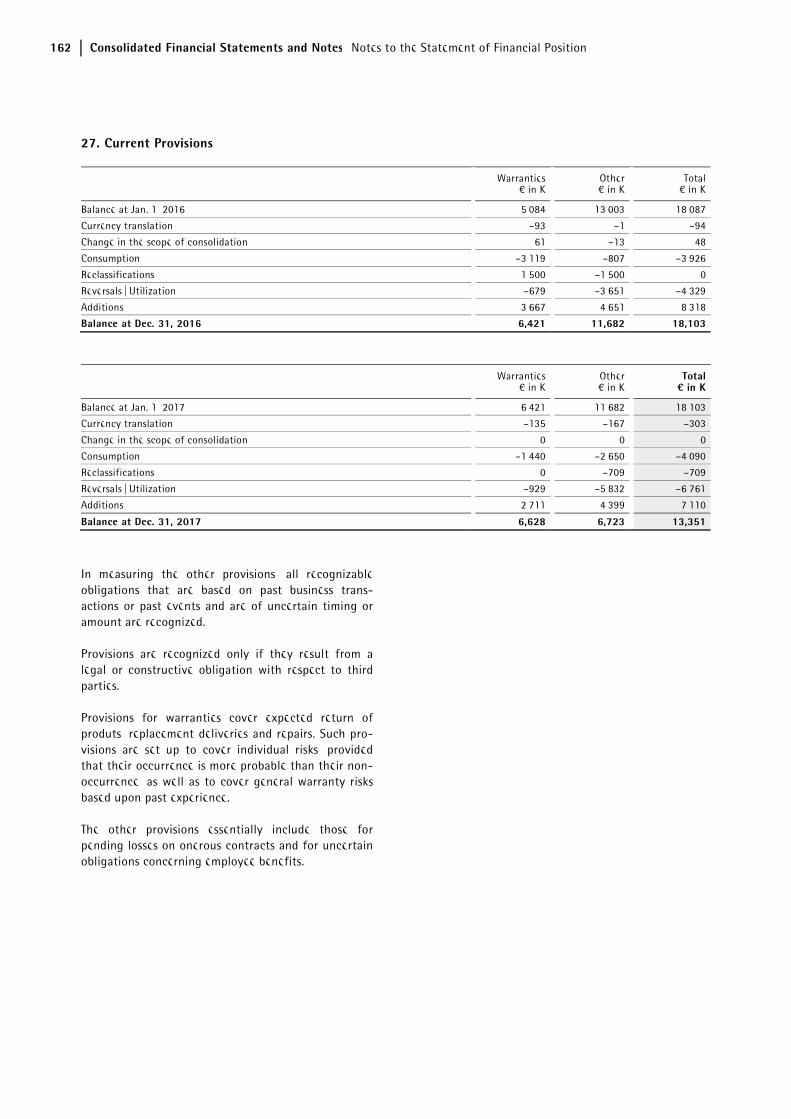
162 Consolidated Financial Statements and Notes Notes to the Statement of Financial Position
27. Current Provisions
Warranties€ in K
Other€ in K
Total€ in K
Balance at Jan. 1, 2016 5,084 13,003 18,087
Currency translation –93 –1 –94
Change in the scope of consolidation 61 –13 48
Consumption –3,119 –807 –3,926
Reclassifications 1,500 –1,500 0
Reversals | Utilization –679 –3,651 –4,329
Additions 3,667 4,651 8,318
Balance at Dec. 31, 2016 6,421 11,682 18,103
Warranties€ in K
Other€ in K
Total¤ in K
Balance at Jan. 1, 2017 6,421 11,682 18,103
Currency translation –135 –167 –303
Change in the scope of consolidation 0 0 0
Consumption –1,440 –2,650 –4,090
Reclassifications 0 –709 –709
Reversals | Utilization –929 –5,832 –6,761
Additions 2,711 4,399 7,110
Balance at Dec. 31, 2017 6,628 6,723 13,351
In measuring the other provisions, all recognizable obligations that are based on past business trans-actions or past events and are of uncertain timing or amount are recognized.
Provisions are recognized only if they result from a legal or constructive obligation with respect to third parties.
Provisions for warranties cover expected return of produts, replacement deliveries and repairs. Such pro-visions are set up to cover individual risks, provided that their occurrence is more probable than their non-occurrence, as well as to cover general warranty risks based upon past experience.
The other provisions essentially include those for pending losses on onerous contracts and for uncertain obligations concerning employee benefits.
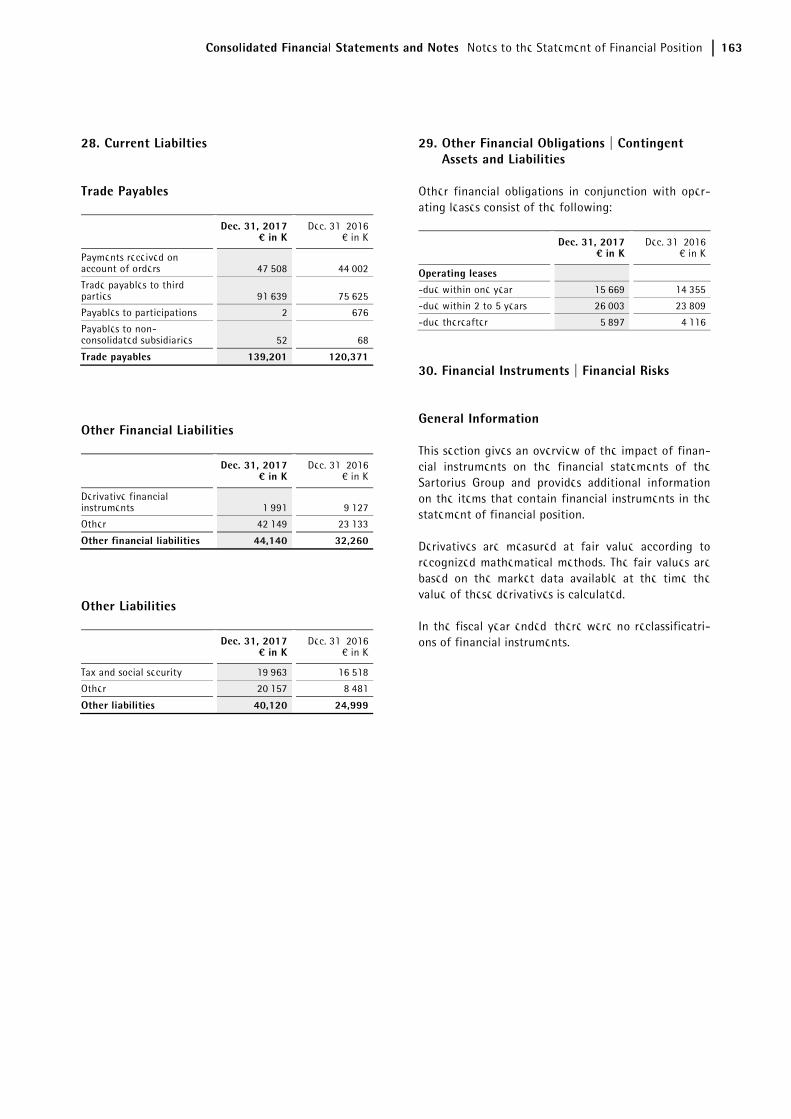
Consolidated Financial Statements and Notes Notes to the Statement of Financial Position 163
28. Current Liabilties
Trade Payables
Dec. 31, 2017¤ in K
Dec. 31, 2016€ in K
Payments received on account of orders 47,508 44,002
Trade payables to third parties 91,639 75,625
Payables to participations 2 676
Payables to non-consolidated subsidiaries 52 68
Trade payables 139,201 120,371
Other Financial Liabilities
Dec. 31, 2017¤ in K
Dec. 31, 2016€ in K
Derivative financial instruments 1,991 9,127
Other 42,149 23,133
Other financial liabilities 44,140 32,260
Other Liabilities
Dec. 31, 2017¤ in K
Dec. 31, 2016€ in K
Tax and social security 19,963 16,518
Other 20,157 8,481
Other liabilities 40,120 24,999
29. Other Financial Obligations | Contingent Assets and Liabilities
Other financial obligations in conjunction with oper-ating leases consist of the following:
Dec. 31, 2017¤ in K
Dec. 31, 2016€ in K
Operating leases -due within one year 15,669 14,355
-due within 2 to 5 years 26,003 23,809
-due thereafter 5,897 4,116
30. Financial Instruments | Financial Risks
General Information
This section gives an overview of the impact of finan-cial instruments on the financial statements of the Sartorius Group and provides additional information on the items that contain financial instruments in the statement of financial position.
Derivatives are measured at fair value according to recognized mathematical methods. The fair values are based on the market data available at the time the value of these derivatives is calculated.
In the fiscal year ended, there were no reclassificatri-ons of financial instruments.
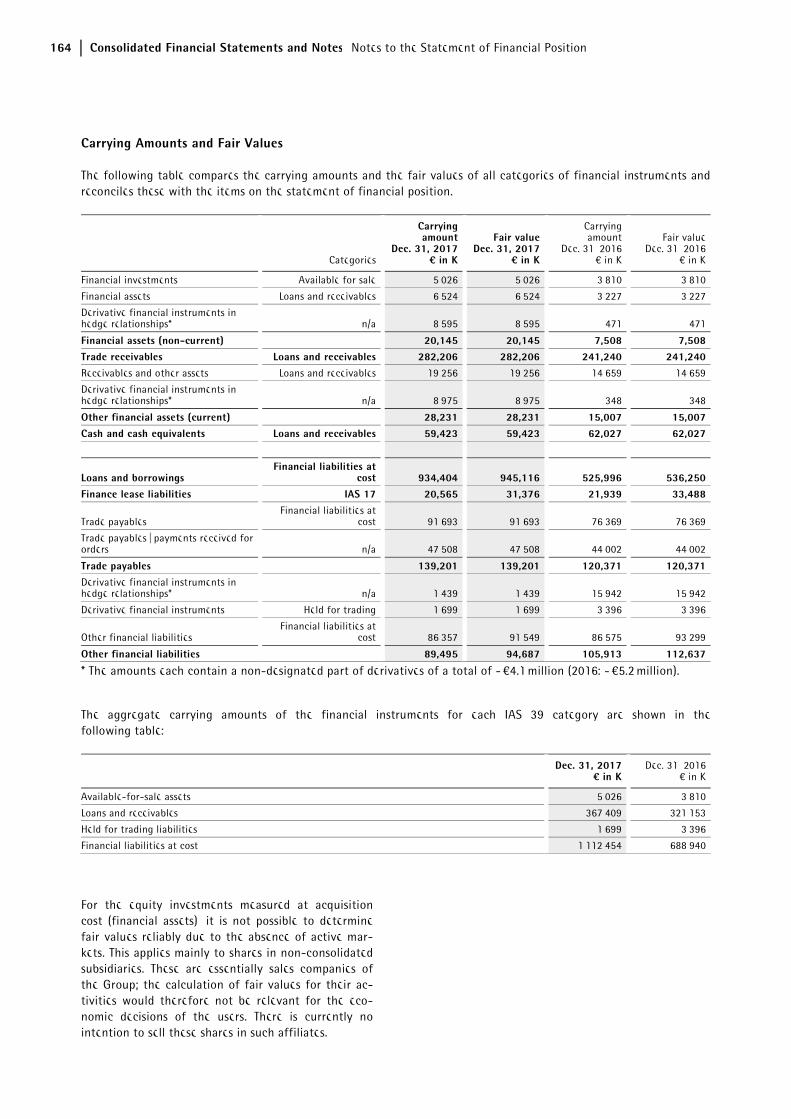
164 Consolidated Financial Statements and Notes Notes to the Statement of Financial Position
Carrying Amounts and Fair Values
The following table compares the carrying amounts and the fair values of all categories of financial instruments and reconciles these with the items on the statement of financial position.
Categories
Carrying amount
Dec. 31, 2017¤ in K
Fair valueDec. 31, 2017
¤ in K
Carrying amount
Dec. 31, 2016€ in K
Fair valueDec. 31, 2016
€ in K
Financial investments Available for sale 5,026 5,026 3,810 3,810
Financial assets Loans and receivables 6,524 6,524 3,227 3,227
Derivative financial instruments in hedge relationships* n/a 8,595 8,595 471 471
Financial assets (non-current) 20,145 20,145 7,508 7,508Trade receivables Loans and receivables 282,206 282,206 241,240 241,240Receivables and other assets Loans and receivables 19,256 19,256 14,659 14,659
Derivative financial instruments in hedge relationships* n/a 8,975 8,975 348 348
Other financial assets (current) 28,231 28,231 15,007 15,007Cash and cash equivalents Loans and receivables 59,423 59,423 62,027 62,027
Loans and borrowings Financial liabilities at
cost 934,404 945,116 525,996 536,250Finance lease liabilities IAS 17 20,565 31,376 21,939 33,488
Trade payables Financial liabilities at
cost 91,693 91,693 76,369 76,369
Trade payables | payments received for orders n/a 47,508 47,508 44,002 44,002
Trade payables 139,201 139,201 120,371 120,371Derivative financial instruments in hedge relationships* n/a 1,439 1,439 15,942 15,942
Derivative financial instruments Held for trading 1,699 1,699 3,396 3,396
Other financial liabilities Financial liabilities at
cost 86,357 91,549 86,575 93,299
Other financial liabilities 89,495 94,687 105,913 112,637
* The amounts each contain a non-designated part of derivatives of a total of - €4.1 million (2016: - €5.2 million).
The aggregate carrying amounts of the financial instruments for each IAS 39 category are shown in the following table:
Dec. 31, 2017¤ in K
Dec. 31, 2016€ in K
Available-for-sale assets 5,026 3,810
Loans and receivables 367,409 321,153
Held for trading liabilities 1,699 3,396
Financial liabilities at cost 1,112,454 688,940
For the equity investments measured at acquisition cost (financial assets), it is not possible to determine fair values reliably due to the absence of active mar-kets. This applies mainly to shares in non-consolidated subsidiaries. These are essentially sales companies of the Group; the calculation of fair values for their ac-tivities would therefore not be relevant for the eco-nomic decisions of the users. There is currently no intention to sell these shares in such affiliates.
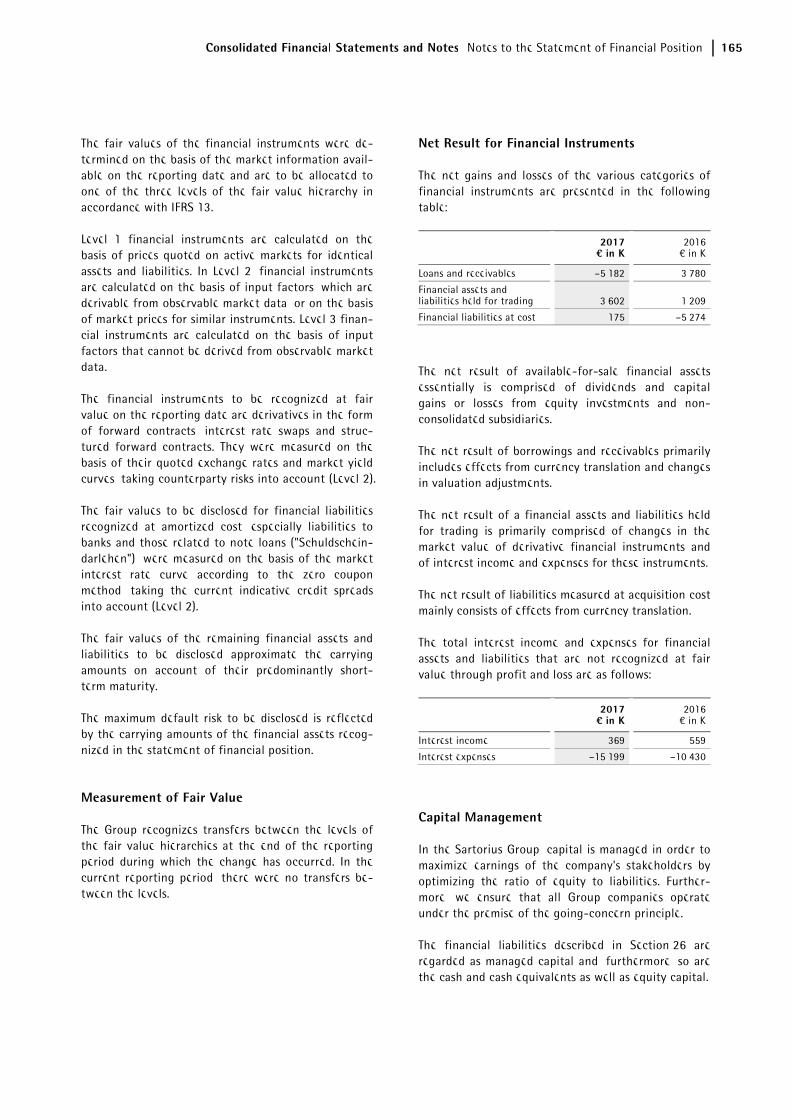
Consolidated Financial Statements and Notes Notes to the Statement of Financial Position 165
The fair values of the financial instruments were de-termined on the basis of the market information avail-able on the reporting date and are to be allocated to one of the three levels of the fair value hierarchy in accordance with IFRS 13.
Level 1 financial instruments are calculated on the basis of prices quoted on active markets for identical assets and liabilities. In Level 2, financial instruments are calculated on the basis of input factors, which are derivable from observable market data, or on the basis of market prices for similar instruments. Level 3 finan-cial instruments are calculated on the basis of input factors that cannot be derived from observable market data.
The financial instruments to be recognized at fair value on the reporting date are derivatives in the form of forward contracts, interest rate swaps and struc-tured forward contracts. They were measured on the basis of their quoted exchange rates and market yield curves, taking counterparty risks into account (Level 2).
The fair values to be disclosed for financial liabilities recognized at amortized cost, especially liabilities to banks and those related to note loans ("Schuldschein-darlehen"), were measured on the basis of the market interest rate curve according to the zero coupon method, taking the current indicative credit spreads into account (Level 2).
The fair values of the remaining financial assets and liabilities to be disclosed approximate the carrying amounts on account of their predominantly short-term maturity.
The maximum default risk to be disclosed is reflected by the carrying amounts of the financial assets recog-nized in the statement of financial position.
Measurement of Fair Value
The Group recognizes transfers between the levels of the fair value hierarchies at the end of the reporting period during which the change has occurred. In the current reporting period, there were no transfers be-tween the levels.
Net Result for Financial Instruments
The net gains and losses of the various categories of financial instruments are presented in the following table:
2017¤ in K
2016€ in K
Loans and receivables –5,182 3,780
Financial assets and liabilities held for trading 3,602 1,209
Financial liabilities at cost 175 –5,274
The net result of available-for-sale financial assets essentially is comprised of dividends and capital gains or losses from equity investments and non-consolidated subsidiaries.
The net result of borrowings and receivables primarily includes effects from currency translation and changes in valuation adjustments.
The net result of a financial assets and liabilities held for trading is primarily comprised of changes in the market value of derivative financial instruments and of interest income and expenses for these instruments.
The net result of liabilities measured at acquisition cost mainly consists of effects from currency translation.
The total interest income and expenses for financial assets and liabilities that are not recognized at fair value through profit and loss are as follows:
2017¤ in K
2016€ in K
Interest income 369 559
Interest expenses –15,199 –10,430
Capital Management
In the Sartorius Group, capital is managed in order to maximize earnings of the company's stakeholders by optimizing the ratio of equity to liabilities. Further-more, we ensure that all Group companies operate under the premise of the going-concern principle.
The financial liabilities described in Section 26 are regarded as managed capital and, furthermore, so are the cash and cash equivalents as well as equity capital.
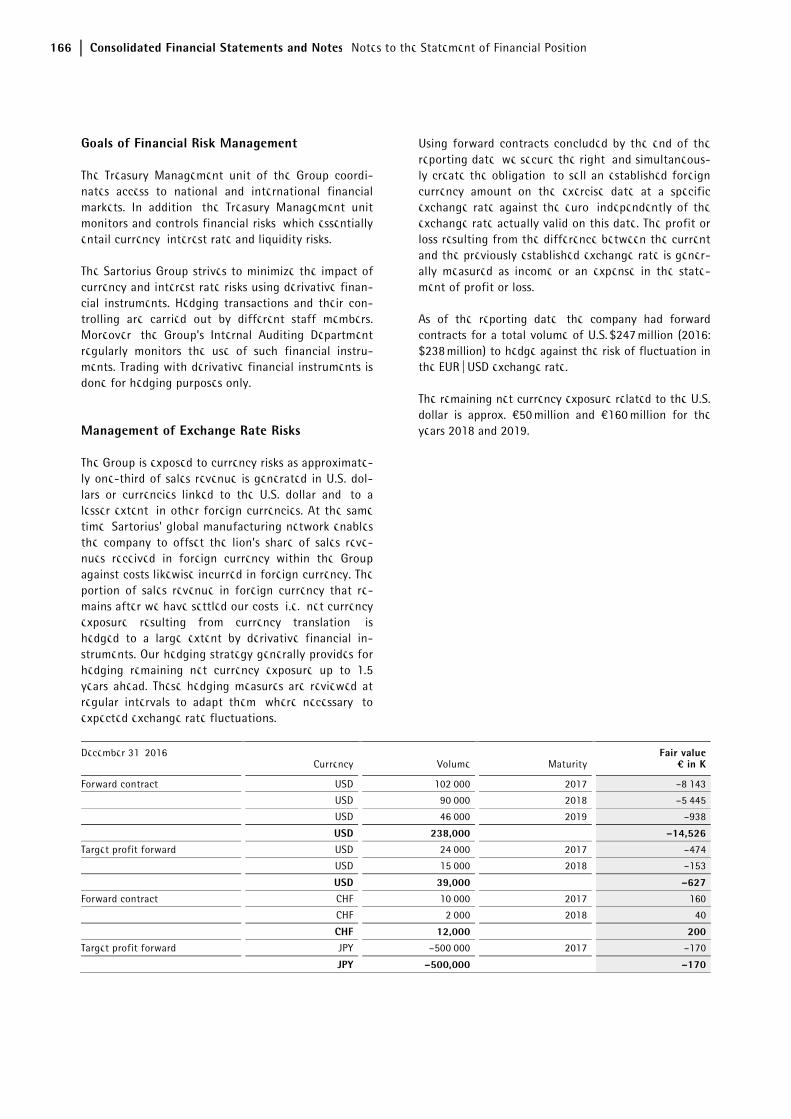
166 Consolidated Financial Statements and Notes Notes to the Statement of Financial Position
Goals of Financial Risk Management
The Treasury Management unit of the Group coordi-nates access to national and international financial markets. In addition, the Treasury Management unit monitors and controls financial risks, which essentially entail currency, interest rate and liquidity risks.
The Sartorius Group strives to minimize the impact of currency and interest rate risks using derivative finan-cial instruments. Hedging transactions and their con-trolling are carried out by different staff members. Moreover, the Group’s Internal Auditing Department regularly monitors the use of such financial instru-ments. Trading with derivative financial instruments is done for hedging purposes only.
Management of Exchange Rate Risks
The Group is exposed to currency risks as approximate-ly one-third of sales revenue is generated in U.S. dol-lars or currencies linked to the U.S. dollar and, to a lesser extent, in other foreign currencies. At the same time, Sartorius' global manufacturing network enables the company to offset the lion’s share of sales reve-nues received in foreign currency within the Group against costs likewise incurred in foreign currency. The portion of sales revenue in foreign currency that re-mains after we have settled our costs, i.e., net currency exposure resulting from currency translation, is hedged to a large extent by derivative financial in-struments. Our hedging strategy generally provides for hedging remaining net currency exposure up to 1.5 years ahead. These hedging measures are reviewed at regular intervals to adapt them, where necessary, to expected exchange rate fluctuations.
Using forward contracts concluded by the end of the reporting date, we secure the right, and simultaneous-ly create the obligation, to sell an established foreign currency amount on the exercise date at a specific exchange rate against the euro, independently of the exchange rate actually valid on this date. The profit or loss resulting from the difference between the current and the previously established exchange rate is gener-ally measured as income or an expense in the state-ment of profit or loss.
As of the reporting date, the company had forward contracts for a total volume of U.S. $247 million (2016: $238 million) to hedge against the risk of fluctuation in the EUR | USD exchange rate.
The remaining net currency exposure related to the U.S. dollar is approx. €50 million and €160 million for the years 2018 and 2019.
December 31, 2016 Currency Volume Maturity
Fair value¤ in K
Forward contract USD 102,000 2017 –8,143
USD 90,000 2018 –5,445
USD 46,000 2019 –938
USD 238,000 –14,526 Target profit forward USD 24,000 2017 –474
USD 15,000 2018 –153
USD 39,000 –627 Forward contract CHF 10,000 2017 160
CHF 2,000 2018 40
CHF 12,000 200 Target profit forward JPY –500,000 2017 –170
JPY –500,000 –170
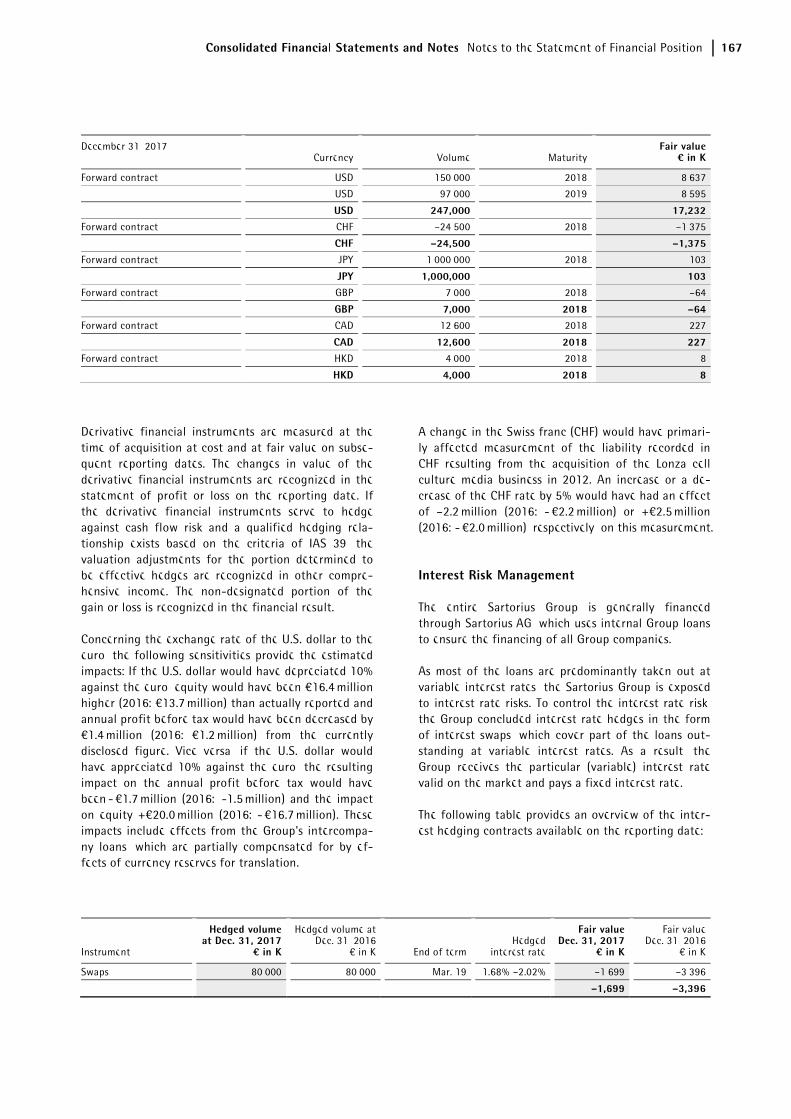
Consolidated Financial Statements and Notes Notes to the Statement of Financial Position 167
December 31, 2017 Currency Volume Maturity
Fair value¤ in K
Forward contract USD 150,000 2018 8,637
USD 97,000 2019 8,595
USD 247,000 17,232Forward contract CHF –24,500 2018 –1,375
CHF –24,500 –1,375Forward contract JPY 1,000,000 2018 103
JPY 1,000,000 103Forward contract GBP 7,000 2018 –64
GBP 7,000 2018 –64Forward contract CAD 12,600 2018 227
CAD 12,600 2018 227Forward contract HKD 4,000 2018 8
HKD 4,000 2018 8
Derivative financial instruments are measured at the time of acquisition at cost and at fair value on subse-quent reporting dates. The changes in value of the derivative financial instruments are recognized in the statement of profit or loss on the reporting date. If the derivative financial instruments serve to hedge against cash flow risk and a qualified hedging rela-tionship exists based on the criteria of IAS 39, the valuation adjustments for the portion determined to be effective hedges are recognized in other compre-hensive income. The non-designated portion of the gain or loss is recognized in the financial result.
Concerning the exchange rate of the U.S. dollar to the euro, the following sensitivities provide the estimated impacts: If the U.S. dollar would have depreciated 10% against the euro, equity would have been €16.4 million higher (2016: €13.7 million) than actually reported and annual profit before tax would have been decreased by €1.4 million (2016: €1.2 million) from the currently disclosed figure. Vice versa, if the U.S. dollar would have appreciated 10% against the euro, the resulting impact on the annual profit before tax would have been - €1.7 million (2016: -1.5 million) and the impact on equity +€20.0 million (2016: - €16.7 million). These impacts include effects from the Group's intercompa-ny loans, which are partially compensated for by ef-fects of currency reserves for translation.
A change in the Swiss franc (CHF) would have primari-ly affected measurement of the liability recorded in CHF resulting from the acquisition of the Lonza cell culture media business in 2012. An increase or a de-crease of the CHF rate by 5% would have had an effect of –2.2 million (2016: - €2.2 million) or +€2.5 million (2016: - €2.0 million), respectively, on this measurement.
Interest Risk Management
The entire Sartorius Group is generally financed through Sartorius AG, which uses internal Group loans to ensure the financing of all Group companies.
As most of the loans are predominantly taken out at variable interest rates, the Sartorius Group is exposed to interest rate risks. To control the interest rate risk, the Group concluded interest rate hedges in the form of interest swaps, which cover part of the loans out-standing at variable interest rates. As a result, the Group receives the particular (variable) interest rate valid on the market and pays a fixed interest rate.
The following table provides an overview of the inter-est hedging contracts available on the reporting date:
Instrument
Hedged volume at Dec. 31, 2017
¤ in K
Hedged volume at Dec. 31, 2016
€ in K End of termHedged
interest rate
Fair valueDec. 31, 2017
¤ in K
Fair value Dec. 31, 2016
€ in K
Swaps 80,000 80,000 Mar. 19 1.68% –2.02% –1,699 –3,396
–1,699 –3,396
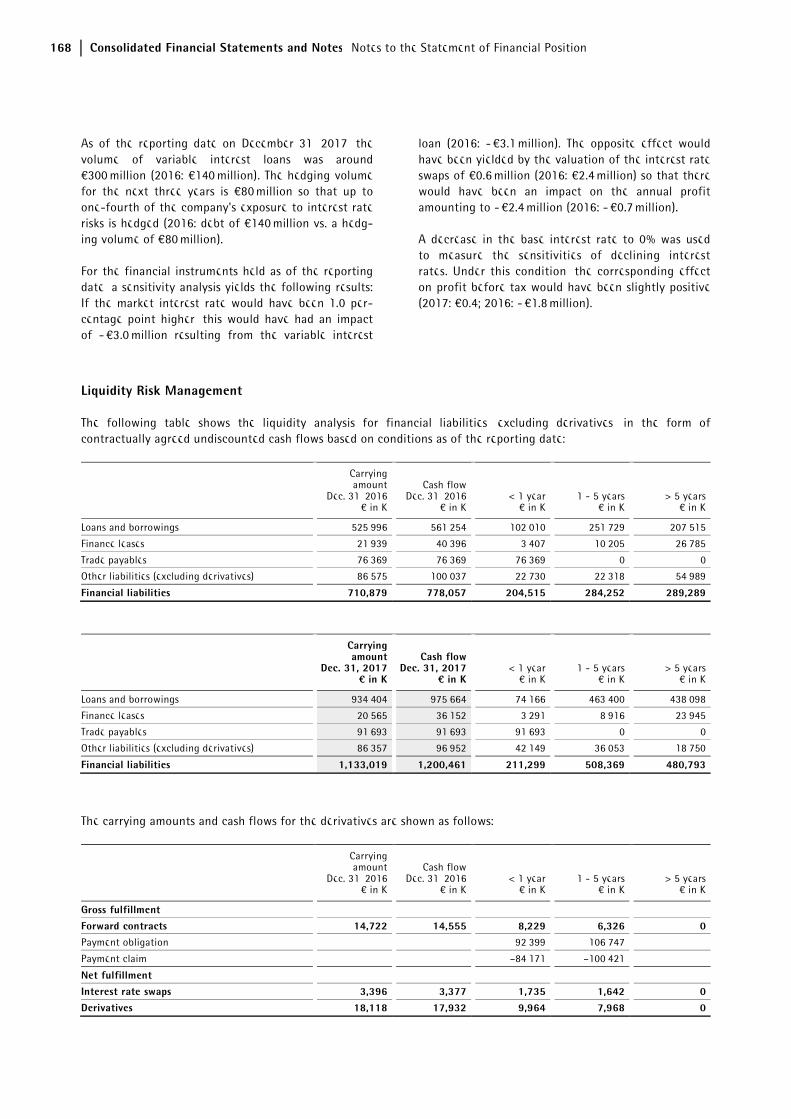
168 Consolidated Financial Statements and Notes Notes to the Statement of Financial Position
As of the reporting date on December 31, 2017, the volume of variable interest loans was around €300 million (2016: €140 million). The hedging volume for the next three years is €80 million so that up to one-fourth of the company's exposure to interest rate risks is hedged (2016: debt of €140 million vs. a hedg-ing volume of €80 million).
For the financial instruments held as of the reporting date, a sensitivity analysis yields the following results: If the market interest rate would have been 1.0 per-centage point higher, this would have had an impact of - €3.0 million resulting from the variable interest
loan (2016: - €3.1 million). The opposite effect would have been yielded by the valuation of the interest rate swaps of €0.6 million (2016: €2.4 million) so that there would have been an impact on the annual profit amounting to - €2.4 million (2016: - €0.7 million).
A decrease in the base interest rate to 0% was used to measure the sensitivities of declining interest rates. Under this condition, the corresponding effect on profit before tax would have been slightly positive (2017: €0.4; 2016: - €1.8 million).
Liquidity Risk Management
The following table shows the liquidity analysis for financial liabilities, excluding derivatives, in the form of contractually agreed undiscounted cash flows based on conditions as of the reporting date:
Carrying amount
Dec. 31, 2016€ in K
Cash flowDec. 31, 2016
€ in K< 1 year
€ in K1 - 5 years
€ in K> 5 years
€ in K
Loans and borrowings 525,996 561,254 102,010 251,729 207,515
Finance leases 21,939 40,396 3,407 10,205 26,785
Trade payables 76,369 76,369 76,369 0 0
Other liabilities (excluding derivatives) 86,575 100,037 22,730 22,318 54,989
Financial liabilities 710,879 778,057 204,515 284,252 289,289
Carrying amount
Dec. 31, 2017¤ in K
Cash flowDec. 31, 2017
¤ in K< 1 year
€ in K1 - 5 years
€ in K> 5 years
€ in K
Loans and borrowings 934,404 975,664 74,166 463,400 438,098
Finance leases 20,565 36,152 3,291 8,916 23,945
Trade payables 91,693 91,693 91,693 0 0
Other liabilities (excluding derivatives) 86,357 96,952 42,149 36,053 18,750
Financial liabilities 1,133,019 1,200,461 211,299 508,369 480,793
The carrying amounts and cash flows for the derivatives are shown as follows:
Carrying amount
Dec. 31, 2016€ in K
Cash flowDec. 31, 2016
€ in K< 1 year
€ in K1 - 5 years
€ in K> 5 years
€ in K
Gross fulfillment Forward contracts 14,722 14,555 8,229 6,326 0Payment obligation 92,399 106,747
Payment claim –84,171 –100,421
Net fulfillment Interest rate swaps 3,396 3,377 1,735 1,642 0Derivatives 18,118 17,932 9,964 7,968 0
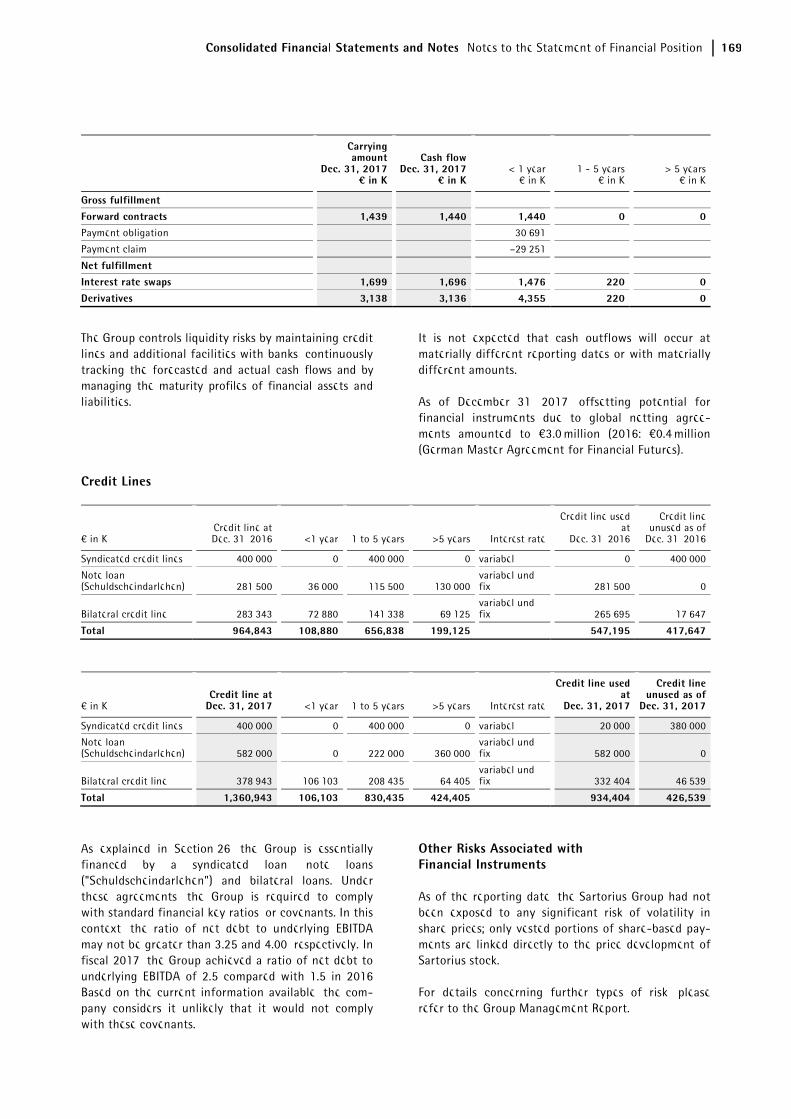
Consolidated Financial Statements and Notes Notes to the Statement of Financial Position 169
Carrying amount
Dec. 31, 2017¤ in K
Cash flowDec. 31, 2017
¤ in K< 1 year
€ in K1 - 5 years
€ in K> 5 years
€ in K
Gross fulfillment
Forward contracts 1,439 1,440 1,440 0 0Payment obligation 30,691
Payment claim –29,251
Net fulfillment Interest rate swaps 1,699 1,696 1,476 220 0
Derivatives 3,138 3,136 4,355 220 0
The Group controls liquidity risks by maintaining credit lines and additional facilities with banks, continuously tracking the forecasted and actual cash flows and by managing the maturity profiles of financial assets and liabilities.
It is not expected that cash outflows will occur at materially different reporting dates or with materially different amounts.
As of December 31, 2017, offsetting potential for financial instruments due to global netting agree-ments amounted to €3.0 million (2016: €0.4 million (German Master Agreement for Financial Futures).
Credit Lines
€ in K Credit line atDec. 31, 2016 <1 year 1 to 5 years >5 years Interest rate
Credit line used at
Dec. 31, 2016
Credit lineunused as of
Dec. 31, 2016
Syndicated credit lines 400,000 0 400,000 0 variabel 0 400,000
Note loan (Schuldscheindarlehen) 281,500 36,000 115,500 130,000
variabel und fix 281,500 0
Bilateral credit line 283,343 72,880 141,338 69,125variabel und fix 265,695 17,647
Total 964,843 108,880 656,838 199,125 547,195 417,647
€ in K Credit line at
Dec. 31, 2017 <1 year 1 to 5 years >5 years Interest rate
Credit line used at
Dec. 31, 2017
Credit lineunused as of
Dec. 31, 2017
Syndicated credit lines 400,000 0 400,000 0 variabel 20,000 380,000
Note loan (Schuldscheindarlehen) 582,000 0 222,000 360,000
variabel und fix 582,000 0
Bilateral credit line 378,943 106,103 208,435 64,405variabel und fix 332,404 46,539
Total 1,360,943 106,103 830,435 424,405 934,404 426,539
As explained in Section 26, the Group is essentially financed by a syndicated loan, note loans ("Schuldscheindarlehen") and bilateral loans. Under these agreements, the Group is required to comply with standard financial key ratios, or covenants. In this context, the ratio of net debt to underlying EBITDA may not be greater than 3.25 and 4.00, respectively. In fiscal 2017, the Group achieved a ratio of net debt to underlying EBITDA of 2.5 compared with 1.5 in 2016 Based on the current information available, the com-pany considers it unlikely that it would not comply with these covenants.
Other Risks Associated with Financial Instruments
As of the reporting date, the Sartorius Group had not been exposed to any significant risk of volatility in share prices; only vested portions of share-based pay-ments are linked directly to the price development of Sartorius stock.
For details concerning further types of risk, please refer to the Group Management Report.
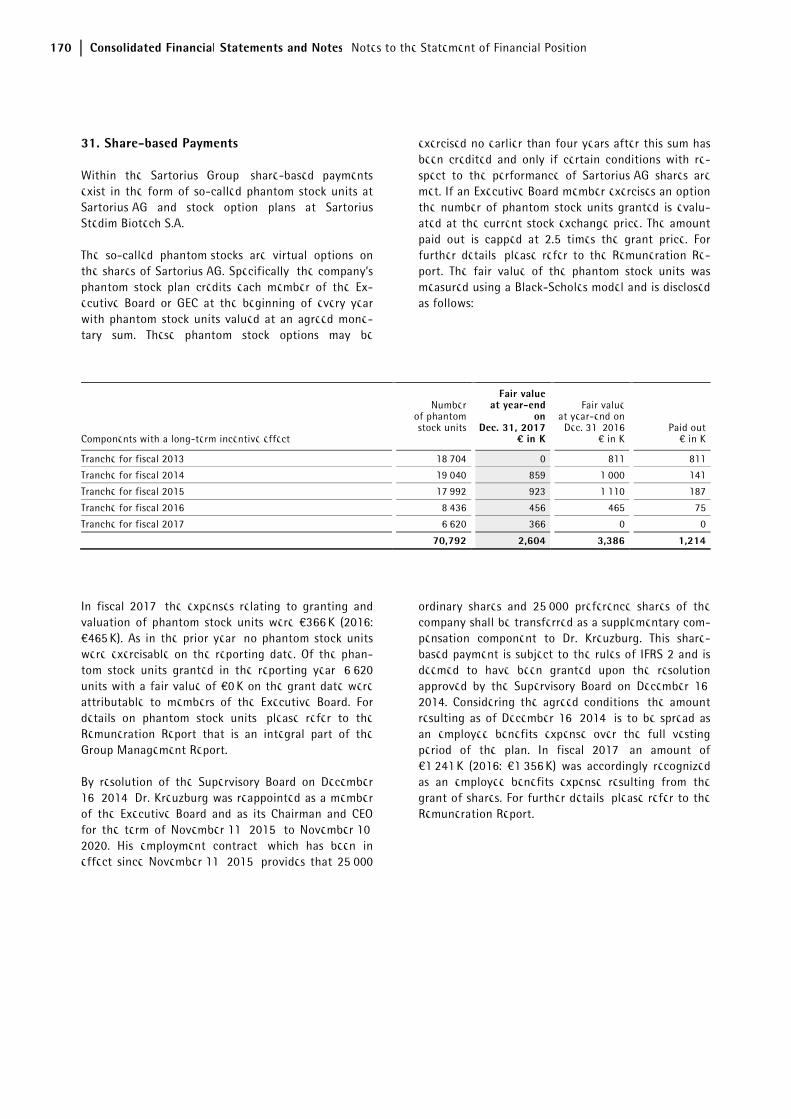
170 Consolidated Financial Statements and Notes Notes to the Statement of Financial Position
31. Share-based Payments
Within the Sartorius Group, share-based payments exist in the form of so-called phantom stock units at Sartorius AG and stock option plans at Sartorius Stedim Biotech S.A.
The so-called phantom stocks are virtual options on the shares of Sartorius AG. Specifically, the company’s phantom stock plan credits each member of the Ex-ecutive Board or GEC at the beginning of every year with phantom stock units valued at an agreed mone-tary sum. These phantom stock options may be
exercised no earlier than four years after this sum has been credited and only if certain conditions with re-spect to the performance of Sartorius AG shares are met. If an Executive Board member exercises an option, the number of phantom stock units granted is evalu-ated at the current stock exchange price. The amount paid out is capped at 2.5 times the grant price. For further details, please refer to the Remuneration Re-port. The fair value of the phantom stock units was measured using a Black-Scholes model and is disclosed as follows:
Components with a long-term incentive effect
Numberof phantom stock units
Fair valueat year-end
onDec. 31, 2017
¤ in K
Fair valueat year-end on
Dec. 31, 2016€ in K
Paid out€ in K
Tranche for fiscal 2013 18,704 0 811 811
Tranche for fiscal 2014 19,040 859 1,000 141
Tranche for fiscal 2015 17,992 923 1,110 187
Tranche for fiscal 2016 8,436 456 465 75
Tranche for fiscal 2017 6,620 366 0 0
70,792 2,604 3,386 1,214
In fiscal 2017, the expenses relating to granting and valuation of phantom stock units were €366 K (2016: €465 K). As in the prior year, no phantom stock units were exercisable on the reporting date. Of the phan-tom stock units granted in the reporting year, 6,620 units with a fair value of €0 K on the grant date were attributable to members of the Executive Board. For details on phantom stock units, please refer to the Remuneration Report that is an integral part of the Group Management Report.
By resolution of the Supervisory Board on December 16, 2014, Dr. Kreuzburg was reappointed as a member of the Executive Board and as its Chairman and CEO for the term of November 11, 2015, to November 10, 2020. His employment contract, which has been in effect since November 11, 2015, provides that 25,000
ordinary shares and 25,000 preference shares of the company shall be transferred as a supplementary com-pensation component to Dr. Kreuzburg. This share-based payment is subject to the rules of IFRS 2 and is deemed to have been granted upon the resolution approved by the Supervisory Board on December 16, 2014. Considering the agreed conditions, the amount resulting as of December 16, 2014, is to be spread as an employee benefits expense over the full vesting period of the plan. In fiscal 2017, an amount of €1,241 K (2016: €1,356 K) was accordingly recognized as an employee benefits expense resulting from the grant of shares. For further details, please refer to the Remuneration Report.
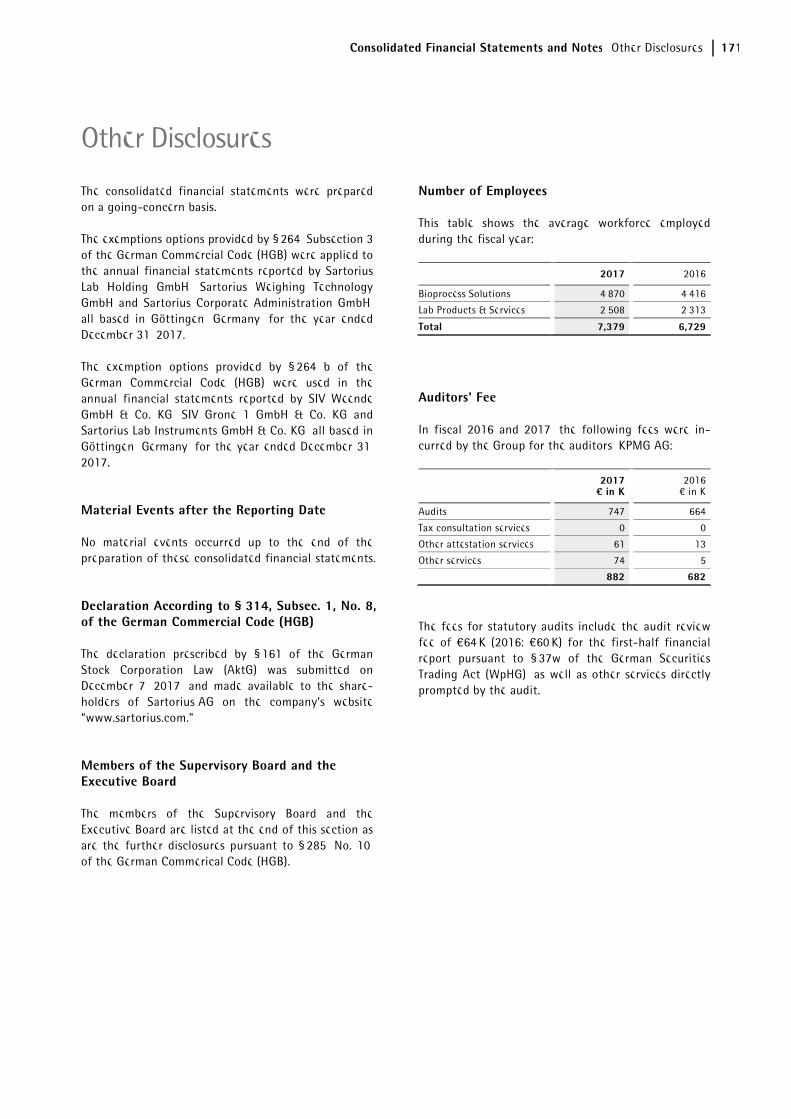
Consolidated Financial Statements and Notes Other Disclosures 171
The consolidated financial statements were prepared on a going-concern basis.
The exemptions options provided by § 264, Subsection 3, of the German Commercial Code (HGB) were applied to the annual financial statements reported by Sartorius Lab Holding GmbH, Sartorius Weighing Technology GmbH and Sartorius Corporate Administration GmbH, all based in Göttingen, Germany, for the year ended December 31, 2017.
The exemption options provided by § 264 b of the German Commercial Code (HGB) were used in the annual financial statements reported by SIV Weende GmbH & Co. KG, SIV Grone 1 GmbH & Co. KG and Sartorius Lab Instruments GmbH & Co. KG, all based in Göttingen, Germany, for the year ended December 31, 2017.
Material Events after the Reporting Date
No material events occurred up to the end of the preparation of these consolidated financial statements.
Declaration According to § 314, Subsec. 1, No. 8, of the German Commercial Code (HGB)
The declaration prescribed by § 161 of the German Stock Corporation Law (AktG) was submitted on December 7, 2017, and made available to the share-holders of Sartorius AG on the company’s website “www.sartorius.com."
Members of the Supervisory Board and the Executive Board
The members of the Supervisory Board and the Executive Board are listed at the end of this section as are the further disclosures pursuant to § 285, No. 10, of the German Commerical Code (HGB).
Number of Employees
This table shows the average workforce employed during the fiscal year:
2017 2016
Bioprocess Solutions 4,870 4,416
Lab Products & Services 2,508 2,313
Total 7,379 6,729
Auditors' Fee
In fiscal 2016 and 2017, the following fees were in-curred by the Group for the auditors, KPMG AG:
2017¤ in K
2016€ in K
Audits 747 664
Tax consultation services 0 0
Other attestation services 61 13
Other services 74 5
882 682
The fees for statutory audits include the audit review fee of €64 K (2016: €60 K) for the first-half financial report pursuant to § 37w of the German Securities Trading Act (WpHG), as well as other services directly prompted by the audit.
Other Disclosures
172 Consolidated Financial Statements and Notes Other Disclosures
Related Companies and Persons
The Group companies included in the consolidated financial statements carry out business activities and transactions in related party relationships as defined by IAS 24. In particular, this concerns transactions with non-consolidated subsidiaries and are generally concluded according to the customary market terms. A long-term service contract exists with an affiliated company. For this contract, expenses of €7.1 million were incurred and reported in the Statement of Profit or Loss in the reporting year (2016: €5.9 million). Details on the transactions completed in the reporting year and the balances outstanding on the reporting date are provided in the relevant sections of these Notes to the Financial Statements, specifically in Sec-tions 9 and 19.
According to IAS 24, related persons are those who are responsible for planning, management and control of a reporting entity. In particular, such persons include the members of the Executive Board and of the Super-visory Board of Sartorius AG. In particular, such persons include the members of the Executive Board and of the Supervisory Board of Sartorius AG. In the reporting year, the total remuneration of the Supervi-sory Board members was €922 K (2016: €957 K); that of the Executive Board, €3,492 K (2016: €3,299 K). The remuneration of former managing directors and mem-bers of the Executive Board and their surviving de-pendents was €871 K (2016: €498 K). The pension obligations to former managing directors and members of the Executive Board and their surviving dependents totaled €8,098 K (2016: €7,485 K). For details on remuneration, please refer to the Remu-neration Report, which is an integral part of the com-bined Group Management Report. Beyond their Supervisory Board remuneration, the employee repre-sentatives who are employees within the Sartorius Group receive compensation that is not related to their service on the Supervisory Board.
The total remuneration of the Executive Board mem-bers according to IFRS is shown in the following table:
2017¤ in K
2016€ in K
Short-term benefits (excl. share-based remuneration) 2,651 2,522
Post-employment benefits 430 393
Other long-term benefits 375 371
Share-based payments 466 406
Total remuneration 3,922 3,692
Partial payments on multi-year variable remuneration of the Executive Board members:
2017¤ in K
2016€ in K
Balance as of Jan. 1 of a fiscal year 387 311
Partial payments deducted –165 –146
Partial payments effected 169 222
Balance as of Dec. 31 of a fiscal year 391 387
The total remuneration of the Supervisory Board members is as follows:
2017¤ in K
2016€ in K
Short-term benefits (excl. share-based remuneration) 922 957
Post-employment benefits 0 0
Other long-term benefits 0 0
Share-based payments 0 0
Total remuneration 922 957
Proposal for Appropriation of Profits
The Supervisory Board and the Executive Board will submit a proposal to the Annual Shareholders’ Meeting to appropriate the retained profit of €141,864,793.40 reported by Sartorius AG for the year ended December 31, 2017, as follows:
€
Payment of a dividend of €0.50 per ordinary share 17,106,112.00
Payment of a dividend of €0.51 per preference share 17,429,794.68
Unappropriated profit carried forward 107,328,886.72
141,864,793.40
Göttingen, February 5, 2018
Sartorius Aktiengesellschaft
The Executive Board
Consolidated Financial Statements and Notes Declaration of the Executive Board 173
We declare to the best of our knowledge that the consolidated financial statements for fiscal 2017 pre-sent a true and fair view of the actual net worth, financial situation and profitability of the Group in accordance with the accounting standards used in preparing these statements. We also certify that the progress of the Group’s business, including its business performance and its situation, are represented accu-rately in the Group Management Report in all material respects and present the most important opportunities and risks of the Group’s future development during the fiscal year.
Göttingen, February 5, 2018
Sartorius Aktiengesellschaft The Executive Board
Declaration of the Executive Board
Dr. Joachim Kreuzburg
Rainer Lehmann
Reinhard Vogt
174 Consolidated Financial Statements and Notes Independent Auditors’ Report
Report on the Audit of the Consolidated Financial Statements and of the Group Management Report
Opinions
We have audited the consolidated financial statements of Sartorius Aktiengesellschaft, Göttingen, and ist subsidiaries (the Group) – which comprise the consoli-dated statement of financial position as at December 31st, 2017, and the consolidated statement of com-prehensive income , consolidated statement of chang-es in equity and consolidated statement of cash flows for the financial year from 1 January 2017 to 31 De-cember 2017, and notes to the consolidated financial statements, including a summary of significant ac-counting policies. In addition, we have audited the group management report of Sartorius Aktiengesell-schaft for the financial year from 1 January 2017 to 31 December 2017. In accordance with the German legal requirements we have not audited the content of the non-financial statement and the corporate gov-ernance statement which are included in section non-financial statement and section corporate governance statement of the group management report.
In our opinion, on the basis of the knowledge obtained in the audit,
– the accompanying consolidated financial statements comply, in all material respects, with the IFRSs as adopted by the EU, and the additional requirements of German commercial law pursuant to Section 315e (1) HGB [Handelsgesetzbuch: German Commercial Code] and, in compliance with these requirements, give a true and fair view of the assets, liabilities, and financial position of the Group as at 31 December 2017, and of its financial performance for the financial year from 1 January 2017 to 31 December 2017, and
– the accompanying group management report as a whole provides an appropriate view of the Group’s position. In all material respects, this group management report is consistent with the consolidated financial statements, complies with German legal requirements and appropriately presents the opportunities and risks of future development. Our opinion on the group management report does not cover the content of the non-financial statement and the corporate governance statement mentioned above.
Pursuant to Section 322 (3) sentence 1 HGB, we de-clare that our audit has not led to any reservations relating to the legal compliance of the consolidated financial statements and of the group management report.
Basis for the Opinions
We conducted our audit of the consolidated financial statements and of the group management report in accordance with Section 317 HGB and the EU Audit Regulation No. 537/2014 (referred to subsequently as “EU Audit Regulation”) and in compliance with Ger-man Generally Accepted Standards for Financial Statement Audits promulgated by the Institut der Wirtschaftsprüfer [Institute of Public Auditors in Ger-many] (IDW). Our responsibilities under those require-ments and principles are further described in the “Auditor’s Responsibilities for the Audit of the Consol-idated Financial Statements and of the Group Man-agement Report” section of our auditor’s report. We are independent of the group entities in accordance with the requirements of European law and German commercial and professional law, and we have fulfilled our other German professional responsibilities in ac-cordance with these requirements. In addition, in accordance with Article 10 (2) point (f) of the EU Au-dit Regulation, we declare that we have not provided non-audit services prohibited under Article 5 (1) of the EU Audit Regulation. We believe that the evidence we have obtained is sufficient and appropriate to provide a basis for our opinions on the consolidated financial statements and on the group management report.
Key Audit Matters in the Audit of the Consolidated Financial Statements
Key audit matters are those matters that, in our pro-fessional judgment, were of most significance in our audit of the consolidated financial statements for the financial year from 1 January 2017 to 31 December 2017. These matters were addressed in the context of our audit of the consolidated financial statements as a whole, and in forming our opinion thereon, we do not provide a separate opinion on these matters.
Independent Auditors’ Report
Consolidated Financial Statements and Notes Independent Auditors’ Report 175
Recoverability of the carrying amount of goodwill
The accounting policies as well as the assumptions made are disclosed in the notes to the consolidated financial statements in note 15. Disclosure of the amount of goodwill is provided in the notes to the consolidated financial statements in note 15. Explana-tions with respect to the Acquisition of Essen BioSci-ence Inc., USA, and MKS Instruments AB (Umetrics), Sweden, are included in the notes to the consolidated financial statements in note 8.
THE FINANCIAL STATEMENT RISK
As at 31 December 2017, goodwill totalled EUR 653,9 million thereby comprising 28,4% of the balance sheet total and a substantial portion of the assets. In financial year 2017 goodwill increased by EUR 214,7 million as a result of the aquisition of Essen BioScience Inc., USA and MKS Instruments AB (Umet-rics), Sweden. The goodwill of Essen BioScience Inc., USA was allocated to operating segment Lab Products & Services and Bioprocess Solution. The goodwill of MKS instruments AB (Umetrics), Sweden, was allocated to operating segment Bioprocess Solutions.
Goodwill is tested for impairment annually at the level of the operating segments Bioprocess Solutions (goodwill of EUR 494,8 million) and Lab Products & Services (goodwill of EUR 159,1 million). The carrying amount is thereby compared with the recoverable amount of the respective operating segments. If the carrying amount exceeds the recoverable amount of the respective operating segment, an impairment is recorded. The recoverable amount is the higher of the fair value less the costs to sell and value in use of the operating segment. The impairment test was carried out as at 30 November 2017.
The goodwill impairment test is complex and is based on a number of judgemental assumptions. These in-clude, among others, the expected business and earn-ings development of the operating segments for the upcoming 4 years, the assumed long-term growth rates and the discount rate used.
There is the risk for the financial statements that the required impairments were not sufficiently recorded. In addition, there is the risk that the disclosures in the notes associated herewith are not appropriate.
OUR AUDIT APPROACH
Die Zuordnung der Geschäfts- oder Firmenwerte aus den Erwerben der Essen BioScience Inc., USA und der MKS Instruments AB (Umetrics), Schweden haben wir uns von der Gesellschaft erläutern lassen, um ein Verständnis der erwarteten Synergieeffekte zu erlan-gen. Wir haben anhand der erwarteten Synergieeffekte die Zuordnung der Geschäfts- oder Firmenwerte aus den Erwerben der Essen BioScience Inc., USA und der MKS Instruments AB (Umetrics), Schweden beurteilt.
The Company explained the allocation of the goodwill attributable to the acquisition of Essen BioScience Inc., USA and MKS Instruments AB (Umetrics), Sweden to us and we assessed this on the basis of the expected synergies.
With the support of our valuation specialists, we as-sessed, among other things, the appropriateness of the significant assumptions as well as the Company’s valu-ation model. This included a discussion of the expected development of the business and results as well as of the assumed underlying long-term growth rates with those responsible for the planning process. In addition, reconciliations were made with the budget 2018 pre-pared by the Executive Board and which were ap-proved by the Supervisory Board and as well with the planing for the next 4 years. Furthermore, we assessed the consistency of the assumptions with external mar-ket assessments.
We also assessed the Company’s planning accuracy by comparing projections for previous financial years with the actual results realised and analysed devia-tions. As small changes in the discount rate can have a substantial impact on the results of the impairment test, we have compared the assumptions and parame-ters underlying the discount rate – in particular the risk-free rate, the market risk premium and the beta factor – with own assumptions and publicly available information.
To provide for the mathematical accuracy of the valu-ation model utilised, we recalculated the Company’s calculations on the basis of elements selected in a risk-orientated manner.
To reflect the existing uncertainty with respect to forecasts as well as the earlier valuation date for the impairment test, we have assessed reasonably possible changes of the discount rate, the expected earnings respectively the long-term growth rate on the recov-erable amount (sensitivity analysis) by calculating alternative scenarios and comparing these with the Company’s valuation results.
176 Consolidated Financial Statements and Notes Independent Auditors’ Report
Finally, we assessed whether the disclosures in the notes with respect to the recoverability of the carrying amount of the goodwill are appropriate.
OUR OBSERVATIONS
The allocation of the goodwill attributable to the acquisition of Essen BioScience Inc. and MKS Instru-ments AB (Umetrics) is appropriate.
The underlying valuation model used in the impair-ment test of goodwill is appropriate and consistent with the applicable accounting principles.
The Company’s assumptions and parameters underly-ing the valuation are within an acceptable bandwidth and are, on the whole, balanced.
The disclosures in the notes associated herewith are appropriate.
The Acquisition of Essen BioScience Inc.
The accounting policies as well as the assumptions made are disclosed in the notes to the consolidated financial statements in note 8. Disclosure of the amount of goodwill is provided in the notes to the consolidated financial statements in note 8. Explana-tions with respect to the aquisition of Essen BioSci-ence Inc., USA are included in the notes to the consolidated financial statements in note 8.
THE FINANCIAL STATEMENT RISK
On 24 March 2017 the Group acquired Essen BioSci-ence Inc., Ann Arbor, Michigan, USA. The purchase price amounted to EUR 302,8 million. Giving consid-eration to the net assets acquired in the amount of EUR 134,1 million, goodwill totalling EUR 168,7 million resulted.
Pursuant to IFRS 3, the identifiable assets acquired and the liabilities assumed are, as a rule, recorded at their fair value on the acquisition date. The Group engaged an external expert to determine and measure the identifiable assets acquired and the liabilities as-sumed.
The identification and measurement of the assets acquired and the liabilities assumed is complex and based on the Executive Board’s judgemental assump-tions. The significant assumptions comprise the projec-tions of the acquired business‘ sales and margins, the license fees utilised as well as the cost of capital.
There is the financial statement risk that the assets acquired and the liabilities assumed are insufficiently
identified or incorrectly measured. In addition, there is the risk that the disclosures in the notes to the consol-idated financial statements are not complete and appropriate.
OUR AUDIT APPROACH
With the support of our valuation specialists we as-sessed, among other things, the appropriateness of the significant assumptions as well as the identification and valuation approaches. We initially obtained an understanding of the acquisition based on inquires of employees in the finance and M&A departments as well as by assessing the relevant contracts.
We agreed the total purchase price with the underly-ing purchase agreement and evidence of payment.
We assessed the competency, skills and objectivity of the independent expert engaged by the Group. Fur-thermore, we assessed the process of the identification of the assets acquired and liabilities assumed in terms of conformity with the requirements of IFRS 3 using our knowledge of Essen BioScience Inc.’s business model. We considered the consistency of the meas-urement methods used and the measurement princi-ples applicable.
We discussed the expected development of sales and margins with those responsible for planning. Further-more, we reconciled these with the planing on which the acquisiton based and assessed the consistency of the assumptions with external market views. The li-cense rates utilised to measure the intangible assets were compared with reference amounts from relevant data bases. The assumptions and parameters underly-ing the cost of capital – in particular the risk-free interest rate, the market risk premium and the beta factor – were compared with own assumptions and publicly available data.
To assess the mathematical accuracy we recalculated amounts selected using a risk-oriented approach. Fi-nally, we assessed whether the disclosures in the notes to the consolidated financial statements with respect to the acquisition of Essen BioScience Inc. are com-plete and appropriate.
OUR OBSERVATIONS
The approaches underlying the identification and valuation of the assets acquired and the liabilities assumed are appropriate and consistent with the ap-plicable accounting policies. The significant assump-tions and parameters are appropriate and the disclosures in the notes to the consolidated financial statements are complete and appropriate.
Consolidated Financial Statements and Notes Independent Auditors’ Report 177
Other Information
Management is responsible for the other information. The other information comprises:
– the non-financial statement and the corporate governance statement, and
– the remaining parts of the annual report, with the exception of the audited consolidated financial statements and group management report and our auditor’s report.
Our opinions on the consolidated financial statements and on the group management report do not cover the other information, and consequently we do not ex-press an opinion or any other form of assurance con-clusion thereon.
In connection with our audit, our responsibility is to read the other information and, in so doing, to consid-er whether the other information
– is materially inconsistent with the consolidated financial statements, with the group management report or our knowledge obtained in the audit, or
– otherwise appears to be materially misstated.
Responsibilities of Management and the Supervisory Board for the Consolidated Financial Statements and the Group Management Report
Management is responsible for the preparation of the consolidated financial statements that comply, in all material respects, with IFRSs as adopted by the EU and the additional requirements of German commercial law pursuant to Section 315e (1) HGB and that the consolidated financial statements, in compliance with these requirements, give a true and fair view of the assets, liabilities, financial position, and financial per-formance of the Group. In addition, management is responsible for such internal control as they have determined necessary to enable the preparation of consolidated financial statements that are free from material misstatement, whether due to fraud or error.
In preparing the consolidated financial statements, management is responsible for assessing the Group’s ability to continue as a going concern. They also have the responsibility for disclosing, as applicable, matters related to going concern. In addition, they are respon-sible for financial reporting based on the going con-cern basis of accounting unless there is an intention to liquidate the Group or to cease operations, or there is no realistic alternative but to do so.
Furthermore, management is responsible for the prep-aration of the group management report that, as a whole, provides an appropriate view of the Group’s position and is, in all material respects, consistent with the consolidated financial statements, complies with German legal requirements, and appropriately presents the opportunities and risks of future development. In addition, management is responsible for such ar-rangements and measures (systems) as they have con-sidered necessary to enable the preparation of a group management report that is in accordance with the applicable German legal requirements, and to be able to provide sufficient appropriate evidence for the assertions in the group management report.
The supervisory board is responsible for overseeing the Group’s financial reporting process for the preparation of the consolidated financial statements and of the group management report.
Auditor’s Responsibilities for the Audit of the Consolidated Financial Statements and of the Group Management Report
Our objectives are to obtain reasonable assurance about whether the consolidated financial statements as a whole are free from material misstatement, whether due to fraud or error, and whether the group management report as a whole provides an appropri-ate view of the Group’s position and, in all material respects, is consistent with the consolidated financial statements and the knowledge obtained in the audit, complies with the German legal requirements and appropriately presents the opportunities and risks of future development, as well as to issue an auditor’s report that includes our opinions on the consolidated financial statements and on the group management report.
Reasonable assurance is a high level of assurance, but is not a guarantee that an audit conducted in accord-ance with Section 317 HGB and the EU Audit Regula-tion and in compliance with German Generally Accepted Standards for Financial Statement Audits promulgated by the Institut der Wirtschaftsprüfer (IDW) will always detect a material misstatement. Misstatements can arise from fraud or error and are considered material if, individually or in the aggregate, they could reasonably be expected to influence the economic decisions of users taken on the basis of these consolidated financial statements and this group management report.
178 Consolidated Financial Statements and Notes Independent Auditors’ Report
We exercise professional judgment and maintain pro-fessional skepticism throughout the audit. We also:
– Identify and assess the risks of material misstatement of the consolidated financial statements and of the group management report, whether due to fraud or error, design and perform audit procedures responsive to those risks, and obtain audit evidence that is sufficient and appropriate to provide a basis for our opinions. The risk of not detecting a material misstatement resulting from fraud is higher than for one resulting from error, as fraud may involve collusion, forgery, intentional omissions, misrepresentations, or the override of internal control.
– Obtain an understanding of internal control relevant to the audit of the consolidated financial statements and of arrangements and measures (systems) relevant to the audit of the group management report in order to design audit procedures that are appropriate in the circumstances, but not for the purpose of expressing an opinion on the effectiveness of these systems.
– Evaluate the appropriateness of accounting policies used by management and the reasonableness of estimates made by management and related disclosures.
– Conclude on the appropriateness of management’s use of the going concern basis of accounting and, based on the audit evidence obtained, whether a material uncertainty exists related to events or conditions that may cast significant doubt on the Group’s ability to continue as a going concern. If we conclude that a material uncertainty exists, we are required to draw attention in the auditor’s report to the related disclosures in the consolidated financial statements and in the group management report or, if such disclosures are inadequate, to modify our respective opinions. Our conclusions are based on the audit evidence obtained up to the date of our auditor’s report. However, future events or conditions may cause the Group to cease to be able to continue as a going concern.
– Evaluate the overall presentation, structure and content of the consolidated financial statements, including the disclosures, and whether the consolidated financial statements present the underlying transactions and events in a manner that the consolidated financial statements give a true and
fair view of the assets, liabilities, financial position and financial performance of the Group in compli-ance with IFRSs as adopted by the EU and the addi-tional requirements of German commercial law pursuant to Section 315e (1) HGB.
– Obtain sufficient appropriate audit evidence regarding the financial information of the entities or business activities within the Group to express opinions on the consolidated financial statements and on the group management report. We are responsible for the direction, supervision and performance of the group audit. We remain solely responsible for our opinions.
– Evaluate the consistency of the group management report with the consolidated financial statements, its conformity with German law, and the view of the Group’s position it provides.
– Perform audit procedures on the prospective information presented by management in the group management report. On the basis of sufficient appropriate audit evidence we evaluate, in particular, the significant assumptions used by management as a basis for the prospective information, and evaluate the proper derivation of the prospective information from these assumptions. We do not express a separate opinion on the prospective information and on the assumptions used as a basis. There is a substantial unavoidable risk that future events will differ materially from the prospective information.
We communicate with those charged with governance regarding, among other matters, the planned scope and timing of the audit and significant audit findings, including any significant deficiencies in internal con-trol that we identify during our audit.
We also provide those charged with governance with a statement that we have complied with the relevant independence requirements, and communicate with them all relationships and other matters that may reasonably be thought to bear on our independence, and where applicable, the related safeguards.
From the matters communicated with those charged with governance, we determine those matters that were of most significance in the audit of the consoli-dated financial statements of the current period and are therefore the key audit matters. We describe these matters in our auditor’s report unless law or regulation precludes public disclosure about the matter.
Consolidated Financial Statements and Notes Independent Auditors’ Report 179
Other Legal and Regulatory Requirements
Further Information pursuant to Article 10 of the EU Audit Regulation
We were elected as group auditor by the annual gen-eral meeting on 6 April 2017. We were engaged by the supervisory board on 6 April 2017. We have been the group auditor of the Sartorius Aktiengesellschaft without interruption since the financial year 2015.
We declare that the opinions expressed in this audi-tor’s report are consistent with the additional report to the audit committee pursuant to Article 11 of the EU Audit Regulation (long-form audit report).
In addition to the consolidated financial statements, we audited the annual financial statements of Sartorius Aktiengesellschaft and carried out various audits of annual financial statements of subsidiaries. Auditing-integrated reviews of interim financial statements and project-accompanying audits of IT-based accounting-related systems were performed. In addition, other statutory or contractual audits have been carried out, such as the confirmation of compli-ance with contractual conditions or review of the non-financial consolidated statement. In addition, we have supported quality assurance services in connection with the first-time adoption of new accounting prin-ciples such as IFRS 9, IFRS 15 and IFRS 16.
German Public Auditor Responsible for the Engagement
The German Public Auditor responsible for the en-gagement is Frank Thiele.
Göttingen, Germany, February 5, 2018
KPMG AG
Wirtschaftsprüfungsgesellschaft
Leitz Thiele Wirtschaftsprüfer Wirtschaftsprüfer
(German Public Auditor) (German Public Auditor)
180 Consolidated Financial Statements and Notes Executive Board and Supervisory Board
During Fiscal 2017
Executive Board
Dr. rer. pol. Joachim Kreuzburg Dipl.-Ingenieur (Graduate Engineer) CEO and Chairman Executive for Labor Relations Corporate Strategy, Human Resources, Operations, Legal Affairs & Compliance and Corporate Communications Born April 22, 1965 Resident of Hanover, Germany Member since November 11, 2002 “Sprecher” (Spokesman) from May 1, 2003, to November 10, 2005 Chairman since November 11, 2005 Appointed until November 10, 2020
Rainer Lehmann Dipl.-Kaufmann (Graduate in Business Administration) Finance, IT and Business Processes Born March 2, 1975 Resident of Brightwaters, New York, USA Member since March 1, 2017 Appointed until February 29, 2020
Reinhard Vogt Industriekaufmann (Industrial Business Manager) Marketing, Sales and Services Born August 4, 1955 Resident of Dransfeld, Germany Member since July 24, 2009 Appointed until July 23, 2019
Jörg Pfirrmann Dipl.-Ökonom (Graduate Economist) Executive for Labor Relations Finance, Human Resources, IT and General Administra-tion Born November 30, 1972 Resident of Göttingen, Germany Member from July 24, 2009, until February 28, 2017
Supervisory Board
Dr. Lothar Kappich Dipl.-Ökonom (Graduate Economist) Chairman since July 19, 2017 Freelance Consultant, formerly Managing Director of ECE Projektmanagement GmbH & Co. KG in Hamburg, Germany Resident of Hamburg, Germany
Manfred Zaffke Dipl.-Volkswirt (Graduate Political Economist) Vice Chairman First Authorized Representative of the German Metalworkers’ Union (IG Metall) in the southern Lower Saxony/Harz region in Northeim, Germany Resident of Osterode am Harz, Germany
Annette Becker Personalfachkauffrau (HR Specialist) Chairwoman of the Employees' Council of Sartorius Corporate Administration GmbH in Göttingen, Germany Chairwoman of the Group Employees' Council of Sartorius AG in Göttingen, Germany Resident of Göttingen, Germany
Uwe Bretthauer Dipl.-Ingenieur (Graduate Engineer) Chairman of the Employees' Council of Sartorius Lab Instruments GmbH & Co. KG in Göttingen, Germany Resident of Göttingen, Germany
Michael Dohrmann Feinmechaniker (Precision Engineer) Chairman of the Employees' Council of Sartorius Stedim Biotech GmbH in Göttingen, Germany Resident of Reinhausen, Germany
Dr. Daniela Favoccia Attorney and Partner of the Hengeler Mueller partner-ship of lawyers in Frankfurt a.M., Germany, Member since April 6, 2017, Resident of Frankfurt a.M., Germany
Petra Kirchhoff Dipl.-Volkswirtin (Graduate Political Economist) Vice President of Corporate Communications and Investor Relations Sartorius Corporate Administration GmbH in Göttingen, Germany Resident of Göttingen, Germany
Executive Board and Supervisory Board
Consolidated Financial Statements and Notes Executive Board and Supervisory Board 181
Karoline Kleinschmidt Dipl.-Sozialwirtin (Graduate Social Economist) Secretary of the German Metalworkers’ Union (IG Metall) of the district management of Lower Saxony and Saxony-Anhalt in Hanover, Germany Resident of Hanover, Germany
Dr. Guido Oelkers President and CEO of Swedish Orphan Biovitrum AB (publ) in Stockholm, Sweden Member since November 6, 2017 Resident of Wollerau, Switzerland
Ilke Hildegard Panzer Executive Vice President and Chief Innovation Officer of the BloodCenter of Wisconsin, part of Versiti Inc., in Milwaukee, Wisconsin, USA Member since April 6, 2017 Resident of Fredonia, Wisconsin, USA
Prof. Dr. Thomas Scheper Dipl.-Chemiker (Graduate Chemical Engineer) University professor and head of the Institute of Technical Chemistry, Gottfried Wilhelm Leibnitz Uni-versity in Hanover, Germany Resident of Hanover, Germany
Prof. Dr. Klaus Rüdiger Trützschler Dipl.-Wirtschaftsmathematiker (Graduate Business Mathematician) and Dipl.-Mathematiker (Graduate Mathematician) Resident of Essen, Germany
Prof. Dr. Dres. h.c. Arnold Picot Dipl.-Kaufmann (Graduate in Business Administration) University professor Chairman until July 9, 2017 Research Center for the Institute of Information, Or-ganization and Management (IOM), Faculty of Economics, Ludwig-Maximilian University of Munich (LMU), Germany Resident of Gauting, Germany
Dr. Dirk Basting Dipl.-Chemiker (Graduate Chemical Engineer) Member until April 6, 2017 Resident of Fort Lauderdale, Florida, USA
Prof. Dr. Gerd Krieger Rechtsanwalt (Lawyer) Honorary Professor at the Heinrich-Heine University in Düsseldorf, Germany Member until April 6, 2017 Resident of Düsseldorf, Germany
Committees of the Supervisory Board
Executive Task Committee Dr. Lothar Kappich (Chairman since July 19, 2017) Manfred Zaffke Uwe Bretthauer Prof. Dr. Klaus Rüdiger Trützschler (Member since July 19, 2017)
Prof. Dr. Dres. h.c. Arnold Picot (Member and Chairman until July 9, 2017) Prof. Dr. Gerd Krieger (Member until April 6, 2017)
Audit Committee Prof. Dr. Klaus Rüdiger Trützschler (Chairman) Manfred Zaffke Uwe Bretthauer Dr. Lothar Kappich (Member since July 19, 2017) Prof. Dr. Dres. h.c. Arnold Picot (Member until July 9, 2017)
Conciliation Committee Dr. Lothar Kappich (Member and Chairman since July 19, 2017) Manfred Zaffke Uwe Bretthauer Prof. Dr. Klaus Rüdiger Trützschler (Member since April 6, 2017) Prof. Dr. Dres. h.c. Arnold Picot (Member and Chairman until July 9, 2017) Prof. Dr. Gerd Krieger (Member until April 6, 2017)
Nomination Committee Dr. Lothar Kappich Dr. Daniela Favoccia (Member since April 6, 2017) Prof. Dr. Klaus Rüdiger Trützschler (Member since July 19, 2017) Prof. Dr. Gerd Krieger (Member until April 6, 2017) Prof. Dr. Dres. h.c. Arnold Picot (Member until July 9, 2017)
182 Consolidated Financial Statements and Notes Executive Board and Supervisory Board
Positions Held by the Members of the Executive Board as of December 31, 2017
Dr. rer. pol. Joachim Kreuzburg Positions held within the Group: Président-Directeur Général (CEO) of: – Sartorius Stedim Biotech S.A., France On the Supervisory Board of: – Sartorius Stedim Biotech GmbH, Germany,
Chairman On the Board of Directors of: – Sartorius North America, Inc., USA, Chairman – Sartorius Stedim North America, Inc., USA, Chairman – IntelliCyt Corporation, USA – Sartorius Stedim Filters, Inc., Puerto Rico, Chairman – Sartorius Stedim Japan K.K., Japan – Denver Instrument (Beijing) Co. Ltd., China – Sartorius Stedim Lab Ltd., UK – Sartorius Stedim BioOutsource Ltd., UK On the Comité Exécutif (Executive Committee) of: – Sartorius Stedim FMT S.A.S., France, Chairman
External Positions: On the Supervisory Board of: – Carl Zeiss AG, Germany – Ottobock SE & Co. KGaA, Germany, Vice Chairman
On the Regionalbeirat (Regional Advisory Board) of: – Commerzbank AG, Germany On the Wirtschaftsbeirat (Economic Advisory Board) of: – Norddeutsche Landesbank, Germany
Rainer Lehmann Positions held within the Group: On the Board of Directors of: – Sartorius Corporation, USA – Essen Holdings, Inc., USA – Sartorius North America, Inc., USA – Sartorius Stedim North America, Inc., USA – Sartorius Stedim Filters, Inc., Puerto Rico – Sartorius (Shanghai) Trading Co., Ltd., China – Sartorius Stedim (Shanghai) Trading Co., Ltd., China
External Positions: On the Unternehmerbeirat (Employers’ Advisory Board) of: – Gothaer Versicherungsbank VVaG, Germany
Reinhard Vogt Positions held within the Group: On the Board of Directors of: – TAP Biosystems Group Ltd., UK – The Automation Partnership (Cambridge) Ltd., UK – Sartorius Stedim BioOutsource Ltd., UK – Sartorius North America, Inc., USA – Sartorius Stedim North America, Inc., USA – Sartorius (Shanghai) Trading Co., Ltd., China – Sartorius Stedim (Shanghai) Trading Co., Ltd., China – Sartorius Stedim Japan K.K, Japan – Sartorius Korea Ltd., South Korea – Sartorius Korea Biotech Co., Ltd., South Korea – Sartorius Stedim Australia Pty. Ltd., Australia On the Verwaltungsrat (Administrative Board) of: – Sartorius Stedim Switzerland AG, Switzerland,
Chairman On the Comité Exécutif (Executive Committee) of: – Sartorius France S.A.S., France, Chairman – Sartorius Stedim France S.A.S., France, Chairman
External Positions: None
Consolidated Financial Statements and Notes Executive Board and Supervisory Board 183
Positions Held by the Members of the Supervisory Board as of December 31, 2017
Dr. Lothar Kappich Positions held within the Group: On the Conseil d’Administration (Board of Directors) of: – Sartorius Stedim Biotech S.A., France
External Positions: None
Manfred Zaffke Positions held within the Group: None
External Positions: On the Supervisory Board of: – Terex MHPS GmbH, Germany – GMH GUSS GmbH, Germany,
Vice Chairman
Annette Becker None
Uwe Bretthauer None
Michael Dohrmann None
Dr. Daniela Favoccia None
Petra Kirchhoff Positions held within the Group: None
External Positions: On the Supervisory Board of: – AWO Göttingen gGmbH, Germany On the Foundation’s Board of Directors of: – SüdniedersachsenStiftung, Germany On the Stock Exchange Council (Börsenrat) of the: – Hanover Stock Exchange of Lower Saxony
(Niedersächsiche Börse zu Hannover), Germany
Karoline Kleinschmidt None
Dr. Guido Oelkers None
Ilke Hildegard Panzer None
Prof. Dr. Thomas Scheper None
Prof. Dr. Klaus Rüdiger Trützschler Positions held within the Group: None
External Positions: On the Supervisory Board of: – Wuppermann AG, Germany, Chairman – Zwiesel Kristallglas AG, Germany, Chairman On the Verwaltungsrat (Administrative Board) of: – Wilh. Werhahn KG, Germany
Supplementary Information
Konzern_Trennseiten.indd 19 15.02.18 09:28
Supplementary Information Glossary 185
Industrial | Product-specific Terms
Bags, single-use Plastic disposable bag used in bioreactors and for storing liquids,
such as culture media, intermediate products and biopharma-
ceuticals
Bioreactor In English-speaking countries, a bioreactor is a vessel used for
cultivating animal or human cells in a culture medium. In non-
English-speaking countries, the term bioreactor is also used
synonymously with the term fermenter to denote a system
used to multiply microorganisms. In either case, the vessel is
used to obtain cells, parts of these or one of their metabolites.
Disposable Used synonymously with “single-use"
Downstream processing Collective term for the various steps that follow fermentation
or cell cultivation (upstream processing) in the production of
biopharmaceuticals; for example, separation, purification and
concentration
FDA - Food and Drug Administration U.S. regulatory agency responsible for ensuring the safety and
efficacy of human and veterinary pharmaceuticals, biological
products, medical devices and foods
Fermentation Technical process used to produce or transform intra- or
extra-cellular substances with the help of microorganisms
Fluid management technologies Technologies and systems for the transportation and storage
of biological liquids
Membrane chromatography Selective separation of mixtures of substances by adsorption
to specifically modified membranes (membrane adsorbers) in
a flowing system
Membrane (filter) Thin film or foil made of polymers; because of the porous
structure, this film is suitable for filtration applications.
Monoclonal antibodies Synthetic antibodies used, in particular, in the treatment of
cancer, HIV and autoimmune diseases
PAT - Process Analytical Technology A strategy for the design, analysis and control of manufacturing
processes according to which quality characteristics of interme-
diate or finished products are defined and then analyzed and
monitored using the critical process parameters identified
Purification An important step in downstream processing
Scale-up Transfer of scale or increase in size. Used to denote the progres-
sion of a process that increases in a range from lab scale to pilot
scale to process scale, while retaining the same technology,
materials of construction and geometries throughout
Single-use | Reusable product Disposable product, i.e., for one-time usage. A reusable product
is designed for repeated use.
Upstream processing In the manufacture of biopharmaceuticals, designates the vari-
ous steps that take place for seeding and propagating cells that
produce an active pharmaceutical ingredient
Validation Documented verification that systems, devices and processes
reproducibly deliver the desired result
Glossary
186 Supplementary Information Glossary
Business | Economic Terms
Amortization Amortization relates exclusively to potential reductions in the
value of goodwill and the allocation of the purchase price to
intangible assets acquired as carried out according to IFRS 3
Cash flow The amount of cash earned after paying all expenses and taxes;
i.e., the cash balance of inflows and outflows of funds
Compliance Observance of applicable laws, codes and other relevant rules
and regulations
Constant currencies; currency-adjusted In the presentation of figures, identical exchange rates are used
for each of the comparative periods.
DAX®, TecDAX® German stock indexes of the transaction service provider and
marketplace organizer Deutsche Börse AG
D&O insurance Directors’ and Officers’ liability insurance that covers Superviso-
ry and Executive Board members and managerial employees
DVFA | SG The Methods Commission of the Society of Investment Profes-
sionals in Germany (DFVA e.V.) and the Schmalenbach-
Gesellschaft (SG)
EBITDA Earnings before interest, taxes, depreciation and amortization;
in this context, amortization refers exclusively to the purchase
price allocation (PPA) to intangible assets acquired according to
IFRS 3.
EBITDA margin The ratio of EBITDA (earnings before interest, taxes, depreciation
and amortization) to sales
Equity ratio The ratio of equity to the balance sheet total
ERP Stands for “Enterprise Resource Planning”;
IT-based system for resource planning
Extraordinary items Exceptional or one-time expenses and income, such as acquisi-
tion costs, restructuring costs and other non-operating expenses
Fixed assets The sum of intangible assets, property, plant and equipment and
financial assets
Goodwill The difference between the price paid for a company or business
and its net assets; a form of intangible asset
Holding company A parent company that exists for the purpose of owning a
controlling interest or shares in several legally independent
subsidiaries that are subordinate within the organizational
hierarchy; this holding company conducts its business exclusive-
ly through these subsidiaries.
Market capitalization The total number of shares outstanding of both classes issued by
the company, multiplied by the corresponding share price
Normalized financial result Financial result excluding fair value adjustments of hedging
instruments, as well as excluding non-periodic expenses and
income.
Normalized income tax Underlying income tax, based on underlying profit before tax
and on non-cash amortization.
Prime Standard Market segment of the Frankfurt Stock Exchange with high,
internationally accepted transparency requirements to meet the
needs of companies seeking to attract international investors.
Supply chain management Setup and coordination of integrated flows of materials, infor-
mation and finances (supply chains) over the entire value-added
process
Treasury Short- and medium-term liquidity management
Underlying Adjusted to eliminate extraordinary items (see definition
Glossary
Supplementary Information Glossary 187
Other Terms
CRM Abbreviation for “Customer Relationship Management”; practic-
es, strategies and technologies that companies use to manage
and analyze customer interactions and data to improve custom-
er retention and drive sales growth
EHS Abbreviation for "Environment, Health and Safety”
EMEA The region comprising Europe, the Middle East and Africa; one
of the three reporting regions in the geographical allocation of
the Sartorius Group besides the Americas and Asia / Pacific
ERP Stands for "Enterprise Resource Planning";
IT-based resource planning system
ESG Abbreviation for “Environment, Social and Governance”; refers
to the three major factors of sustainable corporate management.
GEC Stands for the "Group Executive Committee"; the central man-
agement body of the Sartorius Group. It currently is comprised
of six members: the three Executive Board members of Sartori-
us AG and further executives with global responsibility
GHG Abbreviation for “Greenhouse Gas Protocol,” the international
standard for measuring and managing greenhouse gas emissions,
including reporting. The WHO stands for the “World Heath
Organization,” the coordination authority of the United Nations
for international public health
188 Supplementary Information Index
A Acquisitions | 8 | 14 | 16ff | 20 | 24ff. | 29ff. | 36f. | 41f. | 47 |
50f. | 55f. | 59 | 63 | 85 | 90ff. | 95 | 99 | 125 |
132 134 | 138 | 145f. | 148 | 150ff. | 186Addresses | 192ff.
Annual financial statements | 14 | 51ff. | 75f. | 80 | 87 | 115 |
132 | 171Annual Shareholders’ Meeting | Cover | 8 | 12ff. | 19 | 53 | 70ff. |
75 | 155 | 172 | 179 | 188Amortization | 31ff. | 50 | 72 | 108 | 116ff. | 122f. | 133ff.
Appropriation of profits | 12 | 35 | 53 | 71 | 172Auditor(s) | 12 | 14 | 55 | 68 | 71 | 75 | 115 | 168 | 174ff.
BBalance sheet | Cover | 12 | 36 | 40 | 51ff. | 59 | 61 | 68f | 97 |
111 | 124 | 126 | 129 | 130ff. | 145 | 150Bioprocess Solutions | 8f. | 12 | 22 | 24f. | 28 | 31ff. | 37 |
41ff. | 48 | 50 | 54 | 56 | 66 | 92 |
94f. | 128 | 139 | 141 | 146f | 150 |
152 | 171 | 175CCapital expenditures | 23 | 28 | 36 | 39f. | 50f. | 57 | 63f. | 66 |
118 | 123 | 136 | 141 | 151ff.
Cash flow(s) | 23 | 39 | 122 | 125f.| 129 | 134 | 137f. | 150 | 152 | 154 | 157 | 167ff. | 186
Compliance | 12ff. | 55 | 68f. | 73ff. | 88f. | 92 | 96 | 105 | 107 |
118f. | 180 | 186Consolidated financial statements | 12 | 14 | 22 | 51 | 55 | 68f. |
75 | 114 | 121 | 183Corporate governance | 13f. | 71ff. | 82 | 89 | 105f. | 114 |
117 | 171Currency | 29 | 41 | 59 | 131f. | 138 | 157 | 166f.
DDepreciation | 31 f. | 50 | 108 | 111 | 116 ff. | 122 f. | 135 f.
Distribution | 8 | 24ff.| 31 f. | 35 | 41 f. | 46 f. | 54 f. | 85 | 87 |
116 | 118 | 128 ff. | 149Dividend(s) | Cover | 8 | 14 | 19f | 39 | 51 | 53 | 70 | 76 |
125ff. | 148 | 155f. | 165 | 172
EEarnings | Cover | 14f. | 20 | 23 | 33ff. | 40 | 43 | 47 |
50ff. | 56 | 61 | 69 | 72 | 77 | 79 | 87 f | 93 | 103 |
122f. | 125 f. | 129f | 132ff. | 136ff. | 146ff. | 154 | 156ff. | 165f. | 167f. | 170 | 173ff.
Earnings per share | Cover| 33 | 122 | 149Earnings reserves | 52 | 126EBIT | 33ff. | 122 | 125 | 141EBITDA | 23 | 27 | 34 | 39 | 43 | 47 | 50 | 60 | 66 | 76 | 92 |
130f. | 140f. | 169Employees | Cover | 9 | 15 | 23 | 34f. | 44 | 53 | 59 | 62 | 69 |
75 | 86ff. | 91ff. | 96 | 98 | 100 - 110 | 112 | 114 |
145f. | 157f. | 162 | 175Employee benefits expense | 52 | 79 | 147 | 156 | 170Equity | 23 | 40 | 51f. | 124 | 126f. | 129ff. | 134 | 136 | 157 |
161 | 164 | 166f. | 174Executive Board | 8 | 12ff. | 20 | 53ff. | 68 | 70ff. | 84f. | 101 |
128 | 170ff. | 175ff. | 180ff.
FFinancial instruments | 60 | 75 | 129 | 131 | 136f. | 148 | 154f. |
161 | 163ff.
Financing | 39 | 41 | 50 | 142 | 161 | 167Financial result | 20 | 34f. | 122 | 125 | 132 | 140f. | 146 | 148 |
167 | 186Fixed assets | 51f. | 130 | 133f | 142 | 186Forecast report | 53 | 63ff.
Foreign exchange, foreign exchange rates | 29 | 41 | 59 | 131f. |
138 | 157 | 166f.
G German Act on Equal Participation of Women and Men | 74Group companies | 54f. | 60 | 68f. | 141 | 157 | 167 |172Group Executive Committee | 10f. | 19 | 54 | 73 | 92 | 97 | 187Group financial statements | 12 | 14 | 22 | 51 | 55 | 68f. | 75 |
114 | 121 | 183 Group structure | 22f. | 87 | 114Group management report | 14 | 21 - 119 | 169f | 172ff.
I Industrial Technologies | 27Intangible assets | 76 | 124f. | 134 | 138 | 146 | 150ff. | 186Interest income | 159 | 168Inventories | 40 | 124f. | 135 | 146 | 153f.
Investments | 23 | 28 | 36 | 39f. | 50f. | 57 | 63f. | 66 | 118 |
123 | 136 | 141 | 151ff.
Investor relations | Cover | 18 | 87f. | 180
Index
Supplementary Information Index 189
LLab Products & Services | 8f. | 22 - 26 | 31ff. | 46ff. | 54 | 56 |
66 | 128 | 141 | 145 | 147 | 150 | 153 |
171 | 175Liabilities | 37 | 40f. | 52 | 124f. | 130 | 132f. | 136ff. | 142 |
146 | 148 | 153 | 161 | 163ff. | 168f.
MMarketing | 38 | 54 | 88f. | 93 | 98 | 130 | 180 | 189
NNet debt | Cover | 23 | 39ff. | 50 | 60 | 87 | 169Net profit | Cover | 14 f. | 20 | 23 | 33ff. | 40 | 43 | 47 |50ff. |
56 | 61 | 69 | 72 | 77 | 79 | 87 f | 93 | 103 | 122f. |
125f. | 129f | 132ff. | 136ff. | 146ff. | 154 | 156ff. |
165f. | 167f. | 170 | 173ff.
Note loans | 13 | 161 | 165 | 169
OOrdinary shares | Cover | 8f. | 15ff. | 20 - 23 | 75 | 35 | 50 | 70 |
75 | 122 | 127 | 149 | 155 | 170 | 172PPension commitments | 76 | 78 | 81Pension provisions | 81 | 85 | 135 | 138 | 157f. | 172Phantom stock, phantom stock units | 76ff. | 82f. | 142 | 161 |
170Positions held | 180ff.
Preference share(s) | 8f. | 15ff. | 20 - 23 | 75 | 35 | 50 | 70 | 75 |
119 | 127 | 149 | 155 | 170 | 172Procurement | 56 f. | 130Production| 8f. | 23f. | 27 | 30ff. | 36 | 38f. | 41 | 43ff. | 49f. |
56f. | 59ff. | 62f. | 65 | 86 | 89ff. | 97 | 100 | 103 |
105 | 107ff. | 128 | 147Products | 8f. | 24ff. | 30 | 36 | 44ff. | 48ff. | 54 | 57ff. | 65 | 72 |
86f. | 90 - 97 | 105f. | 108ff. | 114 | 116 | 128 | 134 |
139 | 150Profit | Cover | 14 f. | 20 | 23 | 33 ff. | 40 | 43 | 47 |50ff. | 56 |
61 | 69 | 72 | 77 | 79 | 87f | 93 | 103 | 122f. | 125f. |
129f | 132ff. | 136ff. | 146ff. | 154 | 156ff. | 165f. |
167f. | 170 | 173ff.
Property, plant and equipment | 52 | 124f. | 135 | 138 | 140f. |
146 | 152f.
Provisions | 52 | 124f. | 135f. | 153 | 157 | 161
RRatio of Net Debt to Underlying EBITDA | 41Regions | 22 | 28f. | 32f. | 43 | 46ff. | 94 | 98 | 100 | 141 | 190Remuneration of the Executive Board | 12 | 14Research and Development |33 | 36 | 38 | 44 | 49 | 53 | 88 |
90f. | 97 | 105 | 108Reserves | 52 | 124 f. | 135 f. | 153 | 157 | 161Restructuring | 136 | 140 | 186
Results | Cover | 14f. | 20 | 23 | 33ff. | 40 | 43 | 47 |50ff. | 56 |
61 | 69 | 72 | 77 | 79 | 87f | 93 | 103 | 122f. | 125f. |
129f | 132ff. | 136ff. | 146ff. | 154 | 156ff. | 165f. |
167f. | 170 | 173ff.
Retained profit | 14 | 51ff. | 172Risk management system | 53ff. | 69Risk and opportunities report | 53 - 62 | 74 | 114 | 116
SSales (and distribution) | 8 | 23 | 25 | 32ff. | 37 | 40 | 43 | 46 | 50 |
65f. | 76 | 87 | 91f. | 108 | 110f. | 141 |
145f.
Sales revenue | Cover | 8 | 23 | 25 | 32ff. | 37 | 40 | 43 | 46 |
50 | 65f. | 76 | 87 | 91 f. | 108 | 110f. | 141 |
145f.
Sartorius Stedim Biotech | 22 f. | 34 | 51 | 84 f. | 87 | 92 f. |
143 | 146 | 152 | 156 | 180 | 182 f.
Segment reports | 139f.
Shareholder structure | 19Share(s) | Cover | 8 | 12f. | 16ff. | 22f. | 34f. | 70 | 75ff. | 122 |
126ff. | 142 | 149 | 155f. | 170ff. | 186Statement of profit or loss | 37 | 55 | 122ff. | 130ff. | 138 |
146ff. | 152ff. | 160 | 166 | 174Stedim transaction | 152Supervisory Board | 8 | 12ff. | 20 | 53ff. | 68 | 70ff. | 84f. | 101 |
128 | 170ff. | 175ff. | 180ff.
Supply chain management | 45 | 49 | 56 | 186Sustainability | 86ff.
TTaxes | 34f. | 52 | 54 | 105 | 122ff. | 133f. | 139ff. | 146 | 148 |
150 | 153f. | 156f. | 163 | 167f. | 186Treasury | 41 | 163 | 186
UUnqualified audit certificate | 13 | 174ff.
WWorking capital | 23 | 40f. | 57 | 161
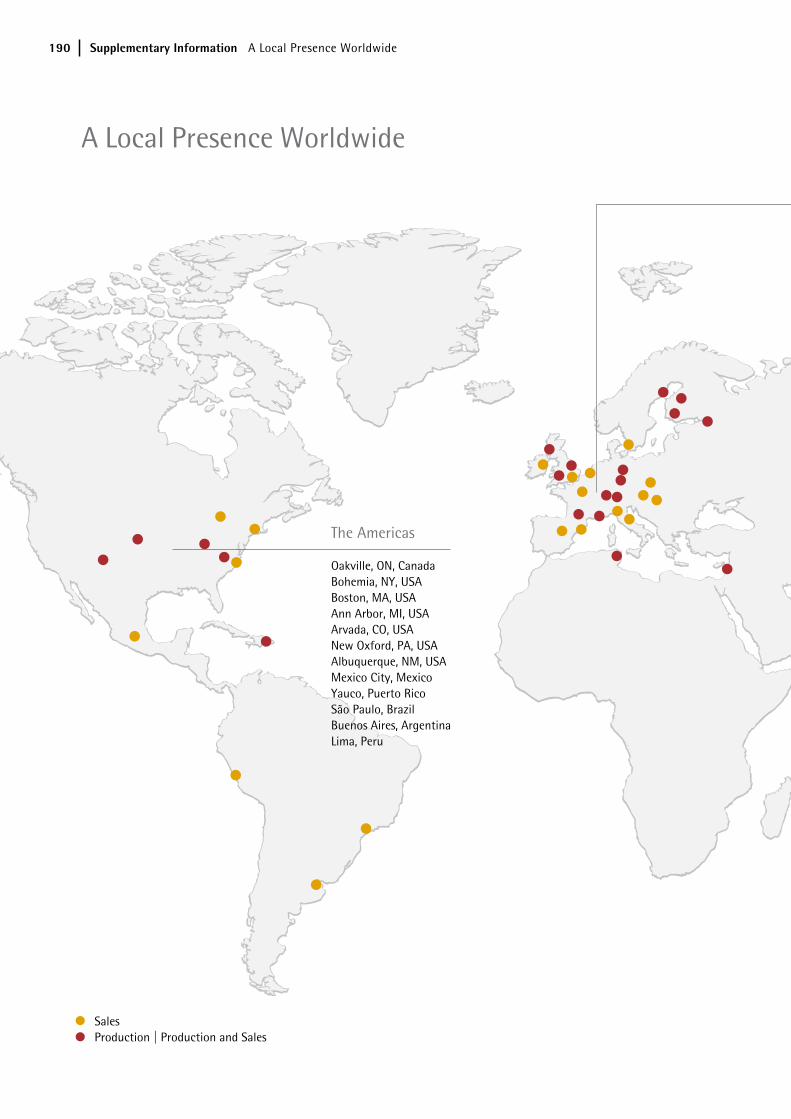
190 Supplementary Information A Local Presence Worldwide
SalesProduction | Production and Sales
The Americas
Oakville, ON, CanadaBohemia, NY, USABoston, MA, USAAnn Arbor, MI, USAArvada, CO, USANew Oxford, PA, USAAlbuquerque, NM, USAMexico City, MexicoYauco, Puerto RicoSão Paulo, BrazilBuenos Aires, ArgentinaLima, Peru
A Local Presence Worldwide
e-GB2017-Konzern_Weltkarte.indd 190 15.02.18 09:31
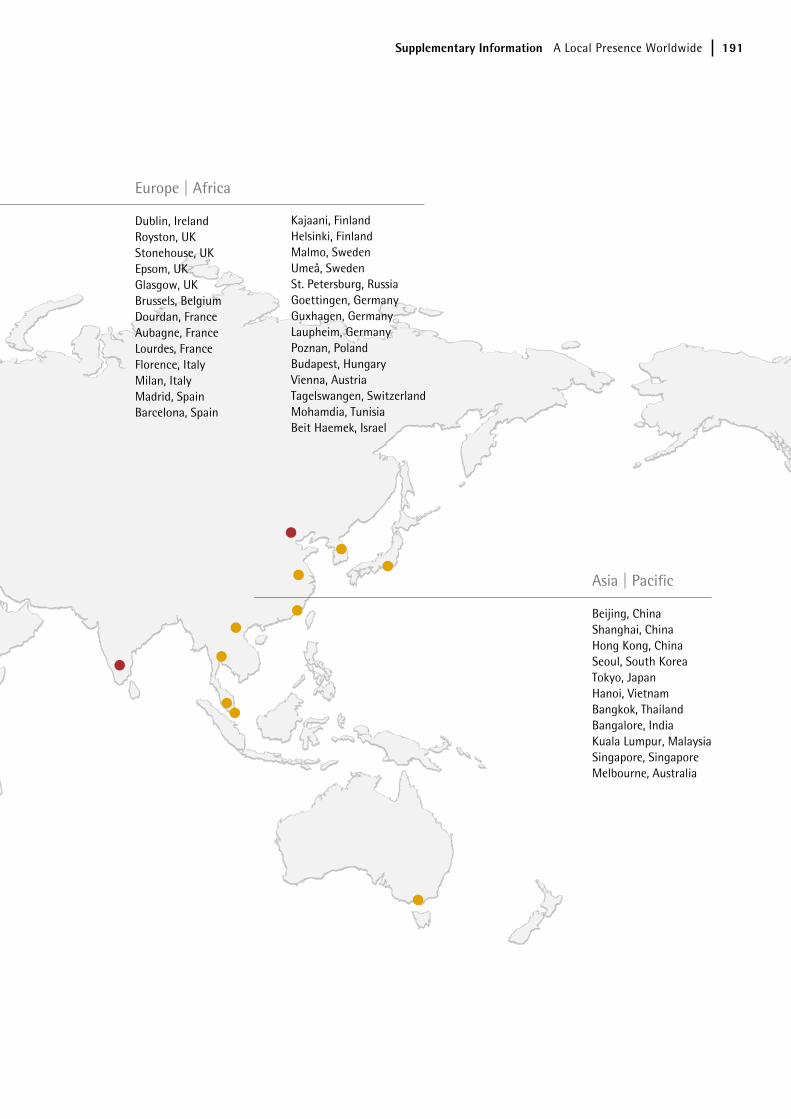
191Supplementary Information A Local Presence Worldwide
Europe | Africa
Dublin, IrelandRoyston, UKStonehouse, UKEpsom, UKGlasgow, UKBrussels, BelgiumDourdan, FranceAubagne, FranceLourdes, France Florence, ItalyMilan, ItalyMadrid, SpainBarcelona, Spain
Kajaani, FinlandHelsinki, FinlandMalmo, SwedenUmeå, SwedenSt. Petersburg, RussiaGoettingen, GermanyGuxhagen, GermanyLaupheim, GermanyPoznan, PolandBudapest, HungaryVienna, AustriaTagelswangen, SwitzerlandMohamdia, TunisiaBeit Haemek, Israel
Asia | Pacific
Beijing, ChinaShanghai, ChinaHong Kong, ChinaSeoul, South KoreaTokyo, JapanHanoi, VietnamBangkok, ThailandBangalore, IndiaKuala Lumpur, MalaysiaSingapore, SingaporeMelbourne, Australia
e-GB2017-Konzern_Weltkarte.indd 191 15.02.18 09:31
192 Supplementary Information Addresses
Europe
Germany
Sartorius AG
Otto-Brenner-Strasse 20
37079 Goettingen
Phone + 49.551.308.0
Fax + 49.551.308.3289
Sartorius Stedim Biotech GmbH
August-Spindler-Strasse 11
37079 Goettingen
Phone + 49.551.308.0
Fax + 49.551.308.3289
Sartorius Lab Instruments GmbH & Co. KG
Otto-Brenner-Strasse 20
37079 Goettingen
Phone + 49.551.308.0
Fax + 49.551.308.3289
Sartorius Stedim Plastics GmbH
Karl-Arnold-Strasse 21
37079 Goettingen
Phone + 49.551.50450.0
Fax + 49.551.50450.50
Sartorius Stedim Systems GmbH
Robert-Bosch-Strasse 5 - 7
34302 Guxhagen
Phone + 49.5665.407.0
Fax + 49.5665.407.2200
Sartorius Stedim Cellca GmbH
Erwin-Rentschler-Strasse 21
88471 Laupheim
Phone + 49.7392.96648.0
Fax + 49.7392.96648.29
Sartorius Corporate Administration GmbH
Otto-Brenner-Strasse 20
37079 Goettingen
Phone + 49.551.308.0
Fax + 49.551.308.3289
Austria
Sartorius Stedim Austria GmbH
Modecenter Strasse 22
1030 Vienna
Phone + 43.1.796.5763.0
Fax + 43.1.796.5763.44
Sartorius Austria GmbH
Modecenter Strasse 22
1030 Vienna
Phone + 43.1.796.5760.0
Fax + 43.1.796.5760.24
Belgium
Sartorius Stedim Belgium N.V.
Rue Colonel Bourg 105
1030 Schaerbeek-Brussels
Phone + 32.2.756.06.80
Fax + 32.2.756.06.81
Sartorius Belgium N.V.
Rue Colonel Bourg 105
1030 Schaerbeek-Brussels
Phone + 32.2.756.06.80
Fax + 32.2.756.06.81
Finland
Sartorius Biohit Liquid Handling Oy
Laippatie 1
00880 Helsinki
Phone + 358.9.75.59.51
Fax + 358.9.75.59.5.00
Sartorius Stedim Nordic Oy
Laippatie 1
00880 Helsinki
Phone + 358.9.75.59.51
Fax + 358.9.75.59.52.00
Sartorius Nordic Oy
Laippatie 1
00880 Helsinki
Phone + 358.9.75.59.51
Fax + 358.9.75.59.52.00
Addresses
Supplementary Information Addresses 193
France
Sartorius Stedim Biotech S.A.
Zone Industrielle Les Paluds
Avenue de Jouques – CS 91051
13781 Aubagne Cedex
Phone + 33.4.42.84.56.00
Fax + 33.4.42.84.56.19
Sartorius Stedim FMT S.A.S.
Zone Industrielle Les Paluds
Avenue de Jouques – CS 91051
13781 Aubagne Cedex
Phone + 33.4.42.84.56.00
Fax + 33.4.42.84.56.19
Sartorius Stedim France S.A.S.
Zone Industrielle Les Paluds,
Avenue de Jouques – CS 71058
13781 Aubagne Cedex
Phone + 33.4.42.84.56.00
Fax + 33.4.42.84.65.45
Sartorius Stedim Aseptics S.A.S.
Zone Industrielle de Saux, Rue Ampère
65100 Lourdes
Phone + 33.5.62.42.73.73
Fax + 33.5.62.42.08.44
Sartorius France S.A.S.
2, rue Antoine Laurent de Lavoisier
Zone d’activité de la Gaudrée
91410 Dourdan
Phone + 33.1.70.62.50.00
Fax + 33.1.64.59.76.39
Hungary
Sartorius Stedim Hungária Kft.
Kagyló u. 5
2092 Budapest
Phone + 36.23.457.227
Fax + 36.23.457.147
Sartorius Hungária Kft.
Kagyló u. 5
2092 Budapest
Phone + 36.23.457.227
Fax + 36.23.457.147
Ireland
Sartorius Stedim Ireland Ltd.
Unit 41, The Business Centre
Stadium Business Park
11 Dublin
Phone + 44.1372.737100
Fax + 44.1372.726171
Sartorius Ireland Ltd.
Unit 41, The Business Centre
Stadium Business Park
11 Dublin
Phone + 44.1372.737100
Fax + 44.1372.726171
Italy
Sartorius Stedim Italy S.r.l.
Via dell' Antella 76/A
50012 Antella – Bagno a Ripoli (Florence)
Phone + 39.055.6340.41
Fax + 39.055.6340.526
Sartorius Italy S.r.l.
Viale Alfonso Casati 4
20835 Muggiò (Monza e Brianza)
Phone + 39.039.4659.1
Fax + 39.039.4659.88
Poland
Sartorius Stedim Poland sp. z o.o.
ul. Wrzesinska 70
62 - 025 Kostrzyn
Phone + 48.61.647.38.40
Fax + 48.61.879.25.04
Sartorius Poland sp z o.o.
ul. Wrzesinska 70
62 - 025 Kostrzyn
Phone + 48.61.647.38.30
Fax + 48.61.647.38.39
Russia
LLC Sartogosm
River Volkova Embankment 9,
litera A, premises 1 -N, 3 -N, 4 -N
192102 St. Petersburg
Phone + 7.812.380.25.69
Fax + 7.812.380.25.62
LLC Sartorius Stedim RUS
5th line V.O. 70, litera A,
premises 110 - 120, 128 - 130 / 11N
199178 St. Petersburg
Phone + 7.812.327.53.27
Fax + 7.812.327.53.23
LLC Sartorius RUS
5th line V.O. 70, litera A,
premises 102 - 109, 121 - 126 / 11N
199178 St. Petersburg
Phone + 7.812.327.53.27
Fax + 7.812.327.53.23
194 Supplementary Information Addresses
Spain
Sartorius Stedim Spain S.A.
Avda. de la Industria, 32,
Edificio PAYMA
28108 Alcobendas (Madrid)
Phone + 34.90.212.3367
Fax + 34.91.358.9623
Sartorius Spain S.A.
Avda. de la Industria, 32,
Edificio PAYMA
28108 Alcobendas (Madrid)
Phone + 34.90.211.0935
Fax + 34.91.358.9623
Sartorius Sales Office
Carrer del Comte Borell, 210
08929 Barcelona
Phone + 34.93.4510560
Fax + 34.93.4513755
Sweden
Sartorius Stedim Data Analytics AB
Tvistevaegen 48
907 36 Umeå
Phone + 46.90.184800
Fax + 46.90.184899
Sartorius Stedim Data Analytics AB
Arenagatan 8b
215 33 Malmo
Phone + 46.40.664.25.80
Fax + 46.40.664.25.85
Switzerland
Sartorius Stedim Switzerland AG
Ringstrasse 24a
8317 Tagelswangen
Phone + 41.52.354.36.36
Fax + 41.52.354.36.46
biotech.switzerland@sartorius-
stedim.com
UK
Sartorius Stedim UK Ltd.
Longmead Business Centre, Blenheim Road
KT19 9 QQ Epsom, Surrey
Phone + 44.1372.737100
Fax + 44.1372.726171
Sartorius Stedim Lab Ltd.
Sperry Way, Stonehouse Park
GL10 3UT Stonehouse, Gloucestershire
Phone + 44.1453.821972
Fax + 44.1453.827928
Sartorius UK Ltd.
Longmead Business Centre, Blenheim Road
KT19 9 QQ Epsom, Surrey
Phone + 44.1372.737159
Fax + 44.1372.726171
The Automation Partnership (Cambridge) Ltd.
Grantham Close, York Way
SG8 5WY Royston Hertfordshire
Phone + 44.1763.227200
Fax + 44.1763.227201
Sartorius Stedim BioOutsource Ltd.
1 Technology Terrace, Acre Road,
Todd Campus, West of Scotland Science Park
G20 0XA Glasgow
Phone + 44.141.946.4222
Fax + 44.141.946.4552
Israel
Sartorius Israel Ltd.
Kibbutz
25115 Beit Haemek
Phone + 972.4.9960.687
Fax + 972.4.9960.639
North America
Canada
Sartorius Canada Inc.
1173 North Service Road West, Unit D- 4
L6M 2V9 Oakville, ON
Phone + 1.905.569.7977
Fax + 1.905.569.7021
Puerto Rico
Sartorius Stedim Filters Inc.
Carretera 128 Int. 376,
Barriada Arturo Lluveras Road 128
00698 Yauco,
Phone + 1.787.856.5020
Fax + 1.787.856.7945
USA
Sartorius Stedim North America Inc.
5 Orville Dr Suite 200
11716 Bohemia, NY
Phone + 1.631.254.4249
Fax + 1.631.254.4264
Sartorius North America Inc.
5 Orville Dr Suite 200
11716 Bohemia, NY
Phone + 1.631.254.4249
Fax + 1.631.254.4264
Sartorius Corporation
5 Orville Dr Suite 200
11716 Bohemia, NY
Phone + 1.631.254.4249
Fax + 1.631.254.4252
Supplementary Information Addresses 195
Essen Instruments Inc.
300 West Morgan Road
48108 Ann Arbor, MI
Phone + 1.734.769.1600
Fax + 1. 734.769.7295
IntelliCyt Corporation
5700 Pasadena Ave NE
87113 Albuquerque, NM
Phone + 1.505.345.9075
Fax + 1.866.782.3140
Latin America
Argentina
Sartorius Argentina S.A.
Int. A. Avalos 4251
B1605ECS Munro, Buenos Aires
Phone + 54.11.47.210505
Fax + 54.11.47.622333
Brazil
Sartorius do Brasil Ltda.
Avenida Senador Vergueiro,
2962, Bairro Anchieta
CEP: 09600–004 São Bernardo do Campo, SP
Phone + 55.11.4362.8900
Fax + 55.11.4362.8901
Mexico
Sartorius de México S.A. de C.V.
Libramiento Norte del Tepotzotlán,
int. 5, Tlacatego
54605 Tepotzotlán, Estado de México
Phone + 52.55.5562.1102
Fax + 52.55.5562.2942
Peru
Sartorius Peru S.A.C.
Avda. Alberto del Campo 411, Floor 12,
The Office Magdalena del Mar
15076 San Isidro, Lima
Phone + 51.1.441.0158
Fax + 51.1.422.6100
Africa
Tunisia
Sartorius Stedim Bioprocess SARL
Km 24, Route de Zaghouan, BP 87
1145 Mohamdia
Phone + 216.79.397.014
Fax + 216.79.397.019
196 Supplementary Information Addresses
Asia | Pacific
China
Sartorius Stedim Biotech (Beijing) Co., Ltd.
Westside of the 2nd Floor, No. 33 Yu An Road,
Airport Economic Zone, Shunyi District
101300 Beijing
Phone + 86.10.8042.6516
Fax + 86.10.8042.6580
Sartorius Scientific Instruments
(Beijing) Co., Ltd.
Workshop Building, No. 33 Yu An Road,
Zone B, Tianzhu Airport Industry Zone,
Shunyi District
101300 Beijing
Phone + 86.10.8042.6300
Fax + 86.10.8042.6486
Sartorius Hong Kong Ltd.
Unit 1012, Lu Plaza, 2 Wing Yip Street,
Kwun Tong, Kowloon
00000 Hong Kong
Phone + 85.2.2774.2678
Fax + 85.2.2766.3526
Sartorius Stedim (Shanghai) Trading Co., Ltd.
3 rd Floor, North Wing, Tower1,
No. 4560 Jinke Road,
Zhangjian High-Tech park, Pudong District,
201210 Shanghai
Phone + 86.21.6878.2300
Fax + 86.21.6878.2332
Sartorius (Shanghai) Trading Co., Ltd.
3 rd Floor, North Wing, Tower 1,
No. 4560 Jinke Road,
Zhangjian High-Tech park, Pudong District,
201210 Shanghai
Phone + 86.21.6878.2300
Fax + 86.21.6878.2332
India
Sartorius Stedim India Pvt. Ltd.
#69/2 & 69/3, Jakkasandra
562123 Nelamangala, Bangalore
Phone + 91.80.43505.250
Fax + 91.80.43505.253
Sartorius India Pvt. Ltd.
#69/2 & 69/3, Jakkasandra
562123 Nelamangala, Bangalore
Phone + 91.80.43505.250
Fax + 91.80.43505.253
Japan
Sartorius Stedim Japan K.K.
Daiwa Shinagawa North Bldg. 4F,
Kita-Shinagawa 1 - 8 - 11, Shinagawa-Ku
140 – 0001 Tokyo
Phone + 81.3.3740.5407
Fax + 81.3.3740.5406
Sartorius Japan K.K.
Daiwa Shinagawa North Bldg. 4F,
Kita-Shinagawa 1 - 8 - 11, Shinagawa-Ku
140 – 0001 Tokyo
Phone + 81.3.3740.5407
Fax + 81.3.3740.5406
Essen BioScience K.K.
301 Daiya Office, 5 - 18 - 4, Taito
110 - 0005 Tokyo
Phone + 81.3.5826 - 4795
Fax + 81.3. 5826 - 4794
Malaysia
Sartorius Stedim Malaysia Sdn. Bhd.
Lot L3 -E- 3B, Enterprise 4,
Technology Park Malaysia, Bukit Jalil
57000 Kuala Lumpur
Phone + 60.3.899.60622
Fax + 60.3.899.60755
Sartorius Malaysia Sdn. Bhd.
Lot L3 -E- 3B, Enterprise 4,
Technology Park Malaysia, Bukit Jalil
57000 Kuala Lumpur
Phone + 60.3.899.60622
Fax + 60.3.899.60755
Supplementary Information Addresses 197
Singapore
Sartorius Stedim Singapore Pte. Ltd.
10 Science Park Road,
The Alpha #02 – 013/14
Singapore Science Park II
117684 Singapore
Phone + 65.6872.3966
Fax + 65.6778.2494
Sartorius Singapore Pte. Ltd.
10 Science Park Road,
The Alpha #02 – 013/14
Singapore Science Park II
117684 Singapore Phone + 65.6872.3966
Fax + 65.6778.2494
South Korea
Sartorius Korea Biotech Co., Ltd.
8F Solid Space, Pangyoyeok-Ro 220,
Bundang-Gu
463 - 400 Seongnam-Si, Gyeonggi-Do
Phone + 82.31.622.4900
Fax + 82.31.627.5790
Sartorius Korea Ltd.
8F Solid Space, Pangyoyeok-Ro 220,
Bundang-Gu
463 - 400 Seongnam-Si, Gyeonggi-Do
Phone + 82.31.622.4900
Fax + 82.31.627.5790
Thailand
Sartorius (Thailand) Co., Ltd.
129 Rama 9 Road, Huaykwang
10310 Bangkok
Phone + 66.2643.8361
Fax + 66.2643.8367
Vietnam
Sartorius Representative Office
Unit C, 17th floor, A Tower, BIG Building
18 Pham Hung Street
My Dinh, Tu Liem, Hanoi
Phone + 84.4.3795.5587
Fax + 84.4.3795.5589
Australia
Sartorius Stedim Australia Pty. Ltd.
Unit 5, 7 - 11 Rodeo Drive
3175 Dandenong South, Victoria
Phone + 61.3.8762.1800
Fax + 61.3. 8762.1828
Sartorius Australia Pty. Ltd.
Unit 5, 7 - 11 Rodeo Drive
3175 Dandenong South, Victoria
Phone + 61.3.8762.1800
Fax + 61.3.8762.1828
For further addresses, please visit our website on the Internet at: www.sartorius.com.

198 Supplementary Information Addresses
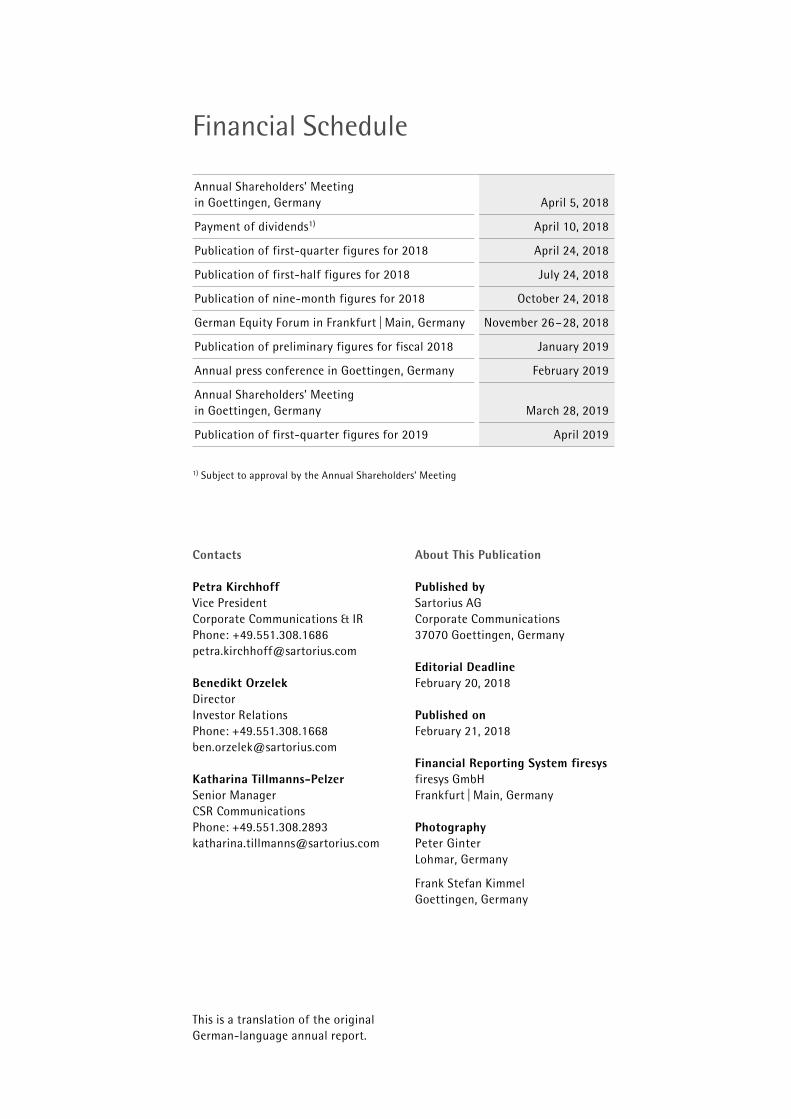
Annual Shareholders’ Meetingin Goettingen, Germany April 5, 2018
Payment of dividends1) April 10, 2018
Publication of first-quarter figures for 2018 April 24, 2018
Publication of first-half figures for 2018 July 24, 2018
Publication of nine-month figures for 2018 October 24, 2018
German Equity Forum in Frankfurt | Main, Germany November 26–28, 2018
Publication of preliminary figures for fiscal 2018 January 2019
Annual press conference in Goettingen, Germany February 2019
Annual Shareholders’ Meetingin Goettingen, Germany March 28, 2019
Publication of first-quarter figures for 2019 April 2019
1) Subject to approval by the Annual Shareholders’ Meeting
Contacts
Petra KirchhoffVice PresidentCorporate Communications & IRPhone: [email protected]
Benedikt OrzelekDirectorInvestor RelationsPhone: [email protected]
Katharina Tillmanns-PelzerSenior ManagerSustainability RelationsPhone: [email protected]
Financial Schedule
About This Publication
Published bySartorius AGCorporate Communications37070 Goettingen, Germany
Editorial DeadlineFebruary 20, 2018
Published onFebruary 21, 2018
Financial Reporting System firesysfiresys GmbHFrankfurt | Main, Germany
PhotographyPeter GinterLohmar, Germany
Frank Stefan KimmelGoettingen, Germany
This is a translation of the originalGerman-language annual report.
Key Figures
1) Underlying = excluding extraordinary items2) After non-controlling interest, adjusted for extraordinary items and non-cash amortization, as well as based on the normalized financial
result, including the corresponding tax effects for each of these items3) Restated4) Adjusted for stock split; rounded values5) Amounts suggested by the Supervisory Board and the Executive Board of Sartorius AG6) Including discontinued operation7) Excluding TAP Biosystems
All figures are given in millions of ¤ according 2017 2016 2015 2014 2013 2013to the IFRS, unless otherwise specified restated
Order intake, sales revenue and earningsOrder intake 1,501.4 1,334.7 1,172.7 929.2 819.6 912.3
Sales revenue 1,404.6 1,300.3 1,114.8 891.2 791.6 887.3
Underlying EBITDA1) 353.2 325.4 263.2 186.8 162.3 172.6
Underlying EBITDA1) as a % of sales revenue 25.1 25.0 23.6 21.0 20.5 19.5
Relevant net profit for continuing operations2) 144.0 132.6 107.4 66.1 59.2 –
Relevant net profit2) 144.0 132.6 107.4 73.7 64.8 64.8
Research and development costs 68.8 59.4 52.5 43.63) 47.7 53.8
Financial data per share4)
Earnings per share continued operations2)
per ordinary share (in ¤) 2.10 1.93 1.57 0.96 0.86 –
per preference share (in ¤) 2.11 1.94 1.58 0.97 0.87 –
Earnings per share2)
per ordinary share (in ¤) 2.10 1.93 1.59 1.07 0.95 0.95
per preference share (in ¤) 2.11 1.94 1.60 1.08 0.96 0.96
Dividends
per ordinary share (in ¤) 0.505) 0.45 0.37 0.26 0.25 0.25
per preference share (in ¤) 0.515) 0.46 0.38 0.27 0.26 0.26
Balance sheetBalance sheet total 2,297.7 1,753.0 1,437.2 1,273.0 1,181.3 1,176.6
Equity 806.6 736.8 644.8 497.7 450.3 450.3
Equity ratio (in %) 35.1 42.0 44.9 39.1 38.1 38.3
FinancialsCapital expenditures 209.4 152.1 113.1 80.9 60.6 62.9
Capital expenditures as a % of sales 14.9 11.7 10.1 9.1 7.7 7.1
Depreciation and amortization 98.3 75.7 58.9 52.7 45.8 47.7
Net cash from operating activities 206.5 170.4 124.4 129.7 97.0 103.3
Net debt 895.5 485.9 344.0 335.66) 345.16) 345.1
Gearing (underlying) 2.5 1.5 1.3 1.76) 2.06) 2.0
Total number of employees as of December 31 7,501 6,911 6,185 5,611 5,1587) 5,8637)
Order Intake and Sales Revenue¤ in millions
912.3 819.6 929.2 1,172.7 1,334.7 1,501.4887.3 791.6 891.2 1,114.8 1,300.3 1,404.6
1,650
1,375
1,100
825
550
2013 2013 2014 2015 2016 2017Continued operations
■ Order intake■Sales revenue
Underlying EBITDA and Margin1)
172.6 162.3 186.8 263.2 325.4 353.219.5 20.5 21.0 23.6 25.0 25.1
400 30
300 27
200 24
100 21
0 18
2013 2013 2014 2015 2016 2017Continued operations
■ Underlying EBITDA in millions of ¤Underlying EBITDA margin in %
Annual Shareholders’ Meeting in Goettingen, Germany April 5, 2018
Payment of dividends1) April 10, 2018
Publication of first-quarter figures for 2018 April 24, 2018
Publication of first-half figures for 2018 July 24, 2018
Publication of nine-month figures for 2018 October 24, 2018
German Equity Forum in Frankfurt | Main, Germany November 26 – 28, 2018
Publication of preliminary figures for fiscal 2018 January 2019
Annual press conference in Goettingen, Germany February 2019
Annual Shareholders’ Meeting in Goettingen, Germany March 28, 2019
Publication of first-quarter figures for 2019 April 2019
1) Subject to approval by the Annual Shareholders’ Meeting
Contacts
Petra KirchhoffVice President Corporate Communications & IRPhone: [email protected]
Benedikt OrzelekDirector
elationsInvestor RPhone: +49.551.308.1668 [email protected]
Katharina Tillmanns-PelzerSenior ManagerCSR CommunicationsPhone: +49.551.308.2893 [email protected]
Financial Schedule
About This Publication
Published bySartorius AGCorporate Communications37070 Goettingen, Germany
Editorial DeadlineFebruary 20, 2018
Published onFebruary 21, 2018
Financial Reporting System firesysfiresys GmbH Frankfurt | Main, Germany
PhotographyPeter GinterLohmar, Germany
Frank Stefan KimmelGoettingen, Germany
This is a translation of the original German-language annual report.
Key Figures
1) Underlying = excluding extraordinary items2) After non-controlling interest, adjusted for extraordinary items and non-cash amortization, as well as based on the normalized financial
result, including the corresponding tax effects for each of these items3) Restated4) Adjusted for stock split; rounded values5) Amounts suggested by the Supervisory Board and the Executive Board of Sartorius AG6) Including discontinued operation7) Excluding TAP Biosystems
All figures are given in millions of ¤ according 2017 2016 2015 2014 2013 2013to the IFRS, unless otherwise specified restated
Order intake, sales revenue and earningsOrder intake 1,501.4 1,334.7 1,172.7 929.2 819.6 912.3
Sales revenue 1,404.6 1,300.3 1,114.8 891.2 791.6 887.3
Underlying EBITDA1) 353.2 325.4 263.2 186.8 162.3 172.6
Underlying EBITDA1) as a % of sales revenue 25.1 25.0 23.6 21.0 20.5 19.5
Relevant net profit for continuing operations2) 144.0 132.6 107.4 66.1 59.2 –
Relevant net profit2) 144.0 132.6 107.4 73.7 64.8 64.8
Research and development costs 68.8 59.4 52.5 43.63) 47.7 53.8
Financial data per share4)
Earnings per share continued operations2)
per ordinary share (in ¤) 2.10 1.93 1.57 0.96 0.86 –
per preference share (in ¤) 2.11 1.94 1.58 0.97 0.87 –
Earnings per share2)
per ordinary share (in ¤) 2.10 1.93 1.59 1.07 0.95 0.95
per preference share (in ¤) 2.11 1.94 1.60 1.08 0.96 0.96
Dividends
per ordinary share (in ¤) 0.505) 0.45 0.37 0.26 0.25 0.25
per preference share (in ¤) 0.515) 0.46 0.38 0.27 0.26 0.26
Balance sheetBalance sheet total 2,297.7 1,753.0 1,437.2 1,273.0 1,181.3 1,176.6
Equity 806.6 736.8 644.8 497.7 450.3 450.3
Equity ratio (in %) 35.1 42.0 44.9 39.1 38.1 38.3
FinancialsCapital expenditures 209.4 152.1 113.1 80.9 60.6 62.9
Capital expenditures as a % of sales 14.9 11.7 10.1 9.1 7.7 7.1
Depreciation and amortization 98.3 75.7 58.9 52.7 45.8 47.7
Net cash from operating activities 206.5 170.4 124.4 129.7 97.0 103.3
Net debt 895.5 485.9 344.0 335.66) 345.16) 345.1
Gearing (underlying) 2.5 1.5 1.3 1.76) 2.06) 2.0
Total number of employees as of December 31 7,501 6,911 6,185 5,611 5,1587) 5,8637)
Order Intake and Sales Revenue¤ in millions
912.3 819.6 929.2 1,172.7 1,334.7 1,501.4887.3 791.6 891.2 1,114.8 1,300.3 1,404.6
1,650
1,375
1,100
825
550
2013 2013 2014 2015 2016 2017Continued operations
■ Order intake■Sales revenue
Underlying EBITDA and Margin1)
172.6 162.3 186.8 263.2 325.4 353.219.5 20.5 21.0 23.6 25.0 25.1
400 30
300 27
200 24
100 21
0 18
2013 2013 2014 2015 2016 2017Continued operations
■ Underlying EBITDA in millions of ¤Underlying EBITDA margin in %
d-GB2017-Konzern-Umschlag_einzeln.indd 3 15.02.18 15:45
Sartorius AG Otto-Brenner-Strasse 2037079 Goettingen, Germany
Phone: +49.551.308.0Fax: +49.551.308.3289
Sartorius Group | 2017 Annual Report
©Sar
tori
us A
G |
Pri
nted
in G
erm
any
| Pu
blic
atio
n N
o. O
G-0
052-
e171
201
| O
rder
No.
860
00-0
02-1
9
Sartorius Group2017 Annual Report
d-GB2017-Konzern-Umschlag_einzeln.indd 4 14.02.18 15:31