Embed Size (px)
Citation preview

Management Report
18 Management Report Structure and Management of the Group
Group Legal Structure
Sartorius Stedim Biotech is a globally operating company with subsidiaries in more than 20 countries and more than 6,200 employees worldwide. The parent company of the Sartorius Stedim Biotech Group is Sartorius Stedim Biotech S.A., headquartered in Aubagne, France.
Sartorius Stedim Biotech S.A. is listed on the Euronext stock exchange in Paris. Approximately 74% of the share capital and around 85% of the voting rights of Sartorius Stedim Biotech S.A. are held by Sartorius AG.
Sartorius AG is a leading international provider of bioprocess and laboratory equipment and technology and is headquartered in Göttingen, Germany. It is listed on the German Stock Exchange and operates two divisions: the bioprocess business as a subgroup under its parent corporation Sartorius Stedim Biotech S.A., and the laboratory business as a further subgroup.
The consolidated financial statements of the Sartorius Stedim Biotech Group include Sartorius Stedim Biotech S.A. and all affiliates in which Sartorius Stedim Biotech S.A. has a controlling interest pursuant to IFRS 10.
Organization and Management of the Group
The Sartorius Stedim Biotech Group is largely organized by function on a worldwide basis. Accordingly, the respective management responsi-bilities are performed along the company’s core functions across all sites and regions.
This global functional organization forms an effective platform for central strategic control and for fast, efficient collaboration and execution within the Group. It enables the company to realize its total solutions provider strategy and position itself effectively in respect of global customers.
The Board of Directors of Sartorius Stedim Biotech S.A. is composed of eight members, one executive director and seven non-executive directors.
Implementing the Group’s various strategies and initiatives at the local level is the responsibility of the national affiliates.
The management bodies of the local companies run their organizations in accordance with applicable statutory provisions, articles of association, and rules of procedure, and in keeping with the principles of corporate governance that apply throughout the Sartorius Stedim Biotech Group worldwide. Please see details of the Board of Directors in the section “Corporate Governance.”
Changes in the Group Portfolio
Sartorius Stedim Biotech acquired a majority stake in Biological Industries, an Israeli cell culture media developer and manufacturer. For approximately €45 million in cash, just over 50% of the shares of the company were taken over from its owners, Kibbutz Beit Haemek and the private equity fund Fortissimo Capital. An option to acquire a further 20% of the shares within three years was also agreed upon.
Biological Industries focuses on cell culture media, particularly for cell and gene therapy, regenerative medicine and other advanced therapies. Founded in 1981, the company currently employs approximately 130 people mainly at its headquarters close to Haifa, Israel. Sales revenue in 2019 totaled more than €20 million, with a double-digit underlying EBITDA margin.
In October 2019, Sartorius Stedim Biotech agreed to acquire parts of Danaher’s Life Science portfolio as part of a broader transaction between Danaher and the Sartorius Group. The total purchase price is approximately $750 million in cash of which about a quarter will be allocated to the businesses purchased by Sartorius Stedim Biotech. The final purchase price allocation is subject to the closing process.
The businesses to be acquired by Sartorius Stedim Biotech had combined sales revenue of approximately $70 million in 2018 and strong double-digit profit margins. They employ approximately 110 people worldwide.
The proposed transaction is expected to be completed in the first quarter of 2020 and is subject to customary closing conditions and the successful acquisition of the GE Biopharma business by Danaher.
Structure and Management of the Group
Management Report Structure and Management of the Group 19
Financial Controlling and Key Performance Indicators
The Sartorius Stedim Biotech Group is managed using a number of key performance indicators, which are also decisive for determination of the variable remuneration component for the Executive Committee and managers.
The key management parameter that Sartorius Stedim Biotech uses to measure the development of its size is currency-adjusted growth of sales revenue.
The key performance measure for profitability is EBITDA adjusted for extraordinary items, i.e. underlying EBITDA, and the corresponding margin. For a definition of this term and more information on its presentation, see the Glossary on page 212.
Regarding the debt financing capacity of the Sartorius Stedim Biotech Group, a further key indicator is the ratio of net debt to underlying EBITDA for the last twelve months.
Moreover, the capex ratio, i.e. capital expenditures relative to sales revenue, represents a key control parameter.
The following financial and non-financial indicators are also reported on a regular basis:
– Order intake– Underlying net profit | Earnings per share– Net profit | Earnings per share– Equity ratio– Net working capital– Net cash flow from operating activities– Number of employees
The annual financial forecast published at the beginning of a fiscal year for the Group generally refers to the development of sales revenue and of underlying EBITDA margin. The expected capex ratio, as well as a directional forecast for the ratio of net debt to underlying EBITDA, is also indicated for the Group.
20 Management Report Business Model, Strategy and Goals
Market and Strategic Positioning
As a leading partner of the biopharmaceutical industry, we help our customers to develop their production processes and manufacture medications more efficiently. Our objective is to achieve scientific and technological progress in life sciences and in bioprocessing to enable more people to have access to advanced therapies and medicines.
We focus on this attractive market, which is characterized by strong growth momentum and long-term trends. Primary growth drivers are a growing world population and an increase in age-related diseases in industrialized countries. In addition, rising incomes in emerging countries are leading to improved access to healthcare and rising demand for medications. Medical advances are also driving the ongoing development and approval of new biopharmaceuticals as well as of emerging biosimilars, which are highly similar to established biologics already licensed, and account for a share of the biopharma market that is currently still small, but fast-growing. As a result of these factors, the volumes of biotech medications are steadily increasing and so is the demand for the appropriate production technologies. This market is largely independent of business cycles.
The maturity and intensity of competition in this still comparably young biopharmaceutical industry are successively increasing. In addition to achieving scientific success, our customers will find it more important, in view of mounting cost pressure on healthcare systems, to increase the efficiency of their research, development and manufacturing processes. We help them meet this challenge by further developing our product portfolio. One of the decisive success factors of Sartorius Stedim Biotech is to use technology in order to differentiate ourselves from our competitors. Our innovative power rests on three pillars: our own specialized product development, the integration of innovations through acquisitions, and alliances with partners in complementary fields.
Another competitive advantage of Sartorius Stedim Biotech is its broad understanding of applications, which is based on its clear focus on the sector. We are thoroughly familiar with our customers' entire added-value chains, especially the interactivity of the systems in these chains. All this makes us a strategic partner of these customers who drive forward innovations in bioprocess technology.
Business Model, Strategy and Goals
Management Report Business Model, Strategy and Goals 21
Products & Services
We offer a broad portfolio of products that focuses on all major steps in the manufacture of a biopharmaceutical, as well as in process development, as prerequisite procedures. Our technologies cover, inter alia, cell line technologies, cell culture media, bioreactors, and a wide range of products for separation, purification and concentration of biological intermediates and finished products, as well as solutions for their storage and transportation. Sartorius Stedim Biotech also offers data analytics software for modeling and optimizing processes of biopharmaceutical development and production. In its core technologies, the company has leading market positions with high double-digit market shares.
The breadth of our product portfolio sets us apart from our competitors. We provide customers with an entire production unit from a single source, as well as assist with preceding project planning, process integration and subsequent validation.
As an innovation leader, Sartorius Stedim Biotech is among the very first biopharmaceutical suppliers to have specialized in single-use technologies, which account for approximately three-quarters of the Group's sales revenue. Due to their cost advantages and their greater flexibility and safety compared with
reusable technologies, the pharmaceutical industry is increasingly relying on single-use products. Particularly in pre-commercial production processes, single-use products have almost completely supplanted classic stainless steel components. Industry observers believe that market penetration is likely to continue as commercial production also increasingly moves toward single-use products. As a result, we generate a large share of sales from repeat business. The high approval requirements placed on our customers' products are also contributing to this growth. Because our customers' production processes must be validated by the health authorities responsible, the technological components initially used can be replaced only at considerable expense once they have been approved. The manufacturers of medications are therefore closely tied to the suppliers for the life cycle of a medication. Beyond this, our broad and stable customer base that we address through our specialized sales force, directly for the most part, also contributes to this favorable risk profile.
The strong strategic positioning of Sartorius Stedim Biotech and the above-average expansion of the sector are a good foundation for profitable growth in the future as well. Beyond realizing our organic development potential, we also aim to further expand the portfolio through complementary acquisitions and alliances.
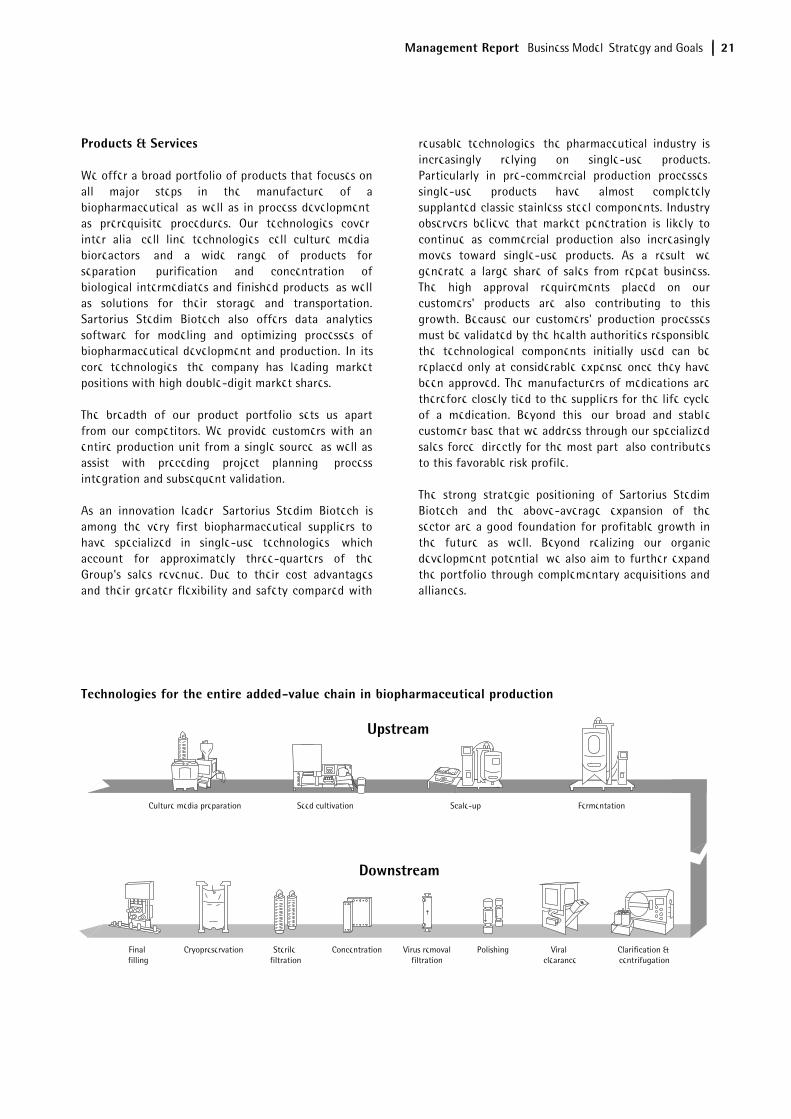
Technologies for the entire added-value chain in biopharmaceutical production
Virus removal
filtrationViral
clearancePolishingFinal
fillingCryopreservation ConcentrationSterile
filtration
Culture media preparation FermentationSeed cultivation Scale-up
Clarification & centrifugation
Upstream
Downstream
22 Management Report Business Model, Strategy and Goals
Sartorius Stedim Biotech 2020 and 2025 Strategies
In 2011, Sartorius Stedim Biotech presented its strategy and targets for profitable growth up to 2020 according to which sales revenue is projected to increase in a range of around €1.5 to €1.6 billion with an underlying EBITDA margin of about 29% to 30%.
While the targets for 2020 still continue to apply unchanged, management extended its projected time horizon and announced its long-term targets for up to 2025. Accordingly, Sartorius Stedim Biotech plans to increase its revenue in the period of 2020 to 2025 to around €2.8 billion, given the high market dynamics and the company's strong strategic positioning. The underlying EBITDA margin is forecasted to increase to around 30%.
In these projections, management takes into account that any future acquisitions in the Group would initially be margin-dilutive and that no significant changes in key exchange rates would occur.
These targets are being implemented by various growth initiatives with the following focal points:
Expansion of the Product Portfolio
Sartorius Stedim Biotech offers a broad product portfolio that is continuously expanded in line with the value-added chain of the biopharmaceutical industry. Aside from our own research and development activities and strategic partnerships, acquisitions that are complementary to or extend our strengths appropriately will remain part of our strategy. We see opportunities in digital networking of products, for example, in the integration of software solutions for bioprocess production control, among others. Expansion into adjacent applications, such as regenerative medicine, is also conceivable. The focus of our efforts will be products that offer solutions to the challenges our customers face and that make our offering even more attractive from the customers' perspective.
Regional Growth Initiatives
North America and Asia are the key focal areas of our regional growth strategy.
North America is the world's largest market for bioprocess equipment. Yet because it is home to our main competitors, Sartorius Stedim Biotech has lower market share in this region than in Europe and Asia. Accordingly, the company is striving to gain additional market share, primarily by strengthening its sales and service capacities.
A further strategic focus is on China. This market offers sizable growth potential owing to rising private and public healthcare expenditures and the rapid development of regional biopharmaceutical plants. To benefit from the dynamic development of this market, Sartorius Stedim Biotech has already been investing heavily in its sales infrastructure and plans to expand production capacity levels there over the medium term.
Optimization of Work Processes
Sufficient production capacity and a powerful supply chain are an essential foundation of future growth. For this reason, in recent years Sartorius Stedim Biotech has substantially expanded its capacities for membranes, filters and single-use bags at various Group sites. Beyond this, implementation of a new ERP system based on Group-wide standardized business processes was completed in 2019.
Following these significant infrastructural expansions, our focus is increasingly shifting to optimization of our processes. Thus, we are driving forward digitalization and process automation in all parts of the company to further enhance the performance power of our supply chain and our customer contact interfaces. This also includes extending our activities in the areas of e-commerce, digital marketing and analytics.
Management Report Sector Conditions 23
Sartorius Stedim Biotech serves customers mainly in the biopharmaceutical industry, which makes its business particularly sensitive to the development of this industry.
Strong Growth in the Biopharmaceutical Market
According to estimates from several market observers, the global pharmaceutical market showed positive development once again in 2019, with an increase of approximately 4% to 5%. Within this market, the segment for medications and vaccinations manufactured using biotech methods has grown faster than the rest of the pharmaceutical market for many years now. In 2019, the biopharmaceutical market was estimated at a volume of €235 billion, an increase of approximately 8% to 9% over the previous year. The steadily growing significance and acceptance of biologics is reflected in its increasing share of the sales revenue in the global pharmaceutical market and the development activities of the pharmaceutical industry. For example, biopharmaceutical compounds account for more than 40% of the R&D pipeline.
Manufacturers of biopharmaceutical development and production technologies were able to increase sales markedly in 2019. There was once again a dynamic rise in demand in emerging countries – especially China – where many commercial biopharmaceutical production facilities were erected in recent years to meet domestic demand. But there was also considerable investment in the United States and Europe, where the largest fermenter capacities are located.
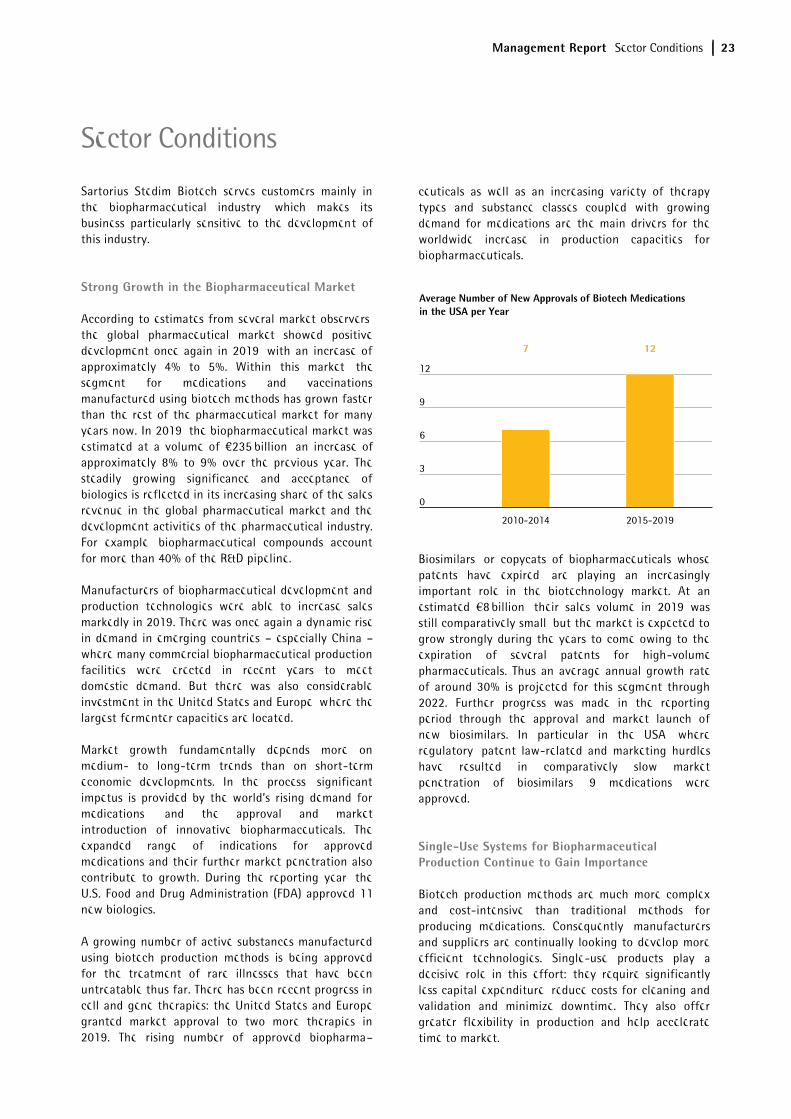
Market growth fundamentally depends more on medium- to long-term trends than on short-term economic developments. In the process, significant impetus is provided by the world’s rising demand for medications, and the approval and market introduction of innovative biopharmaceuticals. The expanded range of indications for approved medications and their further market penetration also contribute to growth. During the reporting year, the U.S. Food and Drug Administration (FDA) approved 11 new biologics.
A growing number of active substances manufactured using biotech production methods is being approved for the treatment of rare illnesses that have been untreatable thus far. There has been recent progress in cell and gene therapies: the United States and Europe granted market approval to two more therapies in 2019. The rising number of approved biopharma–
ceuticals as well as an increasing variety of therapy types and substance classes coupled with growing demand for medications are the main drivers for the worldwide increase in production capacities for biopharmaceuticals.
Biosimilars, or copycats of biopharmaceuticals whose patents have expired, are playing an increasingly important role in the biotechnology market. At an estimated €8 billion, their sales volume in 2019 was still comparatively small, but the market is expected to grow strongly during the years to come owing to the expiration of several patents for high-volume pharmaceuticals. Thus an average annual growth rate of around 30% is projected for this segment through 2022. Further progress was made in the reporting period through the approval and market launch of new biosimilars. In particular in the USA, where regulatory, patent law-related and marketing hurdles have resulted in comparatively slow market penetration of biosimilars, 9 medications were approved.
Single-Use Systems for Biopharmaceutical Production Continue to Gain Importance
Biotech production methods are much more complex and cost-intensive than traditional methods for producing medications. Consequently, manufacturers and suppliers are continually looking to develop more efficient technologies. Single-use products play a decisive role in this effort: they require significantly less capital expenditure, reduce costs for cleaning and validation and minimize downtime. They also offer greater flexibility in production and help accelerate time to market.
7 12
2010-2014 2015-2019
7 12
0
3
6
9
12
Average Number of New Approvals of Biotech Medicationsin the USA per Year
Sector Conditions
24 Management Report Sector Conditions
Owing to these advantages, single-use technologies are already an established part of many process steps. Single-use systems are primarily employed in pre-commercial development activities and production phases, and in small-batch manufacturing. It can be expected that single-use technologies will become increasingly popular for the production of high-volume commercial quantities. This is particularly relevant to the production of biotech drugs, whose clinical development takes place in single-use systems. Sartorius offers the sector’s most extensive portfolio of single-use technologies, with scalable products for every step of manufacturing. The company is also actively helping the biopharmaceutical industry convert to these technologies in the production of medications.
Moderate Growth in the Global Laboratory Market
The global laboratory market reached a volume of €54 billion in the reporting year and is growing annually by 3% to 4.5%, according to estimates from several market observers. Market growth is related to the levels of research and development spending in the individual end markets, among other factors.
Laboratories from the pharmaceutical and biopharma industry are the leading customers for laboratory instruments and consumables. Against the backdrop of globally rising demand for medications, the industry is continuously investing in research to find new active substances, and in the laboratory equipment needed to perform this work. The focus is being placed on technologies related to process automation and innovative analytical instruments that are equipped with improved or new functionalities. Sales generated by key laboratory equipment companies with biopharma customers grew more strongly during the reporting year than did those with customers in other industries.
Research and quality-assurance labs in the chemical and food industry are another important customer group. This segment’s demand for laboratory products depends in part on economic trends. Additional momentum could also be generated by regulatory changes, such as stricter requirements for quality-assurance tests in the food industry. During the reporting year, the economy of key business regions continued to slow. As a result, these end markets tended to generate modest growth.
Academic and public-sector research institutions also use laboratory instruments and consumables. Growth in demand is related to such factors as government budgets and funding programs, all of which can vary from one country to another. In the United States, the National Institute of Health (NIH) is the leading government agency for biomedical research and the largest agency that provides research funding around the world. The NIH’s budget has constantly grown over the last six years. During the reporting year, it climbed by about 5.4% to €34 billion. The European Union is also planning to boost its funding programs for research and innovation starting in 2020. In recent years, China has sharply increased government R&D funding, a trend that has fueled dynamic growth in the laboratory market there. The country plans to continue increasing the share of research spending in GDP through 2020.
Competition
The primary means by which companies in the biotechnology market differentiate themselves from competitors are innovative process, and the quality and performance of their products. The biotechnology sector is constantly discovering new areas of application and expects suppliers to be equally fast-moving and creative in developing new equipment for the manufacture of biotech products. New suppliers, in particular, seek to capitalize on the opportunities inherent in this environment to gain a foothold in the market with carefully targeted niche products. The more established suppliers, meanwhile, are expanding their product range continuously.
We generate around 90% of our sales revenue from validated processes in which replacing products during the production cycle is very expensive, so we receive a high proportion of follow-up and repeat business. The particular strength of Sartorius Stedim Biotech lies in its integrated process solutions: we offer the broadest range in the industry, from drug discovery and development in the lab to commercial manufacture of the final product. Our strategic focus on single-use products gives us a further edge over the competition. Sartorius Stedim Biotech has leading positions on the global market for bioprocess filtration, fermentation, cell cultivation, fluid management and membrane chromatography.
Management Report Sector Conditions 25
Most of our competitors are multinationals based in the USA. Certain business units of Merck KGaA, Danaher Corp., General Electric Company and Thermo Fisher Scientific Inc. are among our main rivals in the bioprocess area; Thermo Fisher and Merck are key players in the laboratory field. We also face competition from smaller companies in individual segments. During the reporting year, Danaher announced the acquisition of General Electric’s biopharmaceutical business. Regulatory approvals for the transaction are expected during the first quarter of 2020.
Sources: IQVIA Institute: The Global Use of Medicine in 2019 and
Outlook to 2023, January 2019; Evaluate Pharma: World Preview
2019, Outlook to 2024, June 2019; BioPlan: 16th Annual Report
and Survey of Biopharmaceutical Manufacturing Capacity and
Production, April 2019; Frost & Sullivan: 2019 Mid-year Report:
Forecast and Analysis of the Global Market for Laboratory
Products, May 2019; BCC Research: Biosimilars: Global Markets,
March 2018; Daedal Research: Global Biologics Market: Size,
Trends & Forecasts, December 2019; www.fda.gov
26 Management Report Group Business Development
Sales Revenue and Order Intake
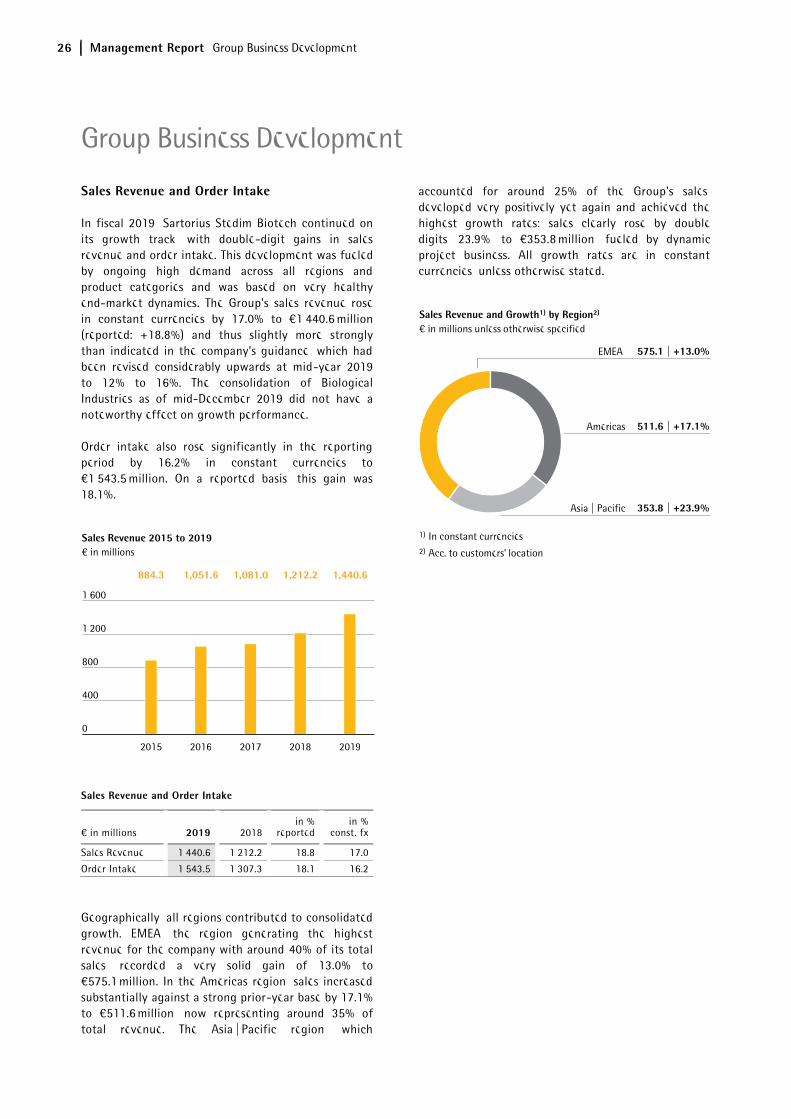
In fiscal 2019, Sartorius Stedim Biotech continued on its growth track, with double-digit gains in sales revenue and order intake. This development was fueled by ongoing high demand across all regions and product categories and was based on very healthy end-market dynamics. The Group's sales revenue rose in constant currencies by 17.0% to €1,440.6 million (reported: +18.8%) and thus slightly more strongly than indicated in the company's guidance, which had been revised considerably upwards at mid-year 2019 to 12% to 16%. The consolidation of Biological Industries as of mid-December 2019 did not have a noteworthy effect on growth performance.
Order intake also rose significantly in the reporting period by 16.2% in constant currencies to €1,543.5 million. On a reported basis, this gain was 18.1%.
Sales Revenue and Order Intake
€ in millions 2019 2018 Δ in %
reported Δ in %
const. fx
Sales Revenue 1,440.6 1,212.2 18.8 17.0
Order Intake 1,543.5 1,307.3 18.1 16.2
Geographically, all regions contributed to consolidated growth. EMEA, the region generating the highest revenue for the company with around 40% of its total sales, recorded a very solid gain of 13.0% to €575.1 million. In the Americas region, sales increased substantially against a strong prior-year base by 17.1% to €511.6 million, now representing around 35% of total revenue. The Asia | Pacific region, which
accounted for around 25% of the Group's sales, developed very positively yet again and achieved the highest growth rates: sales clearly rose by double digits, 23.9%, to €353.8 million, fueled by dynamic project business. All growth rates are in constant currencies, unless otherwise stated.
€ in millions
2015 2016 2017 2018 2019
884.3 1,051.6 1,081.0 1,212.2 1,440.6884.3 1,051.6 1,081.0 1,212.2 1,440.6
0
400
800
1,200
1,600
Sales Revenue 2015 to 2019 In constant currencies
Acc. to customers' location
1)
2)
€ in millions unless otherwise specified
EMEA
Americas
Asia | Pacific
575.1 | +13.0%
511.6 | +17.1%
353.8 | +23.9%
Sales Revenue and Growth1) by Region2)
Group Business Development
Management Report Group Business Development 27
Development of Costs and Earnings
In the reporting year, the cost of sales increased by 18.8% to €692.2 million. The cost of sales ratio remained unchanged at 48.1%.
Selling and distribution costs rose under-proportionately in comparison to sales growth, by 11.8% to €240.6 million. Consequently, the ratio of these costs to sales revenue decreased from 17.8% in 2018 to 16.7% in 2019.
Expenses for research and development increased year over year by 30.7% to €79.2 million. The ratio of R&D expenses to sales revenue was 5.5%, slightly above the prior-year level of 5.0%.
Concerning general administrative expenses, Sartorius Stedim Biotech reported an increase of 13.8% to €76.2 million. In relation to sales revenue, general administrative expenses decreased from 5.5% in the previous year to 5.3% in the reporting year.
At - €20.3 million, the balance of other operating income and expenses was significantly lower than the 2018 comparative figure of €13.5 million. These figures essentially comprise extraordinary items of -€16.8 million (previous year: €12.7 million) and were related to expenses incurred for various corporate projects and the implementation of new IT systems. The reason for the year-over-year decrease is that in 2018, extraordinary items as well as the balance of other operating income and expenses were strongly impacted by one-time income of €35.2 million resulting from the modification of the contract with the life science company Lonza in the area of cell culture media.
The absence of this non-recurring income in the reporting period is also reflected in the development of EBIT, which grew by 10.6% to €332.0 million against the backdrop of higher extraordinary expenses as well as depreciation and amortization. The EBIT margin fell to 23.0% (previous year: 24.8%).
The financial result was -€14.4 million in 2019 relative to -€15.7 million in 2018. This was essentially attributable to valuation effects related to foreign currency liabilities and hedging instruments.
In the reporting year, tax expenses of €81.4 million were higher than the prior-year total of €74.6 million. The company's tax rate was 25.6% compared with 26.2% in the year before.
In the reporting year, net profit attributable to shareholders of Sartorius Stedim Biotech S.A. amounted to €234.6 million, up from €208.1 million a year earlier.
Statement of Profit or Loss
€ in millions 2019 2018 Δ in %
Sales revenue 1,440.6 1,212.2 18.8
Cost of sales –692.2 –582.6 –18.8
Gross profit on sales 748.3 629.6 18.9
Selling and distribution costs –240.6 –215.2 –11.8
Research and development costs –79.2 –60.6 –30.7
General administrative expenses –76.2 –67.0 –13.8
Other operating income and expenses –20.3 13.5 –250.3
Earnings before interest and taxes (EBIT) 332.0 300.2 10.6
Financial income 6.9 5.3 28.4
Financial expenses –21.3 –21.0 –1.2
Financial result –14.4 –15.7 8.1
Profit before tax 317.6 284.5 11.6
Income taxes –81.4 –74.6 –9.2
Net result 236.2 210.0 12.5
Attributable to:
Equity holders of SSB S.A. 234.6 208.1 12.7
Non-controlling interest 1.6 1.9 –15.7
28 Management Report Group Business Development
Earnings
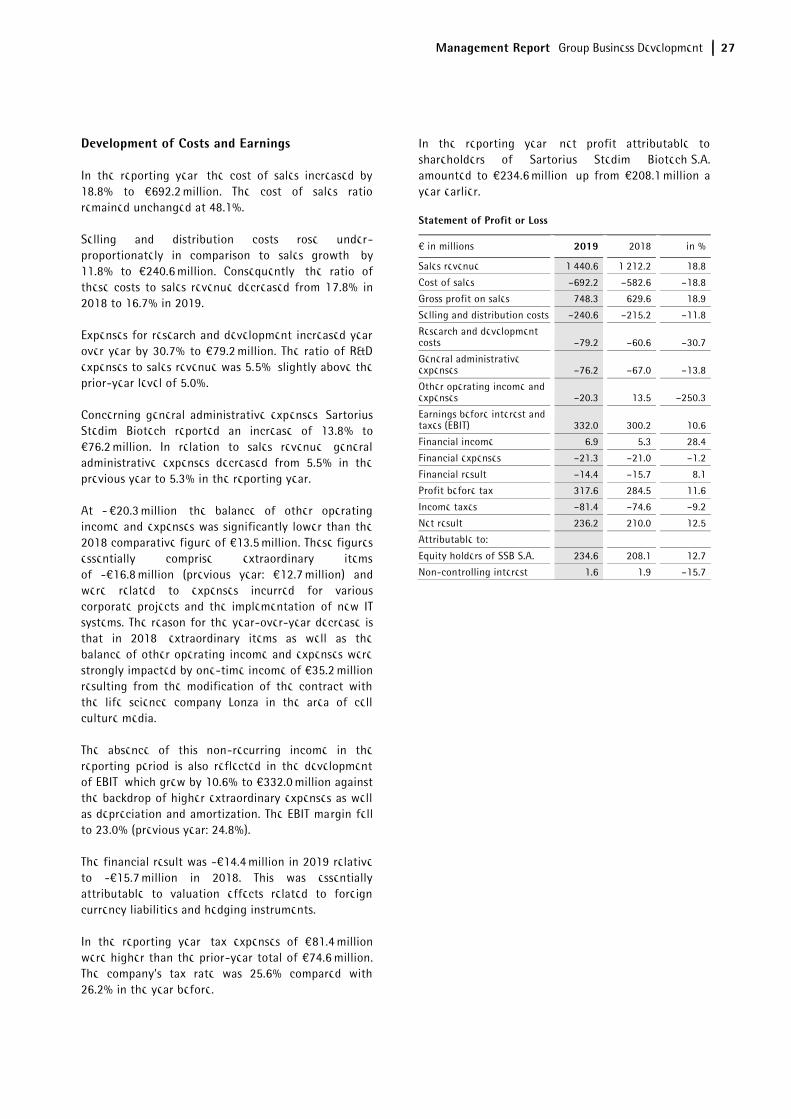
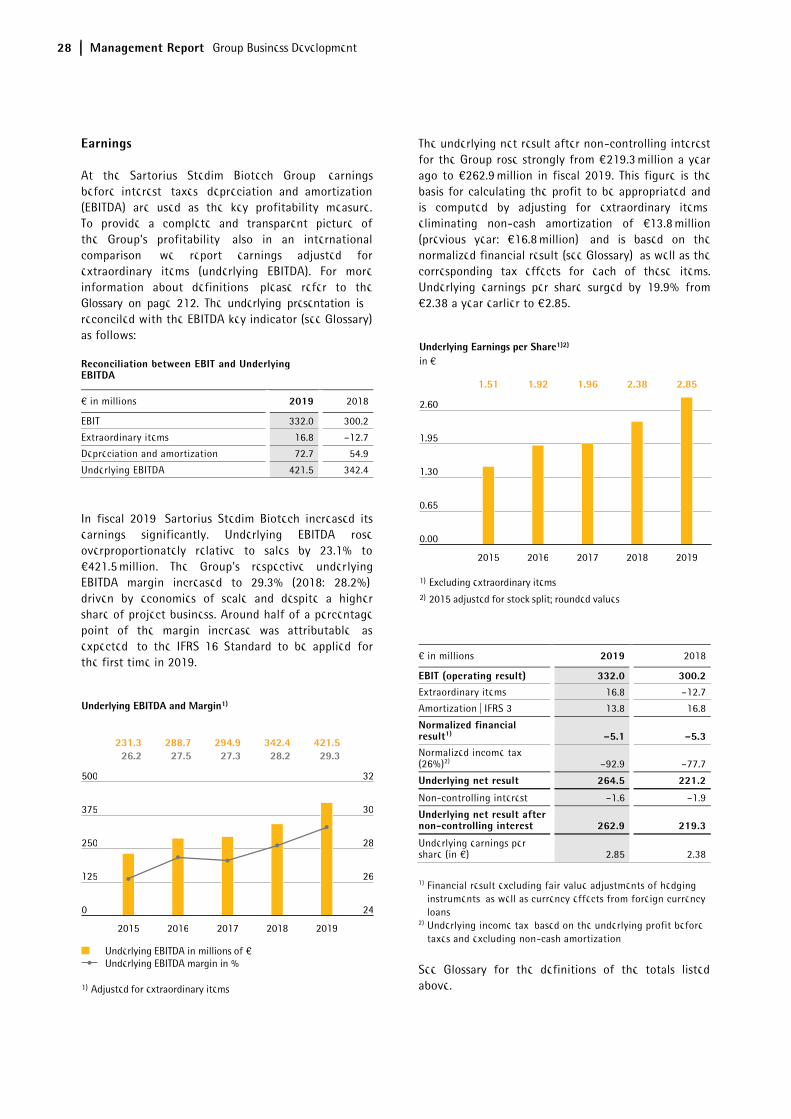
At the Sartorius Stedim Biotech Group, earnings before interest, taxes, depreciation and amortization (EBITDA) are used as the key profitability measure. To provide a complete and transparent picture of the Group's profitability, also in an international comparison, we report earnings adjusted for extraordinary items (underlying EBITDA). For more information about definitions, please refer to the Glossary on page 212. The underlying presentation is reconciled with the EBITDA key indicator (see Glossary) as follows:
Reconciliation between EBIT and Underlying EBITDA
€ in millions 2019 2018
EBIT 332.0 300.2
Extraordinary items 16.8 –12.7
Depreciation and amortization 72.7 54.9
Underlying EBITDA 421.5 342.4
In fiscal 2019, Sartorius Stedim Biotech increased its earnings significantly. Underlying EBITDA rose overproportionately relative to sales by 23.1% to €421.5 million. The Group's respective underlying EBITDA margin increased to 29.3% (2018: 28.2%), driven by economies of scale and despite a higher share of project business. Around half of a percentage point of the margin increase was attributable, as expected, to the IFRS 16 Standard to be applied for the first time in 2019.
The underlying net result after non-controlling interest for the Group rose strongly from €219.3 million a year ago to €262.9 million in fiscal 2019. This figure is the basis for calculating the profit to be appropriated and is computed by adjusting for extraordinary items, eliminating non-cash amortization of €13.8 million (previous year: €16.8 million), and is based on the normalized financial result (see Glossary), as well as the corresponding tax effects for each of these items. Underlying earnings per share surged by 19.9% from €2.38 a year earlier to €2.85.
€ in millions 2019 2018
EBIT (operating result) 332.0 300.2 Extraordinary items 16.8 –12.7
Amortization | IFRS 3 13.8 16.8
Normalized financial result1) –5.1 –5.3Normalized income tax (26%)2) –92.9 –77.7
Underlying net result 264.5 221.2
Non-controlling interest –1.6 –1.9
Underlying net result after non-controlling interest 262.9 219.3
Underlying earnings per share (in €) 2.85 2.38
1) Financial result excluding fair value adjustments of hedginginstruments, as well as currency effects from foreign currencyloans
2) Underlying income tax, based on the underlying profit beforetaxes and excluding non-cash amortization
See Glossary for the definitions of the totals listed above.
2015 2016 2017 2018 2019
Adjusted for extraordinary items1)
Underlying EBITDA in millions of €Underlying EBITDA margin in %
231.3 288.7 294.9 342.4 421.5
26.2 27.5 27.3 28.2 29.3
231.3 288.7 294.9 342.4 421.526.2 27.5 27.3 28.2 29.3
24
26
28
30
32
0
125
250
375
500
Underlying EBITDA and Margin1)
in €
2015 2016 2017 2018 2019
Excluding extraordinary items
2015 adjusted for stock split; rounded values
1)
2)
1.51 1.92 1.96 2.38 2.851.51 1.92 1.96 2.38 2.85
0.00
0.65
1.30
1.95
2.60
Underlying Earnings per Share1)2)
Management Report Group Business Development 29
Research and Development
Activities in product R&D encompass both new and advanced in-house product developments in our own core technologies, as well as the integration of new products through collaborations and acquisitions.
Development activities at Sartorius Stedim Biotech focus on technology areas such as membranes, which are the core component of our filter products; various technology platforms such as single-use containers and sensors; and control technologies for processes such as fermentation. Additional focal areas include developments in materials and components such as plastics, elastomers and intelligent polymers; expanded data analysis; and cell line development.
In the reporting period, Sartorius Stedim Biotech signed a cooperation agreement with Novasep for the development of a membrane-based chromatography system. Novasep is an established manufacturer of resin-based batch and continuous chromatography systems, and Sartorius Stedim Biotech offers innovative single-use solutions for membrane chromatography. The combination of Novasep’s established chromatography platform and Sartorius` membrane solutions is intended to bring together the strengths of both technologies. The resulting system is designed to improve the efficiency of the purification step and strengthen the downstream positioning of Sartorius Stedim Biotech.
Our largest site for product development is Göttingen, Germany; other key sites are Aubagne, France; Guxhagen, Germany; Bangalore, India; Bohemia, New York, United States; Royston, United Kingdom; and Umeå, Sweden.
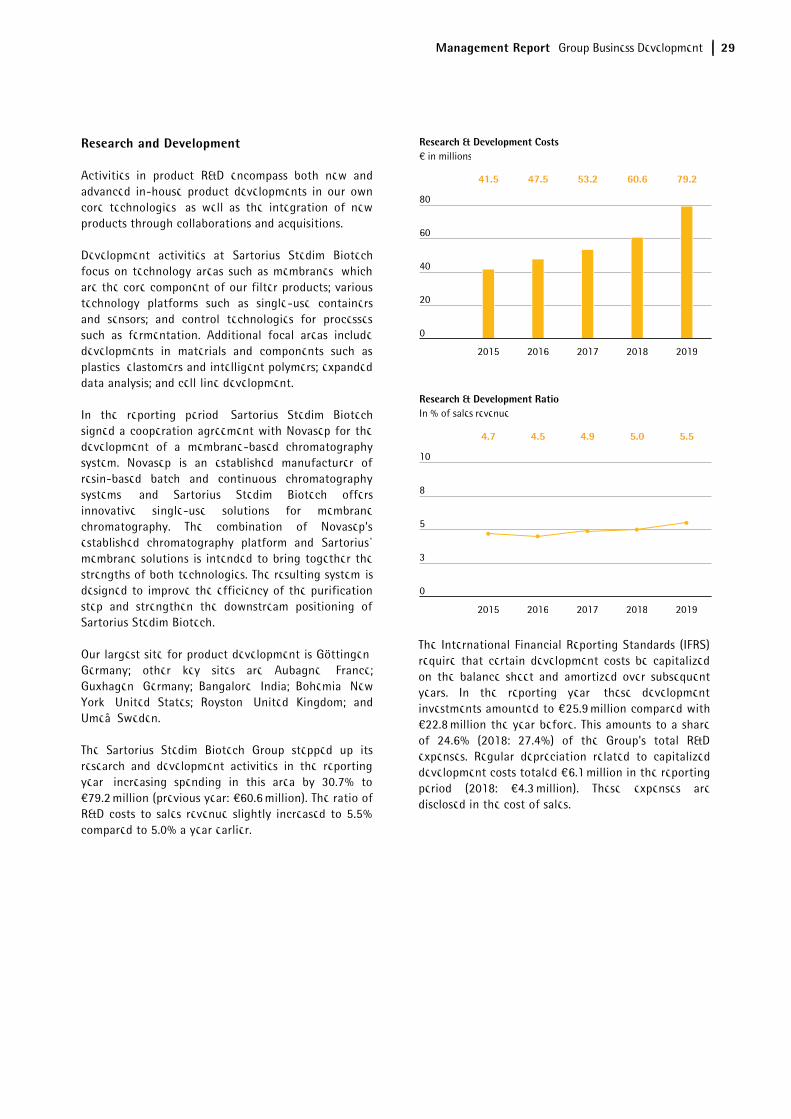
The Sartorius Stedim Biotech Group stepped up its research and development activities in the reporting year, increasing spending in this area by 30.7% to €79.2 million (previous year: €60.6 million). The ratio of R&D costs to sales revenue slightly increased to 5.5% compared to 5.0% a year earlier.
The International Financial Reporting Standards (IFRS) require that certain development costs be capitalized on the balance sheet and amortized over subsequent years. In the reporting year, these development investments amounted to €25.9 million compared with €22.8 million the year before. This amounts to a share of 24.6% (2018: 27.4%) of the Group's total R&D expenses. Regular depreciation related to capitalized development costs totaled €6.1 million in the reporting period (2018: €4.3 million). These expenses are disclosed in the cost of sales.
41.5 47.5 53.2 60.6 79.2
2015 2016 2017 2018 2019
€ in millions
0
20
40
60
80
41.5 47.5 53.2 60.6 79.2
Research & Development Costs
4.7 4.5 4.9 5.0 5.5
2015 2016 2017 2018 2019
In % of sales revenue
0
3
5
8
10
4.7 4.5 4.9 5.0 5.5
Research & Development Ratio
30 Management Report Group Business Development
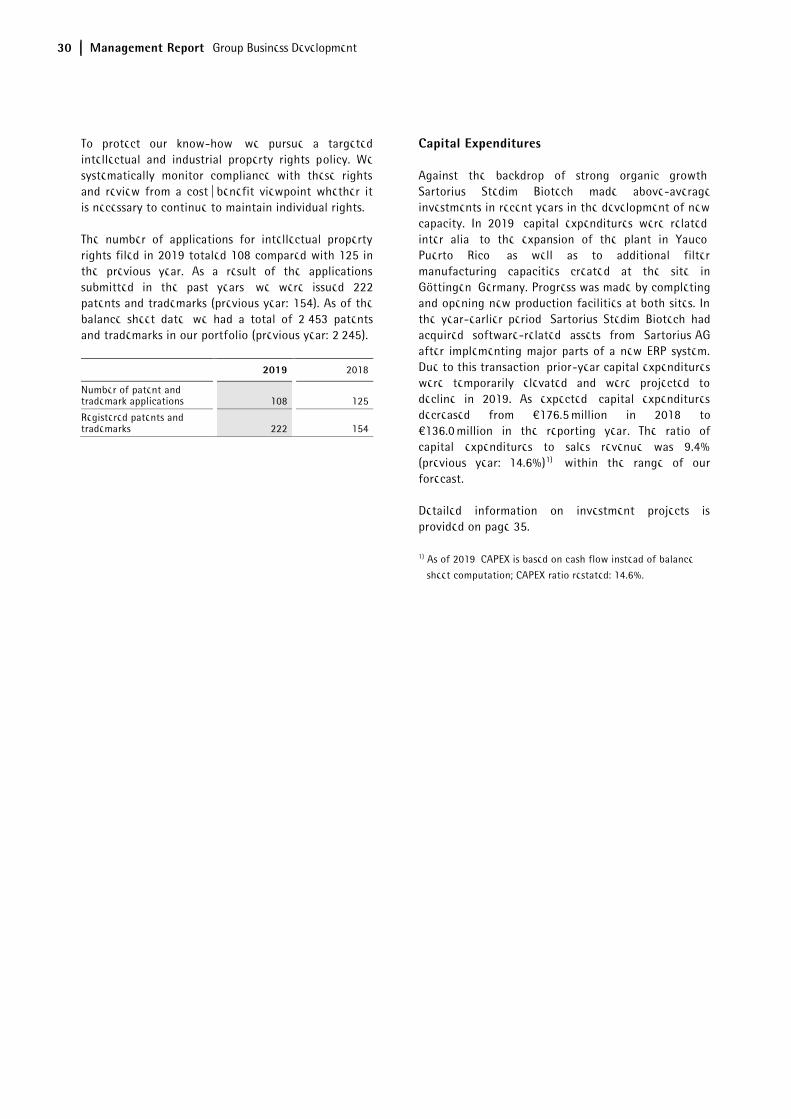
To protect our know-how, we pursue a targeted intellectual and industrial property rights policy. We systematically monitor compliance with these rights and review from a cost | benefit viewpoint whether it is necessary to continue to maintain individual rights.
The number of applications for intellectual property rights filed in 2019 totaled 108 compared with 125 in the previous year. As a result of the applications submitted in the past years, we were issued 222 patents and trademarks (previous year: 154). As of the balance sheet date, we had a total of 2,453 patents and trademarks in our portfolio (previous year: 2,245).
2019 2018
Number of patent and trademark applications 108 125
Registered patents and trademarks 222 154
Capital Expenditures
Against the backdrop of strong organic growth, Sartorius Stedim Biotech made above-average investments in recent years in the development of new capacity. In 2019, capital expenditures were related, inter alia, to the expansion of the plant in Yauco, Puerto Rico, as well as to additional filter manufacturing capacities created at the site in Göttingen, Germany. Progress was made by completing and opening new production facilities at both sites. In the year-earlier period, Sartorius Stedim Biotech had acquired software-related assets from Sartorius AG after implementing major parts of a new ERP system. Due to this transaction, prior-year capital expenditures were temporarily elevated and were projected to decline in 2019. As expected, capital expenditures decreased from €176.5 million in 2018 to €136.0 million in the reporting year. The ratio of capital expenditures to sales revenue was 9.4% (previous year: 14.6%)1), within the range of our forecast.
Detailed information on investment projects is provided on page 35.
1) As of 2019, CAPEX is based on cash flow instead of balance
sheet computation; CAPEX ratio restated: 14.6%.
Management Report Net Worth and Financial Position 31
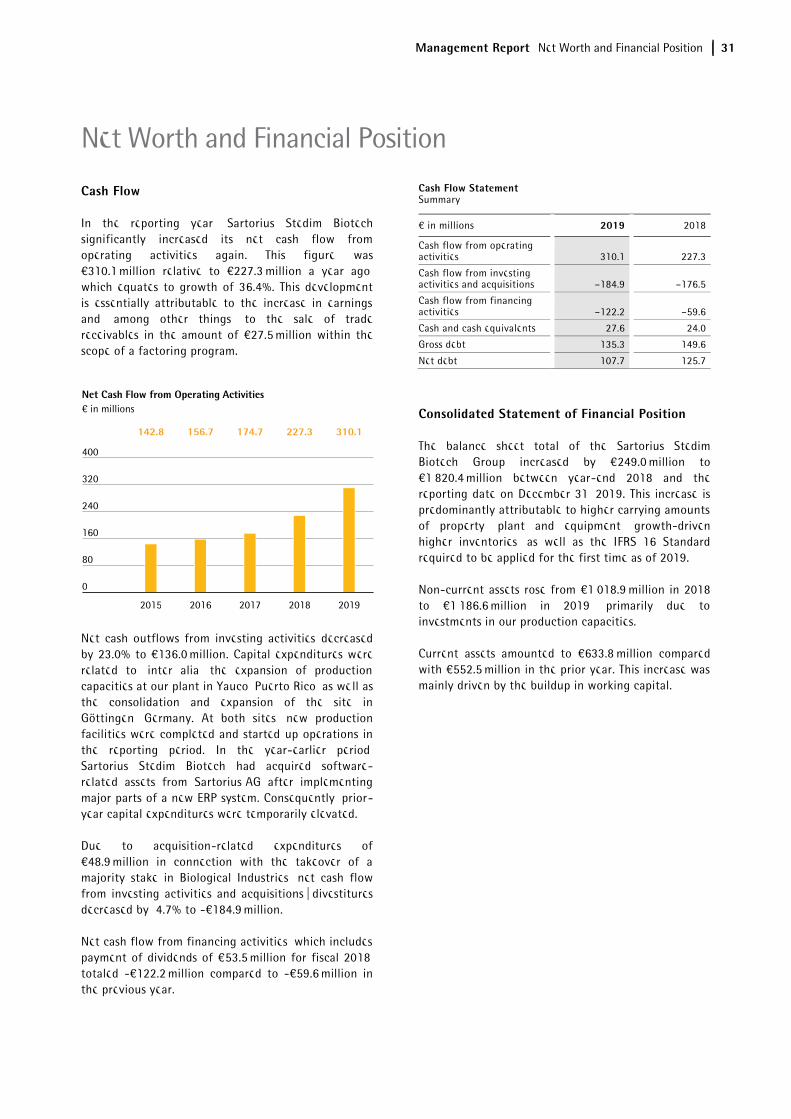
Cash Flow
In the reporting year, Sartorius Stedim Biotech significantly increased its net cash flow from operating activities again. This figure was €310.1 million relative to €227.3 million a year ago, which equates to growth of 36.4%. This development is essentially attributable to the increase in earnings and, among other things, to the sale of trade receivables in the amount of €27.5 million within the scope of a factoring program.
Net cash outflows from investing activities decreased by 23.0% to €136.0 million. Capital expenditures were related to, inter alia, the expansion of production capacities at our plant in Yauco, Puerto Rico, as well as the consolidation and expansion of the site in Göttingen, Germany. At both sites, new production facilities were completed and started up operations in the reporting period. In the year-earlier period, Sartorius Stedim Biotech had acquired software-related assets from Sartorius AG after implementing major parts of a new ERP system. Consequently, prior-year capital expenditures were temporarily elevated.
Due to acquisition-related expenditures of €48.9 million in connection with the takeover of a majority stake in Biological Industries, net cash flow from investing activities and acquisitions | divestitures decreased by 4.7% to -€184.9 million.
Net cash flow from financing activities, which includes payment of dividends of €53.5 million for fiscal 2018, totaled -€122.2 million compared to -€59.6 million in the previous year.
Cash Flow Statement Summary
€ in millions 2019 2018
Cash flow from operating activities 310.1 227.3
Cash flow from investing activities and acquisitions –184.9 –176.5
Cash flow from financing activities –122.2 –59.6
Cash and cash equivalents 27.6 24.0
Gross debt 135.3 149.6
Net debt 107.7 125.7
Consolidated Statement of Financial Position
The balance sheet total of the Sartorius Stedim Biotech Group increased by €249.0 million to €1,820.4 million between year-end 2018 and the reporting date on December 31, 2019. This increase is predominantly attributable to higher carrying amounts of property, plant and equipment, growth-driven higher inventories, as well as the IFRS 16 Standard required to be applied for the first time as of 2019.
Non-current assets rose from €1,018.9 million in 2018 to €1,186.6 million in 2019, primarily due to investments in our production capacities.
Current assets amounted to €633.8 million compared with €552.5 million in the prior year. This increase was mainly driven by the buildup in working capital.
€ in millions
2015 2016 2017 2018 2019
142.8 156.7 174.7 227.3 310.1
0
80
160
240
320
400
142.8 156.7 174.7 227.3 310.1
Net Cash Flow from Operating Activities
Net Worth and Financial Position
32 Management Report Net Worth and Financial Position
Key Working Capital Figures in days
2019 2018
Days inventories outstanding Inventories | x 360 82 75
Sales revenue
Days sales outstanding Trade receivables | x 360 55 65
Sales revenue
Days payables outstanding Trade payables | x 360 49 46
Sales revenue
Net working capital days Net working capital1) | x 360 88 94
Sales revenue
1) Sum of inventories and trade receivables less the trade payables
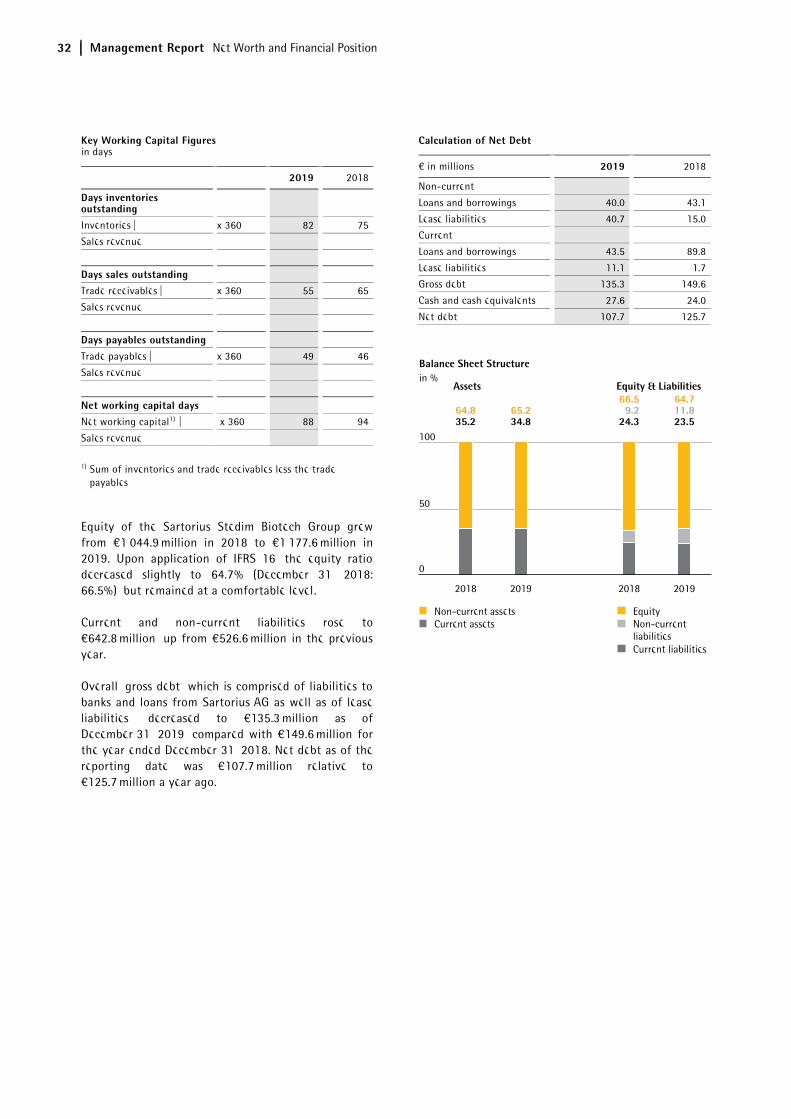
Equity of the Sartorius Stedim Biotech Group grew from €1,044.9 million in 2018 to €1,177.6 million in 2019. Upon application of IFRS 16, the equity ratio decreased slightly to 64.7% (December 31, 2018: 66.5%), but remained at a comfortable level.
Current and non-current liabilities rose to €642.8 million, up from €526.6 million in the previous year.
Overall, gross debt, which is comprised of liabilities to banks and loans from Sartorius AG as well as of lease liabilities, decreased to €135.3 million as of December 31, 2019, compared with €149.6 million for the year ended December 31, 2018. Net debt as of the reporting date was €107.7 million relative to €125.7 million a year ago.
Calculation of Net Debt
€ in millions 2019 2018
Non-current
Loans and borrowings 40.0 43.1
Lease liabilities 40.7 15.0
Current
Loans and borrowings 43.5 89.8
Lease liabilities 11.1 1.7
Gross debt 135.3 149.6
Cash and cash equivalents 27.6 24.0
Net debt 107.7 125.7
in %
2018 20192018 2019
Non-current assetsCurrent assets
EquityNon-current liabilitiesCurrent liabilities
0
50
100
64.8 65.266.5 64.7
35.2 34.89.2 11.8
24.3 23.564.8 65.2
66.5 64.7
35.2 34.89.2 11.8
24.3 23.5
Balance Sheet Structure
Assets Equity & Liabilities
Management Report Net Worth and Financial Position 33
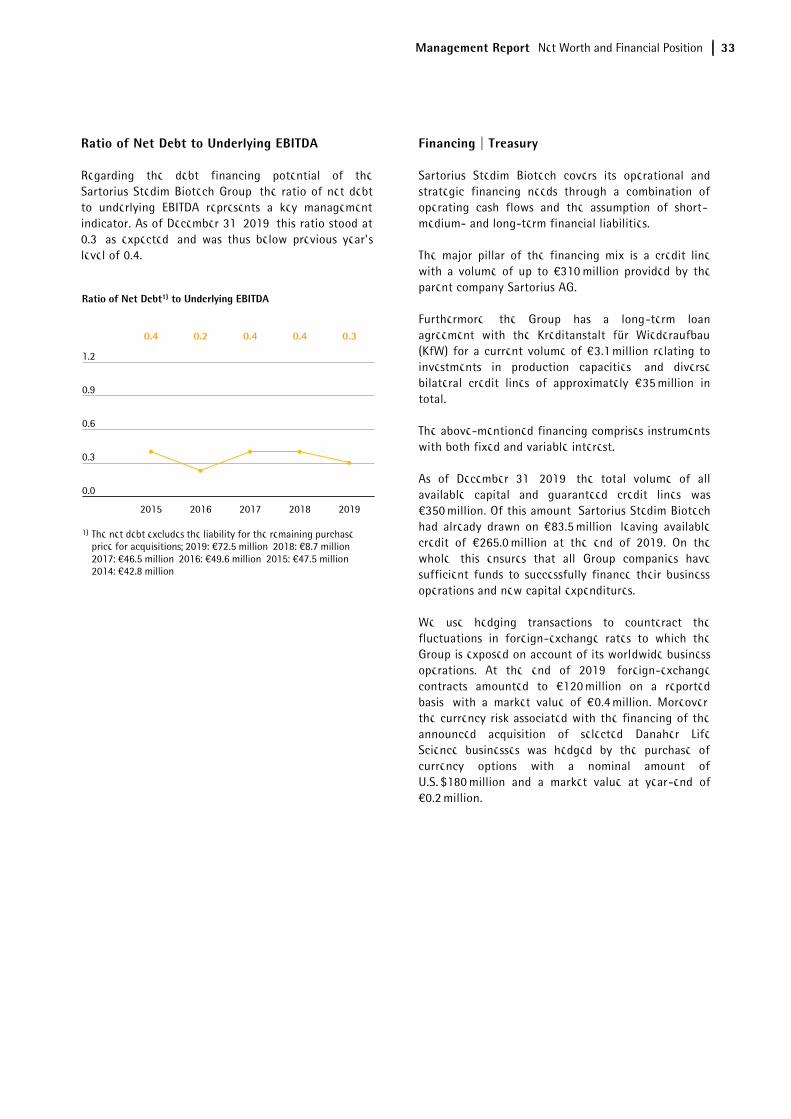
Ratio of Net Debt to Underlying EBITDA
Regarding the debt financing potential of the Sartorius Stedim Biotech Group, the ratio of net debt to underlying EBITDA represents a key management indicator. As of December 31, 2019, this ratio stood at 0.3, as expected, and was thus below previous year's level of 0.4.
Financing | Treasury
Sartorius Stedim Biotech covers its operational and strategic financing needs through a combination of operating cash flows and the assumption of short-, medium- and long-term financial liabilities.
The major pillar of the financing mix is a credit line with a volume of up to €310 million provided by the parent company Sartorius AG.
Furthermore, the Group has a long-term loan agreement with the Kreditanstalt für Wiederaufbau (KfW) for a current volume of €3.1 million relating to investments in production capacities, and diverse bilateral credit lines of approximately €35 million in total.
The above-mentioned financing comprises instruments with both fixed and variable interest.
As of December 31, 2019, the total volume of all available capital and guaranteed credit lines was €350 million. Of this amount, Sartorius Stedim Biotech had already drawn on €83.5 million, leaving available credit of €265.0 million at the end of 2019. On the whole, this ensures that all Group companies have sufficient funds to successfully finance their business operations and new capital expenditures.
We use hedging transactions to counteract the fluctuations in foreign-exchange rates to which the Group is exposed on account of its worldwide business operations. At the end of 2019, foreign-exchange contracts amounted to €120 million on a reported basis, with a market value of €0.4 million. Moreover, the currency risk associated with the financing of the announced acquisition of selected Danaher Life Science businesses was hedged by the purchase of currency options with a nominal amount of U.S. $180 million and a market value at year-end of €0.2 million.
0.4 0.2 0.4 0.4 0.3
2015 2016 2017 2018 2019
0.4 0.2 0.4 0.4 0.3
The net debt excludes the liability for the remaining purchaseprice for acquisitions; 2019: €72.5 million, 2018: €8.7 million, 2017: €46.5 million, 2016: €49.6 million, 2015: €47.5 million, 2014: €42.8 million
1)
0.0
0.3
0.6
0.9
1.2
Ratio of Net Debt1) to Underlying EBITDA
34 Management Report Net Worth and Financial Position
Products and Sales
Sartorius Stedim Biotech sells products and services for the entire added-value chain in biopharmaceutical production and upstream process development. The portfolio includes cell lines, cell culture media, bioreactors, a wide range of products for separation, purification and concentration, and systems for the storage and transport of intermediate and finished biological products.
Acquisition Strengthens Cell Culture Media Business
With its acquisition of a majority stake in Biological Industries, Sartorius Stedim Biotech has significantly expanded its cell culture media offer and enhanced its product portfolio for customers in the advanced therapies market. Biological Industries concentrates on cell culture media in particular for cell and gene therapies, regenerative medicine and other innovative therapies. The company was founded in 1981 and currently employs 130 people, primarily at its main facility near Haifa, Israel, where the company is headquartered and its R&D and production are located. It also has sales locations in the USA, Europe and China.
New Products with a Focus on Automation
During the reporting year, Sartorius Stedim Biotech introduced a new generation of the automated microbioreactor system ambr® 15. This device controls up to 48 bioreactor cultures in disposable vessels in parallel. The system is used in biopharmaceutical labs for cell line development and process optimization. The second generation of the device offers enhanced hardware and software.
In addition, a special bioreactor was launched that is optimized for the production of cellular immune therapies, among other things.
Sartorius Stedim Biotech also updated its software for the multivariate data analysis of biopharmaceutical production processes. This software combines the extensive data sets that are generated at different points in the production process in a uniform system and enables them to be monitored, controlled and analyzed. The updated version offers improved user friendliness and accessibility, as well as time-saving analysis functions.
Sartorius Stedim Biotech introduced the new Sartocheck® 5 integrity testing device for testing and demonstrating the functional capability of filters. The new version offers additional options for electronic data acquisition and subsequent processing, such as the automatic transfer of test results to central databases.
Sales Activities Expanded
Sartorius Stedim Biotech markets its product portfolio directly through its own field sales representatives. Sales activities for key accounts are coordinated and supported by global key account management.
The company has expanded its direct sales in Asia | Pacific through the acquisition of a sales partner in Taiwan that has been selling products particularly from Sartorius Stedim Biotech since 2012.
Management Report Net Worth and Financial Position 35
Production and Supply Chain Management
Sartorius Stedim Biotech has a very well developed production network around the world. The largest production sites are located in Germany, France and Puerto Rico (U.S.). Sartorius Stedim Biotech also manufactures in the United Kingdom, Switzerland, Tunisia, India, the United States and, since 2018, in China.
Expansion of Production Capacity
During the reporting year, Sartorius Stedim Biotech started up operations at its expanded production facilities in Yauco, Puerto Rico. The U.S. market, in particular, is served by this plant. The site’s considerably larger production capacities enable Sartorius Stedim Biotech to deliver an even broader spectrum of products to its American customers directly from the region.
Within about three years of construction, the production capacity for filters and single-use bags for biopharmaceutical production was more than doubled, and, for the first time, extensive capacity for the manufacture of filter membranes was established outside the company’s primary German site in Göttingen. The facility in southwestern Puerto Rico offers about 190,000 square meters of space and is designed to accommodate further long-term growth: if needed, Sartorius Stedim Biotech can at least double its production capacity there.
In Göttingen, capacity for membrane modification was expanded, and an additional building for office and laboratory space was opened.
During the reporting year, staff moved into the development and production center for cell lines in Ulm, Germany. With 6,000 square meters of usable floor space, the new center offers twice the previously available capacity.
36 Management Report Sustainability
Sustainability information for the Sartorius Stedim Biotech Group is not reported. In accordance with the provisions of Article L.225 - 102 - 1 IV of the French commercial code, Sartorius Stedim Biotech is exempted from presenting this information, because it is included in the non-financial statement established and published by the controlling company, Sartorius AG, as per applicable German regulations.
Sustainability
Management Report Opportunity and Risk Report 37
Principles
Every business activity entails opportunities and risks, which have to be managed. The skill with which this is done goes a long way in determining the future development of a company's shareholder value.
It is not the task of risk management to eliminate all risks: rather, our approach is to intentionally take a certain measure of risk in our business activities in order to be successful in unlocking opportunities. However, in this endeavor, it is important to keep risks contained within acceptable limits and to control them carefully. Through appropriate guidelines, we ensure that risk assessments are taken into account in the decision-making processes from the very beginning.
Sartorius Stedim Biotech has decided to make the identification and the management of risks and opportunities a cross-functional component of Group management. In this context, Sartorius Stedim Biotech’s risk management is integrated into the Sartorius Group organization. Our risk management organization reflects a global functional matrix organization in which individuals heading a functional area are each responsible for their own management of opportunities and risks. The Finance & Controlling department is responsible for the organization of the respective reporting process, including the further development of the Group's risk management system.
Managing Opportunities
Our opportunity management centers on the analysis of target markets and sector environments, as well as the assessment of trends, both of which give strong indications as to future business opportunities. The identification of the potential for development in this context is one of the key roles of the relevant managers and initially takes place at the local rather than the central level. The market-facing functions, such as marketing and product management in the individual divisions, play a leading role in this respect. The central Business Development unit supports these areas with market monitoring, data analysis and the implementation of strategic projects.
As part of strategy reviews, the members of the Board of Directors regularly meet with the managers that have operational responsibility to discuss short-, medium- and long-term opportunity potential for the various business areas. If the opportunities are short-
term in nature, they are considered in annual budget planning. Medium- and longer-term opportunities are tracked systematically as part of strategic planning.
As a supplier for the pharmaceutical industry, Sartorius Stedim Biotech operates in a future-oriented and high-growth sector. The significant opportunities generated by the various market and technology trends are described in detail in the sections entitled "Sector Conditions" and "Outlook for the Sector" on pages 23 et seq. and pages 49 et seq., respectively.
Our assessments rank the company as one of the global market leaders in many subsegments and product areas. We believe the high quality of our products, our strong brand recognition and our established customer relationships give Sartorius Stedim Biotech strong opportunities to continue extending our market leadership. The corresponding strategies and the growth opportunities and initiatives based on them are discussed in the section on the strategy of the Group, which begins on page 20.
Risk Management
Organization
The overall responsibility for the maintenance of an effective risk management system ensuring comprehensive and consistent management of all material risks rests with the Audit Committee. The Finance & Controlling Department is responsible for coordinating and developing this system and for consolidated risk reporting, while the particular functional areas are responsible for identifying, analyzing and reporting individual risks. This includes the assessment of their potential impact and the decision-making on taking the appropriate countermeasures.
The Audit Committee monitors the effectiveness of the risk management system. Furthermore, while carrying out their statutory audit mandate for the annual financial statements and consolidated financial statements, the independent auditors examine whether the early warning system in place is capable of prompt identification of risks that could jeopardize the future of the company. Finally, the Internal Audit Department regularly reviews the risk management process and system.
Opportunity and Risk Report
38 Management Report Opportunity and Risk Report
Insurance
We have taken out insurance policies to cover a wide range of risks where possible and economically advisable. These insurance policies include coverage against product liability, property damage, business interruption, transport, material and pecuniary damages and other risks, and provide comprehensive coverage for legal costs. An independent department working in conjunction with an external insurance broker regularly reviews the nature and extent of our insurance protection and makes any adjustments as necessary.
When choosing our insurers, we particularly consider the credit rating of these entities as potential contractual partners, as well as aim to achieve a high degree of diversity in order to mitigate the related risks.
Risk Management System and Risk Reporting
Sartorius has implemented a global guideline (Risk Management Handbook), which includes definitions of the framework, structural organization, processes, risk reporting, and monitoring and controls of the effectiveness of the risk management system. The handbook is based on ISO 31000 "Risk Management - Guidelines" and the COSO (Committee of Sponsoring Organizations of the Treadway Commission) standard. There are also a number of other sources that contain stipulations for handling risks, including the articles of association and rules of procedure of the Group companies, and other internal guidelines. In 2019 the risk management process was adjusted and risk management software was implemented in order to further improve documentation needs.
The prescribed reporting process in the risk categories subsequently described establishes the rules for the ongoing review of and information on risk situations.
If any specific risks are discernible, these are documented with respect to their assessment, probability of occurrence and measures to be taken to eliminate such risks or to mitigate their impact.
We have an urgent reporting procedure in place to ensure that when a new or emerging significant risk to our net worth, financial position and profitability is identified, the audit committee receives all of the necessary details without undue delay.
To classify risks appropriately, we have defined four main categories: external risks, operating risks, financial risks and compliance risks. Each main category is divided into several subcategories that are described in the following sections.
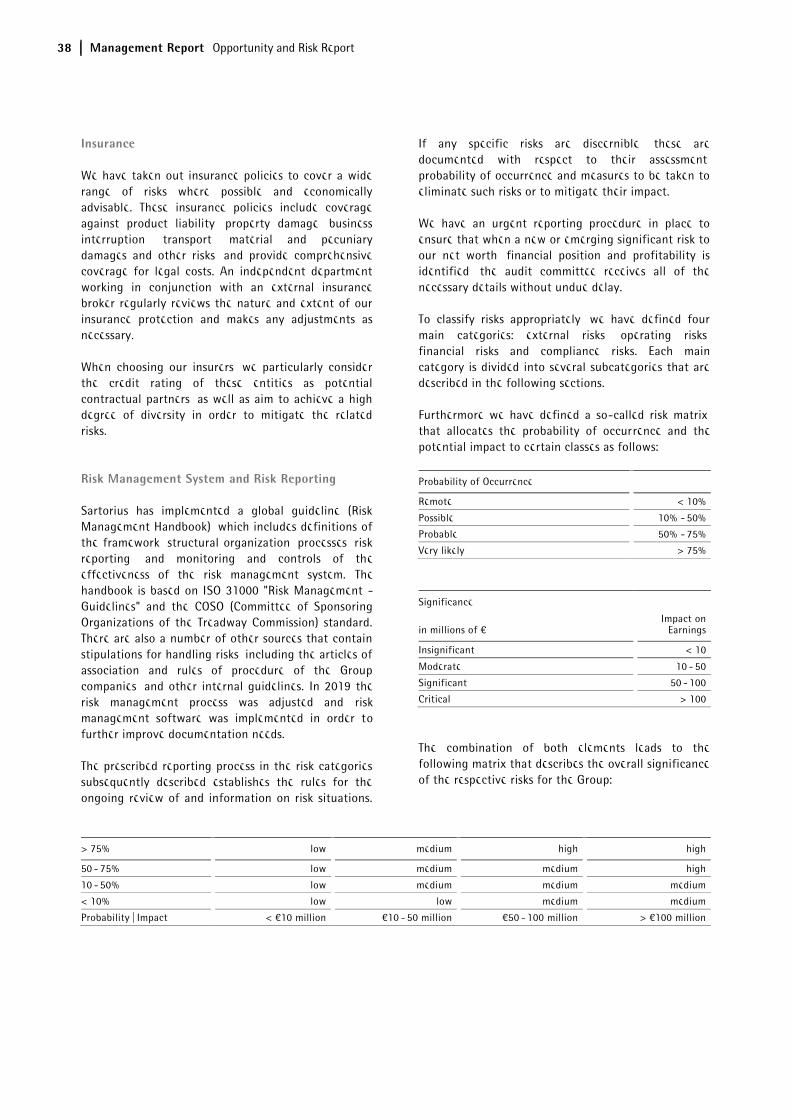
Furthermore we have defined a so-called risk matrix, that allocates the probability of occurrence and the potential impact to certain classes as follows:
Probability of Occurrence
Remote < 10%
Possible 10% - 50%
Probable 50% - 75%
Very likely > 75%
Significance
in millions of € Impact on
Earnings
Insignificant < 10
Moderate 10 - 50
Significant 50 - 100
Critical > 100
The combination of both elements leads to the following matrix that describes the overall significance of the respective risks for the Group:
> 75% low medium high high
50 - 75% low medium medium high
10 - 50% low medium medium medium
< 10% low low medium medium
Probability | Impact < €10 million €10 - 50 million €50 - 100 million > €100 million
Management Report Opportunity and Risk Report 39
External Risks
General Risks
The main risks in this area are those arising from natural catastrophes, especially the hurricane risk in Puerto Rico, and political developments in the United Kingdom or in the USA.
In principle, our ability to foresee and mitigate the direct and indirect effects of risks entailed by life in general is limited, but we proactively take measures, whenever feasible, to ensure that we can respond appropriately and at short notice or are insured against any damage entailed by such risks that include, for instance, natural catastrophes and their associated damage to commercially significant and critical infrastructure.
Our largest sites in Germany and France do not face major risks from natural catastrophes, while e.g. our production plant in Puerto Rico is exposed to the risk of severe hurricanes. We control this risk by applying high security standards to the buildings and explicitly consider this risk in our warehousing and production network strategy.
Political developments, such as the referendum on the United Kingdom’s leaving the European Union ("Brexit") or changes in US foreign policy, can have an impact on the Group’s business. Such developments may involve changes to the tax system or customs duties, as well as impacts on the exchange rate of the euro to the British pound or the U.S. dollar (for more on the subject of exchange rates, see the section below on Exchange Rate Risks).
In the U.K., we run various manufacturing and sales entities with a significant business volume. Any development that has a negative impact on the trading between the U.K. and other countries could therefore lead to a corresponding decrease in the Group's earnings. Further developments are being closely observed and certain measures like safety stocks have already been implemented.
Our affiliates in the US and China have business relations with the respective other country, therefore the implemented tariffs and trade barriers have a negative impact on our profitability. However, this impact is currently rather limited.
Business Cycle Risks
The nature of our various business areas means that Sartorius Stedim Biotech as a whole is insulated to a certain extent from the full force of wider cyclical effects. If economic developments prove more positive than expected, this, in turn, can additionally stimulate stronger growth.
Operational Risks and Opportunities
Our supply chain extends from procurement to production to sales and distribution. Problems within this workflow can have consequential effects, including delays in deliveries. The global supply chain management system we have instituted throughout our process chains largely minimizes the associated risks by analyzing and controlling all of the operations involved. The strongly international alignment of our organization opens up a whole series of opportunities too. The various risks and opportunities encountered within our supply chain are explained in detail below.
Procurement Risks and Opportunities
We purchase a wide range of raw materials, components, parts and services from suppliers and are consequently exposed to the risks of unexpected delivery bottlenecks and | or price increases.
Over the past years, we have implemented powerful tools and robust processes in our Materials Management unit to manage risks and critical materials. These means enable us to meet the needs of our customers with respect to delivery reliability and transparency. Important measures in this respect are to maintain security stock and to define alternative suppliers when feasible. We moreover conduct regular supplier reviews and also use early warning systems.
Risks from raw material prices play a rather subordinate role in our business. On the one hand, the proportion of raw materials in our production costs is comparatively low. On the other hand, we purchase a wide range of materials so that price increases for certain materials do not represent any significant impacts.
Opportunities can arise in the area of procurement when our growth enables us to increase order quantities and thereby strengthen our position with our suppliers, such as by receiving price discounts or preferential treatment as a "preferred customer." In addition, we maintain a list of preferred suppliers in order to enter into long-term business relationships with key suppliers to our mutual benefit.
40 Management Report Opportunity and Risk Report
Production Risks and Opportunities
Manufacturing a large proportion of our products ourselves, we bear the associated risks of capacity bottlenecks or overcapacity, production downtimes, excessive reject rates and high levels of tied-up working capital, as well as dependency on individual manufacturing sites.
Based on our core technology expertise, we manufacture products that involve a high level of vertical integration. Other products, such as reusable fermenters and bioreactors, are manufactured in collaboration with suppliers so that some of the production risks are transferred to external third parties.
We contain and reduce the risks relating to capacities by careful production planning, using versatile machines, semi-automated individual workstations and flextime work schedules, and by continuously monitoring production processes. Moreover, our global manufacturing network enables us to partially compensate for any capacity bottlenecks by shifting production to other regional plants and consequently reducing our dependency on individual local production plants. Furthermore, we have taken out policies for business interruption insurance to compensate for any possible losses due to production downtimes.
In certain production areas we are using easily flammable or explosive materials. Improper handling of those materials can lead to significant damage to property and business interruptions. We have implemented all necessary organizational and constructional measures in order to reduce these risks to the extent possible.
We consider it an opportunity that our investments in infrastructure and production resources have given us high flexibility in our manufacturing operations and that we are capable of meeting our customers' requirements and regulatory standards with respect to business continuity concepts. In addition, this approach ensures that our individual production sites can concentrate on specific manufacturing technologies and makes it possible to capitalize on the cost advantages offered by individual sites. Furthermore, continuous improvements in production, such as simplifying processes and increasing levels of automation, help drive manufacturing efficiency even higher.
Sales and Distribution Risks and Opportunities
The potential risks entailed to the variety of channels to sell and distribute our products around the world are unexpected changes in the demand structure, growing price pressure and non-compliance with supply agreements concluded with customers. We employ targeted market analyses to identify emerging demand trends in individual segments early on so that we have time to respond appropriately. Our technical innovations and the fact that a wide range of our products are used in validated production processes in the biopharmaceutical industry reduce our exposure to the risk of growing price pressure. We have reduced our risk exposure in the area of logistics in recent years by setting up and using central warehouses to optimize distribution logistics.
Opportunities arise in the area of sales and distribution when the increasing breadth of our product range puts us in a position to sell new products to existing customers. Our business relationships, most of which are established for the long term, and our global presence provide further opportunities.
Sartorius Stedim Biotech sources its key customers from the pharmaceutical, chemical and food industries. These customers are usually relatively large organizations that have been in existence for some time and have strong credit ratings. Accordingly, the Group has had low to zero credit losses over the past years, and its overall credit risk continues to be at a very low level. Most of our business areas have a highly diversified customer base, so the Group as a whole is not dependent on individual key accounts to any significant degree.
Competitive Risks and Opportunities
Sartorius Stedim Biotech has a leading competitive position in most of its markets. Some of our competitors are larger than us, and most share our status as a globally operating company. As we serve a large number of customers from highly regulated sectors like the pharmaceutical and food industries, and, the technology barriers to market entry are substantially high, we regard the probability of new competitors emerging within the short term as low.
The fact that many of our products are used in validated bioprocesses reduces the risk of losing significant market share within a short timeframe. At the same time, it is also more difficult for us to quickly force out the competition that serves customers in this area.
Management Report Opportunity and Risk Report 41
Changes in the competitive environment, for example, a further consolidation in the markets, can pose opportunities. We have been continuously making acquisitions in recent years to reinforce our market position and open up new potential synergies.
Quality Risks and Opportunities
The main risk encountered in this area is non-compliance with agreed quality criteria, which can lead to losses for our customers, or their customers, for which we may be made liable through compensation claims. Our customers use Sartorius Stedim Biotech products in a wide range of critical production processes, including the manufacture of pharmaceuticals, foods and chemicals, and in research and development laboratories.
We employ rigorous quality checks and advanced production methods and processes, such as cleanroom technology, to ensure that our products satisfy the most stringent quality standards and high regulatory requirements. These manufacturing methods and processes are subject to constant review under our continuous improvement processes, moreover, and are optimized as requirements evolve. Our successful completion of a host of annual audits by customers and implementation of quality systems compliant with ISO 9001 and, where applicable, with ISO 13485 document the high level of quality achieved in Sartorius products and processes. Irrespective of these measures, we also maintain significant insurance coverage against product liability risks. Sartorius Stedim Biotech has established a traceability system that enables us to recall an entire production batch immediately, if necessary, and minimize any adverse consequences in the event of defects being discovered in a product. Furthermore, we have installed a complaints management system to deal with customer requests and to ensure full documentation.
In the sectors we address, quality requirements are growing more and more stringent all the time, not least as a result of increasing requirements on protection of medical patients and on product safety by regulatory authorities. Increasing and changing requirements typically entail the risk that a new requirement might be overlooked or be difficult to achieve, but we regard this first and foremost as an opportunity that opens up new market prospects. The reason is that challenging quality demands represent a considerable barrier to entry for potential new competitors and provide stimulus for further technical innovation to which we actively respond. Moreover, we actively seek to draw up new requirements through our work on professional committees, membership in
industry associations and standards committees, and are able to identify emerging requirements at an early stage and prepare ourselves accordingly.
R&D Risks and Opportunities
Main risks in this area may arise from development results that diverge from market needs and application requirements, and from exceeding planned development deadlines, since we devote a considerable share of our resources to research and development.
Our advanced project management, intensive R&D controlling and early involvement of our customers in the development process substantially limit these R&D risks. We ensure that product developments are always reviewed very promptly with regard to how well they meet the customers' needs so products can be adapted accordingly as needed. Patents and continuous tracking of the technologies and competitors relevant to us secure our technology and marketing position.
On the other hand, the R&D sphere also offers a number of potential opportunities. Our close collaboration with partners that rank among the global market leaders in their own fields opens up the opportunity for us to jointly develop products with an especially high level of innovation. In areas such as membrane technology and plastics technology, as well as sensorics and bioprocess engineering, the expertise of our own specialists puts us at the very forefront of global research and development, presenting us with an opportunity to turn this technical knowledge into potential sales and an even stronger position on the market. The combination of different innovative activities in a separate Corporate Research Department further enables us to identify and benefit from promising developments and emerging trends at universities, startups and at our customers' plants.
Acquisition Risks and Opportunities
The purchase and sale of companies or parts of companies entail a number of typical risks, such as incorrect valuation assumptions or insufficient usage of anticipated synergy effects. On the other hand, acquisitions also provide many opportunities, such as sales growth, extension of our product portfolio and development of new markets.
To prevent the risks, we take various measures, such as performing a standard due diligence review of important areas and carrying out comprehensive analysis of the market concerned. In addition, we involve external consultants and experts in the
42 Management Report Opportunity and Risk Report
purchase or sales process as required. We especially focus on drafting transaction contracts so that they adequately counter such risks, especially by clauses assuring specific characteristics or by contractual warranty or guarantee provisions, as well as agreements on mechanisms for adjustment of the purchase price and on liability clauses.
Immediately after an acquisition has taken place, an integration phase is initiated in which any potential risks can likewise be detected as early as possible and prevented or minimized by taking the appropriate counteractions. In order to ensure an efficient integration process in the Group and to mitigate the related risks we have established a post-merger integration (PMI) office within the department of Business Process Management.
Personnel Risks and Opportunities
The main risk in this area is that we are not able to hire skilled staff needed for the planned growth of the company. As an innovative technology group, Sartorius Stedim Biotech employs a large percentage of highly qualified people. We counter the risks of a possible scarcity of required specialists, especially those in key positions, and of demographic change by offering performance-related remuneration models, targeted continuing professional development options, further attractive social benefits, continuous education and training for junior staff members within our organization, and interesting people development opportunities. The success of these measures is apparent in the low attrition rates of recent years. Moreover, employment contracts in certain cases contain a clause prohibiting any move to a direct competitor.
Opportunities for Sartorius Stedim Biotech primarily arise in that it can further qualify its staff by offering its own training courses and retain such staff over the long term, thus covering company needs for qualified personnel particularly well.
IT Risks and Opportunities
Since nearly all business processes of the Sartorius Stedim Biotech Group are supported by IT applications, systems failure or other impairment of the relevant IT systems or (cyber)attacks can considerably disrupt the smooth functioning of the companies` business processes and lead to manipulation or to uncontrolled loss or leakage of knowledge or data.
We minimize this risk by continuously investing in the setup and operation of secure IT systems and applications, and by continuously further developing and implementing our concepts and security measures based on the International Standard ISO 27001, Information Security Management System. In addition, we incorporate the results of regular audits and vulnerability assessments carried out by external companies specialized in IT security.
Protection of our data against misuse is ensured by specific authorization and authentication policies based on the assignment of rights, limited to a "need-to-know" basis for performing certain tasks; the application of such policies is reviewed at regular intervals.
We protect our systems against failure and data loss by regular data backups, recovery testing based on rolling disaster scenarios and risk-based use of redundant IT infrastructures. Multi-factor authenti–cation solutions enable us to prevent malware threats.
We are convinced that the threat of cyberattacks is growing worldwide, both in number and intensity. This is why we are continuously extending and strengthening our activities: we are improving our efforts by further automating management of authorizations and reducing the potential for data misuse, among other measures. We inform our staff in a targeted way about possible threats and risks, involving our employees by providing them with simple but effective options for decentralized defense and reporting suspicious emails to IT for checking.
By extending our means for competent and fast response to cyberattacks including other IT security incidents, we supplement our organizational basis for running the Sartorius system and applications at the lowest possible risk across the entire landscape.
Financial Risks and Opportunities
The global nature of the Sartorius Stedim Biotech Group’s operations means that its business activities are inevitably exposed to financial risks. The most significant of these are exchange rate risks, interest rate risks, liquidity risks and tax risks, all of which are described below and addressed in detail in the Notes to the Consolidated Financial Statements. Vice versa, certain financial risks, most notably exchange rate risks and interest rate risks, are balanced by opportunities of approximately equal magnitude.
Management Report Opportunity and Risk Report 43
Exchange Rate Risks
As a consequence of its global business activities, the Group is exposed to risks arising from foreign currency fluctuations. Since we generate around two-thirds of consolidated sales revenue in foreign currencies and, of this figure, approximately two-thirds of this total revenue in U.S. dollars or in currencies pegged to the U.S. dollar, we are positively or negatively impacted by currency effects, especially when converting the currencies of balance sheet items and profit or loss items, respectively. Besides the U.S. dollar, other key currencies are the South Korean won, the British pound, the Singapore dollar, the Japanese yen and the Chinese renminbi.
Our global production network thus enables us to offset the lion’s share of sales revenues received in foreign currency within the Group against costs likewise incurred in foreign currency. For example, we manufacture many of our products for the North American market locally, and are not disadvantaged in competition with our U.S. rivals, insofar as this general currency risk is concerned. We continuously monitor the portion of our foreign currency sales revenue that remains after we have settled our costs, so-called net exposure.
In order to evaluate and steer the remaining risk based on the expected net exposure for the next 12 months and take into consideration hedging transactions already executed, we are continuously calculating our risk exposure with a cash flow at-risk model. We use this basis to decide on whether to use additional derivative financial instruments, especially spot, forward and swap transactions, to adjust for maximum loss. Hedging transactions are set up by one group of staff and monitored by another, separate group.
Interest Rate Risks and Opportunities
The main risk in this area is posed by changes in interest rates that can lead to higher payments. The major part of the financial instruments outstanding on the reporting date is subject to variable interest based on the market rate. However, the overall debt level of the Group and the resulting interest risk is very low. We monitor interest rate trends and our interest rate exposure constantly and have the facility to arrange for hedging transactions where we consider it necessary and economically advisable to do so for individual loans. As of December 31, 2019, we did not have any interest rate derivatives in our portfolio of financial instruments.
Liquidity Risks and Opportunities
The general risk is that Sartorius Stedim Biotech will not be able to pay its creditors. In order to minimize those liquidity risks and optimize liquidity allocation within the organization the Group’s liquidity is managed centrally on the Sartorius Group level by using various long- and short-term debt instruments.
Sartorius Stedim Biotech is mainly using a €300 million credit line provided by Sartorius AG that can be accessed and repaid at short notice. Additionally, we have a number of bilateral working capital credit lines for individual Group companies in place and we have concluded cash pooling agreements between selected Group companies as the primary tool to manage liquidity within the Group.
Tax Risks
Sartorius Stedim Biotech is acting globally with its affiliates and consequently falls under numerous local tax laws and regulations. Changes in tax laws, jurisdiction or the interpretation of laws by the authorities in these countries can lead to additional tax expenses and payments and have an impact on tax positions in the statement of financial position and profit or loss.
We are controlling this risk by permanently monitoring and analyzing the fiscal framework with our central tax department which is supported by external experts in the concerned countries.
Compliance Risks
Regulatory Risks
Our role as a supplier to the biopharmaceutical industry and health care providers means that Sartorius Stedim Biotech can also be affected by underlying developments in these areas. The possibility of the regulatory authorities (FDA, EMA) adopting a more restrictive approach to the approval of new medications remains the principal source of risk in this context. Such a move would reduce the number of new pharmaceutical products to be marketed and would consequently downgrade future prospects for Sartorius Stedim Biotech over the medium term.
44 Management Report Opportunity and Risk Report
Environmental Risks
The main risk in this area is to cause environmental damage, e.g. by polluting the air or the ground with hazardous substances. Sartorius Stedim Biotech has established an environmental management system to minimize these risks. This management system has been certified for compliance with ISO 14001 at a number of the company's relatively large manufacturing sites. The respective company organizational units ensure at the particular sites that the laws and regulations relating to environmental protection are observed and that further technical possibilities for limiting environmental risks are identified on an ongoing basis.
The increasing importance of sustainability considerations in many industries represents an opportunity. That is why this aspect is becoming a key element in our supplier selection process for assessing the suitability of a particular company as a business partner.
Litigation Risks
Litigation risks for Sartorius Stedim Biotech can arise from pending or forthcoming legal disputes or from administrative proceedings. All judicial or extrajudicial disputes are attended to by the company’s own attorneys and legal experts, who engage external lawyers as needed.
At present, there are no pending or discernible legal disputes or proceedings that lack any cost coverage allowances in the statement of financial position or that could have a substantial negative impact on Group.
Assessment of the Overall Risk Situation and Risk Outlook
Where feasible, we adopted countermeasures and | or arranged for balance sheet measures during the reporting year to cover all discernible risks within the Sartorius Stedim Biotech Group, and those of a defined probability of occurrence, that had the potential to damage our net worth, financial situation and profitability.
For the purposes of this report, we have assessed the probability of occurrence of the risks shown below and, in the adjacent columns, classify their particular significance for the entire Group.
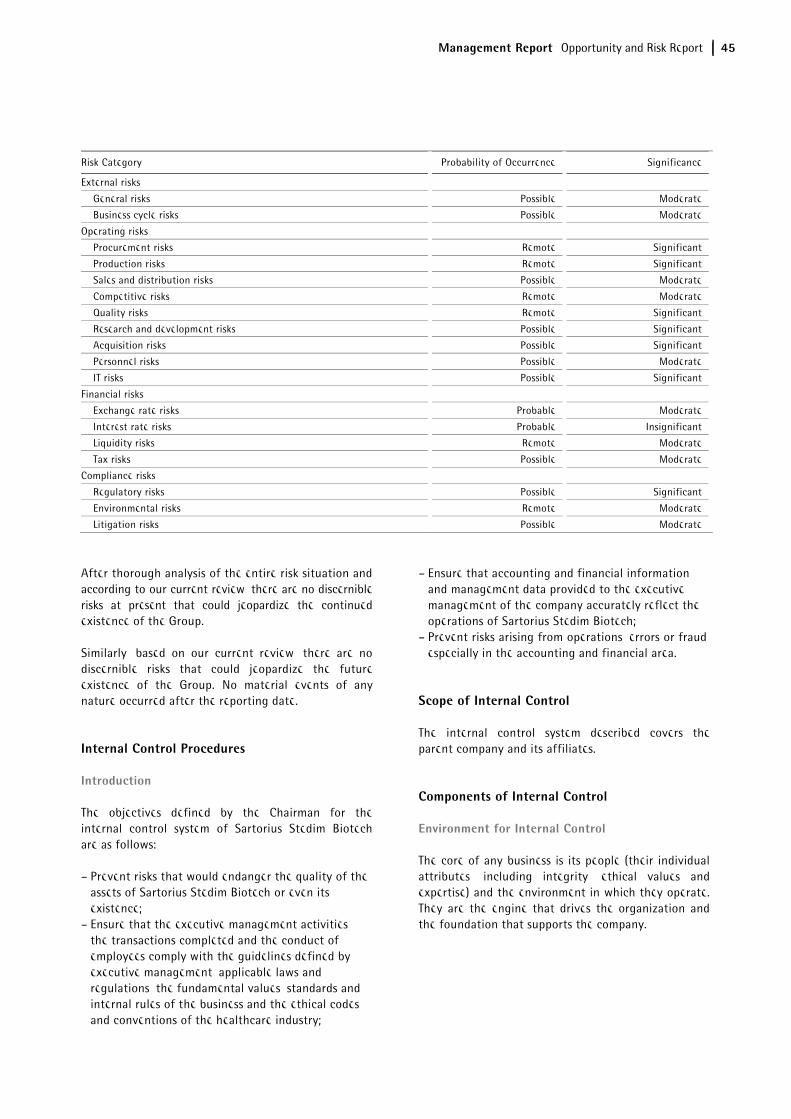
Management Report Opportunity and Risk Report 45
Risk Category Probability of Occurrence Significance
External risks
General risks Possible Moderate
Business cycle risks Possible Moderate
Operating risks
Procurement risks Remote Significant
Production risks Remote Significant
Sales and distribution risks Possible Moderate
Competitive risks Remote Moderate
Quality risks Remote Significant
Research and development risks Possible Significant
Acquisition risks Possible Significant
Personnel risks Possible Moderate
IT risks Possible Significant
Financial risks
Exchange rate risks Probable Moderate
Interest rate risks Probable Insignificant
Liquidity risks Remote Moderate
Tax risks Possible Moderate
Compliance risks
Regulatory risks Possible Significant
Environmental risks Remote Moderate
Litigation risks Possible Moderate
After thorough analysis of the entire risk situation and according to our current review, there are no discernible risks at present that could jeopardize the continued existence of the Group.
Similarly, based on our current review, there are no discernible risks that could jeopardize the future existence of the Group. No material events of any nature occurred after the reporting date.
Internal Control Procedures
Introduction
The objectives defined by the Chairman for the internal control system of Sartorius Stedim Biotech are as follows:
– Prevent risks that would endanger the quality of the assets of Sartorius Stedim Biotech or even its existence;
– Ensure that the executive management activities, the transactions completed and the conduct of employees comply with the guidelines defined by executive management, applicable laws and regulations, the fundamental values, standards and internal rules of the business and the ethical codes and conventions of the healthcare industry;
– Ensure that accounting and financial information and management data provided to the executive management of the company accurately reflect the operations of Sartorius Stedim Biotech;
– Prevent risks arising from operations, errors or fraud, especially in the accounting and financial area.
Scope of Internal Control
The internal control system described covers the parent company and its affiliates.
Components of Internal Control
Environment for Internal Control
The core of any business is its people (their individual attributes, including integrity, ethical values and expertise) and the environment in which they operate. They are the engine that drives the organization and the foundation that supports the company.
46 Management Report Opportunity and Risk Report
Risk Assessment Process — Risk Mapping
The company must be aware of, and deal with, the risks it faces. It must set itself objectives and integrate them into its sales, production, marketing, financial and other activities so that the organization operates in concert. It must also establish mechanisms to identify, analyze and manage the related risks.
Control Activities
These control activities are undertaken at every level of the Group to ensure that internal control is efficient: checking the accuracy, completeness, authorization, validation and recording of transactions and ensuring that different people discharge different duties so as to reduce the risk of errors or fraud.
Information and Communication
The availability of accurate, reliable and complete information is essential both to achieve business objectives and to enable proper reporting to all parties concerned in compliance with the applicable laws and regulations.
Monitoring, Control and Management
Responsibilities and authorities must be defined and understood at all levels of a company for internal control to function effectively. Duties must be assigned in such a way that a person’s work is always checked and approved by a different person. Where the size of the local unit concerned permits, responsibility for initiating, authorizing, recording and processing transactions must always be assigned to different individuals.
Unit management is responsible for maintaining internal checks and internal control at all times.
Internal Controlling Roles
Executive Management
The Chairman and Chief Executive Officer is responsible for the internal control system and management at all levels. He is also responsible for the development, operation, monitoring and management of the internal controlling systems and for providing the necessary assurances that these steps have been implemented.
Audit Committee
The Audit Committee is responsible for carrying out any necessary reviews and evaluations of the internal controlling procedures, including those relating to financial information, and also assists with the preparation of the Group’s consolidated financial statements. For further information about the Audit Committee, see page 74.
Risk Management
The Sartorius Stedim Biotech Group is inevitably exposed to a wide variety of risks by the nature of its operations around the world. Accordingly, an internal risk management system has been set up to help identify, assess and manage these risks efficiently. Within this risk management system, an ad hoc committee comprised of representatives of different departments regularly studies current issues of risk management. This enables the committee to provide executive management with an overview of the risk to which the company is exposed, enabling it to take appropriate action when required.
Internal Auditing Department
The Internal Auditing Department is in charge of monitoring the effectiveness and suitability of risk management and the internal control system in Sartorius Stedim Biotech Group companies, as well as compliance of all activities and processes with internal and external rules and standards. It provides independent auditing and consulting services that focus primarily on compliance with all relevant legal provisions and the improvement of business processes at the company. To ensure the independence of the internal auditors, the Audit Committee receives, at least once a year, a report from the Internal Auditing Department on the work they have done (according to the audit plan established by this committee) and their findings with regard to Group affiliates.
Management Report Opportunity and Risk Report 47
Finance and Controlling Departments
The Finance and Controlling Departments track and monitor operations and projects to optimize the Group’s profitability and cash flow, providing both internal and external stakeholders with reliable information.
These two departments define the Group’s accounting rules and methods and its principle financial processes (five-year business plan, budget, etc.) as well as reporting tools, in order to monitor the day-to-day business.
Procedures for Preparing the Group Financial Statements and Other Accounting and Financial Information
The accounts of affiliates are prepared in accordance with the Group’s accounting policies. The data is then adjusted, where necessary, to produce company accounts that comply with the applicable local legal and tax provisions. Integrated consolidation software is used both for management reporting purposes and to produce the Group financial statements.
Since 2013, the Group has decided to implement a hard close process as of November 30 in order to anticipate and improve the annual audit.
Accounting Standards
The consolidated financial statements are prepared in accordance with IFRS accounting standards as currently adopted by the European Union. The consolidated financial statements comply with accounting rules and methods as detailed in the Notes to the Consolidated Financial Statements.
Roles of the Group’s Finance and Controlling Departments
The Finance and Controlling Departments check the quality of the reporting packages submitted by affiliates, focusing primarily on the following elements: checking corporate data and consolidated adjustments entered locally, inter-company eliminations, the accounting treatment of non-recurring transactions for the reporting period, and verifying principal movements between the opening and closing balance sheets to prepare the cash flow statement.
The Finance Department also verifies the results of procedures, including currency translation, intercompany eliminations, etc.
Key points of review include the preparation and validation of the statement of changes in shareholders’ equity and the cash flow statement.
Financial Information and Reporting
The Group’s rules and procedures in relation to financial reporting and accounting are set out in the Accounting and Reporting Manual. Application of and compliance with these principles, rules and procedures are the direct responsibility of the finance director of each affiliate. They must ensure that information provided via the Management Information System complies fully with all applicable disclosure requirements.
Executive Management reviews the effectiveness of the internal controlling of financial reporting regularly. In particular, it verifies that transactions have been recorded consistently, in accordance with IFRS international accounting standards as applied by the Group and as set out in the Accounting and Reporting Manual, in order to ensure the pertinence of trans-actions and assets recognized within the times set.
Internal Control in 2019
From an internal control perspective, the Group focused on the following this year:
Code of Conduct and Anti-Corruption Code
Employees can consult the Sartorius Code of Conduct and the Sartorius Anti-Corruption Code; initial trainings have been completed and implemented as a controlled operation.
These codes are subject to reviews and revisions as required by amended legislation. In addition, all employees of the company and of the Group are made aware of these codes and must ensure compliance with them on a daily basis.
48 Management Report Opportunity and Risk Report
Corporate Transactions
The company complies with the Recommendation of the Autorité des Marchés Financiers of November 3, 2010, and with the AFEP-MEDEF Code, as revised in June 2018. Thus, transactions involving the purchase or sale of the company’s securities or financial instruments are prohibited during the periods between the date on which managers, persons considered managers under the law, and any person having regular or occasional access to privileged information are aware of precise information on the course of business or prospects that, if made public, could have a significant influence on the price and the date on which the information is made public.
In addition they are also prohibited for a period of:
– fifteen calendar days prior to the date of publication of the annual and semi-annual financial statements of the company,
– fifteen calendar days, preceding the date of publication of the quarterly information, this day included.
At the beginning of each calendar year, the company prepares and distributes a schedule setting out the periods during which trading in the company’s securities is prohibited, specifying that the days indicated do not prejudge the existence of other closed periods resulting from the knowledge of specific information that directly or indirectly concerns the company, which, if it were made pubic, could have a significant influence on the share price of the company’s shares.
In accordance with the recommendations of the AFEP-MEDEF Code and the Autorité des Marchés Financiers Recommendation No. 2010 - 07 of November 3, 2010, hedging transactions of any kind on the company’s shares with regard to stock options are prohibited.
Mid-Term Prospects
The Group will continue to work on Internal Control issues by strengthening its approach to risk mapping and risk management. This process will be based on elements of the AMF Internal Control Reference Framework. In addition, the process of defining mandatory minimum standards of internal controls applying to all Group companies has been followed by publishing the Group Internal Controls Handbook and will be pursued further in 2020.
Management Report Forecast Report 49
Continued High Growth in the Biopharmaceutical Industry
Strong, long-term trends drive growth in the pharmaceutical industry, which is almost entirely independent of business cycles. Various market observers estimate the world's pharmaceutical market will grow between 3% and 6% annually during the period up to 2023. The biopharma segment of the pharmaceutical market, which has been enjoying particularly strong growth for years, will continue to outperform the market. For the period of 2019 to 2023, growth is expected to average between 8% and 9% annually. This would amount to an increase in market volume from the current level of €235 billion to €320 billion. The share of biological medications and vaccines in the total revenue generated by the global pharmaceutical market is expected to continue rising.
In the coming years, the most dynamic market will likely be China. Positive regulatory and political conditions, a constantly increasing number of local biotech companies and rising demand for advanced biopharmaceuticals have been fueling above-average growth for several years now. This trend could continue as a result of the huge amount of catch-up potential in the market and the improved availability of biotech medications. Considerable growth in the United States and Europe is also anticipated, driven in particular by a growing need for medications for aging societies, as well as the rising number of chronically ill and multi-morbid patients. In addition, more and more medications are being approved. For example, biopharmaceuticals are increasingly being used in yet-to-be fully explored therapeutic areas and in the treatment of rare diseases that have thus far been untreatable. Innovative types of therapy for regenerative medicine and new substance classes, such as antibody-drug conjugates (ADCs), are increasing the number and range of approved biopharmaceuticals , as well as necessitating investments in innovative production technologies.
This relatively young biopharmaceuticals segment is driving sector growth with its high innovative power, as reflected in the strong research and development pipelines. Of the estimated 10,000+ medications in R&D pipelines, more than 40% are based on biological manufacturing processes. These include more than 1,750 biosimilars and biobetters, which are generic versions of biologic agents with comparable or better efficacy or fewer side effects than the original compounds.
Biosimilars are contributing increasingly to the growth of the biotechnology market. Current estimates indicate that by 2022, the market could grow by an annual average of 30% and reach a volume of around €18 billion. The significantly lower prices of biosimilars, particularly in emerging and developing countries, are creating new, affordable therapy options and are expected to result in increased demand and rising manufacturing volume. The development of national production capacities to meet the growing demand for medications is receiving political support in these countries and is fueling the establishment of local biotech companies. The biosimilars market in industrialized countries is also likely to expand considerably in the coming years due to the expiration of patents for high-volume biopharmaceuticals and an increasing number of approved biosimilars. This is particularly the case in Europe, where generic medications have been widely used for many years and have been able to gain significant market share in some areas. In the United States, regulatory, patent and marketing challenges that have slowed development up to now could begin to ease.
Forecast Report
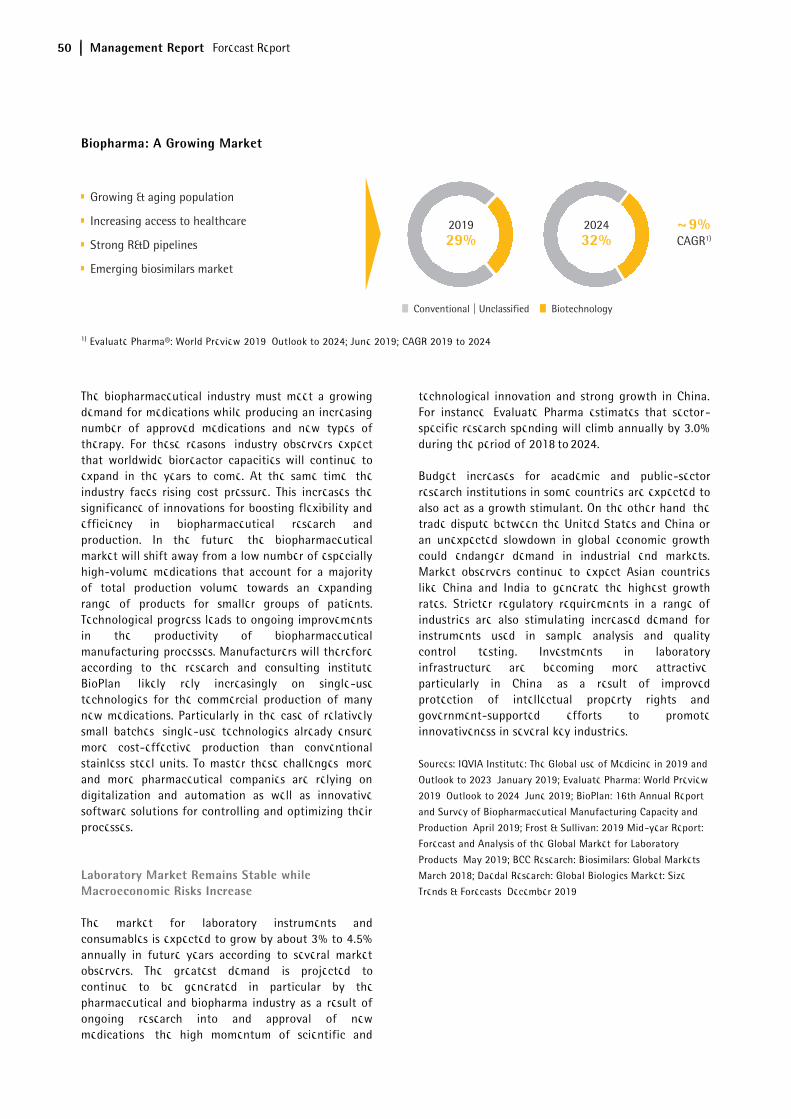
50 Management Report Forecast Report
Biopharma: A Growing Market
1) Evaluate Pharma®: World Preview 2019, Outlook to 2024; June 2019; CAGR 2019 to 2024
The biopharmaceutical industry must meet a growing demand for medications while producing an increasing number of approved medications and new types of therapy. For these reasons, industry observers expect that worldwide bioreactor capacities will continue to expand in the years to come. At the same time, the industry faces rising cost pressure. This increases the significance of innovations for boosting flexibility and efficiency in biopharmaceutical research and production. In the future, the biopharmaceutical market will shift away from a low number of especially high-volume medications that account for a majority of total production volume towards an expanding range of products for smaller groups of patients. Technological progress leads to ongoing improvements in the productivity of biopharmaceutical manufacturing processes. Manufacturers will therefore, according to the research and consulting institute BioPlan, likely rely increasingly on single-use technologies for the commercial production of many new medications. Particularly in the case of relatively small batches, single-use technologies already ensure more cost-effective production than conventional stainless steel units. To master these challenges, more and more pharmaceutical companies are relying on digitalization and automation as well as innovative software solutions for controlling and optimizing their processes.
Laboratory Market Remains Stable while Macroeconomic Risks Increase
The market for laboratory instruments and consumables is expected to grow by about 3% to 4.5% annually in future years according to several market observers. The greatest demand is projected to continue to be generated in particular by the pharmaceutical and biopharma industry as a result of ongoing research into and approval of new medications, the high momentum of scientific and
technological innovation and strong growth in China. For instance, Evaluate Pharma estimates that sector-specific research spending will climb annually by 3.0% during the period of 2018 to 2024.
Budget increases for academic and public-sector research institutions in some countries are expected to also act as a growth stimulant. On the other hand, the trade dispute between the United States and China or an unexpected slowdown in global economic growth could endanger demand in industrial end markets. Market observers continue to expect Asian countries like China and India to generate the highest growth rates. Stricter regulatory requirements in a range of industries are also stimulating increased demand for instruments used in sample analysis and quality control testing. Investments in laboratory infrastructure are becoming more attractive, particularly in China, as a result of improved protection of intellectual property rights and government-supported efforts to promote innovativeness in several key industries.
Sources: IQVIA Institute: The Global use of Medicine in 2019 and
Outlook to 2023, January 2019; Evaluate Pharma: World Preview
2019, Outlook to 2024, June 2019; BioPlan: 16th Annual Report
and Survey of Biopharmaceutical Manufacturing Capacity and
Production, April 2019; Frost & Sullivan: 2019 Mid-year Report:
Forecast and Analysis of the Global Market for Laboratory
Products, May 2019; BCC Research: Biosimilars: Global Markets,
March 2018; Daedal Research: Global Biologics Market: Size,
Trends & Forecasts, December 2019
■ Growing & aging population
■ Increasing access to healthcare
■ Strong R&D pipelines
■ Emerging biosimilars market
~ 9% CAGR1)
■ Conventional | Unclassified ■ Biotechnology
2024 32%
2019 29%
Management Report Forecast Report 51
Future Business Development
Our 2020 guidance reflects the sector environment and economic trends, as well as the opportunities and risks outlined in this Annual Report. All forecasted figures are given in constant currencies. The entire guidance was derived using the same process as in the previous year.
Sartorius Stedim Biotech projects that it will increase Group sales in fiscal 2020 on the basis of constant currencies by around 11% to 14%, with Biological Industries acquired at the end of 2019 expected to contribute approx. 2 percentage point to this growth.
Regarding profitability, management forecasts that the company's underlying EBITDA margin will increase year over year from 29.3% to about 29.5%.
The ratio of capital expenditures to sales revenue is expected to be around 8%, down from the year-earlier figure of 9.4%.
With respect to financial position, management projects that the ratio of net debt to underlying EBITDA will be slightly below the previous year's level of 0.3 reported.
The above forecast does not consider the acquisition of parts of Danaher’s life science portfolio, which was announced on October 21, 2019, and is currently undergoing antitrust clearance. Following the closing of the transaction, which is currently expected around the end of the first quarter of 2020, management will adjust its full-year guidance accordingly.
The guidance assumes an overall stable economic environment and intact supply chains.
52 Management Report Financial Statements of the Parent Company Sartorius Stedim Biotech S.A. as of December 31, 2019
Financial Statements of the Parent Company
Sartorius Stedim Biotech S.A. is the parent company of the Group. The company is a mixed holding Company. The company from now on is managing investments of the Group and reals estates for the French Companies.
In 2019, sales revenue generated at Sartorius Stedim Biotech S.A. was €K 2,116 relative to €K 1,999 in 2018. The operating profit is €K - 2,606 versus €K - 2,371 K in 2018. The net financing income totaled €K 58,925 versus €K 48,576 in 2018.
The net profit for 2019 is €K 56,834 compared to €K 49,521 in 2018.
Appropriation of the Net Profit
The ASM will suggest to appropriate the net profit of €56,834,137 for the reporting year of 2019. as follows:
– The following amount is to be added to this balance: Year-earlier profit carried forward: €31,324,481
– This would yield a distributable profit of €88,158,618
– Total amount of dividends to be disbursed to shareholders: €62,682,529
– Balance resulting from disbursement: €25,476,089
The remaining amount of €25,476,089 is to be carried out to the next year.
Dividends of the last three financial years (information updated as of 1st January 2019)
The table below makes the list of the amount of the dividend per share distributed, since 2016, as well as the tax provisions applicable.
Exercise Dividend1)
Amount eligible for
the 40% abatment
Amount not eligible
for the 40%
abatment Dividend per shares1)
Dec. 31, 2018 52,540,761 52,540,761 0 0.57 €
Dec. 31, 2017 42,402,887 42,402,887 0 0.46 €
Dec. 31, 2016 38,713,209 38,713,209 0 0.42 €
1) Prior deduction of social contribution on the dividend paid to physical person.
Proposition of dividend for the 2019 financial year
The Board of Directors has decided to propose to the 24th of March 2020 Annual Shareholders’ Meeting a net dividend of 0.68 euros, per share for the 2019 financial year in comparison with €0.57 for 2018.
The dividends are distributed to the shareholders in ratio with the proportion of the capital held by each shareholder.
The dividend will be paid on 31 March 2020.
Dividend distribution policy
The company follows a policy of dividend distribution linked on one part to the Group’s profit over the financial year concerned and on another one to the Group’s predictable evolution and profitability.
The 26th of March 2019 Shareholders’ Meeting voted a net dividend of 0.57 euro per share. The payment of the dividend was paid on 2 April 2019.
Dividends and interim dividends paid and unclaimed are prescribed after five years in favor of the State, from their date of payment (article 2277 of the Civil Code).
Financial Statements of the Parent Company Sartorius Stedim Biotech S.A. as of December 31, 2019
Management Report Financial Statements of the Parent Company Sartorius Stedim Biotech S.A. as of December 31, 2019 53
Elements likely to have an impact in the event of a public offer
Pursuant to article L. 225 - 100 - 3 of the French Commercial Code, an element is likely to have an impact in the event of a public offer: the first shareholder of Sartorius Stedim Biotech S.A. holds a significant percentage of its capital and voting rights.
Sartorius Stedim Biotech S.A. Share Capital
Share Capital as of December 31, 2019
As of 31 December 2019, the share capital amounts to eighteen million four hundred and thirty-six thousand thirty-eight euros (€18,436,038). It is divided into twenty two million one hundred and eighty thousand one hundred and ninety (92,180,190) shares worth twenty cents euros (€0,20) each, all fully subscribed and paid up (Heading I, Article 6 of the bylaws), all of which are entitled to the dividend for the financial year 2018, with the exception of shares held by the Company.
Date Nature of the transaction Share par
value Share capital
increase Share
premium Number of new
shares
Number of shares after
the transaction
Share capital after the
transaction
Year 2013 Exercise of share
subscription options 0.61 610.0 8,620.0 1,000.0 17,042,306 10,395,806.6
Year 2014 Exercise of share
subscription options 0.61 9,541.6 134,834.0 15,642.0 17,057,948 10,405,348.2
Year 2014
Reduction of Capital: Cancellation of Treasury
Shares 0.61 –1,036,213.1 –1,698,710.0 15,359,238 9,369,135.1
Year 2014 Increase of Capital:
nominal value change 1.00 5,990,102.8 15,359,238 15,359,238.0
Year 2015 Exercise of share
subscription options 1.00 8,000.0 174,880.0 8,000.0 15,367,238 15,367,238.0
Year 2016
Reduction of Capital: Cancellation of Treasury
Shares 1.00 –1,642,095.0 –1,642,095.0 13,725,143 13,725,143.0
Year 2016 Increase of Capital: new
actions created 1.00 1,638,222.0 1,638,222.0 15,363,365 15,363,365.0
Year 2016 Increase of Capital:
nominal value change 0.20 3,072,673.0 3,072,673.0 92,180,190 18,436,038.0
Year 2017 92,180,190 18,436,038.0
Year 2018 92,180,190 18,436,038.0
Year 2019 92,180,190 18,436,038.0
Sartorius Stedim Biotech S.A. Shareholdings as of December 31, 2019
Situation of Sartorius Stedim Biotech S.A. Shareholdings
Shareholders Shares Voting rights
More than 50% Sartorius AG Sartorius AG
More than 10% but less than 50% None None
More than 5% but less than 10% None None
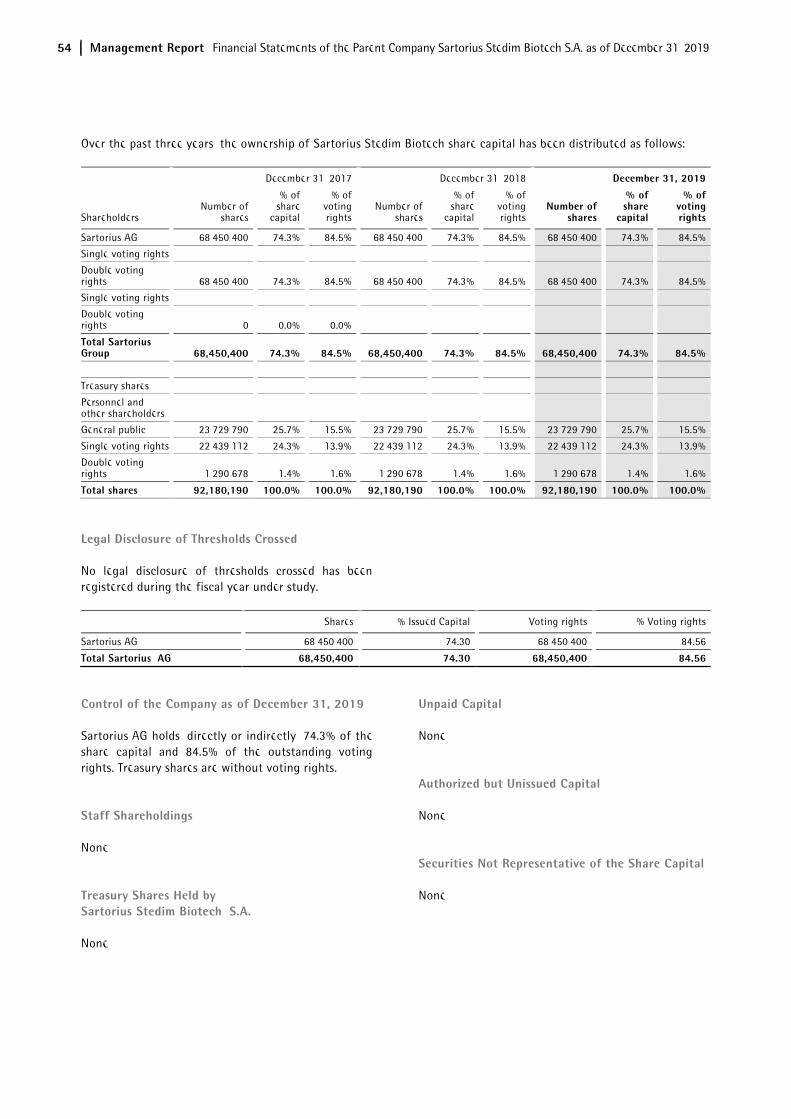
54 Management Report Financial Statements of the Parent Company Sartorius Stedim Biotech S.A. as of December 31, 2019
Over the past three years, the ownership of Sartorius Stedim Biotech share capital has been distributed as follows:
December 31, 2017 December 31, 2018 December 31, 2019
Shareholders Number of
shares
% of share
capital
% of voting rights
Number of shares
% of share
capital
% of voting rights
Number of shares
% of share
capital
% of voting rights
Sartorius AG 68,450,400 74.3% 84.5% 68,450,400 74.3% 84.5% 68,450,400 74.3% 84.5%
Single voting rights
Double voting rights 68,450,400 74.3% 84.5% 68,450,400 74.3% 84.5% 68,450,400 74.3% 84.5%
Single voting rights
Double voting rights 0 0.0% 0.0%
Total Sartorius Group 68,450,400 74.3% 84.5% 68,450,400 74.3% 84.5% 68,450,400 74.3% 84.5%
Treasury shares
Personnel and other shareholders
General public 23,729,790 25.7% 15.5% 23,729,790 25.7% 15.5% 23,729,790 25.7% 15.5%
Single voting rights 22,439,112 24.3% 13.9% 22,439,112 24.3% 13.9% 22,439,112 24.3% 13.9%
Double voting rights 1,290,678 1.4% 1.6% 1,290,678 1.4% 1.6% 1,290,678 1.4% 1.6%
Total shares 92,180,190 100.0% 100.0% 92,180,190 100.0% 100.0% 92,180,190 100.0% 100.0%
Legal Disclosure of Thresholds Crossed
No legal disclosure of thresholds crossed has been registered during the fiscal year under study.
Shares % Issued Capital Voting rights % Voting rights
Sartorius AG 68,450,400 74.30 68,450,400 84.56
Total Sartorius AG 68,450,400 74.30 68,450,400 84.56
Control of the Company as of December 31, 2019
Sartorius AG holds, directly or indirectly, 74.3% of the share capital and 84.5% of the outstanding voting rights. Treasury shares are without voting rights.
Staff Shareholdings
None
Treasury Shares Held by Sartorius Stedim Biotech S.A.
None
Unpaid Capital
None
Authorized but Unissued Capital
None
Securities Not Representative of the Share Capital
None
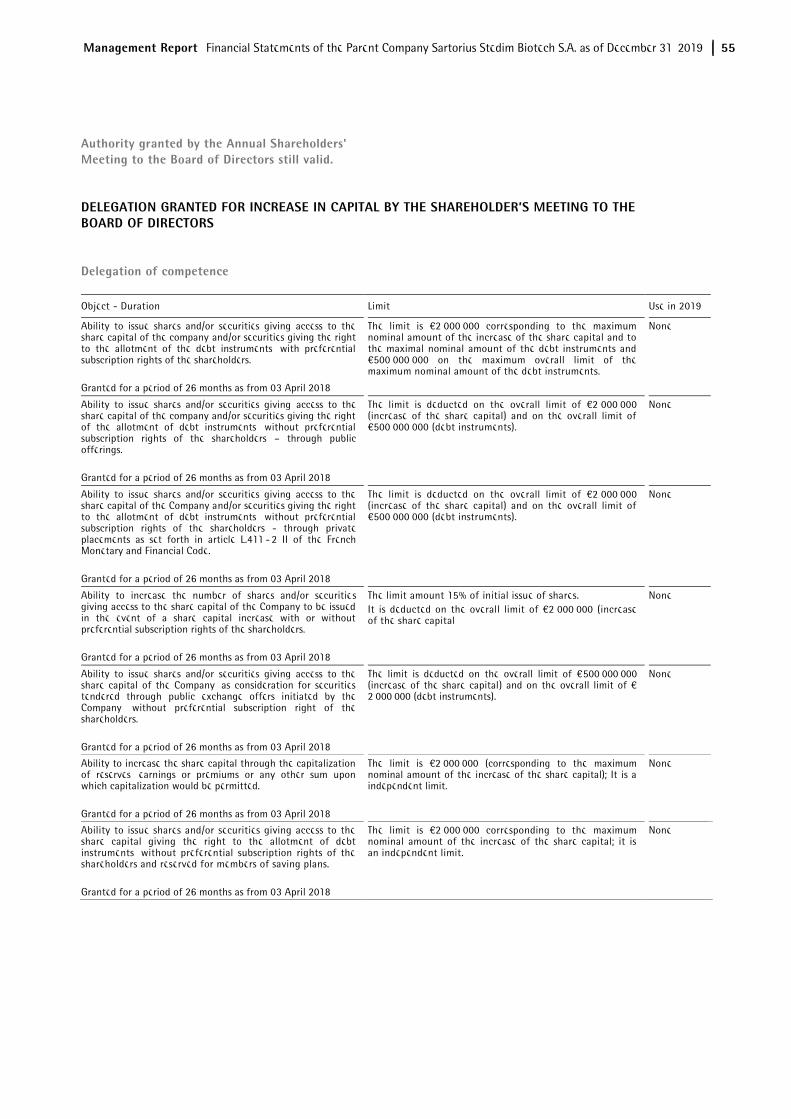
Management Report Financial Statements of the Parent Company Sartorius Stedim Biotech S.A. as of December 31, 2019 55
Authority granted by the Annual Shareholders' Meeting to the Board of Directors still valid.
DELEGATION GRANTED FOR INCREASE IN CAPITAL BY THE SHAREHOLDER’S MEETING TO THE BOARD OF DIRECTORS
Delegation of competence
Object - Duration Limit Use in 2019
Ability to issue shares and/or securities giving access to the share capital of the company and/or securities giving the right to the allotment of the debt instruments, with preferential subscription rights of the shareholders. Granted for a period of 26 months as from 03 April 2018
The limit is €2,000,000 corresponding to the maximum nominal amount of the increase of the share capital and to the maximal nominal amount of the debt instruments and €500,000,000 on the maximum overall limit of the maximum nominal amount of the debt instruments.
None
Ability to issue shares and/or securities giving access to the share capital of the company and/or securities giving the right of the allotment of debt instruments, without preferential subscription rights of the shareholders – through public offerings. Granted for a period of 26 months as from 03 April 2018
The limit is deducted on the overall limit of €2,000,000 (increase of the share capital) and on the overall limit of €500,000,000 (debt instruments).
None
Ability to issue shares and/or securities giving access to the share capital of the Company and/or securities giving the right to the allotment of debt instruments, without preferential subscription rights of the shareholders - through private placements as set forth in article L.411 - 2 II of the French Monetary and Financial Code. Granted for a period of 26 months as from 03 April 2018
The limit is deducted on the overall limit of €2,000,000 (increase of the share capital) and on the overall limit of €500,000,000 (debt instruments).
None
Ability to increase the number of shares and/or securities giving access to the share capital of the Company to be issued in the event of a share capital increase with or without preferential subscription rights of the shareholders. Granted for a period of 26 months as from 03 April 2018
The limit amount 15% of initial issue of shares. It is deducted on the overall limit of €2,000,000 (increase of the share capital
None
Ability to issue shares and/or securities giving access to the share capital of the Company, as consideration for securities tendered through public exchange offers initiated by the Company, without preferential subscription right of the shareholders. Granted for a period of 26 months as from 03 April 2018
The limit is deducted on the overall limit of €500,000,000 (increase of the share capital) and on the overall limit of € 2,000,000 (debt instruments).
None
Ability to increase the share capital through the capitalization of reserves, earnings or premiums or any other sum upon which capitalization would be permitted. Granted for a period of 26 months as from 03 April 2018
The limit is €2,000,000 (corresponding to the maximum nominal amount of the increase of the share capital); It is a independent limit.
None
Ability to issue shares and/or securities giving access to the share capital giving the right to the allotment of debt instruments, without preferential subscription rights of the shareholders and reserved for members of saving plans. Granted for a period of 26 months as from 03 April 2018
The limit is €2,000,000 corresponding to the maximum nominal amount of the increase of the share capital; it is an independent limit.
None
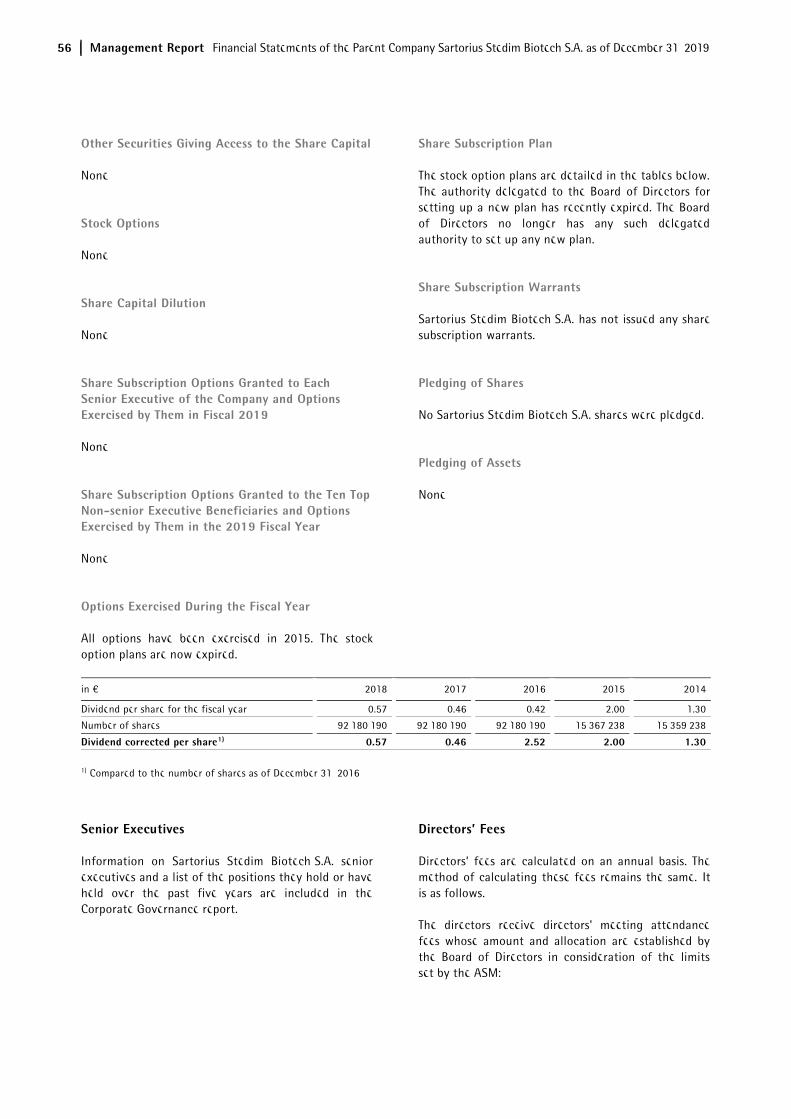
56 Management Report Financial Statements of the Parent Company Sartorius Stedim Biotech S.A. as of December 31, 2019
Other Securities Giving Access to the Share Capital
None
Stock Options
None
Share Capital Dilution
None
Share Subscription Options Granted to Each Senior Executive of the Company and Options Exercised by Them in Fiscal 2019
None
Share Subscription Options Granted to the Ten Top Non-senior Executive Beneficiaries and Options Exercised by Them in the 2019 Fiscal Year
None
Options Exercised During the Fiscal Year
All options have been exercised in 2015. The stock option plans are now expired.
Share Subscription Plan
The stock option plans are detailed in the tables below. The authority delegated to the Board of Directors for setting up a new plan has recently expired. The Board of Directors no longer has any such delegated authority to set up any new plan.
Share Subscription Warrants
Sartorius Stedim Biotech S.A. has not issued any share subscription warrants.
Pledging of Shares
No Sartorius Stedim Biotech S.A. shares were pledged.
Pledging of Assets
None
in € 2018 2017 2016 2015 2014
Dividend per share for the fiscal year 0.57 0.46 0.42 2.00 1.30
Number of shares 92,180,190 92,180,190 92,180,190 15,367,238 15,359,238
Dividend corrected per share1) 0.57 0.46 2.52 2.00 1.30
1) Compared to the number of shares as of December 31, 2016
Senior Executives
Information on Sartorius Stedim Biotech S.A. senior executives and a list of the positions they hold or have held over the past five years are included in the Corporate Governance report.
Directors’ Fees
Directors’ fees are calculated on an annual basis. The method of calculating these fees remains the same. It is as follows.
The directors receive directors' meeting attendance fees whose amount and allocation are established by the Board of Directors in consideration of the limits set by the ASM:
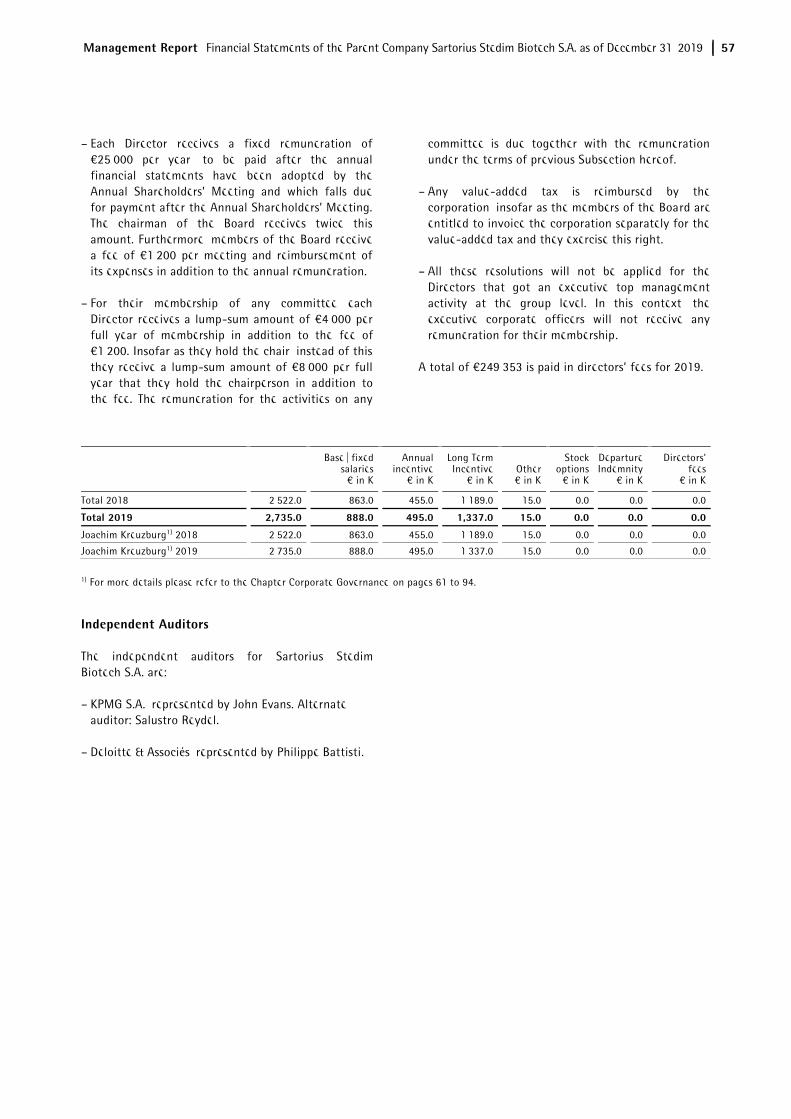
Management Report Financial Statements of the Parent Company Sartorius Stedim Biotech S.A. as of December 31, 2019 57
– Each Director receives a fixed remuneration of €25,000 per year, to be paid after the annual financial statements have been adopted by the Annual Shareholders’ Meeting and which falls due for payment after the Annual Shareholders’ Meeting. The chairman of the Board receives twice this amount. Furthermore, members of the Board receive a fee of €1,200 per meeting and reimbursement of its expenses in addition to the annual remuneration.
– For their membership of any committee each Director receives a lump-sum amount of €4,000 per full year of membership in addition to the fee of €1,200. Insofar as they hold the chair, instead of this, they receive a lump-sum amount of €8,000 per full year that they hold the chairperson in addition to the fee. The remuneration for the activities on any
committee is due together with the remuneration under the terms of previous Subsection hereof.
– Any value-added tax is reimbursed by the corporation, insofar as the members of the Board are entitled to invoice the corporation separately for the value-added tax and they exercise this right.
– All these resolutions will not be applied for the Directors that got an executive top management activity at the group level. In this context, the executive corporate officers will not receive any remuneration for their membership.
A total of €249,353 is paid in directors’ fees for 2019.
Base | fixed salaries
€ in K
Annual incentive
€ in K
Long Term Incentive
€ in K Other € in K
Stock options
€ in K
Departure Indemnity
€ in K
Directors' fees
€ in K
Total 2018 2,522.0 863.0 455.0 1,189.0 15.0 0.0 0.0 0.0
Total 2019 2,735.0 888.0 495.0 1,337.0 15.0 0.0 0.0 0.0
Joachim Kreuzburg1) 2018 2,522.0 863.0 455.0 1,189.0 15.0 0.0 0.0 0.0
Joachim Kreuzburg1) 2019 2,735.0 888.0 495.0 1,337.0 15.0 0.0 0.0 0.0
1) For more details please refer to the Chapter Corporate Governance on pages 61 to 94.
Independent Auditors
The independent auditors for Sartorius Stedim Biotech S.A. are:
– KPMG S.A., represented by John Evans. Alternate auditor: Salustro Reydel.
– Deloitte & Associés, represented by Philippe Battisti.
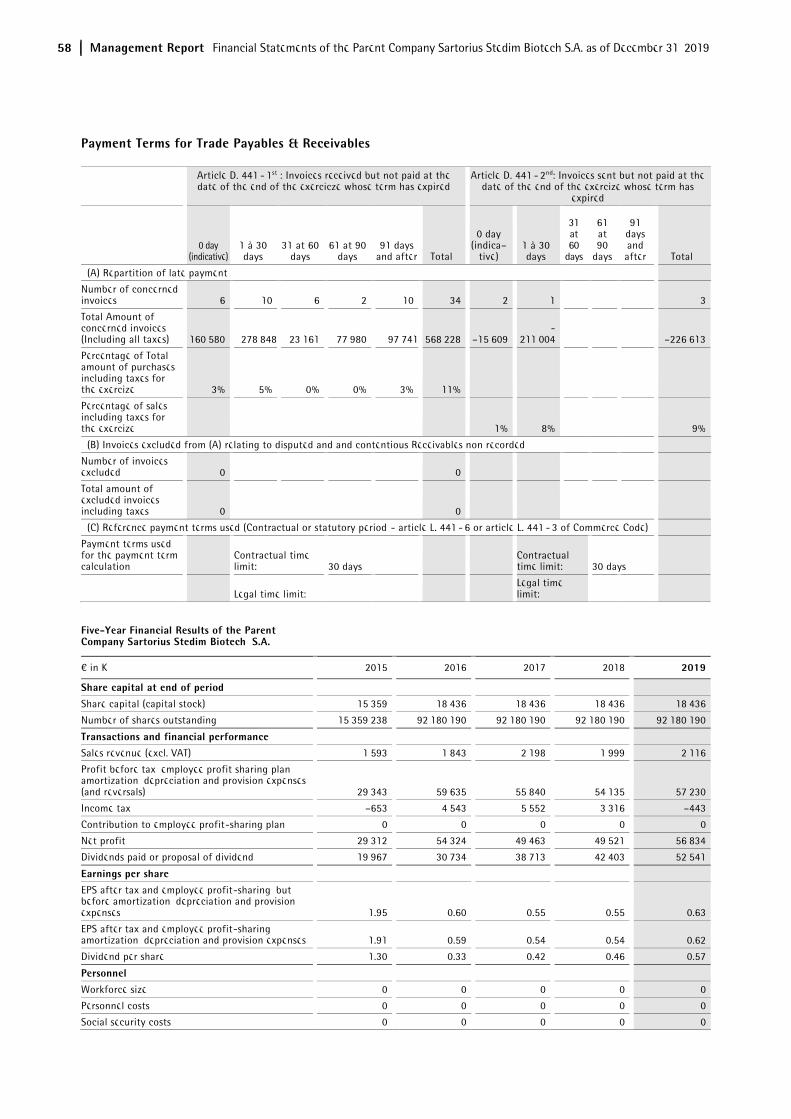
58 Management Report Financial Statements of the Parent Company Sartorius Stedim Biotech S.A. as of December 31, 2019
Payment Terms for Trade Payables & Receivables
Article D. 441 - 1st : Invoices received but not paid at the date of the end of the exercicze whose term has expired
Article D. 441 - 2nd: Invoices sent but not paid at the date of the end of the exercize whose term has
expired
0 day
(indicative) 1 à 30 days
31 at 60 days
61 at 90 days
91 days and after Total
0 day (indica–
tive) 1 à 30 days
31 at 60
days
61 at 90
days
91 days and after Total
(A) Repartition of late payment
Number of concerned invoices 6 10 6 2 10 34 2 1 3
Total Amount of concerned invoices (Including all taxes) 160,580 278,848 23,161 77,980 97,741 568,228 –15,609
-211,004 –226,613
Percentage of Total amount of purchases including taxes for the exercize 3% 5% 0% 0% 3% 11%
Percentage of sales including taxes for the exercize 1% 8% 9%
(B) Invoices excluded from (A) relating to disputed and and contentious Receivables non recorded
Number of invoices excluded 0 0
Total amount of excluded invoices including taxes 0 0
(C) Reference payment terms used (Contractual or statutory period - article L. 441 - 6 or article L. 441 - 3 of Commerce Code)
Payment terms used for the payment term calculation
Contractual time limit: 30 days
Contractual time limit: 30 days
Legal time limit: Legal time limit:
Five-Year Financial Results of the Parent Company Sartorius Stedim Biotech S.A.
€ in K 2015 2016 2017 2018 2019
Share capital at end of period Share capital (capital stock) 15,359 18,436 18,436 18,436 18,436
Number of shares outstanding 15,359,238 92,180,190 92,180,190 92,180,190 92,180,190
Transactions and financial performance Sales revenue (excl. VAT) 1,593 1,843 2,198 1,999 2,116
Profit before tax, employee profit sharing plan, amortization, depreciation and provision expenses (and reversals) 29,343 59,635 55,840 54,135 57,230
Income tax –653 4,543 5,552 3,316 –443
Contribution to employee profit-sharing plan 0 0 0 0 0
Net profit 29,312 54,324 49,463 49,521 56,834
Dividends paid or proposal of dividend 19,967 30,734 38,713 42,403 52,541
Earnings per share EPS after tax and employee profit-sharing, but before amortization, depreciation and provision expenses 1.95 0.60 0.55 0.55 0.63
EPS after tax and employee profit-sharing, amortization, depreciation and provision expenses 1.91 0.59 0.54 0.54 0.62
Dividend per share 1.30 0.33 0.42 0.46 0.57
Personnel Workforce size 0 0 0 0 0
Personnel costs 0 0 0 0 0
Social security costs 0 0 0 0 0