Embed Size (px)
Citation preview
SAR-OPTICAL IMAGE FUSION WITH LANDSAT, SEASAT, ALMAZ AND ERS-1 SATELLITE DATA
David G. Tilley Professional Staff/Space Department'
The Johns Hopkins University Applied Physics Laboratory Laurel, .MD 20723-6099 USA
ISPRS Commission II Systems for Data Processing and Analysis
The Chesapeake Bay estuary along the Mid-Atlantic Coast of The United States was imaged by synthetic aperture radar (SAR) systems aboard the Soviet Almaz satellite in 1991 and the Seasat platform in 1978, and by the thematic mapper (TM) optical system aboard the Landsat-4 platform in 1982. Control points, chosen at sea level, have been used to scale the SAR and TM data to a common map projection. Multi-sensor spatial correlation and coherence functions have been found effective in estimating the vertical elevation and horizontal separation of the twin spans of the Chesapeake Bay bridge. SAR backscatter from the bay scene has been used to compare image resolution for the Almaz and Seas at instruments. Both ERS-1 and Almaz SAR imagery were collected during November 1991 nearly simultaneously and coincidentally off the coast of Newfoundland. These data are compared for Doppler coordinate resolution of wind generated wave fields.
KEY WORDS: Landsat, Seasat, Almaz, Radar, Infrared, Fusion, Coherence, Correlation
1. INTRODUCTION
Scientific visualization (McCormick et. al., 1987) is emerging as an educational tool for investigating relationships between theoretical models and empirical data. In the laboratory and office, visualization is a form of communication that combines computer graphic concepts with image processing technology. Satellite data fusion and assimilation with geophysical models on global scales have progressed beyond the spatial and temporal resolution of alpha-numeric displays. Visualization, theory, and data analysis now form a triad for scientific inquiry with each element requiring and serving the others.
The first section of this poster paper discusses the data processing systems used by a group of about 16 ocean scientists and remote sensing engineers applying satellite data for geophysical research. Members of the group have been involved in oceanography with the synthetic aperture radars aboard NASA's Seas at and space shuttle platforms, satellite altimetry with the U.s. Navy's Geosat program, and atmospheric sounding and ship wake studies for the Department of Defense. Hence, specific software applications have been developed for data analysis using a variety of different computer operating systems and a number of inherited hardware architectures. A local area Ethernet has been developed to facilitate communication within the group and to allow efficient utilization of data acquisition, peripheral storage and display equipment.
The second section of this poster paper presents satellite imagery of the Chesapeake region along the U.s. Altantic Coast recorded over the last dozen years from the perspectives of three different remote sensors. Multi-sensor fusion studies have been conducted to develop methods for registering
512
Seasat, Landsat and Almaz satellite measurements. The Chesapeake Bay Bridge presented itself obliquely 40° from the SAR downrange coordinate, both for Almaz pass 822 and Seas at pass 1339. Landsat-4 and Seas at were free fliers at altitudes of about 700 and 800 kilometers, on November 2, 1982 and September 28, 1978, respectively. Almaz requires active compensation for atmospheric drag which reduced its altitude from 294 to 283 kilometers between May 14 and May 22, 1991.
The third section of this poster paper compares synthetic aperture radar scenes, recorded by the Almaz and ERS-1 satellites on May 23, 1991, of ocean waves propagating over the Grand Banks region off the coast of Newfoundland. The dynamic response characteristics of the two SAR systems are discussed relative to the difference in the height-to-velocity ratios for the Almaz (e.g. 120 sec) and ERS-1 (e.g. 40 sec) platforms. The stationary instrument response characteristics of the SAR aboard ERS-1 are considered for wind roughened scenes of water sheltered from significant ocean swell. The Chesapeake Bay serves as the sheltered test of stationary instrument response for the Almaz sensor. Both radiometric and spatial resolution are considered within this context.
2. DATA PROCESSING SYSTEMS
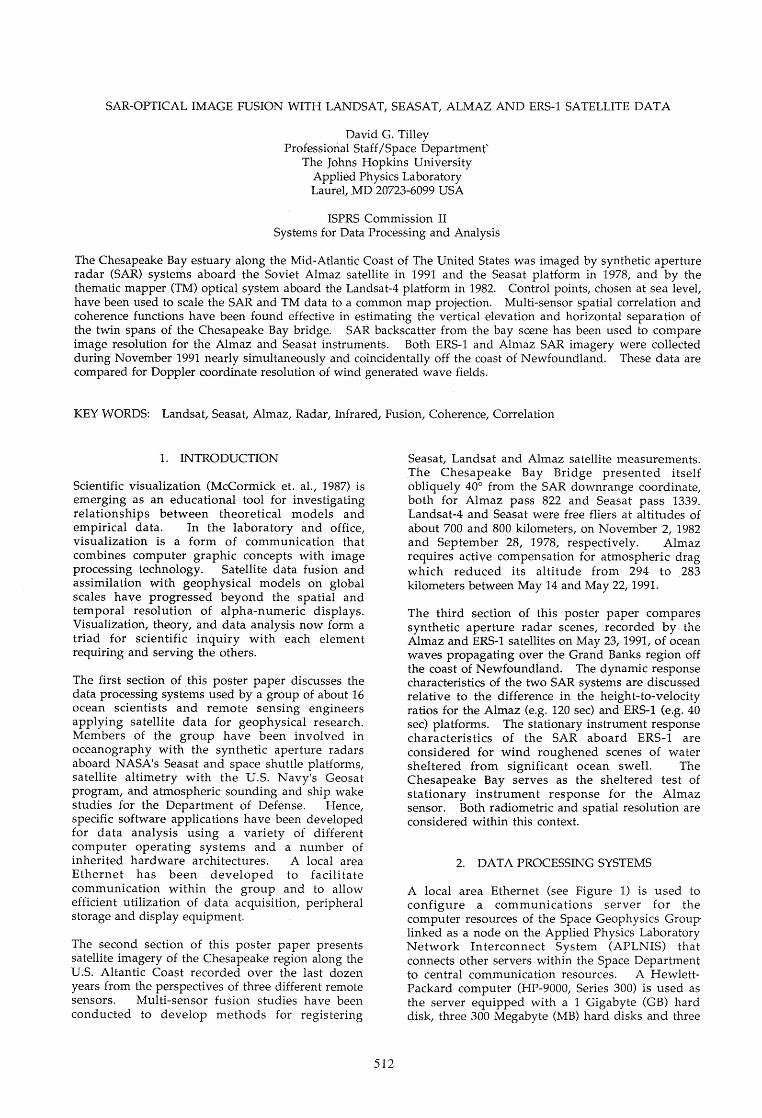
A local area Ethernet (see Figure 1) is used to configure a communications server for the computer resources of. the Space Geophysics Group linked as a node on the Applied Physics Laboratory Network Interconnect System (APLNIS) that connects other servers within the Space Department to central communication resources. A HewlettPackard computer (HP-9000, Series 300) is used as the server equipped with a 1 Gigabyte (GB) hard disk, three 300 Megabyte (MB) hard disks and three
600 MB (i.e., double sided) optical disk drives. This server is also equipped with two HP-7970 tape drives supporting 1600 and 6250 BPI (i.e., tape densities in bits per inch ), a color HP-7550 pen plotter and a number of Laserjet and Postscript printers. The principal computational resource of the network (HP-9000, Series 700) is configured as workstation with a 1 GB hard disk, a 5 3/4" CD-ROM (Le., compact disc-read only memory) drive and a 600 MB double sided optical disk drive. Approximately eight IBM compatible computers, six Macintosh II computers and two Sun 3/60 computers are also configured as workstations. A Macintosh SE/30 computer is used to host a Kodak XL7700 thermal
/'o.0l 'i E 0)., B5 COW
~cr ~~ I:!w
~ u(l)
a:: w U Q
0 FX wO
.~ ~co
~ '" ., ~~
Z~ (ii 0
in u a:: 0 1-- (I)
,- -B ~ ~~5 (/) CD.!;
io. ~~I; ~ ~~~ .l<~
Cl)
Pi ;:;rel ~ ;~
i ~' ~cI N cO ~
~ u ;;:.
~ 'i
E cr
8 8 u ;;:. ;;:. ~ 'i 'i
E E cr a:
513
printer which is the principal device used for grey scaled and color image output of 8 1/2" x 11" prints and transparencies at 200 dots per inch.
The group also operates a MicroVAX II computer and three VAX-3100 workstations equipped with 100 MB hard disks and 300 MB optical disk drives. The Micro VAX II is equipped with a 300 MB hard disk, a 1600/6250 BPI tape drive and an Optronics C4300 color film-writer for 23 cm x 25 cm image formats at resolutions up to 400 lines per cm. Additional disks and tape drives are available at a remote site via APLNIS, a 10 MB/sec optical fiber network.
The group maintains internet services on its local area network and subscribes to electronic mail services provided by APLNIS. Hence, the author receives data as [email protected] and prefers the [email protected] address for messages. TCP lIP (Le., Transmission Control Protocol/Internet Protocol) is the software protocol used for interconnecting the various hardware systems. The X-Window protocol is in use to accommodate image and text displays at Macintosh and IBM compatible workstations for information computed with Interactive Display Language (IDL) software running on the HP 9000 computer. Specific application software is usually developed with the Fortran-77 language running under Unix-8 on the HP computers and VMS-5 on the V AX
computers. Members of the group subscribe to a variety of DOS software packages on their personal computers.
3. CHESAPEAKE MULTI SENSOR FUSION STUDY
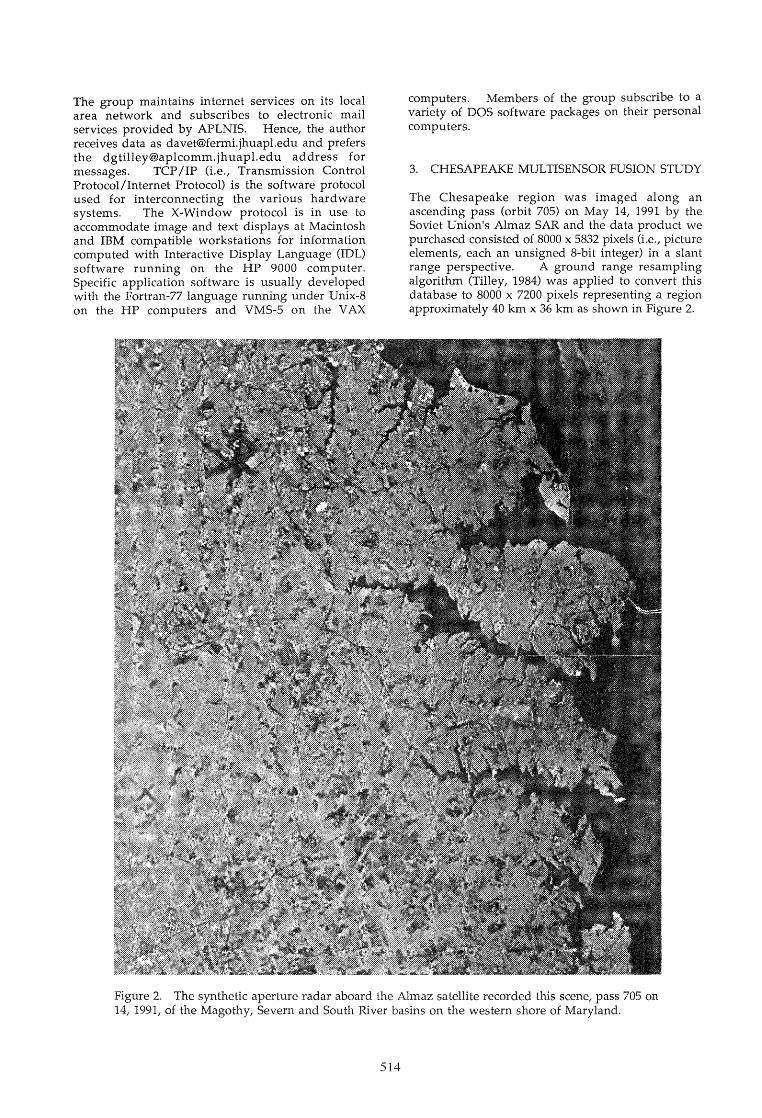
The Chesapeake region was imaged along an ascending pass (orbit 705) on May 14, 1991 by the Soviet Union's Almaz SAR and the data product we purchased consisted of 8000 x 5832 pixels (i.e., picture elements, each an unsigned 8-bit integer) in a slant range perspective. A ground range resampling algorithm (Tilley, 1984) was applied to convert this database to 8000 x 7200 pixels representing a region approximately 40 km x 36 km as shown in Figure 2.
Figure 2. The synthetic aperture radar aboard the Almaz satellite recorded this scene, pass 705 on 14, 1991, of the Magothy, Severn and South River basins on the western shore of Maryland.
514
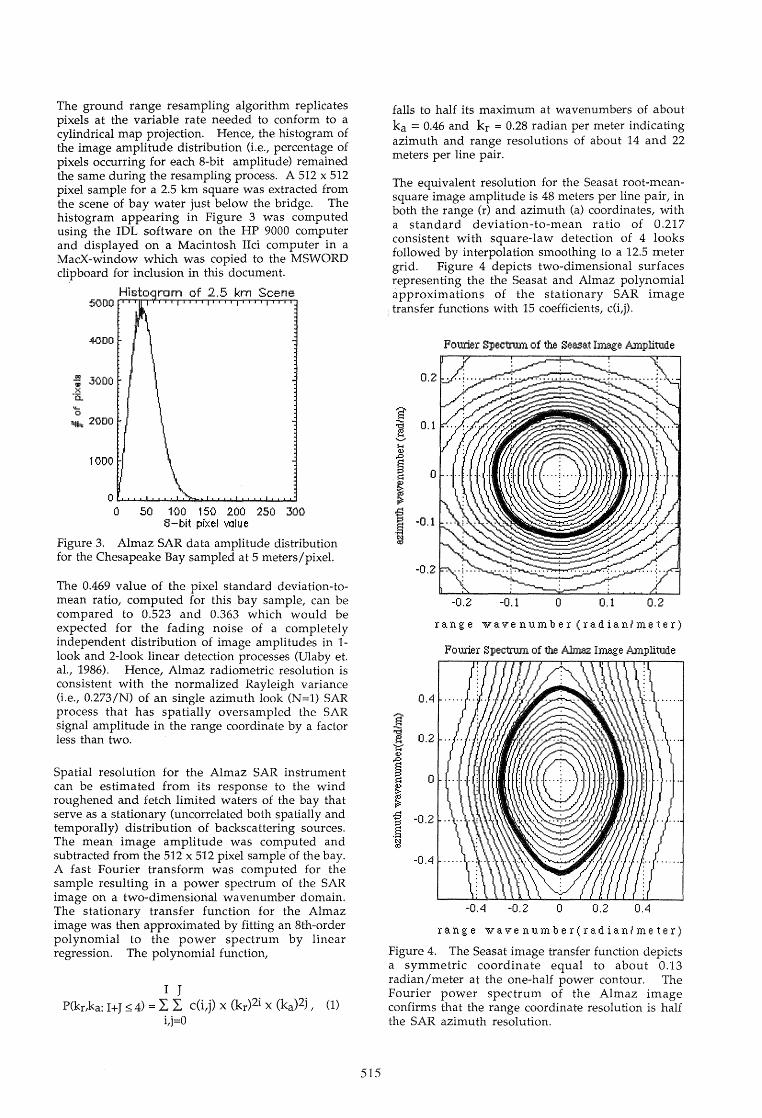
The ground range resampling algorithm replicates pixels at the variable rate needed to co~form to a cylindrical map projection. Hence, the hlstogram of the image amplitude distribution (Le., percentage of pixels occurring for each 8-bit amplitude) remained the same during the resampling process. A 512 x 512 pixel sample for a 2.5 km square was ext~acted from the scene of bay water just below the bndge. The histogram appearing in Figure 3 was computed using the 1DL software on the HP 9000 computer and displayed on a Macintosh IIci computer in a MacX-window which was copied to the MSWORD clipboard for inclusion in this document.
50DO
4000
-; 3000 x
"5..
'0 ~ 2000
10DO
Histo ram of 2.5 km Scene
o~~~~~~~~~~~~~
o 50 100 150 200 250 300 8-bit pixel VtJlue
Figure 3. Almaz SAR data amplitude distribution for the Chesapeake Bay sampled at 5 meters/pixel.
The 0.469 value of the pixel standard deviation-tomean ratio, computed for this bay sample, can be compared to 0.523 and 0.363 which would be expected for the fading noise of a completely independent distribution of image amplitudes in 1-look and 2-100k linear detection processes (Ulaby et. al., 1986). Hence, Almaz radiometric resolution is consistent with the normalized Rayleigh variance (i.e., 0.273/N) of an single azimuth look (N=l) SAR process that has spatially oversampled the SAR signal amplitude in the range coordinate by a factor less than two.
Spatial resolution for the Almaz SAR instrument can be estimated from its response to the wind roughened and fetch limited waters of the bay that serve as a stationary (uncorrelated both spatially and temporally) distribution of backscattering sources. The mean image amplitude was computed and subtracted from the 512 x 512 pixel sample of the bay. A fast Fourier transform was computed for the sample resulting in a power spectrum of the SAR image on a two-dimensional wavenumber domain. The stationary transfer function for the Almaz image was then approximated by fitting an 8th-order pol ynomial to the power spectrum by linear regression. The polynomial function,
I J P(kr,ka: 1+J ~ 4) = L L c(i,j) x (kr)2i x (ka)2j, (1)
i,j=O
515
falls to half its maximum at wavenumbers of about ka = 0.46 and kr = 0.28 radian per meter indicating azimuth and range resolutions of about 14 and 22 meters per line pair.
The equivalent resolution for the Seasat ~oot-n:ea:,square image amplitude is 48 meters per lme paIr, m both the range (r) and azimuth (a) coordinates, with a standard deviation-to-mean ratio of 0.217 consistent with square-law detection of 4 looks followed by interpolation smoothing to a 12.5 meter grid. Figure 4 depicts two-dimensional surfa~es representing the the Seasat and Almaz polynomIal approximations of the stationary SAR image transfer functions with 15 coefficients, c(i,j).
Fourier Spec1rur.n. of the Seasat Image .Amplitude
0.2
s ~ 0.1 "-'" 5-t oJ.)
~ ~ 0
~ ~ .S -0.1
~
-0.2 -0.1 o range wavenumber (radianlmeter)
Fourier Spec1rur.n. of the ~ Image .Amplitude
0.4
S ~ )::::j'
oJ.)
~ ~ 0
~ .g .S
-0.2
~
-0.4
-0.4 -0.2 o range wavenumber(radian/meter)
Figure 4. The Seasat image transfer function depicts a symmetric coordinate equal to about 0.13 radian/meter at the one-half power contour. The Fourier power spectrum of the Almaz image confirms that the range coordinate resolution is half the SAR azimuth resolution.
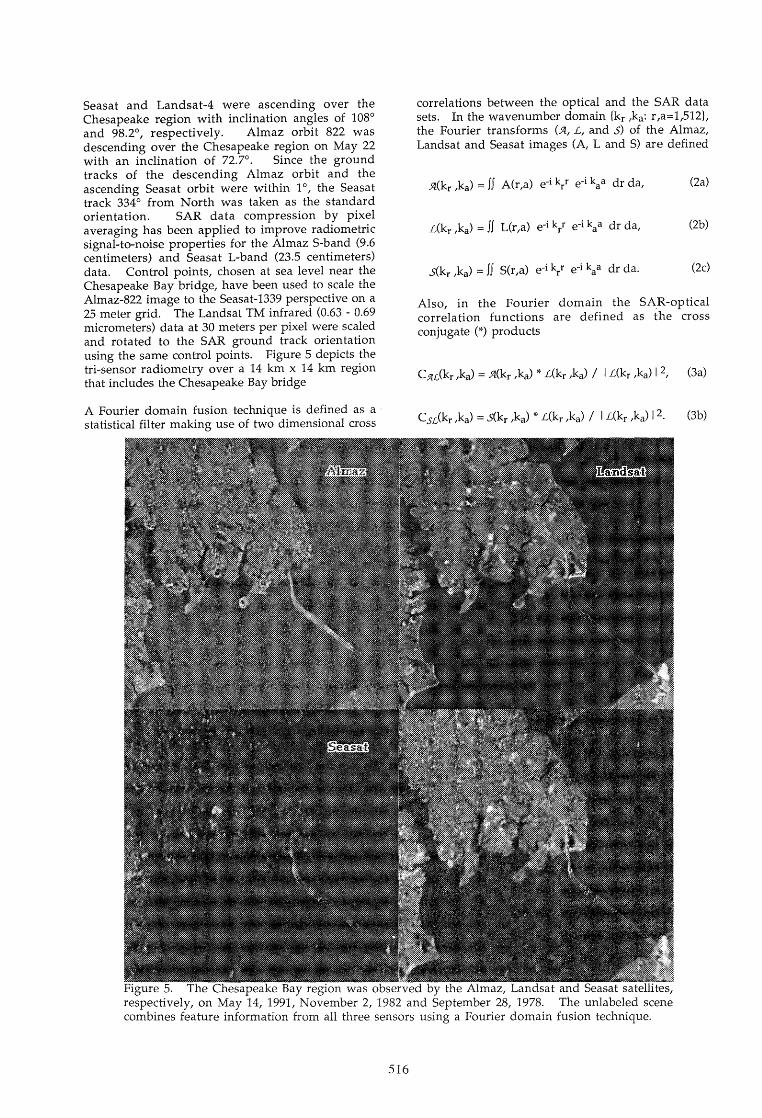
Seas at and Landsat-4 were ascending over the Chesapeake region with inclination angles of 108° and 98.2°, respectively. Almaz orbit 822 was descending over the Chesapeake region on May 22 with an inclination of 72.7°. Since the ground tracks of the descending Almaz orbit and the ascending Seas at orbit were within 1°, the Seasat track 334° from North was taken as the standard orientation. SAR data compression by pixel averaging has been applied to improve radiometric signal-to-noise properties for the Almaz S-band (9.6 centimeters) and Seasat L-band (23.5 centimeters) data. Control points, chosen at sea level near the Chesapeake Bay bridge, have been used to scale the Almaz-822 image to the Seasat-1339 perspective on a 25 meter grid. The Landsat TM infrared (0.63 - 0.69 micrometers) data at 30 meters per pixel were scaled and rotated to the SAR ground track orientation using the same control points. Figure 5 depicts the tri-sensor radiometry over a 14 km x 14 km region that includes the Chesapeake Bay bridge
A Fourier domain fusion technique is defined as a statistical filter making use of two dimensional cross
correlations between the optical and the SAR data sets. In the wavenumber domain {kr ,ka: r ,a=l,512}, the Fourier transforms (51, L, and S) of the Almaz, Landsat and Seasat images (A, Land S) are defined
Also, in the Fourier domain the SAR-optical correlation functions are defined as the cross conjugate (*) products
(3b)
Figure 5. sapea Bay was Almaz, Landsat and Seasat satellites, respectively, on May 14, 1991, November 2, 1982 and September 28, 1978. The unlabeled scene combines feature information from all three sensors using a Fourier domain fusion technique.
516
The mean values of these Landsat normalized correlation functions were computed and used to define a threshold equal to four times their product. The wavenumber domain was then segmented to equal the Fourier transform of the Landsat image where C5lL(kr ,ka) * CSL(kr,ka) was greater than the threshold, the Fourier transform of the Seasat image where CSL(kr ,ka) was greater than its mean, and the Fourier transform of the Almaz image where neither of the previous hierarchical segmentations applied. Fusion of the multi-sensor imagery was accomplished by inverse Fourier transformation
LSA(r,a)=Jf LS51(kr ,ka) ei kl ei kaa dkr dka . (4)
of the segmented wavenumber domain, LS51(k r ,ka).
The unnormalized Almaz-Landsat correlation function, C5IL(k r ,ka) I L(kr ,ka) I 2, is useful for estimating the horizontal separation of the twin spans of the Chesapeake Bay bridge. This distance can also be estimated directly from the Landsat image and is found to be approximately 133 meters. A two dimensional Almaz-Landsat coherence function, Cu(kr ,ka) I L(kr ,ka) I / I 5l(kr ,ka) I, has been used to estimate 49 meters as the mean height of the bridge, based upon interpreting a mean range coordinate shift in image phase (Tilley et. al., 1992) as the SAR layover effect.
4. SAR RESPONSE TO OCEAN WAVE DYNAMICS
The European Space Agency's SAR system aboard the ERS-1 satellite has imaged ocean waves over the Grand Banks of Newfoundland (Beal and Tilley, 1992) as part of a SAR calibration and validation experiment. On November 23, 1991 at 1520 GMT, the Almaz SAR obtained wave imagery over the Grand Banks (N46.5°,W51.00). The Almaz data included a low signal swath located outside the main lobe of the physical antenna pattern which has been processed to yield an estimate of the Almaz SAR stationary transfer function for orbit 3786. No such low signal SAR data were available for ERS-1 orbit 1856 passing over the site earlier on November 23, 1991 at 1440 GMT.
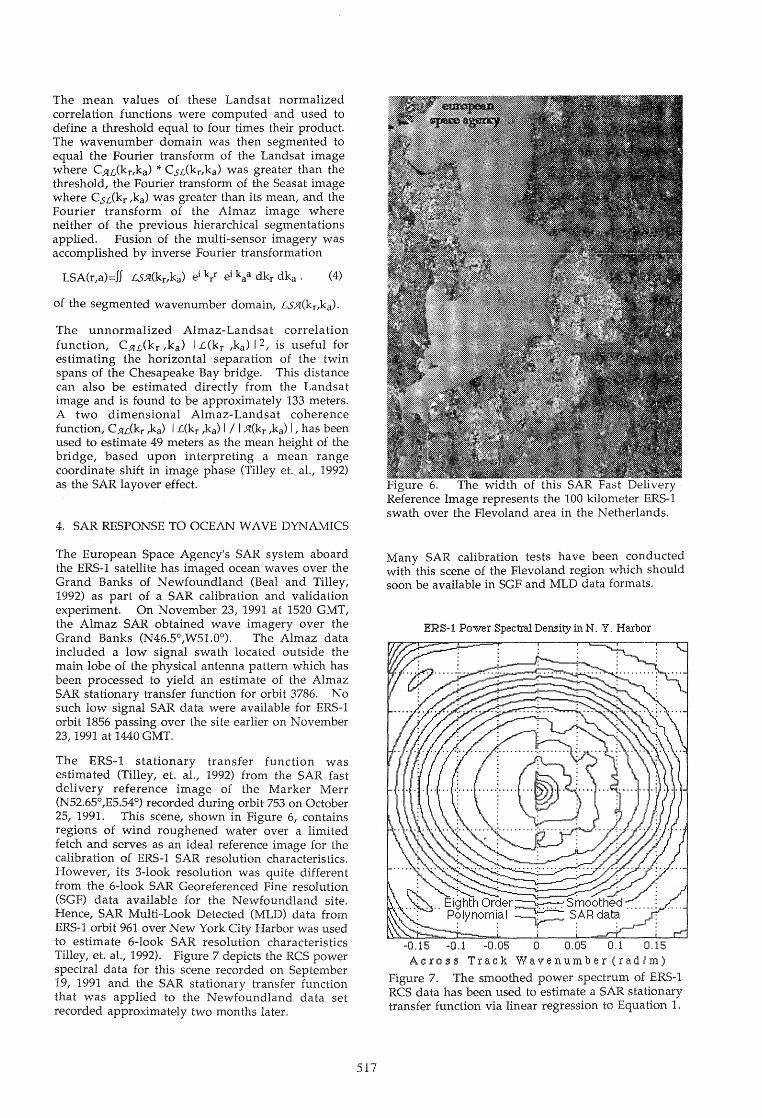
The ERS-1 stationary transfer function was estimated (Tilley, et. al., 1992) from the SAR fast delivery reference image of the Marker Merr (N52.65°,E5.54°) recorded during orbit 753 on October 25, 1991. This scene, shown in Figure 6, contains regions of wind roughened water over a limited fetch and serves as an ideal reference image for the calibration of ERS-1 SAR resolution characteristics. However, its 3-1ook resolution was quite different from the 6-1ook SAR Georeferenced Fine resolution (SGF) data available for the Newfoundland site. Hence, SAR Multi-Look Detected (MLD) data from ERS-1 orbit 961 over New York City Harbor was used to estimate 6-1ook SAR resolution characteristics Tilley, et. al., 1992). Figure 7 depicts the RCS power spectral data for this scene recorded on September 19, 1991 and the SAR stationary transfer function that was applied to the Newfoundland data set recorded approximately two months later.
517
Figure 6. The width of this SAR Fast very Reference Image represents the 100 kilometer ERS-1 swath over the Flevoland area in the Netherlands.
Many SAR calibration tests have been conducted with this scene of the Flevoland region which should soon be available in SGF and MLD data formats.
ER S-l PO"W'er Spectral Density in N. Y. Harbor
-0.15 -0.1 -0.05 o 0.05 0.1 0.15 Across Track Wavenumber (rad/m)
Figure 7. The smoothed power spectrum of ERS-1 RCS data has been used to estimate a SAR stationary transfer function via linear regression to 1.
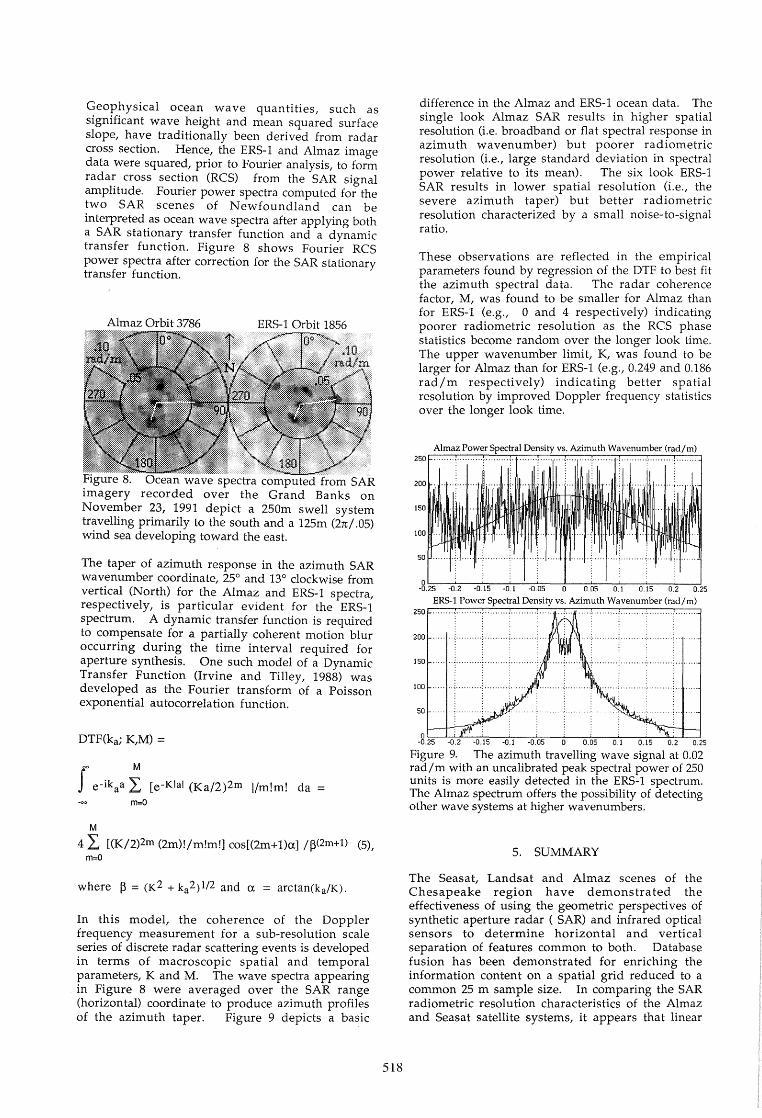
Geophysical ocean wave quantities, such as significant wave height and mean squared surface slope, have traditionally been derived from radar cross section. Hence, the ERS-1 and Almaz image data were squared, prior to Fourier analysis, to form radar cross section (RCS) from the SAR signal amplitude. Fourier power spectra computed for the two SAR scenes of Newfoundland can be interpreted as ocean wave spectra after applying both a SAR stationary transfer function and a dynamic transfer function. Figure 8 shows Fourier ReS power spectra after correction for the SAR stationary transfer function.
Almaz Orbit 3786 ERS-1 Orbit 1856
Figure 8. imagery recorded over the Grand Banks on November 23, 1991 depict a 250m swell system travelling primarily to the south and a 125m (2rr/ .05) wind sea developing toward the east.
The taper of azimuth response in the azimuth SAR wavenumber coordinate, 25° and 13° clockwise from vertical (North) for the Almaz and ERS-1 spectra, respectively, is particular evident for the ERS-1 spectrum. A dynamic transfer function is required to compensate for a partially coherent motion blur occurring during the time interval required for aperture synthesis. One such model of a Dynamic Transfer Function (Irvine and Tilley, 1988) was developed as the Fourier transform of a Poisson exponential autocorrelation function.
DTF(ka; K,M) =
r e-ikaa i [e-K1al (Ka/2)2m l/m!m! da m=O
M
4 L [(K/2)2m (2m)!/m!m!] cos[(2m+1)a] /~(2m+l) (5), m=O
where ~ = (K2 + ka2)l/2 and a = arctan(ka/K).
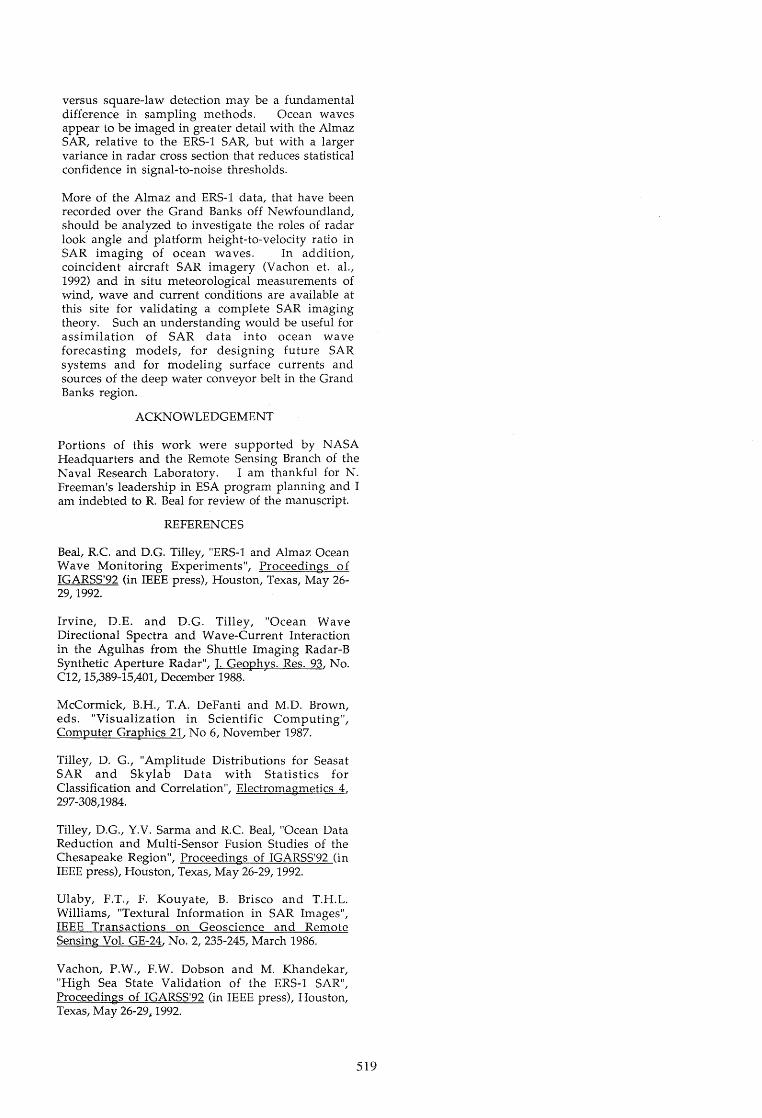
In this model, the coherence of the Doppler frequency measurement for a sub-resolution scale series of discrete radar scattering events is developed in terms of macroscopic spatial and temporal parameters, K and M. The wave spectra appearing in Figure 8 were averaged over the SAR range (horizontal) coordinate to produce azimuth profiles of the azimuth taper. Figure 9 depicts a basic
518
difference in the Almaz and ERS-1 ocean data. The single look Almaz SAR results in higher spatial resolution (i.e. broadband or flat spectral response in azimuth wavenumber) but poorer radiometric resolution (Le., large standard deviation in spectral power relative to its mean). The six look ERS-1 SAR results in lower spatial resolution (i.e., the severe azimuth taper) but better radiometric resolution characterized by a small noise-to-signal ratio.
These observations are reflected in the empirical parameters found by regression of the DTF to best fit the azimuth spectral data. The radar coherence factor, M, was found to be smaller for Almaz than for ERS-1 (e.g., 0 and 4 respectively) indicating poorer radiometric resolution as the RCS phase statistics become random over the longer look time. The upper wavenumber limit, K, was found to be larger for Almaz than for ERS-1 (e.g., 0.249 and 0.186 rad/m respectively) indicating better spatial resolution by improved Doppler frequency statistics over the longer look time.
Almaz Power Spectral Density vs. Azimuth Wavenumber (rad/m) 250
200
150
100
50
0~~~~~~~~~--7-~~--~~~--~~~ -0.25 -0.2 -0.15 -0.1 -0.05 0 0.05 0.1 0.15 0.2 0.25
ERS-l Power Spectral Density vs. Azimuth Wavenumber (rad/m) 250
200
150
100
50
O~~~~~~~~~--~~~~~~~~u-~ -0.25 -0.2 0.25
Figure 9. The azimuth travelling wave signal at 0.02 rad/m with an uncalibrated peak spectral power of 250 units is more easily detected in the ERS-1 spectrum. The Almaz spectrum offers the possibility of detecting other wave systems at higher wavenumbers.
5. SUMMARY
The Seasat, Landsat and Almaz scenes of the Chesapeake region have demonstrated the effectiveness of using the geometric perspectives of synthetic aperture radar ( SAR) and infrared optical sensors to determine horizon tal and vertical separation of features common to both. Database fusion has been demonstrated for enriching the information content on a spatial grid reduced to a common 25 m sample size. In comparing the SAR radiometric resolution characteristics of the Almaz and Seasat satellite systems, it appears that linear
versus square-law detection may be a fundamental difference in sampling methods. Ocean waves appear to be imaged in greater detail with the Almaz SAR, relative to the ERS-1 SAR, but with a larger variance in radar cross section that reduces statistical confidence in signal-to-noise thresholds.
More of the Almaz and ERS-1 data, that have been recorded over the Grand Banks off Newfoundland, should be analyzed to investigate the roles of radar look angle and platform height-to-velocity ratio in SAR imaging of ocean waves. In addition, coincident aircraft SAR imagery (Vachon et. al., 1992) and in situ meteorological measurements of wind, wave and current conditions are available at this site for validating a complete SAR imaging theory. Such an understanding would be useful for assimilation of SAR data into ocean wave forecasting models, for designing future SAR systems and for modeling surface currents and sources of the deep water conveyor belt in the Grand Banks region.
ACKNOWLEDGEMENT
Portions of this work were supported by NASA Headquarters and the Remote Sensing Branch of the Naval Research Laboratory. I am thankful for N. Freeman's leadership in ESA program planning and I am indebted to R Beal for review of the manuscript.
REFERENCES
Beal, RC. and D.G. Tilley, "ERS-1 and Almaz Ocean Wave Monitoring Experiments", Proceedings of IGARSS'92 (in IEEE press), Houston, Texas, May 26-29, 1992.
Irvine, D.E. and D.G. Tilley, "Ocean Wave Directional Spectra and Wave-Current Interaction in the Agulhas from the Shuttle Imaging Radar-B Synthetic Aperture Radar", 1. Geophys. Res. 93, No. C12, 15,389-15,401, December 1988.
McCormick, B.H., T.A. DeFanti and M.D. Brown, eds. "Visualization in Scientific Computing", Computer Graphics 21, No 6, November 1987.
Tilley, D. G., "Amplitude Distributions for Seasat SAR and Skylab Data with Statistics for Classification and Correlation", Electromagmetics 4, 297-308,1984.
Tilley, D.G., Y.V. Sarma and RC. Beal, "Ocean Data Reduction and Multi-Sensor Fusion Studies of the Chesapeake Region", Proceedings of IGARSS'92 (in IEEE press), Houston, Texas, May 26-29, 1992.
Ulaby, F.T., F. Kouyate, B. Brisco and T.H.L. Williams, "Textural Information in SAR Images", IEEE Transactions on Geoscience and Remote Sensing Vol. GE-24, No.2, 235-245, March 1986.
Vachon, P.W., F.W. Dobson and M. Khandekar, "High Sea State Validation of the ERS-1 SAR", Proceedings of IGARSS'92 (in IEEE press), Houston, Texas, May 26-29~ 1992.
519


![SEASAT Data and Processing Technical Note · 2020. 7. 29. · SEASAT SAR Imagery”, JPL, April 1st 1981 [RD-05] RS EO ESRIN 2010-55 Seasat 1 SAR Spec (EARTHNET) [RD-06] JERS-1/SEASAT](https://img.pdfslide.us/doc/110x75/6145885807bb162e665fbf8d/seasat-data-and-processing-technical-note-2020-7-29-seasat-sar-imagerya.jpg)