Embed Size (px)
Citation preview

Kyonga Vada YoonEric D. Stein
Southern California Coastal Water
METAL DRY DEPOSITION RATES ALONG A COASTAL TRANSECT IN SOUTHERN CALIFORNIA
Research Project
Santa Barbara
Malibu
Los Angeles Harbor Upper Newport Bay
Oceanside
San Diego Bay
Santa Monica Bay Oxnard
Lisa SabinKenneth Schiff
Technical Report 509March 2007

METAL DRY DEPOSITION RATES ALONG A COASTAL TRANSECT IN
SOUTHERN CALIFORNIA
Lisa D. Sabin and Kenneth C. Schiff
Southern California Coastal Water Research Project 3535 Harbor Blvd., Suite 110, Costa Mesa, CA 92626
www.sccwrp.org
March 20, 2007
Technical Report 509
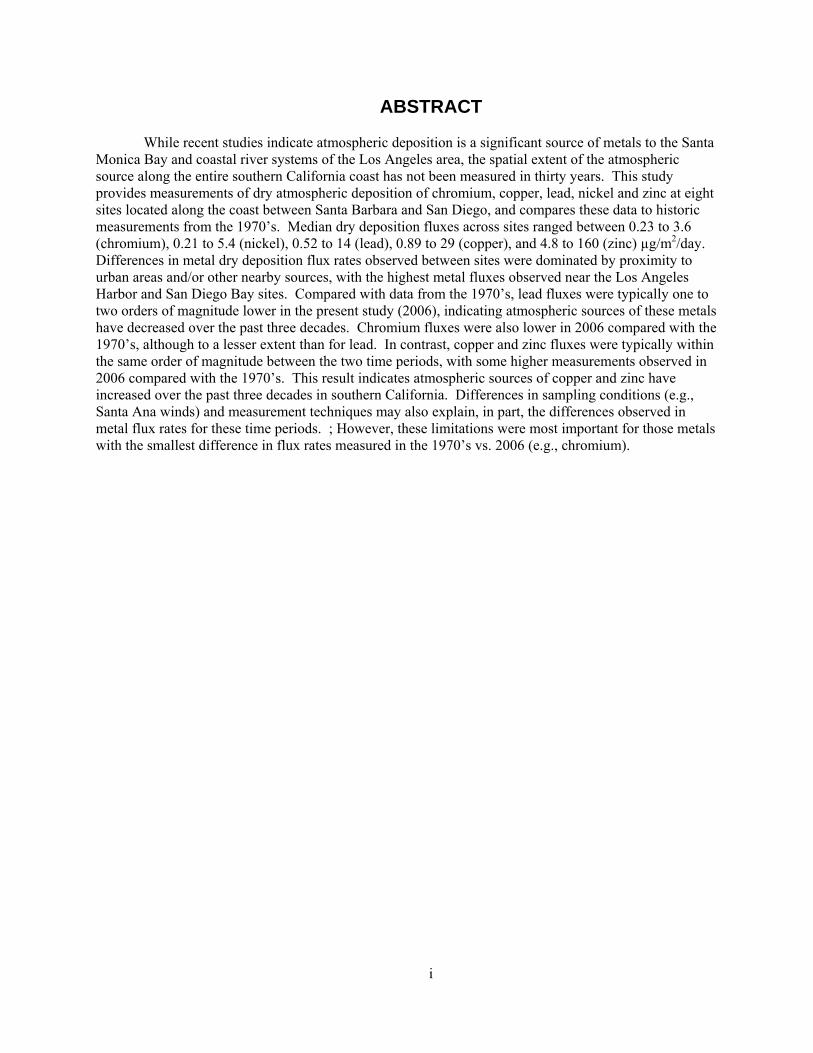
ABSTRACT While recent studies indicate atmospheric deposition is a significant source of metals to the Santa
Monica Bay and coastal river systems of the Los Angeles area, the spatial extent of the atmospheric source along the entire southern California coast has not been measured in thirty years. This study provides measurements of dry atmospheric deposition of chromium, copper, lead, nickel and zinc at eight sites located along the coast between Santa Barbara and San Diego, and compares these data to historic measurements from the 1970’s. Median dry deposition fluxes across sites ranged between 0.23 to 3.6 (chromium), 0.21 to 5.4 (nickel), 0.52 to 14 (lead), 0.89 to 29 (copper), and 4.8 to 160 (zinc) µg/m2/day. Differences in metal dry deposition flux rates observed between sites were dominated by proximity to urban areas and/or other nearby sources, with the highest metal fluxes observed near the Los Angeles Harbor and San Diego Bay sites. Compared with data from the 1970’s, lead fluxes were typically one to two orders of magnitude lower in the present study (2006), indicating atmospheric sources of these metals have decreased over the past three decades. Chromium fluxes were also lower in 2006 compared with the 1970’s, although to a lesser extent than for lead. In contrast, copper and zinc fluxes were typically within the same order of magnitude between the two time periods, with some higher measurements observed in 2006 compared with the 1970’s. This result indicates atmospheric sources of copper and zinc have increased over the past three decades in southern California. Differences in sampling conditions (e.g., Santa Ana winds) and measurement techniques may also explain, in part, the differences observed in metal flux rates for these time periods. ; However, these limitations were most important for those metals with the smallest difference in flux rates measured in the 1970’s vs. 2006 (e.g., chromium).
i

ACKNOWLEDGEMENTS We acknowledge the laboratory analysis provided by CRG Laboratories, Inc. We would like to
thank Chuck Katz, Mark Edson and Hadrianna delos Santos of the United States Navy, Hawkeye Sheene from the City of Oceanside, William Bretz from the UCI Marsh Reserve, Mas Dojiri from the City of Los Angeles, Christine Savitsky of the Adamson House, Jack Peveler of the Channel Islands Harbor, and Arturo Keller and Jeff Kirby from UC Santa Barbara for their cooperation. Also, we would like to express our appreciation of SCCWRP personnel Rachel McPherson and Sandy Nguyen for their assistance collecting the field data.
ii

TABLE OF CONTENTS
Abstract .......................................................................................................................................................... i Acknowledgements.......................................................................................................................................ii Table of Contents.........................................................................................................................................iii List of Tables ............................................................................................................................................... iv List of Figures .............................................................................................................................................. iv Introduction................................................................................................................................................... 1 Methods ........................................................................................................................................................ 2
General Approach................................................................................................................................... 2 Sampling sites .................................................................................................................................. 2
Instrumentation....................................................................................................................................... 2 Sample Preparation and Chemical Analysis........................................................................................... 2 Data Analysis ......................................................................................................................................... 3
Results …………………………………………………………………………………………….……….5 Meteorological Conditions ..................................................................................................................... 5 Dry Deposition Flux Rates ..................................................................................................................... 5
Comparisons with historical data..................................................................................................... 5 Discussion ..................................................................................................................................................... 7 Literature Cited ........................................................................................................................................... 14
iii
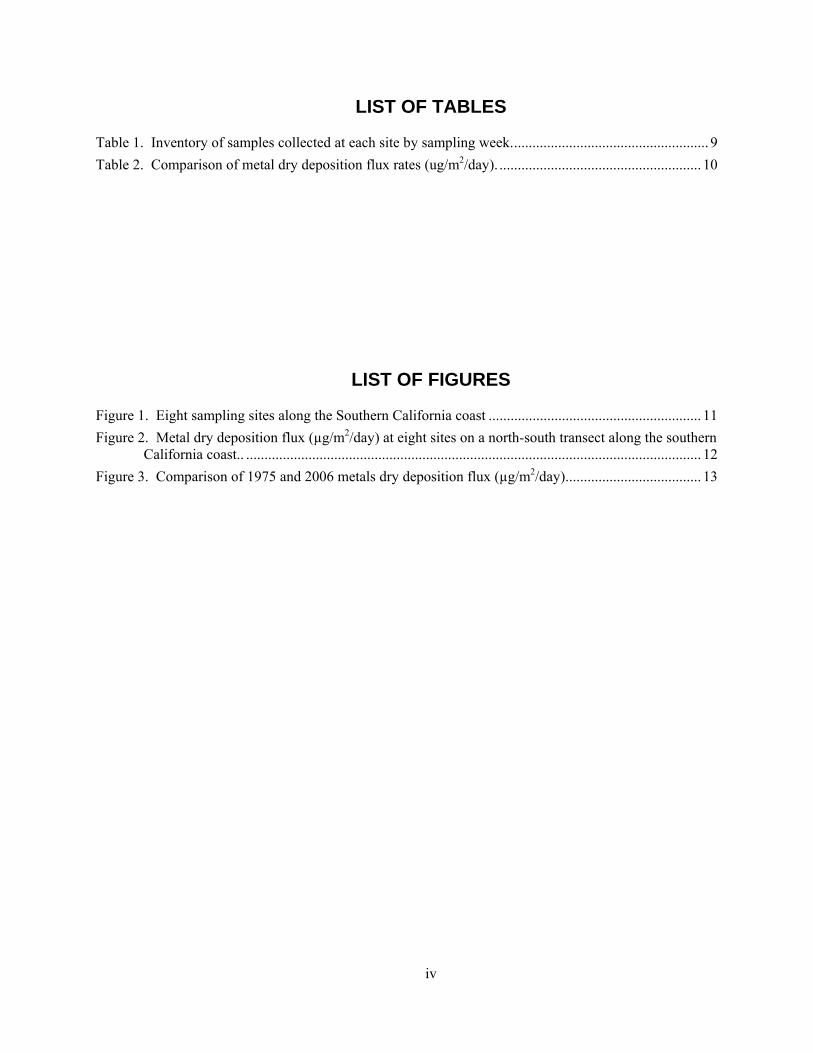
LIST OF TABLES
Table 1. Inventory of samples collected at each site by sampling week...................................................... 9 Table 2. Comparison of metal dry deposition flux rates (ug/m2/day). ....................................................... 10
LIST OF FIGURES
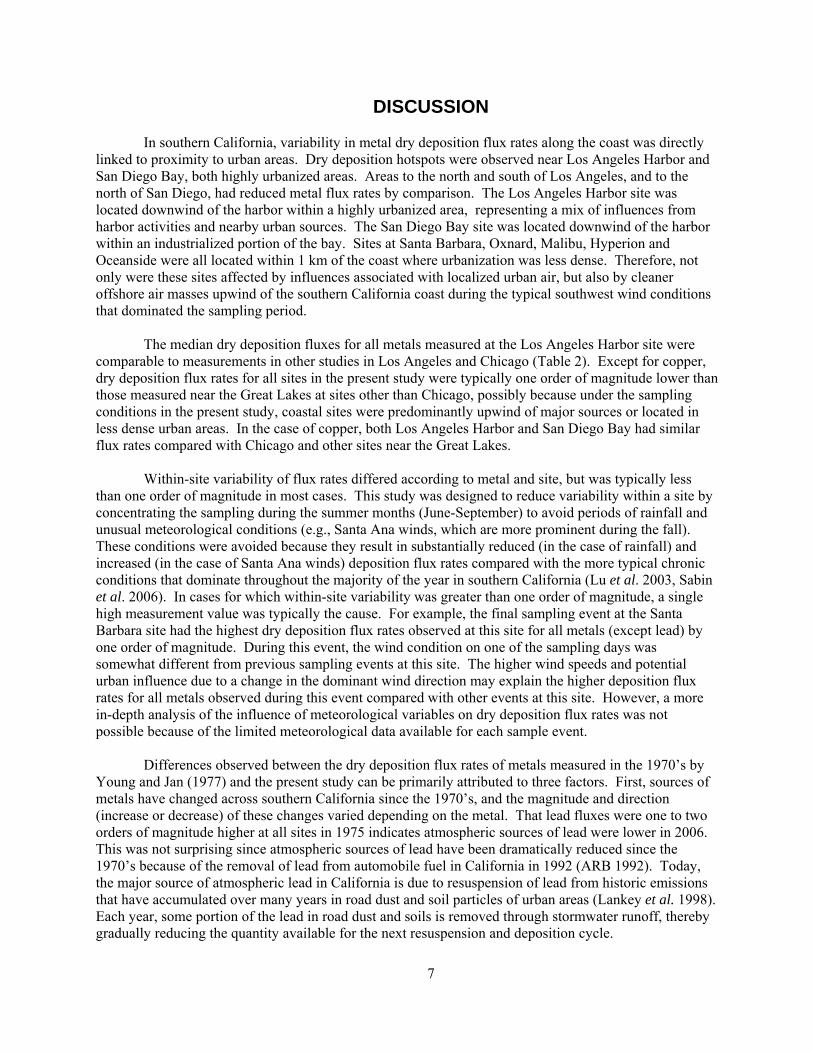
Figure 1. Eight sampling sites along the Southern California coast .......................................................... 11 Figure 2. Metal dry deposition flux (µg/m2/day) at eight sites on a north-south transect along the southern
California coast.. ............................................................................................................................ 12 Figure 3. Comparison of 1975 and 2006 metals dry deposition flux (µg/m2/day)..................................... 13
iv

INTRODUCTION Atmospheric deposition represents a significant fraction of the total pollutant load to many
contaminated waterbodies, relative to other sources (Duce et al. 1991, Lin et al. 1993, Scudlark et al. 1994, Wu et al. 1994, Baker et al. 1997, Scudlark and Church 1997). In southern California, the atmosphere has been shown to be a significant contributor to metal pollution in the Santa Monica Bay and coastal river systems of Los Angeles, primarily through deposition onto the land surface during dry periods, and subsequent removal by stormwater runoff during rain events (Lu et al. 2003; Sabin et al. 2005, 2006a).
Dry deposition flux rates of metals vary primarily as a function of both sources (e.g., proximity to
urban areas, or other nearby sources) and meteorological conditions (e.g., wind speeds). In Los Angeles, the highest metal deposition rates have been observed within 100 m of a large freeway, a major source of particle-bound pollutant metals, while urban background deposition rates have been observed within approximately 450 m of the freeway (Sabin et al. 2006b). In addition, substantially lower flux rates (compared with urban background rates in Los Angeles) have been observed at a non-urban coastal site upwind of Los Angeles (Sabin et al. 2006a).
No measurements of the dry deposition gradient of metals along the entire Southern California
coast have been made in thirty years. During the mid-1970’s, atmospheric deposition studies, conducted at a number of sites along the coast between Santa Barbara and San Diego, provided data on the extent of the urban influence during that time. These historical data demonstrated coastal Los Angeles was a hotspot for dry deposition of a number of constituents (e.g., DDT, PCB, metals), compared with areas along the coast to the north and south of greater Los Angeles (Young et al. 1976, Young and Jan 1977). However, during the past thirty years, there have been changes in atmospheric pollution sources, including decreases for some pollutants (e.g., lead) and increases for others (e.g., copper and zinc). There has also been considerable population growth along the coast, including an expansion of urban areas of Los Angeles and San Diego, as well as increased urbanization of areas that were predominantly non-urban/agricultural in the 1970’s. Thus, substantial differences would be expected between dry deposition flux rates along the southern California coast measured during the 1970’s and those measured in 2006, and it is likely that the direction of the change may vary depending on the metal and the location.
The goal of this study was to gain a better understanding of the dry deposition rates of metals, the
spatial extent of the urban footprint along the coast of Southern California, and how these have changed over the past thirty years. To accomplish this goal, the following objectives were defined: (1) measure the dry deposition flux gradient of five pollutant metals (chromium, copper, lead, nickel and zinc) along a north-south coastal transect of southern California; and (2) compare these measurements with historic metal dry deposition flux rates from the 1970’s.
1

METHODS
General Approach Measurements of metal dry deposition fluxes were made weekly on a north-south transect along
the coast of southern California between Santa Barbara and San Diego over a four month period during Summer and Fall 2006 (Table 1). Each site was sampled at least ten times. All samples were collected for 48 hours during periods with no measurable precipitation.
Sampling sites
There were a total of eight sampling sites along the Southern California coast, including sites at Santa Barbara, Oxnard, Malibu, Santa Monica Bay, Los Angeles Harbor, Upper Newport Bay, Oceanside and San Diego Bay (Figure 1). All sites were located within approximately 1 km of the coast with the exception of Upper Newport Bay (located approximately 8 km inland) and Los Angeles Harbor (located approximately 3 km inland). Sampling was conducted on a weekly to biweekly basis between June 2006 and October 2006 at all sites except Los Angeles Harbor, where sampling was conducted between August 2006 and November 2006.
Specific site selection criteria incorporated the recommendations of the National Atmospheric
Deposition Program (NADP 2001). These criteria included: locations generally representative of the region, with minimal impact of local point or area sources; areas a minimum distance of 100 m from major line sources; and all objects or structures located a distance of at least twice their height from the sampling equipment. These recommendations were followed to the extent possible in populated urban areas.
Instrumentation
Dry deposition flux measurements were made using a 33-cm diameter circular polyvinyl chloride (PVC) plate with a sharp leading edge (<10 degree angle), covered with a Mylar® sheet coated with uniform 10-μm layer of Apiezon L grease. This instrument passively collects particles on a PVC plate as they fall from the air. The deposition plate was mounted on a tripod at a height of approximately 2 m. This surrogate surface has been used successfully in a number of recent studies of atmospheric deposition in Los Angeles (Sabin et al. 2005, Lim et al. 2006).
Measurements of meteorological conditions were not collected at the sites during sampling
events; however, data from nearby weather stations were accessed through the National Climatic Data Center (NCDC http://www.ncdc.noaa.gov/oa/ncdc.html). These data provided 24-hour average wind speed, wind direction, and precipitation amounts for each sampling date. However, the 24-hour meteorological data were for the time period from midnight to midnight each day, while sampling times generally started in the morning around 11:00 AM and finished 48 hours later. Thus the meteorological data did not correspond exactly to the time of the dry deposition measurements, but provided a general description of the wind conditions at the time of sampling.
Sample Preparation and Chemical Analysis
Prior to sampling, Mylar was cut into 33-cm diameter circles and cleaned by wiping with methanol-soaked wipes, then immersed in 10% nitric acid followed by methanol for 10 minutes each. The Mylar sheets were then rinsed with distilled water and allowed to air dry. Dry Mylar sheets were coated with a thin layer of Apiezon L grease, which was liquefied by heating and then painted onto the Mylar film to obtain a thin, uniform 10-μm layer. The Mylar sheets were then mounted onto the
2

deposition plates one day prior to sampling, and the deposition plates were stored in airtight plastic containers for transport to the field.
After sampling, the Mylar sheets were removed from the deposition plates in the field, folded
(greased side inward), and placed inside a clean glass jar. In the lab, each Mylar sheet was divided into ten smaller pieces. The smaller pieces were then returned to respective original sample jars, rinsed three successive times with 15 ml of n-hexane to dissolve the Apiezon grease, then rinsed with 5% Optima Grade nitric acid. The acid and hexane rinses were subsequently combined, the hexane was evaporated in a 50°C water bath, and the remaining acidified sample was then heated to 65°C under sonication for a minimum of 24 hours.
All acid-digested samples were analyzed for 26 metals per EPA Method 200.8 using inductively
coupled plasma-mass spectroscopy (ICP-MS). Results reported here are for chromium, copper, lead, nickel and zinc, which are the primary metals associated with water quality issues in Southern California. Method detection limits were 0.05 ng for lead, 0.1 ng for chromium, nickel and zinc, and 0.4 ng for copper. These limits correspond to minimum detectable deposition fluxes of 0.004 μg/m2/day for lead, 0.009 μg/m2/day for chromium, nickel and zinc, and 0.003 μg/m2/day for copper. Laboratory blanks, analyzed with each batch of 15 samples, were consistently nondetectable. Matrix spike recoveries ranged from 93 to 107% for all five metals. Duplicate matrix spikes indicated the precision of the laboratory analysis method, with relative percent differences (RPD) of 1% or less for all five metals.
Each week of sampling, a blank deposition plate was prepared along with the sample deposition
plates and taken into the field in an airtight plastic container. These field blanks were analyzed along with the samples collected each week. Field blanks contained detectable levels of metals, and all samples were corrected for their respective field blank. To assess the precision of the deposition plates, duplicate deposition plate samples were collected during approximately 10% of sample events. These field duplicates indicated the average RPD’s between collocated deposition plates were 33% (chromium), 10% (copper), 25% (nickel), 23% (lead), and 18% (zinc).
Data Analysis
Metal dry deposition fluxes were first compared among sites along the north-south transect. Because the data were not normally distributed, the non-parametric Kruskal-Wallis One Way Analysis of Variance on Ranks (ANOVA on ranks) and the Dunn’s Method for pairwise multiple comparisons were used to test for significant differences in flux rates between sites. Differences between sites were also evaluated by comparing the medians and ranges of flux rates between sites.
Median dry deposition fluxes of metals at each site were next compared with historical data,
estimated from figures published by Young and Jan (1977) from data collected at similar sites along the coast in 1975. A different surrogate surface was used by Young and Jan (1977); however, few data exist on metal dry deposition flux rates from that period. The site locations in the Young and Jan (1977) study were located on a north-south transect along the southern California coast; most of these sites were located near the sites used in the present study, allowing a unique opportunity to compare dry deposition flux rates in southern California across a thirty year time span. Each of the sites in the Young and Jan (1977) study were matched to a site with approximately the same geographic location for the purpose of the present study using corresponding site identification numbers. For the Young and Jan (1977) data, site identification numbers were: Site 1 - Carpenteria, Site 2 - Port Hueneme, Site 3 - Zuma Beach, Site 4 - Santa Monica, Site 5 - Long Beach, Site 6 - Newport Beach, Site 7 - San Clemente Beach, and Site 8 - Encinitas. For the data from the present study, site identification numbers were: Site 1 - Santa Barbara, Site 2 - Oxnard, Site 3 - Malibu (Malibu Lagoon State Beach), Site 4 - Santa Monica Bay (Hyperion Treatment Facility), Site 5 - Los Angeles Harbor, Site 6 - Upper Newport Bay, Site 7 - Oceanside, and
3

Site 8 - San Diego Bay. In the present study, site 8 (San Diego Bay) is located substantially to the south and in an area with an expected higher impact from nearby urban areas as well as the activities in the bay than the 1975 site 8 (Encinitas). The data from Young and Jan (1977) were measured under desert wind (Santa Ana) conditions. No data for nickel fluxes were available from the Young and Jan (1977) study.
4

RESULTS
Meteorological Conditions Average wind direction was typically from the west or southwest on most sampling days. A few
days had average wind directions from the east or southeast, but these did not dominate any given sampling event. Average 24-hour wind speeds were highest near the Santa Monica Bay site (6.0 to 10 m/s), followed by the San Diego Bay site (4.8 to 8.0 m/s). Oceanside had the lowest 24-hour average wind speeds (2.0 to 5.1 m/s). All other sites had similar 24-h average wind speed ranging between 3 and 7 m/s. There were no obvious relationships observed between wind speeds and direction and deposition flux rates. In addition, from the data available, none of the sampling events were dominated by strong Santa Ana wind conditions. However, because samples were collected over a three-day period for a single sample, there were a small number of sample events for which Santa Ana winds were a factor on at least one of the sampling days.
Dry Deposition Flux Rates
Median fluxes in µg/m2/day across sites ranged between 0.23 and 3.6 (chromium), 0.21 and 5.4 (nickel), 0.52 and 14 (lead), 0.89 and 29 (copper), and 4.8 and 160 (zinc; Figure 2). For all metals, flux rates were significantly different between sites (ANOVA on ranks, p <0.001). The highest median fluxes were observed at the Los Angeles Harbor site for chromium, lead, nickel, and zinc. For copper, the highest median flux was observed at the San Diego Bay site, although the median flux at the Los Angeles Harbor was within the same order of magnitude. Typically, the median fluxes for all metals at the Los Angeles Harbor site were one to two orders of magnitude higher than the median fluxes at the other sites (with the exception of copper, as noted previously). The lowest median fluxes for all metals were observed at the Oxnard site. For copper, lead and zinc, all other sites had median fluxes that were at least one order of magnitude higher than the median flux at the Oxnard site.
Within-site dry deposition flux rates for all metals were within a factor of nine; most within-site
dry deposition flux rates were within a factor of five or less for the Malibu, Santa Monica Bay, Los Angeles Harbor, Upper Newport Bay, and Oceanside sites (Figure 2). The greater variability observed at the Santa Barbara and Oxnard sites was due to a single high flux measurement during one sampling event for chromium, copper, and zinc. In these cases, the highest flux values were an order of magnitude higher than the next highest flux value at the site. At the San Diego Bay site, variability was within a factor of nine for chromium and lead, but was higher (up to two orders of magnitude higher) for copper, nickel and zinc.
Comparisons with historical data
Chromium fluxes ranged from 1 to 16 μg/m2/day in 1975, compared with median fluxes of 0.22 to 3.6 μg/m2/day in 2006 (Figure 3). Chromium fluxes were higher at all sites in 1975 compared with 2006. Oxnard (Site 2) had the highest flux in 1975 that was two orders of magnitude greater than the median flux measured at this site in 2006. The largest single chromium flux measured in 2006 of 4.3 μg/m2/day, measured at the Los Angeles Harbor (Site 5), was an order of magnitude lower than the largest flux measured in 1975 (Figure 3).
Copper fluxes were similar between the two time periods, ranging from 1 to 38 μg/m2/day in
1975, compared with median fluxes of 0.89 to 30 μg/m2/day in 2006 (Figure 3). Copper fluxes were generally higher in 1975, although the differences between fluxes measured in 1975 and those measured in 2006 were typically within the same order of magnitude. Exceptions were Oxnard (Site 2), Santa Monica Bay (Site 4) and Oceanside (Site 7), with 2006 fluxes higher by one to two orders of magnitude
5
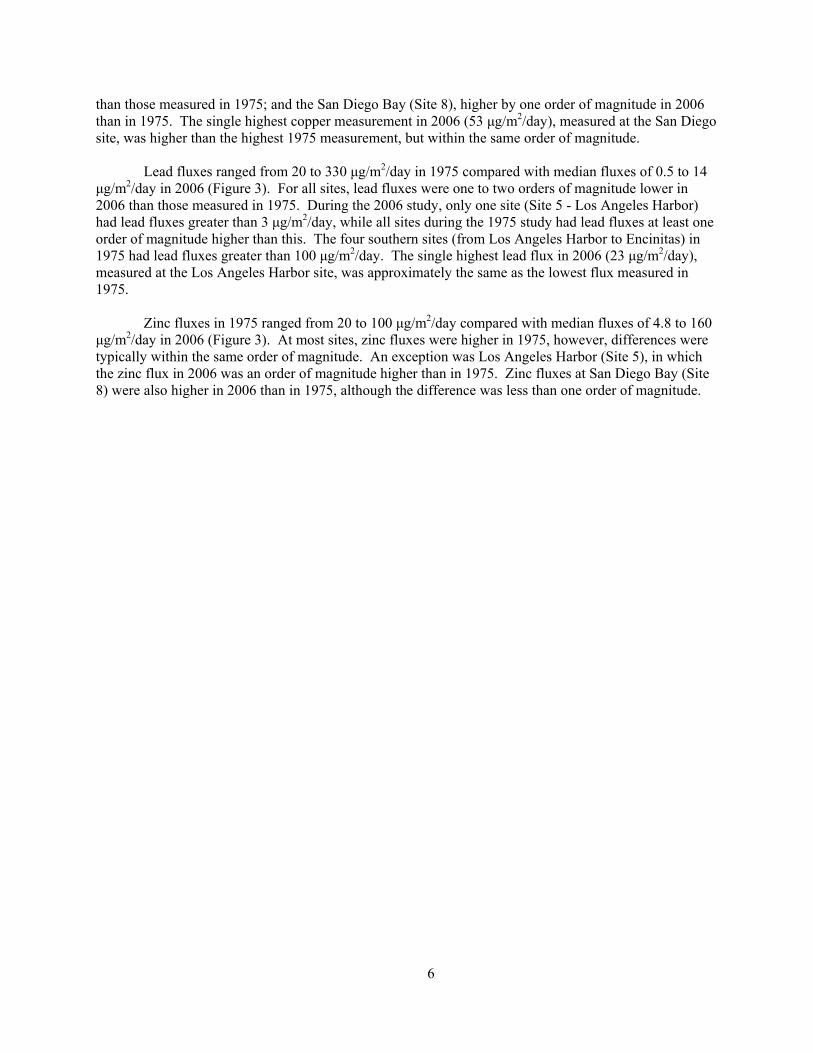
than those measured in 1975; and the San Diego Bay (Site 8), higher by one order of magnitude in 2006 than in 1975. The single highest copper measurement in 2006 (53 μg/m2/day), measured at the San Diego site, was higher than the highest 1975 measurement, but within the same order of magnitude.
Lead fluxes ranged from 20 to 330 μg/m2/day in 1975 compared with median fluxes of 0.5 to 14
μg/m2/day in 2006 (Figure 3). For all sites, lead fluxes were one to two orders of magnitude lower in 2006 than those measured in 1975. During the 2006 study, only one site (Site 5 - Los Angeles Harbor) had lead fluxes greater than 3 μg/m2/day, while all sites during the 1975 study had lead fluxes at least one order of magnitude higher than this. The four southern sites (from Los Angeles Harbor to Encinitas) in 1975 had lead fluxes greater than 100 μg/m2/day. The single highest lead flux in 2006 (23 μg/m2/day), measured at the Los Angeles Harbor site, was approximately the same as the lowest flux measured in 1975.
Zinc fluxes in 1975 ranged from 20 to 100 μg/m2/day compared with median fluxes of 4.8 to 160
μg/m2/day in 2006 (Figure 3). At most sites, zinc fluxes were higher in 1975, however, differences were typically within the same order of magnitude. An exception was Los Angeles Harbor (Site 5), in which the zinc flux in 2006 was an order of magnitude higher than in 1975. Zinc fluxes at San Diego Bay (Site 8) were also higher in 2006 than in 1975, although the difference was less than one order of magnitude.
6
DISCUSSION In southern California, variability in metal dry deposition flux rates along the coast was directly
linked to proximity to urban areas. Dry deposition hotspots were observed near Los Angeles Harbor and San Diego Bay, both highly urbanized areas. Areas to the north and south of Los Angeles, and to the north of San Diego, had reduced metal flux rates by comparison. The Los Angeles Harbor site was located downwind of the harbor within a highly urbanized area, representing a mix of influences from harbor activities and nearby urban sources. The San Diego Bay site was located downwind of the harbor within an industrialized portion of the bay. Sites at Santa Barbara, Oxnard, Malibu, Hyperion and Oceanside were all located within 1 km of the coast where urbanization was less dense. Therefore, not only were these sites affected by influences associated with localized urban air, but also by cleaner offshore air masses upwind of the southern California coast during the typical southwest wind conditions that dominated the sampling period.
The median dry deposition fluxes for all metals measured at the Los Angeles Harbor site were
comparable to measurements in other studies in Los Angeles and Chicago (Table 2). Except for copper, dry deposition flux rates for all sites in the present study were typically one order of magnitude lower than those measured near the Great Lakes at sites other than Chicago, possibly because under the sampling conditions in the present study, coastal sites were predominantly upwind of major sources or located in less dense urban areas. In the case of copper, both Los Angeles Harbor and San Diego Bay had similar flux rates compared with Chicago and other sites near the Great Lakes.
Within-site variability of flux rates differed according to metal and site, but was typically less
than one order of magnitude in most cases. This study was designed to reduce variability within a site by concentrating the sampling during the summer months (June-September) to avoid periods of rainfall and unusual meteorological conditions (e.g., Santa Ana winds, which are more prominent during the fall). These conditions were avoided because they result in substantially reduced (in the case of rainfall) and increased (in the case of Santa Ana winds) deposition flux rates compared with the more typical chronic conditions that dominate throughout the majority of the year in southern California (Lu et al. 2003, Sabin et al. 2006). In cases for which within-site variability was greater than one order of magnitude, a single high measurement value was typically the cause. For example, the final sampling event at the Santa Barbara site had the highest dry deposition flux rates observed at this site for all metals (except lead) by one order of magnitude. During this event, the wind condition on one of the sampling days was somewhat different from previous sampling events at this site. The higher wind speeds and potential urban influence due to a change in the dominant wind direction may explain the higher deposition flux rates for all metals observed during this event compared with other events at this site. However, a more in-depth analysis of the influence of meteorological variables on dry deposition flux rates was not possible because of the limited meteorological data available for each sample event.
Differences observed between the dry deposition flux rates of metals measured in the 1970’s by
Young and Jan (1977) and the present study can be primarily attributed to three factors. First, sources of metals have changed across southern California since the 1970’s, and the magnitude and direction (increase or decrease) of these changes varied depending on the metal. That lead fluxes were one to two orders of magnitude higher at all sites in 1975 indicates atmospheric sources of lead were lower in 2006. This was not surprising since atmospheric sources of lead have been dramatically reduced since the 1970’s because of the removal of lead from automobile fuel in California in 1992 (ARB 1992). Today, the major source of atmospheric lead in California is due to resuspension of lead from historic emissions that have accumulated over many years in road dust and soil particles of urban areas (Lankey et al. 1998). Each year, some portion of the lead in road dust and soils is removed through stormwater runoff, thereby gradually reducing the quantity available for the next resuspension and deposition cycle.
7

In contrast with lead, zinc fluxes were higher in 2006 at the urban-influenced Los Angeles Harbor
site than 1975 measurements, indicating atmospheric sources of zinc have increased since the 1970’s. This is likely given that automobiles are a large source of airborne zinc in urban areas (Watson et al. 2000, Councell et al. 2004) and the number of vehicle miles traveled in the Los Angeles region nearly doubled in the past two decades (Crane and Ong 2004). A similar result for copper, with higher flux rates in 2006 observed at the Los Angeles Harbor and San Diego Bay sites, may also be explained by increased urban sources; in the case of the San Diego Bay site, increased activities at the naval ship yard may be a significant source of higher flux rates. However, as previously discussed, it is important to note the San Diego Bay site was not well matched geographically to the 1975 Encinitas site, the southern-most site during the 1975 study. Thus, the higher copper fluxes for the San Diego Bay site in the 2006 study may also be due, at least in part, to the difference in site location and proximity to nearby sources.
The second major reason for the differences observed between the 1975 data and the present
study is the differences in the wind conditions during the two studies. The data in 1975 were all collected under desert wind conditions (Santa Ana winds). These conditions are known to increase dry deposition flux rates. Both model estimates and measurement data in Los Angeles have found metal dry deposition flux rates may increase during Santa Ana wind conditions by as much as factors of two to eight, depending on the metal (Lu et al. 2003, Sabin et al. 2005). This difference in wind conditions during sampling provides further evidence of the increase in zinc sources since the 1970’s, because if sources were the same, lower zinc fluxes would be expected in the current study under the non-Santa Ana wind conditions. Santa Ana wind conditions may also explain, in part, the lower chromium flux rates in the present study relative to the 1970’s because the major source of chromium has remained the same over the last three decades. The effect of Santa Ana wind conditions was less important for lead because the magnitude of the difference in flux rates between time periods was larger than the effect of wind condition alone.
The third reason for differences between the 1975 data and the present study, and an important
limitation of this comparison, is the differences in the sampling methods and analysis techniques. There have been improvements in dry deposition measurement techniques since the 1970’s (Lim et al. 2006). In particular, the deposition plates used in the present study have been compared favorable with the more traditional method of calculating deposition rates, which involved making air concentration measurements and using an assumed deposition velocity to calculate dry deposition flux rates (Lim et al. 2006). However, no method comparison has been done for the surrogate surfaces used by Young and Jan (1977) and the deposition plates used in the present study. This factor is most important for those metals (e.g., chromium) with the smallest difference between fluxes measured in the 1970’s and those of the current study.
8

Table 1. Inventory of samples collected at each site by sampling week.
Sampling Week Santa Barbara Oxnard MalibuSanta Monica
Bay
Los Angeles Harbor
Upper Newport Bay Oceanside
San Diego Bay
27-Jun-06 205-Jul-06 1 1 1 211-Jul-06 1 1 218-Jul-06 1 1 1 1 1 1 126-Jul-06 1 1 1 102-Aug-06 1 108-Aug-06 1 1 1 1 1 1 116-Aug-06 1 1 1 122-Aug-06 1 1 1 1 1 1 1 130-Aug-06 1 1 1 106-Sep-06 1 2 1 112-Sep-06 1 1 1 119-Sep-06 1 1 1 1 1 1 1 126-Sep-06 1 1 1 1 1 1 1 103-Oct-06 1 1 1 1 1 1 117-Oct-06 1 223-Oct-06 301-Nov-06 1
Number of Samples Collected at Each Site 10 10 10 11 12 11 10 12
Site
9

Table 2. Comparison of metal dry deposition flux rates (µg/m2/day).
Chromium Copper Lead ZincLim et al., 2006Urban Sites in Los Angeles and Orange County, CA USALos Angeles River -1 6 21 15 130Los Angeles River -2 2.3 30 31 160Los Angeles River -3 9 16 32 110Ballona Creek 2.7 18 20 77Dominguez Channel 3.3 12 11 74Santa Ana River 4.3 30 10 180
Yi et al., 2001Chicago, IL USA 5.7 63 38 120South Haven, MI USA 0.7 31 23 51Sleeping Bear Dunes, MI USA 1.6 79 35 68
This StudySanta Barbara 0.34 2.0 1.3 14Oxnard 0.23 0.89 0.52 4.8Malibu 0.29 1.9 1.0 12Hyperion 0.39 3.9 1.0 16Los Angeles Harbor 3.6 22 14 160Newport 0.64 5.1 1.8 22Oceanside 0.48 4.2 1.4 40San Diego Bay 0.99 29 3.3 63
10
Santa Barbara
Oxnard Malibu
Santa Monica Bay Los Angeles Harbor Upper Newport Bay
Oceanside San Diego Bay
Figure 1. Eight sampling sites along the Southern California coast.
11

CHROMIUM
1 2 3 4 5 6 7 8
0
1
2
3
4
5COPPER
1 2 3 4 5 6 7 8
0
10
20
30
40
50
60
LEAD
1 2 3 4 5 6 7 8
0
5
10
15
20
25NICKEL
1 2 3 4 5 6 7 8
0
2
4
6
8
10
12
14
16
ZINC
1 2 3 4 5 6 7 8
0
50
100
150
200
250
300
FLU
X
SITE ID
SITE ID
FLU
X
SITE ID
SITE ID SITE ID
FLU
X
FLU
X
FLU
X
Figure 2. Metal dry deposition flux (µg/m2/day) at eight sites on a north-south transect along the southern California coast. Box plots represent medians and interquartile ranges. Error bars indicate the 10th and 90th percentiles.
12

0.1
1
10
100
0.1 1 10 100
0.1
1
10
100
0.1 1 10 100
0.1
1
10
100
1000
0.1 1 10 100 10001
10
100
1000
1 10 100 1000
■Site 1 Site 2 ▲Site 3 ●Site 4
□Site 5 Site 6 Site 7 ○Site 8
1975 FLUX
2006
FLU
X
CHROMIUM COPPER
LEAD ZINC
Figure 3. Comparison of 1975 and 2006 metal dry deposition flux rates (µg/m2/day). Error bars indicate the 25th and 75th percentiles for the 2006 data.
13

LITERATURE CITED
Baker J.E., D.L. Poster, C.A. Clark, T.M. Church , J.R. Scudlark, J.M. Ondov, R.M. Dickgut and G. Cutter. 1997. Loadings of atmospheric trace elements and organic contaminants to the Chesapeake Bay, pp. 171-194 in: J.E. Baker (ed.), Atmospheric Deposition of Contaminants to the Great Lakes and Coastal Waters. SETAC Press. Pensacola, FL. California Air Resources Board (CARB). 1992. Reformulated Gasoline: Proposed Phase I Specifications, Staff Report. Fuels Section, Criteria Pollutants Branch, Stationary Source Division, Air Resources Board. http://www.arb.ca.gov/fuels/gasoline/carfg1/carfg1.htm. California Department of Transportation (CALTRANS). 2006. California motor vehicle stock travel and fuel forecast. Division of Transportation System Information, Office of Travel Forecasting and Analysis Statewide Modeling Branch, California Department of Transportation. Sacramento, CA. Councell, T.B., K.U. Duckenfield, E.R. Landa and E. Callender. 2004. Tire-wear particles as a source of zinc to the environment. Environmental Science and Technology 38:4206-4212. Crane R. and P. Ong. 2004. Traffic. Southern California Environmental Report Card 2004. UCLA Institute of the Environment. Los Angeles California. http://www.ioe.ucla.edu. Duce, R.A, P.S. Merrill, E.L. Atlas, P. Buat-Menard, B.B. Hicks, J.M. Miller, J.M. Prospero, R. Arimoto, T. Church, M. Ellis, J.N. Galloway, L. Hanson, T.D. Jickells, A.H. Knap, K.H. Reinhardt, B. Schneider, A. Soudine, J.J. Tokos, S. Tsunogai, R. Wollast and M. Zhou. 1991. The atmospheric input of trace species to the world ocean. Global Biogeochemical Cycles 5:193. Lankey, R.L., C.I. Davidson, and F.C. McMichael. 1998. Mass balance for lead in the California South Coast Air Basin: an update. Environmental Research 78:86-93. Lim, J.-H., L.D. Sabin, K.C. Schiff and K.D. Stolzenbach. 2006. Concentration, size distribution, and dry deposition rate of particle-associated metals in the Los Angeles Region. Atmospheric Environment 40:7810-7823. Lin, J.-M., G.-C. Fang, T.M. Holsen and K.E. Noll. 1993. A comparison of dry deposition modeled from size distribution data and measured with a smooth surface for total particle mass, lead and calcium in Chicago. Atmospheric Environment 27:1131-1138. Lu, R., R.P. Turco, K.D. Stolzenbach, S.K. Freidlander, C. Xiong, K. Schiff, L.L. Tiefenthaler and G. Wang. 2003. Dry deposition of airborne trace metals on the Los Angeles Basin and adjacent coastal waters. Journal of Geophysical Research 108:4074-4089. National Atmospheric Deposition Program. 2001. Instruction Manual NADP/NTN Site Selection and Installation. Champaign, IL. http://nadp.sws.uiuc.edu/lib/manuals/siteinst.pdf Sabin, L.D., J.H. Lim, K.D. Stolzenbach and K.C. Schiff. 2005. Contribution of trace metals from atmospheric deposition to stormwater runoff in a small impervious urban catchment. Water Research 39:3929-3937. Sabin, L.D., J.H. Lim, K.C. Schiff and K.D. Stolzenbach. 2006a. Atmospheric dry deposition of trace metals in the Los Angeles coastal region. Environmental Toxicology and Chemistry 25:2334-2341.
14

Sabin, L.D., J.H. Lim, M.T. Venezia, A.M. Winer, K.C. Schiff and K.D. Stolzenbach. 2006b. The dry deposition and resuspension of particle-associated trace metals near a freeway in Los Angeles. Atmospheric Environment 40:7528-7538. Scudlark, J.R., K.M. Conko and T.M. Church. 1994. Atmospheric wet deposition of trace elements to Chesapeake Bay: CBAD study year 1 results. Atmospheric Environment 28:1487. Scudlark, J.R. and T.M. Church TM. 1997. Atmospheric deposition of trace elements to the mid-Atlantic Bight. pp. 195-208 in: J.E. Baker (ed.), Atmospheric Deposition of Contaminants to the Great Lakes and Coastal Waters. SETAC Press. Pensacola, FL. Ventura County. 1998. PM10 Monitoring Network Plan. Ventura County Air Pollution Control District. Ventura, CA. Watson, J.G., J.C. Chow and G.P. Thompson. 2000. Fugitive dust emissions. pp. 117-135 in: W.T. Davis (ed.), Air Pollution Engineering Manual. Second Edition. Air and Waste Management Association, John Wiley and Sons. New York, NY. Wu, Z.Y., M. Han, Z.C. Lin and J.M. Ondov. 1994. Chesapeake Bay atmospheric deposition study, year 1: sources and dry deposition of selected elements in aerosol particles. Atmospheric Environment 28:1471. Yi, S.-M., U. Shahin, J. Sivadechathep, S.C. Sofuoglu and T.M. Holsen. 2001. Overall elemental dry deposition velocities measured around Lake Michigan. Atmospheric Environment 35:1133-1140. Young, D.R., D.J. McDermott and T.C. Heesen. 1976. Aerial fallout of DDT in southern California. Bulletin of Environmental Contamination and Toxicology 16:604-611. Young, D.R. and T. Jan T. 1977. Fire fallout of metals off California. Marine Pollution Bulletin 8:109-112.
15