Embed Size (px)
Citation preview
SAN MATEO COUNTY
Transportation Authority
iStrategic Plan 2020-2024
Board of Directors
Don Horsley, Chair Representing San Mateo County Board of Supervisors
Emily Beach, Vice Chair Representing Cities at Large
Carole Groom Representing San Mateo County Board of Supervisors
Julia Mates Representing Central Judicial Cities
Karyl Matsumoto Representing San Mateo County Transit District
Rico E. Medina Representing Northern Judicial Cities
Carlos Romero Representing Southern Judicial Cities
Executive Staff
Jim Hartnett Executive Director
Carter Mau Deputy General Manager / CEO
Michelle Bouchard Chief Operating Officer / Rail
April Chan Chief Officer, Planning, Grants/ Transportation Authority
John Funghi Chief Officer / Caltrain Planning, CalMod
Derek Hansel Chief Financial Officer
Seamus Murphy Chief Communications Officer
David Olmeda Chief Operating Officer / Bus
Dora Seamans Executive Officer, Authority Secretary
Joan Cassman General Counsel
ii
Acknowledgments
San Mateo County Transportation AuthorityProject Management TeamApril Chan, Chief Officer, Planning, Grants & Transportation AuthorityJessica Epstein, Government and Community Affairs OfficerCasey Fromson, Director, Government and Community AffairsJoe Hurley, Director, Transportation Authority ProgramSeamus Murphy, Chief Communications OfficerJoel Slavit, Manager, Programming and MonitoringJennifer Williams, Administrative Analyst IIWilliam Hurrell, CDM SmithSean Vienna, CDM SmithCharlie Knox, PlaceWorksCliff Lau, PlaceWorks
Staff/Consultant SupportTasha Bartholomew, Communications ManagerJean Brook, Assistant District SecretaryJeannie Chen, Manager, BudgetsDan Lieberman, Public Affairs SpecialistAmy Linehan, Public Affairs SpecialistJeremy Lipps, Manager, Digital CommunicationConnie Mobley-Ritter, Director of TreasuryLadi Millard-Olmeda, Director of Budgets and Financial AnalysisPeter Skinner, Manager, Grants and Fund ProgrammingChiranjivi Bhamidipati, CDM SmithPaula F .Hirsch, CDM SMithCamille Tsao, CDM Smith
Citizens Advisory CommitteeBarbara Arietta, ChairJohn Fox, Vice ChairDiana BautistaAn ChenKen ChenSteven GreenRich HedgesNaomi Hsu
Karen KuklinJeff LonderPeter OhtakiOlma O’NeillDave ReedMario RendonDaniel Ross-Jones
iiiStrategic Plan 2020-2024
Table of Contents
From the Executive Director ��������������������������������������������������������������������������������������������������������������������������������������������������������������������������������������������������������v
Section 1: Introduction and Background �������������������������������������������������������������������������������������������������������������������������������������������������������������������������������� 1
Section 2: Measure A and W Programs Overview2.1 Measure A (2009-2033) �������������������������������������������������������������������������������������������������������������������������������������������������������������������������������������������������������� 32.2 Measure W (2019-2049) ������������������������������������������������������������������������������������������������������������������������������������������������������������������������������������������������������ 6
Section 3: Plan Development Process3.1 Preface: Get Us Moving San Mateo County ������������������������������������������������������������������������������������������������������������������������������������������������������������������� 93.2 Stakeholder/Public Outreach Program ������������������������������������������������������������������������������������������������������������������������������������������������������������������������ 93.3 Plan Development Steps ��������������������������������������������������������������������������������������������������������������������������������������������������������������������������������������������������� 12
Section 4: Setting of the Plan4.1 Demographics and Travel Data ���������������������������������������������������������������������������������������������������������������������������������������������������������������������������������������� 174.2 Related Plan Linkages and Ongoing Planning Efforts �������������������������������������������������������������������������������������������������������������������������������������������� 264.3 Best Practices in Funding from Peer Agencies��������������������������������������������������������������������������������������������������������������������������������������������������������� 294.4 A Financial Look-ahead ���������������������������������������������������������������������������������������������������������������������������������������������������������������������������������������������������� 30
Section 5: Plan Recommendations5.1 Measure A and Measure W Program-wide Challenges/Opportunities and Recommendations ���������������������������������������������������������������� 355.2 Category-specific Challenges/Opportunities and Recommendations ������������������������������������������������������������������������������������������������������������� 38
Section 6: Programming and Allocation Guidelines6.1 Program Participants ����������������������������������������������������������������������������������������������������������������������������������������������������������������������������������������������������������416.2 Project Selection Approach��������������������������������������������������������������������������������������������������������������������������������������������������������������������������������������������� 426.3 Agreement-based ��������������������������������������������������������������������������������������������������������������������������������������������������������������������������������������������������������������� 446.4 Plan-based ���������������������������������������������������������������������������������������������������������������������������������������������������������������������������������������������������������������������������� 456.5 Competitive �������������������������������������������������������������������������������������������������������������������������������������������������������������������������������������������������������������������������� 46
Section 7: Funds Management7.1 Measure A and Measure W Funding ��������������������������������������������������������������������������������������������������������������������������������������������������������������������������������517.2 Matching Funds���������������������������������������������������������������������������������������������������������������������������������������������������������������������������������������������������������������������517.3 TA Consideration of Financing Backed by Sales Tax Revenues ���������������������������������������������������������������������������������������������������������������������������� 537.4 Special Circumstances for Advancing Funds ������������������������������������������������������������������������������������������������������������������������������������������������������������� 53
Section 8: Next Steps ������������������������������������������������������������������������������������������������������������������������������������������������������������������������������������������������������������������� 55
iv
List of TablesTable 2-1: Measure A Program Category Details ..................................................................................................................................................................4Table 2-2: Measure W Program Category Details ................................................................................................................................................................8Table 3-1: Measure W Core Principle Weights - All Categories ..................................................................................................................................... 13Table 3-2: Measure W Core Principles Key .......................................................................................................................................................................... 14Table 4-1: Funds Available Comparison between Measure A and Measure W Program Categories (in 2019 dollars) .............................. 31Table 5-1: Key Legislated Differences between the Measures for the Comparable Competitive Programs ............................................... 36Table 6-1: Participants and Responsibilities .......................................................................................................................................................................41Table 6-2: Eligible Measure A and Measure W Sponsors .............................................................................................................................................. 42Table 6-3: Project Selection Approach ................................................................................................................................................................................. 43Table 7-1: Minimum Matching Fund Requirements for Measure A and W Categories ......................................................................................... 52Table 8-1: Next Steps ................................................................................................................................................................................................................... 55
List of FiguresFigure 2-1: 2004 Measure A TEP Program Categories ........................................................................................................................................................3Figure 2-2: Measure W Congestion Relief Plan Program Categories ...........................................................................................................................7Figure 3-1: Public Survey Response Word Cloud ............................................................................................................................................................... 12Figure 3-2: Measure A & W Comparability Chart ............................................................................................................................................................... 12Figure 3-3: Criteria Development Process ........................................................................................................................................................................... 15Figure 4-1: San Mateo County Population Change within Age Groups, 2010-2040 ................................................................................................ 17Figure 4-2: Change in Population from 2010 to 2040 for San Mateo County by TAZ ............................................................................................. 18Figure 4-3: Change in Employment from 2010 to 2040 for San Mateo County by TAZ .......................................................................................... 19Figure 4-4: Means of Transportation for Commute to San Mateo County Workplaces ....................................................................................... 20Figure 4-5: Transit Ridership Growth by Transit Service Type 2012-2018 ................................................................................................................. 21Figure 4-6: Trips to Work by San Mateo County Residents ........................................................................................................................................... 22Figure 4-7: Trips to Work in San Mateo County Originating Outside the County ................................................................................................... 23Figure 4-8: Trips to Work through San Mateo County .................................................................................................................................................... 24Figure 4-9: Daily Vehicle Miles Traveled in San Mateo County by Road Type........................................................................................................ 25Figure 4-10: Total Available and Projected Measure A Funds and TA-Administered Measure W Funds for Programs and Projects . 32Figure 4-11: Projected Revenue versus Funding Needs ................................................................................................................................................. 33
AppendicesAppendix A: Inventory of Measure A Listed ProjectsAppendix B: Measure A Highway Pipeline ProjectsAppendix C: Measure W Core Principle Weightings by Program from SAG, TAG and Public SurveyAppendix D: Proposed Evaluation Criteria from SAG and TAGAppendix E: Evaluation Criteria for the Competitive Measure A and W ProgramsAppendix F: Summary of Federal, State, Local and/or Regional Transportation Funding SourcesAppendix G: Glossary of Acronyms Appendix H: Summary of Public Comments Received on the Draft Strategic Plan
vStrategic Plan 2020-2024
San Mateo County residents demonstrate a consistent willingness to invest in critical transportation infrastructure projects and programs that enhance mobility and improve the quality of life for all of our communities.
This support has been evident since the original approval of dedicated transportation investment when the San Mateo County Transportation Authority (TA) was formed in 1988 with the passage of Measure A, which was then reauthorized in 2004. Most recently, in 2018, San Mateo County voters passed Measure W, a half-cent sales tax estimated to generate roughly $91 million per year. Together, with the existing Measure A half-cent sales tax, we can continue to invest in our future and move people faster, more efficiently, and help address congestion throughout the County.
The purpose of the TA’s 2020-2024 Strategic Plan is to provide the policy framework and guidance for implementing both the ongoing Measure A Transportation Programs and the TA administered portion of the new Measure W Congestion Relief Plan. The TA is charting new territory by finding common ground between Measures A and W and developing one Strategic Plan that honors the spirit and mandates of both measures. Measure W is guided by Core Principles while Measure A’s foundation is its Vision and Goals. Through extensive public outreach, leveraging the knowledge and diverse experiences of Stakeholder and Technical Advisors and with significant input from members of a TA Board Ad Hoc Committee, staff, expert consultants, and the general public, the needs of both measures can be met through the programs and processes laid out in the following pages.
Congestion relief will take many forms over the next several decades from increasing person throughput on our highways by building express lanes, improving safety and local mobility with more rail-road grade separations, maintaining and expanding first last mile connections to mainline transit service by overcoming barriers to walking and bicycling and improving local shuttle service, and supporting and expanding high quality regional transit to better connect the County to the greater Bay Area region.
This Strategic Plan takes a modern approach that focuses on moving the most people possible, minimizing the traffic impacts of regional growth, and investing in all modes of travel. It serves as the roadmap for the next five years to provide a more balanced functioning transportation system that improves connections between people and places, lays the foundation to promote smart growth, supports economic development, provides an array of choices and promotes geographic and social equity.
We hope you find this Strategic Plan helpful in understanding what the TA does and how Measures A and W funding will be assessed for allocation over the next five years.
Jim Hartnett Executive Director
From the Executive Director
The remaining 50% of Measure W is administered by the San Mateo County Transit District (SamTrans).
List of TablesTable 2-1: Measure A Program Category Details ..................................................................................................................................................................4Table 2-2: Measure W Program Category Details ................................................................................................................................................................8Table 3-1: Measure W Core Principle Weights - All Categories ..................................................................................................................................... 13Table 3-2: Measure W Core Principles Key .......................................................................................................................................................................... 14Table 4-1: Funds Available Comparison between Measure A and Measure W Program Categories (in 2019 dollars) .............................. 31Table 5-1: Key Legislated Differences between the Measures for the Comparable Competitive Programs ............................................... 36Table 6-1: Participants and Responsibilities .......................................................................................................................................................................41Table 6-2: Eligible Measure A and Measure W Sponsors .............................................................................................................................................. 42Table 6-3: Project Selection Approach ................................................................................................................................................................................. 43Table 7-1: Minimum Matching Fund Requirements for Measure A and W Categories ......................................................................................... 52Table 8-1: Next Steps ................................................................................................................................................................................................................... 55
List of FiguresFigure 2-1: 2004 Measure A TEP Program Categories ........................................................................................................................................................3Figure 2-2: Measure W Congestion Relief Plan Program Categories ...........................................................................................................................7Figure 3-1: Public Survey Response Word Cloud ............................................................................................................................................................... 12Figure 3-2: Measure A & W Comparability Chart ............................................................................................................................................................... 12Figure 3-3: Criteria Development Process ........................................................................................................................................................................... 15Figure 4-1: San Mateo County Population Change within Age Groups, 2010-2040 ................................................................................................ 17Figure 4-2: Change in Population from 2010 to 2040 for San Mateo County by TAZ ............................................................................................. 18Figure 4-3: Change in Employment from 2010 to 2040 for San Mateo County by TAZ .......................................................................................... 19Figure 4-4: Means of Transportation for Commute to San Mateo County Workplaces ....................................................................................... 20Figure 4-5: Transit Ridership Growth by Transit Service Type 2012-2018 ................................................................................................................. 21Figure 4-6: Trips to Work by San Mateo County Residents ........................................................................................................................................... 22Figure 4-7: Trips to Work in San Mateo County Originating Outside the County ................................................................................................... 23Figure 4-8: Trips to Work through San Mateo County .................................................................................................................................................... 24Figure 4-9: Daily Vehicle Miles Traveled in San Mateo County by Road Type........................................................................................................ 25Figure 4-10: Total Available and Projected Measure A Funds and TA-Administered Measure W Funds for Programs and Projects . 32Figure 4-11: Projected Revenue versus Funding Needs ................................................................................................................................................. 33
AppendicesAppendix A: Inventory of Measure A Listed ProjectsAppendix B: Measure A Highway Pipeline ProjectsAppendix C: Measure W Core Principle Weightings by Program from SAG, TAG and Public SurveyAppendix D: Proposed Evaluation Criteria from SAG and TAGAppendix E: Evaluation Criteria for the Competitive Measure A and W ProgramsAppendix F: Summary of Federal, State, Local and/or Regional Transportation Funding SourcesAppendix G: Glossary of Acronyms Appendix H: Summary of Public Comments Received on the Draft Strategic Plan

vi
Page intentionally left blank
1Strategic Plan 2020-2024
The San Mateo County Transportation Authority (TA) Strategic Plan, for the years 2020-2024, represents an important milestone in the use of voter-approved funds to implement transportation projects and programs in San Mateo County. It is a five-year plan that identifies the policies, procedures, and methods for administering the expenditure of funds generated by Measure A and 50 percent of funds generated by Measure W. It is the initial strategic plan providing guidance for all of Measure W program categories except for County Public Transportation Systems, which will be administered by the San Mateo County Transit District (SamTrans).
In 1988, San Mateo County voters approved Measure A, a 20-year half-cent sales tax to fund and leverage other funding sources for transportation projects and programs in San Mateo County. The approval of Measure A created the San Mateo County Transportation Authority (TA) to manage and administer the new sales tax revenue. The TA is governed by a seven-member Board of Directors tasked with the administration of the Transportation Expenditure Plan (TEP). The Board of Directors sets the overall policy direction for the TA and is comprised of: two Board members appointed by the Board of Supervisors; four Board members appointed by the City Selection Committee to represent North County, Central County, South County, and Cities at Large; and one Board member appointed by SamTrans. A 15-member Citizens Advisory Committee, appointed by the Board, serves as a liaison between the public and the Board of Directors. The Measure A TEP lists projects and programs, as identified by the cities, local agencies, and citizens of San Mateo County, and includes funding for multiple modes to help meet the County’s transportation needs.
San Mateo County is one of 25 “self-help” counties in California that chose to tax itself in order to help address the County’s transportation needs. The TA has thus been able to accelerate the completion of major projects by bridging funding gaps and leveraging other fund sources. The 1988 Sales Tax Measure expired on December 31, 2008. In 2004, San Mateo County voters reauthorized the Measure A
half-cent sales tax and the adoption of a new TEP for an additional 25 years (2009-2033).
Building off the success of Measure A, while trying to keep up with the pace of change in the region, San Mateo County voters approved Measure W in November 2018, which was the culmination of efforts supported by an extensive outreach process to better understand and meet the County’s mobility needs. Measure W provides an additional half-cent transportation sales tax for 30 years, which supplements Measure A sales tax revenue in support of countywide transportation improvements.
The Measure A TEP requires the TA to develop and adopt a Strategic Plan and that it be updated at least once every five years. The Measure W TEP, otherwise known as the San Mateo County Congestion Relief Plan, also requires the TA to prepare a Strategic Plan with broad-based public outreach.
The purpose of the Plan is to provide policy guidance for the implementation of Measure A and Measure W transportation sales tax programs that the TA is tasked with administering. This Plan provides:
� A description and the results of the robust public communication and outreach effort that was conducted during its preparation
� The policy framework for program implementation, including:
– Evaluation criteria/prioritization for project selection
– Processes to initiate projects
– Options for how the TA can become more proactive with project development and implementation
– Initiatives to support additional project and program implementation efforts, which are further outlined in Section 8
It is essential to emphasize that this plan is a living document that will continue to evolve as the TA implements the Measure A and Measure W programs.
Section 1 Introduction and Background

2
Page intentionally left blank
3Strategic Plan 2020-2024
The 2009-2033 Measure A Program began on January 1, 2009 and continues to generate sales tax revenues in San Mateo County for transportation facilities, services, and programs. The 2019-2049 Measure W Program was approved on November 6, 2018 with the collection of revenue beginning July 1, 2019. The following section discusses the expenditure goals and guidelines for the two transportation funding programs.
2.1 Measure A (2009-2033)
GoalsThe Measure A Transportation Expenditure Plan (TEP) aims to:
� Reduce commute corridor congestion
� Make regional connections
� Enhance safety
� Meet local mobility needs
Key StrategiesThe Measure A TEP vision has also set forth several key strategies:
� Target key congested corridors for highway and transit improvements
� Continue to improve connections with regional transportation facilities
� Enhance safety in all aspects of the transportation system
� Meet local mobility needs, especially those of seniors and people with disabilities
� Meet the cities’ and County’s unique local transportation needs
� Leverage local, state, and federal funds
� Encourage transportation projects that support transit-oriented development
Program Category DetailsThe Measure A expenditure plan sets the specific
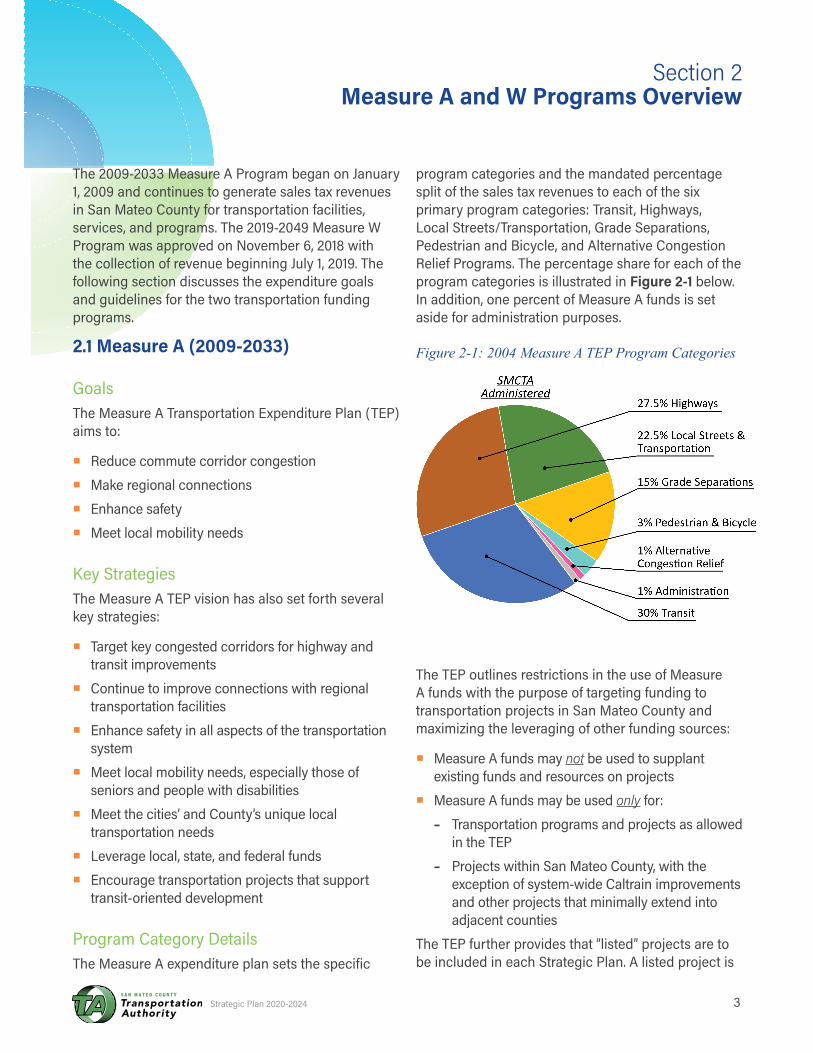
program categories and the mandated percentage split of the sales tax revenues to each of the six primary program categories: Transit, Highways, Local Streets/Transportation, Grade Separations, Pedestrian and Bicycle, and Alternative Congestion Relief Programs. The percentage share for each of the program categories is illustrated in Figure 2-1 below. In addition, one percent of Measure A funds is set aside for administration purposes.
Figure 2-1: 2004 Measure A TEP Program Categories
The TEP outlines restrictions in the use of Measure A funds with the purpose of targeting funding to transportation projects in San Mateo County and maximizing the leveraging of other funding sources:
� Measure A funds may not be used to supplant existing funds and resources on projects
� Measure A funds may be used only for:
– Transportation programs and projects as allowed in the TEP
– Projects within San Mateo County, with the exception of system-wide Caltrain improvements and other projects that minimally extend into adjacent counties
The TEP further provides that “listed” projects are to be included in each Strategic Plan. A listed project is
Section 2 Measure A and W Programs Overview
4
a capital project in which the TA has programmed Measure A funding from the Highway, Grade Separations, and Pedestrian and Bicycle program categories. The TA can deprogram funding for a project, and thus remove a listed project from the Strategic Plan if requested by the project sponsor or if a sponsor fails to meet its obligations under the terms and conditions of the funding agreement for the project. An inventory of listed projects is contained in Appendix A. Note, going forward, the listed projects in Appendix A will be updated as needed and included in each subsequent Strategic Plan during the life of Measure A. The inventory of listed projects is not intended to be a comprehensive list of projects selected for funding from all the Measure A programs, nor an inventory of all projects eligible for Measure A funds in the future.
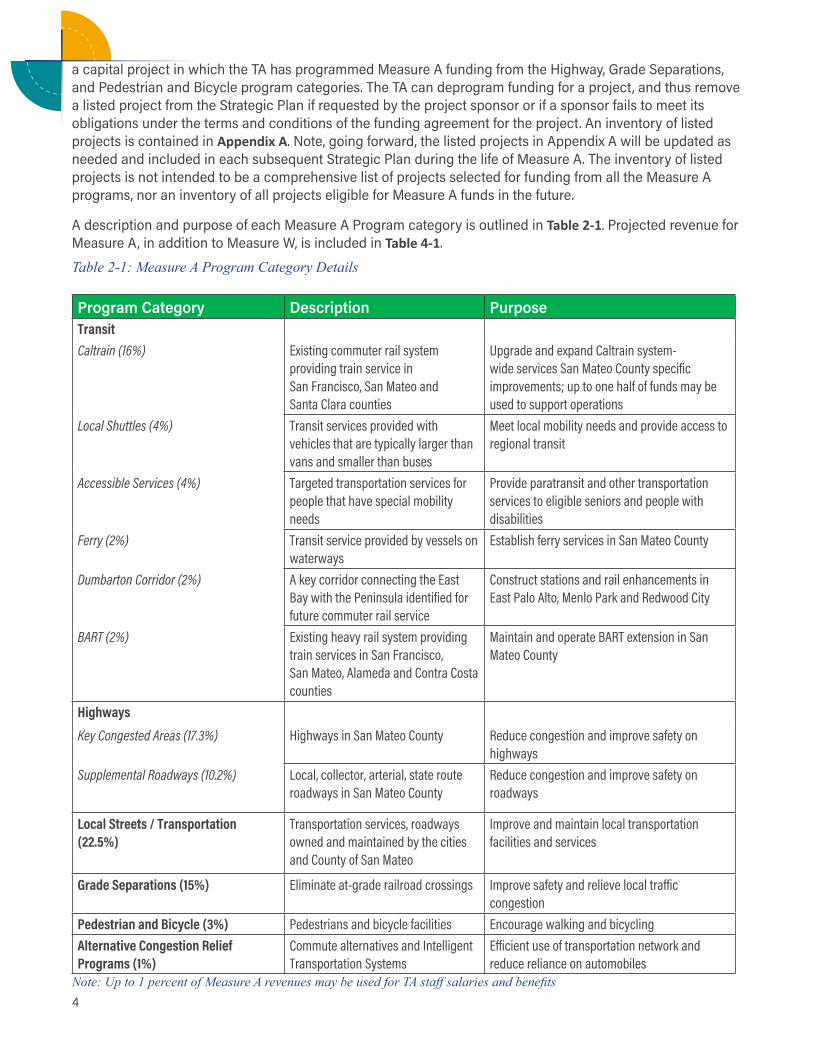
A description and purpose of each Measure A Program category is outlined in Table 2-1. Projected revenue for Measure A, in addition to Measure W, is included in Table 4-1.
Table 2-1: Measure A Program Category Details
Program Category Description PurposeTransitCaltrain (16%) Existing commuter rail system
providing train service in San Francisco, San Mateo and Santa Clara counties
Upgrade and expand Caltrain system-wide services San Mateo County specific improvements; up to one half of funds may be used to support operations
Local Shuttles (4%) Transit services provided with vehicles that are typically larger than vans and smaller than buses
Meet local mobility needs and provide access to regional transit
Accessible Services (4%) Targeted transportation services for people that have special mobility needs
Provide paratransit and other transportation services to eligible seniors and people with disabilities
Ferry (2%) Transit service provided by vessels on waterways
Establish ferry services in San Mateo County
Dumbarton Corridor (2%) A key corridor connecting the East Bay with the Peninsula identified for future commuter rail service
Construct stations and rail enhancements in East Palo Alto, Menlo Park and Redwood City
BART (2%) Existing heavy rail system providing train services in San Francisco, San Mateo, Alameda and Contra Costa counties
Maintain and operate BART extension in San Mateo County
Highways
Key Congested Areas (17.3%) Highways in San Mateo County Reduce congestion and improve safety on highways
Supplemental Roadways (10.2%) Local, collector, arterial, state route roadways in San Mateo County
Reduce congestion and improve safety on roadways
Local Streets / Transportation (22�5%)
Transportation services, roadways owned and maintained by the cities and County of San Mateo
Improve and maintain local transportation facilities and services
Grade Separations (15%) Eliminate at-grade railroad crossings Improve safety and relieve local traffic congestion
Pedestrian and Bicycle (3%) Pedestrians and bicycle facilities Encourage walking and bicyclingAlternative Congestion Relief Programs (1%)
Commute alternatives and Intelligent Transportation Systems
Efficient use of transportation network and reduce reliance on automobiles
Note: Up to 1 percent of Measure A revenues may be used for TA staff salaries and benefits
Section 2 Measure A and W Programs Overview
5Strategic Plan 2020-2024
Accomplishments over the Past Five YearsOver the past five years of the Measure A program, a number of accomplishments were achieved, as described below.
Processes and Plans � Continued the established Call for Projects (CFP) process for several of the competitive program categories,
including two rounds each of Highway, Shuttle and Pedestrian/Bicycle CFPs, and one Grade Separation CFP, programming over $199 million to projects throughout the County
� Developed an unconstrained 10-Year Highway Capital Improvement Program (CIP) (FY 2016-2025) to better understand the magnitude of the Highway Program shortfall
� Developed a Congestion and Safety Performance Assessment of the State Highway System in San Mateo County in conjunction with the City/County Association of Governments of San Mateo County (C/CAG) to identify key hot spots in the highway network
� Provided funding support and actively participated in the SamTrans Mobility Management Plan Community Services Strategy to provide policy recommendations to improve performance of the jointly administered TA-C/CAG Local Shuttle Program that provides critical first/last mile connections to regional transit and improves local mobility
Key Projects and Programs FundedMeasure A has funded a number of key projects and programs throughout the County to meet the goals of the 2004 TEP. Following are key projects funded during the past five years:
Transit � Caltrain upgrades and improvements, such as:
– Peninsula Corridor Electrification Project (PCEP) - electrification of the Caltrain Corridor and purchase of electric multiple unit (EMU) trains – currently under construction
– South San Francisco Caltrain Station Improvements Project - replacement of the existing station to meet current safety standards with improved access – currently under construction
– San Mateo Bridges Project - replacement of four 100-plus-year-old railroad bridges in the City of San Mateo – completed in 2016
� Shuttles: The TA helps fund a robust shuttle system to provide critical first- and last-mile access to regional transit and meet local mobility needs
� Ferry: A financial feasibility study and cost/benefit analysis is underway to determine the viability of a new public ferry terminal with the operation of new public ferry service in Redwood City
� Paratransit: Approximately $3.5 million is provided annually in support of the Paratransit Program, meeting the transportation needs of those with special mobility requirements
Highways � SR 1 San Pedro Creek Bridge Replacement Project (Pacifica) – completed in 2016
� US 101/Broadway Interchange Reconstruction Project - reconstruction of one of the oldest interchanges in San Mateo County – completed in 2017
� SR 92 / SR 82 (El Camino Real) Interchange Improvements - conversion from a full to partial cloverleaf interchange. Backups and queuing on SR 92 have been reduced with wider on- and off-ramps – completed in 2018
6
� US 101 / Willow Interchange Improvements - conversion from full to partial cloverleaf interchange and replacement of the existing bridge structure with a wider one. Operational deficiencies caused by short weave movements between on-and off-ramps, and backups and upstream queuing on US 101 have been reduced. Cycle tracks for bicyclists included – completed in September 2019
� San Mateo US 101 Express Lanes, I-380 to terminus of Santa Clara County Express Lanes - creation of express lanes for use by HOV3+ (high-occupancy vehicles with three or more occupants), motorcycles and transit for free and other vehicles for a toll. Existing HOV lanes will be converted into express lanes south of Whipple Avenue (under construction) and new express lanes will be added from Whipple to I-380 (final design)
Grade Separations � 25th Avenue Grade Separation - grade separation
of the existing Caltrain crossing of 25th Avenue in San Mateo that includes the relocation and reconstruction of the Hillsdale Caltrain Station and extension of 28th and 31st Avenues underneath below – currently under construction
� Broadway Grade Separation - preliminary engineering and environmental work is ongoing for a grade separation of the existing Caltrain crossing of Broadway in Burlingame
� Ravenswood Avenue, South Linden Avenue/Scott Street and the Whipple Avenue Grade Separation Projects - planning work is underway to study potential grade separations of existing Caltrain crossings in the cities of Menlo Park, South San Francisco, San Bruno, and Redwood City
Pedestrian/Bicycle � US 101 / Holly Street Pedestrian and Bicycle
Overcrossing: new pedestrian/bicycle bridge to be implemented in conjunction with US 101 / Holly Street Interchange Improvements in San Carlos – construction pending
� US 101 Pedestrian and Bicycle Overcrossing south of University Avenue - new pedestrian/bicycle bridge in East Palo Alto approximately 1/3 of a mile south of the University Avenue Interchange – completed May 2019
� John Daly Boulevard Streetscape Improvements - new six- to seven-foot-wide bicycle lanes on John Daly Boulevard, widened pedestrian refuge islands,
installation of pedestrian scale lighting on widened sidewalks, and installation of stamped asphalt crosswalks in Daly City – construction complete May 2019
Alternative Congestion Relief (ACR) � Ongoing support for Commute.org’s annual
Transportation Demand Management (TDM) work programs
2.2 Measure W (2019-2049)In 2018, when San Mateo County voters passed Measure W, they gave the County the ability to generate additional resources from a new half-cent sales tax to implement transportation improvements as identified in the San Mateo County Congestion Relief Plan.
The Congestion Relief Plan sets the program categories and percentage split of the sales tax revenues that are to be implemented primarily with guidance, as applicable, from the eleven Measure W Core Principles.
Measure W Core PrinciplesThrough a robust public outreach process, the following Core Principles were developed to help guide the allocation of Measure W funds:
� Relieve traffic congestion countywide
� Invest in a financially sustainable public transportation system that increases ridership, embraces innovation, creates more transportation choices, improves travel experience, and provides quality, affordable transit options for youth, seniors, people with disabilities, and people with lower incomes
� Implement environmentally-friendly transportation solutions and projects that incorporate green stormwater infrastructure and plan for climate change
� Promote economic vitality, economic development, and the creation of quality jobs
� Maximize opportunities to leverage investment and services from public and private partners
� Enhance safety and public health
� Invest in repair and maintenance of existing and future infrastructure
Section 2 Measure A and W Programs Overview
7Strategic Plan 2020-2024
� Facilitate the reduction of vehicle miles traveled, travel times, and greenhouse gas emissions
� Incorporate the inclusion and implementation of complete street policies and other strategies that encourage safe accommodation of all people using the roads, regardless of mode of travel
� Incentivize transit, bicycle, pedestrian, carpooling, and other shared-ride options over driving alone
� Maximize potential traffic reduction potential associated with the creation of housing in high-quality transit corridors
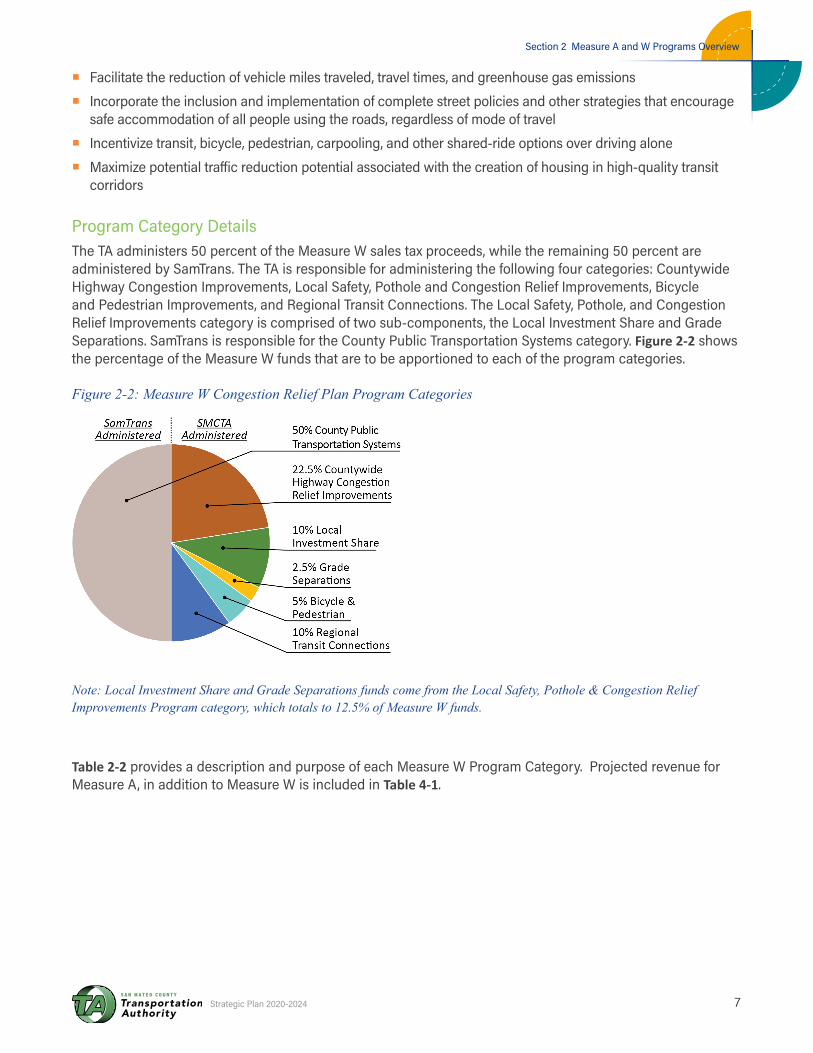
Program Category DetailsThe TA administers 50 percent of the Measure W sales tax proceeds, while the remaining 50 percent are administered by SamTrans. The TA is responsible for administering the following four categories: Countywide Highway Congestion Improvements, Local Safety, Pothole and Congestion Relief Improvements, Bicycle and Pedestrian Improvements, and Regional Transit Connections. The Local Safety, Pothole, and Congestion Relief Improvements category is comprised of two sub-components, the Local Investment Share and Grade Separations. SamTrans is responsible for the County Public Transportation Systems category. Figure 2-2 shows the percentage of the Measure W funds that are to be apportioned to each of the program categories.
Figure 2-2: Measure W Congestion Relief Plan Program Categories
Note: Local Investment Share and Grade Separations funds come from the Local Safety, Pothole & Congestion Relief Improvements Program category, which totals to 12.5% of Measure W funds.
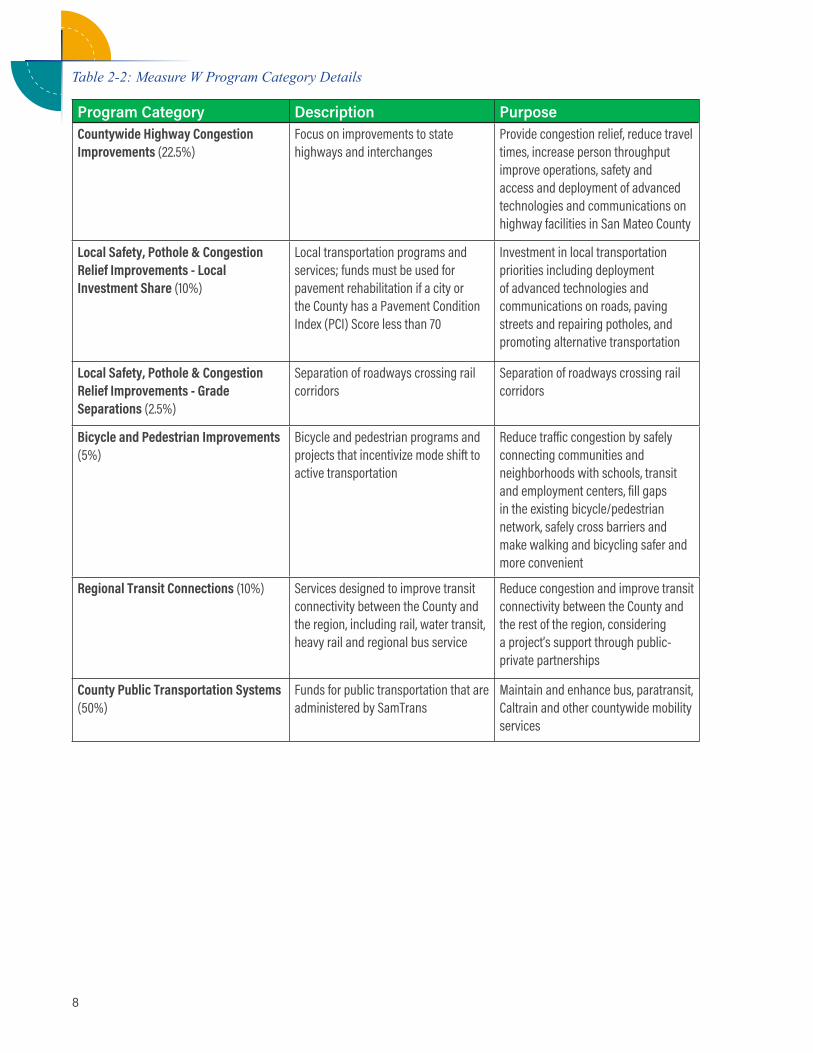
Table 2-2 provides a description and purpose of each Measure W Program Category. Projected revenue for Measure A, in addition to Measure W is included in Table 4-1.
8
Table 2-2: Measure W Program Category Details
Program Category Description PurposeCountywide Highway Congestion Improvements (22.5%)
Focus on improvements to state highways and interchanges
Provide congestion relief, reduce travel times, increase person throughput improve operations, safety and access and deployment of advanced technologies and communications on highway facilities in San Mateo County
Local Safety, Pothole & Congestion Relief Improvements - Local Investment Share (10%)
Local transportation programs and services; funds must be used for pavement rehabilitation if a city or the County has a Pavement Condition Index (PCI) Score less than 70
Investment in local transportation priorities including deployment of advanced technologies and communications on roads, paving streets and repairing potholes, and promoting alternative transportation
Local Safety, Pothole & Congestion Relief Improvements - Grade Separations (2.5%)
Separation of roadways crossing rail corridors
Separation of roadways crossing rail corridors
Bicycle and Pedestrian Improvements (5%)
Bicycle and pedestrian programs and projects that incentivize mode shift to active transportation
Reduce traffic congestion by safely connecting communities and neighborhoods with schools, transit and employment centers, fill gaps in the existing bicycle/pedestrian network, safely cross barriers and make walking and bicycling safer and more convenient
Regional Transit Connections (10%) Services designed to improve transit connectivity between the County and the region, including rail, water transit, heavy rail and regional bus service
Reduce congestion and improve transit connectivity between the County and the rest of the region, considering a project’s support through public-private partnerships
County Public Transportation Systems (50%)
Funds for public transportation that are administered by SamTrans
Maintain and enhance bus, paratransit, Caltrain and other countywide mobility services
9Strategic Plan 2020-2024
3.1 Preface: Get Us Moving San Mateo CountySamTrans, in conjunction with the San Mateo County Board of Supervisors, led the Get Us Moving San Mateo County (GUM) effort from Winter 2017 through Spring 2018. This large-scale outreach effort was a collaborative program designed to increase community awareness of current transportation conditions, programs, services, and solutions; help identify and prioritize transportation-funding needs in the County; develop an understanding of community opinions about transportation priorities; and inform future transportation revenue opportunities and expenditures.
GUM was a joint effort with local cities, partner agencies, and other stakeholders including regional leaders, transportation professionals, employers of all sizes, non-profit and transit advocacy groups. Outreach resulted in feedback from more than 16,000 San Mateo County residents and reached hundreds-of-thousands more through direct mail, television advertisements, online surveys, social media, town halls and more than 100 presentations to city councils, business and community groups, and more.
The result of the GUM outreach effort was the development of the San Mateo County Congestion Relief Plan, which became Measure W. The SamTrans Board of Directors approved Measure W for the November 2018 ballot with the consent of the San Mateo County Board of Supervisors.
The Strategic Plan development process leveraged the GUM development efforts, utilizing the same Stakeholder Advisory Group (SAG) and Technical Advisory Group (TAG) for continuity.
3.2 Stakeholder/Public Outreach Program This section delves into the outreach process and the steps taken to develop the Strategic Plan.
Broad-based stakeholder engagement was critical to the creation of this Strategic Plan. Outreach was especially important given that this is the inaugural
development of the policy framework for the implementation of the TA’s programs under Measure W, as well as the incorporation of both Measure A and Measure W into one Strategic Plan.
Outreach occurred at multiple points in the process through a variety of engagement techniques to ensure the development of a well-informed Plan that addresses the diverse interests and needs of the County. Throughout the Strategic Plan development process, stakeholders played an integral role providing input on the policy framework and implementation of the measure programs.
One significant task in the Strategic Plan development process was to determine what “as applicable” means for the Measure W Core Principles. Measure W states, “Investment categories identified in the Congestion Relief Plan are to be implemented primarily with guidance from the Core Principles set forth below, as applicable…” The Strategic Plan set out to answer the questions of whether all the Core Principles applied to each funding program category, and at what weight or level of significance. Outreach focused more on Measure W than Measure A because the TA had conducted outreach multiple times in the past on Measure A through previous Strategic Plans.
Public engagement methods included regular meetings with stakeholder and technical advisors, an online survey with over 2,500 responses, and a series of public meetings held throughout the County.
The following describes the public engagement in more detail:
� SAG meetings: the SAG was comprised of representatives that included non-profits, large employers, business groups, transit, and constituent advocacy groups
� TAG meetings: the TAG was comprised of representatives from the cities, County, transit agencies, special districts and the TA’s local partner funding partners
� San Mateo County Transportation Authority Board
Section 3 Plan Development Process
10
of Directors, Board Ad Hoc Committee and Citizen’s Advisory Committee meetings
� Updates to the County Board of Supervisors, the City and County Association of Governments of San Mateo County (C/CAG) and Commute.org Board of Directors
� Community meetings, pop-up events at local farmers markets, and presentations at organizations around the County
� Virtual Town Hall on the San Mateo County Transit District YouTube
� Online engagement through the TA website dedicated page, http://www.smcta.com/about/Strategic_Plan_2020-2024.html
� Public online survey publicized through SAG and TAG members, a text-blast to 40,000 randomized county residents, e-mail to numerous Community Based Organizations (CBOs), school and senior groups, and press releases and social media publicity. In addition, approximately 4,000 GUM survey takers received notice of the survey.
� The public comment period for the Draft Strategic Plan was open for 30 days. Approximately 4,500 GUM survey and TA Specific Plan survey respondents were notified of the availability of the Draft Strategic Plan for review and comment. A summary of comments received on the TA’s website for the Draft Strategic Plan can be found in Appendix H.
Developing the Plan with Broad Stakeholder InputStakeholder and Technical Advisory GroupsBetween March and September of 2019, there were numerous meetings with the SAG and the TAG. The following are highlights of key activities they participated in, as further described in Section 3.2:
� Comparison of the Measure A and W Program categories, which confirmed direction to provide a common selection process for several competitive program categories
� Completing a survey to determine the applicability of the Measure W Core Principles to each program category
� Recommendations on the project selection process, eligible sponsorship and minimum matching fund requirements
� Input on what the TA’s role should be with regard to project delivery and technical assistance
� Development of project evaluation criteria that relate to the Core Principles
� Final review of the weighting of the Core Principles and development of weighted evaluation criteria
Members of the SAG and TAG were generally supportive of the proposed processes for project selection and initiation. Key comments received from members emphasized the importance and need for flexibility; input on project delivery with respect to sponsor implementation and support for the TA to take a more proactive role sponsoring highway projects of countywide significance; concerns regarding limited available funding to deliver large capital projects and the ability to leverage external revenue sources; integration of modern transportation concepts in light of regional and statewide initiatives; and the establishment of metrics to better determine how projects are meeting the Measure A Goals and Vision and the Measure W Core Principles.
Presentations/Open HousesTA Staff presented material on the Strategic Plan through multiple venues. Staff held four community open house events in the summer of 2019 at the following locations: San Mateo Public Library, Pacifica Community Center, Menlo Park Senior Center, and the South San Francisco Municipal Building. After a presentation by the TA about the Strategic Plan effort, attendees were invited to participate in a dot sticker exercise ranking the top six Core Principles for each of the Measure W funding categories.
In November 2019 staff, conducted an online Virtual Town Hall hosted on the San Mateo County Transit District website where viewers saw a presentation on the Strategic Plan, could ask questions by a chat window and make formal public comments via the TA website. Finally, in both summer and fall of 2019 staff went to multiple organizations to make formal presentations including those representing individuals with disabilities, labor organizations, business groups, environmental groups and others.
The following are organizations that SMCTA staff made informal presentations to during the Strategic Plan development process:
Section 3 Plan Development Process
11Strategic Plan 2020-2024
� Menlo Park Chamber of Commerce, Business Issues & Transportation
� Pacifica Climate Committee � Redwood City - San Mateo County Chamber of
Commerce, Transportation & Housing Committee
� SAMCEDA Housing Land Use and Transportation (HLUT)
� San Mateo County Paratransit Coordinating Council � SamTrans Citizens Advisory Committee (CAC)
Pop-Up EventsThe TA set up booths at two pop-up events: the Half Moon Bay Coastside Farmers Market and the Burlingame farmers market (both in June of 2019). Each booth had large-format posters that provided background information on the Strategic Plan and Measure W, and a facilitated dot sticker exercise for ranking Core Principles under each project category. The TA also provided fact sheets on the Strategic Plan, Measure A and Measure W at all community meetings.
Ad Hoc Committee, Citizen Advisory Committee, and Board MeetingsTA staff regularly presented the results of stakeholder and public outreach efforts to the Ad Hoc Committee, the SamTrans CAC, and the TA Board to keep them abreast of the planning effort and to get their buy-in on key components of the Plan development process.
Online Public SurveyTo reach a large-scale audience, the TA opened an online survey from June to August of 2019, which received more than 2,500 responses. The survey provided an introduction on the Strategic Plan effort and Measure W, and asked respondents to choose up to six of the most applicable Core Principles for each Measure W Program category. The survey also asked for each respondent’s place of residence and employment by city or unincorporated County area and provided an area for open-ended general comments.
General Comments from the Online Public SurveyAll survey comments were reviewed and incorporated where appropriate. Some comments that were representative of general themes that emerged from the comments include:
� Prioritize pedestrian safety
� Addressing at-grade train crossings is really important
� Safety, relieving congestion, and repairing potholes should be the overwhelming priority
� Safe connected bike paths
� Support green, environmentally-friendly solutions
� More bikes = fewer cars
� Invest in more transit and more bike infrastructure
� Denser housing near transportation hubs to support more frequent and expanded public transportation service
� Increasing automobile capacity will not improve congestion
� More carpool lanes
� Get people out of their cars on the 101 and onto Caltrain
� Good networked sustainable transportation alternatives to and through San Mateo County
� Improve the pedestrian environment near schools
and transit hubs
� Please make the roads safer
� Safe streets and more transit service
� Fix the potholes
� Repair streets and highways
� Infrastructure repair is critical
� Bikes, trains and buses
� More transit options
� Stop prioritizing automobiles
� Congestion relief, road maintenance, convenient public transportation
� Traffic reduction is a must
� Coordinate the times of the shuttles, ferries, buses and Bay Area Rapid Transit (BART) better
� Seamless fare integration
� Public transportation needs to be more efficient, run more frequently and connect to other lines at transfer points
� More trains, more often
12
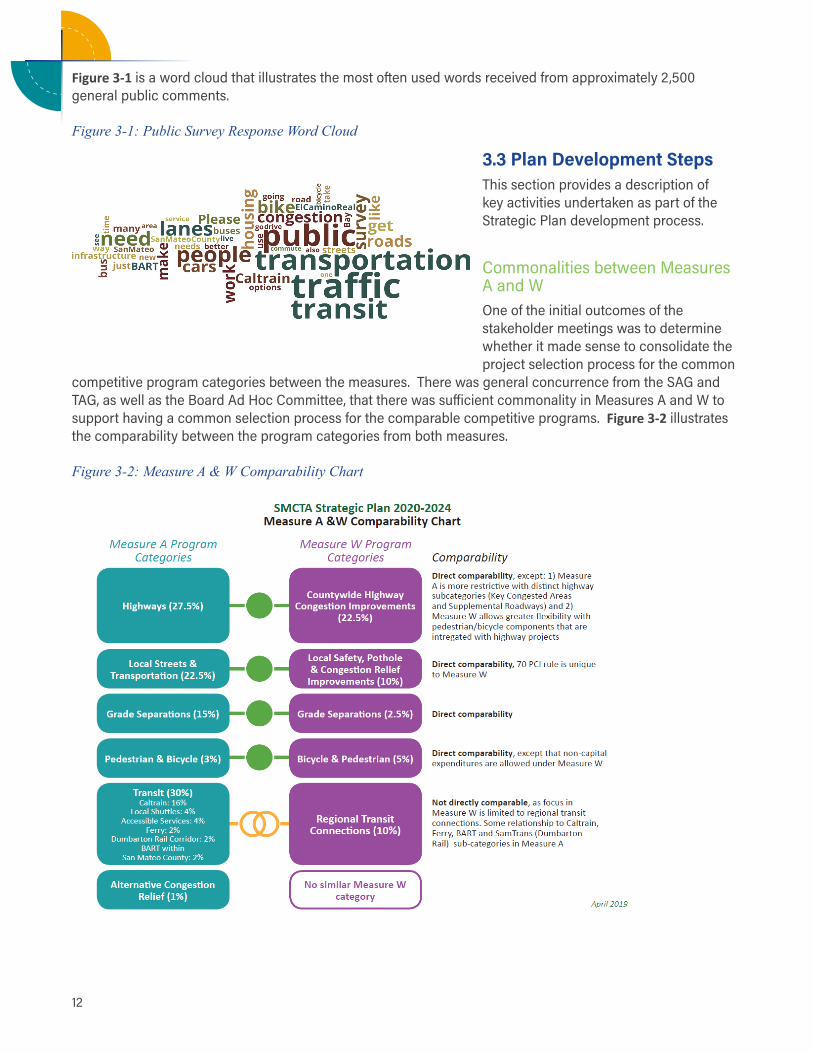
Figure 3-1 is a word cloud that illustrates the most often used words received from approximately 2,500 general public comments.
Figure 3-1: Public Survey Response Word Cloud
3.3 Plan Development StepsThis section provides a description of key activities undertaken as part of the Strategic Plan development process.
Commonalities between Measures A and WOne of the initial outcomes of the stakeholder meetings was to determine whether it made sense to consolidate the project selection process for the common
competitive program categories between the measures. There was general concurrence from the SAG and TAG, as well as the Board Ad Hoc Committee, that there was sufficient commonality in Measures A and W to support having a common selection process for the comparable competitive programs. Figure 3-2 illustrates the comparability between the program categories from both measures.
Figure 3-2: Measure A & W Comparability Chart
Section 3 Plan Development Process
13Strategic Plan 2020-2024
Project Framework TablesPolicy framework tables were created for the Measure W program categories and the comparable Measure A program categories for project selection, project sponsorship, and minimum matching fund requirements as illustrated in Table 6-1 and 6-2 in Section 6.1 and minimum matching fund requirements in Table 7-1 in Section 7.2
Initiatives to Improve Project DeliveryThe TA also saw an opportunity to be able to improve the project delivery process. The TAG, which was primarily comprised of representatives that are the TEP project sponsors, strongly supported the position that the TA should be proactive in identifying and sponsoring highway projects of countywide significance. The TA recognizes that local agencies often have limited resources and experience as well as competing priorities that can impact their ability to deliver large regional highway projects. Greater benefits may be realized by strategically targeting projects that reduce regional congestion and also improve local mobility. Examples of highway projects of countywide significance include the San Mateo US 101 Express Lanes and the US 101/SR 92 Interchange. The TA will consider setting aside funding for these highway projects of countywide significance, striking a balance with local needs, which will be further addressed as part of the update to the Short Range Highway Plan (2012-2021) with an accompanying Capital Improvement Program (CIP).
The TA also strives to further its role with technical assistance, as resources permit, to advance project delivery. The TA should further explore the following options:
� Provide technical assistance to sponsors, not limited to the highway program,
� Utilize consultant services to offer Complete Streets and other best practice workshops,
� Temporarily offer consultant services to fill sponsor gaps due to staff vacancies on request to keep projects moving, and
� Contract with consultants to obtain grant funds to help sponsors be more competitive with various grants and better leverage Measure A & W funds.
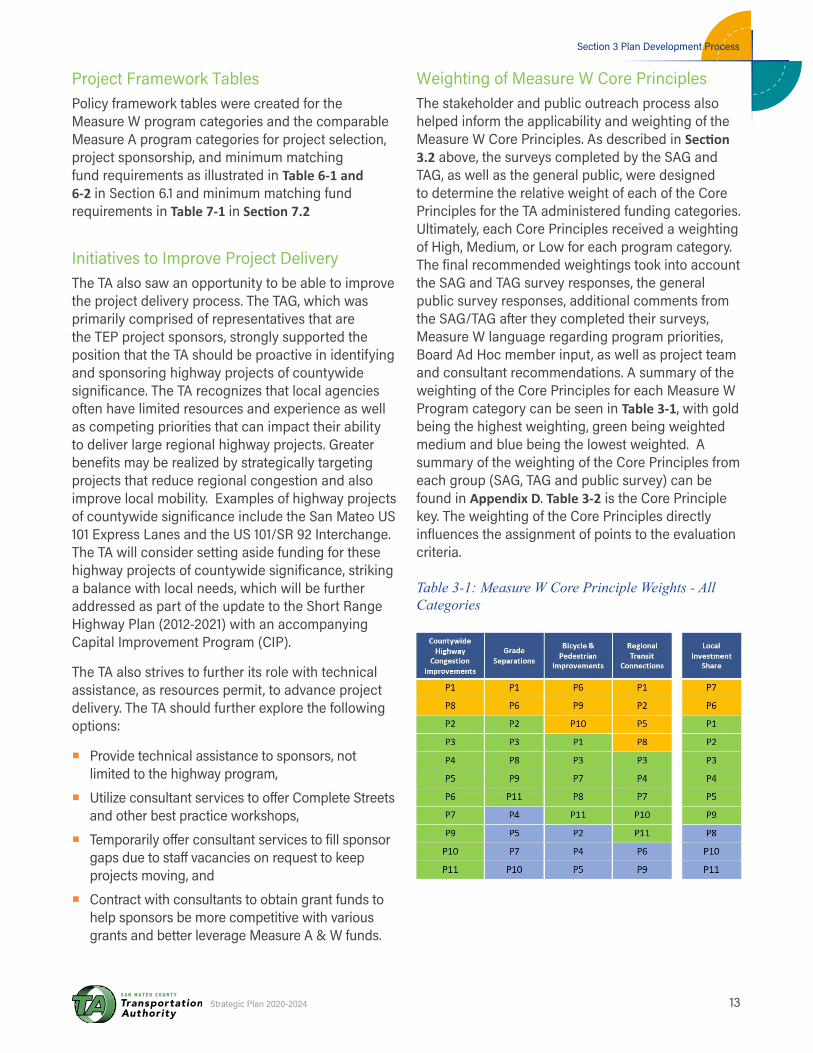
Weighting of Measure W Core PrinciplesThe stakeholder and public outreach process also helped inform the applicability and weighting of the Measure W Core Principles. As described in Section 3.2 above, the surveys completed by the SAG and TAG, as well as the general public, were designed to determine the relative weight of each of the Core Principles for the TA administered funding categories. Ultimately, each Core Principles received a weighting of High, Medium, or Low for each program category. The final recommended weightings took into account the SAG and TAG survey responses, the general public survey responses, additional comments from the SAG/TAG after they completed their surveys, Measure W language regarding program priorities, Board Ad Hoc member input, as well as project team and consultant recommendations. A summary of the weighting of the Core Principles for each Measure W Program category can be seen in Table 3-1, with gold being the highest weighting, green being weighted medium and blue being the lowest weighted. A summary of the weighting of the Core Principles from each group (SAG, TAG and public survey) can be found in Appendix D. Table 3-2 is the Core Principle key. The weighting of the Core Principles directly influences the assignment of points to the evaluation criteria.
Table 3-1: Measure W Core Principle Weights - All Categories
14
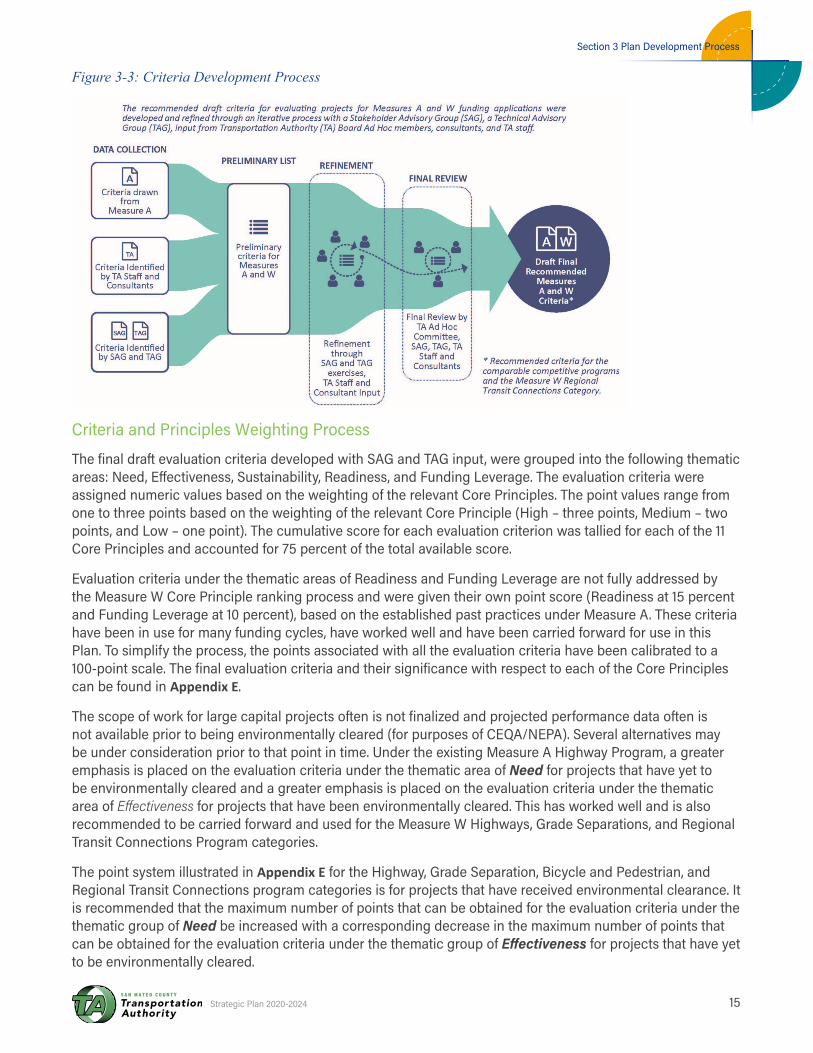
Development of Evaluation CriteriaThe Strategic Plan contains evaluation criteria for the comparable competitive Highway, Bicycle/Pedestrian, and Grade Separation Program categories, and the Measure W Regional Transit Connections Program category. The comparable competitive programs are those where project sponsors compete for funding and the program category requirements between Measures A and W are similar. Significant input went into the evaluation criteria development process. As part of the SAG and TAG meetings, staff shared existing project evaluation criteria used for the Measure A programs and added a few suggestions for each of the 11 Core Principles with respect to each of the comparable competitive funding categories and the Measure W Regional Transit Connections Program category organized by Core Principle. Working with that initial set of criteria, SAG and TAG members generated hundreds of evaluation criteria sorted by Core Principle for each of the programs, which can be found in Appendix D. The proposed evaluation criteria were brought back to the SAG and TAG for further refinement and consolidation through facilitated breakout sessions. Board Ad Hoc members, staff and consultant also contributed significant input into this process, which is illustrated below in Figure 3-3.
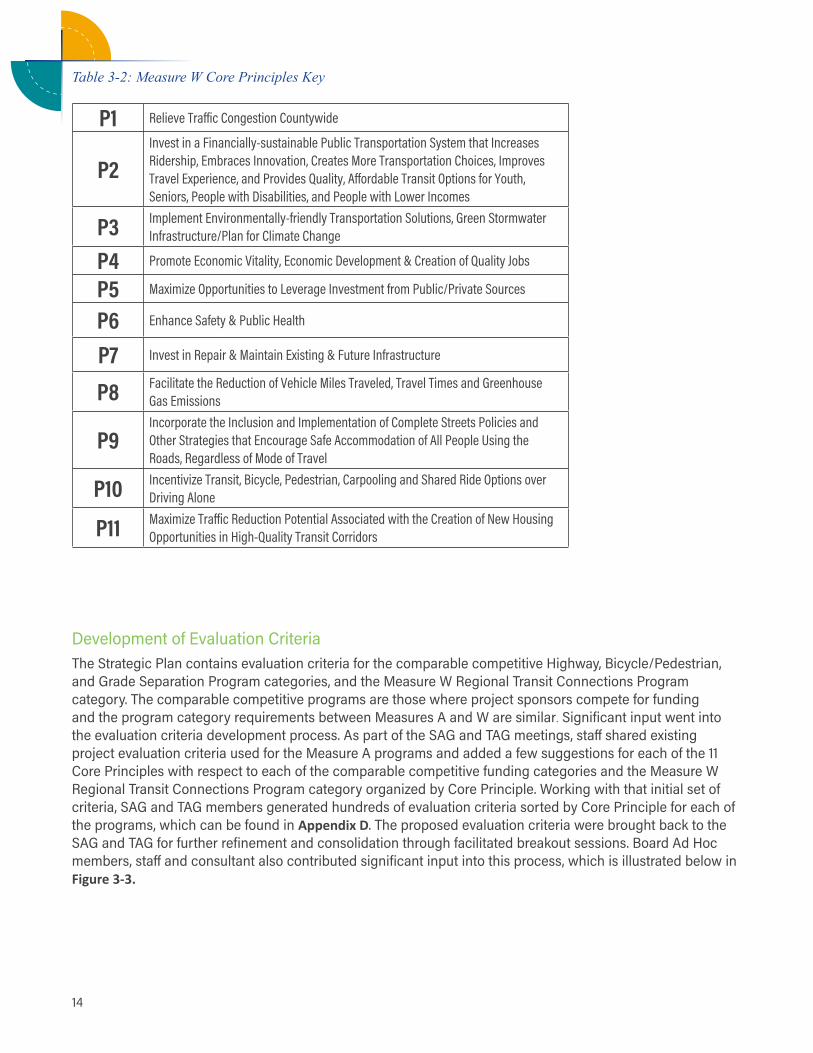
Table 3-2: Measure W Core Principles Key
P1 Relieve Traffic Congestion Countywide
P2Invest in a Financially-sustainable Public Transportation System that Increases Ridership, Embraces Innovation, Creates More Transportation Choices, Improves Travel Experience, and Provides Quality, Affordable Transit Options for Youth, Seniors, People with Disabilities, and People with Lower Incomes
P3 Implement Environmentally-friendly Transportation Solutions, Green Stormwater Infrastructure/Plan for Climate Change
P4 Promote Economic Vitality, Economic Development & Creation of Quality Jobs
P5 Maximize Opportunities to Leverage Investment from Public/Private Sources
P6 Enhance Safety & Public Health
P7 Invest in Repair & Maintain Existing & Future Infrastructure
P8 Facilitate the Reduction of Vehicle Miles Traveled, Travel Times and Greenhouse Gas Emissions
P9Incorporate the Inclusion and Implementation of Complete Streets Policies and Other Strategies that Encourage Safe Accommodation of All People Using the Roads, Regardless of Mode of Travel
P10 Incentivize Transit, Bicycle, Pedestrian, Carpooling and Shared Ride Options over Driving Alone
P11 Maximize Traffic Reduction Potential Associated with the Creation of New Housing Opportunities in High-Quality Transit Corridors
Section 3 Plan Development Process
15Strategic Plan 2020-2024
Figure 3-3: Criteria Development Process
Criteria and Principles Weighting Process
The final draft evaluation criteria developed with SAG and TAG input, were grouped into the following thematic areas: Need, Effectiveness, Sustainability, Readiness, and Funding Leverage. The evaluation criteria were assigned numeric values based on the weighting of the relevant Core Principles. The point values range from one to three points based on the weighting of the relevant Core Principle (High – three points, Medium – two points, and Low – one point). The cumulative score for each evaluation criterion was tallied for each of the 11 Core Principles and accounted for 75 percent of the total available score.
Evaluation criteria under the thematic areas of Readiness and Funding Leverage are not fully addressed by the Measure W Core Principle ranking process and were given their own point score (Readiness at 15 percent and Funding Leverage at 10 percent), based on the established past practices under Measure A. These criteria have been in use for many funding cycles, have worked well and have been carried forward for use in this Plan. To simplify the process, the points associated with all the evaluation criteria have been calibrated to a 100-point scale. The final evaluation criteria and their significance with respect to each of the Core Principles can be found in Appendix E.
The scope of work for large capital projects often is not finalized and projected performance data often is not available prior to being environmentally cleared (for purposes of CEQA/NEPA). Several alternatives may be under consideration prior to that point in time. Under the existing Measure A Highway Program, a greater emphasis is placed on the evaluation criteria under the thematic area of Need for projects that have yet to be environmentally cleared and a greater emphasis is placed on the evaluation criteria under the thematic area of Effectiveness for projects that have been environmentally cleared. This has worked well and is also recommended to be carried forward and used for the Measure W Highways, Grade Separations, and Regional Transit Connections Program categories.
The point system illustrated in Appendix E for the Highway, Grade Separation, Bicycle and Pedestrian, and Regional Transit Connections program categories is for projects that have received environmental clearance. It is recommended that the maximum number of points that can be obtained for the evaluation criteria under the thematic group of Need be increased with a corresponding decrease in the maximum number of points that can be obtained for the evaluation criteria under the thematic group of Effectiveness for projects that have yet to be environmentally cleared.

16
Page intentionally left blank
17Strategic Plan 2020-2024
This section provides a backdrop of existing demographic and travel trends within San Mateo County, a look at how peer agencies fund transportation projects in relation to the TA’s funding practices, and a financial look-ahead for the funding of projects in San Mateo County.
4.1 Demographics and Travel DataThe TA conducted an analysis of demographic data to better understand current and future population and employment growth patterns and travel trends. This includes current and future mode share and trip growth, as projected changes could influence program policies.
Demographic TrendsAccording to the State of California Department of Finance, during the last national census in 2010, San Mateo County had 718,454 residents and 331,931 jobs. Between 2010 and 2040, San Mateo County is projected to increase in population by 25 percent with employment increasing by 34 percent.
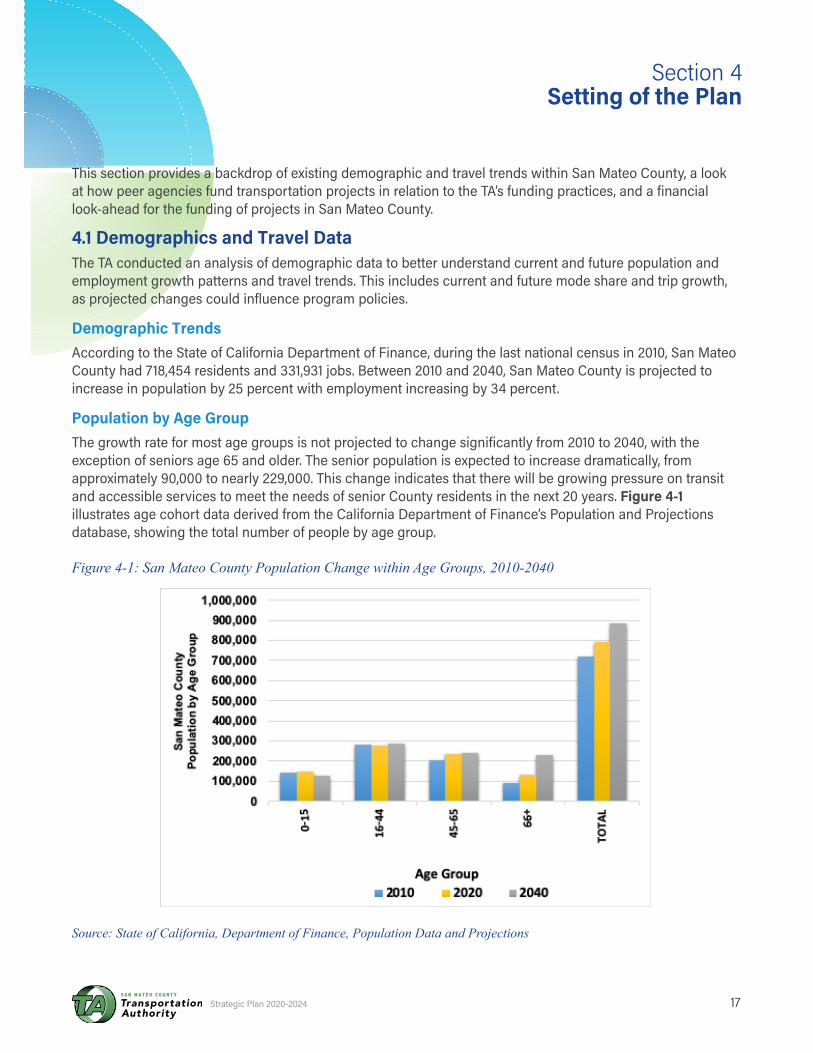
Population by Age GroupThe growth rate for most age groups is not projected to change significantly from 2010 to 2040, with the exception of seniors age 65 and older. The senior population is expected to increase dramatically, from approximately 90,000 to nearly 229,000. This change indicates that there will be growing pressure on transit and accessible services to meet the needs of senior County residents in the next 20 years. Figure 4-1 illustrates age cohort data derived from the California Department of Finance’s Population and Projections database, showing the total number of people by age group.
Figure 4-1: San Mateo County Population Change within Age Groups, 2010-2040
Source: State of California, Department of Finance, Population Data and Projections
Section 4 Setting of the Plan
18
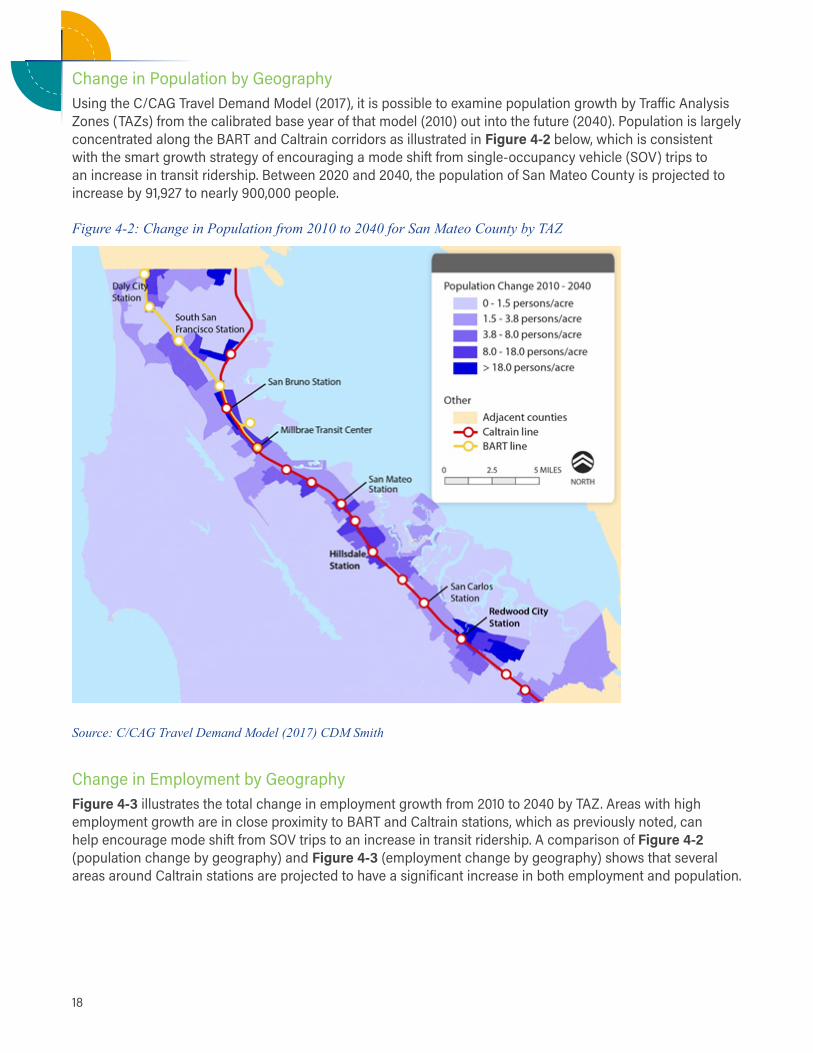
Change in Population by GeographyUsing the C/CAG Travel Demand Model (2017), it is possible to examine population growth by Traffic Analysis Zones (TAZs) from the calibrated base year of that model (2010) out into the future (2040). Population is largely concentrated along the BART and Caltrain corridors as illustrated in Figure 4-2 below, which is consistent with the smart growth strategy of encouraging a mode shift from single-occupancy vehicle (SOV) trips to an increase in transit ridership. Between 2020 and 2040, the population of San Mateo County is projected to increase by 91,927 to nearly 900,000 people.
Figure 4-2: Change in Population from 2010 to 2040 for San Mateo County by TAZ
Source: C/CAG Travel Demand Model (2017) CDM Smith
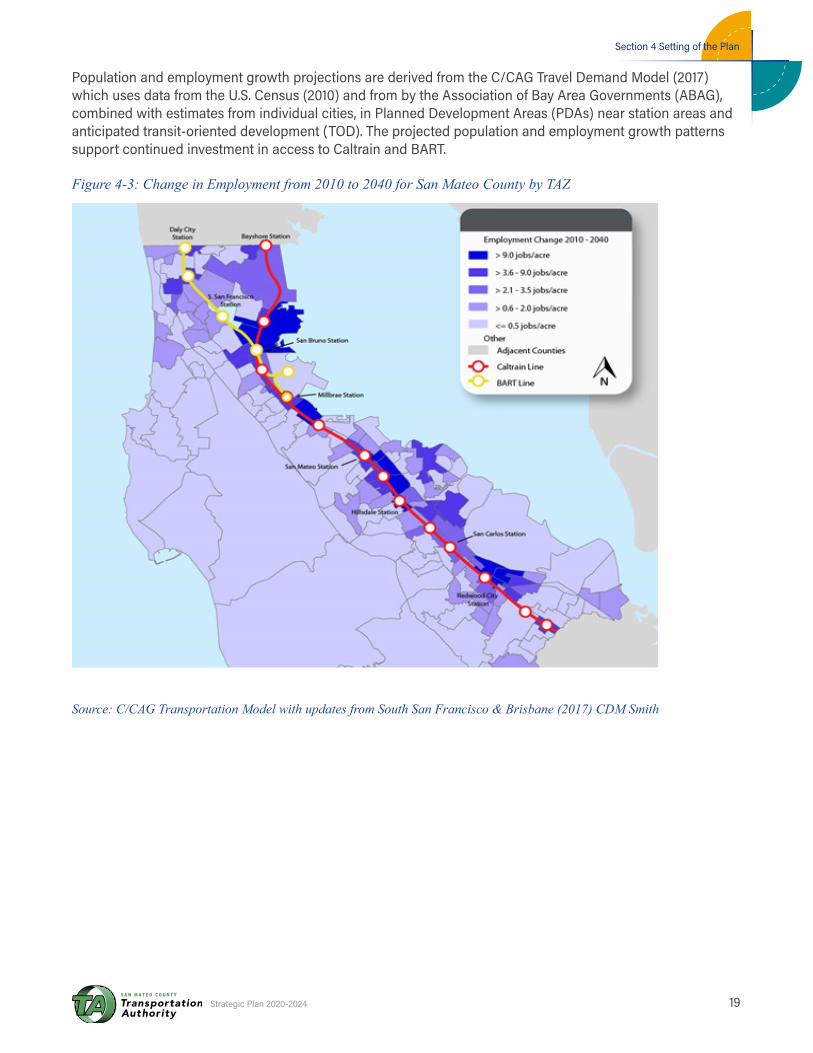
Change in Employment by GeographyFigure 4-3 illustrates the total change in employment growth from 2010 to 2040 by TAZ. Areas with high employment growth are in close proximity to BART and Caltrain stations, which as previously noted, can help encourage mode shift from SOV trips to an increase in transit ridership. A comparison of Figure 4-2 (population change by geography) and Figure 4-3 (employment change by geography) shows that several areas around Caltrain stations are projected to have a significant increase in both employment and population.
Section 4 Setting of the Plan
19Strategic Plan 2020-2024
Population and employment growth projections are derived from the C/CAG Travel Demand Model (2017) which uses data from the U.S. Census (2010) and from by the Association of Bay Area Governments (ABAG), combined with estimates from individual cities, in Planned Development Areas (PDAs) near station areas and anticipated transit-oriented development (TOD). The projected population and employment growth patterns support continued investment in access to Caltrain and BART.
Figure 4-3: Change in Employment from 2010 to 2040 for San Mateo County by TAZ
Source: C/CAG Transportation Model with updates from South San Francisco & Brisbane (2017) CDM Smith
20
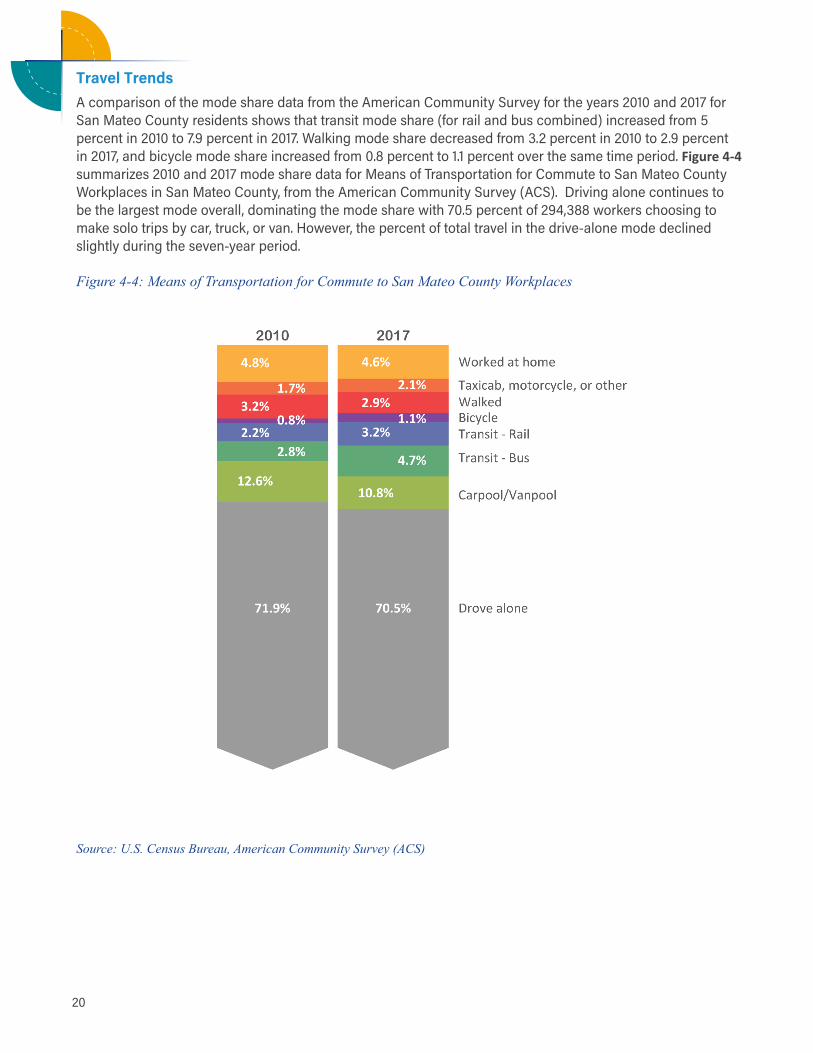
Travel TrendsA comparison of the mode share data from the American Community Survey for the years 2010 and 2017 for San Mateo County residents shows that transit mode share (for rail and bus combined) increased from 5 percent in 2010 to 7.9 percent in 2017. Walking mode share decreased from 3.2 percent in 2010 to 2.9 percent in 2017, and bicycle mode share increased from 0.8 percent to 1.1 percent over the same time period. Figure 4-4 summarizes 2010 and 2017 mode share data for Means of Transportation for Commute to San Mateo County Workplaces in San Mateo County, from the American Community Survey (ACS). Driving alone continues to be the largest mode overall, dominating the mode share with 70.5 percent of 294,388 workers choosing to make solo trips by car, truck, or van. However, the percent of total travel in the drive-alone mode declined slightly during the seven-year period.
Figure 4-4: Means of Transportation for Commute to San Mateo County Workplaces
Source: U.S. Census Bureau, American Community Survey (ACS)
Section 4 Setting of the Plan
21Strategic Plan 2020-2024
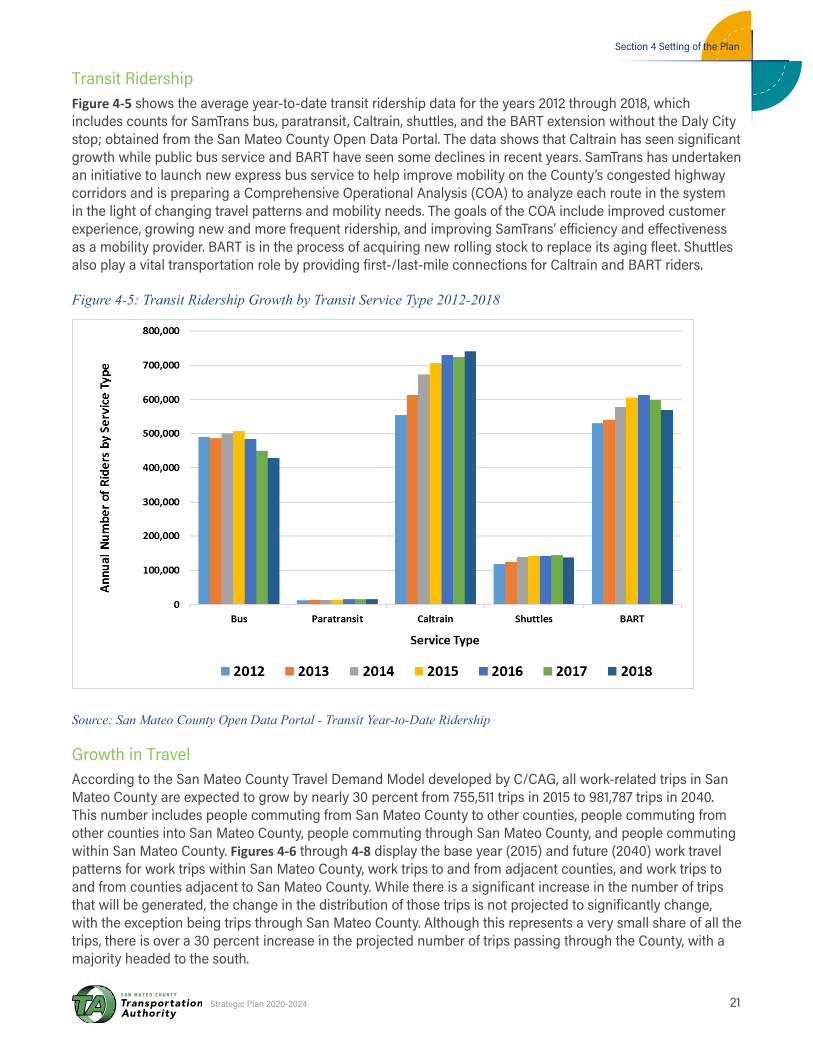
Transit RidershipFigure 4-5 shows the average year-to-date transit ridership data for the years 2012 through 2018, which includes counts for SamTrans bus, paratransit, Caltrain, shuttles, and the BART extension without the Daly City stop; obtained from the San Mateo County Open Data Portal. The data shows that Caltrain has seen significant growth while public bus service and BART have seen some declines in recent years. SamTrans has undertaken an initiative to launch new express bus service to help improve mobility on the County’s congested highway corridors and is preparing a Comprehensive Operational Analysis (COA) to analyze each route in the system in the light of changing travel patterns and mobility needs. The goals of the COA include improved customer experience, growing new and more frequent ridership, and improving SamTrans’ efficiency and effectiveness as a mobility provider. BART is in the process of acquiring new rolling stock to replace its aging fleet. Shuttles also play a vital transportation role by providing first-/last-mile connections for Caltrain and BART riders.
Figure 4-5: Transit Ridership Growth by Transit Service Type 2012-2018
Source: San Mateo County Open Data Portal - Transit Year-to-Date Ridership
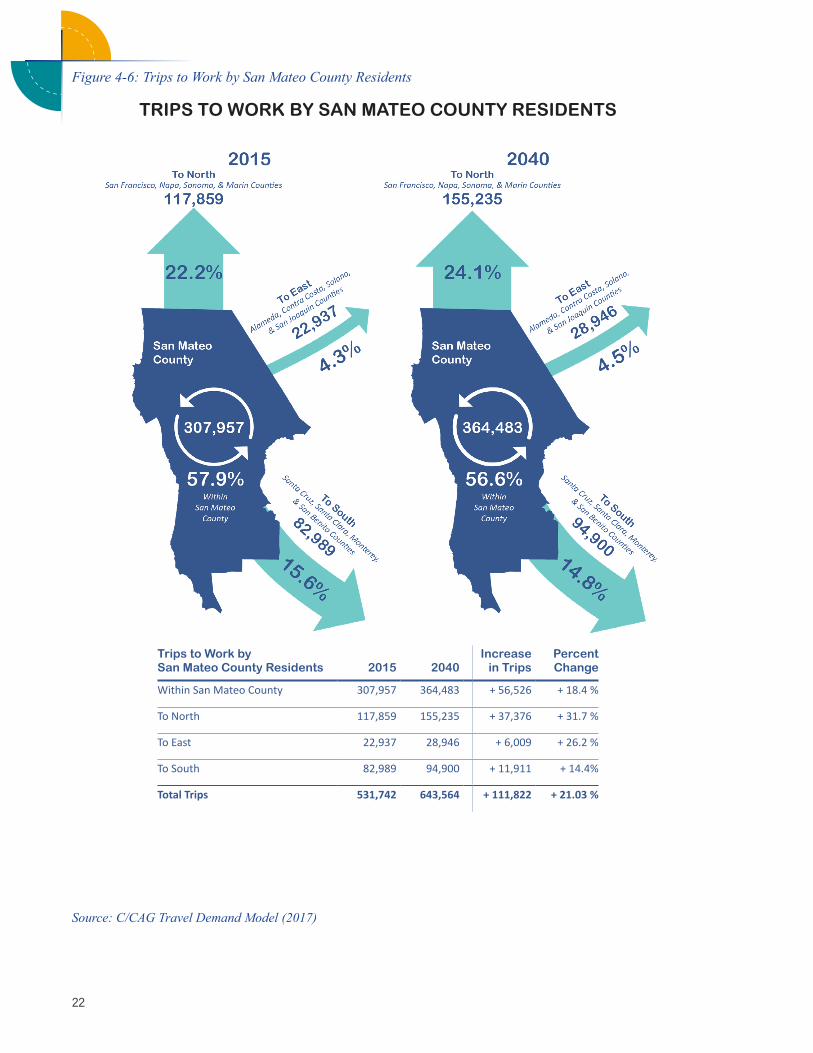
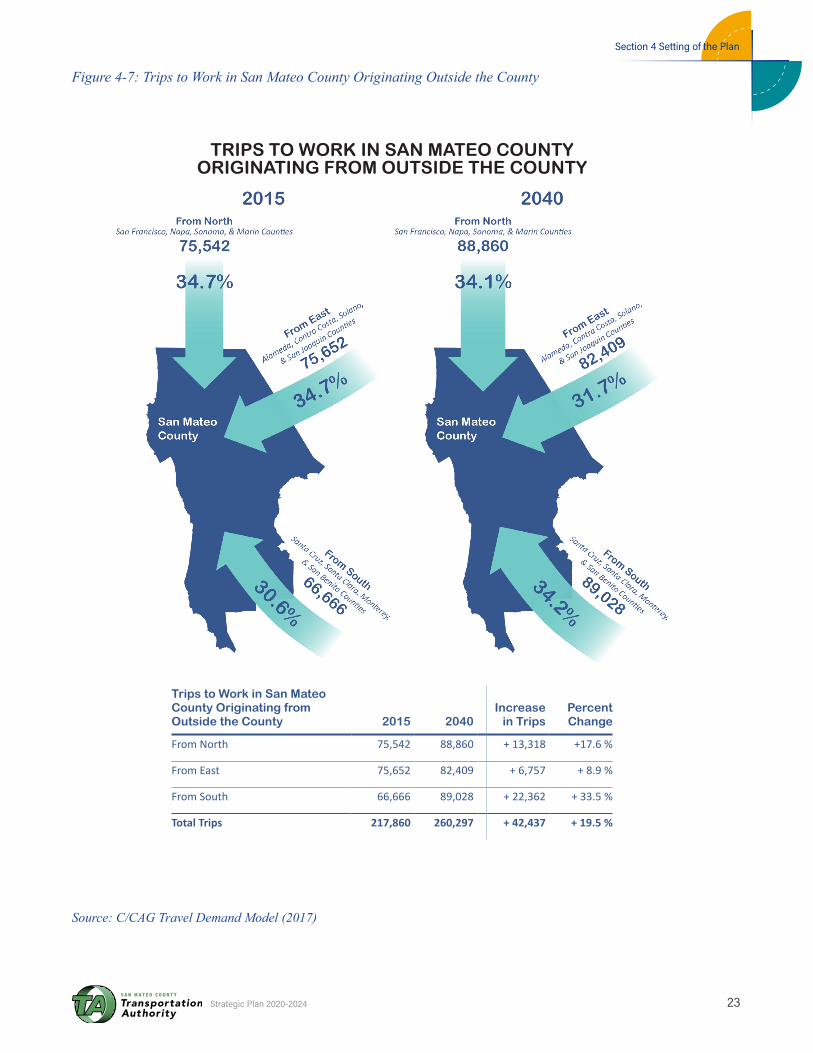
Growth in TravelAccording to the San Mateo County Travel Demand Model developed by C/CAG, all work-related trips in San Mateo County are expected to grow by nearly 30 percent from 755,511 trips in 2015 to 981,787 trips in 2040. This number includes people commuting from San Mateo County to other counties, people commuting from other counties into San Mateo County, people commuting through San Mateo County, and people commuting within San Mateo County. Figures 4-6 through 4-8 display the base year (2015) and future (2040) work travel patterns for work trips within San Mateo County, work trips to and from adjacent counties, and work trips to and from counties adjacent to San Mateo County. While there is a significant increase in the number of trips that will be generated, the change in the distribution of those trips is not projected to significantly change, with the exception being trips through San Mateo County. Although this represents a very small share of all the trips, there is over a 30 percent increase in the projected number of trips passing through the County, with a majority headed to the south.
22
Figure 4-6: Trips to Work by San Mateo County Residents
Trips to Work bySan Mateo County Residents 2015 2040
Increase in Trips
Percent Change
Within San Mateo County 307,957 364,483 + 56,526 + 18.4 %
To North 117,859 155,235 + 37,376 + 31.7 %
To East 22,937 28,946 + 6,009 + 26.2 %
To South 82,989 94,900 + 11,911 + 14.4%
Total Trips 531,742 643,564 + 111,822 + 21.03 %
TRIPS TO WORK BY SAN MATEO COUNTY RESIDENTS
Source: C/CAG Travel Demand Model (2017)
Section 4 Setting of the Plan
23Strategic Plan 2020-2024
Figure 4-7: Trips to Work in San Mateo County Originating Outside the County
Trips to Work in San Mateo County Originating from Outside the County 2015 2040
Increase in Trips
Percent Change
From North 75,542 88,860 + 13,318 +17.6 %
From East 75,652 82,409 + 6,757 + 8.9 %
From South 66,666 89,028 + 22,362 + 33.5 %
Total Trips 217,860 260,297 + 42,437 + 19.5 %
TRIPS TO WORK IN SAN MATEO COUNTY ORIGINATING FROM OUTSIDE THE COUNTY
Source: C/CAG Travel Demand Model (2017)
24
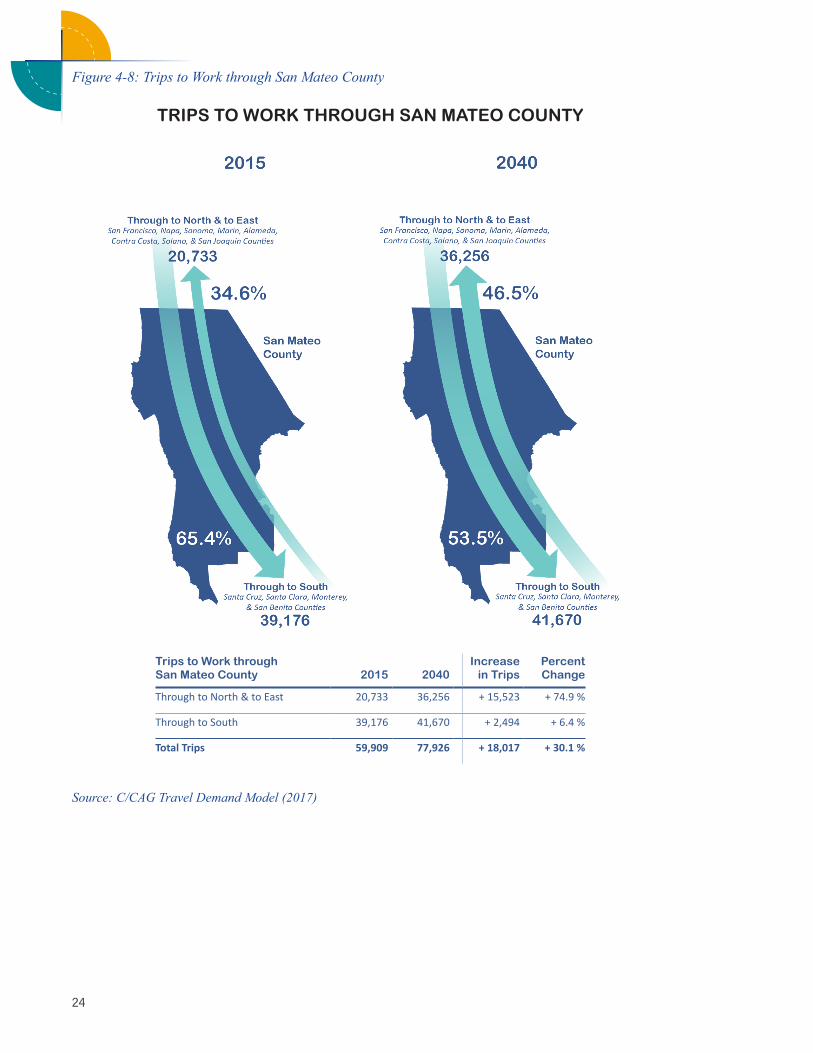
Figure 4-8: Trips to Work through San Mateo County
Trips to Work throughSan Mateo County 2015 2040
Increase in Trips
Percent Change
Through to North & to East 20,733 36,256 + 15,523 + 74.9 %
Through to South 39,176 41,670 + 2,494 + 6.4 %
Total Trips 59,909 77,926 + 18,017 + 30.1 %
TRIPS TO WORK THROUGH SAN MATEO COUNTY
Source: C/CAG Travel Demand Model (2017)
Section 4 Setting of the Plan
25Strategic Plan 2020-2024
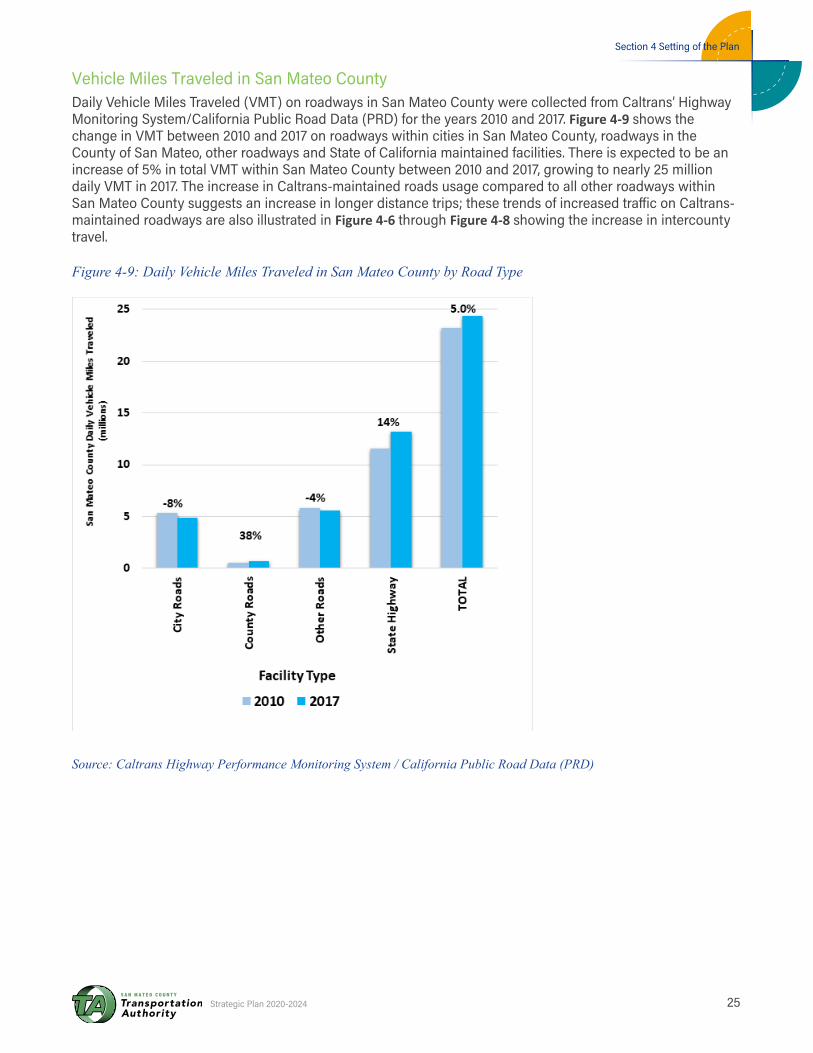
Vehicle Miles Traveled in San Mateo County Daily Vehicle Miles Traveled (VMT) on roadways in San Mateo County were collected from Caltrans’ Highway Monitoring System/California Public Road Data (PRD) for the years 2010 and 2017. Figure 4-9 shows the change in VMT between 2010 and 2017 on roadways within cities in San Mateo County, roadways in the County of San Mateo, other roadways and State of California maintained facilities. There is expected to be an increase of 5% in total VMT within San Mateo County between 2010 and 2017, growing to nearly 25 million daily VMT in 2017. The increase in Caltrans-maintained roads usage compared to all other roadways within San Mateo County suggests an increase in longer distance trips; these trends of increased traffic on Caltrans-maintained roadways are also illustrated in Figure 4-6 through Figure 4-8 showing the increase in intercounty travel.
Figure 4-9: Daily Vehicle Miles Traveled in San Mateo County by Road Type
Source: Caltrans Highway Performance Monitoring System / California Public Road Data (PRD)
26
Emerging Mobility ServicesSince the release of the 2014-2019 Strategic Plan, there has been significant growth in new emerging mobility services within the region. Micromobility services such as bike share programs, which have been trending toward dockless e-bike (electric assist) systems, and scooter share programs have become widely adopted in dense urban areas where they are being used for short trips and first-/last-mile connections to and from transit. However, they have struggled to gain traction in suburban San Mateo County, and it is not clear what actual impacts these services will have on overall mode share in the future.
Over the last five years, there has also been a rise in ride-hailing companies such as Uber and Lyft operating rideshare programs and Get Around and Zipcar providing car share services.
These emerging mobility services provide opportunities to reduce SOV trips to access transit and major activity centers. Micromobility services can benefit from the build-out of bikeway networks and encourage greater usage of those facilities. Ride-hailing and car share have the potential to reduce individual auto ownership and make transportation choices more equitable for those who cannot afford a vehicle or are unable to drive themselves.
These relatively new services also present some challenges. There are storage concerns with dockless bike share and scooter share systems, with potential conflicts arising from the blocking of sidewalks and the devices not being used and stored properly. Ride-hailing services have been shown to increase VMT and can compete with transit. However, the potential to reduce VMT and provide better first-/last-mile connections to and from transit may offset the downside of these mobility services.
Autonomous VehiclesAutonomous vehicle (AV) pilots are currently being tested in locations across the nation and abroad. While mainstream use of AVs is likely well beyond the timeframe of this Plan, they bring their own set of opportunities and challenges, with great potential to impact and alter the built environment within the coming decades. AVs could enable narrower rights of way and travel lanes; influence the form, location, and amount of parking; impact the mobility of pedestrians and bicyclists; and provide opportunities
for redevelopment on excess parking lots and rights of way. Their impact could be similar to that of ride-hailing companies today with regard to increased VMT; however, AVs also have the potential to reduce auto ownership in urban areas through shared on-demand mobility.
Summary of FindingsThe review of demographic and travel trends revealed the following findings:
� High growth in the number of seniors (residents age 65 and older) will put increased pressure on the provision of transit and other senior-centric projects and programs.
� The majority of the population and employment growth in the County will occur along the already congested north/south Highway 101 and Caltrain corridors. Providing multimodal solutions with focus on sustainable practices will be critical.
� The use of transit and bicycle modes have increased since 2010, and although the mode share has decreased for SOV trips it continues to be by far the largest share. This suggests a balanced approach to transportation investment will be needed.
� VMT analysis of roadways in San Mateo County and the growth in travel demand in the County, shows that more strain will be put on an already constrained network of Caltrans-maintained facilities (as shown in Figures 4-5 through 4-8). Future transportation projects will need to emphasize person throughput to mitigate traffic congestion.
� There is an increase in the number and type of rapidly evolving new emerging mobility services (from bike share to autonomous vehicles), which bring opportunities that can be transformative in the reduction of SOV trips and challenges as well, potentially being disruptive without proper policy guidance in place.
4.2 Related Plan Linkages and Ongoing Planning EffortsThere are a number of recently completed or on-going transportation planning efforts in San Mateo County that were examined during the development of the Strategic Plan to help inform the tasks in the Plan development process, including the
Section 4 Setting of the Plan
27Strategic Plan 2020-2024
development of evaluation criteria and the project selection process. Many of these plans were initiated to address some of the same issues that were identified under the Measure W Get Us Moving San Mateo County process in 2018 (e.g. countywide congestion relief) and they were developed to help define the future transportation network in the county.
Plan Bay Area 2040 (2017):Plan Bay Area 2040 is a state-mandated, integrated long-range transportation and land use plan. As required by Senate Bill 375, all metropolitan regions in California must complete a Sustainable Communities Strategy (SCS) as part of a Regional Transportation Plan. In the Bay Area, the Metropolitan Transportation Commission (MTC) and the Association of Bay Area Governments (ABAG) are jointly responsible for developing and adopting a SCS that integrates transportation, land use and housing to meet greenhouse gas reduction targets set by the California Air Resources Board (CARB).
As part of Plan Bay Area 2040, MTC and ABAG conducted extensive outreach to both regional stakeholders and the general public. After receiving feedback from stakeholders and the public, MTC and the ABAG Executive Board established seven goals and 13 performance targets to measure Plan Bay Area 2040’s effectiveness in addressing the major challenges facing the region.
Many of the goals and targets are in-line with the existing Measure A goals, the new Measure W Core Principles and the criteria that were born out of the outreach efforts conducted for the Strategic Plan. These include but are not limited to the following
� Goal: Climate Protection
– Target: Reduce per-capita CO2 emissions
� Goal: Transportation System Effectiveness
– Target: Increase non-auto mode share
– Target: Reduce vehicle operating and maintenance costs due to pavement conditions
– Reduce per-rider transit delay due to aged infrastructure
� Goal: Economic Vitality
– Increase share of jobs accessible in congested conditions
San Mateo Countywide Transportation Plan 2040 (2017):The San Mateo Countywide Transportation Plan for 2040 (SMCTP 2040), prepared by the City and County Association of Governments of San Mateo County (C/CAG), was conceived by San Mateo County leaders as a way to provide the county with a long-range, comprehensive transportation planning document that sets forth a coordinated planning framework and establishes a systematic transportation planning process for identifying and resolving transportation issues. SMCTP 2040 is intended to articulate clear transportation planning objectives and policies and to promote consistency and compatibility among all transportation plans and programs within the county.
SMCTP 2040 created a central vision statement, and then identified 11 categories where more specific vision statements, goals and objectives could be developed to provide a framework for decision making to help guide countywide transportation investment for the next two decades. The following eight categories have ties to the goals that were developed for Measure A and Measure W’s core principles: Land Use & Transportation, Roadway System, Bicycles, Pedestrians, Public Transportation, Transportation System Management and Intelligent Transportation System (ITS), Transportation Demand Management (TDM), and Modal Connectivity.
San Mateo Countywide Transportation Plan 2040 Follow Up Action Plan (2018): The San Mateo Countywide Transportation Plan 2040 (SMCTP 2040) Follow-Up Action Plan process was initiated by a list of next steps developed to ensure the SMCTP 2040 would be implemented appropriately. The SMCTP 2040 Follow-Up Working Group was formed to guide the development of the Follow-Up Action Plan. The Follow-Up Action Plan is a living document intended to guide C/CAG staff, its member agencies, and stakeholders to implement the SMCTP 2040. The Follow-Up Action Plan Priorities are the primary keys to ensuring the vision, goals, and objectives of the SMCTP 2040 are met.
As part of the SMCTP 2040 Follow-Up Action Plan, a Performance Measures Matrix was developed that identifies whether the objectives that are tied to the categories that were developed in the SMCTP 2040 apply to the long- short- or near-term, which mode they apply to and what the specific performance
28
measure or target is for that category. Just like in the SMCTP 2040, there are categories in the Performance Measures Matrix that have ties to the goals that were developed for Measure A and Measure W’s Core Principles; those include: Land Use, Roadway System, Bicycles, Pedestrians, Public Transportation, Transportation System Management and ITS, TDM, and Modal Connectivity.
Caltrain Business Plan (2020): This plan is a comprehensive effort currently being undertaken by the Peninsula Corridor Joint Powers Board (JPB) to develop a long-term service vision for Caltrain. Through a substantial planning process, the Business Plan has addressed the future potential of Caltrain rail service over the next 20-30 years by assessing the benefits, impacts, and costs of different long-term service scenarios. In October 2018, the JPB adopted a long-term service vision; it calls for a minimum of eight trains per direction per hour during the commute hours (up from the current five), as well as increased off-peak and weekend services by 2040. This increased frequency, paired with longer trains, is anticipated to massively expand capacity to nearly 180,000 riders per day (up from the current 63,000) by 2040. In spring 2020, the JPB is anticipated to adopt the full Caltrain Business Plan, which will provide additional information about the long-term service vision, build the case for investment, and outline an implementation plan.
Caltrain has 14 stations in San Mateo County and 30 at-grade crossings of streets, all of which could be candidates for grade separation-related improvements. Although the Caltrain Business Plan does not provide recommendations regarding the priority of at-grade crossings to be grade separated, the JPB will embark on a study that prioritizes grade separations on the Caltrain Corridor after its completion. This subsequent work effort will have a direct influence on the competitive Measure W Grade Separation Program.
Dumbarton Transportation Corridor Study (2017): The 2017 Dumbarton Transportation Corridor Study (DTCS), prepared by the San Mateo County Transit District (District), is a feasibility study that evaluated potential multimodal transportation improvements within the Dumbarton Corridor in the South San Francisco Bay Area. The Dumbarton Corridor is a critical connector between residential
neighborhoods in the East Bay and job centers on the San Francisco Peninsula. The Study recommended a re-established rail corridor and expanded bus service across the Dumbarton Highway Bridge (SR 84). The DTCS considered a variety of short and long term improvements that were evaluated against a set of performance criteria established under key project goals. There are parallels that can be drawn from the goals and criteria in the DTCS and the Measure A Goals, Measure W Core Principles and the evaluation criteria that have been developed in this Strategic Plan. Key goals listed in the DTCS include: enhancing mobility, with an emphasis on capacity and throughput; cost effectiveness; consideration of environmental impacts, financial risk and safety; and protecting local communities from adverse impacts, considering low income and minorities.
Alternatives developed as part of the DTCS, and a subsequent work effort currently underway to further explore options to enhance mobility options along the Dumbarton Rail Corridor, may be eligible to compete for funding in the Measure A and W Highway Program category and the Measure W Regional Transit Connections Program category.
US-101 Express Bus Feasibility Study (2018): The SamTrans US-101 Express Bus Feasibility Study explored the role express buses can play in providing mobility options on US-101 and adjacent roadways like I-280 that strengthen connectivity to jobs and housing hubs throughout the region. Together with other improvements and TDM initiatives, the implementation of viable, time-competitive public transit options on US-101 has the potential to help meet the region’s future transportation demands. The study examined the financial and operational feasibility of a network of long-distance express buses operating on US-101 through San Mateo County, potentially integrated with managed lanes that provide access to high-occupancy vehicles. The study recommended up to six routes implemented over three phases that were in alignment with the study goals that included: provide mobility options for regional trips, increase transit market share, develop cost effective service, transportation equity, enhance assess to jobs and population centers, and support sustainable land use and transportation policies. These goals are also consistent with the evaluation criteria developed in the Measure W Regional Transit Connections Program category.
Section 4 Setting of the Plan
29Strategic Plan 2020-2024
SamTrans launched its new express bus route, the FCX from Foster City to San Francisco, in August 2019. The agency is exploring launching additional routes, which may be eligible for funding in the Measure W Regional Transit Connections Program category, over the coming years.
US-101 Mobility Action Plan (Ongoing): US-101 is a key component of the transportation network connecting communities in San Francisco, the Peninsula, and the South Bay. US-101 is one of the most economically important corridors in California, as well as a near neighbor to more than 640,000 residents. The MAP is a multi-county effort to develop programs and policies intended to maximize the benefits of planned infrastructure projects and address disproportionate impacts on low-income and/or highway adjacent communities. The outcome of the MAP will include a comprehensive set of near-term, policy and transportation demand management (TDM) concepts, with a focus on equity, that have the potential to maximize the benefits of planned infrastructure projects. TDM programs may include transit subsidies, carpool programs, improved bicycle connections, and other incentives or disincentives, seek to reduce travel demand of single-occupancy vehicles or to redistribute this demand to off-peak travel times.
Goals and performance metrics have been proposed to evaluate proposed MAP TDM strategies that include: reliability, in terms of peak travel time consistency, percent of time Express Lanes operate at 45 miles per hour or greater, on-time performance for transit and perceived travel time reliability; prioritizing high capacity mobility, considering person throughput, vehicle occupancy and transit ridership on parallel corridors; and fostering healthy and sustainable communities, factoring collisions, bicycle and pedestrian mode share, asthma rates and traffic density. The MAP Goals are consistent with the Measure A Goals, Measure W Core Principles and are oriented toward similar outcomes as the evaluation criteria developed for many of the competitive comparable programs in the TA Strategic Plan. The MAP will serve as a point of input in the subsequent Strategic Plan initiative to prepare an Alternative Congestion Relief/TDM Plan that will provide further direction for the allocation of funding in the Measure A Alternative Congestion Relief Program Category and the Measure W TDM subcategory
of the Countywide Highway Congestion Relief Improvements Program category.
4.3 Best Practices in Funding from Peer AgenciesTo gain a better understanding of best practices in transportation funding programs, the TA conducted interviews with eight peer agencies with an extensive history of administering funding programs:
� Alameda County Transportation Commission (Alameda CTC)
� San Francisco County Transportation Authority (SFCTA)
� Santa Clara County Valley Transportation Authority (VTA)
� Transportation Authority of Marin (TAM)
� Metropolitan Transportation Commission (MTC)
� San Diego Association of Governments (SANDAG)
� Puget Sound Regional Council (PSRC)
� Seattle Department of Transportation (SDOT)
The interviews took place in the Spring of 2019, most of them over the phone, with a staff member from each respective agency. The following section describes the key takeaways from the interviews.
Funding SourcesThe peer agencies were found to use a variety of funding sources for competitive transportation projects in their respective areas. Most of the agencies interviewed funded programs through a local half-cent sales tax measure that goes toward funding various capital, operational, and planning-related transportation projects. Some of the other agencies (e.g., PSRC) work as a pass-through agency for federal monies through the Federal Highway Administration and the Federal Transit Administration. MTC distributes funds to agencies throughout the nine-county Bay Area region that are derived from a variety of sources, including Regional Measures 2 and 3 (RM2 and RM3), which collect tolls from the region’s bridges. Peer agencies found that opportunities to leverage external funds are maximized when agency goals and strategies were aligned; much like the TA’s Measure A Vision and Goals and Measure W Core Principles align with peer agencies in the region (C/CAG and MTC).
30
TransparencyOne of the major takeaways from the interviews was the importance of transparency in the project selection process. Agencies noted that they have seen the most success when they identify or prioritize projects early on (e.g., in an Expenditure Plan or through Visioning and Principles), which limits the need for competitive selection. By limiting the competitive selection process though, these agencies find themselves in a less flexible situation should a new transformative project come up after the Expenditure Plan has been finalized. When competitive selections are needed, the peer agencies said that developing appropriate evaluation criteria is key, using a collaborative effort with the respective boards and sponsors to develop detailed scoring matrices so the results of the process can be easily understood and supported.
The peer agencies also made note of the importance of informing their Boards and the public about the uncertainties that are involved in the process, such as when revenue does not meet the projections and what that may mean for the projects in a region. They also pointed out that having flexibility built into the programs may help sponsors better deliver more projects, with a set of both committed and uncommitted funds in each project category. However, if there is too much flexibility, without funding commitments, then agencies run the risk of not being able to finish the projects they have started to fund.
EquityEquity was another topic raised by the peer agencies, both geographic and socioeconomic. Urban areas tend to receive more funding than rural areas, but by dividing local infrastructure funds (local streets and roads) by formula, each agency that is funded gets more discretion on how the funds will be spent. To address the socioeconomic inequities in funding, some agencies set aside additional points for projects that happen within specifically designated areas, such as Communities-of-Concern as is the practice of both SANDAG and MTC. Additionally, competitive projects can be assigned more points through specific equity criteria.
This Strategic Plan incorporates issues of equity using a variety of methods. Distribution of the Measure A Local Streets and Transportation and the Measure W
Local Investment Share program categories are by formula throughout the County, ensuring a relative equitable distribution of funding based on population and road miles. As noted in Section 6.3, the TA should take into consideration geographic and social equity to try and achieve an equitable distribution of investments.
Technical AssistanceFinally, the peer agencies provide different levels of technical assistance for local agencies that apply for funding. Similar to the TA, many of the peer agencies provided debriefs for agencies whose projects are not selected.
The TA currently provides technical assistance to highway program sponsors on a request basis and will considering expanding technical assistance efforts as noted in Section 6.1.
Key TakeawaysThe key takeaways from the peer review process include:
� Most peer agencies make long-term commitments per their Expenditure Plans and lead the implementation of those plans
� The agencies have competitive calls for some programs but not to the extent of the TA, which leaves those agencies with somewhat less flexibility for project implementation
� Opportunities to leverage external funds are maximized when peer agency goals and strategies are aligned
� The TA’s goals and principles align well with those in other regional transportation plans such as C/CAG’s Countywide Transportation Plan and MTC’s Plan Bay Area
4.4 A Financial Look-aheadTable 4-1 shows projected annual revenue on an annual basis through the 2020-2024 five-year timeframe of this Strategic Plan, and collected funding yet to be committed to projects, with projected new revenue from January 2019 through December 2033 (15 years) for Measure A program categories. It also shows projected revenue from July 2019 through June 2049 (30 years) for the Measure W program categories that the TA is tasked with administering.
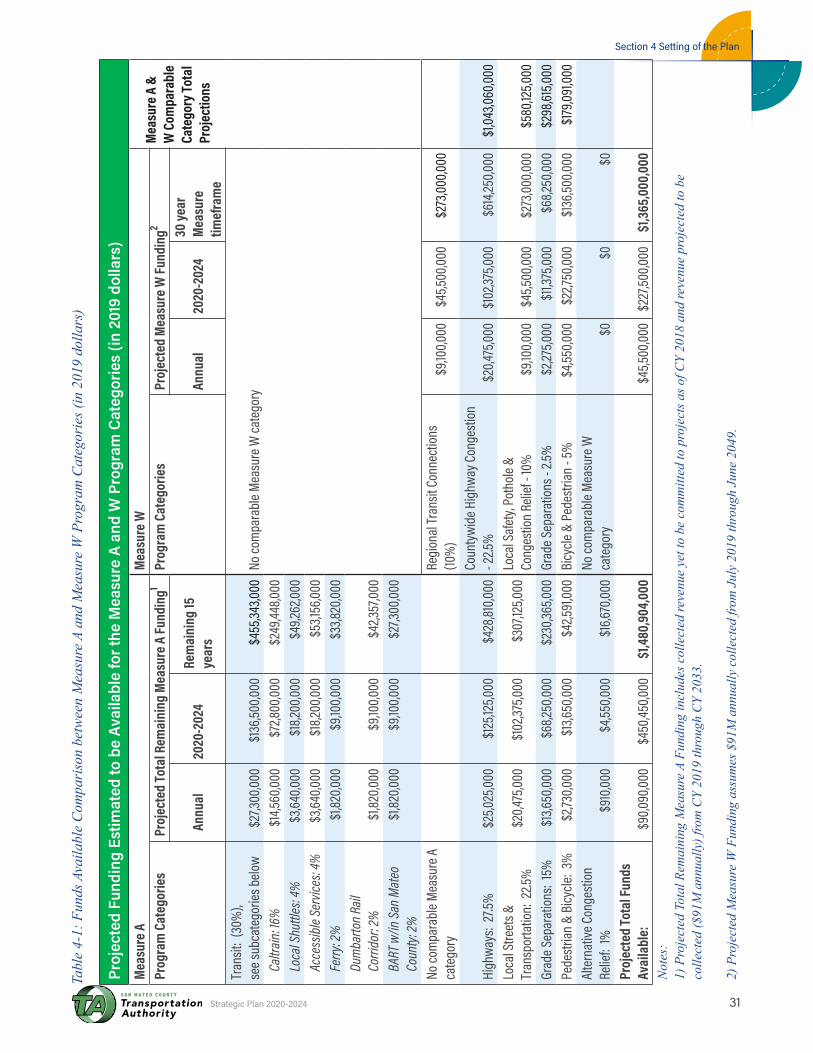
Section 4 Setting of the Plan
31Strategic Plan 2020-2024
Tabl
e 4-
1: F
unds
Ava
ilabl
e C
ompa
riso
n be
twee
n M
easu
re A
and
Mea
sure
W P
rogr
am C
ateg
orie
s (in
201
9 do
llars
)
Proj
ecte
d Fu
ndin
g Es
timat
ed to
be
Avai
labl
e fo
r the
Mea
sure
A a
nd W
Pro
gram
Cat
egor
ies
(in 2
019
dolla
rs)
Mea
sure
AM
easu
re W
M
easu
re A
&
W C
ompa
rabl
e Ca
tego
ry To
tal
Proj
ectio
ns
Prog
ram
Cat
egor
ies
Proj
ecte
d To
tal R
emai
ning
Mea
sure
A Fu
ndin
g1Pr
ogra
m C
ateg
orie
sPr
ojec
ted
Mea
sure
W Fu
ndin
g2
A
nnua
l20
20-2
024
Rem
aini
ng 15
ye
ars
An
nual
2020
-202
430
year
M
easu
re
timef
ram
eTr
ansit
: (30
%),
see s
ubca
tego
ries b
elow
$27,3
00,00
0$1
36,50
0,000
$455
,343,0
00No
com
para
ble M
easu
re W
cate
gory
C
altra
in: 16
%$1
4,560
,000
$72,8
00,00
0$2
49,44
8,000
L
ocal
Shut
tles:
4%$3
,640,0
00$1
8,200
,000
$49,2
62,00
0
Acc
essib
le Se
rvice
s: 4%
$3,64
0,000
$18,2
00,00
0$5
3,156
,000
F
erry
: 2%
$1,82
0,000
$9,10
0,000
$33,8
20,00
0
Dum
barto
n Rail
C
orrid
or: 2
%$1
,820,0
00$9
,100,0
00$4
2,357
,000
B
ART w
/in Sa
n Mat
eo
Cou
nty:
2%$1
,820,0
00$9
,100,0
00$2
7,300
,000
No co
mpa
rabl
e Mea
sure
A
cate
gory
Regi
onal
Tran
sit C
onne
ction
s (10
%)
$9,10
0,000
$4
5,500
,000
$273
,000,0
00
High
ways
: 27.5
%$2
5,025
,000
$125
,125,0
00$4
28,81
0,000
Coun
tywid
e Hig
hway
Con
gesti
on
- 22.5
%$2
0,475
,000
$102
,375,0
00
$614
,250,0
00
$1,04
3,060
,000
Loca
l Stre
ets &
Tr
ansp
orta
tion:
22.5
%$2
0,475
,000
$102
,375,0
00$3
07,12
5,000
Loca
l Saf
ety,
Poth
ole &
Co
nges
tion
Relie
f - 10
%$9
,100,0
00
$45,5
00,00
0 $2
73,00
0,000
$5
80,12
5,000
Grad
e Sep
arat
ions:
15%
$1
3,650
,000
$68,2
50,00
0$2
30,36
5,000
Grad
e Sep
arat
ions -
2.5%
$2,27
5,000
$1
1,375
,000
$68,2
50,00
0 $2
98,61
5,000
Pede
strian
& B
icycle
: 3%
$2,73
0,000
$13,6
50,00
0$4
2,591
,000
Bicy
cle &
Ped
estri
an -
5%$4
,550,0
00
$22,7
50,00
0 $1
36,50
0,000
$1
79,09
1,000
Alte
rnat
ive C
onge
stion
Re
lief:
1%$9
10,00
0$4
,550,0
00$1
6,670
,000
No co
mpa
rabl
e Mea
sure
W
cate
gory
$0$0
$0Pr
ojec
ted
Tota
l Fun
ds
Avai
labl
e:
$90,0
90,00
0$4
50,45
0,000
$1,4
80,9
04,0
00$4
5,500
,000
$227
,500,0
00$1
,365
,000
,000
Not
es:
1) P
roje
cted
Tot
al R
emai
ning
Mea
sure
A F
undi
ng in
clud
es c
olle
cted
reve
nue
yet t
o be
com
mitt
ed to
pro
ject
s as o
f CY
2018
and
reve
nue
proj
ecte
d to
be
colle
cted
($91
M a
nnua
lly) f
rom
CY
2019
thro
ugh
CY
2033
. 2)
Pro
ject
ed M
easu
re W
Fun
ding
ass
umes
$91
M a
nnua
lly c
olle
cted
from
Jul
y 20
19 th
roug
h Ju
ne 2
049.
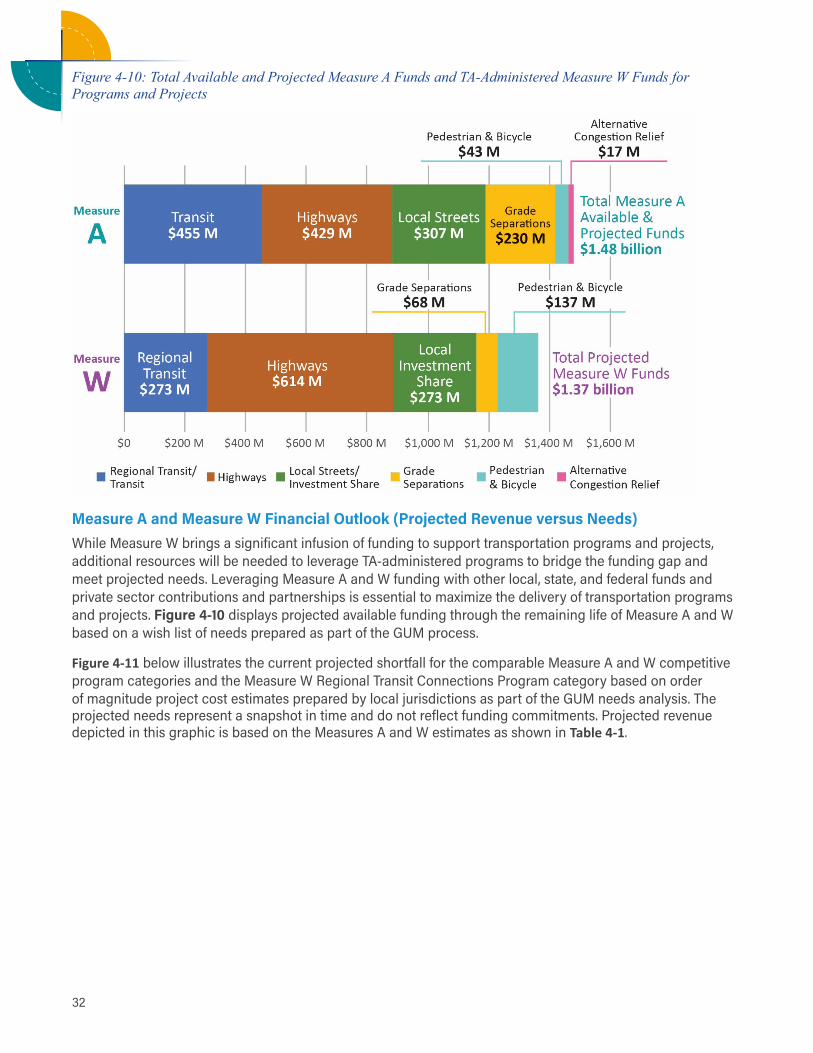
32
Figure 4-10: Total Available and Projected Measure A Funds and TA-Administered Measure W Funds for Programs and Projects
Measure A and Measure W Financial Outlook (Projected Revenue versus Needs)While Measure W brings a significant infusion of funding to support transportation programs and projects, additional resources will be needed to leverage TA-administered programs to bridge the funding gap and meet projected needs. Leveraging Measure A and W funding with other local, state, and federal funds and private sector contributions and partnerships is essential to maximize the delivery of transportation programs and projects. Figure 4-10 displays projected available funding through the remaining life of Measure A and W based on a wish list of needs prepared as part of the GUM process.
Figure 4-11 below illustrates the current projected shortfall for the comparable Measure A and W competitive program categories and the Measure W Regional Transit Connections Program category based on order of magnitude project cost estimates prepared by local jurisdictions as part of the GUM needs analysis. The projected needs represent a snapshot in time and do not reflect funding commitments. Projected revenue depicted in this graphic is based on the Measures A and W estimates as shown in Table 4-1.
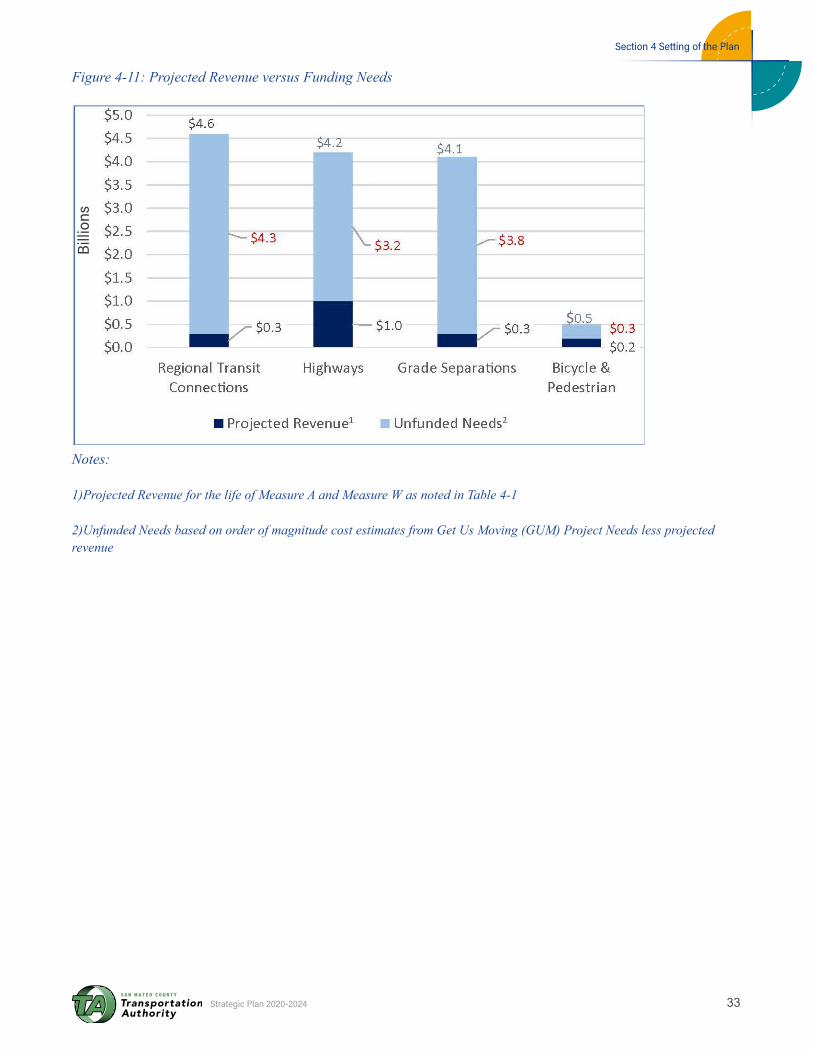
Section 4 Setting of the Plan
33Strategic Plan 2020-2024
Figure 4-11: Projected Revenue versus Funding Needs
Notes:
1)Projected Revenue for the life of Measure A and Measure W as noted in Table 4-1
2)Unfunded Needs based on order of magnitude cost estimates from Get Us Moving (GUM) Project Needs less projected revenue
Billi
ons

34
Page intentionally left blank
35Strategic Plan 2020-2024
Section 5 Plan Recommendations
The Strategic Plan development process and stakeholder and public outreach efforts helped determine that the TA’s current processes for project selection and project initiation and implementation generally work well. Project sponsors appreciate the flexibility of the program’s project delivery. The primary challenge in developing the Plan was the stakeholders’ desire to blend the project selection processes for the comparable competitive Measure A and Measure W programs into a single common process. It was also clear, from a legal standpoint and from the viewpoint of the stakeholders, that the common selection processes would need to fully comply with the distinct legislated differences between the comparable competitive programs and respect the 11 Core Principles of Measure W while addressing the Vision, Goals, and supporting objectives of Measure A.
Other program-wide and category specific challenges and opportunities were also identified, which are discussed in more detail in the following sections.
5.1 Measure A and Measure W Program-wide Challenges/Opportunities and RecommendationsThe Strategic Plan development process identified three main program-wide challenges/opportunities which are presented in the following section along with recommendations to address those challenges/opportunities:
Challenge/Opportunity 1 – Project SelectionThere is a fair amount of commonality between the two measures, especially for these comparable competitive programs: the Measure A Highways Program category and Measure W Countywide Highway Congestion Improvements Program category, the Measure A Pedestrian and Bicycle program category and Measure W Bicycle and Pedestrian Improvements Program category, and the Measure A Grade Separations program category and the grade separation portion of the Measure W Local Safety, Pothole & Congestion Relief Improvements Program category. The opportunity
exists, for purposes of efficiency, to consider shared project selection processes for the common competitive programs. Despite the similarities, there are differences between the measures that funding allocation decisions must respect.
The Measure W Core Principles build upon and expand the Measure A Goals and Vision with modern concepts that take a broader view of the integral relationship between transportation and quality of life, as well as themes that were not as prevalent during the reauthorization of Measure A. Concepts within the Measure W Core Principles, such as public health, planning for climate change, and performance-based metrics to encourage a reduction in SOV trips were not specified in the Measure A Expenditure Plan.
In turn, the Measure W Core Principles either do not address or assign the same level of significance to project readiness and funding leverage, which have been part of the Measure A competitive selection processes. Project readiness is not specifically identified in the Measure A Expenditure Plan, yet it is prevalent in the selection processes that the TA has developed for the administration of Measure A as a matter of good business practice to prioritize projects that are the most ready for implementation. While both measures promote the leveraging of external funding sources, the outcome of the process used in this Strategic Plan development process to weight the Core Principles and assign point values to evaluation criteria, as explained in Section 3.3, did not fully capture the importance of leveraging constrained TA resources.
Another key difference between the two measures is that the Measure W Congestion Relief Plan generally provides a greater degree of flexibility than the Measure A Expenditure Plan. For example, Measure A explicitly identifies eligible sponsors, while the determination of eligible Measure W sponsors will be established through the development of the TA Strategic Plan. Table 5-1 illustrates a few key legislated differences between the measures that must be respected for the comparable competitive highway and pedestrian and bicycle programs.
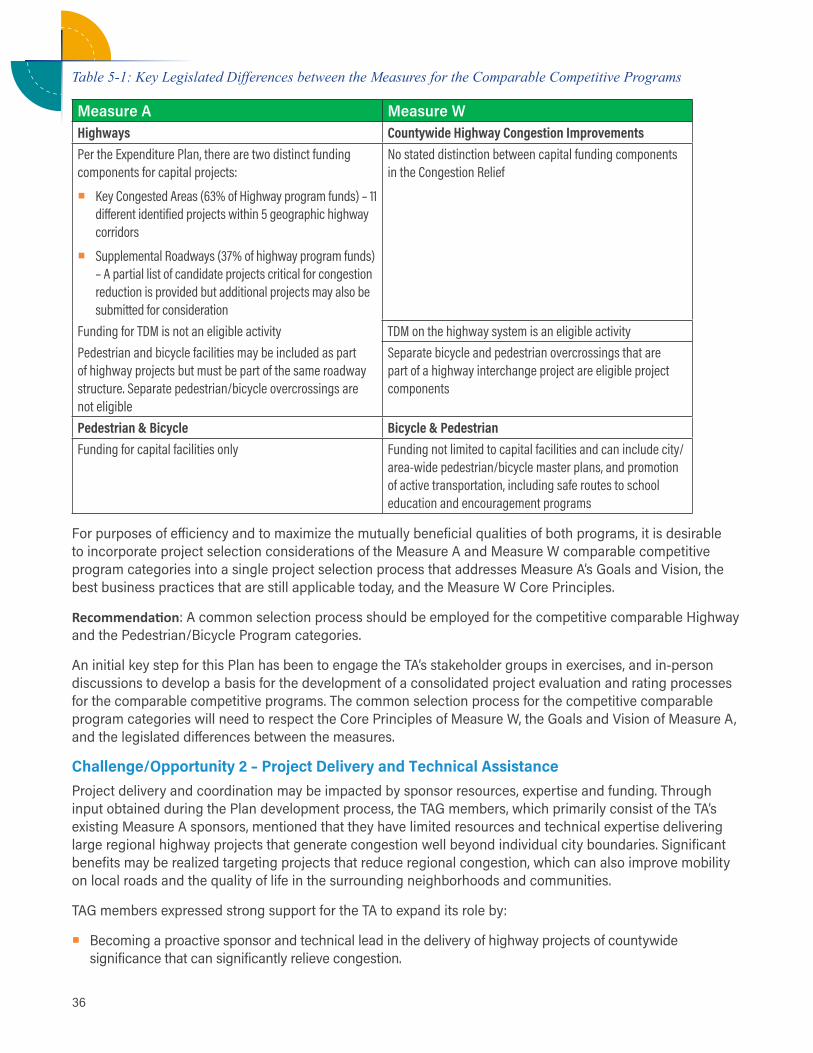
36
Table 5-1: Key Legislated Differences between the Measures for the Comparable Competitive Programs
Measure A Measure WHighways Countywide Highway Congestion ImprovementsPer the Expenditure Plan, there are two distinct funding components for capital projects:
� Key Congested Areas (63% of Highway program funds) – 11 different identified projects within 5 geographic highway corridors
� Supplemental Roadways (37% of highway program funds) – A partial list of candidate projects critical for congestion reduction is provided but additional projects may also be submitted for consideration
No stated distinction between capital funding components in the Congestion Relief
Funding for TDM is not an eligible activity TDM on the highway system is an eligible activityPedestrian and bicycle facilities may be included as part of highway projects but must be part of the same roadway structure. Separate pedestrian/bicycle overcrossings are not eligible
Separate bicycle and pedestrian overcrossings that are part of a highway interchange project are eligible project components
Pedestrian & Bicycle Bicycle & PedestrianFunding for capital facilities only Funding not limited to capital facilities and can include city/
area-wide pedestrian/bicycle master plans, and promotion of active transportation, including safe routes to school education and encouragement programs
For purposes of efficiency and to maximize the mutually beneficial qualities of both programs, it is desirable to incorporate project selection considerations of the Measure A and Measure W comparable competitive program categories into a single project selection process that addresses Measure A’s Goals and Vision, the best business practices that are still applicable today, and the Measure W Core Principles.
Recommendation: A common selection process should be employed for the competitive comparable Highway and the Pedestrian/Bicycle Program categories.
An initial key step for this Plan has been to engage the TA’s stakeholder groups in exercises, and in-person discussions to develop a basis for the development of a consolidated project evaluation and rating processes for the comparable competitive programs. The common selection process for the competitive comparable program categories will need to respect the Core Principles of Measure W, the Goals and Vision of Measure A, and the legislated differences between the measures.
Challenge/Opportunity 2 – Project Delivery and Technical AssistanceProject delivery and coordination may be impacted by sponsor resources, expertise and funding. Through input obtained during the Plan development process, the TAG members, which primarily consist of the TA’s existing Measure A sponsors, mentioned that they have limited resources and technical expertise delivering large regional highway projects that generate congestion well beyond individual city boundaries. Significant benefits may be realized targeting projects that reduce regional congestion, which can also improve mobility on local roads and the quality of life in the surrounding neighborhoods and communities.
TAG members expressed strong support for the TA to expand its role by:
� Becoming a proactive sponsor and technical lead in the delivery of highway projects of countywide significance that can significantly relieve congestion.
Section 5 Plan Recommendations
37Strategic Plan 2020-2024
� Expanding its role as provider of technical assistance, as resources permit to aid in the delivery of local sponsor projects.
Recommendation: To further improve project delivery, the TA should:
� Be proactive in identifying and sponsoring highway projects of countywide significance, while striking a balance with local needs. These projects and the amount of funding to be set aside for them should be addressed as part of the Short Range Highway Plan (SRHP) Update and the accompanying Capital Improvement Program (CIP) to fully assess current highway program needs.
� Consider expanding its role as resources permit, recognizing its own contract capacity, to help its sponsors advance project delivery. This can include any of the following actions:
– Offer technical assistance to sponsors, not limited to the highway program, through its on-call bench of consultants;
– Utilize consultant services to offer Complete Streets and other best practice workshops;
– Temporarily offer consultant services on request, when informed by sponsors of staff vacancies, to keep projects moving and minimize delay;
– Contracting with consultants to help sponsors obtain grant funds from external sources to better leverage Measure A and Measure W funds in addition to funding from their own local sources.
Challenge/Opportunity 3 – Assessment of Performance-based Evaluation Criteria for the Comparable Competitive Program Categories and the Measure W Regional Transit Connections Program CategoryWhen reviewing competing projects within a given funding category, it is often difficult to make a judgment as to which projects are the most deserving of funding and which projects should not receive funding. There is a need to provide for a more definitive, and when feasible, quantitative assessment of how a project may fare with regard to meeting evaluation criteria. However, there is also the reality that many project sponsors, particularly if a project is in the early stages of development, may not be able to provide the information needed to support the meaningful use of quantitative criteria. For
example, the Measure W Core Principle, “Facilitate the reduction of vehicle miles traveled (VMT), travel times and greenhouse gas emissions” is a specific performance-oriented Principle, which lends itself to quantitative analysis. However, it is unlikely at the initial conceptualization of a project that the project sponsor will have access to the data needed to calculate these metrics. The type of quantitative information needed typically becomes available when a project has reached the completion of the environmental phase of work.
There was a significant effort involving TA staff and SAG/TAG members in the Plan development process to identify evaluation criteria to be used in the project selection process for the comparable competitive funding categories and the Measure W Regional Transit Connections category. Many of these criteria are performance based and ideally would be the subject of a quantitative analysis. The lack of available support data may result in the need to provide more of a qualitative assessment for some of these criteria
There also is a need to assess how well the TA is meeting the Measure A Goals and Vision and Measure W Core Principles with the projects and programs that it is funding. This provides some of the justification for Initiative #10 in Section 8.
Recommendation: When quantitative information is not available, sponsors should provide a qualitative response to address performance-based criteria. The project evaluation process should strive to provide methods to use data sources that are readily available to allow a simplified initial assessment of performance for the quantifiable performance criteria. Projects that have reached the environmental phase should be subject to a more rigorous qualitative evaluation of performance. The process established under the Measure A Highway Program that provides greater weight on evaluation criteria under the thematic area of Need for projects that have yet to be environmentally and less weight for Effectiveness should be continued for large capital programs that go through a Call for Projects process, as further outlined in Section 6.5.
It is equally important to periodically assess whether the programs and projects that the TA funds are effectively meeting Measure A Goals and Vision and
38
Measure W Core Principles, as laid out in initiative #10 in Section 8. Information obtained from periodically assessing performance can be used to inform future investment decisions.
5.2 Category-specific Challenges/Opportunities and RecommendationsThe Strategic Plan development process also identified several category specific challenges/opportunities which are presented in the following section, along with recommendations to address the identifies challenges/opportunities:
Challenge/Opportunity 1 – Countywide Highway Congestion ImprovementsThere is a shortfall of projected Measure A and W funds to meet Highway Program needs as identified through the process described in Section 4.4. There is a need to balance the delivery of projects already in the funding pipeline with new projects to be selected for funding.
The Short Range Highway Plan 2011-2021 (SRHP) was the inaugural New Measure A document that provided guidance for making funding decisions within the Measure A Highway Program category. The TA at its September 2017 Board of Directors meeting recognized the funding shortfall that was known at that time and adopted policy revisions to the Highway Program project selection process that resulted in focusing the remaining Measure A Highway Program category funds on completing projects that have received previous funding allocations. The TA established a list of Highway Program Pipeline Projects in 2015, and, as part of Highway Program policy revisions approved in 2017, shifted the focus of the Call for Projects process to complete the Pipeline Projects. Pipeline projects are projects which are top priorities for the agency due to the need to complete work already started. A list of the Highway Pipeline Projects can be found in Appendix B. There has been substantial progress made funding many of the Pipeline Projects with roughly half of them being fully funded, including a few that have been completed. A few other projects were rescinded by sponsors and the remaining half are still in need of additional funding. Measure W brings a significant amount of additional funding for highways. With past progress made on many of the Measure A Pipeline Projects, an opportunity exists to
assess current projected needs and develop policy guidance for the expenditure of Measure W Highway Program category funds.
Measure W offers greater flexibility and opportunity in that it can fund Countywide TDM efforts to promote non-SOV trips and greater person throughput on the County’s highway system. The Countywide TDM/Commute Alternatives Program is listed as a sample candidate project within the Measure W Highway Program.
Recommendation: Update the existing SRHP and prepare a new CIP to assist in long-term policy guidance and financial planning for highway projects. The TA developed a Highway CIP based on a recommendation for the previous Strategic Plan Update and it is now appropriate and timely to create a new CIP that will incorporate projected funding from Measure W. A new subcategory for TDM/Commute Alternatives within the Measure W Highway Program should be created. The development of guidelines for this new subcategory should be coordinated with the development of the Alternative Congestion Relief/TDM Plan that is to be prepared for the Measure A Alternative Congestive Relief Program.
Challenge/Opportunity 2 – Bicycle/Pedestrian ProgramAs shown in Figure 4-10, there is a substantial amount of new funding in Measure W projected for bicycle and pedestrian improvements. There is an opportunity to allocate more funding to help advance the delivery of large transformational capital projects, such as pedestrian and bicycle overcrossings, in this program that did not previously exist. Measure W also provides flexibility for funds to be used for non-capital projects such as planning efforts and efforts to incentivize active transportation. The opportunity also exists to fund city/area-wide bicycle and pedestrian master plans and programs that promote and encourage active transportation. There was strong stakeholder support during the Plan development process to establish new funding subcategories for these activities, as funding permits.
Recommendation: The Call for Projects approach, which the TA has been successfully using in the Measure A Pedestrian/Bicycle Program, should also apply to the Measure W project selection. Separate
Section 5 Plan Recommendations
39Strategic Plan 2020-2024
subcategories should be created for:
� Large capital projects (approximately $1.0 million or greater)
� Small capital projects (approximately less than $1.0 million)
� Planning and marketing/promotion
� Safe Routes to Schools (SRTS) projects
The Bicycle and Pedestrian Program Evaluation Criteria in Appendix E should be used when determining funding allocations for capital projects from both Measure A and Measure W. The TA should use these criteria for the planning and marketing/promotion subcategory to the extent they are applicable; however, further work is needed to establish the guidelines for how funding will be allocated to projects and programs within this subcategory. The San Mateo County Office of Education (COE) has an existing SRTS discretionary grant program that is open to all public schools. For purposes of efficiency, the use of Measure W SRTS bicycle and pedestrian subcategory funds should be coordinated with the COE for integration within and potential expansion of their SRTS grant program.
Challenge/Opportunity 3 – Regional Transit ConnectionsThis is a new funding category in Measure W and there is no comparable program in Measure A. The intent of this program is to improve transit connectivity between the County and the region with a network of transit options, including commuter and heavy rail, water transit, and regional bus service. This program is unique in that it contains a wide variety of different transportation modes that will be competing for funding. There is a need to develop a comprehensive set of program guidelines that build off of the guidance and evaluation criteria that are contained in Appendix E of this Strategic Plan and further assess and analyze projected needs.
Recommendation: The TA should develop a Regional Transit Connections planning study and an accompanying CIP to assist in long-term policy guidance and financial planning.
Challenge/Opportunity 4 – Grade SeparationsThere is insufficient funding projected from the TA’s funding programs to fully separate all the existing
at-grade road-rail crossings in the County, let alone the grade separation projects that are currently in the Measure A funding pipeline. The Measure A Grade Separation Pipeline projects that have yet to be fully funded include Linden/Scott in South San Francisco/San Bruno, Broadway in Burlingame, and Ravenswood in Menlo Park. The new funding added by Measure W for grade separations is not sufficient to fund even one project; however, it could be used to supplement Measure A grade separation funds to help implement the three Measure A Grade Separation Pipeline projects that remain. There also is a need, however, to provide funding to start new grade separation projects, given the planned increase in Caltrain service levels outlined in the Caltrain Business Plan. The Peninsula Corridor Joint Power Board (JPB) will be embarking on a study that prioritizes grade separations on the Caltrain Corridor, which can help inform decisions regarding the allocation of funding for new grade separation projects.
Recommendation: Continue with the status quo for the Measure A program selection process – continue funding the Pipeline Projects with a set-aside to start new projects with the Planning phase of work. Measure W funds should be flexible and eligible to supplement funding needs for the existing Measure A Pipeline Projects and provide seed money for new projects using a Call-for-Projects process for planning and/or preliminary engineering/environmental work. The Measure W Call for Projects to begin funding new grade separation projects should take place after the JPB completes its planned study that prioritizes grade separations on the Caltrain Corridor. Minimum matching fund requirements for grade separation projects should be required to better leverage limited TA funding and will need to be substantial to better ensure geographic equity (see Section 7.2).
Challenge/Opportunity #5 - Local ShuttlesThe Measure A Shuttle Program has been ongoing for many funding cycles through a joint Call for Projects with C/CAG and the process has worked well. Recently the ability to deliver service has become more challenging for the program sponsors. While difficulty in hiring and retaining operators is not new, these problems have become far more acute during the past year due to strong economic growth and increased competition from the private sector
40
for private bus service. The cost of contracting for the operation of shuttles has increased well beyond the rate of the Consumer Price Index (CPI). Shuttle sponsors have had to voluntarily suspend some shuttles and service reliability on others has declined with an increase in no-shows.
Recommendation: SamTrans will be preparing a shuttle study in FY 2020 to assess the existing local shuttle program and consider more cost-effective approaches to meeting local mobility needs. The TA should consider recommendations made from this study for implementation in future Shuttle Calls for Projects.
Challenge/Opportunity #6 – Alternative Congestion Relief/TDMThere is a relatively small amount of money available to the Measure A Alternative Congestion Relief Program (1 percent) to fund commute alternatives and planning of intelligent transportation systems (ITS). Historically allocations from this funding category have primarily supported Commute.org’s ongoing annual TDM work programs. It is important to note though that cities and the County are also eligible sponsors for this program and that a fair amount of funding from this category (approximately $3 million) remains in a reserve. During the prior Strategic Plan, a recommendation was made to
prepare an Alternative Congestion Relief Plan to help determine potential projects and the basis for initiating and selecting projects to be implemented with these funds.
On a related note, the US 101 Mobility Action Plan that is currently being developed, further described in Section 4.2, will be providing a comprehensive set of near-term, policy and TDM concepts that may include transit subsidies, carpool programs, improved bicycle connections, and other incentives or disincentives to reduce travel demand of single-occupancy vehicle trips and/or to shift trip demand to off peak periods along the 101 Corridor. In addition, this Strategic Plan also recommends that a separate TDM subcategory be created within the Measure W Highway Program to be used for TDM/commute alternatives.
Recommendation: A Countywide Alternative Congestion Relief/TDM Plan will be developed, considering recommendations from the US 101 Mobility Action Plan as an input in conjunction, with key external stakeholders. The Countywide Alternative Congestion Relief/TDM Plan will serve as a guide for initiating and selecting projects to be implemented under the Measure A Alternative Congestion Relief Program and the Measure A Highway TDM subcategory.
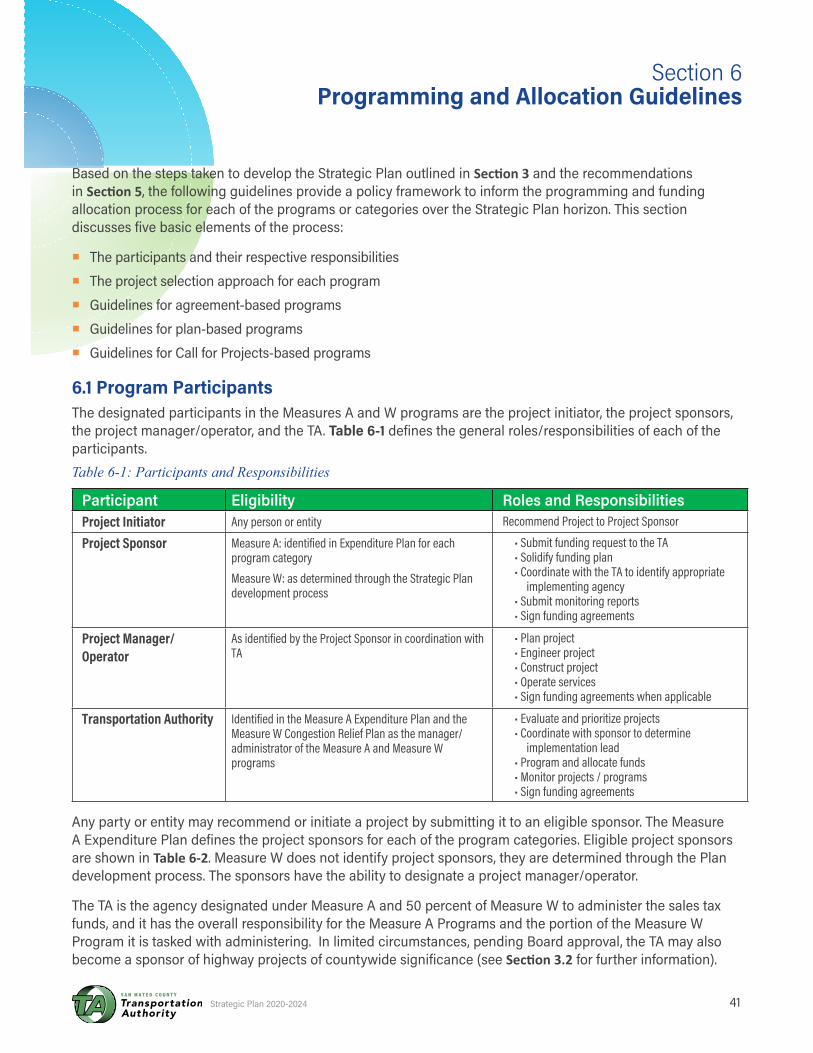
41Strategic Plan 2020-2024
Based on the steps taken to develop the Strategic Plan outlined in Section 3 and the recommendations in Section 5, the following guidelines provide a policy framework to inform the programming and funding allocation process for each of the programs or categories over the Strategic Plan horizon. This section discusses five basic elements of the process:
� The participants and their respective responsibilities
� The project selection approach for each program
� Guidelines for agreement-based programs
� Guidelines for plan-based programs
� Guidelines for Call for Projects-based programs
6.1 Program ParticipantsThe designated participants in the Measures A and W programs are the project initiator, the project sponsors, the project manager/operator, and the TA. Table 6-1 defines the general roles/responsibilities of each of the participants. Table 6-1: Participants and Responsibilities
Participant Eligibility Roles and ResponsibilitiesProject Initiator Any person or entity Recommend Project to Project Sponsor
Project Sponsor Measure A: identified in Expenditure Plan for each program categoryMeasure W: as determined through the Strategic Plan development process
• Submit funding request to the TA• Solidify funding plan• Coordinate with the TA to identify appropriate
implementing agency• Submit monitoring reports • Sign funding agreements
Project Manager/Operator
As identified by the Project Sponsor in coordination with TA
• Plan project• Engineer project• Construct project• Operate services• Sign funding agreements when applicable
Transportation Authority Identified in the Measure A Expenditure Plan and the Measure W Congestion Relief Plan as the manager/administrator of the Measure A and Measure W programs
• Evaluate and prioritize projects• Coordinate with sponsor to determine
implementation lead • Program and allocate funds• Monitor projects / programs• Sign funding agreements
Any party or entity may recommend or initiate a project by submitting it to an eligible sponsor. The Measure A Expenditure Plan defines the project sponsors for each of the program categories. Eligible project sponsors are shown in Table 6-2. Measure W does not identify project sponsors, they are determined through the Plan development process. The sponsors have the ability to designate a project manager/operator.
The TA is the agency designated under Measure A and 50 percent of Measure W to administer the sales tax funds, and it has the overall responsibility for the Measure A Programs and the portion of the Measure W Program it is tasked with administering. In limited circumstances, pending Board approval, the TA may also become a sponsor of highway projects of countywide significance (see Section 3.2 for further information).
Section 6 Programming and Allocation Guidelines
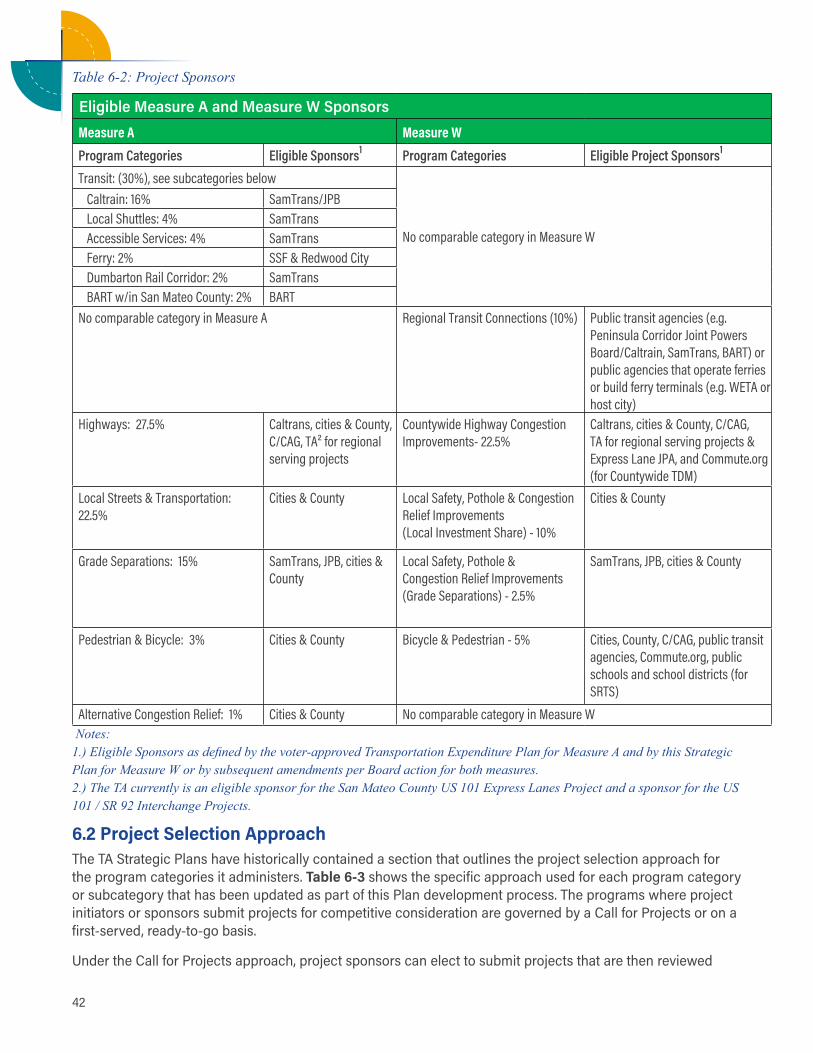
42
Table 6-2: Project Sponsors
Eligible Measure A and Measure W Sponsors Measure A Measure W Program Categories Eligible Sponsors1 Program Categories Eligible Project Sponsors1
Transit: (30%), see subcategories below
No comparable category in Measure W
Caltrain: 16% SamTrans/JPB Local Shuttles: 4% SamTrans Accessible Services: 4% SamTrans Ferry: 2% SSF & Redwood City Dumbarton Rail Corridor: 2% SamTrans BART w/in San Mateo County: 2% BARTNo comparable category in Measure A Regional Transit Connections (10%) Public transit agencies (e.g.
Peninsula Corridor Joint Powers Board/Caltrain, SamTrans, BART) or public agencies that operate ferries or build ferry terminals (e.g. WETA or host city)
Highways: 27.5% Caltrans, cities & County, C/CAG, TA² for regional serving projects
Countywide Highway Congestion Improvements- 22.5%
Caltrans, cities & County, C/CAG, TA for regional serving projects & Express Lane JPA, and Commute.org (for Countywide TDM)
Local Streets & Transportation: 22.5%
Cities & County Local Safety, Pothole & Congestion Relief Improvements (Local Investment Share) - 10%
Cities & County
Grade Separations: 15% SamTrans, JPB, cities & County
Local Safety, Pothole & Congestion Relief Improvements (Grade Separations) - 2.5%
SamTrans, JPB, cities & County
Pedestrian & Bicycle: 3% Cities & County Bicycle & Pedestrian - 5% Cities, County, C/CAG, public transit agencies, Commute.org, public schools and school districts (for SRTS)
Alternative Congestion Relief: 1% Cities & County No comparable category in Measure W Notes:1.) Eligible Sponsors as defined by the voter-approved Transportation Expenditure Plan for Measure A and by this Strategic Plan for Measure W or by subsequent amendments per Board action for both measures. 2.) The TA currently is an eligible sponsor for the San Mateo County US 101 Express Lanes Project and a sponsor for the US 101 / SR 92 Interchange Projects.
6.2 Project Selection ApproachThe TA Strategic Plans have historically contained a section that outlines the project selection approach for the program categories it administers. Table 6-3 shows the specific approach used for each program category or subcategory that has been updated as part of this Plan development process. The programs where project initiators or sponsors submit projects for competitive consideration are governed by a Call for Projects or on a first-served, ready-to-go basis.
Under the Call for Projects approach, project sponsors can elect to submit projects that are then reviewed
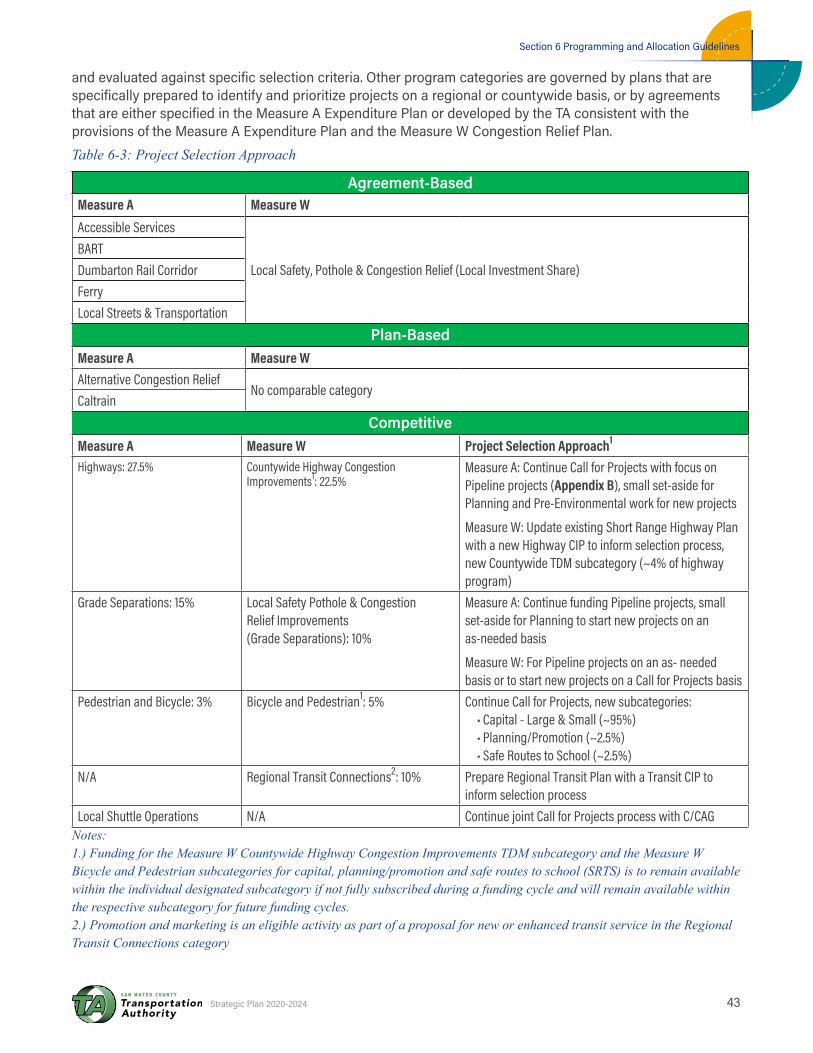
Section 6 Programming and Allocation Guidelines
43Strategic Plan 2020-2024
and evaluated against specific selection criteria. Other program categories are governed by plans that are specifically prepared to identify and prioritize projects on a regional or countywide basis, or by agreements that are either specified in the Measure A Expenditure Plan or developed by the TA consistent with the provisions of the Measure A Expenditure Plan and the Measure W Congestion Relief Plan.Table 6-3: Project Selection Approach
Agreement-BasedMeasure A Measure WAccessible Services
Local Safety, Pothole & Congestion Relief (Local Investment Share)BARTDumbarton Rail CorridorFerryLocal Streets & Transportation
Plan-BasedMeasure A Measure WAlternative Congestion Relief
No comparable categoryCaltrain
Competitive Measure A Measure W Project Selection Approach1
Highways: 27.5% Countywide Highway Congestion Improvements1: 22.5%
Measure A: Continue Call for Projects with focus on Pipeline projects (Appendix B), small set-aside for Planning and Pre-Environmental work for new projects
Measure W: Update existing Short Range Highway Plan with a new Highway CIP to inform selection process, new Countywide TDM subcategory (~4% of highway program)
Grade Separations: 15% Local Safety Pothole & Congestion Relief Improvements (Grade Separations): 10%
Measure A: Continue funding Pipeline projects, small set-aside for Planning to start new projects on an as-needed basis
Measure W: For Pipeline projects on an as- needed basis or to start new projects on a Call for Projects basis
Pedestrian and Bicycle: 3% Bicycle and Pedestrian1: 5% Continue Call for Projects, new subcategories:• Capital - Large & Small (~95%)• Planning/Promotion (~2.5%)• Safe Routes to School (~2.5%)
N/A Regional Transit Connections2: 10% Prepare Regional Transit Plan with a Transit CIP to inform selection process
Local Shuttle Operations N/A Continue joint Call for Projects process with C/CAG Notes: 1.) Funding for the Measure W Countywide Highway Congestion Improvements TDM subcategory and the Measure W Bicycle and Pedestrian subcategories for capital, planning/promotion and safe routes to school (SRTS) is to remain available within the individual designated subcategory if not fully subscribed during a funding cycle and will remain available within the respective subcategory for future funding cycles. 2.) Promotion and marketing is an eligible activity as part of a proposal for new or enhanced transit service in the Regional Transit Connections category
44
6.3 Agreement-basedThese programs and projects are not subject to a competitive project selection process governed by the TA. They include the following program categories or subcategories:
� Measure A
– Transit : Accessible Services
– Transit: BART within San Mateo County
– Transit: Ferry
– Transit: Dumbarton Rail Corridor
– Local Streets and Transportation
� Measure W
– Local Safety, Pothole & Congestion Relief (Local Investment Share)
Measure ATransit: Accessible ServicesFor the Transit: Accessible Services program, four percent of funding is committed to the continuation and expansion of paratransit services operated by SamTrans as Redi-Wheels and RediCoast. The TEP allows for other supplemental services to be funded within this program. To date, these services have not yet been identified by SamTrans. If such services are identified in the future, they will be considered for funding in this category. Four percent of Measure A sales tax revenues will be allocated to SamTrans on an annual basis.
Transit: BARTFor the Transit: BART within the San Mateo County program – as outlined in an agreement with BART, SamTrans, and the TA – two percent of Measure A sales tax revenues will be allocated to BART on an annual basis.
Transit: FerryThe TA is committed to providing two percent of Measure A funding for ferry services, with the Cities of South San Francisco and Redwood City as the designated sponsors. The City of South San Francisco started operating ferry service in 2012, while there is currently a planning and feasibility study underway in Redwood City to determine the terminal location and service area.
Transit: Dumbarton Rail CorridorThe TA is committed to providing two percent of
Measure A funding to the Dumbarton Rail Corridor, with SamTrans designated as project sponsor. Completion of the environmental document for this project is on hold pending the identification of a funding plan.
Local Streets and Transportation ProgramFor the Local Streets and Transportation Program, the TA is committed to providing 22.5 percent of Measure A funding to the County and its cities for local transportation facility maintenance and improvement. The specific amount for each entity is determined based on the formula of 50 percent by population and 50 percent by road mileage within each jurisdiction. The TA will update the road miles and population figures annually based on California Department of Transportation and Department of Finance data.
Measure WLocal Safety, Pothole & Congestion Relief Improvements (Local Investment Share)Ten percent of the Measure W tax proceeds will be disbursed to each of the cities and the County using the same formula as the Measure A Local Streets and Transportation Program. Funds may be used for the following transportation investments, which include but are not limited to:
� Implementing advanced technologies and communications on the roadway system
� Improving local streets and roads by paving streets and repairing potholes
� Promoting alternative modes of transportation, which may include funding shuttles or sponsoring carpools, bicycling, and pedestrian programs
� Planning and implementing traffic operations and safety projects, including signal coordination, bicycle/pedestrian safety projects, and separation of roadways crossing the Caltrain rail corridor
If a city or the County has a Pavement Condition Index (PCI) score of less than 70, it must use tax proceeds under this Category exclusively for projects that will increase their score until it reaches 70 or greater.
Programming, Allocation and Monitoring ProcessThe programming and allocations process for the agreement-based programs includes the following steps:
Section 6 Programming and Allocation Guidelines
45Strategic Plan 2020-2024
� Staff Recommendation - Prior to the beginning of each fiscal year (July 1-June 30), the TA will estimate the amount of projected revenues available for the programs and projects. Based on these estimates, TA staff will make a programming and allocation recommendation to the Board.
� TA Board Consideration - The Board will consider the recommendations as part of the annual TA budgeting process. Board approval will allow staff to allocate the money and complete the annual funding commitment.
� Funding Agreements - Funds from the agreement-based programs are distributed based on the conditions in the funding recipients’ respective funding agreements. The funding agreement outlines the understanding between the funding recipient and the TA regarding the amount of funding, purpose of the funds, payment terms, any applicable reporting requirements, and other relevant obligations. BART and recipients of Measure A Local Streets and Transportation Program funding currently receive funds directly from the County Controller. The cities and County will receive funds directly from the TA for Measure W Local Safety, Pothole & Congestion Relief (Local Investment Share) project.
� Monitoring Report Submittals – Project sponsors receiving funding from the Measure A Dumbarton Rail Corridor and Ferry Program categories will be required to submit monitoring reports to inform on the status of project scope, schedule, budget, project performance and effectiveness. Project sponsors from the Measure A Local Streets and Transportation Program category and the Measure W Local Investment Share component of the Local Safety, Pothole and Congestion Relief Improvements Program category are required to submit annual reports to inform the TA of projects funded. Local Investment Share funding sponsors are also required to report on how funded projects met one or more of the Measure W Core Principles and how they considered their Complete Streets policies in the use of the funds.
6.4 Plan-basedThe plan-based approach requires the development of a plan for a specific category, which will include a comprehensive list of capital and/or operating projects that need to be implemented to meet the goals of that category. The TA and the project sponsor
will use the Plan to aggressively leverage external funding to implement the entire program. Measure A program categories or subcategories include:
� Alternative Congestion Relief Programs
� Transit: Caltrain
Measure AAlternative Congestion Relief The TA, in conjunction with its external stakeholders, will be preparing an Alternative Congestion Relief Plan that will serve as a basis for project evaluation and the selection process.
Transit: CaltrainCaltrain is designated as the recipient in this category. At least 50 percent of the annual funding allocation from Measure A can be designated for capital projects and no more than 50 percent can be used for operations. The allocation of project funding will be based on the Caltrain Short Range Transit Plan (SRTP), which the JPB is required to prepare in order to receive federal and state funding. The SRTP and the annual Caltrain budgeting process will provide the basis for determining funding allocations needed for Caltrain.
Measure WThere are no Plan-based programs under Measure W.
Programming, Allocation and Monitoring ProcessThe programming and allocations processes for plan-based programs and projects are as follows:
� Staff Recommendation - Prior to the beginning of each fiscal year (July 1 – June 30), the eligible project sponsors within these categories will submit funding requests to the TA, and the TA will consider such requests within the projected revenues available for these programs. TA staff will make a programming and allocation recommendation to the Board.
� TA Board Consideration - The Board will consider the recommendations as part of the annual TA budgeting process. Board approval will allow staff to allocate the money and complete the funding commitment.
� Funding Agreements - Prior to receiving any disbursements of funds, the receiving entity will need to execute a funding agreement with the
46
TA. The standard funding agreement outlines the understanding between the funding recipient and the TA regarding the amount of funding, purpose of the funds, payment terms, any applicable reporting requirements, and other obligations connected to the receipt of funding.
� Monitoring Report Submittals – In order to track progress and ensure appropriate and efficient use of funds, sponsors are required to submit monitoring reports to inform on the status of project scope, schedule, budget, project performance and effectiveness.
6.5 CompetitiveCompetitive programs are those in which new projects proposed within each program category will compete for funding. The competitive programs include:
� Measure A
– Transit – Shuttles
– Highways
– Pedestrian and Bicycle Facilities
– Grade Separations
� Measure W
– Countywide Highway Congestion Improvements
– Pedestrian and Bicycle Facilities
– Grade Separations
– Regional Transit Connections
Measure ATransit: ShuttlesSamTrans is the TEP-designated sponsor for the Local Shuttle Program but has historically permitted other public agencies to apply by obtaining a Letter of Concurrence stating that the proposed shuttle route does not duplicate SamTrans fixed-route or other public shuttle service. Potential enhancements to the evaluation and project selection process, which currently is on a Call for Projects basis held jointly with C/CAG, will be made after SamTrans completes a shuttle study in FY 2020. The Study will assess program delivery and performance and other potential cost-effective approaches to meeting local mobility needs.
HighwaysThe Highway Program category consists of two
components:
� Key Congested Areas (KCA) – Specific projects that are defined in the Measure A TEP.
� Supplemental Roadway Projects (SR) – A partial list of candidate projects that are defined in the Measure A TEP. Sponsors may put forward other projects through the project selection process.
The Call for Projects process will continue with a focus on the Measure A Highway Pipeline projects as identified in Appendix B. As part of subsequent initiatives, the SRHP (2012-2021) will be updated and a new Highway CIP will be prepared to better inform the project selection process for the use of Measure W Countywide Highway Congestion Improvements Program category funding.
Pedestrian and BicycleA partial list of Measure A candidate projects is identified in the TEP. The existing capital Call for Projects selection process will continue. Per strong support from the Plan TAG, there will be separate subcategories for small and large capital projects as funding permits. This plan envisions that a single funding Call for Projects will be held for the Measure A and W capital pedestrian and bicycle program.
Grade SeparationsThe Measure A Grade Separations Program category will continue with the focus on funding Pipeline Projects with a set-aside to start new projects. The project selection process is on a first-come, first-served, ready-to-go basis.
Measure WCountywide Highway Congestion ImprovementsTax proceeds will be invested in highway projects throughout the County designed to: provide congestion relief; reduce travel times; increase person throughput; improve highway and interchange operations, safety, and access; and deploy advanced technologies and communications on the highways. The focus of this program is on highways and highway interchanges, although projects that alleviate congestion on connecting arterial streets that impact the highway system are also eligible. An update to the existing SRHP and an accompanying CIP will be prepared to better inform the competitive selection process for this program. Per strong support from the SAG, a separate TDM
Section 6 Programming and Allocation Guidelines
47Strategic Plan 2020-2024
subcategory is being created for this program to encourage non-SOV trips and off peak trip demand. A Countywide Alternative Congestion Relief/TDM Plan will be prepared that will serve as a guide for initiating and selecting projects for the competitive TDM subcategory.
Grade SeparationsMeasure W Tax proceeds can be invested to supplement the existing Measure A Pipeline projects on an as-needed basis or to start new projects on a Call for Projects basis. Future Calls for Projects are anticipated to occur after Caltrain completes a study that will prioritize Caltrain grade separations.
Bicycle & Pedestrian ImprovementsPriority will be given to projects that are designed to help reduce traffic congestion by safely connecting communities and neighborhoods with schools, transit, and employment centers; fill gaps in the existing bicycle and pedestrian network; safely cross barriers such as major roads, rail corridors, and highways; improve existing facilities to make them safer and more accessible for cyclists and pedestrians; and make walking or biking a safer and more convenient option.
Per strong support from the TAG, and as sufficient funding permits, there will be three separate subcategories: 1) large and small capital projects, 2) city- and area-wide planning/promotion and marketing, and 3) SRTS projects.
Allocations for these subcategories will go through a Call for Projects process. The project selection process for the SRTS subcategory will be coordinated with the COE.
Regional Transit ConnectionsTax proceeds will be invested in infrastructure and services that are designed to improve transit connectivity between the County and the nine-county Bay Area region. Investments from this category will be prioritized based on a project’s ability to reduce congestion and enhance mobility options by connecting the County to the rest of the region, and a project’s support through public-private partnerships . This program is somewhat unique in that it can fund a variety of different transit modes. A Regional Transit Connections planning study and an accompanying Transit CIP will be prepared to better inform the competitive selection process for this
program. It is important to note that promotion and marketing is an eligible activity as part of a proposal for new or enhanced service in this category to help support and establish a successful ridership base. The planning study will incorporate guidance for how this may be applied.
Call for Projects ProcessThe process for programming and allocating funding from the competitive programs that are not on a first-come, first-serve, ready-to-go-basis consists of the TA issuing a Call for Projects, followed by project evaluation and prioritization.
� Call for Projects: The TA will issue a Call for Projects by program requesting project sponsor(s) to submit projects for funding consideration. The frequency of the Call for Projects will differ by program. The specific funding cycles for the programs are to be determined based on funding availability, program need, program readiness and for Measure W funding, after the noted initiatives from the section above are completed, to better inform the selection process. When scheduling a Call for Projects funding cycle, the TA shall consider the timing of the request in relationship to the timing of other federal, state, and regional funding programs in order to maximize the opportunities for obtaining funds from these sources.
� Project Evaluation and Prioritization: The TA assembles Project Review committees to evaluate project applications and proposals. The review is based on criteria outlined in the Call for Projects. The five general categories of criteria that are considered for project evaluation and selection: Need, Effectiveness, Sustainability, Readiness, and Funding Leverage are discussed below and are also listed in Appendix E. Evaluation criteria under the thematic areas of Readiness and Funding Leverage are either not addressed (Readiness) or deserve greater emphasis (Funding Leverage) than the Measure W focus as described in Section 3.2. A more detailed listing of evaluation criteria for the competitive funding categories is contained in Appendix E. The criteria for each of the competitive funding programs may be modified, subject to Board approval, to retain flexibility and account for new policy directives, initiatives, and legislation that further promotes TEP goals.
48
– Readiness: As an initial step, the TA assesses readiness. Did the sponsor submit a complete and coherent proposal? Is the proposed scope ready to proceed and how shovel-ready is it? Readiness also measures the level of public and stakeholder support and viability of the project to be funded. Key indicators include the quality of the planning process that occurred to define the project, level of community engagement/stakeholder and public support, schedule and project status, and availability of resources to implement the project. Where program guidelines dictate, did the sponsor coordinate with the TA to identify the entity best suited to carry out project implementation?
– Need: From the onset, the TA must establish the need for a project to consider it for funding before reviewing it for policy consistency. Is the project consistent with the goals of the Measure A TEP or either or both of the Congestion Relief Plan and the Countywide Transportation Plan? Does it support the policies of the sponsoring city’s General Plan, Specific Plans, and other relevant planning and programming documents? What and how critical is the mobility and/or safety issue that is to be addressed? How does this project contribute to a larger public goal?
– Effectiveness:- The TA will use effectiveness criteria to evaluate the performance merits of the project. If the TA invests in a major highway improvement, how much congestion will be relieved and what is the level of person throughput? If it invests in a grade separation, how much does it improve safety and reduce local traffic congestion? If the TA invests in a pedestrian/bicycle bridge, how many pedestrians and bicyclists are going to use it? If it invests in a new shuttle service, how many new riders are going to use it? If it funds a new regional transit service, what is the projected ridership? How cost effective and seamless will it be with other connecting services? Effectiveness criteria will help measure benefits against the cost of building and implementing a project.
– Sustainability: The TA will assess the impact a project may have on promoting practices that maintain and/or improve the environment and quality of life for all on a long-term basis. What is the project’s impact on the immediate ecosystem as well as the greater environment?
Can the impacts be mitigated? Does the project support transit-oriented development? Are land use and transportation decisions linked together to achieve efficient transportation options? For capital projects, are materials being used that promote long life cycles and reduce maintenance costs? Where applicable, what is the marketing plan to promote the service? The TA will consider sustainability principles and practices in the planning, implementation, and operation of projects.
– Funding Leverage: The TA will measure the level of financial commitment to a project. Has the sponsor committed matching funds to the project, and if so, how much? Does the match include any contribution from the private sector?
Geographic and Social Equity The Measure A and Measure W programs are countywide efforts that should take into consideration a relative equitable distribution of investments to help ensure all areas of the County, and all socio-economic groups within it, receive a proportionate share of the transportation benefits and that no area is disproportionately adversely impacted.
� Staff Recommendation: Staff develops project funding recommendations for Board consideration, which is based on the review of the Project Review Committees when projects go through a Call for Projects process. Recommendations are clearly anchored to the program-specific project evaluation and prioritization criteria.
� TA Board Approval: The TA Board takes action on the programming of Measure A and Measure W funding. This ensures commitment to the project. Either concurrent with the programming or in a separate action, the Board will allocate funding as part of the TA’s annual budget approval process. This action ensures timely availability of funds.
� Funding Agreements: Prior to receiving any disbursements of funds, the recipient is required to execute a funding agreement, or in the case of multiple sponsors or implementing public agencies, recipients enter into a memorandum of understanding with the TA. The standard funding agreement outlines the understanding between the funding recipient and the TA regarding the amount of funding, purpose of the funds, payment terms, reporting requirements and other obligations
Section 6 Programming and Allocation Guidelines
49Strategic Plan 2020-2024
connected to the receipt of funding. Memoranda of understanding (MOUs) also define the roles and responsibilities of the sponsors and implementing public agencies.
� Monitoring Report Submittals: Project Sponsors will be required to submit monitoring reports to track progress and ensure appropriate and efficient use of Measure A and Measure W funds.
– Capital Projects - Project Sponsors will be required to submit monitoring reports during the planning, design development, and construction of capital projects. The content of the reports will be focused on project scope, schedule, and budget. Post-construction, the TA will monitor the use and effectiveness of the projects as part of performance metrics that will be used to confirm that plan goals are being met. This information will also be used to inform future investment decisions.
– Operating Projects - Project Sponsors will be required to submit performance reports for operating projects. Sample performance measures include service effectiveness, service quality, and customer satisfaction. This monitoring program will assist the TA in justifying the continued funding for approved operating projects. If performance measures indicate less than acceptable performance, the TA will work with the Project Sponsor to set up a mitigation program and achieve improvements as a condition of continued funding from the Measure A Program.

50
Page intentionally left blank
51Strategic Plan 2020-2024
Section 7 Funds Management
In addition to defining the process for funding allocation and programming, the TA is charged with responsibly managing the Measure A and the TA-administered portion of the Measure W transportation sales tax revenues. The TA is actively involved with leveraging funds to achieve the goals of the 2004 Measure A Expenditure Plan while adhering to Measure W Core Principles. The TA will focus on programming and allocating funds to projects as money becomes available and maximizing matching funds to increase the total investment in County transportation infrastructure and services. The TA will treat requests for the advancement of funds as exceptions to the rule; project sponsors must justify requests with compelling reasons that offset the impact of financing fees and/or timing of funds to other projects.
7.1 Measure A and Measure W FundingThe TA will develop CIPs for the Highways and Regional Transit Connections Program categories to better assess the magnitude of potential expenditure needs with respect to the flow of measure revenues and the potential availability of matching funds. The CIPs will provide further details on an order of magnitude basis and will be prepared in conjunction with planning studies as noted in Section 5.1 that will further assess how the TA will conduct the competitive processes for these categories. The TA will determine the timing of the funding cycles for these categories by considering the collection of sales tax revenues, the timing of project needs, and other external funding opportunities. The TA will fine-tune the CIPs on an ongoing basis by identifying prioritized projects and continually monitoring local and countywide short- and long-term needs and program readiness.
7.2 Matching FundsNavigating through the network of external funding and securing matching funds is complicated. A representative summary of existing federal, state, and local funding programs that can be leveraged with Measure A and Measure W funding is contained in Appendix G, although these programs are subject to change. Regional funds are treated as local funds. As resources permit, the TA will work with project sponsors to maximize the amount of matching funds secured for each project. Table 7-1 shows the minimum matching fund requirements for the comparable program categories and the Measure W Regional Transit Connections Program category and the Measure A Transit Program, Local Shuttles component.
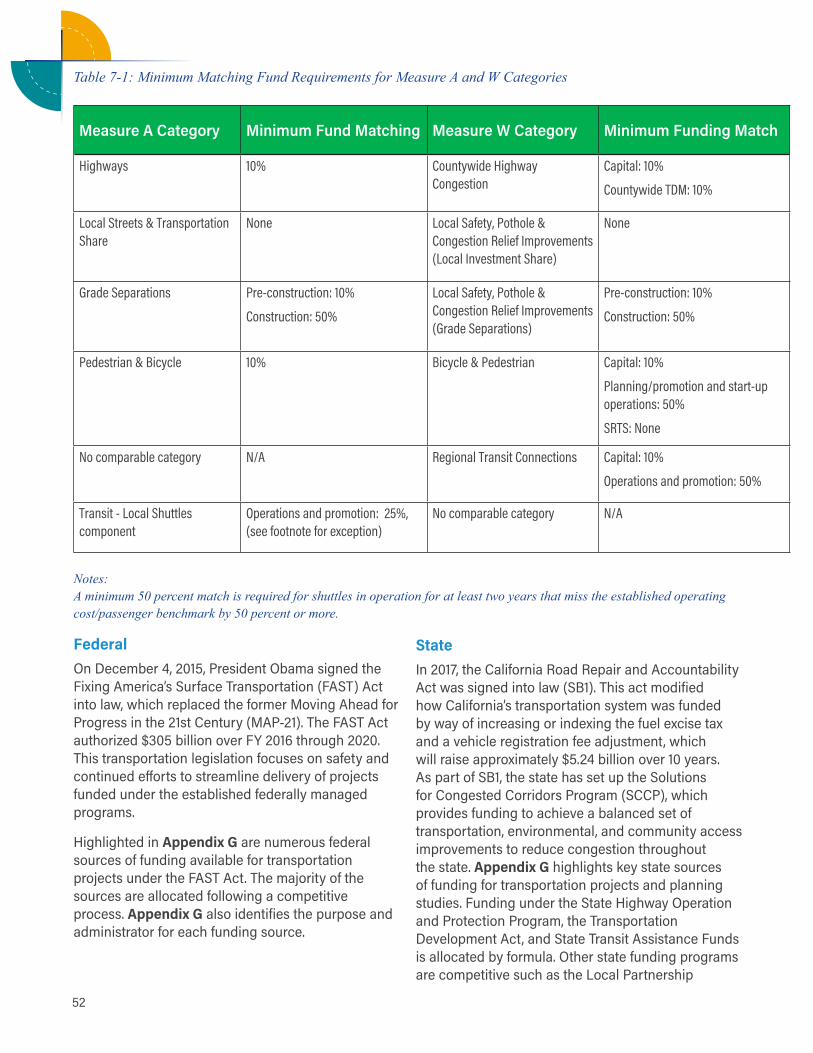
52
Table 7-1: Minimum Matching Fund Requirements for Measure A and W Categories
Measure A Category Minimum Fund Matching Measure W Category Minimum Funding Match
Highways 10% Countywide Highway Congestion
Capital: 10%
Countywide TDM: 10%
Local Streets & Transportation Share
None Local Safety, Pothole & Congestion Relief Improvements (Local Investment Share)
None
Grade Separations Pre-construction: 10%
Construction: 50%
Local Safety, Pothole & Congestion Relief Improvements (Grade Separations)
Pre-construction: 10%
Construction: 50%
Pedestrian & Bicycle 10% Bicycle & Pedestrian Capital: 10%
Planning/promotion and start-up operations: 50%
SRTS: None
No comparable category N/A Regional Transit Connections Capital: 10%
Operations and promotion: 50%
Transit - Local Shuttles component
Operations and promotion: 25%, (see footnote for exception)
No comparable category N/A
Notes: A minimum 50 percent match is required for shuttles in operation for at least two years that miss the established operating cost/passenger benchmark by 50 percent or more.
FederalOn December 4, 2015, President Obama signed the Fixing America’s Surface Transportation (FAST) Act into law, which replaced the former Moving Ahead for Progress in the 21st Century (MAP-21). The FAST Act authorized $305 billion over FY 2016 through 2020. This transportation legislation focuses on safety and continued efforts to streamline delivery of projects funded under the established federally managed programs.
Highlighted in Appendix G are numerous federal sources of funding available for transportation projects under the FAST Act. The majority of the sources are allocated following a competitive process. Appendix G also identifies the purpose and administrator for each funding source.
State In 2017, the California Road Repair and Accountability Act was signed into law (SB1). This act modified how California’s transportation system was funded by way of increasing or indexing the fuel excise tax and a vehicle registration fee adjustment, which will raise approximately $5.24 billion over 10 years. As part of SB1, the state has set up the Solutions for Congested Corridors Program (SCCP), which provides funding to achieve a balanced set of transportation, environmental, and community access improvements to reduce congestion throughout the state. Appendix G highlights key state sources of funding for transportation projects and planning studies. Funding under the State Highway Operation and Protection Program, the Transportation Development Act, and State Transit Assistance Funds is allocated by formula. Other state funding programs are competitive such as the Local Partnership
Section 7 Funds Management
53Strategic Plan 2020-2024
Program (LPP), which provides funding to local and regional agencies to improve aging Infrastructure, road conditions, active transportation, and health and safety benefits. Appendix G identifies the purpose and administrator for each state funding source.
LocalAppendix G highlights key local/regional sources of funding: Measure A and Measure W County transportation sales tax revenues, gasoline tax subventions, regional bridge tolls, vehicle license fees, developer impact fees, and the Transportation Fund for Clean Air. Appendix G also identifies the purpose and administrator for each funding source.
Potential New Funding SourcesWith escalating project costs and limited availability of transportation funding coupled with the need for transportation investments, the TA encourages project sponsors to explore and identify non-traditional sources of funding. Non-traditional sources of funding include innovative financing, establishing new funding sources, and developing public-private partnerships.
Traditional and Innovative FinancingThis type of financing includes mechanisms to creatively finance major infrastructure projects by bonding or borrowing against future anticipated revenue streams. This may include Transportation Infrastructure Finance and Innovation Act of 1998 (TIFIA, a federal credit program), lease-financing of transit vehicles, and finding ways to use future funding sources as collateral.
Private Sector ContributionsMajor Bay Area employers have shown a willingness to invest in transportation infrastructure that addresses the commute problems of their current employees and reduces barriers perceived by prospective new employees. Projects that address regional and subregional transportation deficiencies should be viewed as candidates for private sector participation.
Public-Private PartnershipsPublic-Private Partnerships (PPPs) are potential solutions to funding shortfalls for the completion of projects. Generally, it is a partnership between a governmental entity and a private business venture in which the cost of a project may be partially funded
by the private partners. The private partners receive a benefit from the project in which they invest. Many types of PPPs exist and most approaches are tailored to specific projects. The San Mateo County 101 Express Lanes Project is an example of a successful PPP, where approximately 10 percent (over $50 million) of the capital project cost is being funded from private sector contributions. A reduction in traffic congestion on the US 101 corridor is a key benefit in the ability to retain and attract employees for local businesses.
New Regional/Local Funding SourcesTo increase the overall funding pool, it is necessary to generate additional dollars. Funding options could include toll revenue from Express Lane projects, tax assessment districts, and pursuit of a regional transportation tax (e.g., FASTER Bay Area). Some of the potential new sources may require legislative action.
7.3 TA Consideration of Financing Backed by Sales Tax RevenuesBoth Measure A and Measure W allow the TA to bond for the purpose of advancing the commencement of or expediting the delivery of transportation programs and projects. The bonding capacity will be backed by future Measure A or Measure W revenues. The TA will weigh the benefits of timely implementation of programs and projects and avoidance of escalating construction costs against the costs of bonding. In recent years, interest rates have been relatively low and the bonding agencies have been particularly receptive to issuing bonds supported by sale tax revenues. However, it will still be important for the TA to weigh the costs of a bond issue and the interest payments that will be required against the costs of deferring or delaying projects until the natural flow of funds is sufficient to move forward.
7.4 Special Circumstances for Advancing FundsThere will be special circumstances when project sponsors need to request Measure A and W funding outside the established funding processes discussed in Section 5 of this Plan. The TA has the authority to make funds available outside established Call for Projects funding cycles and prior to the collection of revenues. The TA Board will consider the request based on the following criteria:
54
� Urgency
– A project that calls for immediate construction to address a public safety need
– A project that can realize significant cost savings if it can be constructed in an earlier timeframe
– Loss of funding sources if the project is not constructed within a certain timeframe
– Expected escalation of project development and construction costs outpaces the rate of growth of Measure A and Measure W revenues
� Impact to the Measure A and Measure W Programs
– Potential of the funding advance delaying other projects
– Financial fees associated with advancing funds (the potential saving in implementation costs should be considered)
The TA will determine the method of delivering the advance at the time the request is granted by the Board. The TA should also develop CIPs to determine if advancing funds by either borrowing from other programs or using financing would be an economically and fiscally prudent means of delivering high-priority projects at a lower cost (adjusted for inflation) compared to waiting and implementing projects strictly using a pay-as-you-go approach.
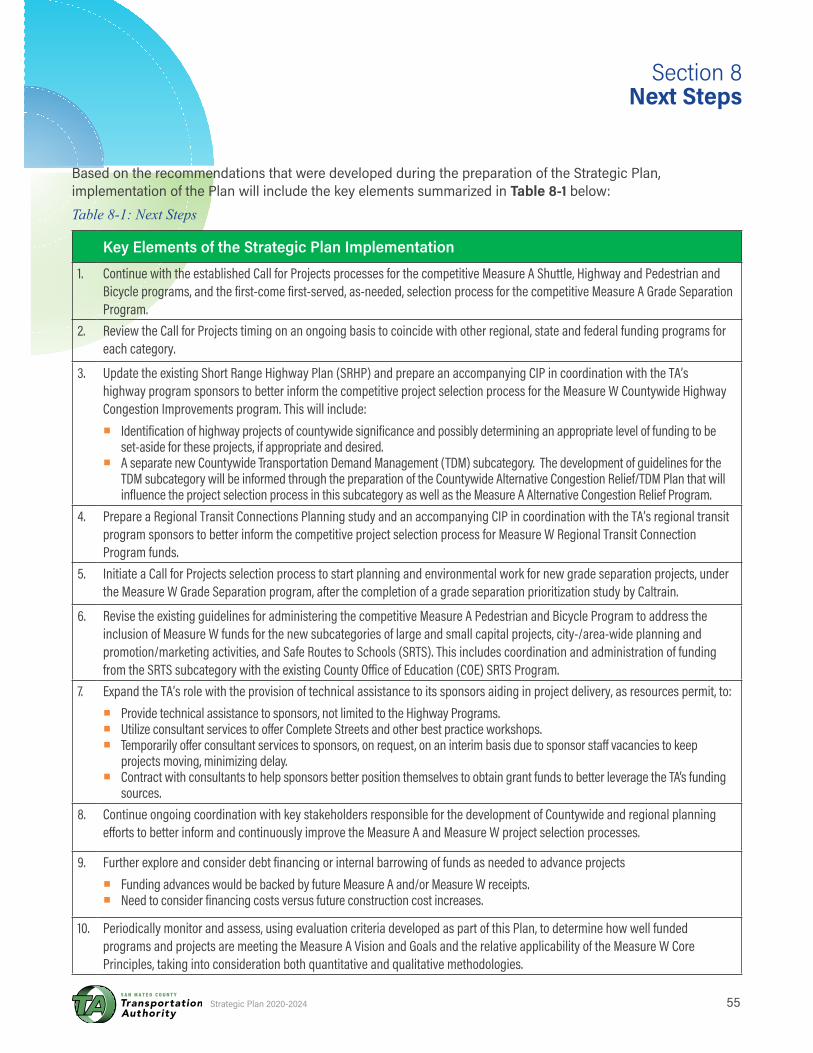
55Strategic Plan 2020-2024
Based on the recommendations that were developed during the preparation of the Strategic Plan, implementation of the Plan will include the key elements summarized in Table 8-1 below:Table 8-1: Next Steps
Key Elements of the Strategic Plan Implementation1. Continue with the established Call for Projects processes for the competitive Measure A Shuttle, Highway and Pedestrian and
Bicycle programs, and the first-come first-served, as-needed, selection process for the competitive Measure A Grade Separation Program.
2. Review the Call for Projects timing on an ongoing basis to coincide with other regional, state and federal funding programs for each category.
3. Update the existing Short Range Highway Plan (SRHP) and prepare an accompanying CIP in coordination with the TA’s highway program sponsors to better inform the competitive project selection process for the Measure W Countywide Highway Congestion Improvements program. This will include:
� Identification of highway projects of countywide significance and possibly determining an appropriate level of funding to be set-aside for these projects, if appropriate and desired.
� A separate new Countywide Transportation Demand Management (TDM) subcategory. The development of guidelines for the TDM subcategory will be informed through the preparation of the Countywide Alternative Congestion Relief/TDM Plan that will influence the project selection process in this subcategory as well as the Measure A Alternative Congestion Relief Program.
4. Prepare a Regional Transit Connections Planning study and an accompanying CIP in coordination with the TA’s regional transit program sponsors to better inform the competitive project selection process for Measure W Regional Transit Connection Program funds.
5. Initiate a Call for Projects selection process to start planning and environmental work for new grade separation projects, under the Measure W Grade Separation program, after the completion of a grade separation prioritization study by Caltrain.
6. Revise the existing guidelines for administering the competitive Measure A Pedestrian and Bicycle Program to address the inclusion of Measure W funds for the new subcategories of large and small capital projects, city-/area-wide planning and promotion/marketing activities, and Safe Routes to Schools (SRTS). This includes coordination and administration of funding from the SRTS subcategory with the existing County Office of Education (COE) SRTS Program.
7. Expand the TA’s role with the provision of technical assistance to its sponsors aiding in project delivery, as resources permit, to: � Provide technical assistance to sponsors, not limited to the Highway Programs. � Utilize consultant services to offer Complete Streets and other best practice workshops. � Temporarily offer consultant services to sponsors, on request, on an interim basis due to sponsor staff vacancies to keep
projects moving, minimizing delay. � Contract with consultants to help sponsors better position themselves to obtain grant funds to better leverage the TA’s funding
sources.8. Continue ongoing coordination with key stakeholders responsible for the development of Countywide and regional planning
efforts to better inform and continuously improve the Measure A and Measure W project selection processes.
9. Further explore and consider debt financing or internal barrowing of funds as needed to advance projects � Funding advances would be backed by future Measure A and/or Measure W receipts. � Need to consider financing costs versus future construction cost increases.
10. Periodically monitor and assess, using evaluation criteria developed as part of this Plan, to determine how well funded programs and projects are meeting the Measure A Vision and Goals and the relative applicability of the Measure W Core Principles, taking into consideration both quantitative and qualitative methodologies.
Section 8 Next Steps