Embed Size (px)
Citation preview
Sampling and Experimental Design David Ferris, Noblesville High School
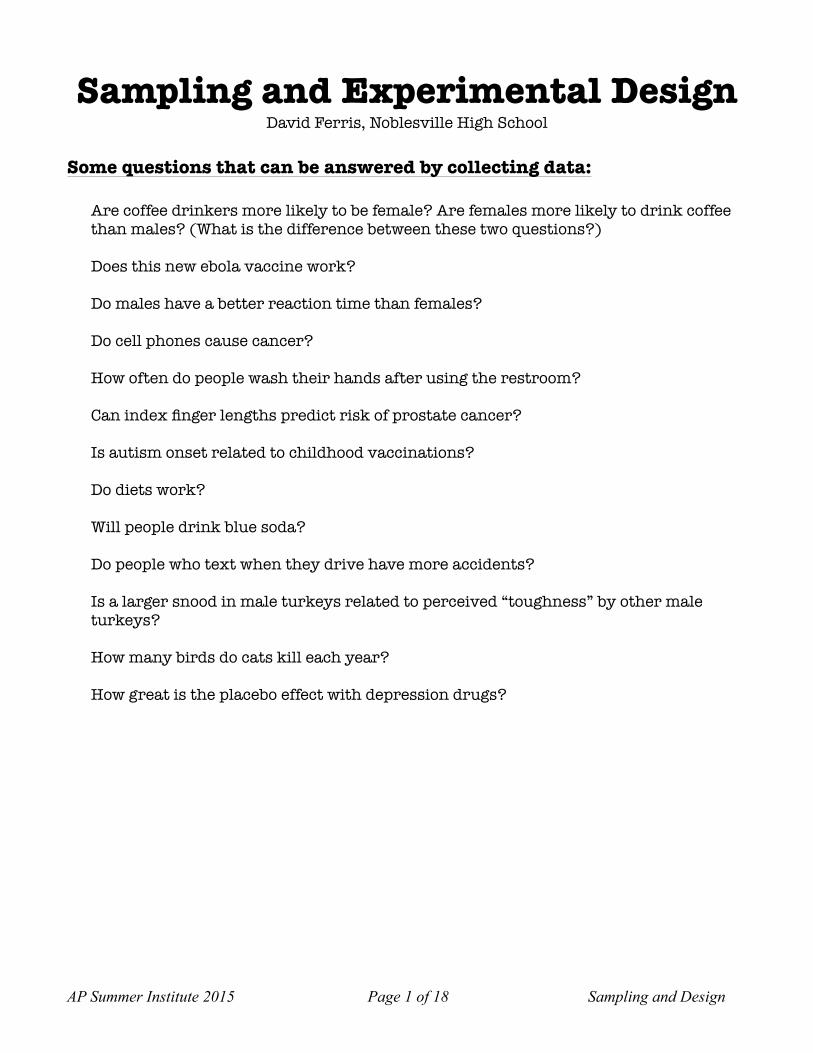
Some questions that can be answered by collecting data:
Are coffee drinkers more likely to be female? Are females more likely to drink coffee than males? (What is the difference between these two questions?)
Does this new ebola vaccine work?
Do males have a better reaction time than females?
Do cell phones cause cancer?
How often do people wash their hands after using the restroom?
Can index finger lengths predict risk of prostate cancer?
Is autism onset related to childhood vaccinations?
Do diets work?
Will people drink blue soda?
Do people who text when they drive have more accidents?
Is a larger snood in male turkeys related to perceived “toughness” by other male turkeys?
How many birds do cats kill each year?
How great is the placebo effect with depression drugs?
AP Summer Institute 2015 Page ! of ! Sampling and Design1 18
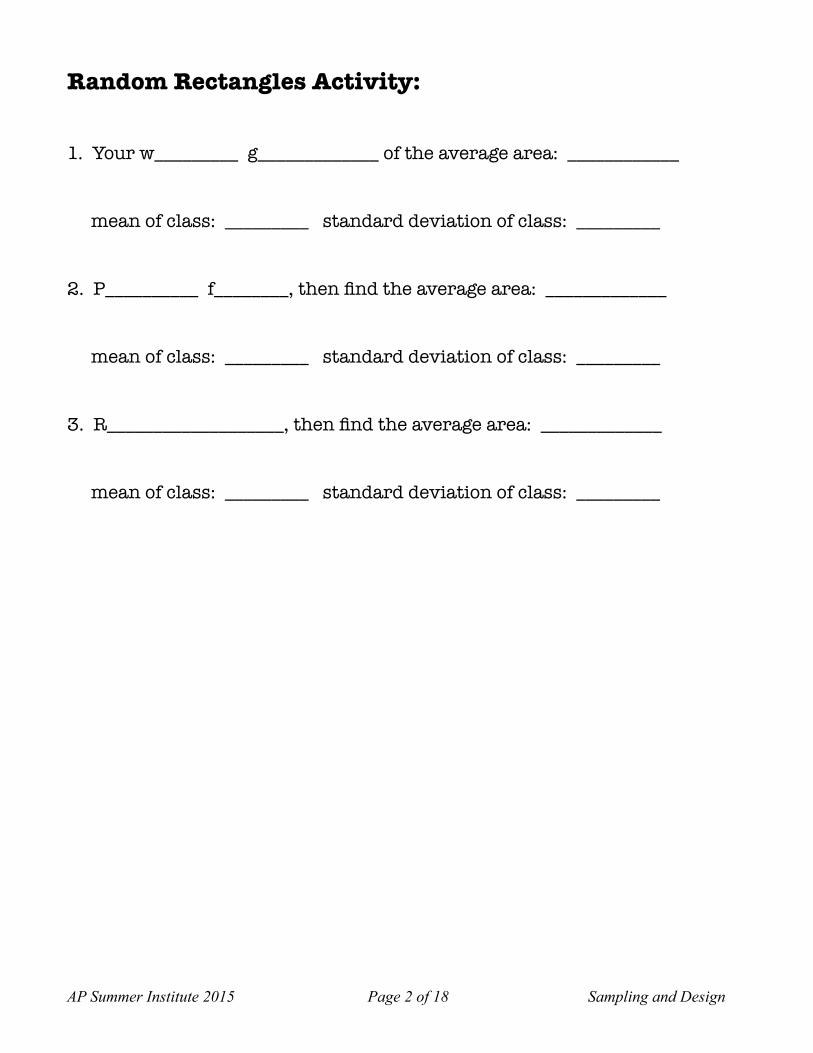
Random Rectangles Activity:
1. Your w_________ g_____________ of the average area: ____________
mean of class: _________ standard deviation of class: _________
2. P__________ f________, then find the average area: _____________
mean of class: _________ standard deviation of class: _________
3. R___________________, then find the average area: _____________
mean of class: _________ standard deviation of class: _________
AP Summer Institute 2015 Page ! of ! Sampling and Design2 18
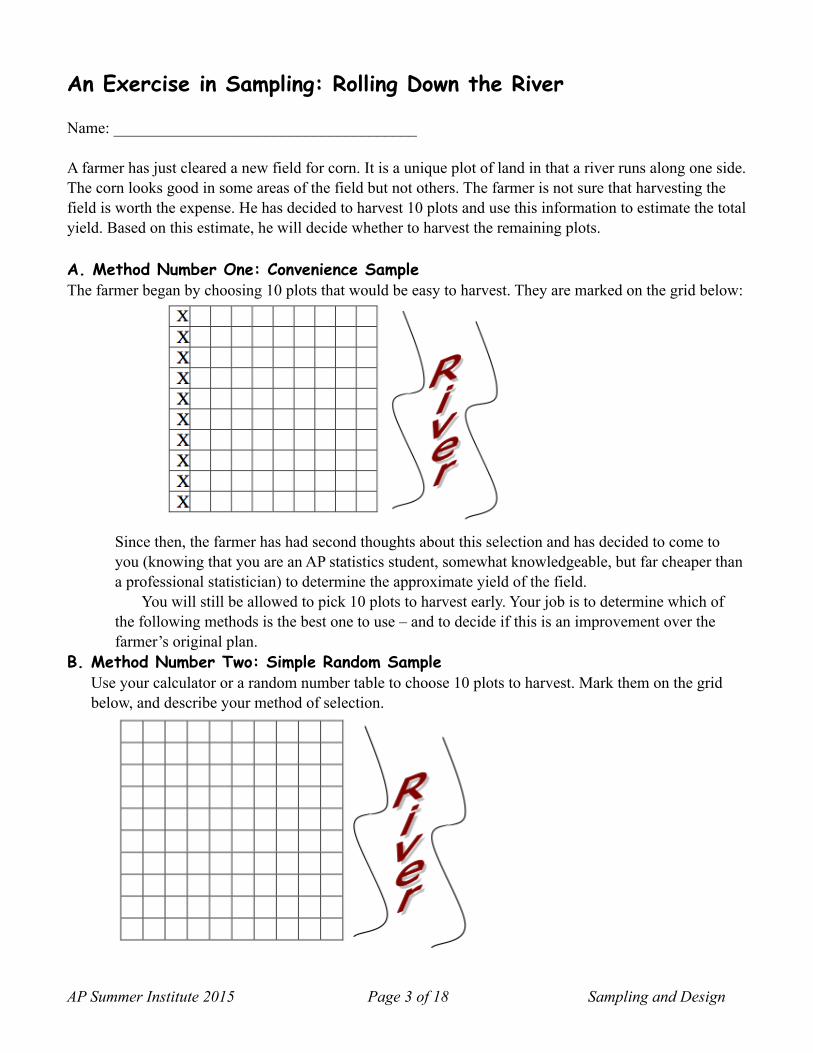
An Exercise in Sampling: Rolling Down the River
Name: ______________________________________
A farmer has just cleared a new field for corn. It is a unique plot of land in that a river runs along one side. The corn looks good in some areas of the field but not others. The farmer is not sure that harvesting the field is worth the expense. He has decided to harvest 10 plots and use this information to estimate the total yield. Based on this estimate, he will decide whether to harvest the remaining plots.
A. Method Number One: Convenience Sample The farmer began by choosing 10 plots that would be easy to harvest. They are marked on the grid below:
! Since then, the farmer has had second thoughts about this selection and has decided to come to you (knowing that you are an AP statistics student, somewhat knowledgeable, but far cheaper than a professional statistician) to determine the approximate yield of the field. You will still be allowed to pick 10 plots to harvest early. Your job is to determine which of the following methods is the best one to use – and to decide if this is an improvement over the farmer’s original plan.
B. Method Number Two: Simple Random Sample Use your calculator or a random number table to choose 10 plots to harvest. Mark them on the grid below, and describe your method of selection.
!
AP Summer Institute 2015 Page ! of ! Sampling and Design3 18
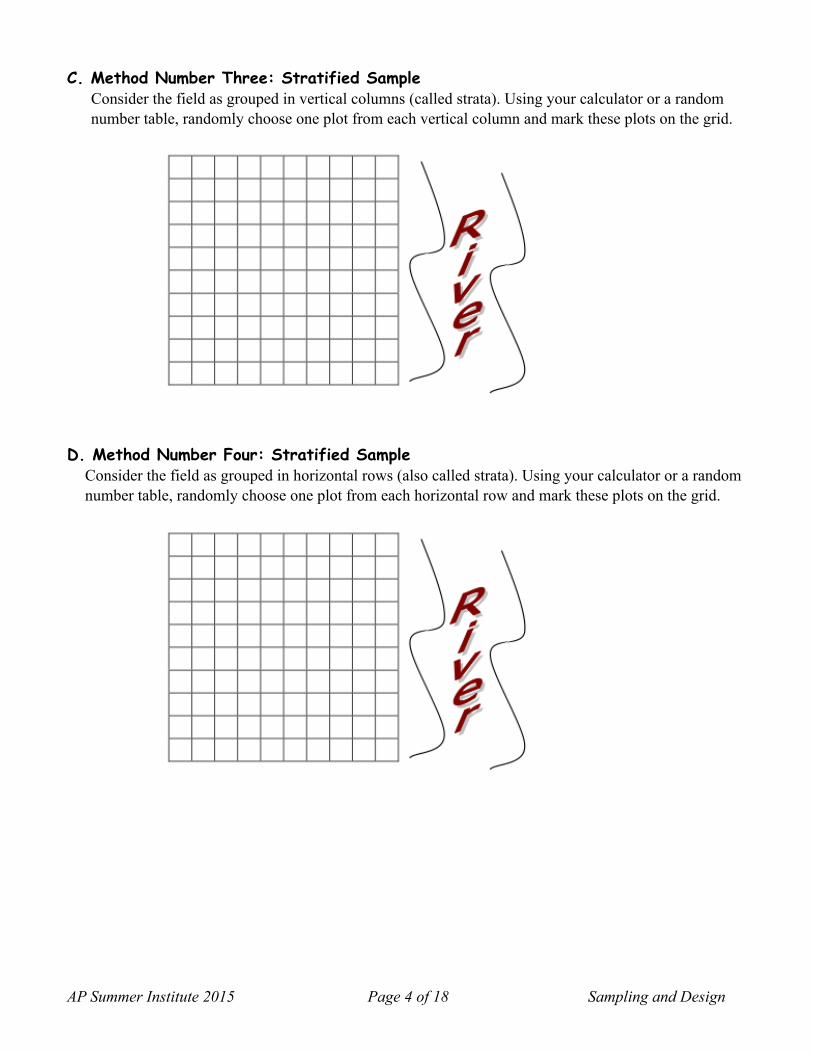
C. Method Number Three: Stratified Sample Consider the field as grouped in vertical columns (called strata). Using your calculator or a random number table, randomly choose one plot from each vertical column and mark these plots on the grid.
!
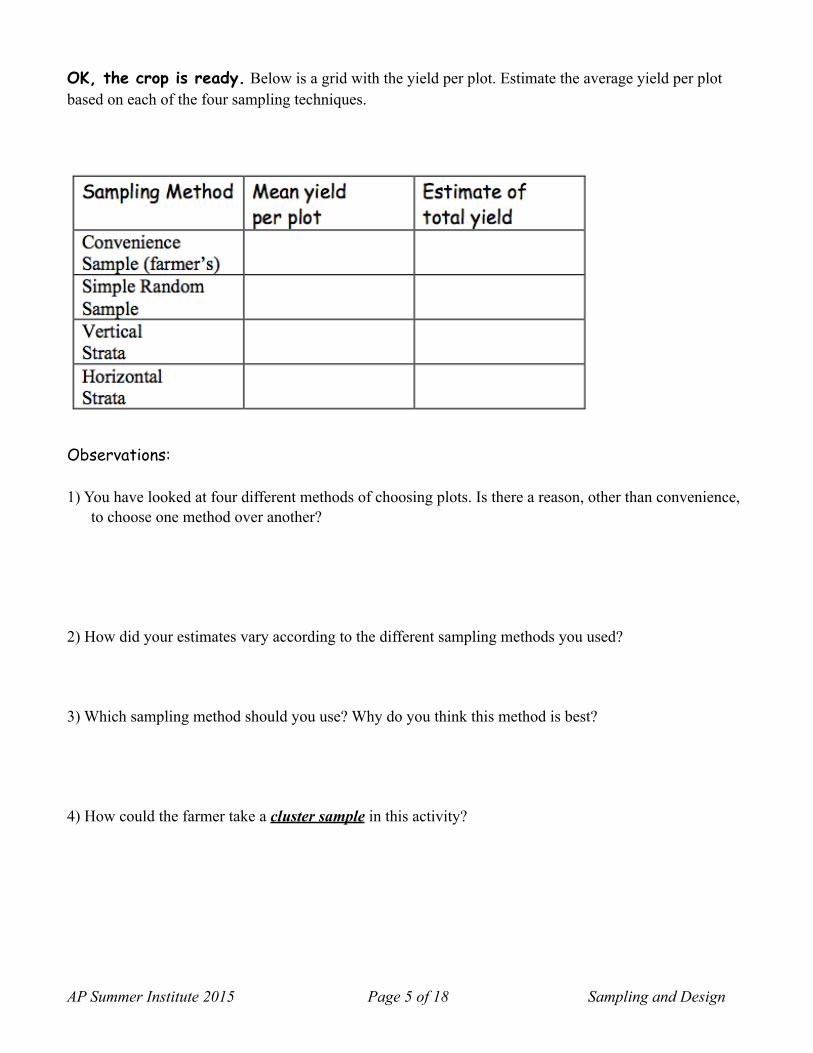
D. Method Number Four: Stratified Sample Consider the field as grouped in horizontal rows (also called strata). Using your calculator or a random number table, randomly choose one plot from each horizontal row and mark these plots on the grid.
!
AP Summer Institute 2015 Page ! of ! Sampling and Design4 18
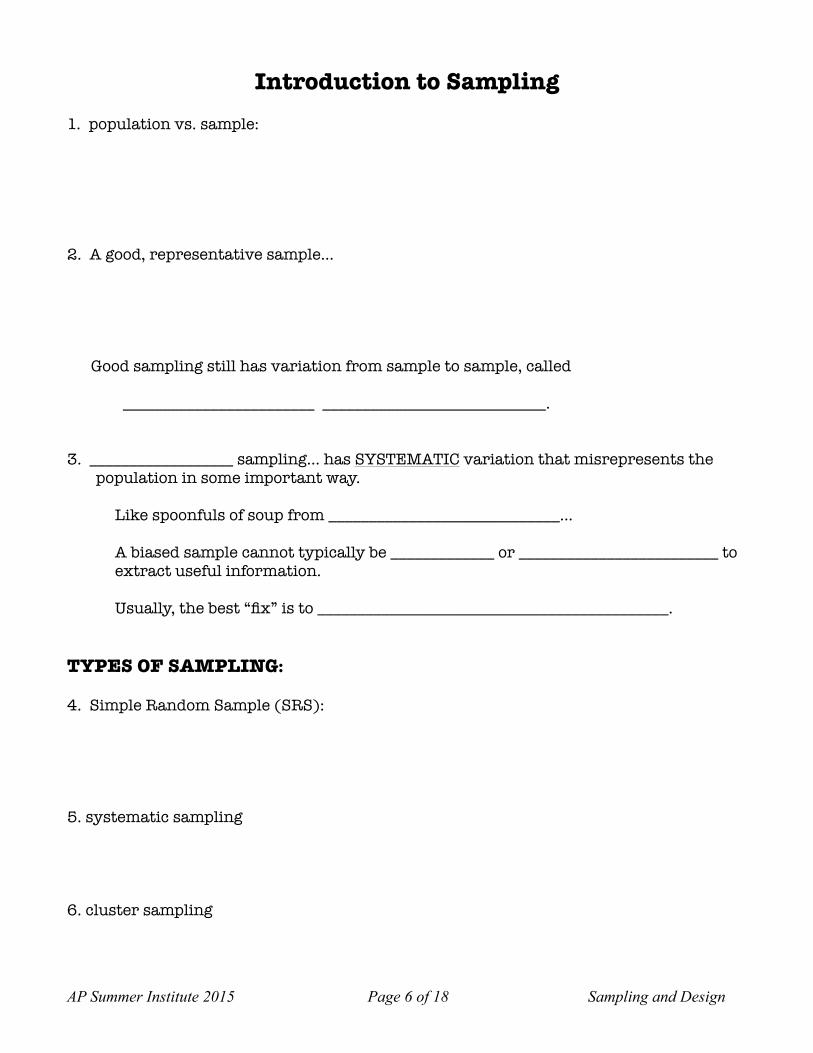
OK, the crop is ready. Below is a grid with the yield per plot. Estimate the average yield per plot based on each of the four sampling techniques.
!
Observations:
1) You have looked at four different methods of choosing plots. Is there a reason, other than convenience, to choose one method over another?
2) How did your estimates vary according to the different sampling methods you used?
3) Which sampling method should you use? Why do you think this method is best?
4) How could the farmer take a cluster sample in this activity?
AP Summer Institute 2015 Page ! of ! Sampling and Design5 18
Introduction to Sampling 1. population vs. sample:
2. A good, representative sample…
Good sampling still has variation from sample to sample, called
________________________ ____________________________.
3. __________________ sampling… has SYSTEMATIC variation that misrepresents the population in some important way.
Like spoonfuls of soup from _____________________________...
A biased sample cannot typically be _____________ or _________________________ to extract useful information.
Usually, the best “fix” is to ____________________________________________.
TYPES OF SAMPLING:
4. Simple Random Sample (SRS):
5. systematic sampling
6. cluster sampling
AP Summer Institute 2015 Page ! of ! Sampling and Design6 18
7. stratified sampling:
8. multistage sampling
9. convenience sampling
TYPES OF BIAS:
10. response bias
11. nonresponse bias
12. voluntary response bias
13. undercoverage
14. BE SURE TO KNOW: The difference between variability and bias
AP Summer Institute 2015 Page ! of ! Sampling and Design7 18
Paper Helicopter Experiment Name:___________________________________
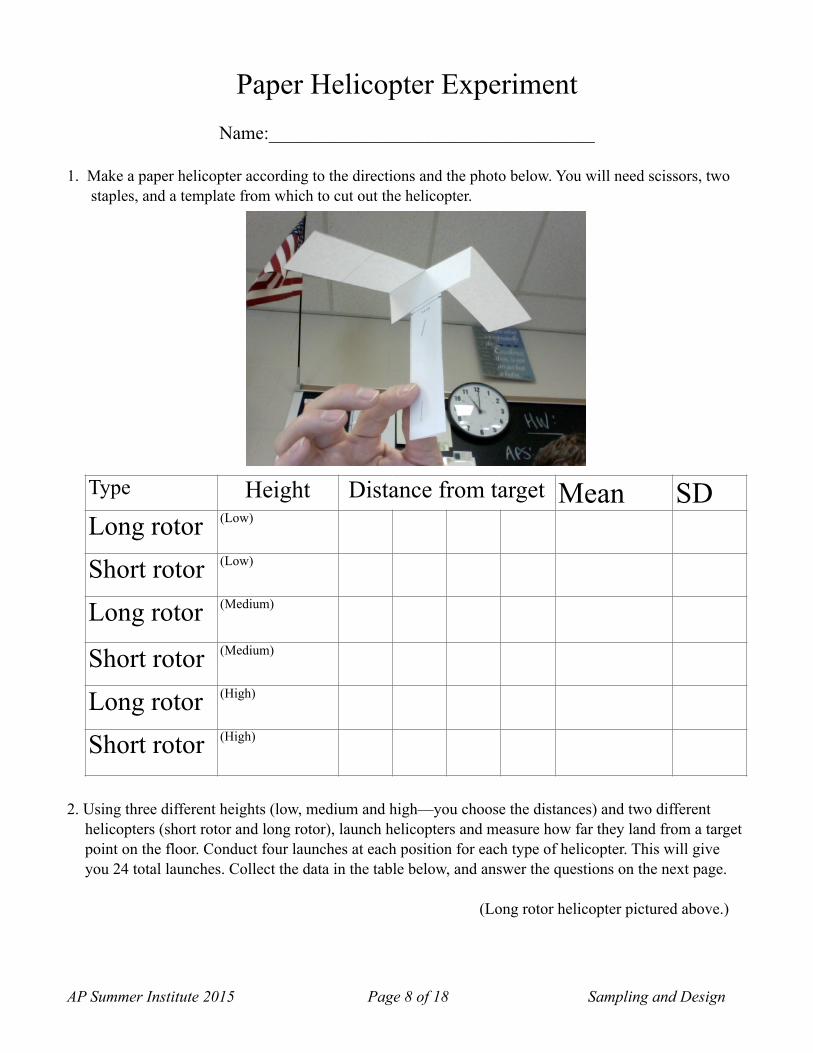
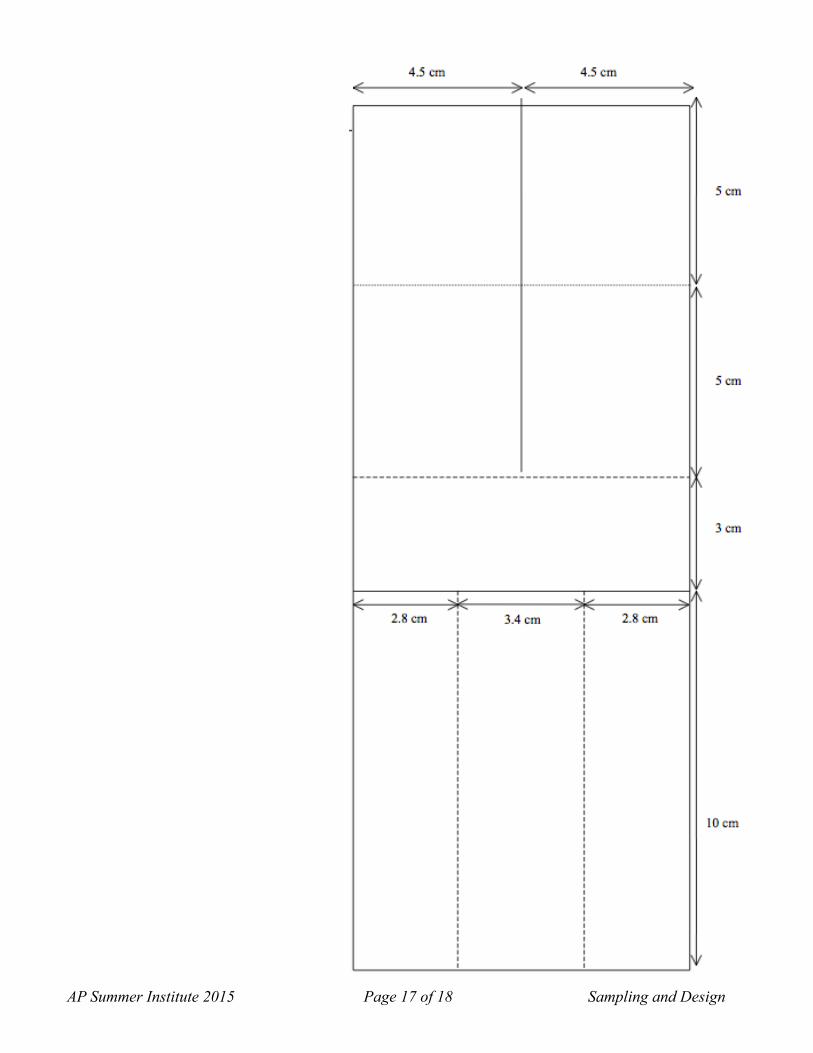
1. Make a paper helicopter according to the directions and the photo below. You will need scissors, two staples, and a template from which to cut out the helicopter.
2. Using three different heights (low, medium and high—you choose the distances) and two different helicopters (short rotor and long rotor), launch helicopters and measure how far they land from a target point on the floor. Conduct four launches at each position for each type of helicopter. This will give you 24 total launches. Collect the data in the table below, and answer the questions on the next page.
(Long rotor helicopter pictured above.)
Type Height Distance from target Mean SDLong rotor (Low)
Short rotor (Low)
Long rotor (Medium)
Short rotor (Medium)
Long rotor (High)
Short rotor (High)
AP Summer Institute 2015 Page ! of ! Sampling and Design8 18
Helicopter Activity Questions 1. The distances you recorded were not all exactly the same—there was a lot of variation. What were
some of the sources (causes) of this variation?
2. These sources of variation can be categorized into three broad types. What are they?
3. How could you have “accounted for” the two “non-expected” general sources of variation?
4. What are the factors in the experiment?
5. What are the levels of each factor?
6. How many total treatments did you have? ________
7. Name at least three possible sources of bias in this experiment (be sure to remember the definition of bias).
AP Summer Institute 2015 Page ! of ! Sampling and Design9 18
! For rest of article, see file: expdesign_rabbits.pdf For more good articles about design, see: http://courses.ncssm.edu/math/Stat_Inst/Notes.htm Cobb’s book (mentioned above) is an even deeper discussion of experimental design.
AP Summer Institute 2015 Page ! of ! Sampling and Design10 18
Unique Concepts/Terms in Experiments
Blocking
Confounding
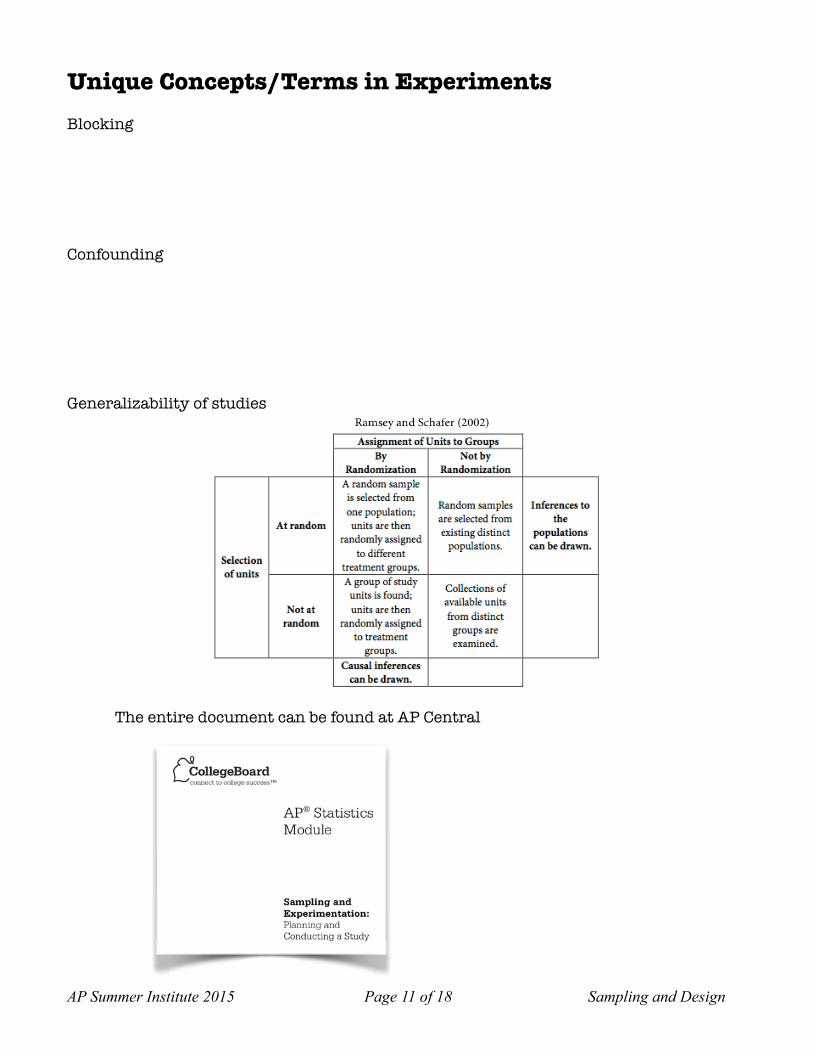
Generalizability of studies
The entire document can be found at AP Central
AP Summer Institute 2015 Page ! of ! Sampling and Design11 18
Placebo and placebo effect (See YouTube video from 60 minutes: Treating Depression: Is there a placebo effect?)
Blinding (single and double)
Three Types of Experiments
AP Summer Institute 2015 Page ! of ! Sampling and Design12 18
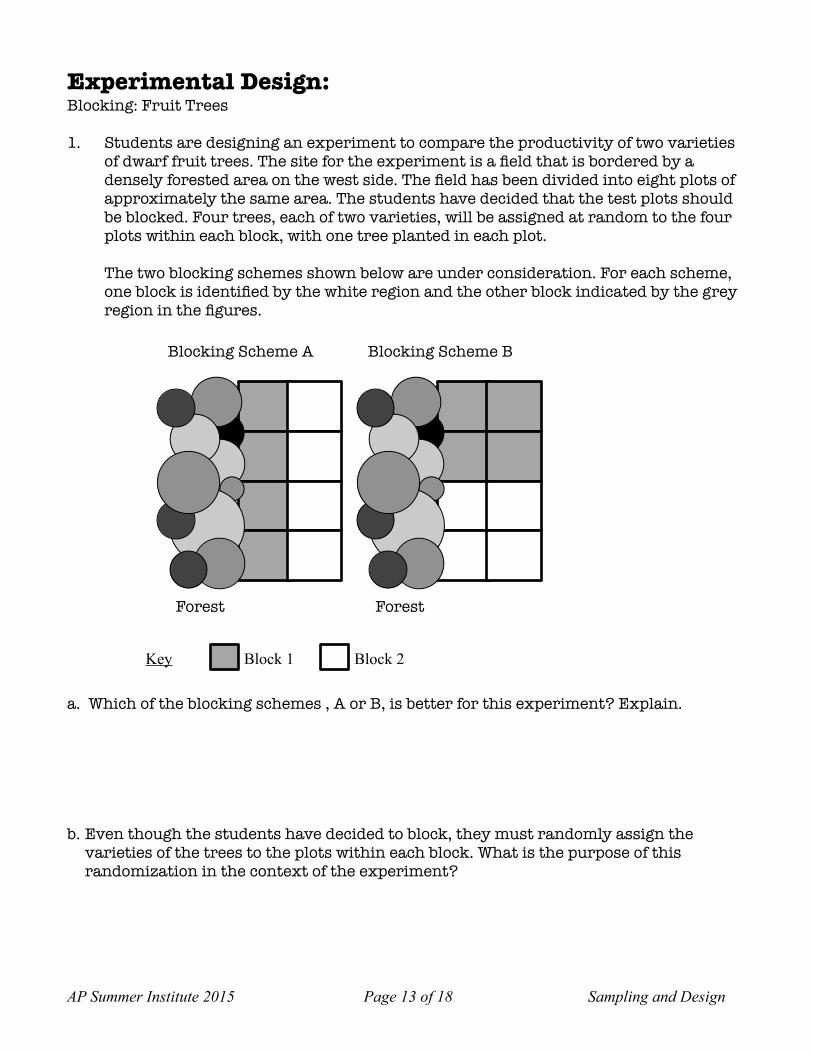
Experimental Design: Blocking: Fruit Trees
1. Students are designing an experiment to compare the productivity of two varieties of dwarf fruit trees. The site for the experiment is a field that is bordered by a densely forested area on the west side. The field has been divided into eight plots of approximately the same area. The students have decided that the test plots should be blocked. Four trees, each of two varieties, will be assigned at random to the four plots within each block, with one tree planted in each plot.
The two blocking schemes shown below are under consideration. For each scheme, one block is identified by the white region and the other block indicated by the grey region in the figures.
! !
! ! ! ! !
a. Which of the blocking schemes , A or B, is better for this experiment? Explain.
b.Even though the students have decided to block, they must randomly assign the
varieties of the trees to the plots within each block. What is the purpose of this randomization in the context of the experiment?
Forest
Blocking Scheme A
Forest
Blocking Scheme B
Key Block 1 Block 2
AP Summer Institute 2015 Page ! of ! Sampling and Design13 18
!
AP Summer Institute 2015 Page ! of ! Sampling and Design14 18
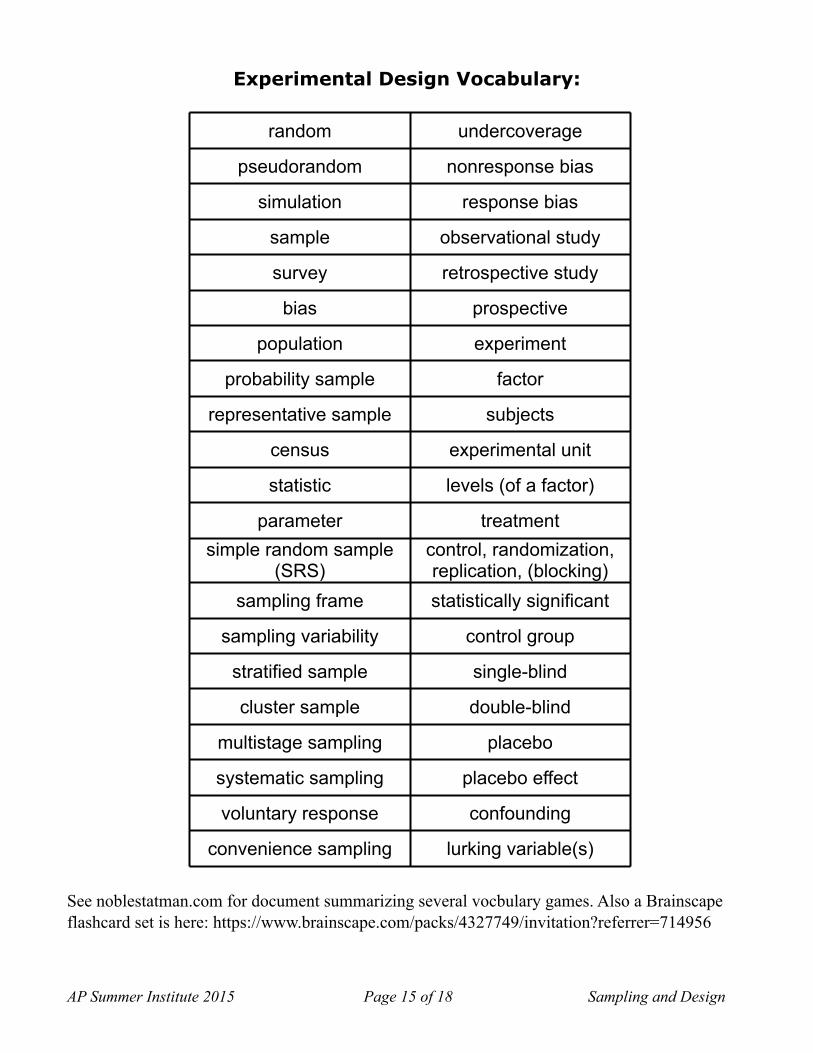
Experimental Design Vocabulary:
See noblestatman.com for document summarizing several vocbulary games. Also a Brainscape flashcard set is here: https://www.brainscape.com/packs/4327749/invitation?referrer=714956
random undercoverage
pseudorandom nonresponse bias
simulation response bias
sample observational study
survey retrospective study
bias prospective
population experiment
probability sample factor
representative sample subjects
census experimental unit
statistic levels (of a factor)
parameter treatmentsimple random sample
(SRS)control, randomization, replication, (blocking)
sampling frame statistically significant
sampling variability control group
stratified sample single-blind
cluster sample double-blind
multistage sampling placebo
systematic sampling placebo effect
voluntary response confounding
convenience sampling lurking variable(s)
AP Summer Institute 2015 Page ! of ! Sampling and Design15 18
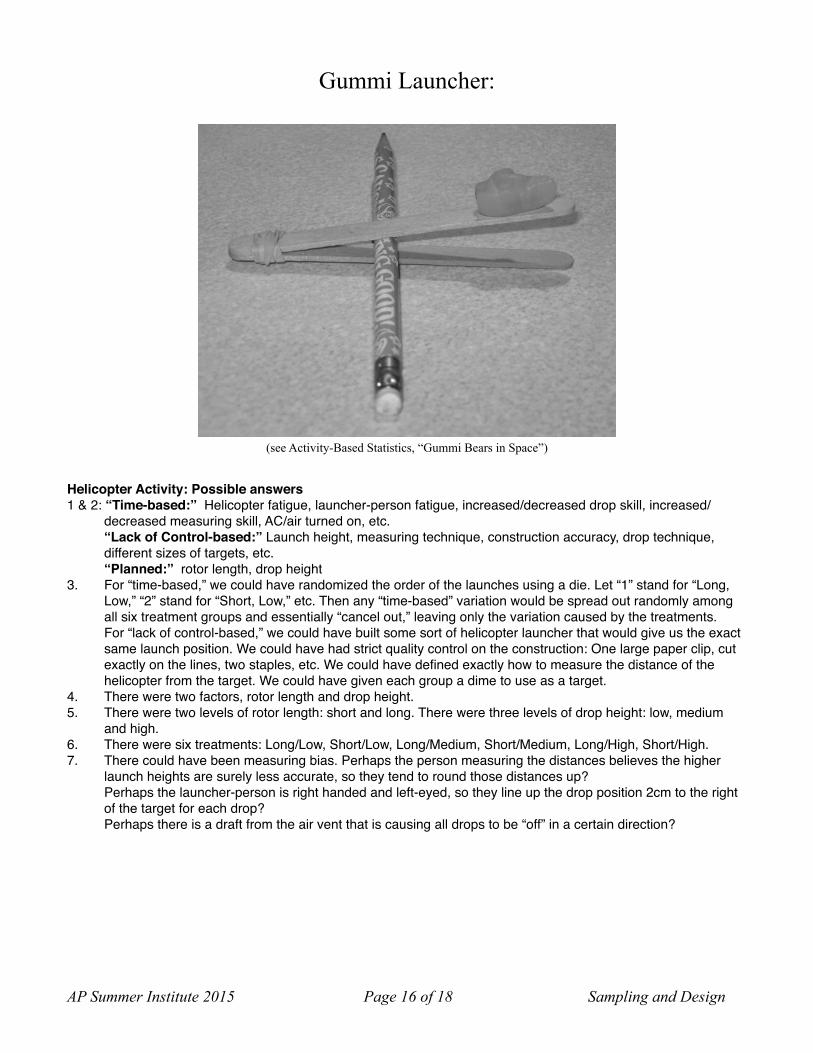
Gummi Launcher:
! (see Activity-Based Statistics, “Gummi Bears in Space”)
Helicopter Activity: Possible answers1 & 2: “Time-based:” Helicopter fatigue, launcher-person fatigue, increased/decreased drop skill, increased/
decreased measuring skill, AC/air turned on, etc.“Lack of Control-based:” Launch height, measuring technique, construction accuracy, drop technique, different sizes of targets, etc.“Planned:” rotor length, drop height
3. For “time-based,” we could have randomized the order of the launches using a die. Let “1” stand for “Long, Low,” “2” stand for “Short, Low,” etc. Then any “time-based” variation would be spread out randomly among all six treatment groups and essentially “cancel out,” leaving only the variation caused by the treatments.For “lack of control-based,” we could have built some sort of helicopter launcher that would give us the exact same launch position. We could have had strict quality control on the construction: One large paper clip, cut exactly on the lines, two staples, etc. We could have defined exactly how to measure the distance of the helicopter from the target. We could have given each group a dime to use as a target.
4. There were two factors, rotor length and drop height.5. There were two levels of rotor length: short and long. There were three levels of drop height: low, medium
and high.6. There were six treatments: Long/Low, Short/Low, Long/Medium, Short/Medium, Long/High, Short/High.7. There could have been measuring bias. Perhaps the person measuring the distances believes the higher
launch heights are surely less accurate, so they tend to round those distances up?Perhaps the launcher-person is right handed and left-eyed, so they line up the drop position 2cm to the right of the target for each drop?Perhaps there is a draft from the air vent that is causing all drops to be “off” in a certain direction?
AP Summer Institute 2015 Page ! of ! Sampling and Design16 18
! AP Summer Institute 2015 Page ! of ! Sampling and Design17 18
!
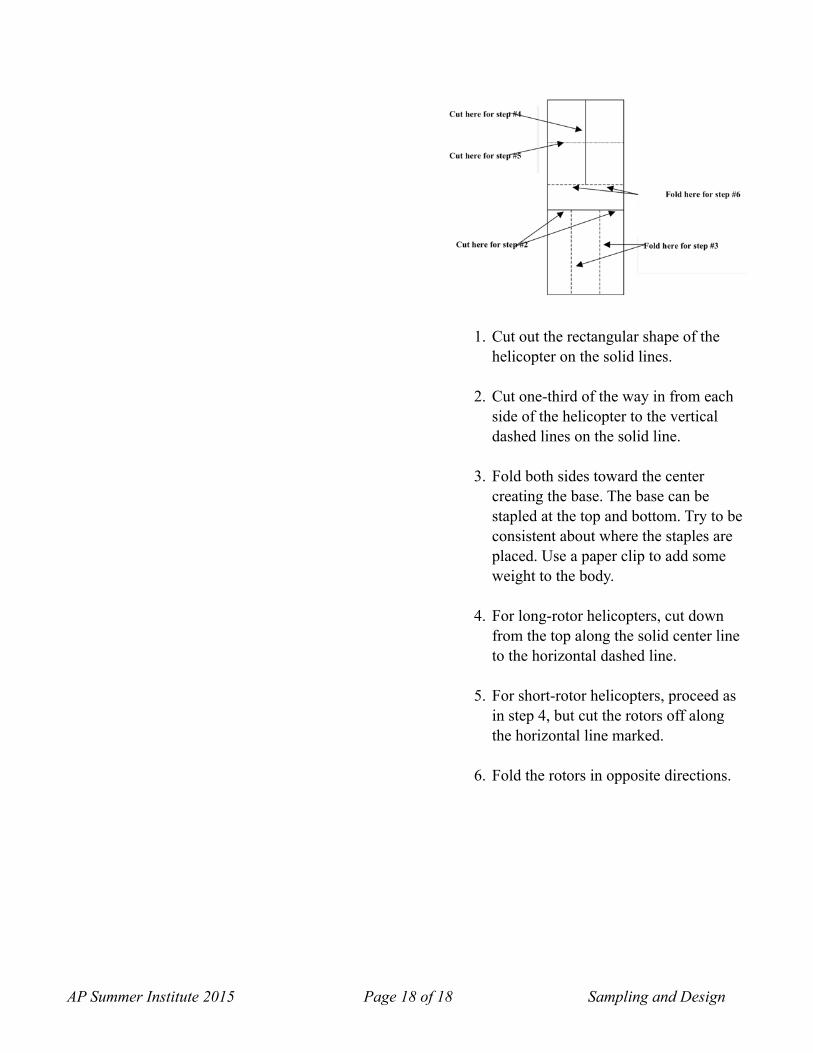
1. Cut out the rectangular shape of the helicopter on the solid lines.
2. Cut one-third of the way in from each side of the helicopter to the vertical dashed lines on the solid line.
3. Fold both sides toward the center creating the base. The base can be stapled at the top and bottom. Try to be consistent about where the staples are placed. Use a paper clip to add some weight to the body.
4. For long-rotor helicopters, cut down from the top along the solid center line to the horizontal dashed line.
5. For short-rotor helicopters, proceed as in step 4, but cut the rotors off along the horizontal line marked.
6. Fold the rotors in opposite directions.
AP Summer Institute 2015 Page ! of ! Sampling and Design18 18