Embed Size (px)
Citation preview
AP Statistics Experienced Workshop Fall 2013 Page 1 of 24
AP Statistics: Experienced Workshop David Ferris, consultant
[email protected] www.noblestatman.com
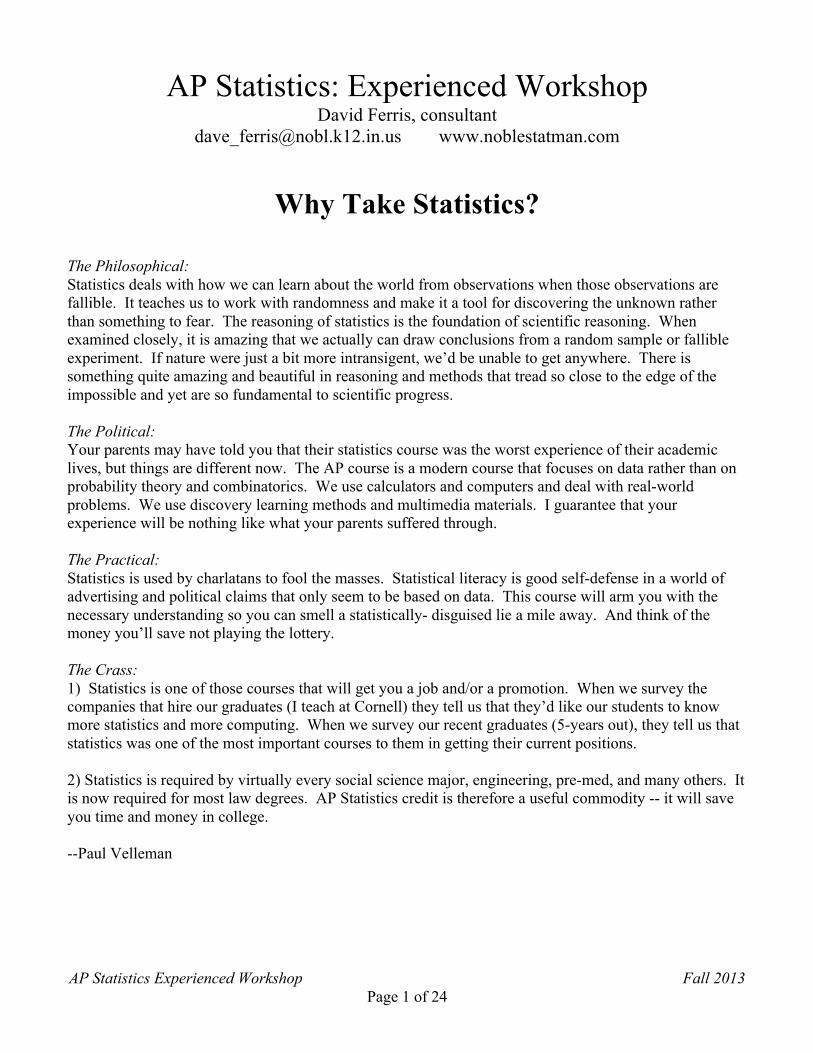
Why Take Statistics? The Philosophical: Statistics deals with how we can learn about the world from observations when those observations are fallible. It teaches us to work with randomness and make it a tool for discovering the unknown rather than something to fear. The reasoning of statistics is the foundation of scientific reasoning. When examined closely, it is amazing that we actually can draw conclusions from a random sample or fallible experiment. If nature were just a bit more intransigent, we’d be unable to get anywhere. There is something quite amazing and beautiful in reasoning and methods that tread so close to the edge of the impossible and yet are so fundamental to scientific progress. The Political: Your parents may have told you that their statistics course was the worst experience of their academic lives, but things are different now. The AP course is a modern course that focuses on data rather than on probability theory and combinatorics. We use calculators and computers and deal with real-world problems. We use discovery learning methods and multimedia materials. I guarantee that your experience will be nothing like what your parents suffered through. The Practical: Statistics is used by charlatans to fool the masses. Statistical literacy is good self-defense in a world of advertising and political claims that only seem to be based on data. This course will arm you with the necessary understanding so you can smell a statistically- disguised lie a mile away. And think of the money you’ll save not playing the lottery. The Crass: 1) Statistics is one of those courses that will get you a job and/or a promotion. When we survey the companies that hire our graduates (I teach at Cornell) they tell us that they’d like our students to know more statistics and more computing. When we survey our recent graduates (5-years out), they tell us that statistics was one of the most important courses to them in getting their current positions. 2) Statistics is required by virtually every social science major, engineering, pre-med, and many others. It is now required for most law degrees. AP Statistics credit is therefore a useful commodity -- it will save you time and money in college. --Paul Velleman
AP Statistics Experienced Workshop Fall 2013 Page 2 of 24
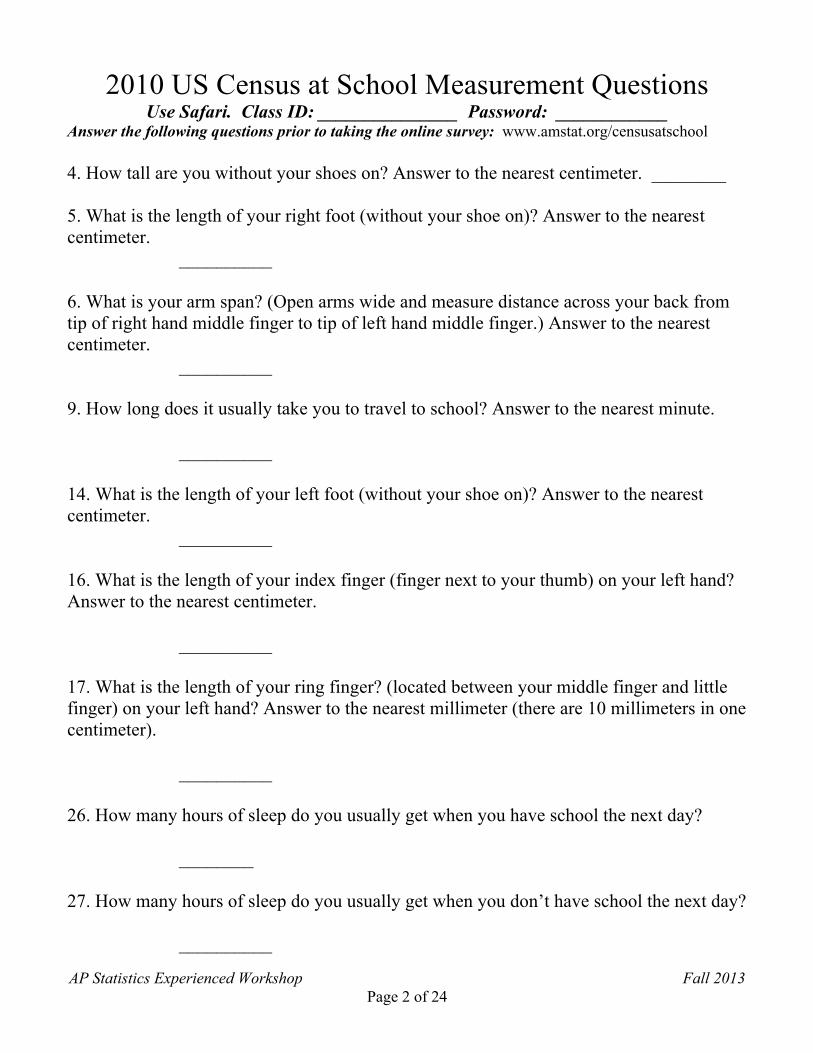
2010 US Census at School Measurement Questions Use Safari. Class ID: _______________ Password: ____________
Answer the following questions prior to taking the online survey: www.amstat.org/censusatschool 4. How tall are you without your shoes on? Answer to the nearest centimeter. ________ 5. What is the length of your right foot (without your shoe on)? Answer to the nearest centimeter. __________ 6. What is your arm span? (Open arms wide and measure distance across your back from tip of right hand middle finger to tip of left hand middle finger.) Answer to the nearest centimeter. __________ 9. How long does it usually take you to travel to school? Answer to the nearest minute. __________ 14. What is the length of your left foot (without your shoe on)? Answer to the nearest centimeter. __________ 16. What is the length of your index finger (finger next to your thumb) on your left hand? Answer to the nearest centimeter. __________ 17. What is the length of your ring finger? (located between your middle finger and little finger) on your left hand? Answer to the nearest millimeter (there are 10 millimeters in one centimeter). __________ 26. How many hours of sleep do you usually get when you have school the next day? ________ 27. How many hours of sleep do you usually get when you don’t have school the next day? __________
AP Statistics Experienced Workshop Fall 2013 Page 3 of 24
Group members:_____________________________________________________________ Steps:
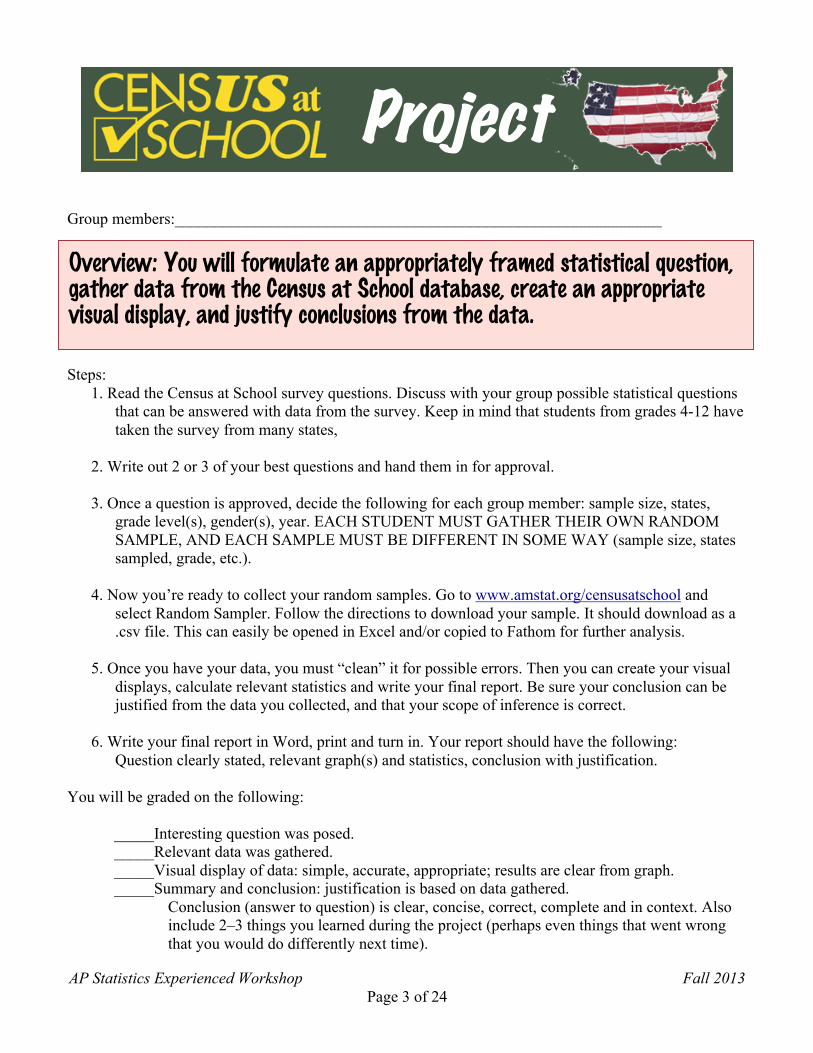
1. Read the Census at School survey questions. Discuss with your group possible statistical questions that can be answered with data from the survey. Keep in mind that students from grades 4-12 have taken the survey from many states,
2. Write out 2 or 3 of your best questions and hand them in for approval. 3. Once a question is approved, decide the following for each group member: sample size, states,
grade level(s), gender(s), year. EACH STUDENT MUST GATHER THEIR OWN RANDOM SAMPLE, AND EACH SAMPLE MUST BE DIFFERENT IN SOME WAY (sample size, states sampled, grade, etc.).
4. Now you’re ready to collect your random samples. Go to www.amstat.org/censusatschool and
select Random Sampler. Follow the directions to download your sample. It should download as a .csv file. This can easily be opened in Excel and/or copied to Fathom for further analysis.
5. Once you have your data, you must “clean” it for possible errors. Then you can create your visual
displays, calculate relevant statistics and write your final report. Be sure your conclusion can be justified from the data you collected, and that your scope of inference is correct.
6. Write your final report in Word, print and turn in. Your report should have the following: Question clearly stated, relevant graph(s) and statistics, conclusion with justification.
You will be graded on the following:
_____Interesting question was posed. _____Relevant data was gathered. _____Visual display of data: simple, accurate, appropriate; results are clear from graph. _____Summary and conclusion: justification is based on data gathered.
Conclusion (answer to question) is clear, concise, correct, complete and in context. Also include 2–3 things you learned during the project (perhaps even things that went wrong that you would do differently next time).
Project
Overview: You will formulate an appropriately framed statistical question, gather data from the Census at School database, create an appropriate visual display, and justify conclusions from the data.
AP Statistics Experienced Workshop Fall 2013 Page 4 of 24
Age Guessing Activity
1. Guess the ages of the following people, and put your guess in this column: Name: Actual Age: Your Guess: Barack Obama __________ __________ Simon Cowell __________ __________ Bill Gates __________ __________ Johnny Depp __________ __________ Bono __________ __________ Alex Trebek __________ __________ Oprah Winfrey __________ __________ Miley Cyrus __________ __________ Peyton Manning __________ __________ J. K. Rowling __________ __________ Mick Jagger __________ __________ Mark Zuckerberg __________ __________ 2. Put the actual ages of each person in the first column. 3. Type both lists into your calculator. (Actual ages in L1, your guesses in L2.) 4. Make a scatterplot for these two lists. (x-axis is L1, y-axis is L2) 5. Calculate r: __________ 6. Describe below what you discovered about your age guesses:

AP Statistics Experienced Workshop Fall 2013 Page 5 of 24
Commonly Asked Regression Questions (as seen on previous AP Statistics exams)
1. Describe the association in context. 2. Is a linear model appropriate to describe this relationship? Explain. 3. Write the equation for the linear model on this data. 4. Explain the meaning of the slope in this linear model 5. Explain the meaning of the y-intercept in this linear model 6. Find the value and explain the meaning of the correlation coefficient. 7. Find the value of and interpret r-squared 8. a. Using the linear model, predict _____________ when ____________ is ___________. b. Is the residual for this data point positive or negative? Is the model over- or
underestimating? Explain. 9. Comment on any outliers present. Fully describe their effect on the data, if any. 10. Interpret regression and model information from a computer printout.
AP Statistics Experienced Workshop Fall 2013 Page 6 of 24
Paper Helicopter Experiment
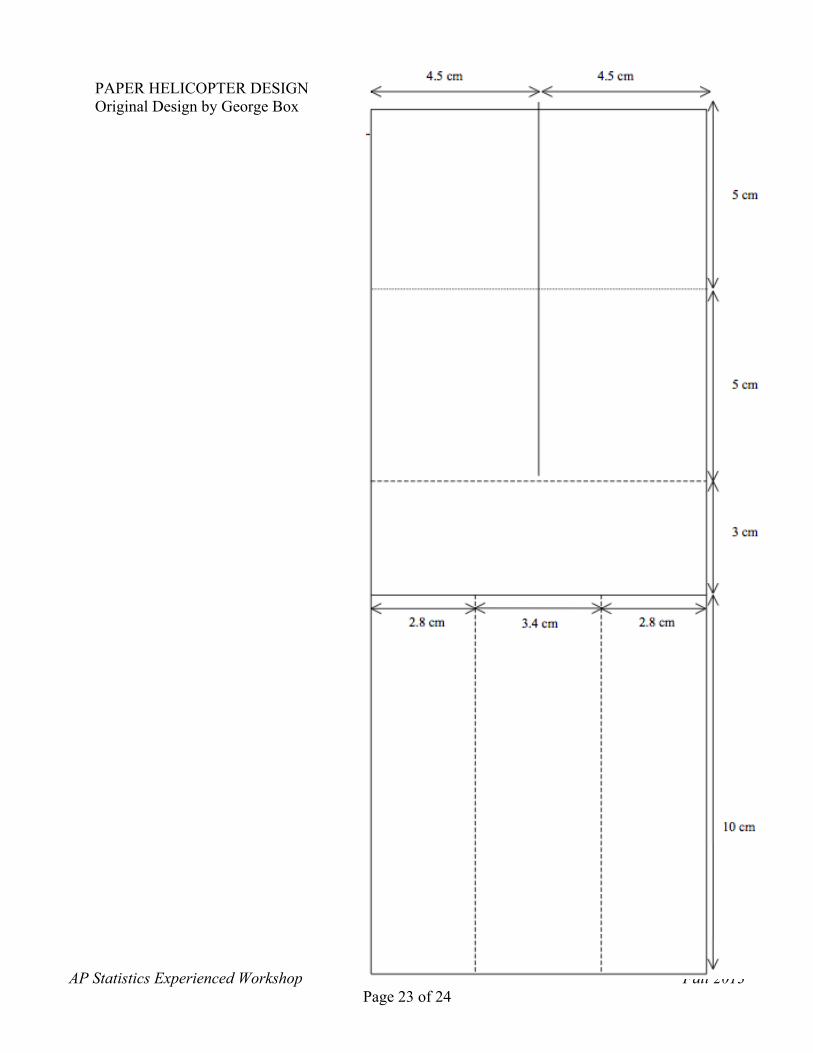
Name:___________________________________ 1. Make a paper helicopter according to the directions and the photo below. You will need
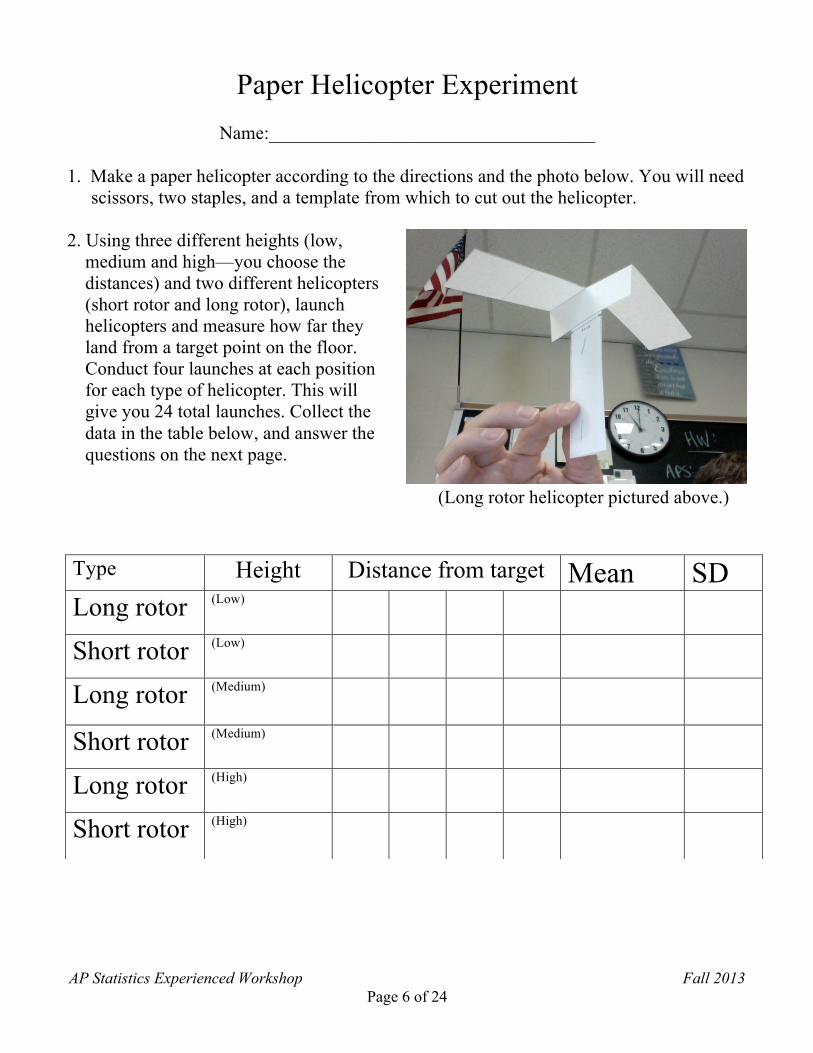
scissors, two staples, and a template from which to cut out the helicopter. 2. Using three different heights (low,
medium and high—you choose the distances) and two different helicopters (short rotor and long rotor), launch helicopters and measure how far they land from a target point on the floor. Conduct four launches at each position for each type of helicopter. This will give you 24 total launches. Collect the data in the table below, and answer the questions on the next page.
(Long rotor helicopter pictured above.)
Type Height Distance from target Mean SD Long rotor (Low) Short rotor (Low) Long rotor (Medium) Short rotor (Medium) Long rotor (High) Short rotor (High)
AP Statistics Experienced Workshop Fall 2013 Page 7 of 24
1. What sources of variation are in this experiment? 2. How did you account for these sources of variation? 3. What are the factors in the experiment? 4. What are the levels of each factor? 5. How many total treatments did you have? ________ 6. How did you use randomization? 7. Describe how you used control in the experiment. 8. Describe the replication used in the experiment. 9. Name at least three possible sources of bias in this experiment (be sure to remember the
definition of bias). 10. For discussion: other problems you encountered that were unexpected/unplanned.
AP Statistics Experienced Workshop Fall 2013 Page 8 of 24
2007 #2: As dogs age, diminished joint and hip health may lead to joint pain and thus reduce a dog’s activity level. Such a reduction in activity can lead to other health concerns such as weight gain and lethargy due to lack of exercise. A study is to be conducted to see which of two dietary supplements, glucosamine or chondroitin, is more effective in promoting joint and hip health and reducing the onset of canine osteoarthritis. Researchers will randomly select a total of 300 dogs from ten different large veterinary practices around the country. All of the dogs are more than 6 years old, and their owners have given consent to participate in the study. Changes in joint and hip health will be evaluated after 6 months of treatment. (a) What would be an advantage to adding a control group in the design of this study? (b) Assuming a control group is added to the other two groups in the study, explain how you would
assign the 300 dogs to these three groups for a completely randomized design. (c) Rather than using a completely randomized design, one group of researchers proposes blocking on
clinics, and another group of researchers proposes blocking on breed of dog. How would you decide which one of these two variables to use as a blocking variable?
AP Statistics Experienced Workshop Fall 2013 Page 9 of 24
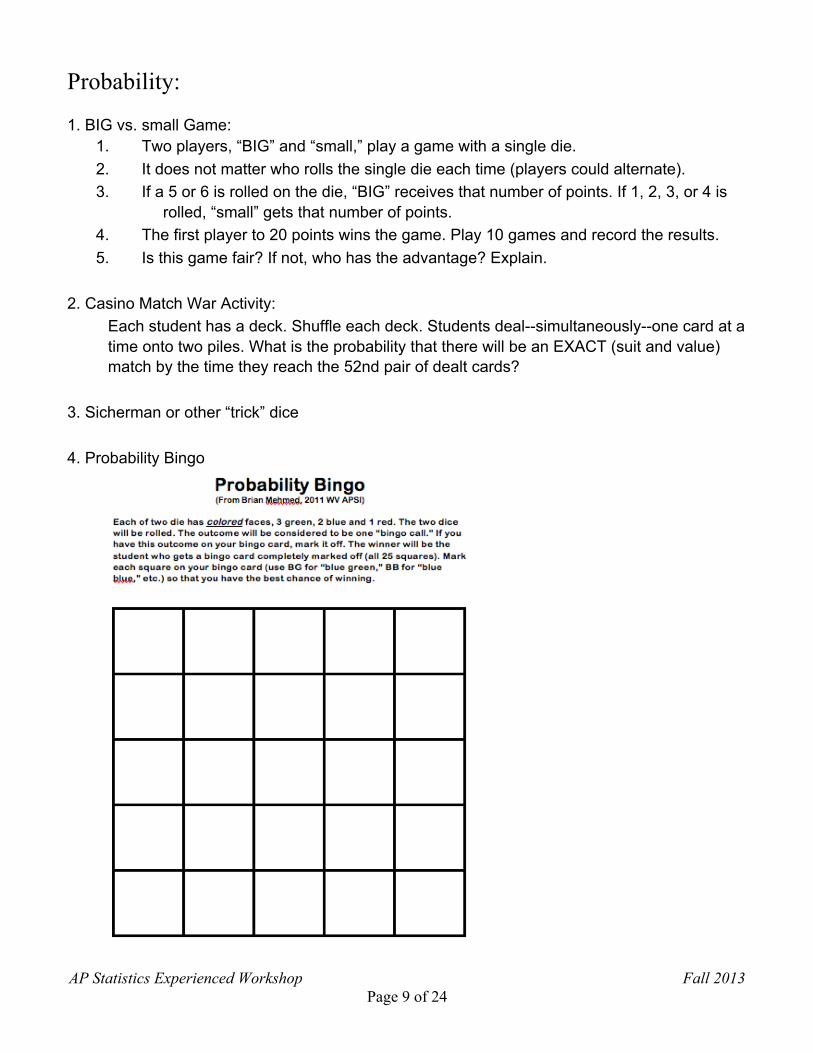
Probability: 1. BIG vs. small Game:
1. Two players, “BIG” and “small,” play a game with a single die. 2. It does not matter who rolls the single die each time (players could alternate). 3. If a 5 or 6 is rolled on the die, “BIG” receives that number of points. If 1, 2, 3, or 4 is
rolled, “small” gets that number of points. 4. The first player to 20 points wins the game. Play 10 games and record the results. 5. Is this game fair? If not, who has the advantage? Explain.
2. Casino Match War Activity:
Each student has a deck. Shuffle each deck. Students deal--simultaneously--one card at a time onto two piles. What is the probability that there will be an EXACT (suit and value) match by the time they reach the 52nd pair of dealt cards?
3. Sicherman or other “trick” dice 4. Probability Bingo
AP Statistics Experienced Workshop Fall 2013 Page 10 of 24
AP Statistics: Random Variables Developing the Rules for +/– Name______________________________________ Let X be a random variable with equally likely outcomes {2, 4, 6, 8} Let Y be a random variable with equally likely outcomes {1, 3, 5}
E(X) = ____________ E(Y) = ______________
SD(X) = ____________ SD(Y) = ______________
VAR(X)= ____________ VAR(Y)= _______________ Now find the set of outcomes for X + Y: {______________________________________________}
Store these values in a list and calculate the mean, SD and variance. E(X + Y) = ___________ SD(X + Y) = ____________ VAR(X + Y) = _________ Find the set of outcomes for X – Y: {______________________________________________}
Store these values in a list and calculate the mean, SD and variance.
E(X – Y) = ____________ SD(X – Y) = _____________ VAR(X – Y) = __________ You should be able to verify that for the sum or difference of independent random variables,
“____________________ ________.”
AP Statistics Experienced Workshop Fall 2013 Page 11 of 24
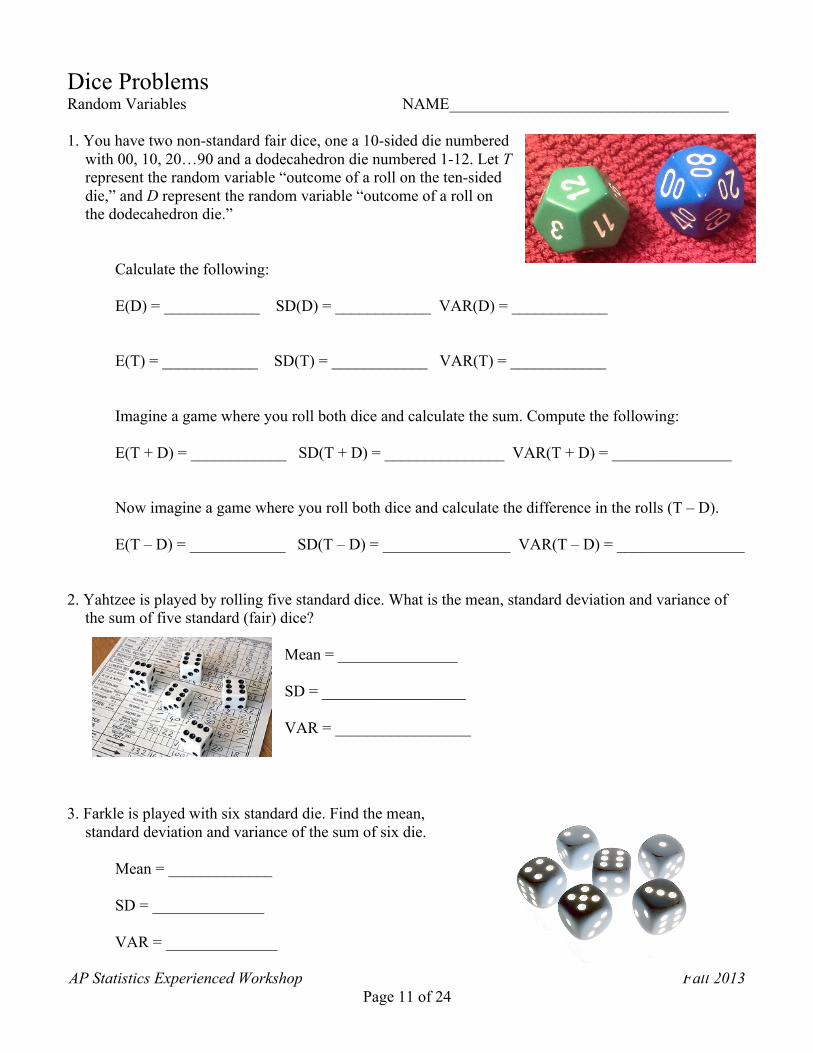
Dice Problems Random Variables NAME___________________________________ 1. You have two non-standard fair dice, one a 10-sided die numbered
with 00, 10, 20…90 and a dodecahedron die numbered 1-12. Let T represent the random variable “outcome of a roll on the ten-sided die,” and D represent the random variable “outcome of a roll on the dodecahedron die.”
Calculate the following: E(D) = ____________ SD(D) = ____________ VAR(D) = ____________ E(T) = ____________ SD(T) = ____________ VAR(T) = ____________ Imagine a game where you roll both dice and calculate the sum. Compute the following: E(T + D) = ____________ SD(T + D) = _______________ VAR(T + D) = _______________ Now imagine a game where you roll both dice and calculate the difference in the rolls (T – D). E(T – D) = ____________ SD(T – D) = ________________ VAR(T – D) = ________________ 2. Yahtzee is played by rolling five standard dice. What is the mean, standard deviation and variance of
the sum of five standard (fair) dice? Mean = _______________ SD = __________________ VAR = _________________
3. Farkle is played with six standard die. Find the mean,
standard deviation and variance of the sum of six die. Mean = _____________ SD = ______________ VAR = ______________
AP Statistics Experienced Workshop Fall 2013 Page 12 of 24
The 12 Days of Christmas On the first day of Christmas, my true love gave to me: A Partridge in a Pear Tree.
If the probability of getting a partridge is .58 and the probability of getting a pear tree is .76, and these are independent events, find the probability of getting a partridge and a pear tree.
On the second day of Christmas , my true love gave to me: Two Turtle Doves.
If the probability of a female turtle dove is .53, find the probability of at least one female turtle dove in the pair.
On the third day of Christmas, my true love gave to me: Three French Hens.
If the probability of a hen truly having French citizenship is .81, find the probability of exactly two French hens out of the three.
On the fourth day of Christmas, my true love gave to me: Four Calling Birds.
If the probability of a bird actually calling is .63, find theprobability of finding the first calling bird on the third attempt.
On the fifth day of Christmas, my true love gave to me: Five Golden Rings.
If the probability of getting a real golden ring is .72, find the probability of getting three or fewer golden rings in the five.
On the sixth day of Christmas, my true love gave to me: Six Geese A-laying.
If the probability of getting an authentic laying goose is .83, find the probability of getting a laying goose on or before the fourth trial.
AP Statistics Experienced Workshop Fall 2013 Page 13 of 24
On the seventh day of Christmas, my true love gave to me: Seven Swans A-swimming.
If the probability that a swan drowns is .23, find the probability of exactly 4 out of the 7 swans drown. On the eighth day of Christmas, my true love gave to me: Eight Maids A-milking.
If the probability of getting a sour maid A-milking is .38, find the expected number of sour maids A-milking.
On the ninth day of Christmas, my true love gave to me: Nine Ladies Dancing.
If the probability of a dancing lady accepting an invitation to danceis .18, what is the expected number of ladies you would have to ask, before one accepts.
On the tenth day of Christmas, my true love gave to me: Ten Lords A-leaping.
If the probability of a lame leaping lord is .24, find the probability of getting your first lame leaping lord after the sixth attempt.
On the eleventh day of Christmas, my true love gave to me: Eleven Pipers Piping.
If the probability of frozen pipes is .63, find the probability of 8 or more frozen pipes. On the twelfth day of Christmas, my true love gave to me: Twelve Drummers Drumming.
If the probability of a dribbling drummer is .48, find the standard deviation of the dribbling drummers drumming.
From Jim Luhring, Cherry Creek HS
AP Statistics Experienced Workshop Fall 2013 Page 14 of 24
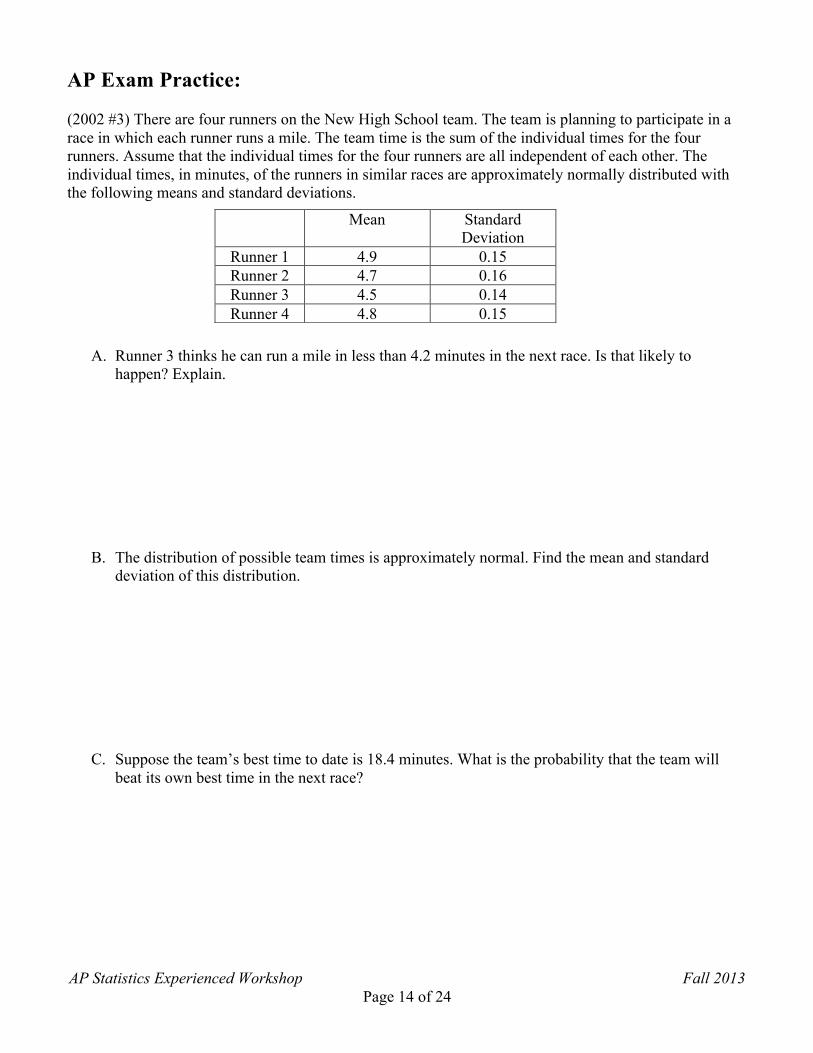
AP Exam Practice: (2002 #3) There are four runners on the New High School team. The team is planning to participate in a race in which each runner runs a mile. The team time is the sum of the individual times for the four runners. Assume that the individual times for the four runners are all independent of each other. The individual times, in minutes, of the runners in similar races are approximately normally distributed with the following means and standard deviations.
A. Runner 3 thinks he can run a mile in less than 4.2 minutes in the next race. Is that likely to happen? Explain.
B. The distribution of possible team times is approximately normal. Find the mean and standard
deviation of this distribution. C. Suppose the team’s best time to date is 18.4 minutes. What is the probability that the team will
beat its own best time in the next race?
Mean Standard Deviation
Runner 1 4.9 0.15 Runner 2 4.7 0.16 Runner 3 4.5 0.14 Runner 4 4.8 0.15
AP Statistics Experienced Workshop Fall 2013 Page 15 of 24
Inference: The Pièce de Résistance! the most important or remarkable feature…literally "piece which has staying power"
1. The foundation of inference: s____________________ d________________________ 2. German Tanks Problem:
During WWII, Allied spies were asked to estimate the numbers of tanks the Germans had of various types. At about the same time, the Allies were able to capture a number of German tanks, and it was discovered that part numbers on the tanks had coded information that almost certainly indicated serial numbers from the same factories. The part numbers were decoded, and British mathematicians were given the serial numbers and asked to estimate the number of tanks. The mathematicians came up with estimates quite a bit lower than those given by the spies. Long after the war, it was discovered that the spies had been deceived by the Germans repainting their tanks to increase their apparent numbers. The mathematicians were much closer to getting the number of tanks right.1 a. Take a random sample of 7 tank numbers from a population of an unknown number of tank numbers. Assume the tank numbers are consecutive integers. (You can also assume the lowest number is “1.”) b. In your group, create three reasonable statistics from these seven numbers that would give an estimate of the largest number in the population (think about what you have learned about distributions). Discuss and decide which of the three is your “best” estimator of the maximum tank number. c. Calculate your group’s estimates of the maximum tank number using this method. d. Now let’s think: assume one group’s estimate was only 5 off from the correct answer. Explain why this does not necessarily mean that they have the best method. e. What would happen if we took another sample of seven tank numbers and your group estimated the maximum tank number? f. How could we decide which group’s method was the best in the long run? What would be the features of such a method? g. Let’s use Fathom to simulate some of these statistics from your groups. h. Examine the handout of several statistics and their sampling distributions.
1 This problem was first introduced to the world in 1947, shortly after many documents concerning WWII became declassified. The original article was An Empirical Approach to Economic Intelligence in World War II by Richard Ruggles and Henry Brodie, published in the Journal of the American Statistical Association, Vol. 42, No. 237. (Mar., 1947), pp. 72–91. Much has been published about it since then, and information can readily be found on the Web by searching for “German Tank Problem.”
AP Statistics Experienced Workshop Fall 2013 Page 16 of 24
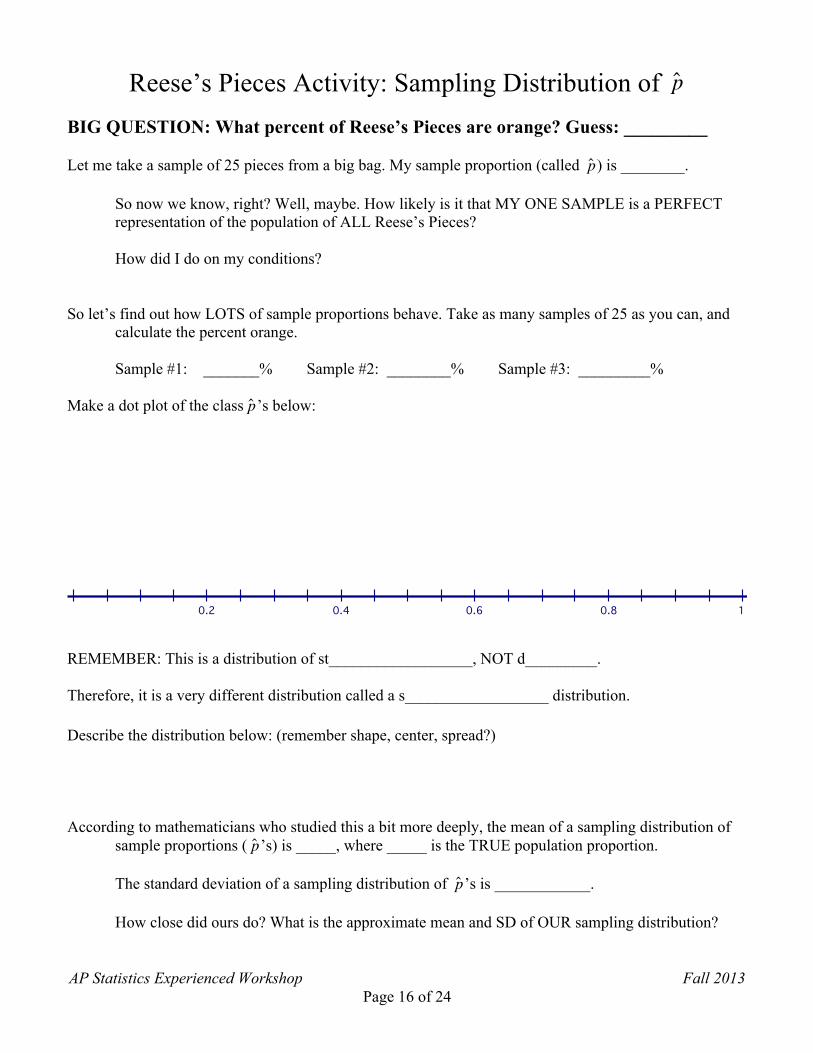
Reese’s Pieces Activity: Sampling Distribution of
�
ˆ p BIG QUESTION: What percent of Reese’s Pieces are orange? Guess: _________ Let me take a sample of 25 pieces from a big bag. My sample proportion (called
�
ˆ p ) is ________. So now we know, right? Well, maybe. How likely is it that MY ONE SAMPLE is a PERFECT
representation of the population of ALL Reese’s Pieces? How did I do on my conditions? So let’s find out how LOTS of sample proportions behave. Take as many samples of 25 as you can, and
calculate the percent orange. Sample #1: _______% Sample #2: ________% Sample #3: _________% Make a dot plot of the class
�
ˆ p ’s below:
0.2 0.4 0.6 0.8 1
REMEMBER: This is a distribution of st__________________, NOT d_________. Therefore, it is a very different distribution called a s__________________ distribution. Describe the distribution below: (remember shape, center, spread?) According to mathematicians who studied this a bit more deeply, the mean of a sampling distribution of
sample proportions (
�
ˆ p ’s) is _____, where _____ is the TRUE population proportion. The standard deviation of a sampling distribution of
�
ˆ p ’s is ____________. How close did ours do? What is the approximate mean and SD of OUR sampling distribution?
AP Statistics Experienced Workshop Fall 2013 Page 17 of 24
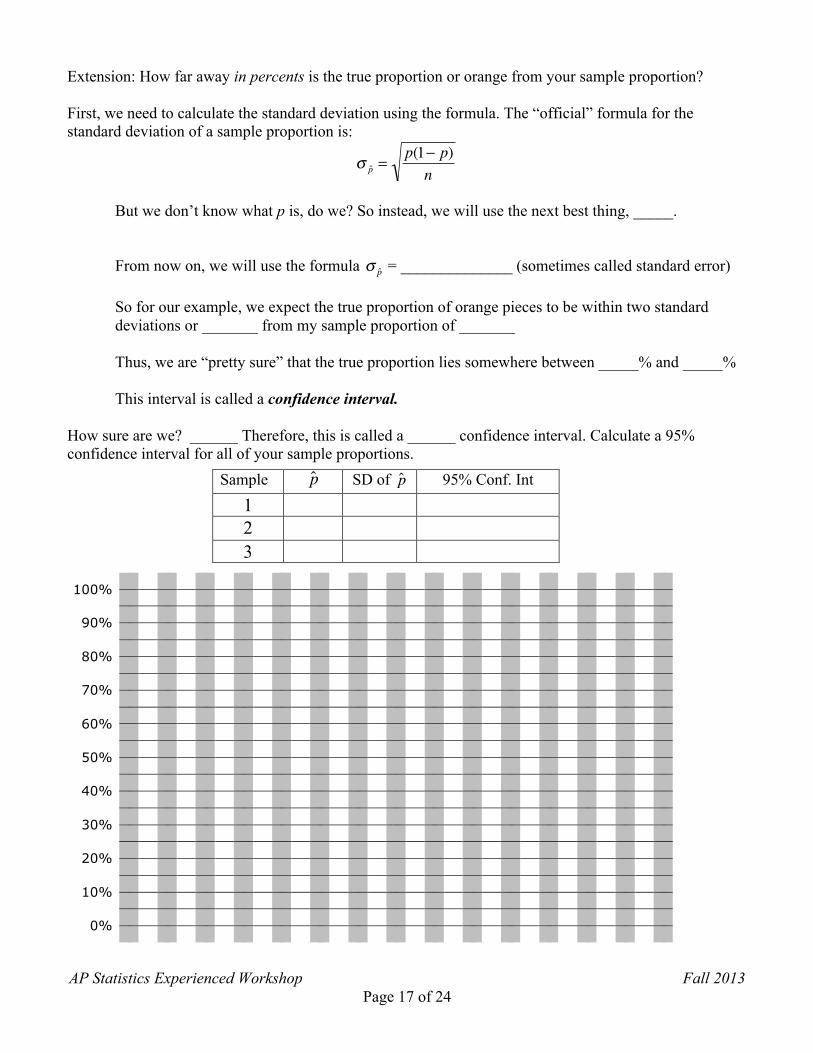
Extension: How far away in percents is the true proportion or orange from your sample proportion? First, we need to calculate the standard deviation using the formula. The “official” formula for the standard deviation of a sample proportion is:
�
σ ˆ p =p(1− p)
n
But we don’t know what p is, do we? So instead, we will use the next best thing, _____.
From now on, we will use the formula
�
σ ˆ p = ______________ (sometimes called standard error) So for our example, we expect the true proportion of orange pieces to be within two standard
deviations or _______ from my sample proportion of _______ Thus, we are “pretty sure” that the true proportion lies somewhere between _____% and _____% This interval is called a confidence interval. How sure are we? ______ Therefore, this is called a ______ confidence interval. Calculate a 95% confidence interval for all of your sample proportions.
100% 90% 80% 70% 60% 50% 40% 30% 20% 10% 0%
Sample
�
ˆ p SD of
�
ˆ p 95% Conf. Int
1 2
3
AP Statistics Experienced Workshop Fall 2013 Page 18 of 24
2004B #3. Trains carry bauxite ore from a mine in Canada to an aluminum processing plant in northern New York state in hopper cars. Filling equipment is used to load ore into the hopper cars. When functioning properly, the actual weights of ore loaded into each car by the filling equipment at the mine are approximately normally distributed with a mean of 70 tons and a standard deviation of 0.9 ton. If the mean is greater than 70 tons, the loading mechanism is overfilling. (a) If the filling equipment is functioning properly, what is the probability that the weight of the ore in a randomly selected car will be 70.7 tons or more? Show your work. (b) Suppose that the weight of ore in a randomly selected car is 70.7 tons. Would that fact make you suspect that the loading mechanism is overfilling the cars? Justify your answer. (c) If the filling equipment is functioning properly, what is the probability that a random sample of 10 cars will have a mean ore of 70.7 tons or more? Show your work. (d) Based on your answer in part (c), if a random sample of 10 cars had a mean ore weight of 70.7 tons, would you suspect that the loading mechanism was overfilling the cars? Justify your answer.
AP Statistics Experienced Workshop Fall 2013 Page 19 of 24
AP Statistics Exam General Information: • The AP Statistics Exam is Friday, May 9, 2014 from 12-4 PM • There are ______ multiple choice questions on the AP Statistics Exam.
• There are ______ free response questions on the AP Statistics Exam. • Each part weighs 50% (scaled to _______ points each)
• Students have ______ minutes for each section of the exam.
• #_____ of the Free Response part is called the Investigative Task.
• Students should reserve about _____ minutes to complete this problem.
• It is worth _____ of the free response section, or _____ of the entire test.
• It typically covers several ________ _______________.
• It typically introduces something _________.
• Students should have a strategy: 1. S___________/s________ the entire test, and r_______ problems. 2. Find the two _________________ and do those first (≈20 minutes) 3. Then do #6 (up to 25 minutes) 4. Then spend the rest of your time (≈45 minutes) on the last three.
The investigative Task is designed to _________________ you. Try to _________________ read, think and give your best answers.
________ credit earned on the Investigative Task will help your overall score.
Mean scores on recent Investigative Tasks: ____________, _____________, _____________
AP Statistics Experienced Workshop Fall 2013 Page 20 of 24
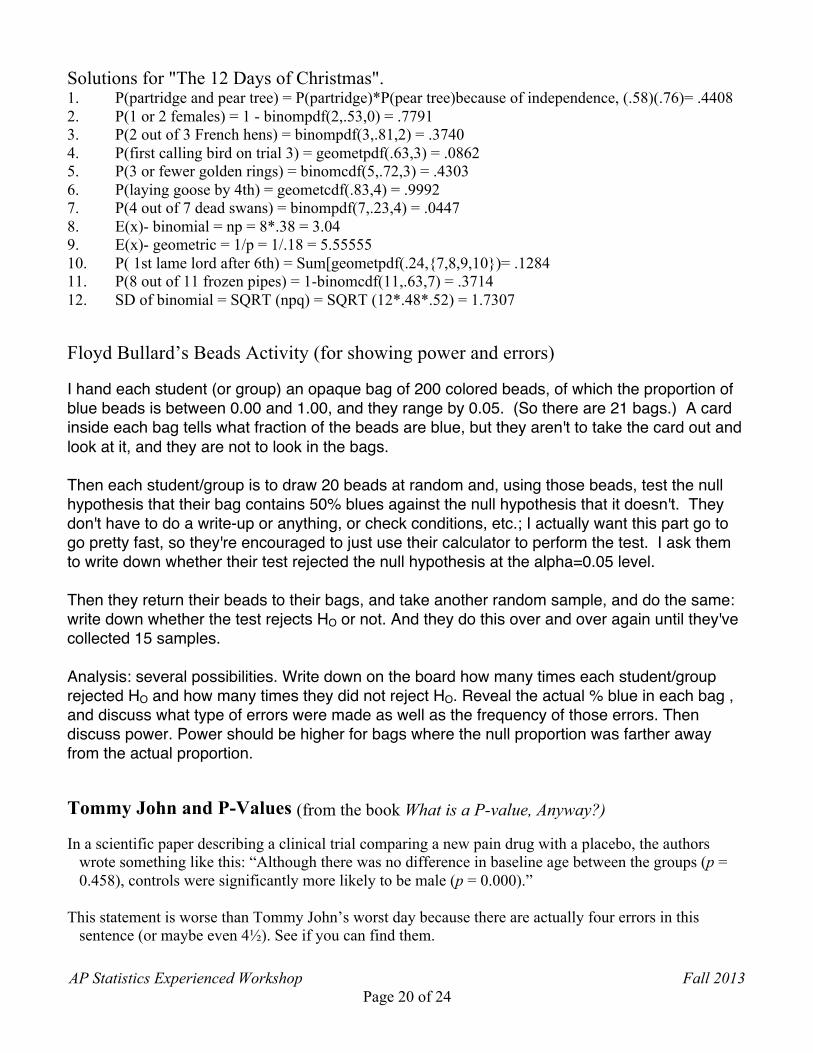
Solutions for "The 12 Days of Christmas". 1. P(partridge and pear tree) = P(partridge)*P(pear tree)because of independence, (.58)(.76)= .4408 2. P(1 or 2 females) = 1 - binompdf(2,.53,0) = .7791 3. P(2 out of 3 French hens) = binompdf(3,.81,2) = .3740 4. P(first calling bird on trial 3) = geometpdf(.63,3) = .0862 5. P(3 or fewer golden rings) = binomcdf(5,.72,3) = .4303 6. P(laying goose by 4th) = geometcdf(.83,4) = .9992 7. P(4 out of 7 dead swans) = binompdf(7,.23,4) = .0447 8. E(x)- binomial = np = 8*.38 = 3.04 9. E(x)- geometric = 1/p = 1/.18 = 5.55555 10. P( 1st lame lord after 6th) = Sum[geometpdf(.24,{7,8,9,10})= .1284 11. P(8 out of 11 frozen pipes) = 1-binomcdf(11,.63,7) = .3714 12. SD of binomial = SQRT (npq) = SQRT (12*.48*.52) = 1.7307 Floyd Bullard’s Beads Activity (for showing power and errors)
I hand each student (or group) an opaque bag of 200 colored beads, of which the proportion of blue beads is between 0.00 and 1.00, and they range by 0.05. (So there are 21 bags.) A card inside each bag tells what fraction of the beads are blue, but they aren't to take the card out and look at it, and they are not to look in the bags. Then each student/group is to draw 20 beads at random and, using those beads, test the null hypothesis that their bag contains 50% blues against the null hypothesis that it doesn't. They don't have to do a write-up or anything, or check conditions, etc.; I actually want this part go to go pretty fast, so they're encouraged to just use their calculator to perform the test. I ask them to write down whether their test rejected the null hypothesis at the alpha=0.05 level. Then they return their beads to their bags, and take another random sample, and do the same: write down whether the test rejects HO or not. And they do this over and over again until they've collected 15 samples. Analysis: several possibilities. Write down on the board how many times each student/group rejected HO and how many times they did not reject HO. Reveal the actual % blue in each bag , and discuss what type of errors were made as well as the frequency of those errors. Then discuss power. Power should be higher for bags where the null proportion was farther away from the actual proportion. Tommy John and P-Values (from the book What is a P-value, Anyway?)
In a scientific paper describing a clinical trial comparing a new pain drug with a placebo, the authors wrote something like this: “Although there was no difference in baseline age between the groups (p = 0.458), controls were significantly more likely to be male (p = 0.000).”
This statement is worse than Tommy John’s worst day because there are actually four errors in this
sentence (or maybe even 4½). See if you can find them.
AP Statistics Experienced Workshop Fall 2013 Page 21 of 24
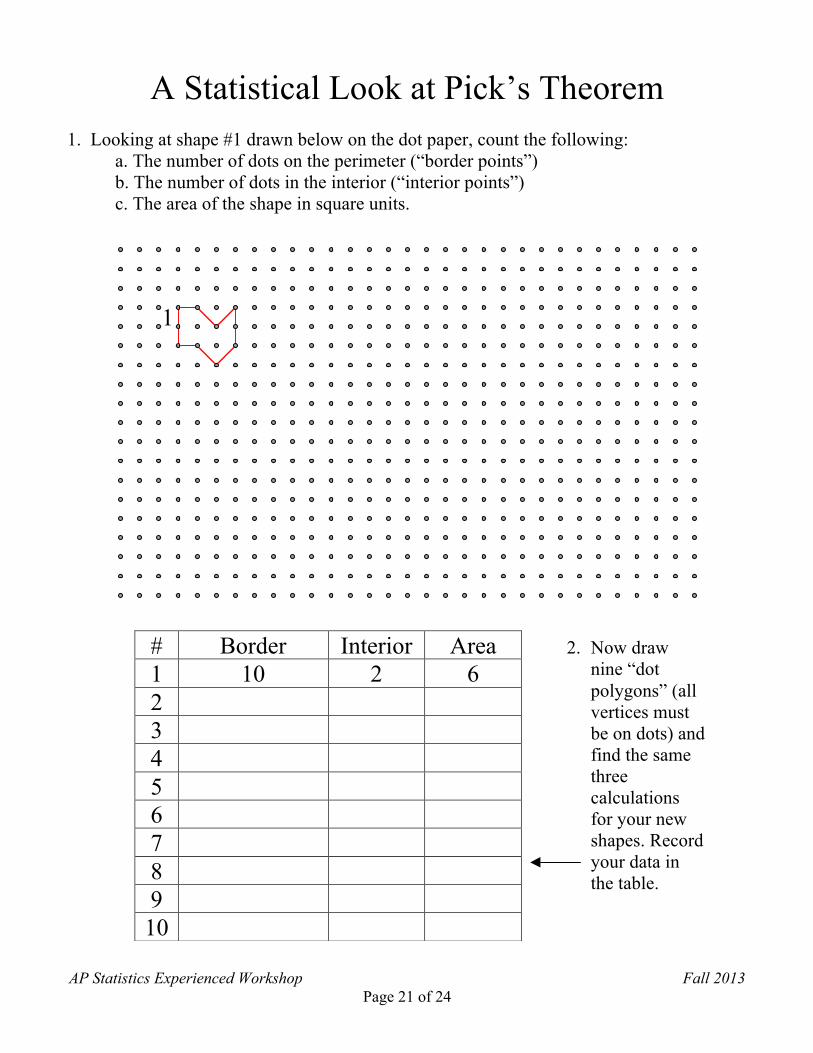
A Statistical Look at Pick’s Theorem 1. Looking at shape #1 drawn below on the dot paper, count the following: a. The number of dots on the perimeter (“border points”) b. The number of dots in the interior (“interior points”) c. The area of the shape in square units.
# Border Interior Area 1 10 2 6 2 3 4 5 6 7 8 9 10
2. Now draw nine “dot polygons” (all vertices must be on dots) and find the same three calculations for your new shapes. Record your data in the table.
1
AP Statistics Experienced Workshop Fall 2013 Page 22 of 24
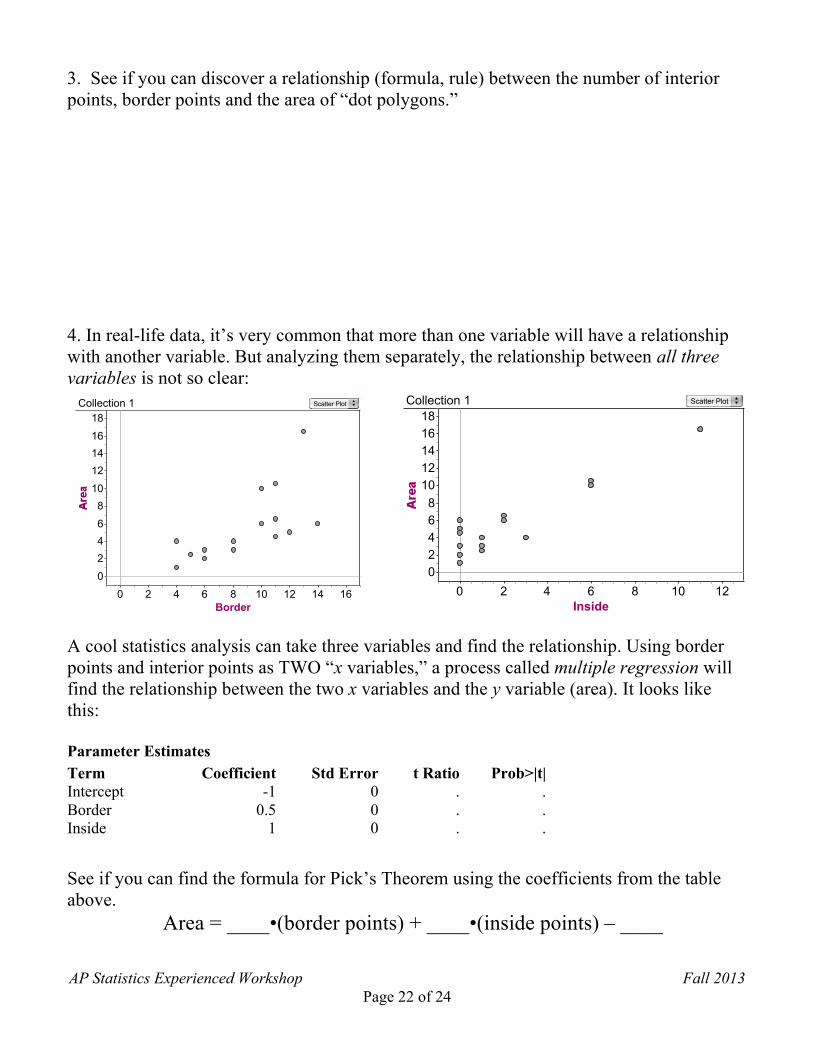
3. See if you can discover a relationship (formula, rule) between the number of interior points, border points and the area of “dot polygons.” 4. In real-life data, it’s very common that more than one variable will have a relationship with another variable. But analyzing them separately, the relationship between all three variables is not so clear:
0
246
810
121416
18
Border0 2 4 6 8 10 12 14 16
Collection 1 Scatter Plot
02468
1012141618
Inside0 2 4 6 8 10 12
Collection 1 Scatter Plot
A cool statistics analysis can take three variables and find the relationship. Using border points and interior points as TWO “x variables,” a process called multiple regression will find the relationship between the two x variables and the y variable (area). It looks like this: Parameter Estimates
See if you can find the formula for Pick’s Theorem using the coefficients from the table above. Area = ____•(border points) + ____•(inside points) – ____
Term Coefficient Std Error t Ratio Prob>|t| Intercept -1 0 . . Border 0.5 0 . . Inside 1 0 . .
AP Statistics Experienced Workshop Fall 2013 Page 23 of 24
PAPER HELICOPTER DESIGN Original Design by George Box
AP Statistics Experienced Workshop Fall 2013 Page 24 of 24
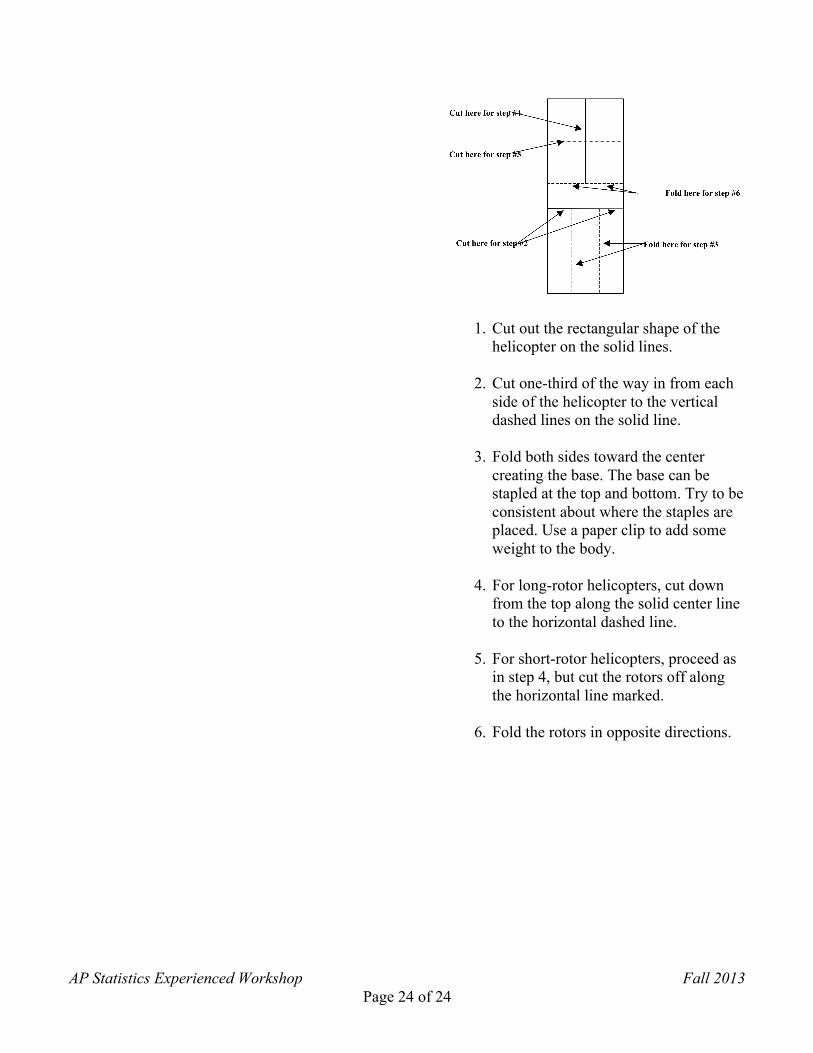
1. Cut out the rectangular shape of the helicopter on the solid lines.
2. Cut one-third of the way in from each
side of the helicopter to the vertical dashed lines on the solid line.
3. Fold both sides toward the center
creating the base. The base can be stapled at the top and bottom. Try to be consistent about where the staples are placed. Use a paper clip to add some weight to the body.
4. For long-rotor helicopters, cut down
from the top along the solid center line to the horizontal dashed line.
5. For short-rotor helicopters, proceed as
in step 4, but cut the rotors off along the horizontal line marked.
6. Fold the rotors in opposite directions.