Embed Size (px)
Citation preview

3Module
UNESCO International Institute for Educational Planning
Kenneth N. Ross
Sample design for educational survey
research
Quantitative research methods in educational planning
Series editor: Kenneth N.Ross

Sample design for educational survey researchModule 3
Content
1
1. Basic concepts of sample design for educational survey research 1Populations : desired, defined, and excluded 2
Sampling frames 3
Representativeness 4
Probability samples and non-probability samples 5
Types of non-probability samples 61. Judgement sampling 7
2. Convenience sampling 7
3. Quota sampling 8
Types of probability samples 81. Simple random sampling 9
2. Stratified sampling 10
3. Cluster sampling 11
The accuracy of estimates obtained from probability samples 131. Mean square error 13
2. The accuracy of individual sample estimates 15
3. Comparison of the accuracy of probability samples 16
Sample design for two-stage cluster samples 171. The design effect for two-stage cluster samples 18
2. The effective sample size for two-stage cluster samples 19
Sample design tables for two-stage cluster samples 20
© UNESCO
http://www.sacmeq.org and http://www.unesco.org/iiep
Sample design for educational survey researchModule 3
II
2. How to draw a national sample of students: a hypothetical example for ‘country x’ 27
3. How to draw a national sample of schools and students: a real example for Zimbabwe 48
4. The estimation of sampling errors 64The Jackknife Procedure 66
5. References 70
Appendix 1Random number tables for selecting a simple random sample of twenty students from groups of students of size 21 to 100 73
Appendix 2Sample design tables (for roh values of 0.1 to 0.9) 78
Appendix 3Estimation of the coefficient of intraclass correlation 81

http://www.sacmeq.org and http://www.unesco.org/iiep

1

1
Basic concepts of sample design for educational survey research
1
Sampling in educational research is generally conducted in order to permit the detailed study of part, rather than the whole, of a population. The information derived from the resulting sample is customarily employed to develop useful generalizations about the population. These generalizations may be in the form of estimates of one or more characteristics associated with the population, or they may be concerned with estimates of the strength of relationships between characteristics within the population.
Provided that scientific sampling procedures are used, the selection of a sample often provides many advantages compared with a complete coverage of the population. For example, reduced costs associated with gathering and analyzing the data, reduced requirements for trained personnel to conduct the fieldwork, improved speed in most aspects of data summarization and reporting, and greater accuracy due to the possibility of more intense supervision of fieldwork and data preparation operations.
The social science research situations in which sampling is used may be divided into the following three broad categories: experiments – in which the introduction of treatment variables occurs according to a pre-arranged experimental design and all extraneous variables are either controlled or randomized; surveys – in which all members of a defined target population have a known
© UNESCO
Sample design for educational survey research
2
Module 3
http://www.sacmeq.org and http://www.unesco.org/iiep
Basic concepts of sample design for educational survey research
3© UNESCO
non-zero probability of selection into the sample; and investigations – in which data are collected without either the randomization of experiments or the probability sampling of surveys.
Experiments are strong with respect to internal validity because they are concerned with the question of whether a true measure of the effect of a treatment variable has been obtained for the subjects in the experiment. Surveys, on the other hand, are strong with respect to external validity because they are concerned with the question of whether the findings obtained for the subjects in the survey may be generalized to a wider population. Investigations are weak with respect to both internal and external validity and their use is due mainly to convenience or low cost.
Populations : desired, defined, and excludedIn any educational research study it is important to have a precise description of the population of elements (persons, organizations, objects, etc.) that is to form the focus of the study. In most studies this population will be a finite one that consists of elements which conform to some designated set of specifications. These specifications provide clear guidance as to which elements are to be included in the population and which are to be excluded.
In order to prepare a suitable description of a population it is essential to distinguish between the population for which the results are ideally required, the desired target population, and the population which is actually studied, the defined target population. An ideal situation, in which the researcher had complete control over the research environment, would lead to both of these populations containing the same elements. However, in most studies, some differences arise due, for example, to (a) noncoverage:
Sample design for educational survey research
2
Module 3
http://www.sacmeq.org and http://www.unesco.org/iiep
Basic concepts of sample design for educational survey research
3© UNESCO
the population description may accidently omit some elements because the researcher has no knowledge of their existence, (b) lack of resources: the researcher may intentionally exclude some elements from the population description because the costs of their inclusion in data gathering operations would be prohibitive, or (c) an ageing population description: the population description may have been prepared at an earlier date and therefore it includes some elements which have ceased to exist.
The defined target population provides an operational definition which may be used to guide the construction of a list of population elements, or sampling frame, from which the sample may be drawn. The elements that are excluded from the desired target population in order to form the defined target population are referred to as the excluded population.
Sampling framesThe selection of a sample from a defined target population requires the construction of a sampling frame. The sampling frame is commonly prepared in the form of a physical list of population elements – although it may also consist of rather unusual listings, such as directories or maps, which display less obvious linkages between individual list entries and population elements. A well-constructed sampling frame allows the researcher to ‘take hold’ of the defined target population without the need to worry about contamination of the listing with incorrect entries or entries which represent elements associated with the excluded population.
Generally the sampling frame incorporates a great deal more structure than one would expect to find in a simple list of elements. For example, in a series of large-scale studies of Reading Literacy carried out in 30 countries during 1991 (Ross, 1991), sampling frames were constructed which listed schools according to a number
Sample design for educational survey research
4
Module 3
http://www.sacmeq.org and http://www.unesco.org/iiep
Basic concepts of sample design for educational survey research
5© UNESCO
of stratification variables: size (number of students), program (for example, comprehensive or selective), region (for example, urban or rural), and sex composition (single sex or coeducational). The use of these stratification variables in the construction of sampling frames was due, in part, to the need to present research results for sample data that had been drawn from particular strata within the sampling frame.
RepresentativenessThe notion of ‘representativeness’ is a frequently used, and often misunderstood, notion in social science research. A sample is often described as being representative if certain percentage frequency distributions of element characteristics within the sample data are similar to corresponding distributions within the whole population.
The population characteristics selected for these comparisons are referred to as ‘marker variables’. These variables are usually selected from among those demographic variables that are readily available for both population and sample. Unfortunately, there are no objective rules for deciding which variables should be nominated as marker variables. Further, there are no agreed benchmarks for assessing the degree of similarity required between percentage frequency distributions for a sample to be judged as ‘representative of the population’.
It is important to note that a high degree of representativeness in a set of sample data refers specifically to the marker variables selected for analysis. It does not refer to other variables assessed by the sample data and therefore does not necessarily guarantee that the sample data will provide accurate estimates for all element characteristics. The assessment of the accuracy of sample data can only be discussed meaningfully with reference to the value of the mean square error, calculated separately, for particular sample estimates (Ross, 1978).
Sample design for educational survey research
4
Module 3
http://www.sacmeq.org and http://www.unesco.org/iiep
Basic concepts of sample design for educational survey research
5© UNESCO
The most popular marker variables in the field of education have commonly been demographic factors associated with students (sex, age, socio-economic status, etc.) and schools (type of school, school location, school size, etc.). For example, in a series of educational research studies carried out in the United States during the early 1970’s, Wolf (1977) selected the following marker variables: sex of student, father’s occupation, father’s education, and mother’s education. These variables were selected because their percentage frequency distributions could be obtained for the population from tabulations prepared by the Bureau of the Census.
Probability samples and non-probability samplesThe use of samples in educational research is usually followed by the calculation of sample estimates with the aim of either (a) estimating the values of population parameters from sample statistics, or (b) testing statistical hypotheses about population parameters. These two aims require that the researcher has some knowledge of the accuracy of the values of sample statistics as estimates of the relevant population parameters. The accuracy of these estimates may generally be derived from statistical theory – provided that probability sampling has been employed. Probability sampling requires that each member of the defined target population has a known, and non-zero, chance of being selected into the sample.
In contrast, the stability of sample estimates based on non-probability sampling cannot be discovered from the internal evidence of a single sample. That is, it is not possible to determine whether a non-probability sample is likely to provide very accurate or very inaccurate estimates of population parameters. Consequently, these types of samples are not appropriate for
Sample design for educational survey research
6
Module 3
http://www.sacmeq.org and http://www.unesco.org/iiep
Basic concepts of sample design for educational survey research
7© UNESCO
dealing objectively with issues concerning either the estimation of population parameters or the testing of hypotheses.
The use of non-probability samples is sometimes carried out with the (usually implied) justification that estimates derived from the sample may be linked to some hypothetical universe of elements rather than to a real population. This justification may lead to research results which are not meaningful if the gap between the hypothetical universe and any relevant real population is too large.
In some circumstances, a well-planned probability sample design can be turned accidentally into a non-probability sample design if subjective judgement is exercised at any stage during the execution of the sample design. Some researchers fall into this trap through a lack of control of field operations at the final stage of a multi-stage sample design.
The most common example of this in educational settings occurs when the researcher goes to great lengths in drawing a probability sample of schools, and then leaves it to the initiative of teaching staff in the sampled schools to select a ‘random sample’ of students or classes.
Types of non-probability samplesThere are three main types of non-probability samples: judgement, convenience, and quota samples. These approaches to sampling result in the elements in the target population having an unknown chance of being selected into the sample. It is always wise to treat research results arising from these types of sample design as suggesting statistical characteristics about the population – rather than as providing population estimates with specifiable confidence limits.
Sample design for educational survey research
6
Module 3
http://www.sacmeq.org and http://www.unesco.org/iiep
Basic concepts of sample design for educational survey research
7© UNESCO
1. Judgement sampling
The process of judgement, or purposive, sampling is based on the assumption that the researcher is able to select elements which represent a ‘typical sample’ from the appropriate target population. The quality of samples selected by using this approach depends on the accuracy of subjective interpretations of what constitutes a typical sample.
It is extremely difficult to obtain meaningful results from a judgement sample because no two experts will agree upon the exact composition of a typical sample. Therefore, in the absence of an external criterion, there is no way in which in the research results obtained from one judgement sample can be judged as being more accurate than the research results obtained from another.
2. Convenience sampling
A sample of convenience is the terminology used to describe a sample in which elements have been selected from the target population on the basis of their accessibility or convenience to the researcher.
Convenience samples are sometimes referred to as ‘accidental samples’ for the reason that elements may be drawn into the sample simply because they just happen to be situated, spatially or administratively, near to where the researcher is conducting the data collection.
The main assumption associated with convenience sampling is that the members of the target population are homogeneous. That is, that there would be no difference in the research results obtained from a random sample, a nearby sample, a co-operative sample, or a sample gathered in some inaccessible part of the population.
Sample design for educational survey research
8
Module 3
http://www.sacmeq.org and http://www.unesco.org/iiep
Basic concepts of sample design for educational survey research
9© UNESCO
As for judgement sampling, there is no way in which the researcher may check the precision of one sample of convenience against another. Indeed the critics of this approach argue that, for many research situations, readily accessible elements within the target population will differ significantly from less accessible elements. They therefore conclude that the use of convenience sampling is likely to introduce a substantial degree of bias into sample estimates of population parameters.
3. Quota sampling
Quota sampling is a frequently used type of non-probability sampling. It is sometimes misleadingly referred to as ‘representative sampling’ because numbers of elements are drawn from various target population strata in proportion to the size of these strata.
While quota sampling places fairly tight restrictions on the number of sample elements per stratum, there is often little or no control exercised over the procedures used to select elements within these strata. For example, either judgement or convenience sampling may be used in any or all of the strata. Therefore, the superficial appearance of accuracy associated with proportionate representation of strata should be considered in the light that there is no way of checking either the accuracy of estimates obtained for any one stratum, or the accuracy of estimates obtained by combining individual stratum estimates.
Types of probability samplesThere are many ways in which a probability sample may be drawn from a population. The method that is most commonly described in textbooks is simple random sampling. This method is rarely used in practical social research situations because
Sample design for educational survey research
8
Module 3
http://www.sacmeq.org and http://www.unesco.org/iiep
Basic concepts of sample design for educational survey research
9© UNESCO
(a) the selection and measurement of individual population elements is often too expensive, and (b) certain complexities may be introduced intentionally into the sample design in order to address more appropriately the objectives and administrative constraints associated with the research. The complexities most often employed in educational research include the use of stratification techniques, cluster sampling, and multiple stages of selection.
1. Simple random sampling
The selection of a simple random sample is usually carried out according to a set of mechanical instructions which guarantees the random nature of the selection procedure.
For example, Kish (1965) provides the following operational definition in order to describe procedures for the selection of a simple random sample of elements without replacement from a finite population of elements:
From a table of random digits select with equal probability n different selection numbers, corresponding to n of the N listing numbers of the population elements. The n listings selected from the list, on which each of the N population elements is represented separately by exactly one listing, must identify uniquely n different elements. (p. 36)
Simple random sampling, as described in this definition, results in an equal probability of selection for all elements in the population. This characteristic, called ‘epsem sampling’ (equal probability of selection method), is not restricted solely to this type of sample design. Equal probability of selection can result from either the use of equal probabilities of selection throughout the sampling process, or from the use varying probabilities that compensate for each other through several stages of multistage sampling. Epsem sampling is widely applied in educational research because it usually leads to self-weighting samples in which the simple arithmetic mean obtained from the sample data is an unbiased estimate of the population mean.
Sample design for educational survey research
10
Module 3
http://www.sacmeq.org and http://www.unesco.org/iiep
Basic concepts of sample design for educational survey research
11© UNESCO
2. Stratified sampling
The technique of stratification is often employed in the preparation of sample designs because it generally provides increased accuracy in sample estimates without leading to substantial increases in costs. Stratification does not imply any departure from probability sampling – it simply requires that the population be divided into subpopulations called strata and that probability sampling be conducted independently within each stratum. The sample estimates of population parameters are then obtained by combining information from each stratum.
In some studies, stratification is used for reasons other than obtaining gains in sampling accuracy. For example, strata may be formed in order to employ different sample designs within strata, or because the subpopulations defined by the strata are designated as separate ‘domains of study’ (Kish, 1987, p. 34).
Variables used to stratify populations in education generally describe demographic aspects concerning schools (for example, location, size, and program) and students (for example, age, sex, grade level, and socio-economic status).
Stratified sampling may result in either proportionate or disproportionate sample designs. In a proportionate stratified sample design the number of observations in the total sample is allocated among the strata of the population in proportion to the relative number of elements in each stratum of the population.
That is, a stratum containing a given percentage of the elements in the population would be represented by the same percentage of the total number of sample elements. In situations where the elements are selected with equal probability within strata, this type of sample design results in epsem sampling and therefore ‘self-weighted’ estimates of population parameters.
Sample design for educational survey research
10
Module 3
http://www.sacmeq.org and http://www.unesco.org/iiep
Basic concepts of sample design for educational survey research
11© UNESCO
In contrast, a disproportionate stratified sample design is associated with the use of different probabilities of selection, or sampling fractions, within the various population strata. This can sometimes occur when the sample is designed to achieve greater overall accuracy than proportionate stratification by using ‘optimum allocation’ (Kish,1965:92). More commonly disproportionate sampling is used in order to ensure that the accuracy of sample estimates obtained for stratum parameters is sufficiently high to be able to make meaningful comparisons between strata.
The sample estimates derived from a disproportionate sample design are generally prepared with the assistance of ‘weighting factors’. These factors, represented either by the inverse of the selection probabilities or by a set of numbers proportional to them, are employed in order to prevent inequalities in selection probabilities from causing the introduction of bias into sample estimates of population parameters. The reciprocals of the selection probalities, sometimes called ‘raising factors’, refer to the number of elements in the population represented by a sample element (Ross, 1978).
In the field of educational research, the weighting factors are often calculated so as to ensure that the sum of the weighting factors over all elements in the sample is equal to the sample size. This ensures that the readers of research reports are not confused by differences between actual and weighted sample sizes.
3. Cluster sampling
A population of elements can usually be thought of as a hierarchy of different sized groups or ‘clusters’ of sampling elements. These groups may vary in size and nature. For example, a population of school students may be grouped into a number of classrooms, or it may be grouped into a number of schools. A sample of students may then be selected from this population by selecting clusters of students
Sample design for educational survey research
12
Module 3
http://www.sacmeq.org and http://www.unesco.org/iiep
Basic concepts of sample design for educational survey research
13© UNESCO
as classroom groups or school groups rather than individually as would occur when using a simple random sample design.
The use of cluster sampling in educational research is sometimes undertaken as an alternative to simple random sampling in order to reduce research costs for a given sample size. For example, a cluster sample consisting of the selection of 10 classes – each containing around 20 students – would generally lead to smaller data collection costs compared with a simple random sample of 200 students. The reduced costs occur because the simple random sample may require the researcher to collect data in as many as 200 schools.
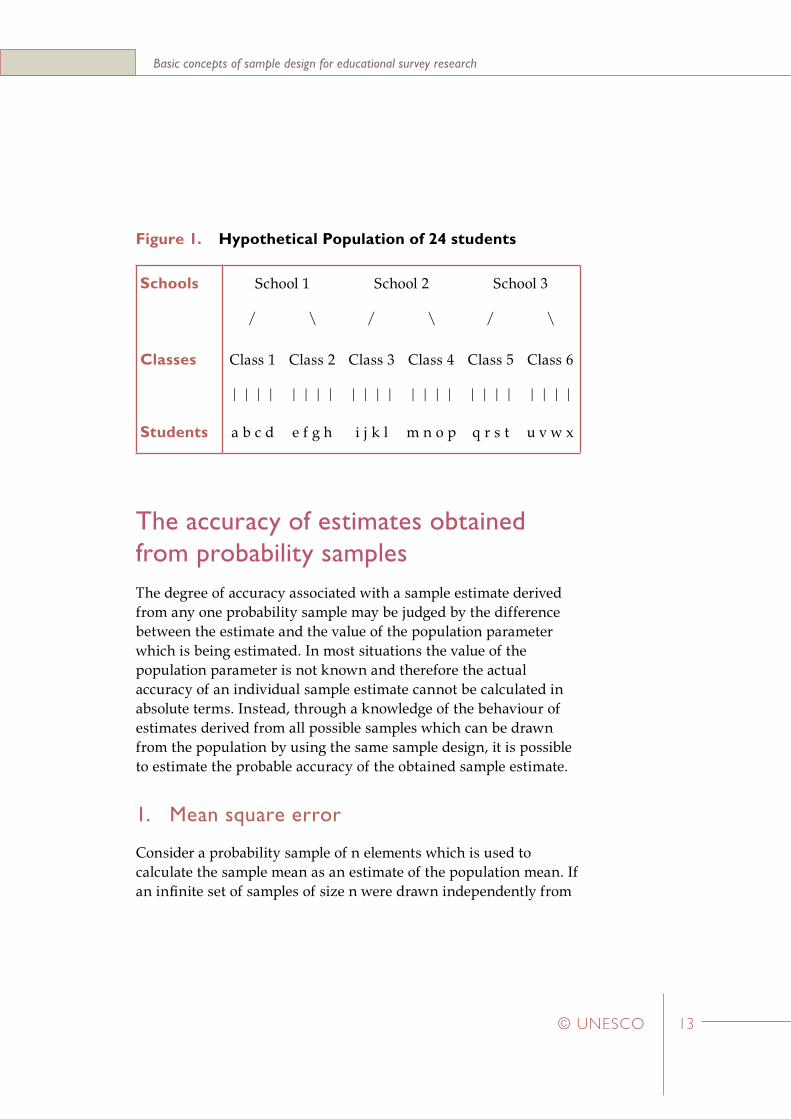
Cluster sampling does not prevent the application of probability sampling techniques. This may be demonstrated by examining several ways in which cluster samples may be drawn from a population of students. Consider the hypothetical population, described in Figure 1, of twenty-four students distributed among six classrooms (with four students per class) and three schools (with two classes per school).
A simple random sample of four students drawn without replacement from this population would result in an epsem sample with each element having a probability of selection, p, equal to 1/6 (Kish. 1965:40). A range of cluster samples, listed below with their associated p values, may also be drawn in a manner which results in epsem samples.
• Randomly select one class, then include all students in this class in the sample. (p = 1/6 x 4/4 = 1/6).
• Randomly select two classes, then select a random sample of two students from within these classes. (p = 2/6 x 2/4 = 1/6).
• Randomly select two schools, then select a random sample of one class from within each of these schools, then select a random sample of two students from within these classes. (p = 2/3 x 1/2 x 2/4 = 1/6).
Sample design for educational survey research
12
Module 3
http://www.sacmeq.org and http://www.unesco.org/iiep
Basic concepts of sample design for educational survey research
13© UNESCO
Figure 1. Hypothetical Population of 24 students
Schools School 1 School 2 School 3
/ \ / \ / \
Classes Class 1 Class 2 Class 3 Class 4 Class 5 Class 6
| | | | | | | | | | | | | | | | | | | | | | | |
Students a b c d e f g h i j k l m n o p q r s t u v w x
The accuracy of estimates obtained from probability samplesThe degree of accuracy associated with a sample estimate derived from any one probability sample may be judged by the difference between the estimate and the value of the population parameter which is being estimated. In most situations the value of the population parameter is not known and therefore the actual accuracy of an individual sample estimate cannot be calculated in absolute terms. Instead, through a knowledge of the behaviour of estimates derived from all possible samples which can be drawn from the population by using the same sample design, it is possible to estimate the probable accuracy of the obtained sample estimate.
1. Mean square error
Consider a probability sample of n elements which is used to calculate the sample mean as an estimate of the population mean. If an infinite set of samples of size n were drawn independently from
14
Sample design for educational survey researchModule 3
http://www.sacmeq.org and http://www.unesco.org/iiep
Basic concepts of sample design for educational survey research
15© UNESCO
this population and the sample mean calculated for each sample, the average of the resulting sampling distribution of sample means would be referred to as the expected value.
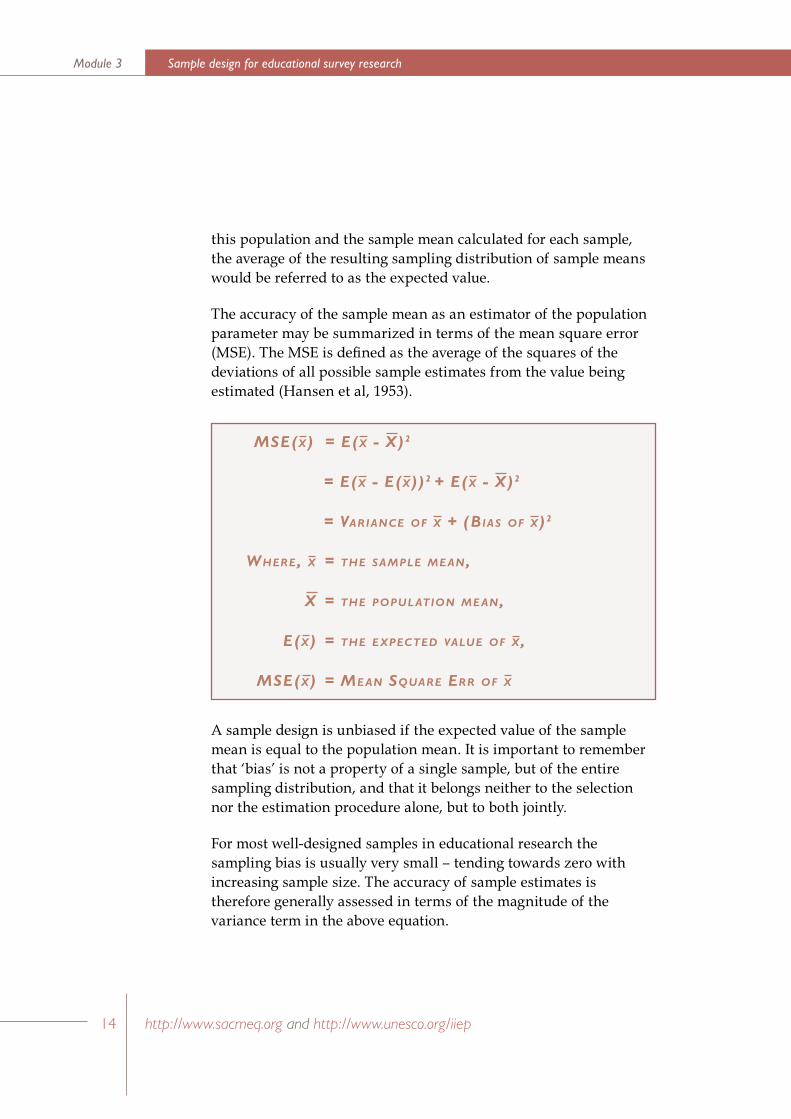
The accuracy of the sample mean as an estimator of the population parameter may be summarized in terms of the mean square error (MSE). The MSE is defined as the average of the squares of the deviations of all possible sample estimates from the value being estimated (Hansen et al, 1953).
A sample design is unbiased if the expected value of the sample mean is equal to the population mean. It is important to remember that ‘bias’ is not a property of a single sample, but of the entire sampling distribution, and that it belongs neither to the selection nor the estimation procedure alone, but to both jointly.
For most well-designed samples in educational research the sampling bias is usually very small – tending towards zero with increasing sample size. The accuracy of sample estimates is therefore generally assessed in terms of the magnitude of the variance term in the above equation.
14
Sample design for educational survey researchModule 3
http://www.sacmeq.org and http://www.unesco.org/iiep
Basic concepts of sample design for educational survey research
15© UNESCO
2. The accuracy of individual sample estimates
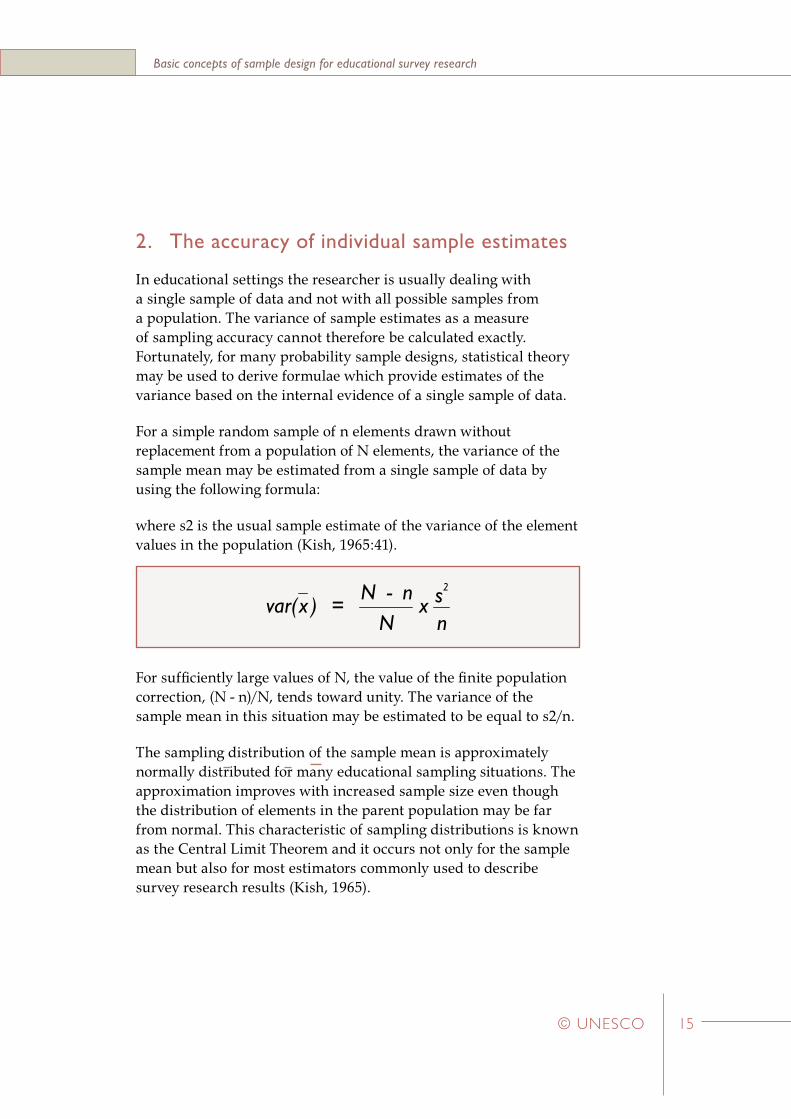
In educational settings the researcher is usually dealing with a single sample of data and not with all possible samples from a population. The variance of sample estimates as a measure of sampling accuracy cannot therefore be calculated exactly. Fortunately, for many probability sample designs, statistical theory may be used to derive formulae which provide estimates of the variance based on the internal evidence of a single sample of data.
For a simple random sample of n elements drawn without replacement from a population of N elements, the variance of the sample mean may be estimated from a single sample of data by using the following formula:
where s2 is the usual sample estimate of the variance of the element values in the population (Kish, 1965:41).
For sufficiently large values of N, the value of the finite population correction, (N - n)/N, tends toward unity. The variance of the sample mean in this situation may be estimated to be equal to s2/n.
The sampling distribution of the sample mean is approximately normally distributed for many educational sampling situations. The approximation improves with increased sample size even though the distribution of elements in the parent population may be far from normal. This characteristic of sampling distributions is known as the Central Limit Theorem and it occurs not only for the sample mean but also for most estimators commonly used to describe survey research results (Kish, 1965).
���
������
��������
16
Sample design for educational survey researchModule 3
http://www.sacmeq.org and http://www.unesco.org/iiep
Basic concepts of sample design for educational survey research
17© UNESCO
From a knowledge of the properties of the normal distribution we know that we can be “68 per cent confident” that the population mean lies within the range specified by:
(the sample mean ± one standard error of the sample mean)
where the standard error of the sample mean is equal to the square root of the variance of the sample mean. Similarly the we can be “95 percent confident” that the population mean lies within the range specified by:
(sample mean ± two standard errors of the sample mean)
While the above discussion has concentrated mostly on sample means derived from simple random samples, the same approach may be used to set up confidence limits for many other population values derived from various types of sample designs. For example, confidence limits may be calculated for complex statistics such as correlation coefficients, regression coefficients, multiple correlation coefficients, etc. (Ross, 1978).
3. Comparison of the accuracy of probability samples
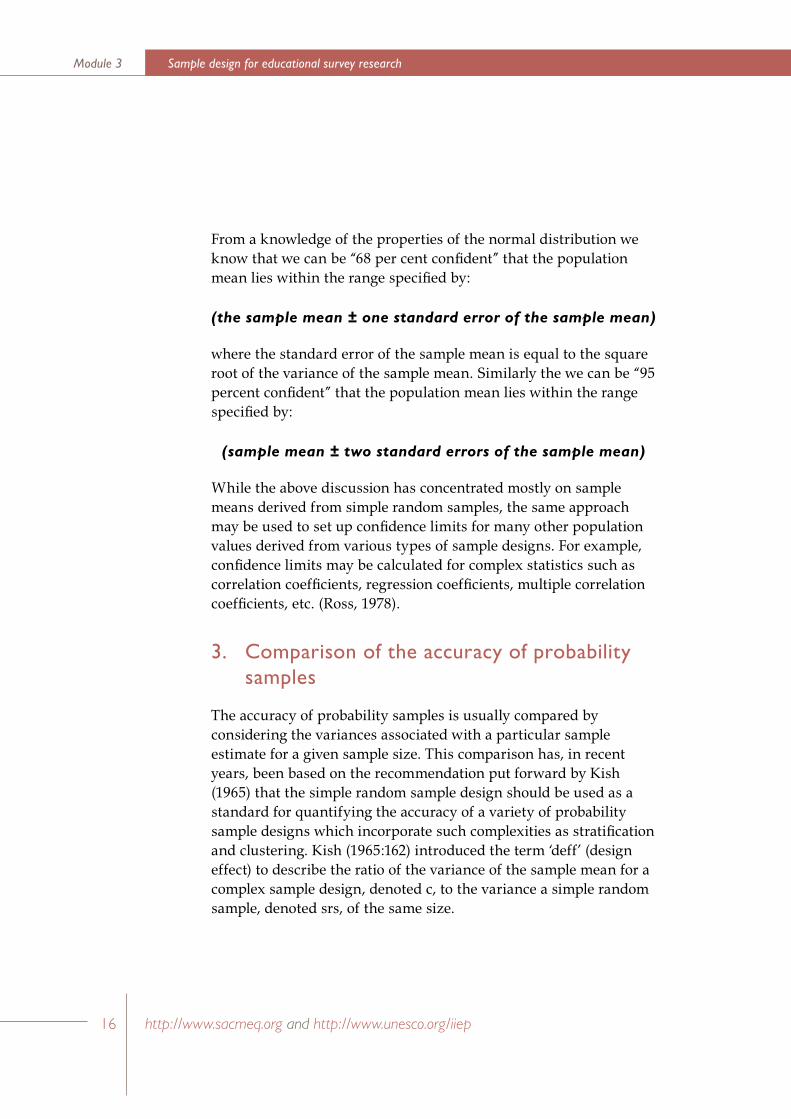
The accuracy of probability samples is usually compared by considering the variances associated with a particular sample estimate for a given sample size. This comparison has, in recent years, been based on the recommendation put forward by Kish (1965) that the simple random sample design should be used as a standard for quantifying the accuracy of a variety of probability sample designs which incorporate such complexities as stratification and clustering. Kish (1965:162) introduced the term ‘deff’ (design effect) to describe the ratio of the variance of the sample mean for a complex sample design, denoted c, to the variance a simple random sample, denoted srs, of the same size.
16
Sample design for educational survey researchModule 3
http://www.sacmeq.org and http://www.unesco.org/iiep
Basic concepts of sample design for educational survey research
17© UNESCO
The potential for arriving at false conclusions in educational research by using incorrect sampling error calculations has been demonstrated in a study carried out by Ross (1976). This study showed that it was highly misleading to assume that sample size was, in itself, an adequate indicator of the sampling accuracy associated with complex sample designs. For example, Ross (1976:40) demonstrated that a two-stage cluster sample of 150 students (that was selected for a study conducted in Australia by randomly selecting 6 classes followed by the random selection of 25 students within these classes) had the same sampling accuracy for sample means as would a simple random sample of 20 students.
Sample design for two-stage cluster samplesThe two-stage cluster sample is probably the most commonly used sample design in educational research. This design is generally employed by selecting either schools or classes at the first stage of sampling, followed by the selection of either clusters of students within schools or clusters of students within classes at the second stage. In many studies the two-stage cluster design is preferred because this design offers an opportunity for the researcher to conduct analyses at more than one level of data aggregation. For example, the selection of students within classes at the second stage of sampling would, provided there were sufficient numbers of classes and numbers of students selected within classes, permit analyses to be carried out at (a) the between-student level (by
������������
��������
�
Sample design for educational survey research
18
Module 3
http://www.sacmeq.org and http://www.unesco.org/iiep
Basic concepts of sample design for educational survey research
19© UNESCO
using data describing individual students), (b) the between-class level (by using data based on class mean scores), or (c) both levels simultaneously using ‘multilevel analysis’ procedures.
In the following discussion some properties of two-stage cluster samples have been described by using the simplifying assumption that the clusters in the population are of equal size. This assumption permits the use of ‘sample design tables’ (see Appendix 2) which provide an excellent aid for designing two-stage cluster samples with pre-specified levels of sampling accuracy.
1. The design effect for two-stage cluster samples
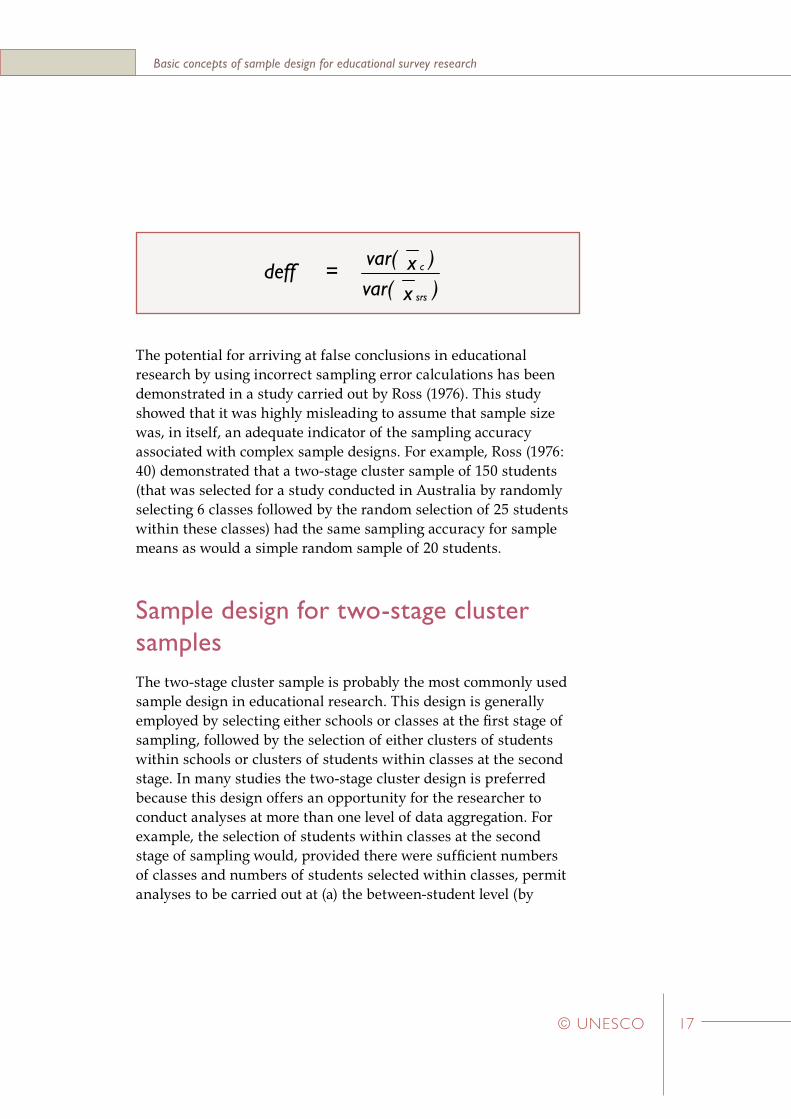
The value of the design effect (Kish, 1965:257) for a two-stage cluster sample design depends, for a given cluster size, on the value of the coefficient of intraclass correlation.
The coefficient of intraclass correlation, often referred to as roh, provides a measure of the degree of homogeneity within clusters. In educational settings the notion of homogeneity within clusters may be observed in the tendency of student characteristics to more homogeneous within schools, or classes, than would be the case if students were assigned to schools, or classes, at random. This homogeneity may be due to common selective factors (for example,
where b is the size of the selected clusters, and roh is the coefficient of intraclass correlation
�������������������������
��������
�
Sample design for educational survey research
18
Module 3
http://www.sacmeq.org and http://www.unesco.org/iiep
Basic concepts of sample design for educational survey research
19© UNESCO
residential zoning of schools), or to joint exposure to the same external influences (for example, teachers and school programs), or to mutual interaction (for example, peer group pressure), or to some combination of these.
2. The effective sample size for two-stage cluster samples
The “effective sample size” (Kish, 1965:259) for a given two-stage cluster sample is equal to the size of the simple random sample which has a level of sampling accuracy, as measured by the variance of the sample mean, which is equal to the sampling accuracy of the given two-stage cluster sample. A little algebra may be used to demonstrate that the actual sample size, nc, and the effective sample size, n*, for a two-stage cluster sample are related to the design effect associated with that sample in the following manner (Ross, 1978:137-138).
From previous discussion, we may replace deff in this formula by an expression which is a function of the cluster size and the coefficient of intraclass correlation.
For example, consider a two-stage cluster sample based on a sample of 10 schools followed by the selection of 20 students per school. In addition, consider a student characteristic (for example, a test score or attitude scale score) for which the value of the coefficient of intraclass correlation is equal to 0.1. This value of roh would
������� �� �
����������������� �� �
Sample design for educational survey research
20
Module 3
http://www.sacmeq.org and http://www.unesco.org/iiep
Basic concepts of sample design for educational survey research
21© UNESCO
be typical for clusters of students selected randomly from within secondary schools in Australia (Ross, 1983). In this situation, the above formula simplifies to the following expression.
Solving this equation for n* gives a value of 69 for the value of the effective sample size. That is, given the value of 0.1 for roh, a two-stage cluster sample of size 200 that is selected by sampling 10 schools followed by sampling 20 students per school would have sampling accuracy equivalent to a simple random sample of 69 students.
For a given population of students, the value of roh tends to be higher for clusters based on classes rather than clusters based on schools. Ross (1978) has obtained values of roh as high as 0.5 for mathematics test scores based on classes within Australian secondary schools.
Sample design tables for two-stage cluster samplesSample design tables are often prepared for well-designed research studies in which it is intended to employ two-stage cluster sampling. These tables present a range of sample design options – each designed to have a pre-specified level of sampling accuracy. A hypothetical example has been presented in the following discussion in order to illustrate the sequence of calculations and decisions involved in the preparation of these tables.
Consider an educational research study in which test items are administered to a two-stage cluster sample of students with the aim
����������������� � �
Sample design for educational survey research
20
Module 3
http://www.sacmeq.org and http://www.unesco.org/iiep
Basic concepts of sample design for educational survey research
21© UNESCO
of estimating the percentage of students in the population that are able to obtain correct answers. In addition, assume that a sampling accuracy constraint has been placed on the design of the study so as to ensure that the sample estimate of the percentage of students providing the correct answer, p, will provide p + 5 per cent as 95 per cent confidence limits for the value of the percentage in the population.
For reasonably large samples it is possible to assume normality of the distribution of sample estimates (Kish, 1965:13-14) and therefore confidence limits of p + 5 per cent are approximately equivalent to an error range of plus or minus two standard errors of p. Consequently, the error constraint placed on the study means that one standard error of p needs to be less than or equal to 2.5 per cent.
Consider a simple random sample of n* students selected from this population in order to calculate values of p. Statistical theory may be employed to show that, for large populations, the variance of the sample estimate of p as an estimate of the population value may be calculated by using the following formula (Kish, 1965:46).
The maximum value of p(100 - p) occurs for p = 50. Therefore, in order to ensure that we could satisfy the error constraints described above, the following inequality would need to be valid.
���������������
��������
���������������
������
� �
Sample design for educational survey research
22
Module 3
http://www.sacmeq.org and http://www.unesco.org/iiep
Basic concepts of sample design for educational survey research
23© UNESCO
That is, the size of the simple random sample, n*, would have to be greater than, or equal to, about 400 students in order to obtain 95 per cent confidence limits of p + 5 per cent.
Now consider the size of a two-stage cluster sample design which would provide equivalent sampling accuracy to a simple random sample of 400 students. The design of this cluster sample would require knowledge of the numbers of primary sampling units (for example, schools or classes) and the numbers of secondary sampling units (students) which would be required.
From previous discussion, the relationship between the size of the cluster sample, nc, which has the same accuracy as a simple random sample of size n* = 400 may be written in the following fashion. This expression is often described as a ‘planning equation’ because it may be used to explore sample design options for two-stage cluster samples.
The value of nc is equal to the product of the number of primary sampling units, a, and the number of secondary sampling units selected from each primary sampling unit, b. Substituting for nc in this formula, and then transposing provides the following expression for a in terms of b and roh.
������������������� ��
��������������
����� ��
Sample design for educational survey research
22
Module 3
http://www.sacmeq.org and http://www.unesco.org/iiep
Basic concepts of sample design for educational survey research
23© UNESCO
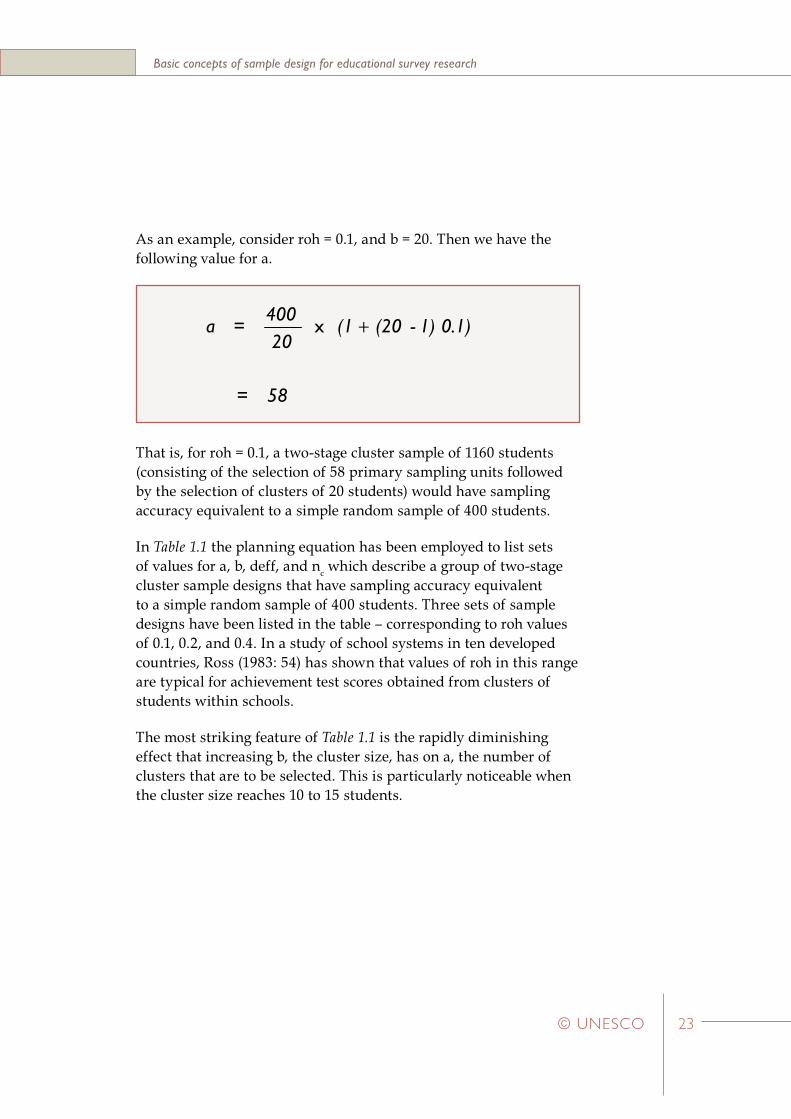
As an example, consider roh = 0.1, and b = 20. Then we have the following value for a.
That is, for roh = 0.1, a two-stage cluster sample of 1160 students (consisting of the selection of 58 primary sampling units followed by the selection of clusters of 20 students) would have sampling accuracy equivalent to a simple random sample of 400 students.
In Table 1.1 the planning equation has been employed to list sets of values for a, b, deff, and nc which describe a group of two-stage cluster sample designs that have sampling accuracy equivalent to a simple random sample of 400 students. Three sets of sample designs have been listed in the table – corresponding to roh values of 0.1, 0.2, and 0.4. In a study of school systems in ten developed countries, Ross (1983: 54) has shown that values of roh in this range are typical for achievement test scores obtained from clusters of students within schools.
The most striking feature of Table 1.1 is the rapidly diminishing effect that increasing b, the cluster size, has on a, the number of clusters that are to be selected. This is particularly noticeable when the cluster size reaches 10 to 15 students.
���
����������������
����� ��
Sample design for educational survey research
24
Module 3
http://www.sacmeq.org and http://www.unesco.org/iiep
Basic concepts of sample design for educational survey research
25© UNESCO
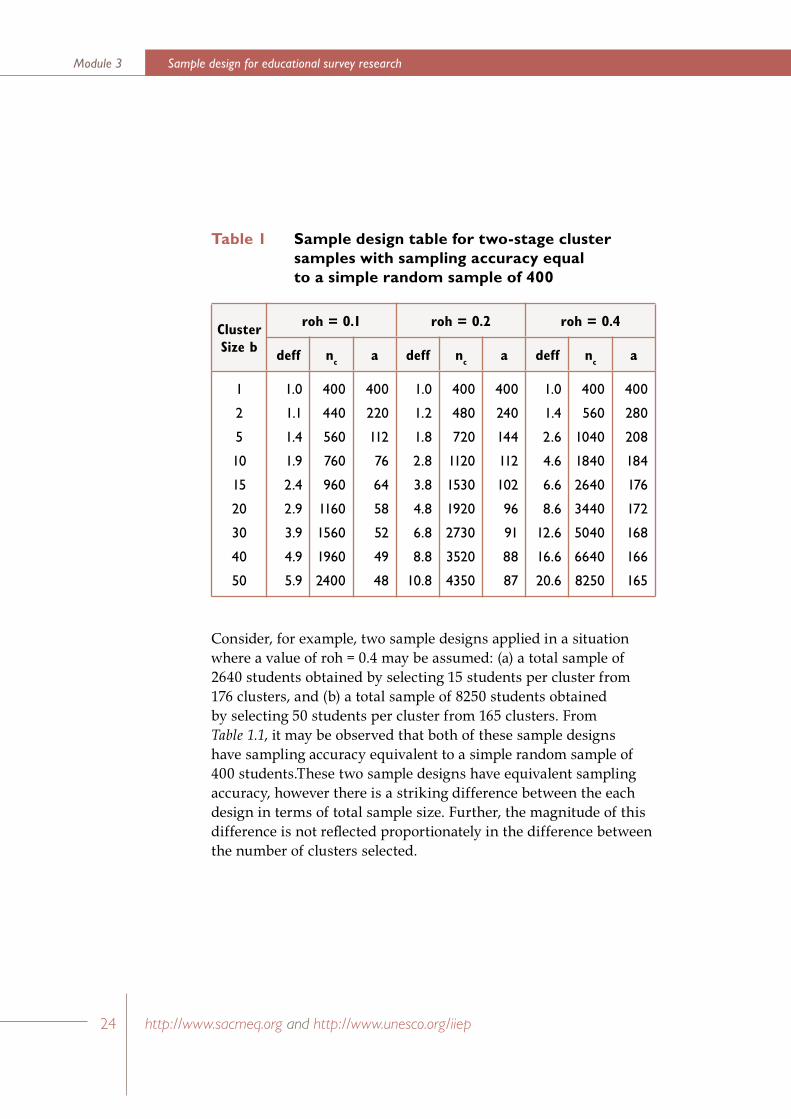
Table 1 Sample design table for two-stage cluster samples with sampling accuracy equal to a simple random sample of 400
Cluster Size b
roh = 0.1 roh = 0.2 roh = 0.4
deff nc a deff nc a deff nc a
1
2
5
10
15
20
30
40
50
1.0
1.1
1.4
1.9
2.4
2.9
3.9
4.9
5.9
400
440
560
760
960
1160
1560
1960
2400
400
220
112
76
64
58
52
49
48
1.0
1.2
1.8
2.8
3.8
4.8
6.8
8.8
10.8
400
480
720
1120
1530
1920
2730
3520
4350
400
240
144
112
102
96
91
88
87
1.0
1.4
2.6
4.6
6.6
8.6
12.6
16.6
20.6
400
560
1040
1840
2640
3440
5040
6640
8250
400
280
208
184
176
172
168
166
165
Consider, for example, two sample designs applied in a situation where a value of roh = 0.4 may be assumed: (a) a total sample of 2640 students obtained by selecting 15 students per cluster from 176 clusters, and (b) a total sample of 8250 students obtained by selecting 50 students per cluster from 165 clusters. From Table 1.1, it may be observed that both of these sample designs have sampling accuracy equivalent to a simple random sample of 400 students.These two sample designs have equivalent sampling accuracy, however there is a striking difference between the each design in terms of total sample size. Further, the magnitude of this difference is not reflected proportionately in the difference between the number of clusters selected.

Sample design for educational survey research
24
Module 3
http://www.sacmeq.org and http://www.unesco.org/iiep
Basic concepts of sample design for educational survey research
25© UNESCO
This result illustrates an important point for the planning of educational research studies that seek to make stable estimates of student population characteristics. This is that the sampling accuracy levels of two-stage cluster sample designs, for cluster sizes of 10 or more, tend to be greatly influenced by small changes in the number of clusters that are selected at the first stage of sampling, and relatively less influenced by small changes in the size of the selected clusters.
The main use of sample design tables like the one presented in Table 1.1 is to permit the researcher to choose, for a given value of roh, one sample design from among a list of equally accurate sample design options. The final choice between equally accurate options is usually guided by cost factors, or data analysis strategies, or a combination of both of these.
For example, the cost of collecting data by using ‘group administration’ of tests, questionnaires, etc. often depends more on the number of selected schools than on the number of students surveyed within each selected school. This occurs because the use of this methodology usually leads to higher marginal costs associated with travel to many schools, compared with the marginal costs of increasing the number of students surveyed within each selected school. In contrast, the cost of collecting data by using ‘individual administration’ of one-to-one tests, interviews, etc., normally depends more on the total sample size than on the number of selected schools.
The choice of a sample design option may also depend upon the data analysis strategies that are being employed in the research. For example, analyses may be planned at both the between-student and between-school levels of analysis. In order to conduct analyses at the between-school level, data obtained from individual students may need to be aggregated to obtain files consisting of school records based on student mean scores. This type of analysis
Sample design for educational survey research
26
Module 3
http://www.sacmeq.org and http://www.unesco.org/iiep 27© UNESCO
requires that sufficient students be selected per school so as to ensure that stable estimates are able to be made for individual schools. At the same time, it requires that sufficient schools are available so as to ensure that meaningful results may be obtained for estimates of population characteristics.

Sample design for educational survey research
26
Module 3
http://www.sacmeq.org and http://www.unesco.org/iiep 27© UNESCO
2How to draw a national sample of students : a hypothetical example for ‘country x’
In this section a hypothetical example has been presented in order to illustrate the 12 main steps involved in selecting a national sample of schools and students for ‘Country X’. The numbers of schools and students in the example have been made very small so that all calculations and tabulations can be carried out by hand. In the next section of this module a ‘real’ example has been presented in which the required calculations and tabulations must be carried out by computer.
The desired target population for the example consists of 1100 students attending 20 schools located in two administrative regions of Country X. The sample design requires that five schools be selected across four strata with probability proportional to the number of students in the defined target population. Within the five selected schools a simple random sample of 20 students is to be selected. The 12 steps required to complete the sample design cover the following five areas.
• Specification of Sample (Steps 1 to 4)
The development and listing of ‘specifications’ for the sample design – including target population, sample size, sampling stages, stratification, sample allocation, cluster size, and pseudoschool
28
Sample design for educational survey researchModule 3
http://www.sacmeq.org and http://www.unesco.org/iiep 29
How to draw a national sample of students: a hypothetical example for ‘country x’
© UNESCO
rules. In most research situations the specifications are prepared following a detailed investigation of the availability of information that is suitable for the construction of sampling frames, and an evaluation of the nature and scope of the data that are to be collected.
• Stratification and Sample Allocation (Steps 5 to 7)
A description of the stratification variables and an analysis of the breakdown of the defined target population across strata. The breakdown is used with the sample design specifications to guide the allocation of the sample across strata.
• Marker Variables (Step 8)
This is an ‘optional’ area. It provides information that can be used to make comparisons between the population and sample. However, it has no real impact on the scientific quality of the final sample.
• Construction of Sampling Frame (Steps 9 and 10)
The construction of a separate list of schools for each stratum. Each school is listed in association with the number of students in the defined target population. Schools that are smaller than a specified size are linked to a similar (and nearby) school to form a ‘pseudoschool’.
• Sample Selection (Steps 11 and 12)
The selection of the sample of schools within strata (by using a ‘lottery tickets’ approach), and the selection of a sample of students within schools (by using a table of random numbers).
28
Sample design for educational survey researchModule 3
http://www.sacmeq.org and http://www.unesco.org/iiep 29
How to draw a national sample of students: a hypothetical example for ‘country x’
© UNESCO
EXERCISE A
The reader should work through the 12 steps of the sample design. Where tabulations are presented, the figures in each cell should be verified by hand calculation using the listing of schools that has been provided in step 3. After working through all steps, the following questions should be addressed:
1. What is the probability of a student in the first school of the first stratum being selected into the sample? Is this probability the same for students in other schools in the first stratum? Is it the same for students in other strata?
2. How would the sampling of students be undertaken for a pseudoschool that was selected at the first stage of sampling?
3. What other variables might be used to stratify the defined target population? Are any of these ‘better’ than the ones used in the example?
4. What would Table 3 and Table 4 look like if the stratification variables were ‘Region’ and ‘School Type’?
30
Sample design for educational survey researchModule 3
http://www.sacmeq.org and http://www.unesco.org/iiep 31
How to draw a national sample of students: a hypothetical example for ‘country x’
© UNESCO
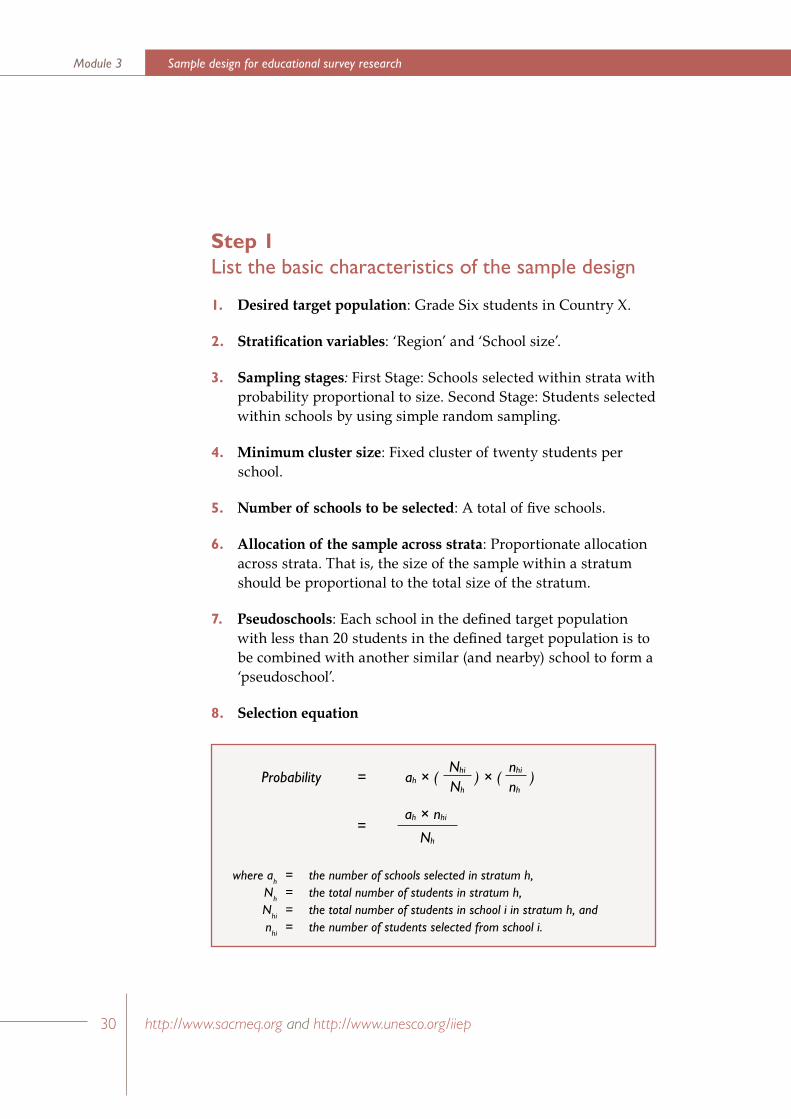
Step 1List the basic characteristics of the sample design
1. Desired target population: Grade Six students in Country X.
2. Stratification variables: ‘Region’ and ‘School size’.
3. Sampling stages: First Stage: Schools selected within strata with probability proportional to size. Second Stage: Students selected within schools by using simple random sampling.
4. Minimum cluster size: Fixed cluster of twenty students per school.
5. Number of schools to be selected: A total of five schools.
6. Allocation of the sample across strata: Proportionate allocation across strata. That is, the size of the sample within a stratum should be proportional to the total size of the stratum.
7. Pseudoschools: Each school in the defined target population with less than 20 students in the defined target population is to be combined with another similar (and nearby) school to form a ‘pseudoschool’.
8. Selection equation
Probability = ah × (Nhi
) × (nhi
)Nh nh
= ah × nhi
Nh
where ah = the number of schools selected in stratum h, Nh = the total number of students in stratum h, Nhi = the total number of students in school i in stratum h, and nhi = the number of students selected from school i.

30
Sample design for educational survey researchModule 3
http://www.sacmeq.org and http://www.unesco.org/iiep 31
How to draw a national sample of students: a hypothetical example for ‘country x’
© UNESCO
Step 2Prepare brief and accurate written descriptions of the desired target population, the defined target population, and the excluded population
1. Desired Target Population: “Grade Six students in Country X”.
2. Defined Target Population: “All students at the Grade Six level who are attending registered Government or Non-government primary schools in all administrative regions of Country X”.
3. Excluded Population: “All students at the Grade Six level attending special schools for the handicapped in Country X”.
32
Sample design for educational survey researchModule 3
http://www.sacmeq.org and http://www.unesco.org/iiep 33
How to draw a national sample of students: a hypothetical example for ‘country x’
© UNESCO
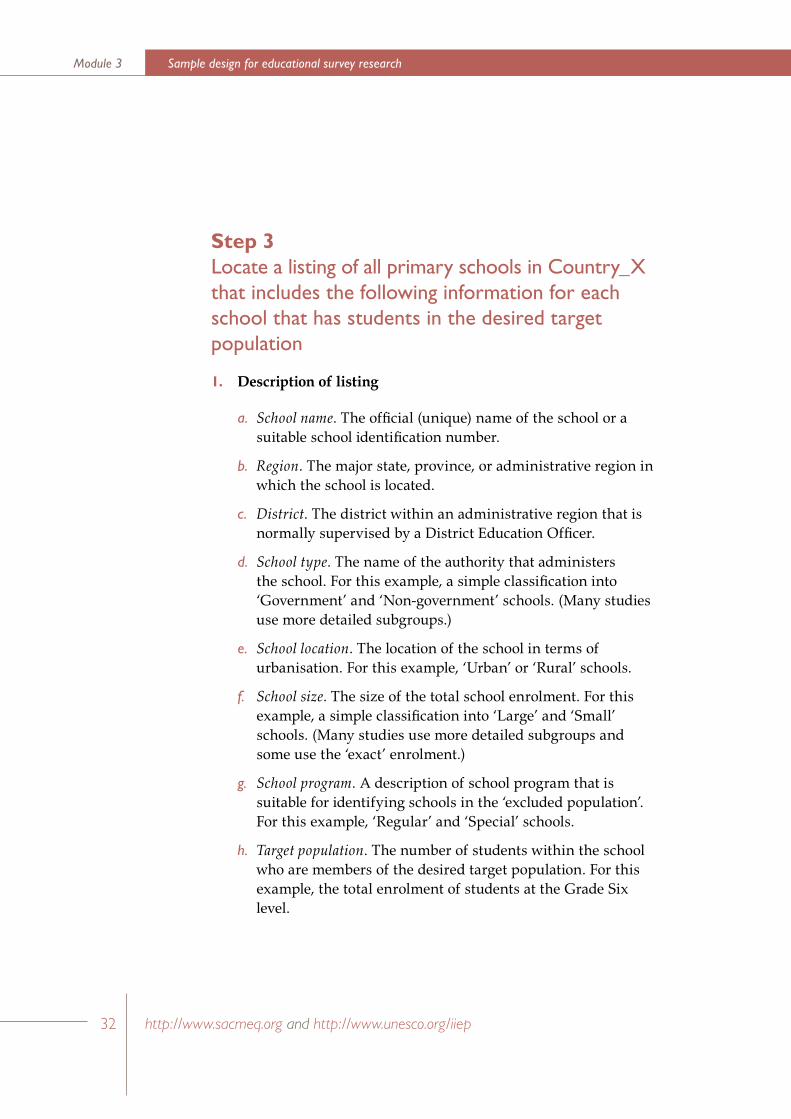
Step 3Locate a listing of all primary schools in Country_X that includes the following information for each school that has students in the desired target population
1. Description of listing
a. School name. The official (unique) name of the school or a suitable school identification number.
b. Region. The major state, province, or administrative region in which the school is located.
c. District. The district within an administrative region that is normally supervised by a District Education Officer.
d. School type. The name of the authority that administers the school. For this example, a simple classification into ‘Government’ and ‘Non-government’ schools. (Many studies use more detailed subgroups.)
e. School location. The location of the school in terms of urbanisation. For this example, ‘Urban’ or ‘Rural’ schools.
f. School size. The size of the total school enrolment. For this example, a simple classification into ‘Large’ and ‘Small’ schools. (Many studies use more detailed subgroups and some use the ‘exact’ enrolment.)
g. School program. A description of school program that is suitable for identifying schools in the ‘excluded population’. For this example, ‘Regular’ and ‘Special’ schools.
h. Target population. The number of students within the school who are members of the desired target population. For this example, the total enrolment of students at the Grade Six level.
32
Sample design for educational survey researchModule 3
http://www.sacmeq.org and http://www.unesco.org/iiep 33
How to draw a national sample of students: a hypothetical example for ‘country x’
© UNESCO
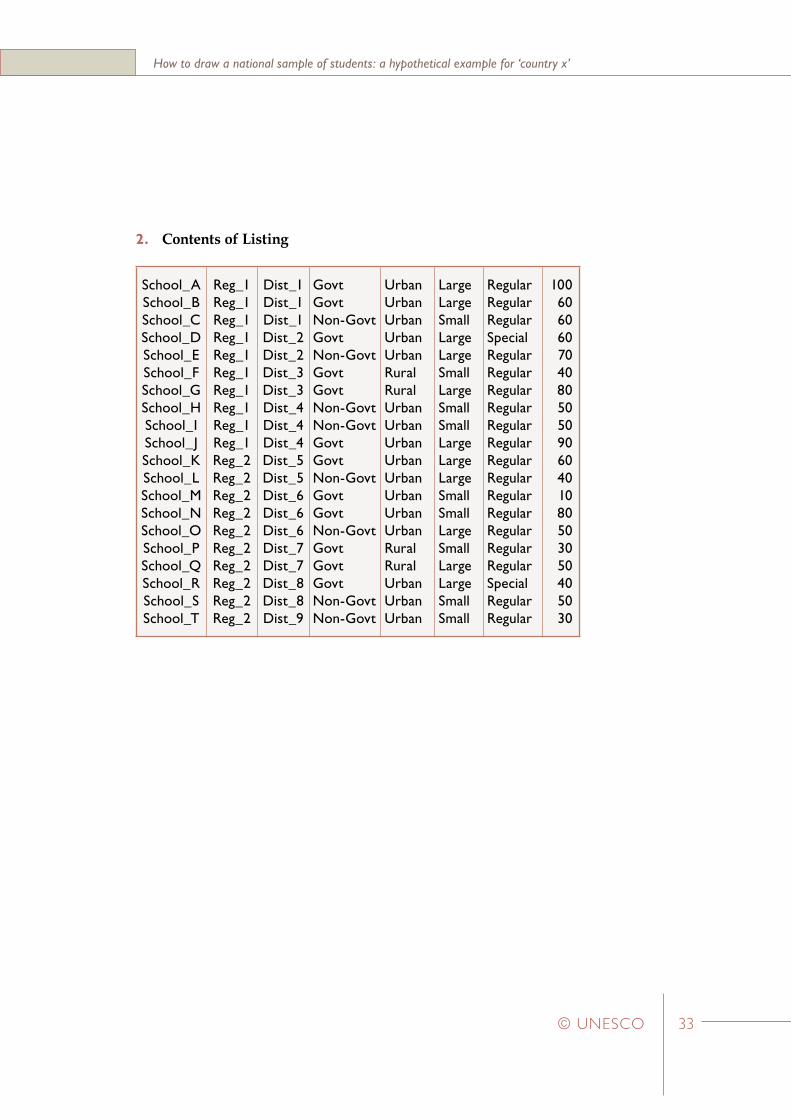
2. Contents of Listing
School_ASchool_BSchool_CSchool_DSchool_ESchool_FSchool_GSchool_HSchool_ISchool_JSchool_KSchool_LSchool_MSchool_NSchool_OSchool_PSchool_QSchool_RSchool_SSchool_T
Reg_1Reg_1Reg_1Reg_1Reg_1Reg_1Reg_1Reg_1Reg_1Reg_1Reg_2Reg_2Reg_2Reg_2Reg_2Reg_2Reg_2Reg_2Reg_2Reg_2
Dist_1Dist_1Dist_1Dist_2Dist_2Dist_3Dist_3Dist_4Dist_4Dist_4Dist_5Dist_5Dist_6Dist_6Dist_6Dist_7Dist_7Dist_8Dist_8Dist_9
GovtGovtNon-GovtGovtNon-GovtGovtGovtNon-GovtNon-GovtGovtGovtNon-GovtGovtGovtNon-GovtGovtGovtGovtNon-GovtNon-Govt
UrbanUrbanUrbanUrbanUrbanRuralRuralUrbanUrbanUrbanUrbanUrbanUrbanUrbanUrbanRuralRuralUrbanUrbanUrban
LargeLargeSmallLargeLargeSmallLargeSmallSmallLargeLargeLargeSmallSmallLargeSmallLargeLargeSmallSmall
RegularRegularRegularSpecialRegularRegularRegularRegularRegularRegularRegularRegularRegularRegularRegularRegularRegularSpecialRegularRegular
10060606070408050509060401080503050405030
34
Sample design for educational survey researchModule 3
http://www.sacmeq.org and http://www.unesco.org/iiep 35
How to draw a national sample of students: a hypothetical example for ‘country x’
© UNESCO
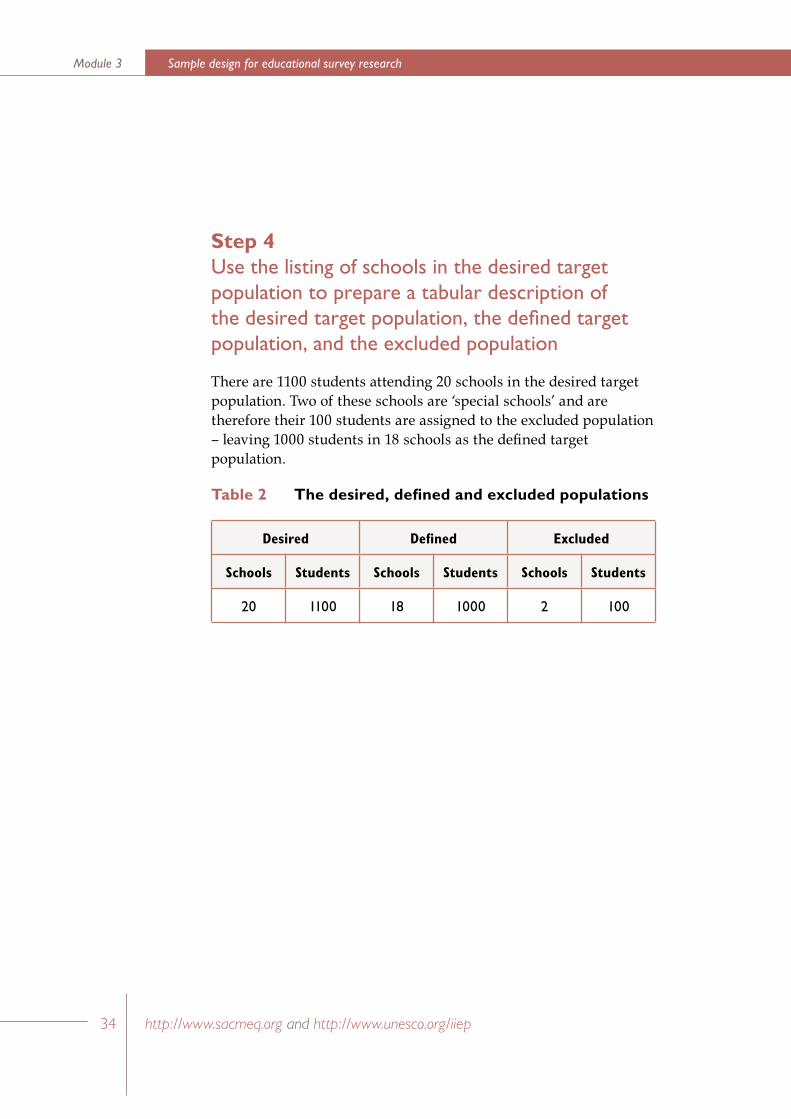
Step 4Use the listing of schools in the desired target population to prepare a tabular description of the desired target population, the defined target population, and the excluded population
There are 1100 students attending 20 schools in the desired target population. Two of these schools are ‘special schools’ and are therefore their 100 students are assigned to the excluded population – leaving 1000 students in 18 schools as the defined target population.
Table 2 The desired, defined and excluded populations
Desired Defined Excluded
Schools Students Schools Students Schools Students
20 1100 18 1000 2 100
34
Sample design for educational survey researchModule 3
http://www.sacmeq.org and http://www.unesco.org/iiep 35
How to draw a national sample of students: a hypothetical example for ‘country x’
© UNESCO
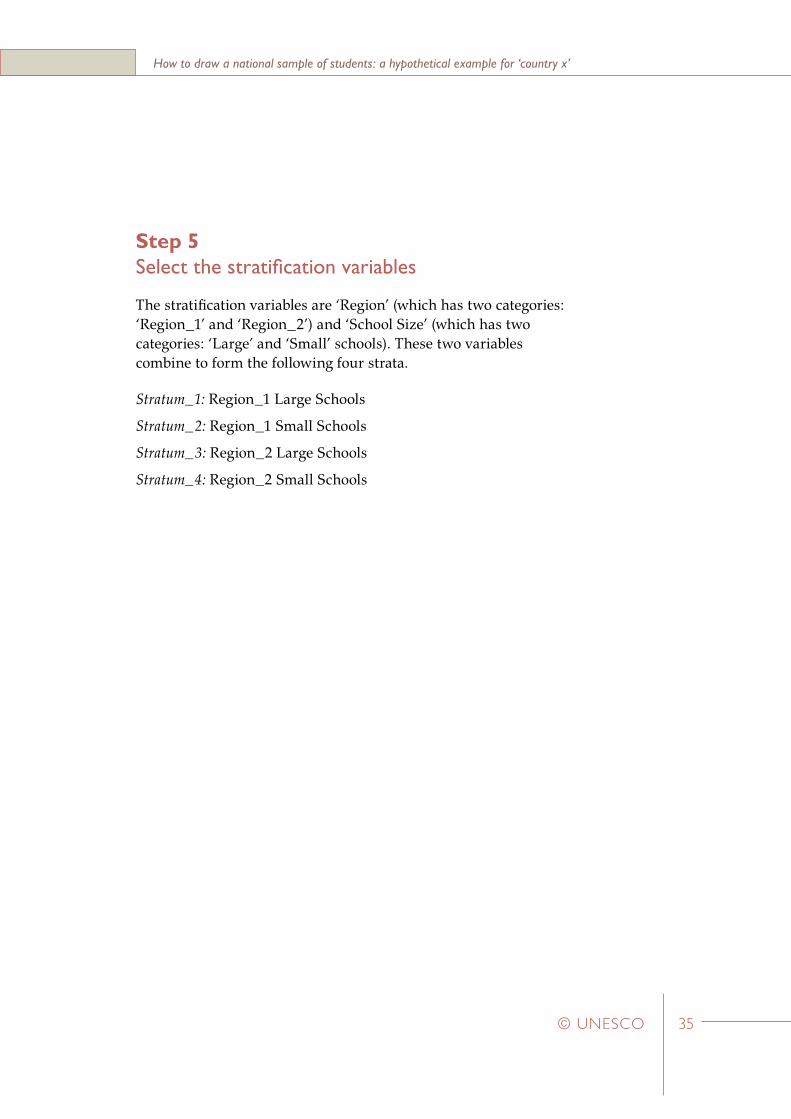
Step 5Select the stratification variables
The stratification variables are ‘Region’ (which has two categories: ‘Region_1’ and ‘Region_2’) and ‘School Size’ (which has two categories: ‘Large’ and ‘Small’ schools). These two variables combine to form the following four strata.
Stratum_1: Region_1 Large Schools
Stratum_2: Region_1 Small Schools
Stratum_3: Region_2 Large Schools
Stratum_4: Region_2 Small Schools
36
Sample design for educational survey researchModule 3
http://www.sacmeq.org and http://www.unesco.org/iiep 37
How to draw a national sample of students: a hypothetical example for ‘country x’
© UNESCO
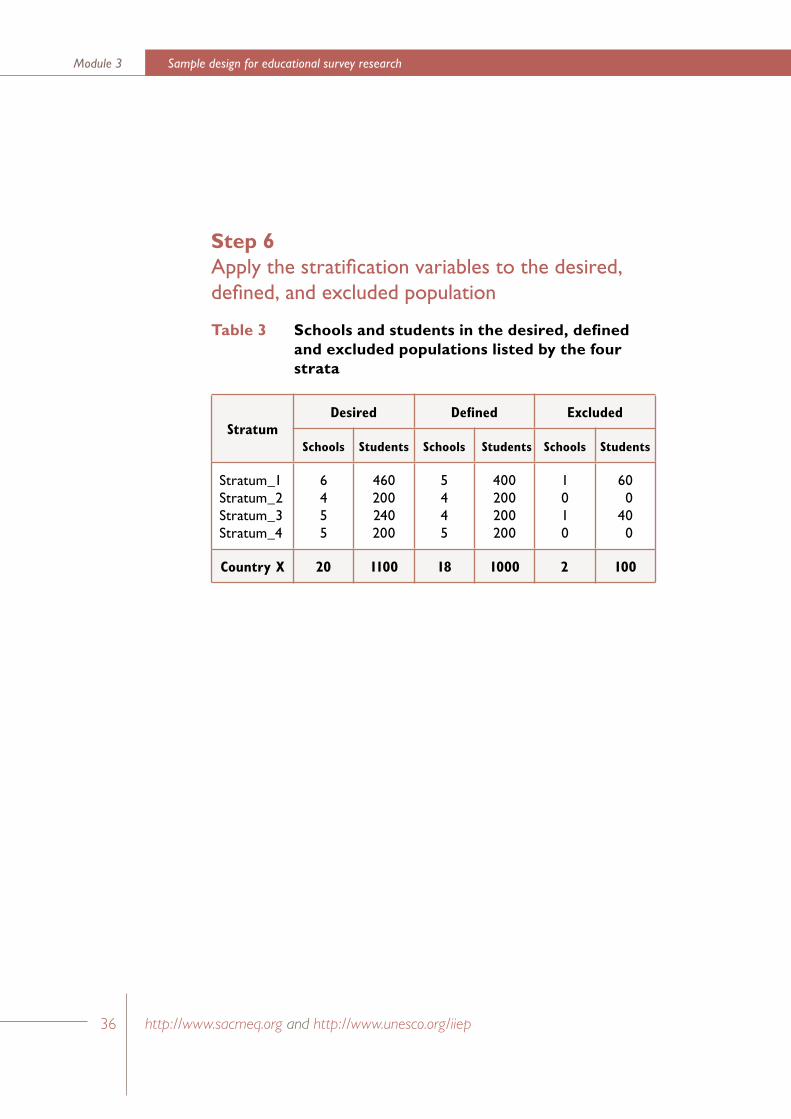
Step 6Apply the stratification variables to the desired, defined, and excluded population
Table 3 Schools and students in the desired, defined and excluded populations listed by the four strata
Stratum Desired Defined Excluded
Schools Students Schools Students Schools Students
Stratum_1Stratum_2Stratum_3Stratum_4
6455
460200240200
5445
400200200200
1010
600
400
Country X 20 1100 18 1000 2 100
36
Sample design for educational survey researchModule 3
http://www.sacmeq.org and http://www.unesco.org/iiep 37
How to draw a national sample of students: a hypothetical example for ‘country x’
© UNESCO
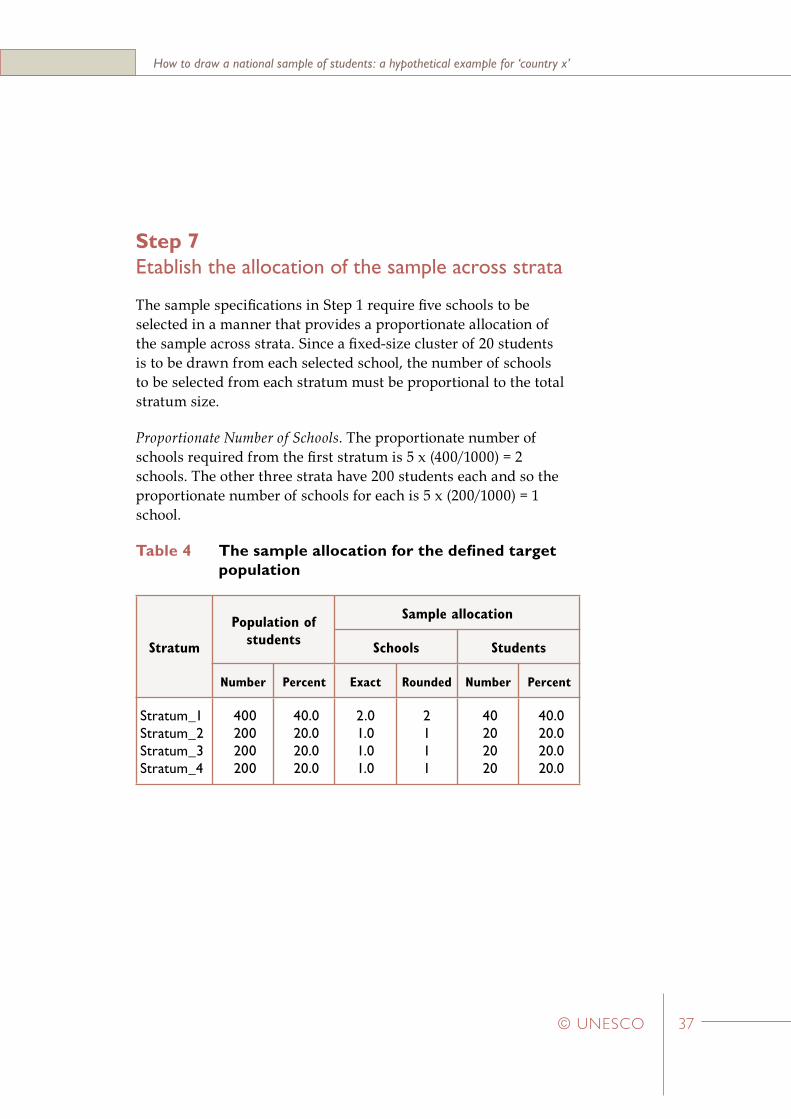
Step 7Etablish the allocation of the sample across strata
The sample specifications in Step 1 require five schools to be selected in a manner that provides a proportionate allocation of the sample across strata. Since a fixed-size cluster of 20 students is to be drawn from each selected school, the number of schools to be selected from each stratum must be proportional to the total stratum size.
Proportionate Number of Schools. The proportionate number of schools required from the first stratum is 5 x (400/1000) = 2 schools. The other three strata have 200 students each and so the proportionate number of schools for each is 5 x (200/1000) = 1 school.
Table 4 The sample allocation for the defined target population
Stratum
Population of students
Sample allocation
Schools Students
Number Percent Exact Rounded Number Percent
Stratum_1Stratum_2Stratum_3Stratum_4
400 200 200 200
40.0 20.0 20.0 20.0
2.01.01.01.0
2111
40 20 20 20
40.0 20.0 20.0 20.0
38
Sample design for educational survey researchModule 3
http://www.sacmeq.org and http://www.unesco.org/iiep 39
How to draw a national sample of students: a hypothetical example for ‘country x’
© UNESCO
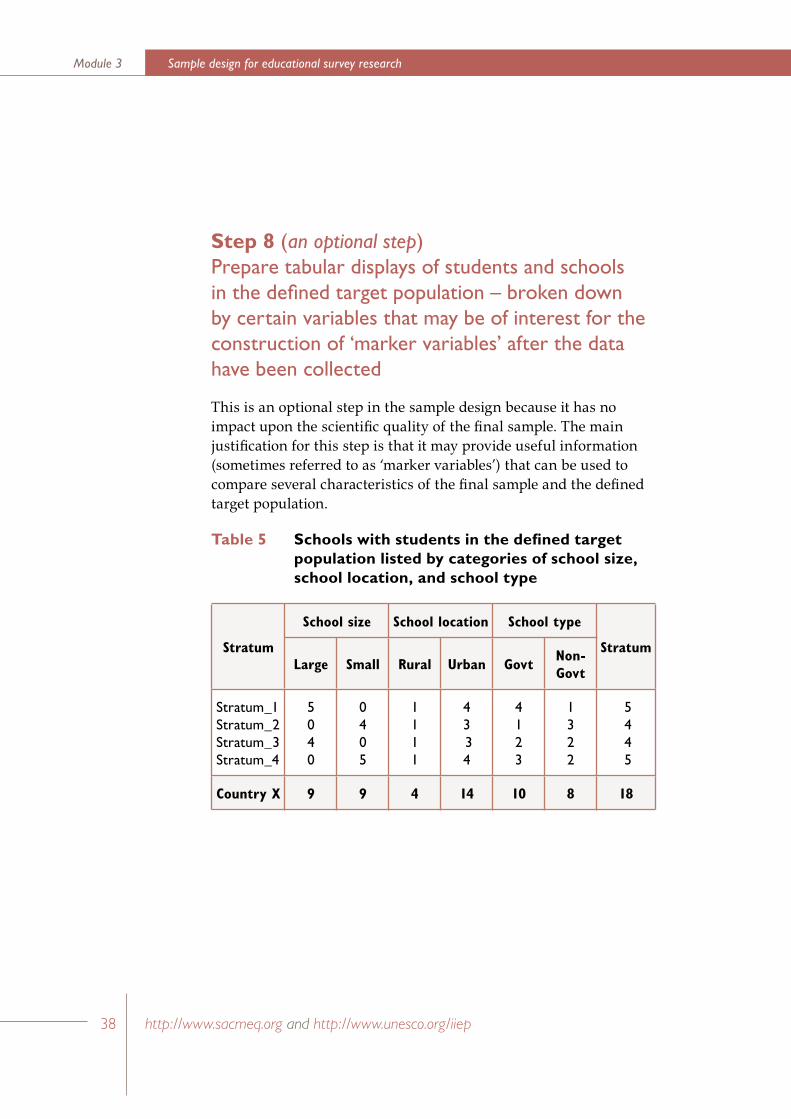
Step 8 (an optional step)Prepare tabular displays of students and schools in the defined target population – broken down by certain variables that may be of interest for the construction of ‘marker variables’ after the data have been collected
This is an optional step in the sample design because it has no impact upon the scientific quality of the final sample. The main justification for this step is that it may provide useful information (sometimes referred to as ‘marker variables’) that can be used to compare several characteristics of the final sample and the defined target population.
Table 5 Schools with students in the defined target population listed by categories of school size, school location, and school type
Stratum
School size School location School type
StratumLarge Small Rural Urban Govt
Non-Govt
Stratum_1Stratum_2Stratum_3Stratum_4
5040
0405
1111
4 3 34
4 123
1322
5 4 4 5
Country X 9 9 4 14 10 8 18
38
Sample design for educational survey researchModule 3
http://www.sacmeq.org and http://www.unesco.org/iiep 39
How to draw a national sample of students: a hypothetical example for ‘country x’
© UNESCO
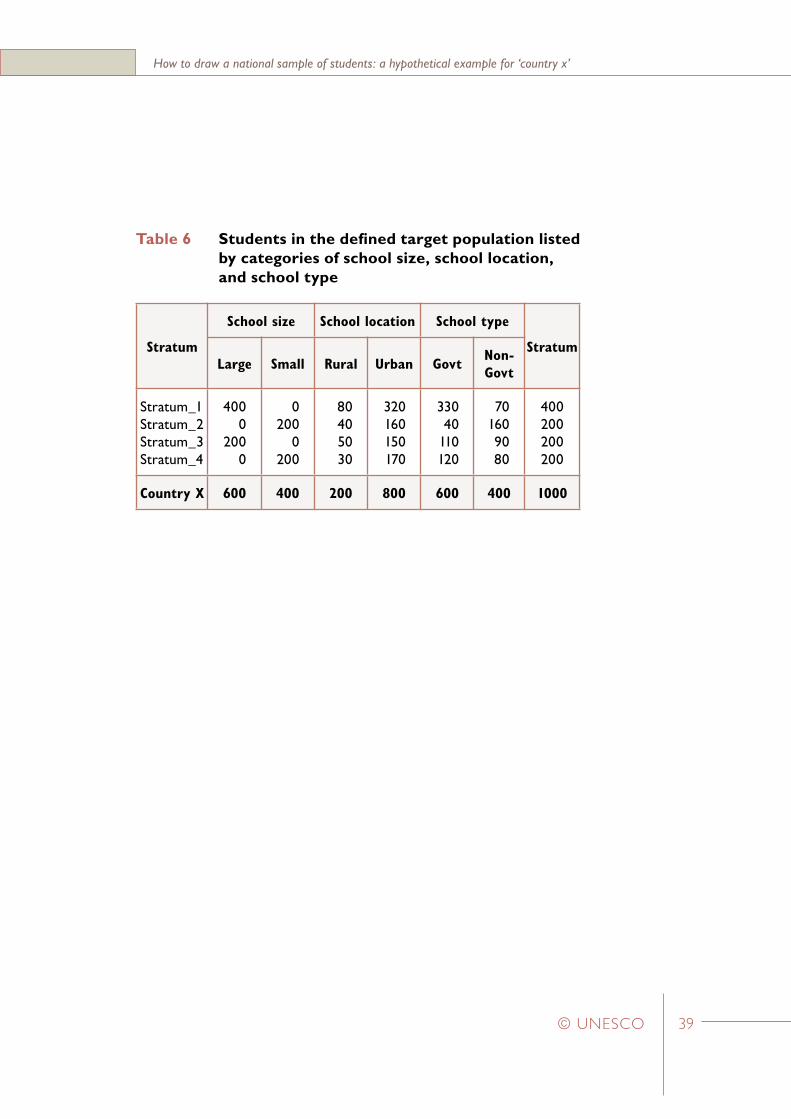
Table 6 Students in the defined target population listed by categories of school size, school location, and school type
Stratum
School size School location School type
StratumLarge Small Rural Urban Govt
Non-Govt
Stratum_1Stratum_2Stratum_3Stratum_4
4000
2000
0200
0200
80405030
320160150170
33040
110120
701609080
400200200200
Country X 600 400 200 800 600 400 1000
40
Sample design for educational survey researchModule 3
http://www.sacmeq.org and http://www.unesco.org/iiep 41
How to draw a national sample of students: a hypothetical example for ‘country x’
© UNESCO
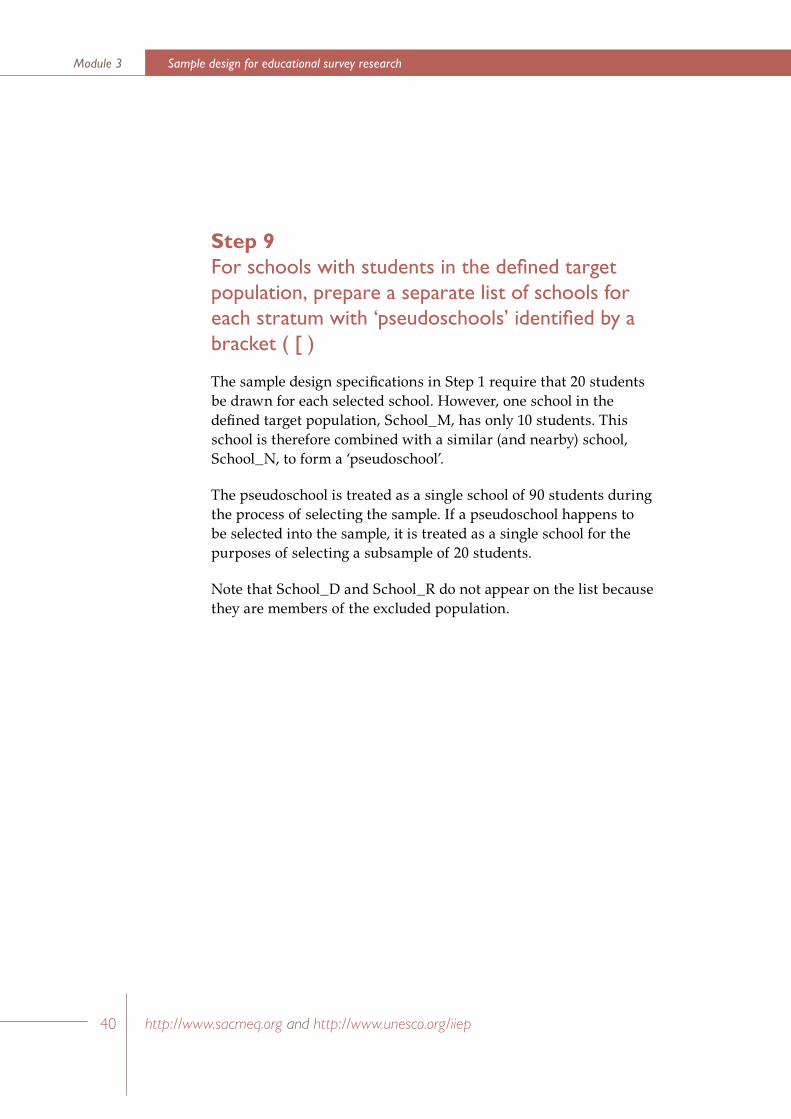
Step 9For schools with students in the defined target population, prepare a separate list of schools for each stratum with ‘pseudoschools’ identified by a bracket ( [ )
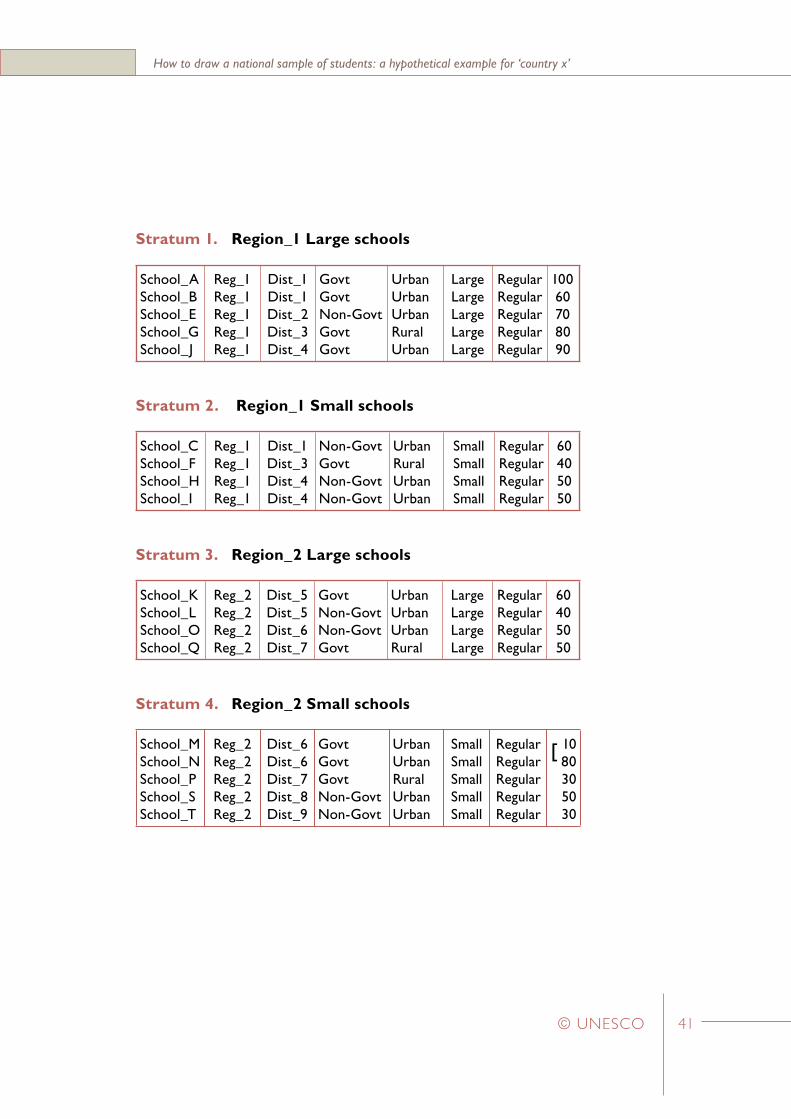
The sample design specifications in Step 1 require that 20 students be drawn for each selected school. However, one school in the defined target population, School_M, has only 10 students. This school is therefore combined with a similar (and nearby) school, School_N, to form a ‘pseudoschool’.
The pseudoschool is treated as a single school of 90 students during the process of selecting the sample. If a pseudoschool happens to be selected into the sample, it is treated as a single school for the purposes of selecting a subsample of 20 students.
Note that School_D and School_R do not appear on the list because they are members of the excluded population.
40
Sample design for educational survey researchModule 3
http://www.sacmeq.org and http://www.unesco.org/iiep 41
How to draw a national sample of students: a hypothetical example for ‘country x’
© UNESCO
Stratum 1. Region_1 Large schools
School_ASchool_BSchool_ESchool_GSchool_J
Reg_1Reg_1Reg_1Reg_1Reg_1
Dist_1Dist_1Dist_2Dist_3Dist_4
GovtGovtNon-GovtGovtGovt
UrbanUrbanUrbanRuralUrban
LargeLargeLargeLargeLarge
RegularRegularRegularRegularRegular
100 60 70 80 90
Stratum 2. Region_1 Small schools
School_CSchool_FSchool_HSchool_I
Reg_1Reg_1Reg_1Reg_1
Dist_1Dist_3Dist_4Dist_4
Non-GovtGovtNon-GovtNon-Govt
UrbanRuralUrbanUrban
SmallSmallSmallSmall
RegularRegularRegularRegular
60405050
Stratum 3. Region_2 Large schools
School_KSchool_LSchool_OSchool_Q
Reg_2Reg_2Reg_2Reg_2
Dist_5Dist_5Dist_6Dist_7
GovtNon-GovtNon-GovtGovt
UrbanUrbanUrbanRural
LargeLargeLargeLarge
RegularRegularRegularRegular
60405050
Stratum 4. Region_2 Small schools
School_MSchool_NSchool_PSchool_SSchool_T
Reg_2Reg_2Reg_2Reg_2Reg_2
Dist_6Dist_6Dist_7Dist_8Dist_9
GovtGovtGovtNon-GovtNon-Govt
UrbanUrbanRuralUrbanUrban
SmallSmallSmallSmallSmall
RegularRegularRegularRegularRegular
10[ 80 30 5030
42
Sample design for educational survey researchModule 3
http://www.sacmeq.org and http://www.unesco.org/iiep 43
How to draw a national sample of students: a hypothetical example for ‘country x’
© UNESCO
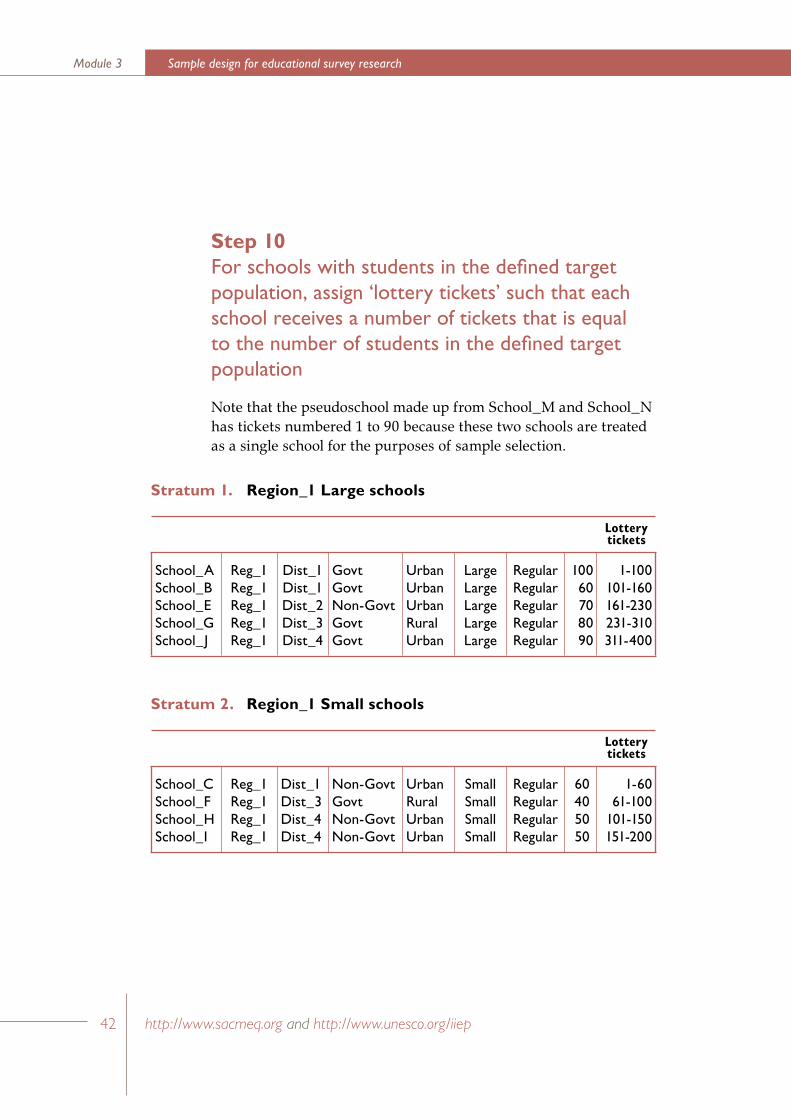
Step 10For schools with students in the defined target population, assign ‘lottery tickets’ such that each school receives a number of tickets that is equal to the number of students in the defined target population
Note that the pseudoschool made up from School_M and School_N has tickets numbered 1 to 90 because these two schools are treated as a single school for the purposes of sample selection.
Stratum 1. Region_1 Large schools
Lotterytickets
School_ASchool_BSchool_ESchool_GSchool_J
Reg_1Reg_1Reg_1Reg_1Reg_1
Dist_1Dist_1Dist_2Dist_3Dist_4
GovtGovtNon-GovtGovtGovt
UrbanUrbanUrbanRuralUrban
LargeLargeLargeLargeLarge
RegularRegularRegularRegularRegular
100 60 70 80 90
1-100101-160161-230231-310311-400
Stratum 2. Region_1 Small schools
Lotterytickets
School_CSchool_FSchool_HSchool_I
Reg_1Reg_1Reg_1Reg_1
Dist_1Dist_3Dist_4Dist_4
Non-GovtGovtNon-GovtNon-Govt
UrbanRuralUrbanUrban
SmallSmallSmallSmall
RegularRegularRegularRegular
60 405050
1-6061-100
101-150151-200
42
Sample design for educational survey researchModule 3
http://www.sacmeq.org and http://www.unesco.org/iiep 43
How to draw a national sample of students: a hypothetical example for ‘country x’
© UNESCO
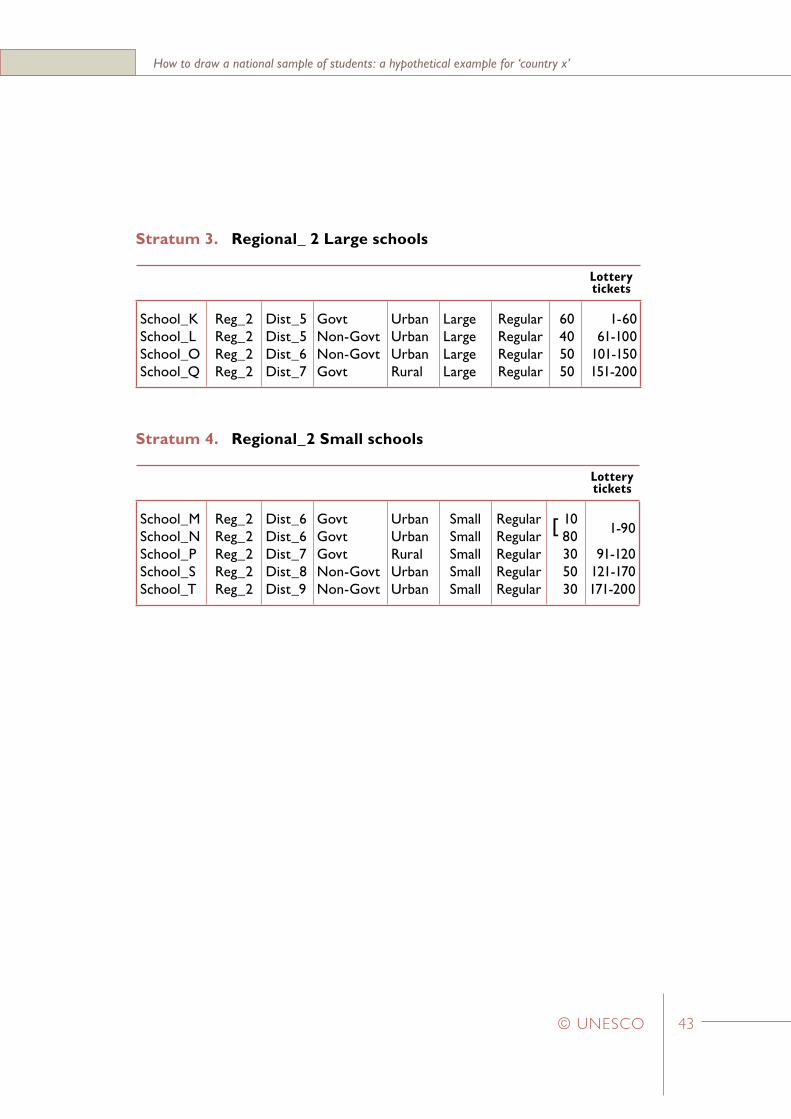
Stratum 3. Regional_ 2 Large schools
Lotterytickets
School_KSchool_LSchool_OSchool_Q
Reg_2Reg_2Reg_2Reg_2
Dist_5Dist_5Dist_6Dist_7
GovtNon-GovtNon-GovtGovt
UrbanUrbanUrbanRural
LargeLargeLargeLarge
RegularRegularRegularRegular
60 405050
1-6061-100
101-150151-200
Stratum 4. Regional_2 Small schools
Lotterytickets
School_MSchool_NSchool_PSchool_SSchool_T
Reg_2Reg_2Reg_2Reg_2Reg_2
Dist_6Dist_6Dist_7Dist_8Dist_9
GovtGovtGovtNon-GovtNon-Govt
UrbanUrbanRuralUrbanUrban
SmallSmallSmallSmallSmall
RegularRegularRegularRegularRegular
10[ 80 30 50 30
1-90
91-120121-170171-200

44
Sample design for educational survey researchModule 3
http://www.sacmeq.org and http://www.unesco.org/iiep 45
How to draw a national sample of students: a hypothetical example for ‘country x’
© UNESCO
Step 11Select the sample of schools
• Selection of two schools for stratum 1
In the first stratum two schools must be selected with probability proportional to the number of students in the defined target population. This is achieved by allocating a number of ‘lottery tickets’ to each school so that the first school on the list, School_A, with 100 students in the defined target population receives lottery tickets that are numbered from 1 to 100. The second school on the list, School_B, with 60 students receives lottery tickets that are numbered from 101 to 160, and so on – until the final school in the first stratum receives tickets numbered 311 to 400.
Since two schools must be selected there is a need to identify two ‘winning tickets’. The ratio of the total number of tickets to the number of winning tickets is known as the ‘sampling interval’. For the first stratum the sampling interval is equal to 400/2 = 200. That, is each ticket in the first stratum should have a 1 in 200 chance of being drawn as a winning ticket. Note that within the other three strata, one winning ticket must be selected from a total of 200 tickets – which gives the same value for the sampling interval (200/1 = 200).
The ‘winning tickets’ for the first stratum are drawn by using a ‘random start – constant interval’ procedure whereby a random number in the interval of 1 to 200 is selected as the first winning ticket and the second ticket is selected by adding an increment of 200. Assuming a random start of 105, the winning ticket numbers would be 105 and 305. This results in the selection of School_B (which holds tickets 101 to 160) and School_G (which holds tickets 231 to 310). The probability of selection is proportional to the number of tickets held and therefore each of these schools is selected with probability proportional to the number of students in the defined target population.
44
Sample design for educational survey researchModule 3
http://www.sacmeq.org and http://www.unesco.org/iiep 45
How to draw a national sample of students: a hypothetical example for ‘country x’
© UNESCO
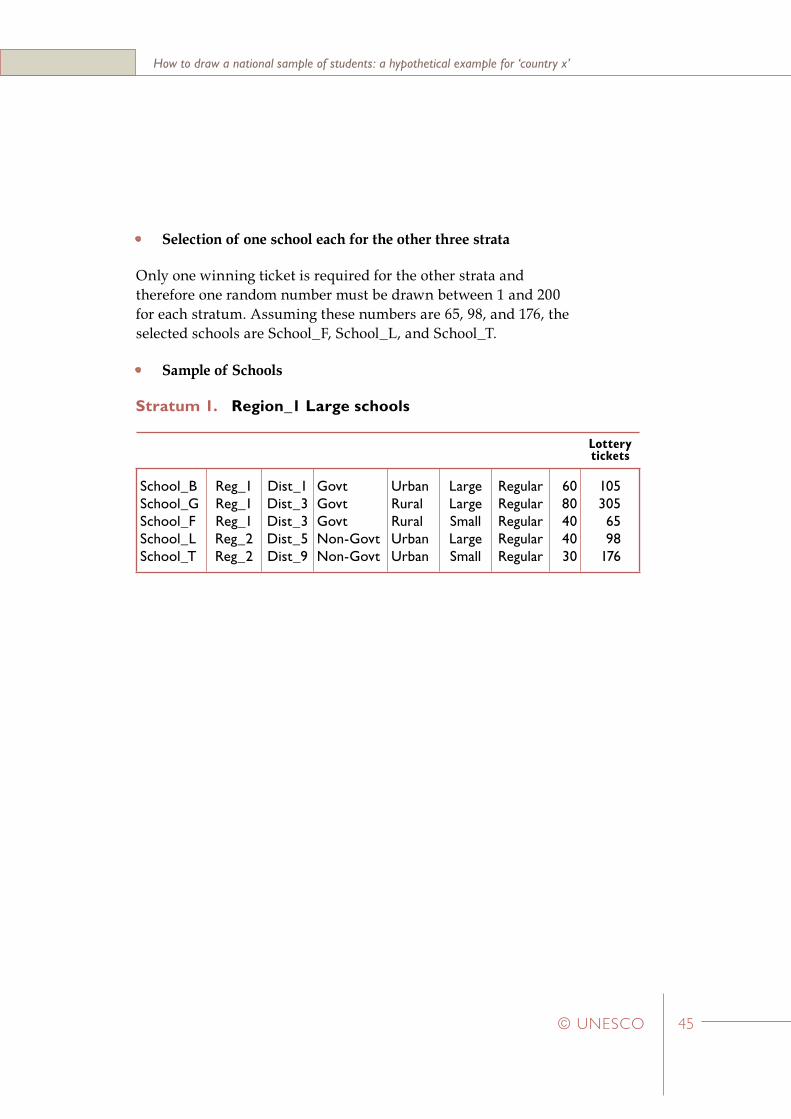
• Selection of one school each for the other three strata
Only one winning ticket is required for the other strata and therefore one random number must be drawn between 1 and 200 for each stratum. Assuming these numbers are 65, 98, and 176, the selected schools are School_F, School_L, and School_T.
• Sample of Schools
Stratum 1. Region_1 Large schools
Lotterytickets
School_BSchool_GSchool_FSchool_LSchool_T
Reg_1Reg_1Reg_1Reg_2Reg_2
Dist_1Dist_3Dist_3Dist_5Dist_9
GovtGovtGovtNon-GovtNon-Govt
UrbanRuralRuralUrbanUrban
LargeLargeSmallLargeSmall
RegularRegularRegularRegularRegular
60 80 40 40 30
1053056598
176
46
Sample design for educational survey researchModule 3
http://www.sacmeq.org and http://www.unesco.org/iiep 47
How to draw a national sample of students: a hypothetical example for ‘country x’
© UNESCO
Step 12Use a table of random numbers to select a simple random sample of 20 students in each selected school
Within a selected school a table of random numbers is used to identify students from a sequentially numbered roll of students in the defined target population. The application of this procedure has been described in detail by Ross and Postlethwaite (1991). A summary of the procedure has been presented below.
1. Obtain Grade Six register(s) of attendance
These registers are obtained for all students in the defined target population – in this case Grade Six students. In multiple session schools, both morning and afternoon registers are obtained.
2. Place a sequential number beside the name of each Grade Six student
For example, consider a school with one ‘shift’ and a total of 48 students in Grade Six. Commence by placing the number ‘1’ beside the first student on the Register; then place the number ‘2’ beside the second student on the Register; …etc…;finally, place the number ‘48’ beside the last student on the Register.
As another example, consider a school with 42 students in the morning ‘shift’ and 48 students in the afternoon session of Grade Six. Commence by placing the number ‘1’ beside the first student on the Morning Register; …etc…; then place a ‘42’ beside the last student on the Morning Register; then place a ‘43’ beside the first student on the Afternoon register; …etc…;finally place a ‘90’ beside the last student on the afternoon register.
46
Sample design for educational survey researchModule 3
http://www.sacmeq.org and http://www.unesco.org/iiep 47
How to draw a national sample of students: a hypothetical example for ‘country x’
© UNESCO
3. Locate the appropriate set of selection numbers
In Appendix 6 sets of “random number tables” have been listed for a variety of school sizes. (Note that only the sets relevant for school sizes in the range 21 to 100 have been presented in this Appendix.) For example, if a school has 48 students in Grade Six, the appropriate set of selection numbers is listed under the ‘R48’ heading. Similarly, if a school has 90 Grade Six students then the appropriate set of selection numbers is listed under the ‘R90’ heading.
4. Use the appropriate set of random numbers
After locating the appropriate set of random numbers, use the first random number to locate the Grade Six student with the same sequential number on the Register. Then use the second random number to locate the Grade Six student with the same sequential number on the Register. Continue with this process until the complete sample of students has been selected.
For example, in Step 11 the first school selected in Stratum_1 is School_B which has 60 students in the defined target population. Within this school the students selected would be those with the following sequential numbers: 1, 5, 6, 7, 9 …, 52, and 54. (These numbers are obtained from the set of random numbers labelled ‘R60’ in Appendix 6).

Sample design for educational survey researchModule 3
48 http://www.sacmeq.org and http://www.unesco.org/iiep 49© UNESCO
3 How to draw a national sample of schools and students: a real example for Zimbabwe
In Section Two of this module a hypothetical example was presented in order to provide a simple illustration of the 12 main steps involved in selecting a national sample of schools and students. In this section a ‘real’ example has been presented by applying these 12 steps to the selection of a national sample of schools and students in Zimbabwe. For most of these steps, an ‘exercise’ has been given which requires the use of a computer to carry out the kinds of calculations and tabulations that were possible to conduct by hand for the hypothetical example. The example draws upon computer-based techniques that were developed for a large-scale study of the quality of education at Grade Six level in Zimbabwe (Ross and Postlethwaite, 1991). The study was undertaken in 1991 by the International Institute for Educational Planning (IIEP, UNESCO) and the Zimbabwe Ministry of Education and Culture.
In order to work through the exercises in this section it will be necessary to employ the SAMDEM software (Sylla et al., 2004) in association with a sampling frame that was constructed from the 1991 ‘school forms’ survey of primary schools in Zimbabwe. The database (described in Step 3 of this section, and entitled ‘Zimbabwe.dat’) was developed in association with George Moyo, Patrick Pfukani, and Saul Murimba from the Policy and Planning Unit of the Zimbabwe Ministry of Education and Culture.

Sample design for educational survey researchModule 3
48 http://www.sacmeq.org and http://www.unesco.org/iiep 49© UNESCO
The 12 steps described in this section have been used in many countries to select national samples of schools and students (Ross, 1991). However, it should be emphasized that the general ideas are applicable to samples that might be selected for smaller studies such as surveys of an administrative region or educational district.
Step 1List the basic characteristics of the sample design
1. Desired Target Population: Grade Six students in Zimbabwe.
2. Stratification Variables: The following two stratification variables were used.
a. ‘Region’: This variable referred to the nine major administrative regions of Zimbabwe and took the following nine values: ‘Harare’, ‘Manica’ (Manicaland), ‘Mascen’ (Mashonaland Central), ‘Masest’ (Mashonaland East), ‘Maswst’ (Mashonaland West), ‘Matnor’ (Matabeleland North), ‘Matsou’ (Matabeleland South), ‘Maving’ (Masvingo), ‘Midlnd’ (Midlands).
b. ‘School size’: This variable referred to the size of the school in terms of total school enrolment and took the following two values: ‘L’ (Large) and ‘S’ (Small).
3. Sampling Stages: First Stage: Schools selected within strata with probability proportional to size. Second Stage: Students selected within schools by using simple random sampling.
4. Minimum Cluster Size: A fixed cluster of twenty students per school was accepted because this represented a manageable cluster size for data collection requirements within any single school.
50
Sample design for educational survey researchModule 3
http://www.sacmeq.org and http://www.unesco.org/iiep 51
How to draw a national sample of schools and students: a ‘real’ example for Zimbabwe
© UNESCO
5. Number of Schools to be Selected: The number of schools required for this example was governed by the requirement that final sample should have an effective sample size for the main criterion variables of at least 400 students. That is, the final sample was required to have sampling accuracy that was equivalent to, or better than, a simple random sample of 400 students.
a. Sample design tables
The general sample design framework adopted for the example consisted of a stratified two-stage cluster sample design. This permitted the use of sample design tables (Ross, 1987) to provide estimates of the number of schools and students required to obtain a sample with an effective sample size of 400. In order to use the sample design tables, it is necessary to know: the minimum cluster size (the minimum number of students within a school that will be selected for participation in the data collection), and the coefficient of intraclass correlation (a measure of the tendency of student characteristics to be more homogeneous within schools than would be the case if students were assigned to schools at random).
From above, it was known that the minimum cluster size adopted for the example was 20 students. Also, from a previous study of Reading Achievement conducted in Zimbabwe (Ross and Postlethwaite, 1991) it was found that the value of roh was around 0.3.
In Appendix 2 a set of sample design tables has been presented for various values of the minimum cluster size, and various values of the co-efficient of intraclass correlation. The construction of these tables has been described by Ross (1987). In each table, ‘a’ has been used to describe the number of schools, ‘b’ has been used to describe the

50
Sample design for educational survey researchModule 3
http://www.sacmeq.org and http://www.unesco.org/iiep 51
How to draw a national sample of schools and students: a ‘real’ example for Zimbabwe
© UNESCO
minimum cluster size, and ‘n’ has been used to describe the total sample size.
The rows of Table 4 that correspond to a minimum cluster size of one refer to the effective sample size. That is, they describe the size of a simple random sample which has equivalent accuracy. Therefore, the pairs of figures in the fourth and fifth columns in the table all refer to sample designs which have equivalent accuracy to a simple random sample of size 400. The second and third columns refer to an effective sample size of 1600, and the final two pairs of columns refer to effective sample sizes of 178 and 100, respectively.
The most important columns of figures in Appendix 2 for this example are the fourth and fifth columns because they list a variety of two-stage samples that would result in an effective sample size of 400.
To illustrate, consider the intersection of the fourth and fifth columns of figures with the third row of figures in the first page of Appendix 2. The pair of values a=112 and n=560 indicate that if roh is equal to 0.1 and the minimum cluster size, b, is equal to 5, then the two-stage cluster sample design required to meet the required sampling standard would be 5 students selected from each of 112 schools – which would result in a total sample size of 560 students.
The effect of a different value of roh, for the same minimum cluster size, may be examined by considering the corresponding rows of the table for roh=0.2, 0.3, etc. For example, in the case where roh=0.3, a total sample size of 880 students obtained by selecting 5 students from each of 176 schools would be needed to meet the required sampling standard.
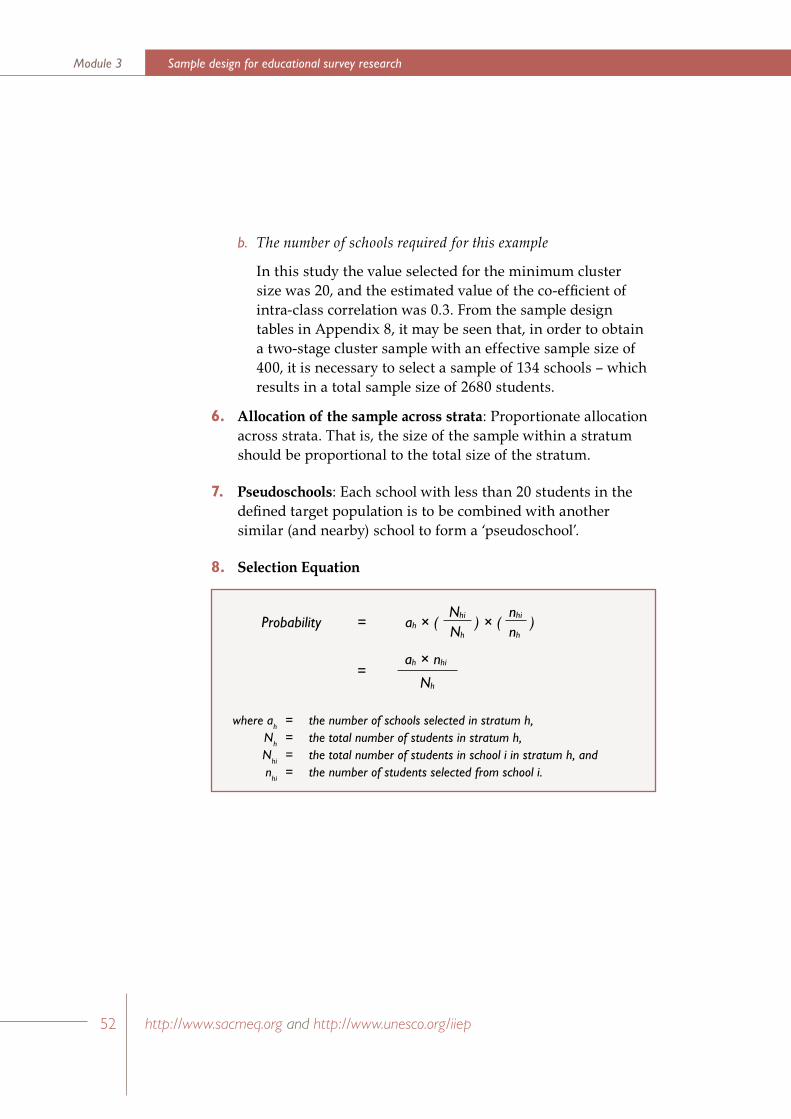
52
Sample design for educational survey researchModule 3
http://www.sacmeq.org and http://www.unesco.org/iiep 53
How to draw a national sample of schools and students: a ‘real’ example for Zimbabwe
© UNESCO
b. The number of schools required for this example
In this study the value selected for the minimum cluster size was 20, and the estimated value of the co-efficient of intra-class correlation was 0.3. From the sample design tables in Appendix 8, it may be seen that, in order to obtain a two-stage cluster sample with an effective sample size of 400, it is necessary to select a sample of 134 schools – which results in a total sample size of 2680 students.
6. Allocation of the sample across strata: Proportionate allocation across strata. That is, the size of the sample within a stratum should be proportional to the total size of the stratum.
7. Pseudoschools: Each school with less than 20 students in the defined target population is to be combined with another similar (and nearby) school to form a ‘pseudoschool’.
8. Selection Equation
Probability = ah × (Nhi
) × (nhi
)Nh nh
= ah × nhi
Nh
where ah = the number of schools selected in stratum h, Nh = the total number of students in stratum h, Nhi = the total number of students in school i in stratum h, and nhi = the number of students selected from school i.
52
Sample design for educational survey researchModule 3
http://www.sacmeq.org and http://www.unesco.org/iiep 53
How to draw a national sample of schools and students: a ‘real’ example for Zimbabwe
© UNESCO
Step 2Prepare brief and accurate written descriptions of the desired target population, the defined target population, and the excluded population
1. Desired target population: “Grade Six students in Zimbabwe”.
2. Defined target population: “All students at the Grade Six level in September 1991 who are attending registered Government or Non-government primary schools that offer the ‘regular’ curriculum, that contain at least 10 Grade Six students, and that are located in all nine administrative regions of Zimbabwe”.
3. Excluded Population: “All students at the Grade Six level in September 1991 who are attending (a) special schools for the handicapped in Zimbabwe (these schools do not offer the ‘regular’ curriculum), or (ii) primary schools in Zimbabwe with less than 10 Grade Six students (these schools are smaller than the specified minimum size)”.

54
Sample design for educational survey researchModule 3
http://www.sacmeq.org and http://www.unesco.org/iiep 55
How to draw a national sample of schools and students: a ‘real’ example for Zimbabwe
© UNESCO
Step 3Locate a listing of all primary schools in Zimbabwe that includes the following information for each school that has students in the desired target population
Description of Listing (Stored in ‘Zimababwe.dat’ File)
• Schlname (Columns 1-15). This variable describes the official name given to each the school by the Zimbabwe Ministry of Education and Culture.
• Region (Columns 17-22). This variable describes the administrative regions of Zimbabwe. The variable takes nine values: ‘Harare’, ‘Manica’ (Manicaland), ‘Mascen’ (Mashonaland Central), ‘Masest’ (Mashonaland East), ‘Maswst’ (Mashonaland West), ‘Matnor’ (Matabeleland North), ‘Matsou’ (Matabeleland South), ‘Maving’ (Masvingo), ‘Midlnd’ (Midlands).
• District (Columns 24-29). This variable describes the administrative district within each administrative region of Zimbabwe. The variable takes 55 values ranging from ‘Harare’ (which is congruent with the region of Harare) to ‘Zvisha’ (which is located in the region of Midlands).
EXERCISE B
Use the SAMDEM software to list the following groups of schools in the Zimbabwe.dat file:
1. the first ten schools in the file,
2. schools that contain students in the ‘excluded population’ (special and small schools) and,
3. schools that must be combined to form `pseudoschools’.
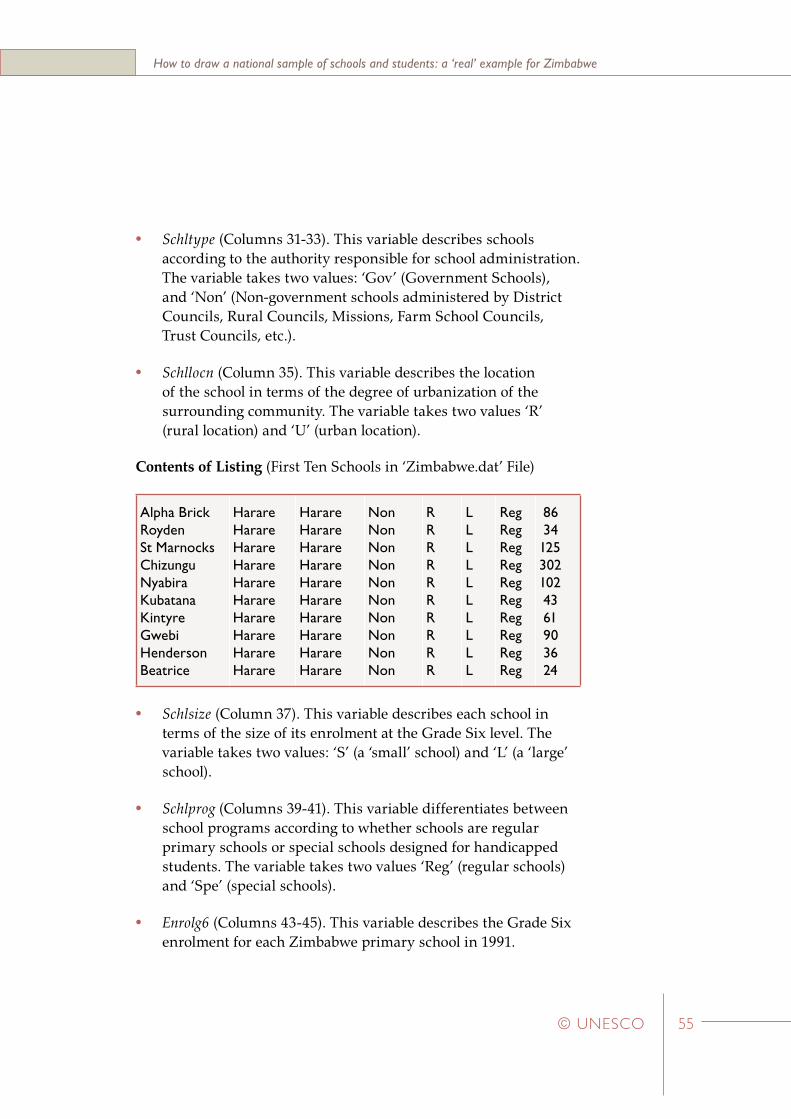
54
Sample design for educational survey researchModule 3
http://www.sacmeq.org and http://www.unesco.org/iiep 55
How to draw a national sample of schools and students: a ‘real’ example for Zimbabwe
© UNESCO
• Schltype (Columns 31-33). This variable describes schools according to the authority responsible for school administration. The variable takes two values: ‘Gov’ (Government Schools), and ‘Non’ (Non-government schools administered by District Councils, Rural Councils, Missions, Farm School Councils, Trust Councils, etc.).
• Schllocn (Column 35). This variable describes the location of the school in terms of the degree of urbanization of the surrounding community. The variable takes two values ‘R’ (rural location) and ‘U’ (urban location).
Contents of Listing (First Ten Schools in ‘Zimbabwe.dat’ File)
Alpha BrickRoydenSt MarnocksChizunguNyabiraKubatanaKintyreGwebiHendersonBeatrice
HarareHarareHarareHarareHarareHarareHarareHarareHarareHarare
HarareHarareHarareHarareHarareHarareHarareHarareHarareHarare
NonNonNonNonNonNonNonNonNonNon
RRRRRRRRRR
LLLLLLLLLL
RegRegRegRegRegRegRegRegRegReg
86 34125302102 43 61 90 36 24
• Schlsize (Column 37). This variable describes each school in terms of the size of its enrolment at the Grade Six level. The variable takes two values: ‘S’ (a ‘small’ school) and ‘L’ (a ‘large’ school).
• Schlprog (Columns 39-41). This variable differentiates between school programs according to whether schools are regular primary schools or special schools designed for handicapped students. The variable takes two values ‘Reg’ (regular schools) and ‘Spe’ (special schools).
• Enrolg6 (Columns 43-45). This variable describes the Grade Six enrolment for each Zimbabwe primary school in 1991.
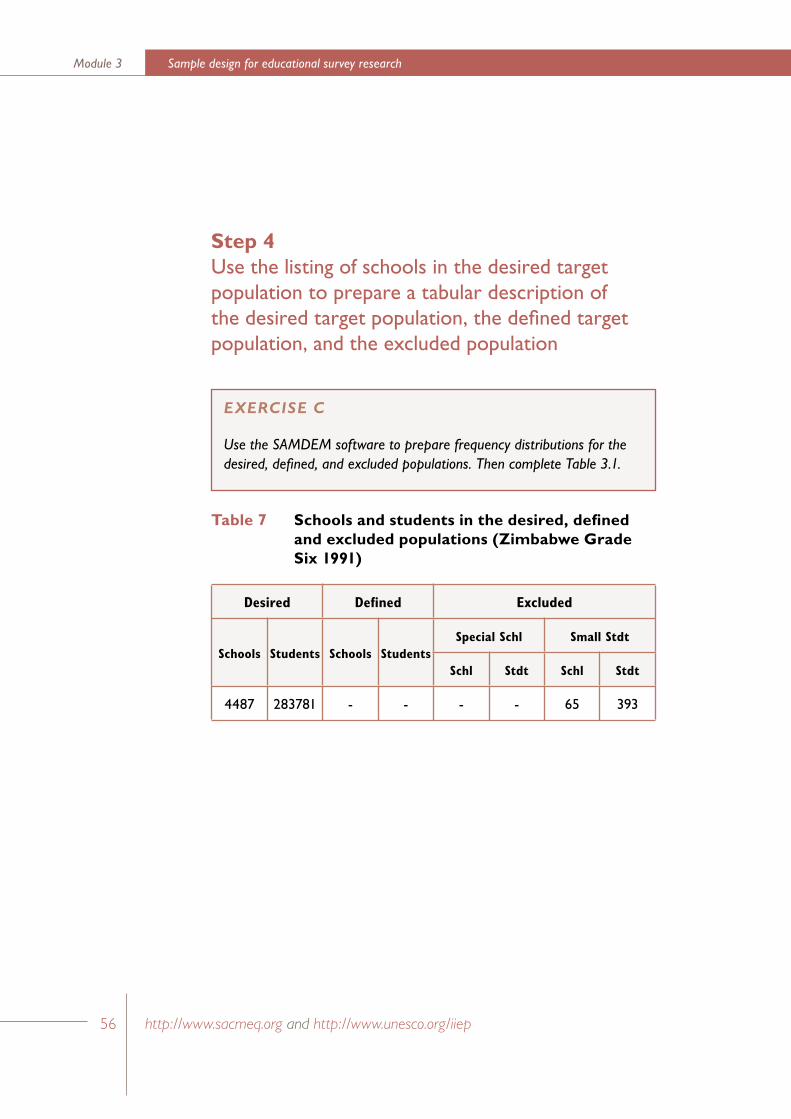
56
Sample design for educational survey researchModule 3
http://www.sacmeq.org and http://www.unesco.org/iiep 57
How to draw a national sample of schools and students: a ‘real’ example for Zimbabwe
© UNESCO
Step 4Use the listing of schools in the desired target population to prepare a tabular description of the desired target population, the defined target population, and the excluded population
Table 7 Schools and students in the desired, defined and excluded populations (Zimbabwe Grade Six 1991)
Desired Defined Excluded
Schools Students Schools StudentsSpecial Schl Small Stdt
Schl Stdt Schl Stdt
4487 283781 - - - - 65 393
EXERCISE C
Use the SAMDEM software to prepare frequency distributions for the desired, defined, and excluded populations. Then complete Table 3.1.
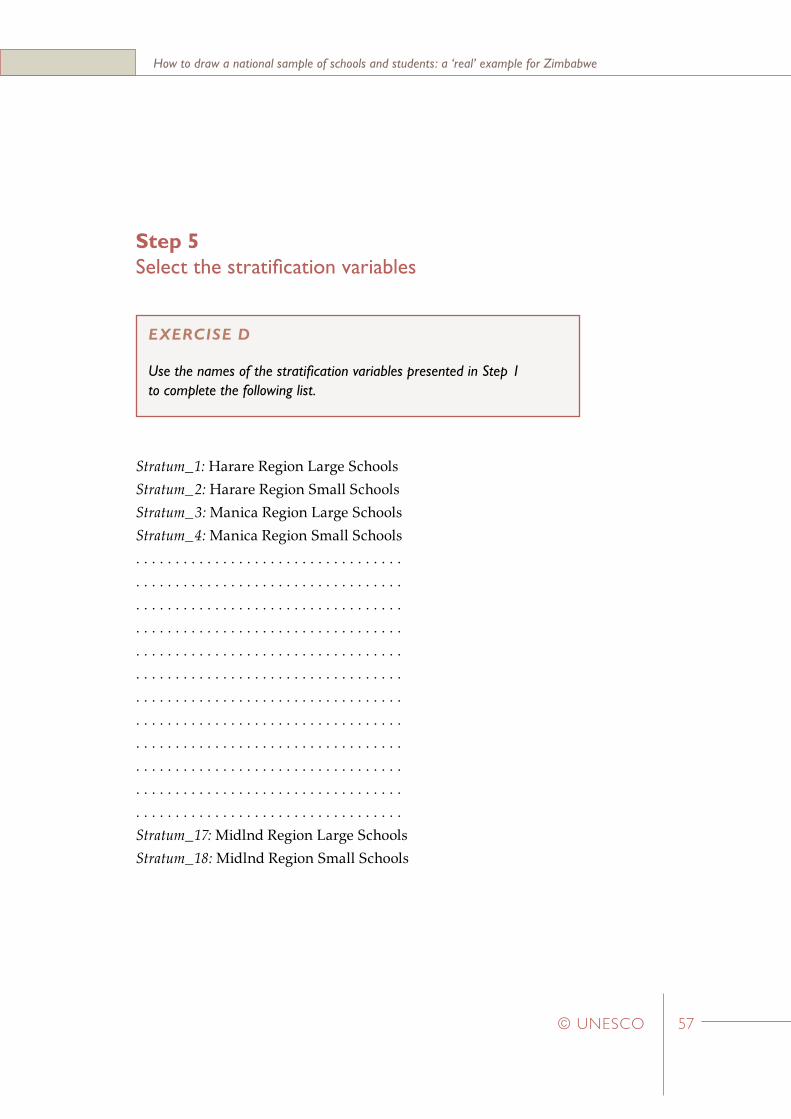
56
Sample design for educational survey researchModule 3
http://www.sacmeq.org and http://www.unesco.org/iiep 57
How to draw a national sample of schools and students: a ‘real’ example for Zimbabwe
© UNESCO
Step 5Select the stratification variables
Stratum_1: Harare Region Large SchoolsStratum_2: Harare Region Small SchoolsStratum_3: Manica Region Large SchoolsStratum_4: Manica Region Small Schools. . . . . . . . . . . . . . . . . . . . . . . . . . . . . . . . . . . . . . . . . . . . . . . . . . . . . . . . . . . . . . . . . . . . . . . . . . . . . . . . . . . . . . . . . . . . . . . . . . . . . . . . . . . . . . . . . . . . . . . . . . . . . . . . . . . . . . . . . . . . . . . . . . . . . . . . . . . . . . . . . . . . . . . . . . . . . . . . . . . . . . . . . . . . . . . . . . . . . . . . . . . . . . . . . . . . . . . . . . . . . . . . . . . . . . . . . . . . . . . . . . . . . . . . . . . . . . . . . . . . . . . . . . . . . . . . . . . . . . . . . . . . . . . . . . . . . . . . . . . . . . . . . . . . . . . . . . . . . . . . . . . . . . . . . . . . . . . . . . . . . . . . . . . . . . . . . . . . . . . . . . . . . . . . . . . . . . . . . . . . . . . . . . . . . . . . . . . . . . . . . . . . . . . . Stratum_17: Midlnd Region Large SchoolsStratum_18: Midlnd Region Small Schools
EXERCISE D
Use the names of the stratification variables presented in Step 1 to complete the following list.
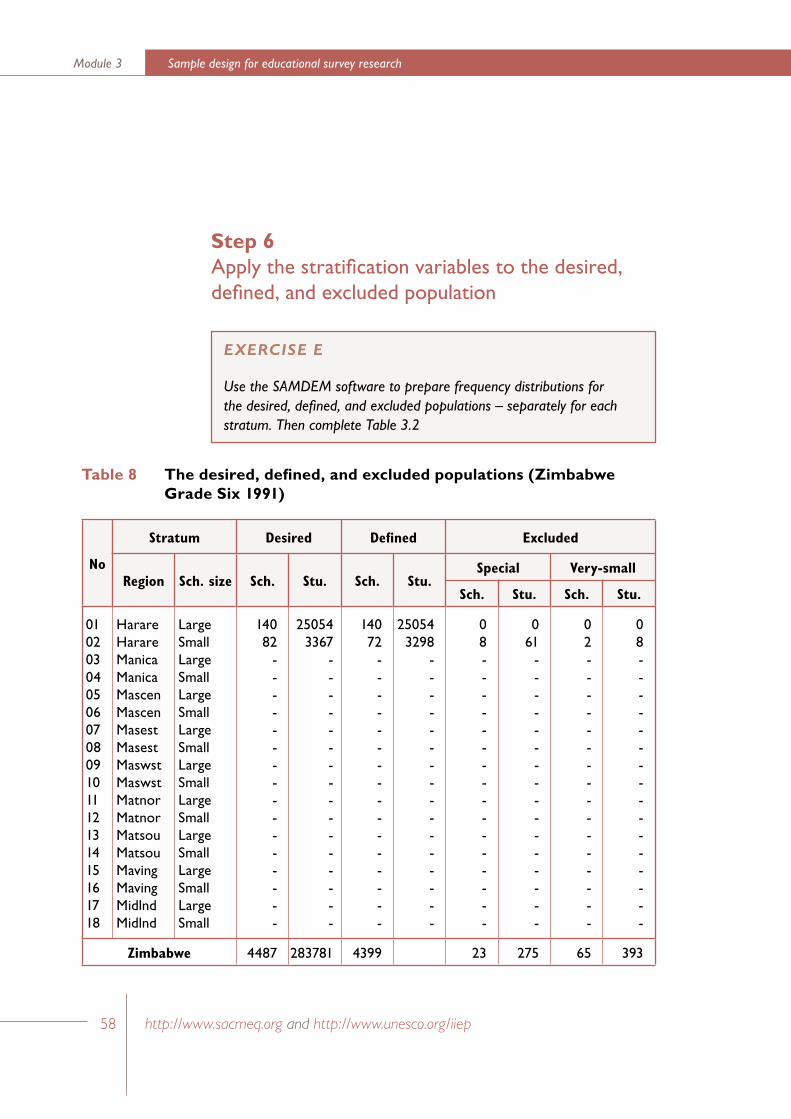
58
Sample design for educational survey researchModule 3
http://www.sacmeq.org and http://www.unesco.org/iiep 59
How to draw a national sample of schools and students: a ‘real’ example for Zimbabwe
© UNESCO
Step 6Apply the stratification variables to the desired, defined, and excluded population
EXERCISE E
Use the SAMDEM software to prepare frequency distributions for the desired, defined, and excluded populations – separately for each stratum. Then complete Table 3.2
Table 8 The desired, defined, and excluded populations (Zimbabwe Grade Six 1991)
No
Stratum Desired Defined Excluded
Region Sch. size Sch. Stu. Sch. Stu.Special Very-small
Sch. Stu. Sch. Stu.
010203040506070809101112131415161718
HarareHarareManicaManicaMascenMascenMasestMasestMaswstMaswstMatnorMatnorMatsouMatsouMavingMavingMidlndMidlnd
LargeSmallLargeSmallLargeSmallLargeSmallLargeSmallLargeSmallLargeSmallLargeSmallLargeSmall
140 82
----------------
25054 3367
----------------
140 72
----------------
25054 3298
----------------
0 8----------------
0 61
----------------
0 2----------------
0 8----------------
Zimbabwe 4487 283781 4399 23 275 65 393
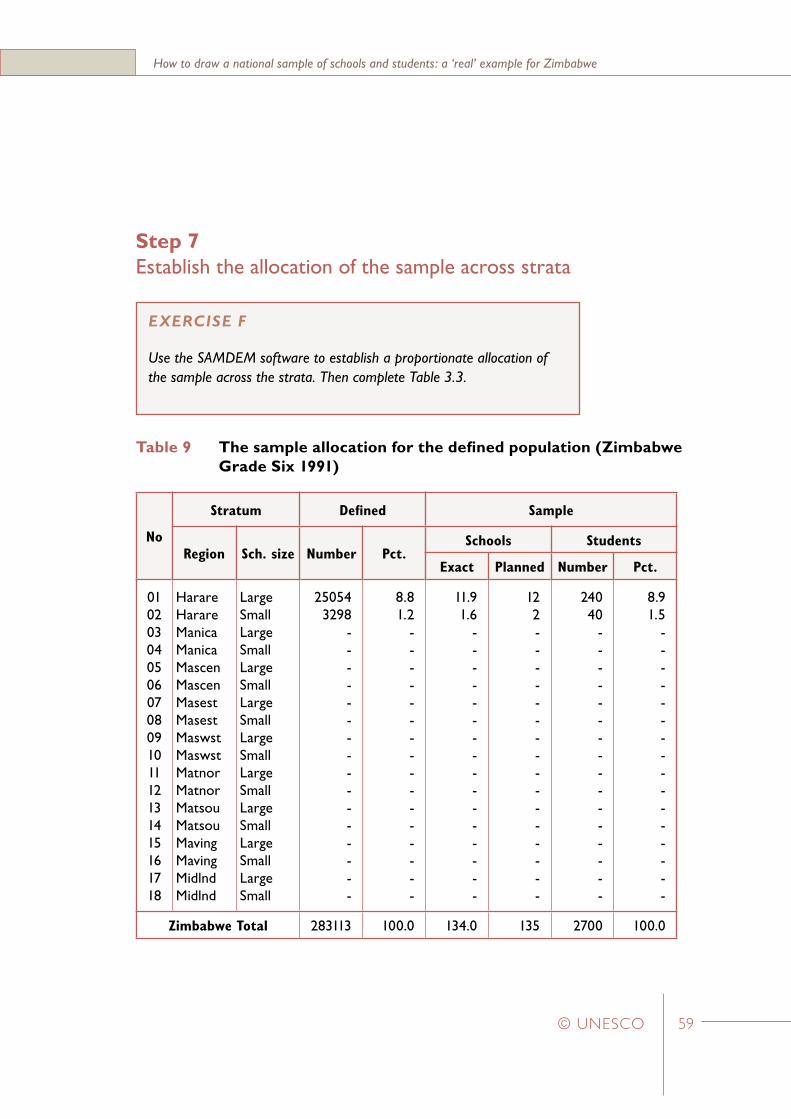
58
Sample design for educational survey researchModule 3
http://www.sacmeq.org and http://www.unesco.org/iiep 59
How to draw a national sample of schools and students: a ‘real’ example for Zimbabwe
© UNESCO
Step 7Establish the allocation of the sample across strata
EXERCISE F
Use the SAMDEM software to establish a proportionate allocation of the sample across the strata. Then complete Table 3.3.
Table 9 The sample allocation for the defined population (Zimbabwe Grade Six 1991)
No
Stratum Defined Sample
Region Sch. size Number Pct.Schools Students
Exact Planned Number Pct.
010203040506070809101112131415161718
HarareHarareManicaManicaMascenMascenMasestMasestMaswstMaswstMatnorMatnorMatsouMatsouMavingMavingMidlndMidlnd
LargeSmallLargeSmallLargeSmallLargeSmallLargeSmallLargeSmallLargeSmallLargeSmallLargeSmall
25054 3298
----------------
8.8 1.2
----------------
11.9 1.6
----------------
12 2----------------
240 40
----------------
8.9 1.5
----------------
Zimbabwe Total 283113 100.0 134.0 135 2700 100.0
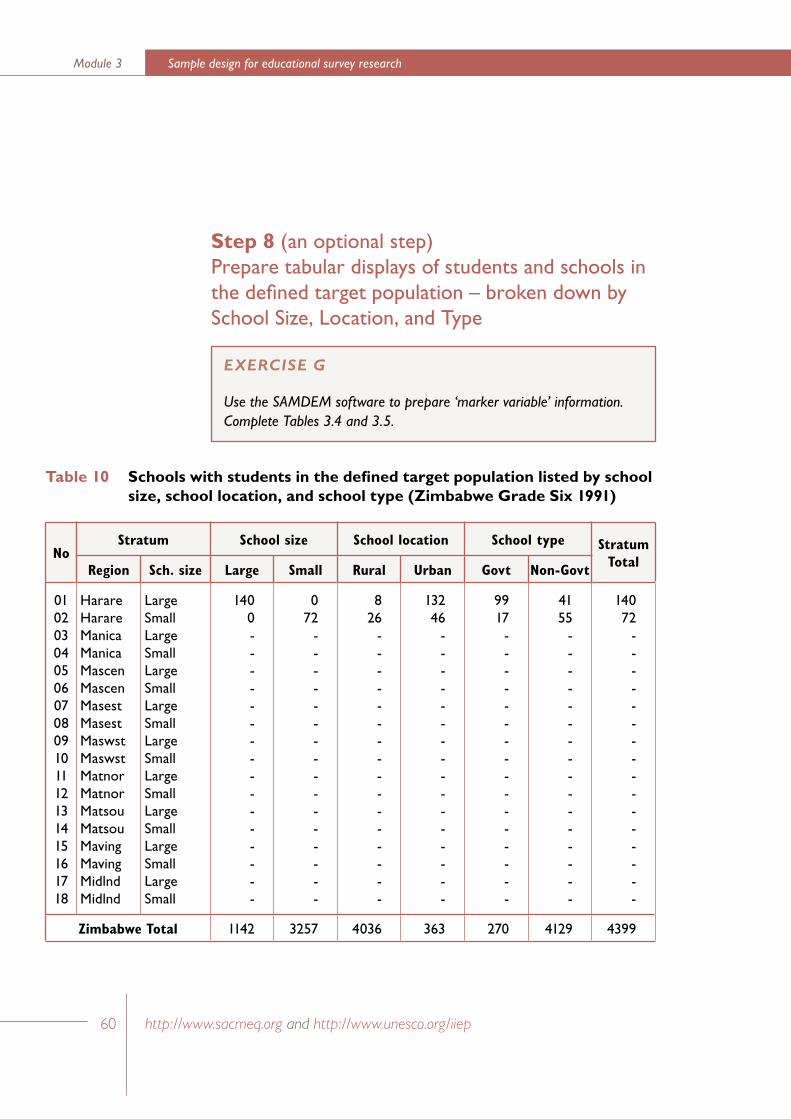
60
Sample design for educational survey researchModule 3
http://www.sacmeq.org and http://www.unesco.org/iiep 61
How to draw a national sample of schools and students: a ‘real’ example for Zimbabwe
© UNESCO
Step 8 (an optional step)Prepare tabular displays of students and schools in the defined target population – broken down by School Size, Location, and Type
EXERCISE G
Use the SAMDEM software to prepare ‘marker variable’ information. Complete Tables 3.4 and 3.5.
Table 10 Schools with students in the defined target population listed by school size, school location, and school type (Zimbabwe Grade Six 1991)
NoStratum School size School location School type Stratum
TotalRegion Sch. size Large Small Rural Urban Govt Non-Govt
010203040506070809101112131415161718
HarareHarareManicaManicaMascenMascenMasestMasestMaswstMaswstMatnorMatnorMatsouMatsouMavingMavingMidlndMidlnd
LargeSmallLargeSmallLargeSmallLargeSmallLargeSmallLargeSmallLargeSmallLargeSmallLargeSmall
1400----------------
0 72
----------------
826
----------------
132 46
----------------
99 17
----------------
4155
----------------
14072
----------------
Zimbabwe Total 1142 3257 4036 363 270 4129 4399
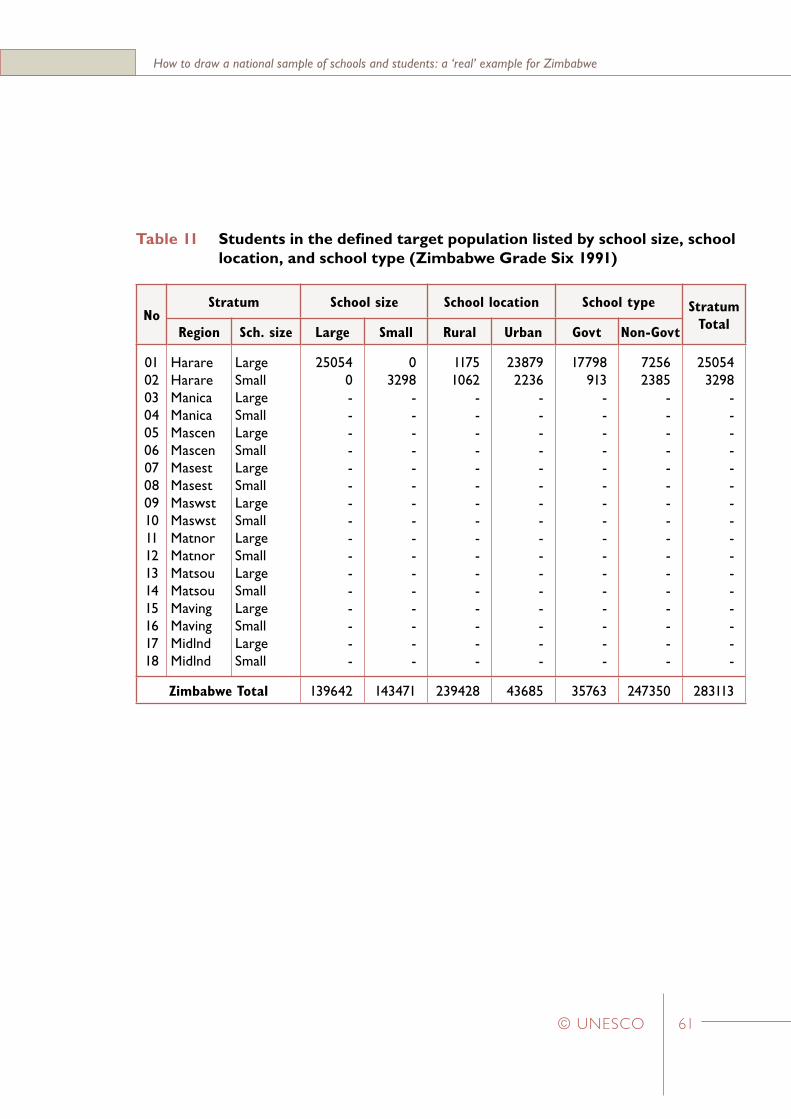
60
Sample design for educational survey researchModule 3
http://www.sacmeq.org and http://www.unesco.org/iiep 61
How to draw a national sample of schools and students: a ‘real’ example for Zimbabwe
© UNESCO
Table 11 Students in the defined target population listed by school size, school location, and school type (Zimbabwe Grade Six 1991)
NoStratum School size School location School type Stratum
TotalRegion Sch. size Large Small Rural Urban Govt Non-Govt
010203040506070809101112131415161718
HarareHarareManicaManicaMascenMascenMasestMasestMaswstMaswstMatnorMatnorMatsouMatsouMavingMavingMidlndMidlnd
LargeSmallLargeSmallLargeSmallLargeSmallLargeSmallLargeSmallLargeSmallLargeSmallLargeSmall
250540----------------
03298
----------------
11751062
----------------
23879 2236
----------------
17798 913
----------------
72562385
----------------
250543298
----------------
Zimbabwe Total 139642 143471 239428 43685 35763 247350 283113
62
Sample design for educational survey researchModule 3
http://www.sacmeq.org and http://www.unesco.org/iiep 63
How to draw a national sample of schools and students: a ‘real’ example for Zimbabwe
© UNESCO
Step 9For schools with students in the defined target population, prepare a separate list of schools for each stratum with ‘pseudoschools’ identified with a bracket ( [ )
Step 10For the defined target population, assign ‘lottery tickets’ such that each school receives a number of tickets that is equal to the number of students in the defined target population
EXERCISE H
Use the SAMDEM software to list the schools having students in the defined target population and located in ‘stratum 2: Harare region small schools!’.
EXERCISE I
Use the SAMDEM software to assign ‘lottery tickets’ for schools having students in the defined target population and located in ‘stratum 2: Harare region small schools’. repeat this exercise for one other stratum.
62
Sample design for educational survey researchModule 3
http://www.sacmeq.org and http://www.unesco.org/iiep 63
How to draw a national sample of schools and students: a ‘real’ example for Zimbabwe
© UNESCO
Step 11Select the sample of schools.
Step 12Use a table of random numbers to select a simple random sample of 20 students in each school.
EXERCISE J
Use the SAMDEM software to to select the sample of schools from schools having students in the defined target population and located in ‘stratum 2: Harare region small schools’. repeat this exercise for one other stratum.
EXERCISE K
use the random number tables (see Appendix 1) to identify student selection numbers for the schools that were selected from ‘stratum 2: Harare region small schools’. repeat this exercise for one other stratum.
Sample design for educational survey researchModule 3
64 http://www.sacmeq.org and http://www.unesco.org/iiep 65© UNESCO
4 The estimation of sampling errors
The computational formulae required to estimate the variance of descriptive statistics, such as sample means, are widely available for simple random sample designs and some sample designs that incorporate complexities such as stratification and cluster sampling. However, in the case of more complex analytical statistics, such as correlation coefficients and regression coefficients, the required formulae are not readily available for sample designs which depart from the model of simple random sampling. These formulae are either enormously complicated or, ultimately, they prove resistant to mathematical analysis (Frankel, 1971).
In the absence of suitable formulae, a variety of empirical techniques have emerged in recent years which provide «approximate variances that appear satisfactory for practical purposes» (Kish, 1978:20). The most frequently applied empirical techniques may be divided into two broad categories : Subsample Replication and Taylor’s Series Approximation.
In Subsample Replication a total sample of data is used to construct two or more subsamples and then a distribution of parameter estimates is generated by using each subsample. The subsample results are analyzed to obtain an estimate of the parameter, as well as a confidence assessment for that estimate (Finifter, 1972). The main approaches in using this technique have been Independent Replication (Deming, 1960), Jackknifing (Tukey, 1958), and Balanced Repeated Replication (McCarthy, 1966).
Sample design for educational survey researchModule 3
64 http://www.sacmeq.org and http://www.unesco.org/iiep 65© UNESCO
Alternatively, Taylor’s Series Approximation may be used to provide a more ‘direct’ method of variance estimation than these three approaches. In the absence of an exact formula for the variance, the Taylor’s Series is used to approximate a numerical value for the first few terms of a series expansion of the variance formula. A number of computer programs have been prepared in order to carry out the extensive numerical calculations required for this approach (Wolter, 1985, Appendix ).
In the remainder of this section the Jackknife procedure has been described. This procedure offers the following two important benefits.
• Greater FlexibilityThe Jackknife may be applied to a wide variety of sample designs whereas (i) Balanced Repeated Replication is designed for application to sample designs that have precisely two primary sampling units per stratum, and (ii) Independent Replication requires a large number of selections per stratum so that a reasonably large number of independent replicated samples can be formed
• Ease of Use The Jackknife does not require specialized software systems whereas (i) Balanced Repeated Replication usually requires the prior establishment by computer of complex Hadamard matrices that are used to ‘balance’ the half samples of data that form replications of the original sample, and (ii) Taylor’s Series methods require specific software routines to be available for each statistic under consideration.
66
Sample design for educational survey researchModule 3
http://www.sacmeq.org and http://www.unesco.org/iiep 67
The estimation of the sampling errors
© UNESCO
The Jackknife Procedure
The development of the Jackknife procedure may be traced back to a method used by Quenouille (1956) to reduce the bias of estimates. Further refinement of the method (Mosteller and Tukey, 1968) led to its application in a range of social science situations where formulae are not readily available for the calculation of sampling errors.
The Jackknife procedure requires that an initial estimate, yall, of a statistic, y, be made on the total sample of data. The total sample is then divided into k subgroups and yi is computed, using the same functional form as yall, but based on the reduced sample of data obtained by omitting the ith subgroup. Then k ‘pseudovalues’ yi
* (i=1,2,...,k) can be defined – based on the k reduced samples:
Quenouille’s estimator (also called the ‘Jackknife value’) is the mean of the k pseudovalues:
Quenouille’s contribution was to show that, while yall may have bias of order 1/n as an estimate of y, the Jackknife value, y*, has bias of order 1/n2.
��������������� ������
������ ��
����
� �
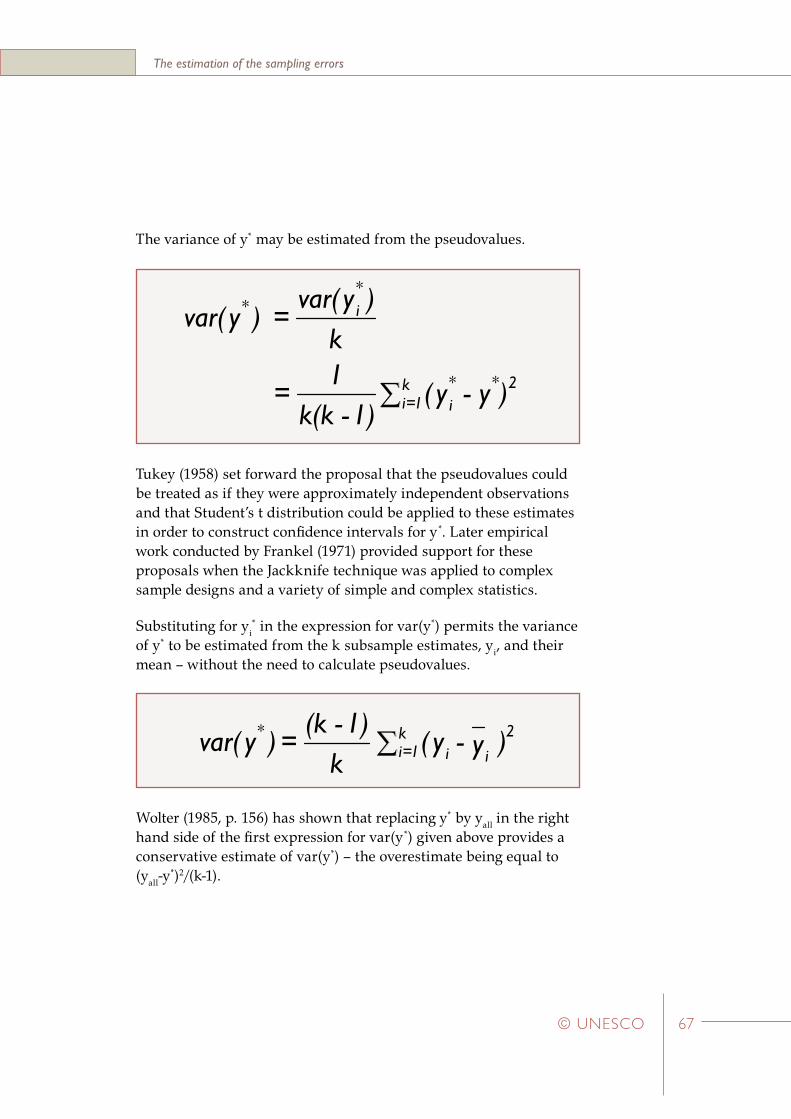
66
Sample design for educational survey researchModule 3
http://www.sacmeq.org and http://www.unesco.org/iiep 67
The estimation of the sampling errors
© UNESCO
The variance of y* may be estimated from the pseudovalues.
Tukey (1958) set forward the proposal that the pseudovalues could be treated as if they were approximately independent observations and that Student’s t distribution could be applied to these estimates in order to construct confidence intervals for y*. Later empirical work conducted by Frankel (1971) provided support for these proposals when the Jackknife technique was applied to complex sample designs and a variety of simple and complex statistics.
Substituting for yi* in the expression for var(y*) permits the variance
of y* to be estimated from the k subsample estimates, yi, and their mean – without the need to calculate pseudovalues.
Wolter (1985, p. 156) has shown that replacing y* by yall in the right hand side of the first expression for var(y*) given above provides a conservative estimate of var(y*) – the overestimate being equal to (yall-y
*)2/(k-1).
���������������
��
�������
�������
����
����
���
�
���������������
������� �
���
���� �
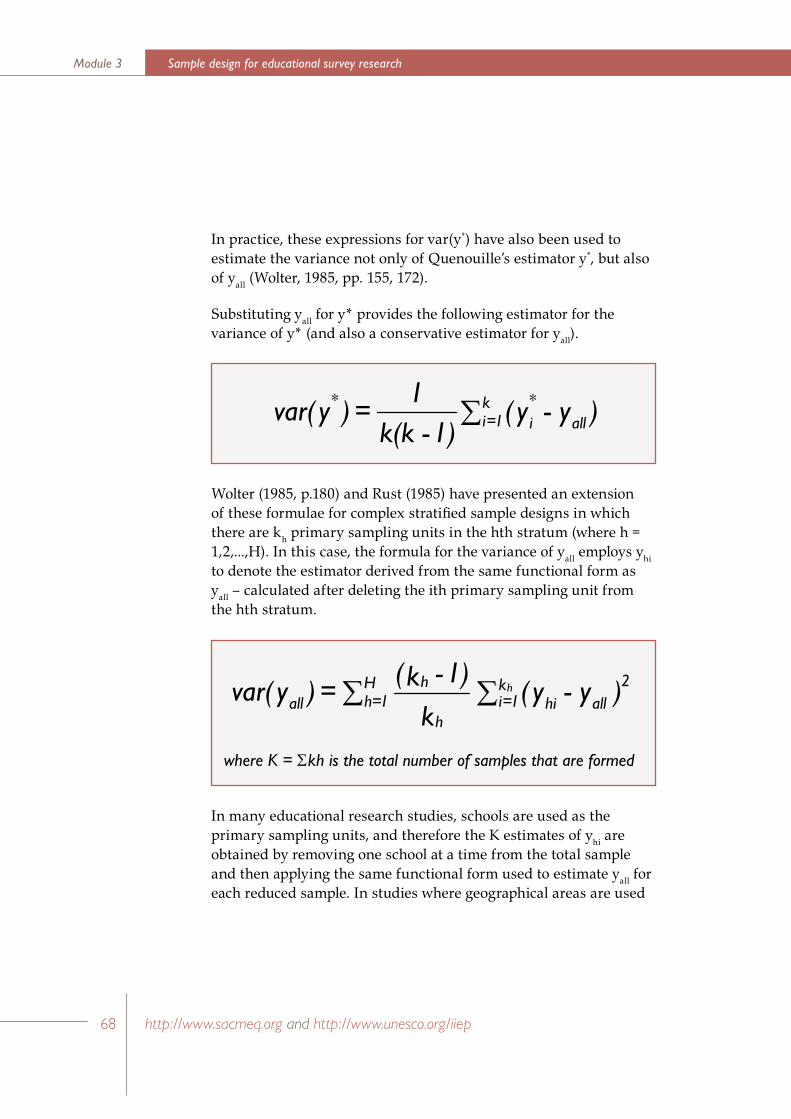
68
Sample design for educational survey researchModule 3
http://www.sacmeq.org and http://www.unesco.org/iiep 69
The estimation of the sampling errors
© UNESCO
In practice, these expressions for var(y*) have also been used to estimate the variance not only of Quenouille’s estimator y*, but also of yall (Wolter, 1985, pp. 155, 172).
Substituting yall for y* provides the following estimator for the variance of y* (and also a conservative estimator for yall).
Wolter (1985, p.180) and Rust (1985) have presented an extension of these formulae for complex stratified sample designs in which there are kh primary sampling units in the hth stratum (where h = 1,2,...,H). In this case, the formula for the variance of yall employs yhi to denote the estimator derived from the same functional form as yall – calculated after deleting the ith primary sampling unit from the hth stratum.
In many educational research studies, schools are used as the primary sampling units, and therefore the K estimates of yhi are obtained by removing one school at a time from the total sample and then applying the same functional form used to estimate yall for each reduced sample. In studies where geographical areas are used
���������������
�������� ���
��
����
� �
where K = Σkh is the total number of samples that are formed
��������
�������������� ������
����
�
��������
���
68
Sample design for educational survey researchModule 3
http://www.sacmeq.org and http://www.unesco.org/iiep 69
The estimation of the sampling errors
© UNESCO
as the primary sampling units, followed by the selection of more than one school per area, the estimates of yhi are based on reduced samples formed by omitting one geographical area at a time.

Sample design for educational survey researchModule 3
70 http://www.sacmeq.org and http://www.unesco.org/iiep 71© UNESCO
Brickell, J. L. (1974). “Nominated samples from public schools and statistical bias”. American Educational Research Journal, 11(4), 333-341.
Deming, W. E. (1960). Sample design in business research. New York: Wiley.
Finifter, B. M. (1972). “The generation of confidence: Evaluating research findings by random subsample replication”. In H. L. Costner (Ed.), Sociological Methodology. San Francisco: Jossey-Bass.
Frankel, M. R. (1971). Inference from survey samples. Ann Arbor, Michigan: Institute for Social Research.
Haggard, E.A. (1958). Intraclass correlation and the analysis of variance. New York: Dryden.
Hansen, M. H., Hurwitz, W. N.; Madow, W. G. (1953). Sample survey methods and theory (Vols. 1 & 2). New York: Wiley.
International Association for the Evaluation of Educational Achievement (IEA) (1986). Technical committee meeting: sample design and sample sizes. Paper distributed at the Annual General Meeting of the IEA, Stockholm, Sweden.
Jessen, R. L. (1978). “Statistical survey techniques”. New York: Wiley.
5 References

Sample design for educational survey researchModule 3
70 http://www.sacmeq.org and http://www.unesco.org/iiep 71© UNESCO
Kalton, G. (1983). “Introduction to survey sampling” (Sage Series in Quantitative Applications in the Social Sciences, No. 35). Beverly Hills, CA: Sage.
Kish, L. (1965). Survey sampling. New York: Wiley.
Kish, L. (1978). “On the future of survey sampling”. In N. K. Namboordi (Ed.), Survey sampling and measurement. New York: Academic Press.
McCarthy, P. J. (1966). Replication: An approach to the analysis of data from complex surveys. Washington: United States National Centre for Health Statistics.
Mosteller, F. and Tukey, J. (1968). “Data Analysis Including Statistics”. In G. Lindzey and E. Aronson (Eds.), The handbook of social psychology. (2nd ed.). Reading, Massachusetts: Addison-Wesley.
Quenouille, M. J. (1956). “Notes on Bias in Estimation”. Biometrica, 43, 353-360.
Ross, K. N. (1976). Searching for uncertainty: Sampling errors in educational survey research. Hawthorn, Victoria: Australian Council for Educational Research.
Ross, K. N. (1978). Sample design for educational survey research (Monograph). Evaluation in Education, 2, 105-195.
Ross, K. N. (1987). Sample design. International Journal of Educational Research, 11(1), 57-75.
Ross K. N. (1991). Sampling Manual for the IEA International Study of Reading Literacy. Hamburg: IEA International Study of Reading Literacy Coordinating Centre.

Sample design for educational survey researchModule 3
72 http://www.sacmeq.org and http://www.unesco.org/iiep 73© UNESCO
Ross, K. N. and Postlethwaite, T. N. (1992). “Indicators of the Quality of Education: A National Study of Primary Schools in Zimbabwe”. Paris: International Institute for Educational Planning.
Rust, K. (1985). Variance estimation for complex estimators in sample surveys. Journal of Official Statistics, 1(4), 381-397.
Sylla, K.; Saito, M. and Ross,K. (2004). SAMDEM: Sample Design Manager. Paris. International Institute for Educational Planning.
Tukey, J. W. (1958). Bias and confidence in not-quite large samples (Abstract). Annals of Mathematical Statistics, 29, 614.
Wolf, R. M. (1977). Achievement in America: National report of the United States for the International Educational Achievement Project. New York: Teachers College Press.
Wolter, K. M. (1985). Introduction to Variance Estimation. New York: Springer-Verlag.
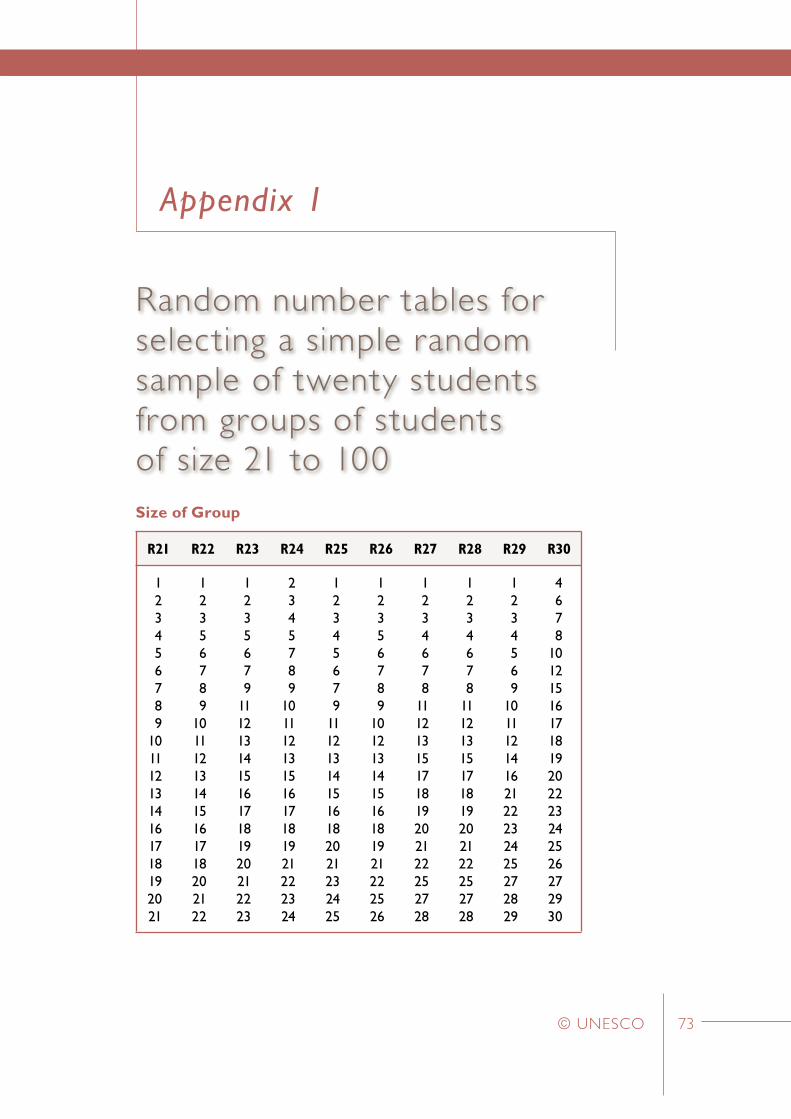
Sample design for educational survey researchModule 3
72 http://www.sacmeq.org and http://www.unesco.org/iiep 73© UNESCO
Size of Group
R21 R22 R23 R24 R25 R26 R27 R28 R29 R30
123456789
1011121314161718192021
12356789
101112131415161718202122
1235679
11121314151617181920212223
2345789
10111213151617181921222324
12345679
111213141516182021232425
12356789
101213141516181921222526
1234678
11121315171819202122252728
1234678
11121315171819202122252728
1234569
10111214162122232425272829
4678
10121516171819202223242526272930
Appendix 1
Random number tables for selecting a simple random sample of twenty students from groups of students of size 21 to 100
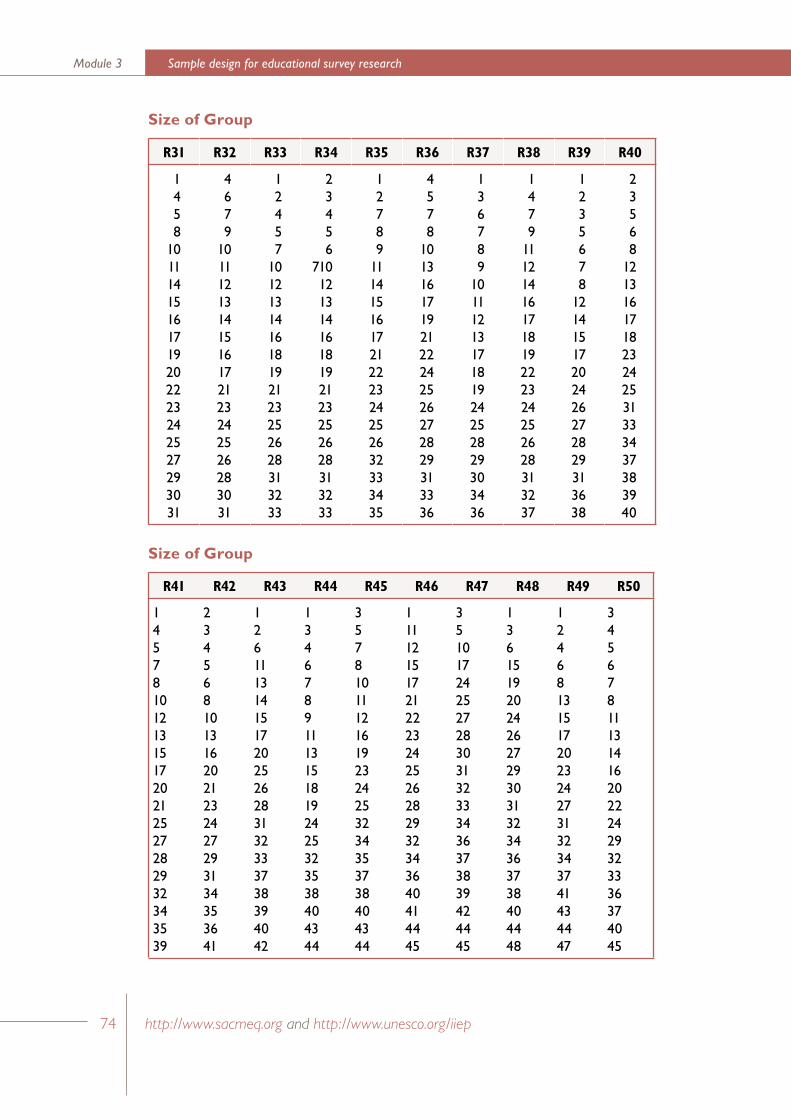
74
Sample design for educational survey researchModule 3
http://www.sacmeq.org and http://www.unesco.org/iiep 75
Appendix 1
© UNESCO
Size of Group
R31 R32 R33 R34 R35 R36 R37 R38 R39 R40
1458
10111415161719202223242527293031
4679
10111213141516172123242526283031
12457
101213141618192123252628313233
23456
7101213141618192123252628313233
12789
111415161721222324252632333435
4578
10131617192122242526272829313336
136789
1011121317181924252829303436
1479
11121416171819222324252628313237
1235678
12141517202426272829313638
23568
121316171823242531333437383940
Size of Group
R41 R42 R43 R44 R45 R46 R47 R48 R49 R50
14578101213151720212527282932343539
2345681013162021232427293134353641
1261113141517202526283132333738394042
134678911131518192425323538404344
357810111216192324253234353738404344
111121517212223242526282932343640414445
35101724252728303132333436373839424445
1361519202426272930313234363738404448
12468131517202324273132343741434447
3456781113141620222429323336374045
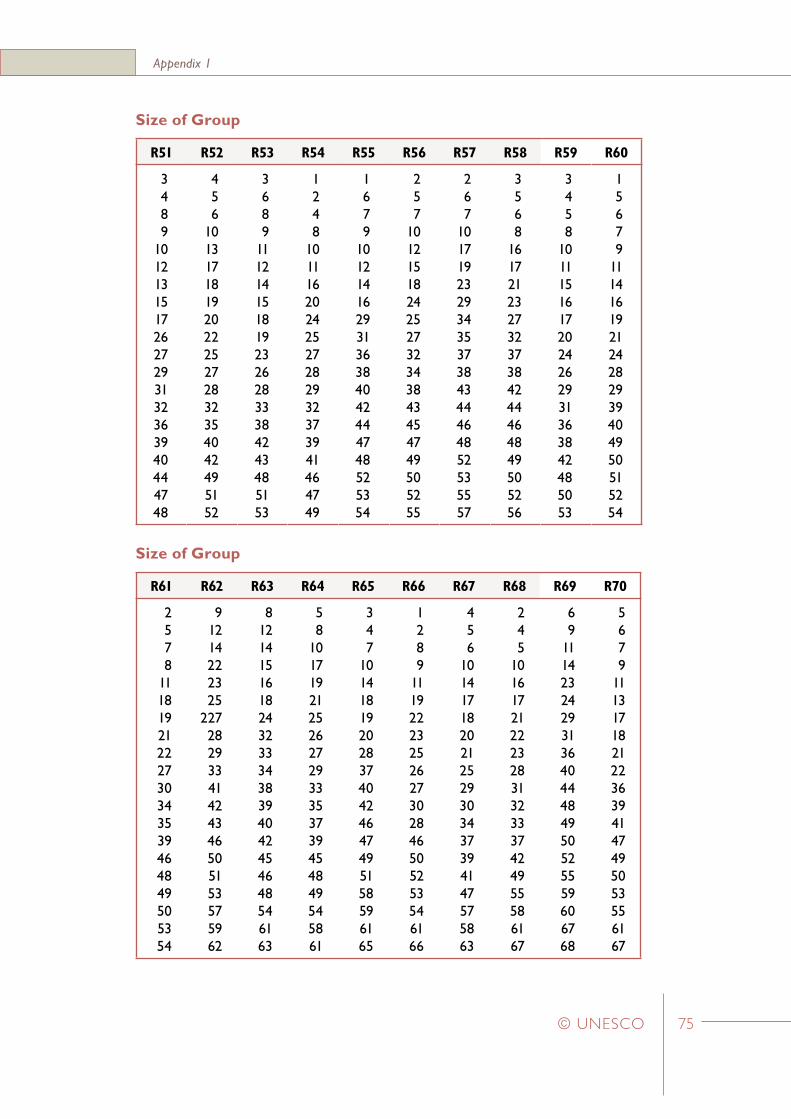
74
Sample design for educational survey researchModule 3
http://www.sacmeq.org and http://www.unesco.org/iiep 75
Appendix 1
© UNESCO
Size of Group
R51 R52 R53 R54 R55 R56 R57 R58 R59 R60
3489
10121315172627293132363940444748
456
1013171819202225272832354042495152
3689
11121415181923262833384243485153
1248
10111620242527282932373941464749
1679
10121416293136384042444748525354
257
1012151824252732343843454749505255
267
1017192329343537384344464852535557
3568
16172123273237384244464849505256
3458
10111516172024262931363842485053
15679
111416192124282939404950515254
Size of Group
R61 R62 R63 R64 R65 R66 R67 R68 R69 R70
2578
11181921222730343539464849505354
91214222325
22728293341424346505153575962
812141516182432333438394042454648546163
58
101719212526272933353739454849545861
347
1014181920283740424647495158596165
1289
11192223252627302846505253546166
456
1014171820212529303437394147575863
245
1016172122232831323337424955586167
69
111423242931364044484950525559606768
5679
11131718212236394147495053556167
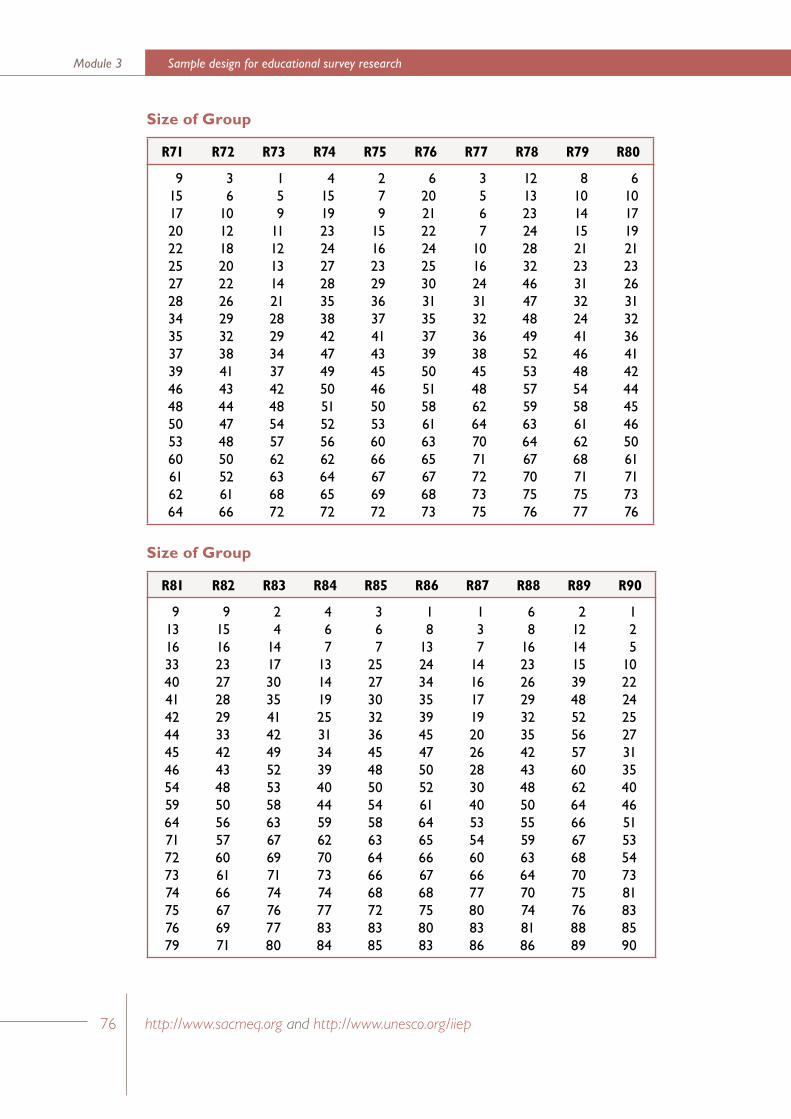
76
Sample design for educational survey researchModule 3
http://www.sacmeq.org and http://www.unesco.org/iiep 77
Appendix 1
© UNESCO
Size of Group
R71 R72 R73 R74 R75 R76 R77 R78 R79 R80
915172022252728343537394648505360616264
36
101218202226293238414344474850526166
159
1112131421282934374248545762636872
415192324272835384247495051525662646572
279
1516232936374143454650536066676972
620212224253031353739505158616365676873
3567
10162431323638454862647071727375
1213232428324647484952535759636467707576
810141521233132244146485458616268717577
610171921232631323641424445465061717376
Size of Group
R81 R82 R83 R84 R85 R86 R87 R88 R89 R90
913163340414244454654596471727374757679
915162327282933424348505657606166676971
24
141730354142495253586367697174767780
467
1314192531343940445962707374778384
367
2527303236454850545863646668728385
18
132434353945475052616465666768758083
137
1416171920262830405354606677808386
68
162326293235424348505559636470748186
212141539485256576062646667687075768889
125
1022242527313540465153547381838590
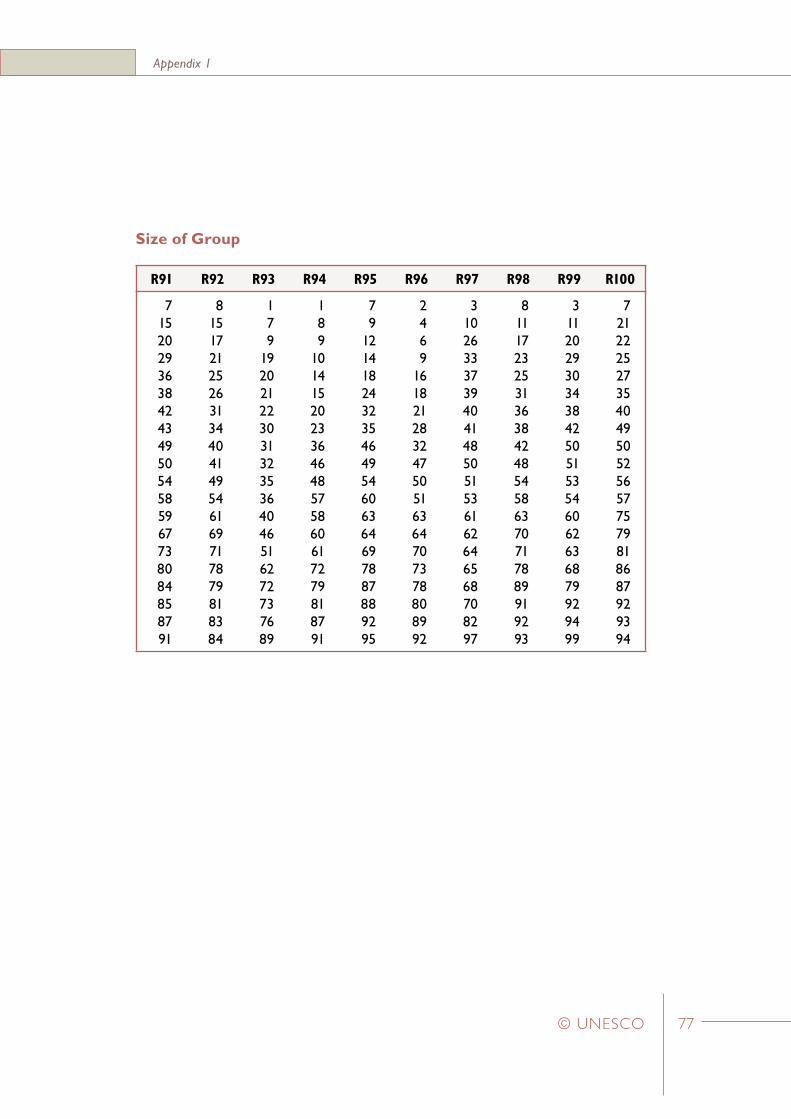
76
Sample design for educational survey researchModule 3
http://www.sacmeq.org and http://www.unesco.org/iiep 77
Appendix 1
© UNESCO
Size of Group
R91 R92 R93 R94 R95 R96 R97 R98 R99 R100
715202936384243495054585967738084858791
815172125263134404149546169717879818384
179
1920212230313235364046516272737689
189
1014152023364648575860617279818791
79
121418243235464954606364697887889295
2469
16182128324750516364707378808992
310263337394041485051536162646568708297
811172325313638424854586370717889919293
311202930343842505153546062636879929499
721222527354049505256577579818687929394
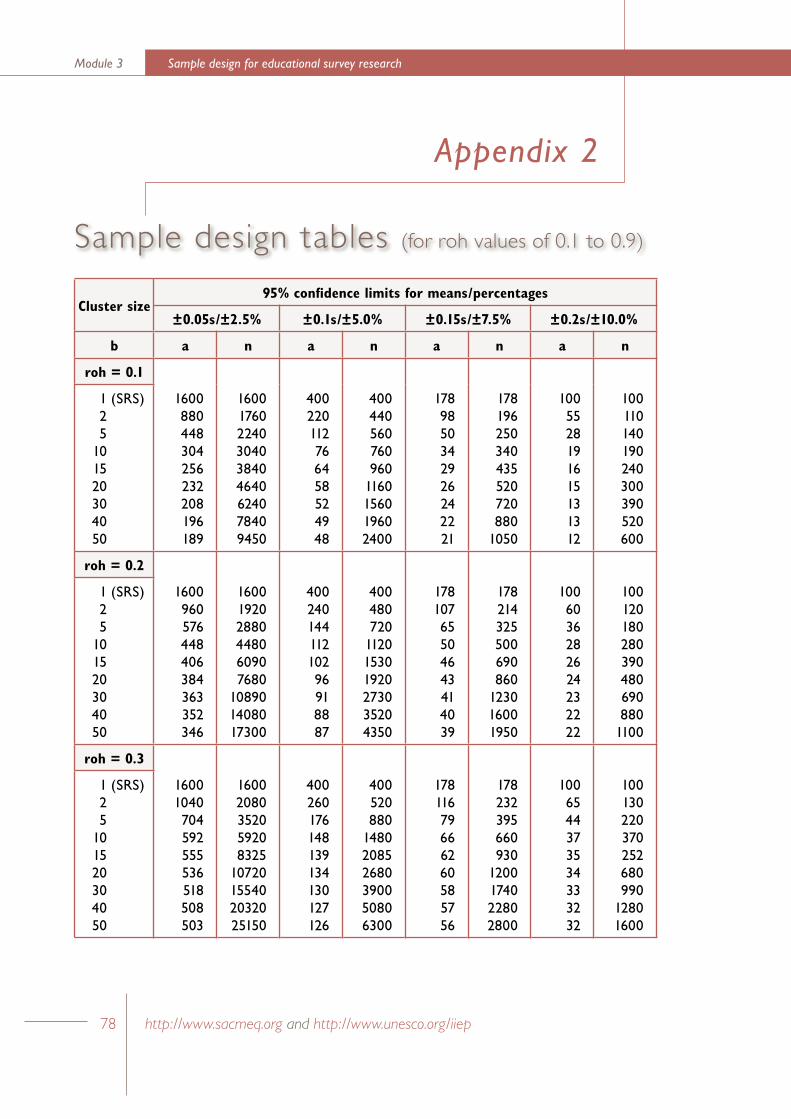
Sample design for educational survey researchModule 3
78 http://www.sacmeq.org and http://www.unesco.org/iiep 79© UNESCO
Appendix 2
Sample design tables (for roh values of 0.1 to 0.9)
Cluster size95% confidence limits for means/percentages
±0.05s/±2.5% ±0.1s/±5.0% ±0.15s/±7.5% ±0.2s/±10.0%
b a n a n a n a n
roh = 0.1
1 (SRS) 2 5101520304050
1600880448304256232208196189
160017602240304038404640624078409450
400220112766458524948
400440560760960
1160156019602400
1789850342926242221
178196250340435520720880
1050
1005528191615131312
100110140190240300390520600
roh = 0.2
1 (SRS) 2 5101520304050
1600960576448406384363352346
160019202880448060907680
108901408017300
40024014411210296918887
400480720
112015301920273035204350
17810765504643414039
178214325500690860
123016001950
1006036282624232222
100120180280390480690880
1100
roh = 0.3
1 (SRS) 2 5101520304050
16001040704592555536518508503
16002080352059208325
10720155402032025150
400260176148139134130127126
400520880
148020852680390050806300
17811679666260585756
178232395660930
1200174022802800
1006544373534333232
100130220370252680990
12801600
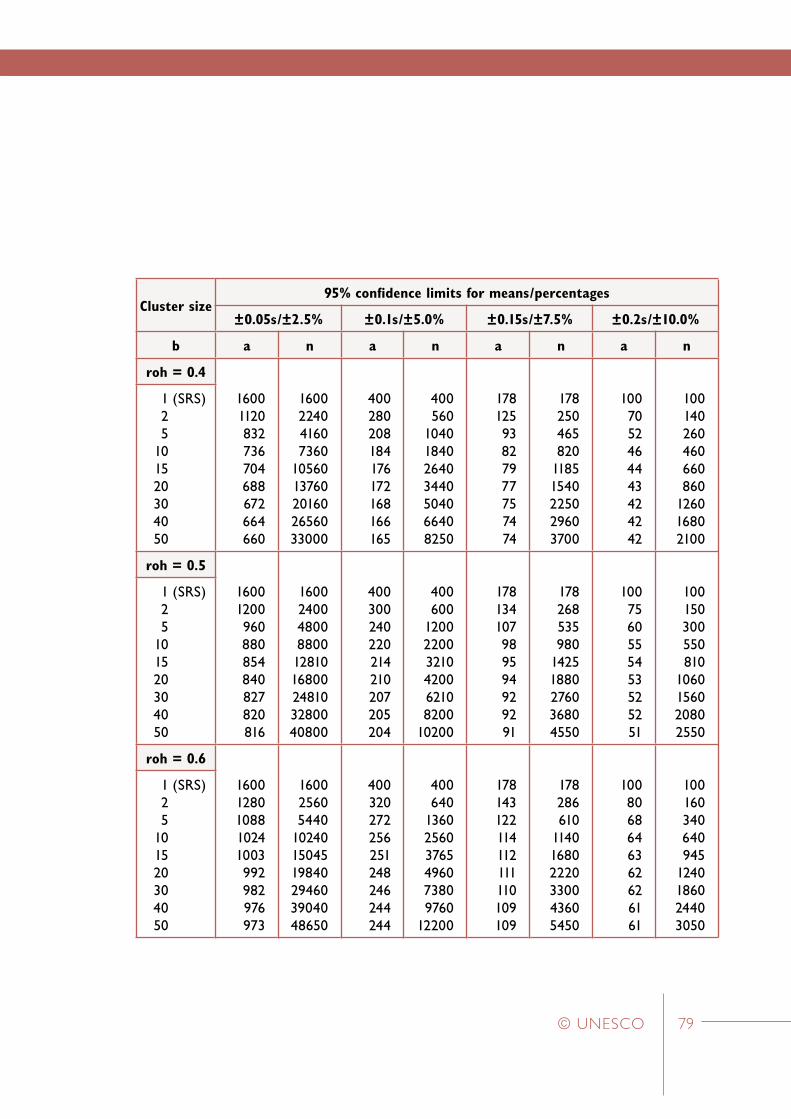
Sample design for educational survey researchModule 3
78 http://www.sacmeq.org and http://www.unesco.org/iiep 79© UNESCO
Cluster size95% confidence limits for means/percentages
±0.05s/±2.5% ±0.1s/±5.0% ±0.15s/±7.5% ±0.2s/±10.0%
b a n a n a n a n
roh = 0.4
1 (SRS) 2 5101520304050
16001120832736704688672664660
1600224041607360
1056013760201602656033000
400280208184176172168166165
400560
1040184026403440504066408250
17812593827977757474
178250465820
11851540225029603700
1007052464443424242
100140260460660860
126016802100
roh = 0.5
1 (SRS) 2 5101520304050
16001200960880854840827820816
1600240048008800
1281016800248103280040800
400300240220214210207205204
400600
120022003210420062108200
10200
178134107989594929291
178268535980
14251880276036804550
1007560555453525251
100150300550810
1060156020802550
roh = 0.6
1 (SRS) 2 5101520304050
16001280108810241003992982976973
160025605440
102401504519840294603904048650
400320272256251248246244244
400640
136025603765496073809760
12200
178143122114112111110109109
178286610
114016802220330043605450
1008068646362626161
100160340640945
1240186024403050
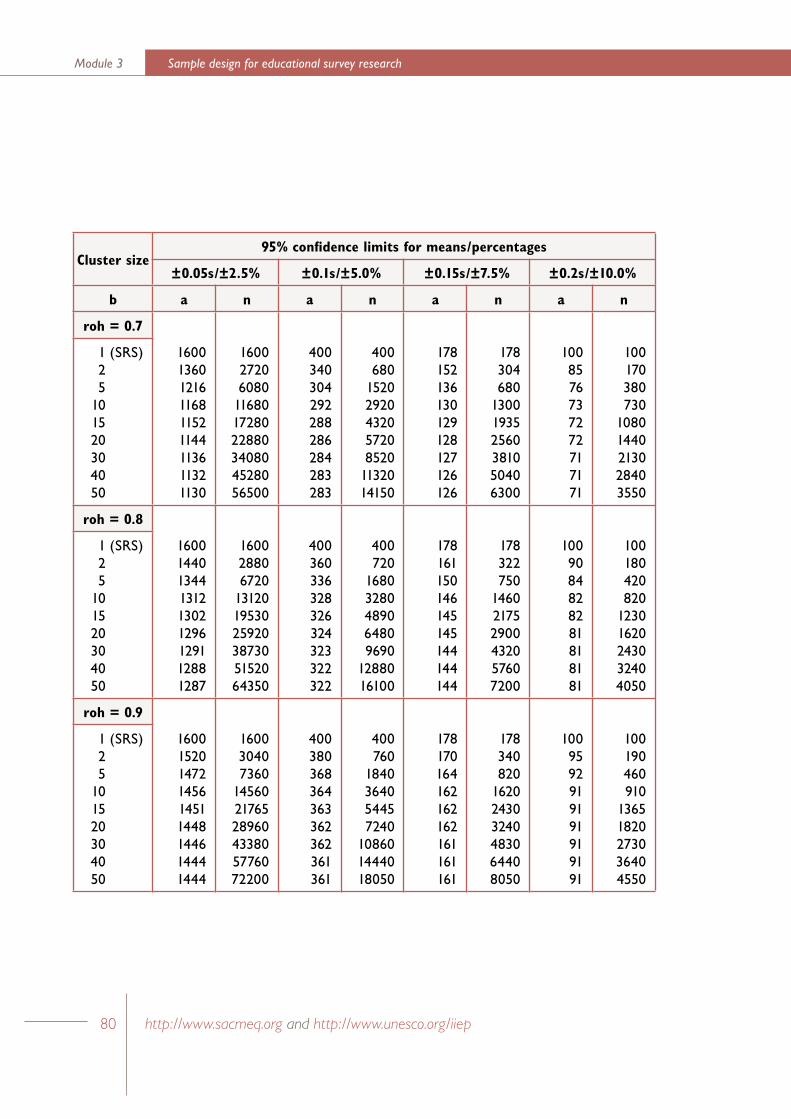
Sample design for educational survey researchModule 3
80 http://www.sacmeq.org and http://www.unesco.org/iiep 81© UNESCO
Cluster size95% confidence limits for means/percentages
±0.05s/±2.5% ±0.1s/±5.0% ±0.15s/±7.5% ±0.2s/±10.0%
b a n a n a n a n
roh = 0.7
1 (SRS) 2 5101520304050
160013601216116811521144113611321130
160027206080
116801728022880340804528056500
400340304292288286284283283
400680
15202920432057208520
1132014150
178152136130129128127126126
178304680
130019352560381050406300
1008576737272717171
100170380730
10801440213028403550
roh = 0.8
1 (SRS) 2 5101520304050
160014401344131213021296129112881287
160028806720
131201953025920387305152064350
400360336328326324323322322
400720
16803280489064809690
1288016100
178161150146145145144144144
178322750
146021752900432057607200
1009084828281818181
100180420820
12301620243032404050
roh = 0.9
1 (SRS) 2 5101520304050
160015201472145614511448144614441444
160030407360
145602176528960433805776072200
400380368364363362362361361
400760
1840364054457240
108601444018050
178170164162162162161161161
178340820
162024303240483064408050
1009592919191919191
100190460910
13651820273036404550
Sample design for educational survey researchModule 3
80 http://www.sacmeq.org and http://www.unesco.org/iiep 81© UNESCO
The coefficient of intraclass correlation (roh) was developed earlier this century in connection with studies carried out to measure ‘fraternal resemblance’ – such as in the calculation of the correlation between the heights of brothers. To establish this correlation there was generally no reason for ordering the pairs of measurements obtained from any two brothers. Therefore the approach used was to calculate a product-moment correlation coefficient from a symmetrical table of measures consisting of two interchanged entries for each pair of brothers. In the days before computers, these calculations became extremely arduous when large numbers of brothers from large families were being studied. Some computationally simpler formulae for calculating estimates of this coefficient were eventually developed by several statisticians (Haggard, 1958). These formulae were based either on analysis of variance methods, or on the calculation of the variance of elements and the variance of the means of groups, or clusters, of elements.
In the field of educational survey research, the clusters of elements which define primary sampling units often refer to students that are grouped into schools. The value of roh then provides a measure of the tendency for students to be more similar within schools (on some given characteristic such as achievement test scores) than would be the case if students had been allocated at random among schools. The estimate of roh is prepared by using schools as ‘experimental treatments’ in calculating the between-clusters mean square (BCMS) and the within-clusters mean square (WCMS). The term b refers to the number of students per school.
Estimation of the coeff icient of intraclass correlation
Appendix 3
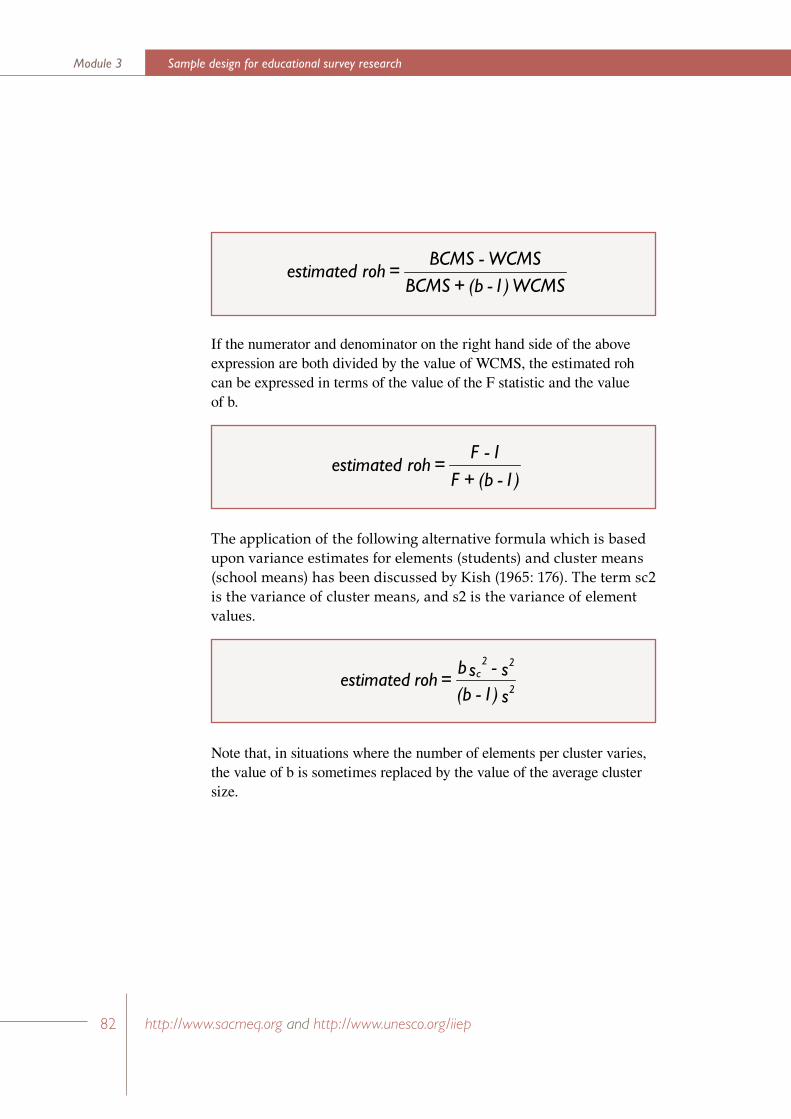
82 http://www.sacmeq.org and http://www.unesco.org/iiep
Sample design for educational survey researchModule 3
If the numerator and denominator on the right hand side of the above expression are both divided by the value of WCMS, the estimated roh can be expressed in terms of the value of the F statistic and the value of b.
The application of the following alternative formula which is based upon variance estimates for elements (students) and cluster means (school means) has been discussed by Kish (1965: 176). The term sc2 is the variance of cluster means, and s2 is the variance of element values.
Note that, in situations where the number of elements per cluster varies, the value of b is sometimes replaced by the value of the average cluster size.
�������������������������
�������������
������������
�������������
��������������
��������������
���

82 http://www.sacmeq.org and http://www.unesco.org/iiep