Embed Size (px)
Citation preview
SAMOS/NGI Data Management System Project Defense
Jacob T. Rettig
Florida State University Fall 2009
A project submitted to the
Department of Computer Science In partial fulfillment of the requirements for the
Degree of Master of Science
Major Professor: Dr. Daniel G. Schwartz1
Committee: Dr. Mark A. Bourassa2, 3, Dr. FeiFei Li1, and Shawn R. Smith2
1 - Computer Science, 2 - COAPS, 3 - Meteorology
SAMOS/NGI DMS Jacob T. Rettig
2
Table of Contents
No Title Page Acknowledgments 3 Abstract 4
1. Introduction 1.1 Background and Motivation
1.2 Objectives and Design Requirements 5 7
2. The Data Management System 2.1 System Overview
2.2 Database Overview 2.3 Web Interface Overview
10 13 16
3. Project Components Implementations 3.1 SAMOS to NGI Modifications
3.2 Metadata Update Interfaces 3.3 Database Interaction Upgrades 3.4 Google Maps API Data Viewer Interface
21 24 29 32
4. Future Work 34 5. Conclusion 35 6. References 36 7. Appendix 37
SAMOS/NGI DMS Jacob T. Rettig
3
ACKNOWLEDGEMENTS
First I will like to thank my major professor and advisor, Dr. Daniel G. Schwartz for the
guidance, patience and support through acquiring my Master’s degree and through writing this
project report. I will like to thank my committee members for their willingness to guide me
through the writing of this report. Thank you to Shawn R. Smith and Dr. Mark Bourassa for
their confidence in me, promoting me to a research assistant position, and the opportunity to
work at the Center for Ocean-Atmospheric Prediction Studies (COAPS) for almost three years.
COAPS has provided me excellent real world work experience and education. I wish to thank
the previous members of the Shipboard Automated Meteorological and Oceanographic System
(SAMOS) Data Assembly Center (DAC) team who set-up the SAMOS system which provides a
foundation for most of my work at COAPS. Thank you to the SAMOS DAC team especially
Anton Dmitriev, Jiangyi Hu, Scott Kondor, Mike McDonald, Geoff Montee, Jeremy Rolph, Shawn
Smith, and Tina Suen during my employment for working great in a team and the new
experiences. Thank you to the Northern Gulf of Mexico Institute (NGI) data team especially Jim
Waller, Paul Ruscher, Stephanie White, and Nico Wienders for all the work done to set up the
NGI Data Management System (DMS), the wonderful cooperation in meeting for regular
updates, and collaboration in solving issues with the system. Thank you to my family for help
and support in writing this report and completing grad school.
SAMOS/NGI DMS Jacob T. Rettig
4
ABSTRACT
Upgrades to the Shipboard Automated Meteorological and Oceanographic System (SAMOS)
Data Management System (DMS) are described. The upgraded DMS collects, formats, quality
controls, distributes, and archives near real-time surface marine data for not only research vessel
observations, but also for data from an instrumented Air Force tower as a part of the Northern
Gulf of Mexico Institute (NGI). The motivations for these changes to the DMS are to expand it
to include NGI data, improve the processing time, have more complete metadata, and make the
user interfaces easier to use. Three related projects include: developing an easy to use web
interface for entering instrument metadata, recoding functions from PHP to Perl to decrease the
processing time of the DMS, and a web interface designed with the Google Maps API that gives
a visual representation of observation differences along the vessel tracks. The creation of the
NGI DMS required major changes in the data collection protocol as well as the data parsing of
the original data file collected. The data from the NGI DMS is used in research projects at the
Center for Ocean-Atmospheric Prediction Studies (COAPS), Meteorology, and Oceanography
groups of FSU. The Metadata Update Interface (MUI) is an easy way to enter the metadata
required to operate the DMS and allows the research vessels’ operators to keep the metadata of
their vessels up to date via a web-based graphical user interface. The recoding of the database
functions in the DMS removes system call overhead and decreases the DMS’s processing time
from 30 to 45 seconds down to no more than 10 seconds. The maps created using the Google
Maps API are used as a part of visual quality control internally to COAPS as well as by the
public for getting a vessel track history of the 23 participating research vessels in the SAMOS
initiative.
SAMOS/NGI DMS Jacob T. Rettig
5
Chapter 1. Introduction
1.1 Background and Motivation
The Center for Ocean-Atmospheric Prediction Studies (COAPS) has developed a data
management system (DMS) for automated marine meteorological and near-surface
oceanographic observations. This DMS, developed in 2004, supports in transit data collection by
research vessels participating in the Shipboard Automated Meteorological and Oceanographic
System (SAMOS) initiative. SAMOS observations support validation studies for satellite
sensors and numerical model products. Other applications include air-sea interaction research
and developing satellite data retrieval algorithms [1].
SAMOS started in 2005 with a data pilot project. This project was a partnership between the
Woods Hole Oceanographic Institution (WHOI) and the SAMOS Data Assembly Center (DAC)
at the Florida State University. The goals of the pilot project included: developing a data
protocol for daily transmission of SAMOS observations from a vessel at sea to the DAC,
designing and testing metadata forms and protocols, beginning routine daily transmission of
SAMOS observations, and implementing routine data quality evaluation of SAMOS
observations prior to public distribution [2].
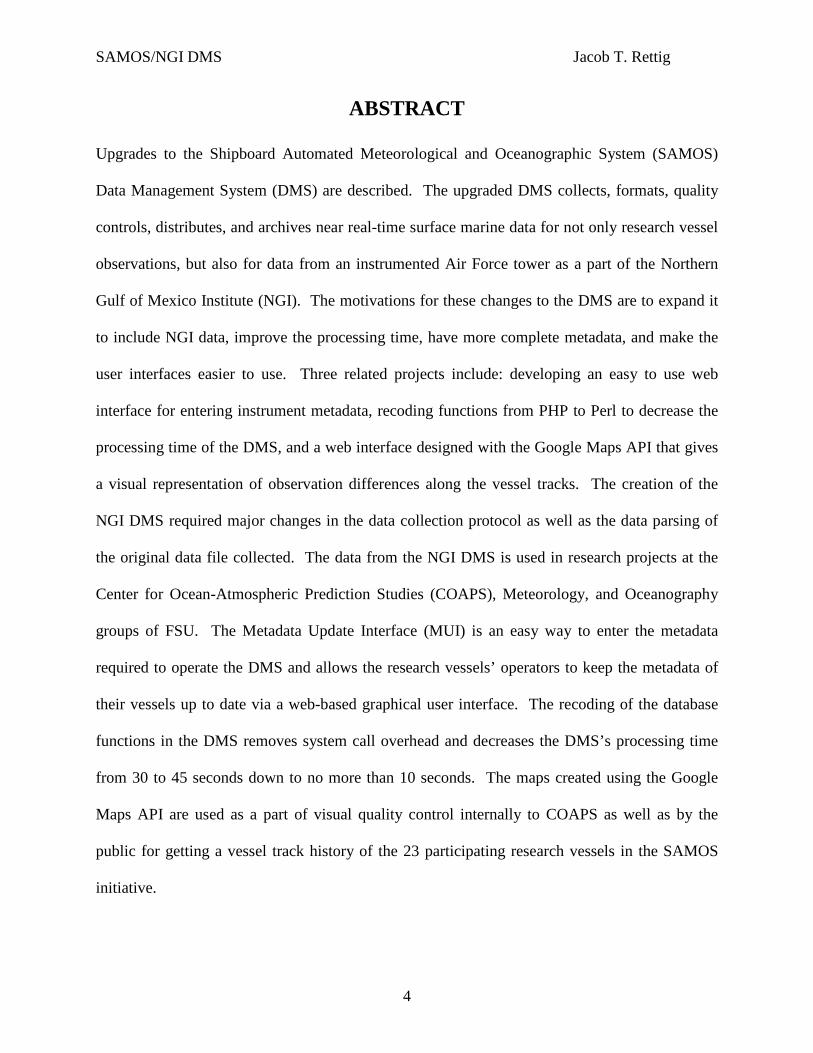
The data file protocol (Fig. 1) is as follows: files are transmitted via email attachments, the files
contain all 1-minute averages sampled during one day at sea, the file format is SAMOS, which is
each minute of data is in a row of key-value pairs, and files are transmitted just past 0000 UTC.
SAMOS/NGI DMS Jacob T. Rettig
6
The pilot program started with two WHOI vessels, Atlantis and Knorr, and has since evolved
into the operational SAMOS program. As of December 2009 the number has increased to 23
participating vessels with data available for download at http://samos.coaps.fsu.edu. The number
of participating vessels in the SAMOS initiative is still increasing and the DMS has had many
improvements since creation.
The author’s thesis work focused on updating the SAMOS DMS to support the Northern Gulf of
Mexico Institute (NGI) (http://www.coaps.fsu.edu/ngi), thereby providing data stewardship for
instrumented Air Force towers in the northern Gulf of Mexico. While working on the NGI
project, I have also made many improvements to the SAMOS DMS on the side. The next
section (1.2) will list the objectives and design requirements of the NGI project as well as three
other projects that are identifiably my work. The following sections will describe the
Fig. 1 – SAMOS protocol
SAMOS/NGI DMS Jacob T. Rettig
7
SAMOS/NGI DMS (2), describe the implementations of four of the components I have worked
on (3), future work (4), and finalize with the conclusion (5).
1.2 Objectives and Design Requirements
Four of the projects I have worked on while at COAPS will be described. The objective of the
NGI DMS is to expand the SAMOS DMS to be able to work with data from a stationary
platform to be used in various research projects. The objective of the SAMOS Metadata Update
Interface (MUI) is to increase ease of use and create availability for ship operators to keep their
vessels’ metadata up to date. The objective of recoding the database interface code from PHP to
Perl is to make code maintenance easier as well as better system performance. The objective of
the Google Maps API Data Viewer Interface is to give a visual representation of vessel location
to help with visual quality control and to show vessel tracks to the public. The design
requirements of the four projects will follow.
The NGI DMS is to have all the capabilities of the SAMOS DMS including collection of data
from the tower to the DAC at COAPS, automated quality control (QC), distribution to the
research community through a web interface. SAMOS collects data via email. This has overhead
and is unnecessary for the NGI. Instead the data is to be transferred to a logging system via RF
(radio frequency) transmitter and logged on a Personal Computer (PC) with logging software.
The resulting comma separated value (CSV) files from the logging software are to then be
transferred to the DAC via rsync over FTP. Since incoming data to SAMOS is in a format where
each minute of data is a row of key and value pairs rather than a CSV file with a set of header
rows given by the data logger used in NGI, there is an additional requirement that the NGI DMS
SAMOS/NGI DMS Jacob T. Rettig
8
must read in the CSV file as input. The trigger for processing is to be changed from incoming
email to a directory designated for unprocessed data files and a cron job that checks this
directory. The last requirement is that the NGI DMS must do all these requirements fully
automated and the only human interaction required is maintenance and quick verification.
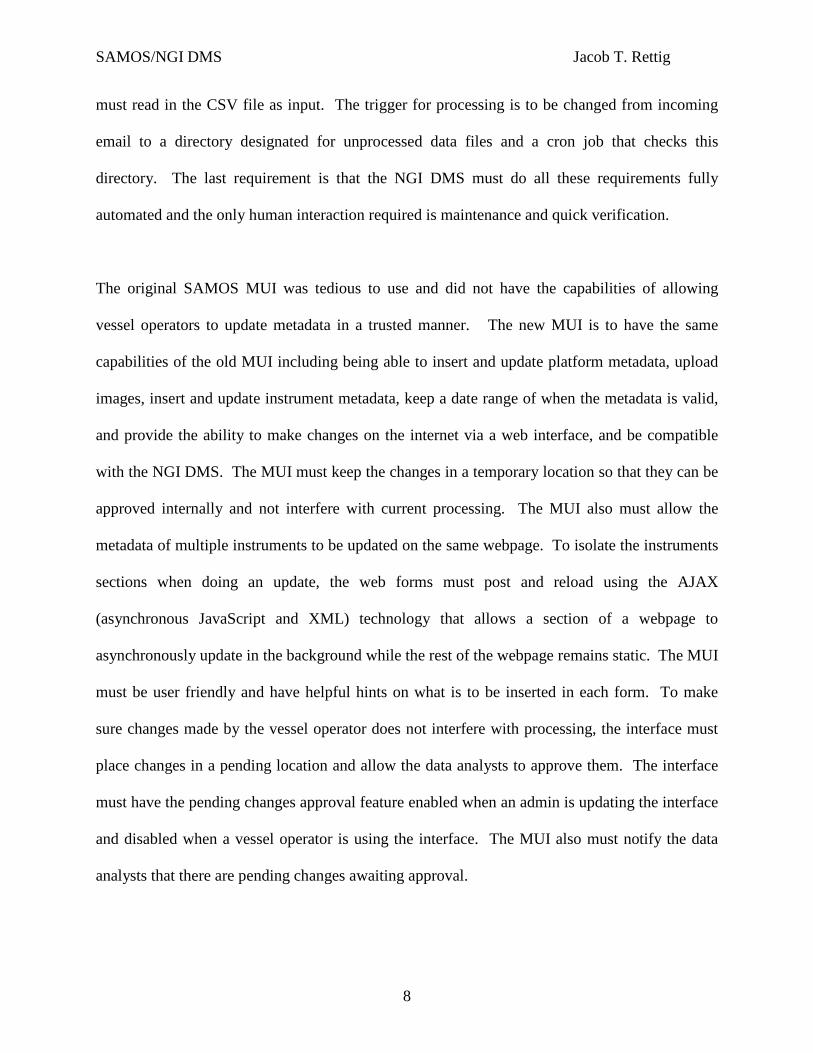
The original SAMOS MUI was tedious to use and did not have the capabilities of allowing
vessel operators to update metadata in a trusted manner. The new MUI is to have the same
capabilities of the old MUI including being able to insert and update platform metadata, upload
images, insert and update instrument metadata, keep a date range of when the metadata is valid,
and provide the ability to make changes on the internet via a web interface, and be compatible
with the NGI DMS. The MUI must keep the changes in a temporary location so that they can be
approved internally and not interfere with current processing. The MUI also must allow the
metadata of multiple instruments to be updated on the same webpage. To isolate the instruments
sections when doing an update, the web forms must post and reload using the AJAX
(asynchronous JavaScript and XML) technology that allows a section of a webpage to
asynchronously update in the background while the rest of the webpage remains static. The MUI
must be user friendly and have helpful hints on what is to be inserted in each form. To make
sure changes made by the vessel operator does not interfere with processing, the interface must
place changes in a pending location and allow the data analysts to approve them. The interface
must have the pending changes approval feature enabled when an admin is updating the interface
and disabled when a vessel operator is using the interface. The MUI also must notify the data
analysts that there are pending changes awaiting approval.
SAMOS/NGI DMS Jacob T. Rettig
9
To improve the processing time of the DMS the SQL wrapper functions that are in PHP must be
rewritten in Perl, the language of the rest of the processing code. The new code must be able to
execute in the rest of the DMS without modifying the other programs’ code. The new code must
not use the system call which has a large overhead in creating a new process on the system. The
new code must replicate the exact output provide by the old code.
The Google Maps API Data Viewer Interface must use the hourly represented data from the
database. The map must show the track of the vessel for the time frame and vessel requested.
The interface must be easy to use and not take too long to start and refresh.
SAMOS/NGI DMS Jacob T. Rettig
10
Chapter 2. The Data Management System
2.1 System Overview
The DMS contains automated processing programs, a database, and a user friendly web
interface. The data flow, data processing, and database interactions will be described in this
section and the database and web interface will be described in detail in the following two
sections. Before processing the data, the database must be populated with the platform- and
instrument-specific metadata. This is done through the MUI that I have designed and will be
described in detail in section 3.2. The metadata are embedded in the final product and certain
parameters are required for processing (for example units and variable name in the original file).
Each of the incoming raw data files is broken into daily file pieces and given an order number
that is unique for each platform and collection date. Each order number is then run sequentially
through a series of automated processes via a Perl driver which queries the SQL database. To
track the progress through processing, the output of each program is given a predefined version
number. The intermediate files and logs are given a naming structure that allows them to be
recreated from the tracking information in the database.
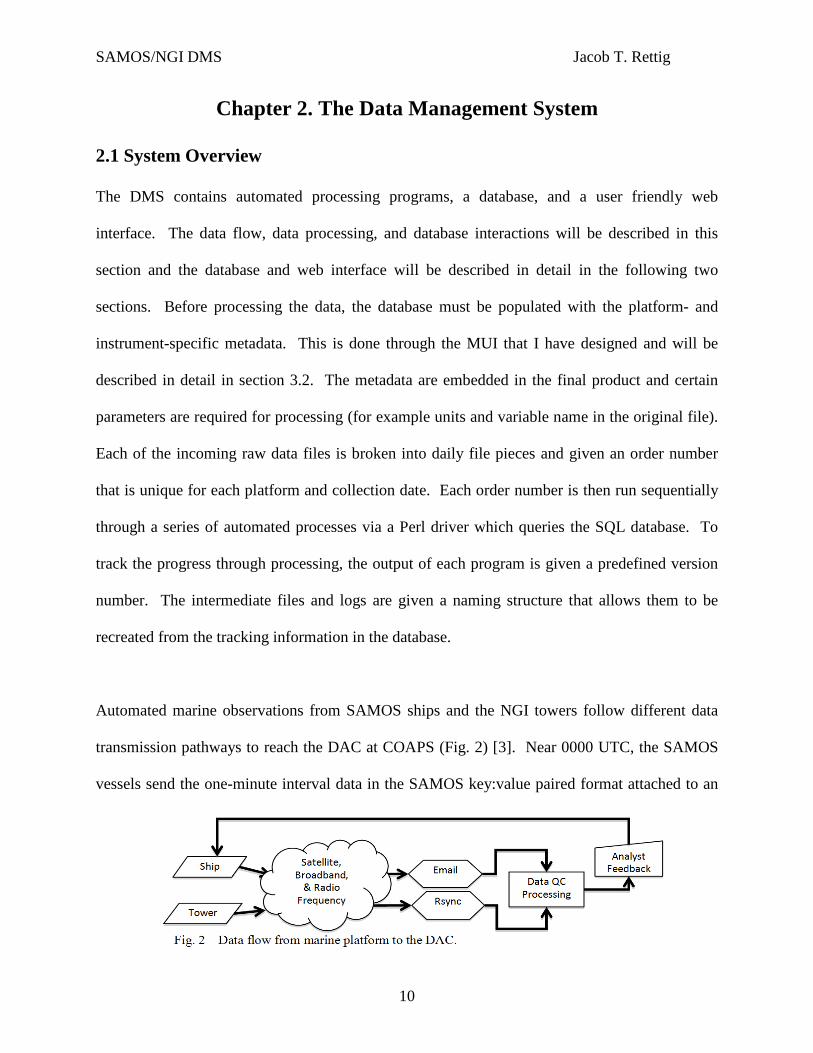
Automated marine observations from SAMOS ships and the NGI towers follow different data
transmission pathways to reach the DAC at COAPS (Fig. 2) [3]. Near 0000 UTC, the SAMOS
vessels send the one-minute interval data in the SAMOS key:value paired format attached to an
SAMOS/NGI DMS Jacob T. Rettig
11
email to the DAC via broadband satellite communications. NGI follows a different data path to
the DAC. The data from the NGI tower is sent to shore at ten-minute intervals using line of site
radio frequency transmission. The data is then logged on a PC at the FSU Coastal and Marine
Laboratory and pulled to the DAC via rsync. The NGI website is updated at the ten-minute
intervals, but the data is currently processed through the DMS once a day as in SAMOS. The
installation and maintenance of software and hardware on the tower and at the Marine Lab are
done by Jim Waller and Paul Ruscher. Ocean sensors in the NGI project are maintained by
Stephanie White and Nico Weinders. From then on the data processing is the same at the DAC
for SAMOS and NGI. The upgrades to SAMOS for NGI will be described in more detail in
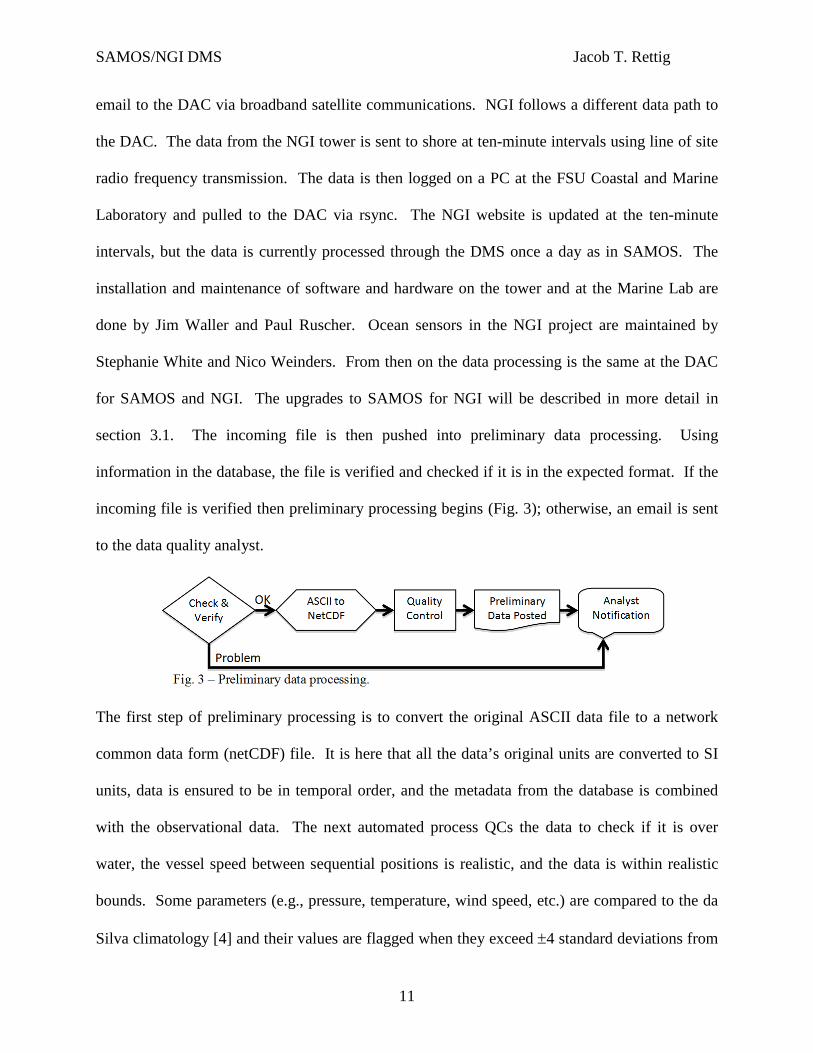
section 3.1. The incoming file is then pushed into preliminary data processing. Using
information in the database, the file is verified and checked if it is in the expected format. If the
incoming file is verified then preliminary processing begins (Fig. 3); otherwise, an email is sent
to the data quality analyst.
The first step of preliminary processing is to convert the original ASCII data file to a network
common data form (netCDF) file. It is here that all the data’s original units are converted to SI
units, data is ensured to be in temporal order, and the metadata from the database is combined
with the observational data. The next automated process QCs the data to check if it is over
water, the vessel speed between sequential positions is realistic, and the data is within realistic
bounds. Some parameters (e.g., pressure, temperature, wind speed, etc.) are compared to the da
Silva climatology [4] and their values are flagged when they exceed ±4 standard deviations from
SAMOS/NGI DMS Jacob T. Rettig
12
the climatology [3]. Related variables (such as proper air, wet-bulb, and dew point temperature)
are checked to see if their physical relationship is not violated. Each data value has a flag
associated with it to define its quality. There are flags ranging from A to Z (such examples are Z
for good data and B for data out of realistic bounds) [5]. Once complete, the QC results are
updated in the netCDF file as well as the database, the preliminary data files are linked to the
distribution servers, and the analyst is notified.
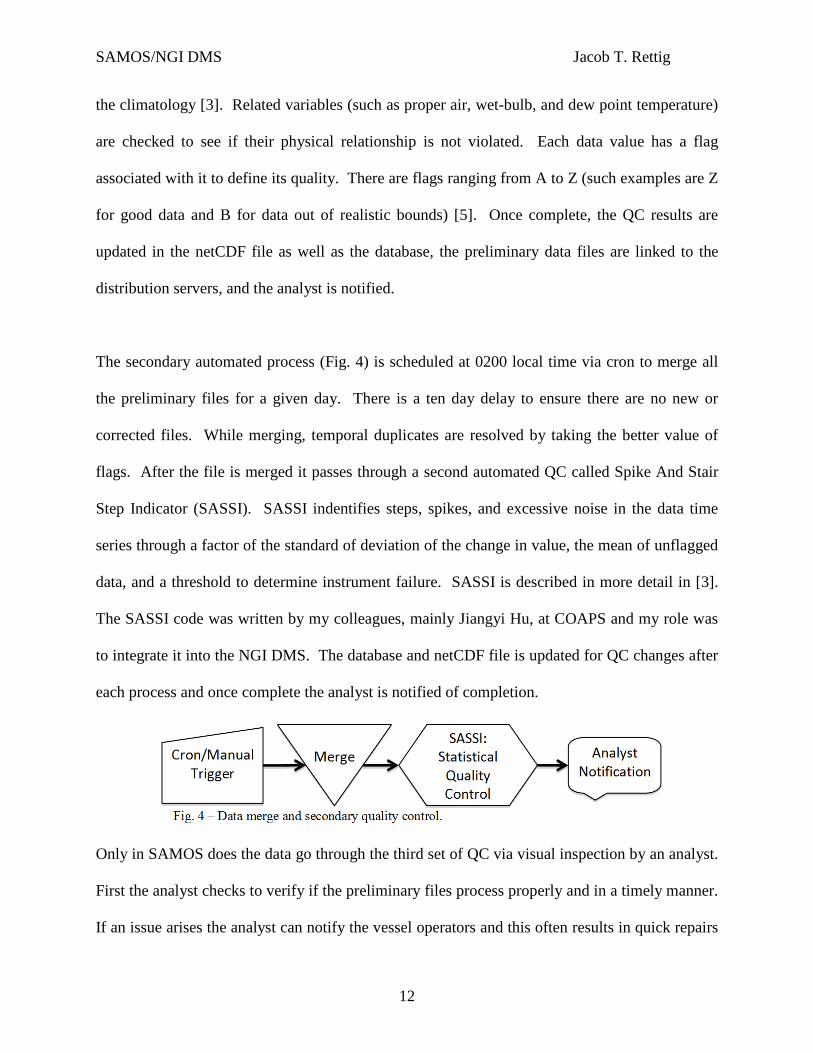
The secondary automated process (Fig. 4) is scheduled at 0200 local time via cron to merge all
the preliminary files for a given day. There is a ten day delay to ensure there are no new or
corrected files. While merging, temporal duplicates are resolved by taking the better value of
flags. After the file is merged it passes through a second automated QC called Spike And Stair
Step Indicator (SASSI). SASSI indentifies steps, spikes, and excessive noise in the data time
series through a factor of the standard of deviation of the change in value, the mean of unflagged
data, and a threshold to determine instrument failure. SASSI is described in more detail in [3].
The SASSI code was written by my colleagues, mainly Jiangyi Hu, at COAPS and my role was
to integrate it into the NGI DMS. The database and netCDF file is updated for QC changes after
each process and once complete the analyst is notified of completion.
Only in SAMOS does the data go through the third set of QC via visual inspection by an analyst.
First the analyst checks to verify if the preliminary files process properly and in a timely manner.
If an issue arises the analyst can notify the vessel operators and this often results in quick repairs
SAMOS/NGI DMS Jacob T. Rettig
13
to the system. The second QC is done by using SAMOS VIsual Data Assessment Tool
(SVIDAT) (Appendix I) written in the Interactive Data Language (IDL) that allows the analyst to
visually see the data in a graphical format and add/delete/modify the QC flags. This is
preferably done on a ten day delay after the data is merged and available, but can be later due to
resources and time limitations of the data quality analysts. All the preliminary, intermediate, and
research quality data is available for download via the web (http://samos.coaps.fsu.edu), FTP,
and THREDDS services. The data is also archived via the Ocean Archive System (OAS) at the
U.S. NODC [3]. The archive creation script was also coded by the author, but will not be
described in this manuscript. A more detailed description of the SAMOS system is in the
internal technical document titled SAMOS: The Data Processing ([6]).
2.2 Database Overview
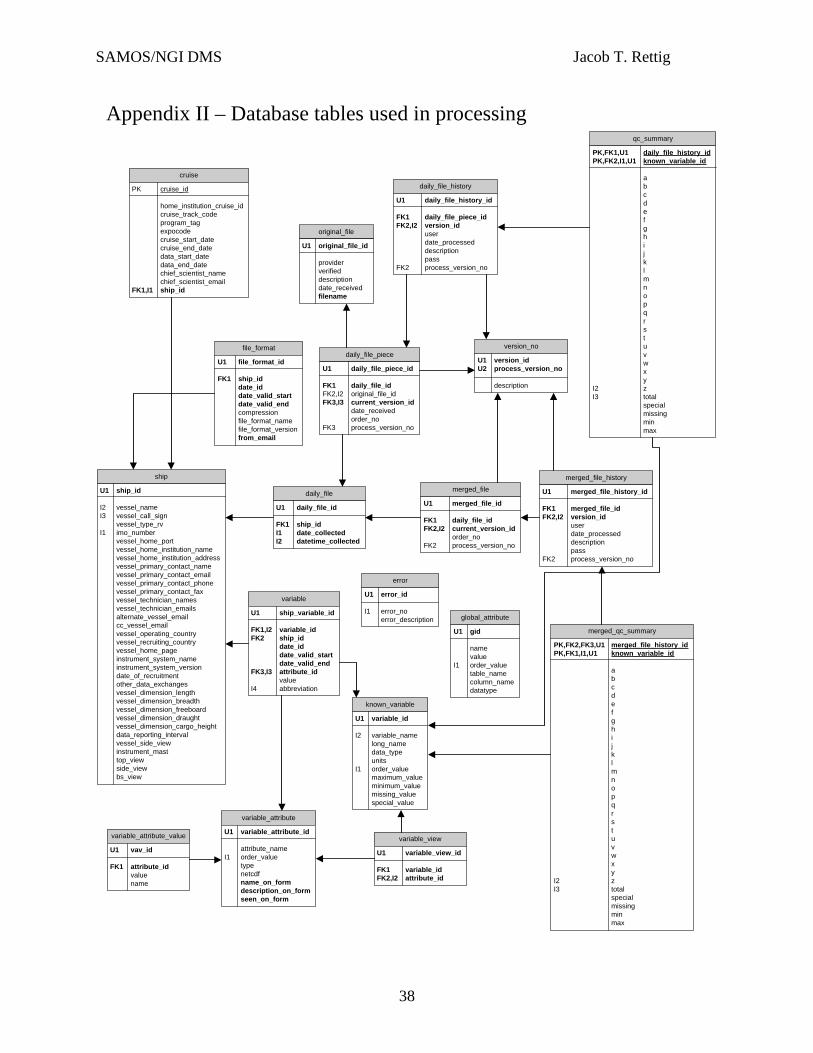
The SAMOS/NGI database has 30 tables with around 150 attributes (Appendix II & III). One
reason why there are so many tables is because the database was designed to allow changes to
the structure of the metadata via the web interface without modifying the structure of the
database. The database is well documented in SAMOS: database structure ([7]) so this section
will provide only a general description of the database tables and highlights on what I have
created/modified. There are three logical parts to the database and they can be divided as such:
platform metadata, data tracking, and miscellaneous tables.
The platform metadata section contains the tables: ship, ship_update, cruise, variable,
variable_update, known_variable, variable_view, variable_attribute, variable_attribute_value,
global_attribute, ship_graphics, graphic_types, file_format, and file_format_update. The
SAMOS/NGI DMS Jacob T. Rettig
14
SAMOS DMS database structure was copied for the NGI DMS and even though it is better to
use platform rather than ship in the table names, ship has remained due to the many code updates
that would be required to make the change. The tables ending with update are not shown in the
diagram because they have the same structure as the tables of the same primary name. These
update tables are used in the MUI that I have created and will be described in section 3.2. The
“non-update” tables are the ones that need to be populated before processing begins. The
file_format table specifies the format that the incoming file is in and what email address it should
come from for each platform. The cruise table is currently not in use due to difficulty in
collecting cruise metadata, but its purpose is to store metadata about each cruise. The ship table
contains metadata on each platform and the global_attribute table tells the processing code
which attributes from the ship table as well as static values are to be added to the metadata
section of the netCDF files. The ship_graphics table was created by me to store the information
for the interface that manages images and schematics of the platforms. The graphics_types table
allows the interface to add new types of schematics and images to the system. This is one
example of an extra table that allows on-the-fly customization via the web interface. The
remaining variable tables in this section store the metadata for the platform instrumentation and
the units to which the variables are converted. Variable refers to a platform observation type
(such as temperature, pressure, or humidity). The known_variable table keeps information on
the variables. The variable table keeps the metadata on a particular platform’s variable and is
linked to the known_variable. The variable_attribute table is the metadata attributes that are
available for a particular variable and if there is a variable_attribute_value entry linked to it, a
pull down appears in the MUI rather than a free form text box. The variable_view table lets the
system know which attributes belong to which variable.
SAMOS/NGI DMS Jacob T. Rettig
15
The second type is the data tracking section and it contains: daily_file, daily_file_peice,
daily_file_history, qc_summary, merged_file, merged_file_history, merged_qc_summary,
original_file, version_no, error, time_avg_data, and time_avg_data_history. A new daily_file
entry is created when a there is a new date collected for a particular platform. When the
SAMOS/NGI preliminary processing begins, the incoming file name is stored in a new entry of
the original_file table and a new daily_file_piece entry is created. The daily_file_piece entry is
linked to the correct original_file entry, daily_file entry, and the version_no entry that
corresponds to the current version number. After each process completes a new
daily_file_history entry is created that stores process tracking information for that version. Once
the data is QC’ed, a qc_summary entry for each variable is created that contains the counts of
each QC flag as well as the maximum and minimum values. The merged_file,
merged_file_history, and merged_qc_summary tables are used in the same way as the
daily_file_peice, daily_file_history, and qc_summary respectively but for secondary processing
tracking. The error table contains error codes and descriptions to be used in the logs in case of
failures in the processing. The time_avg_data and time_avg_data_history tables are used for
storing the hourly average of the data points and the associated flag. I have created these tables
to work much like daily_file_history and qc_summary, and they are used for the Google Maps
API Data Viewer Interface that will be described in section 3.4.
The third type is miscellaneous tables. The navigation_item table builds the toolbar to the
internal web interface as well as keeps information on what type of users can view a link/page.
The user access levels are stored in the user_level table and the usernames are stored in the users
SAMOS/NGI DMS Jacob T. Rettig
16
table. Users are assigned a user level and can only access the pages in the navigation_item table
that are at or below their level. I have created the user_ship_access table to link which platforms
an operator username can access. This table is used by the external access of the MUI described
in section 3.2.
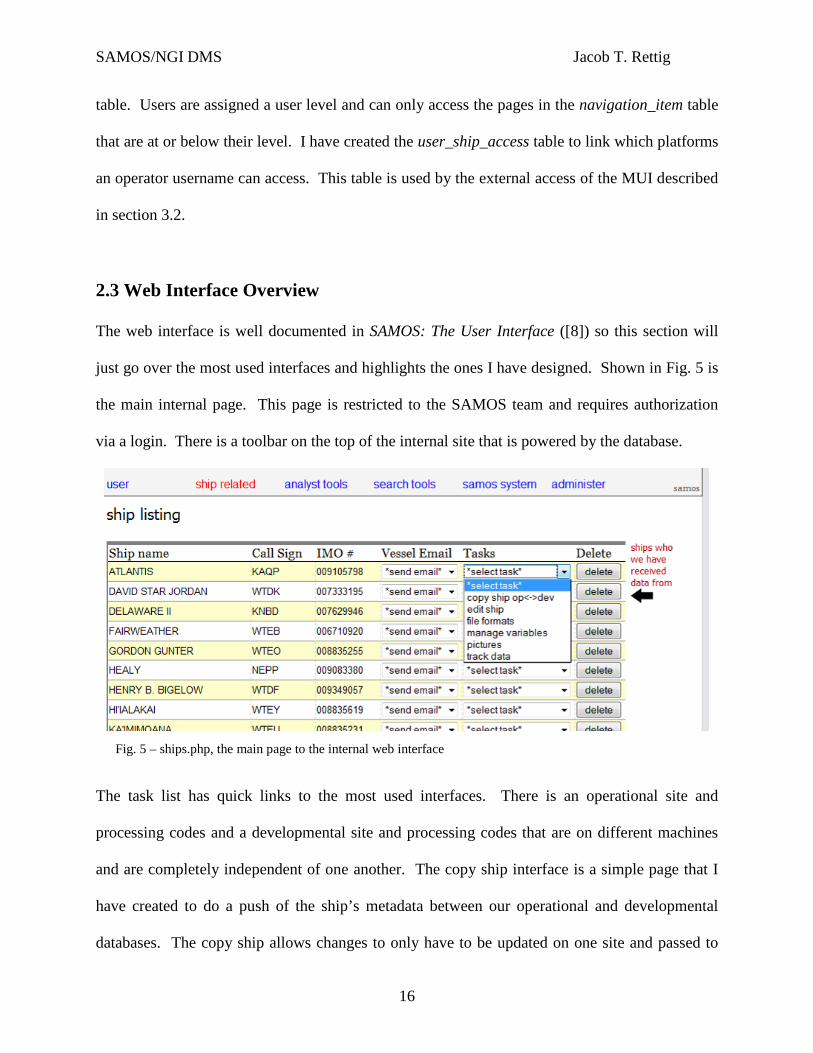
2.3 Web Interface Overview
The web interface is well documented in SAMOS: The User Interface ([8]) so this section will
just go over the most used interfaces and highlights the ones I have designed. Shown in Fig. 5 is
the main internal page. This page is restricted to the SAMOS team and requires authorization
via a login. There is a toolbar on the top of the internal site that is powered by the database.
The task list has quick links to the most used interfaces. There is an operational site and
processing codes and a developmental site and processing codes that are on different machines
and are completely independent of one another. The copy ship interface is a simple page that I
have created to do a push of the ship’s metadata between our operational and developmental
databases. The copy ship allows changes to only have to be updated on one site and passed to
Fig. 5 – ships.php, the main page to the internal web interface
SAMOS/NGI DMS Jacob T. Rettig
17
the other. It uses the pending updates capability of the updated MUIs to ensure the changes are
what were wanted. The next four (edit ship, file formats, and manage variables, and pictures)
link to the MUI I have created for updating platform metadata and will be described in section
3.2. The last link is goes to the data tracking page.
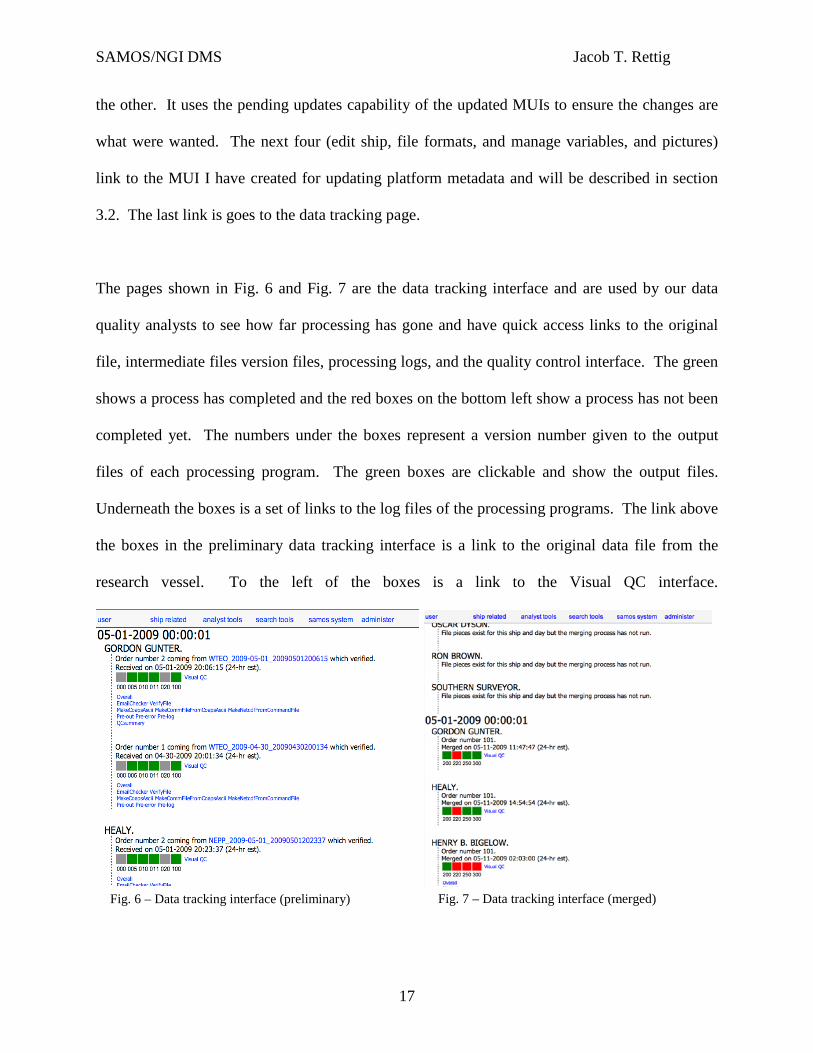
The pages shown in Fig. 6 and Fig. 7 are the data tracking interface and are used by our data
quality analysts to see how far processing has gone and have quick access links to the original
file, intermediate files version files, processing logs, and the quality control interface. The green
shows a process has completed and the red boxes on the bottom left show a process has not been
completed yet. The numbers under the boxes represent a version number given to the output
files of each processing program. The green boxes are clickable and show the output files.
Underneath the boxes is a set of links to the log files of the processing programs. The link above
the boxes in the preliminary data tracking interface is a link to the original data file from the
research vessel. To the left of the boxes is a link to the Visual QC interface.
Fig. 6 – Data tracking interface (preliminary) Fig. 7 – Data tracking interface (merged)
SAMOS/NGI DMS Jacob T. Rettig
18
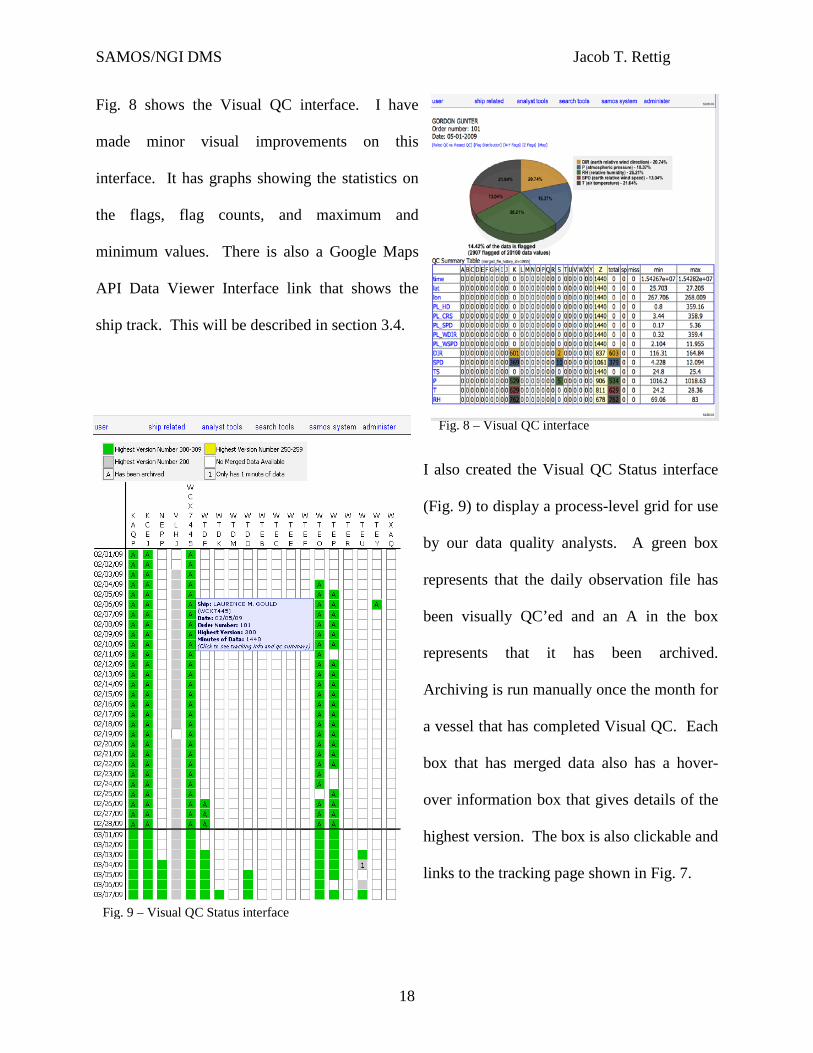
Fig. 8 – Visual QC interface
Fig. 9 – Visual QC Status interface
Fig. 8 shows the Visual QC interface. I have
made minor visual improvements on this
interface. It has graphs showing the statistics on
the flags, flag counts, and maximum and
minimum values. There is also a Google Maps
API Data Viewer Interface link that shows the
ship track. This will be described in section 3.4.
I also created the Visual QC Status interface
(Fig. 9) to display a process-level grid for use
by our data quality analysts. A green box
represents that the daily observation file has
been visually QC’ed and an A in the box
represents that it has been archived.
Archiving is run manually once the month for
a vessel that has completed Visual QC. Each
box that has merged data also has a hover-
over information box that gives details of the
highest version. The box is also clickable and
links to the tracking page shown in Fig. 7.
SAMOS/NGI DMS Jacob T. Rettig
19
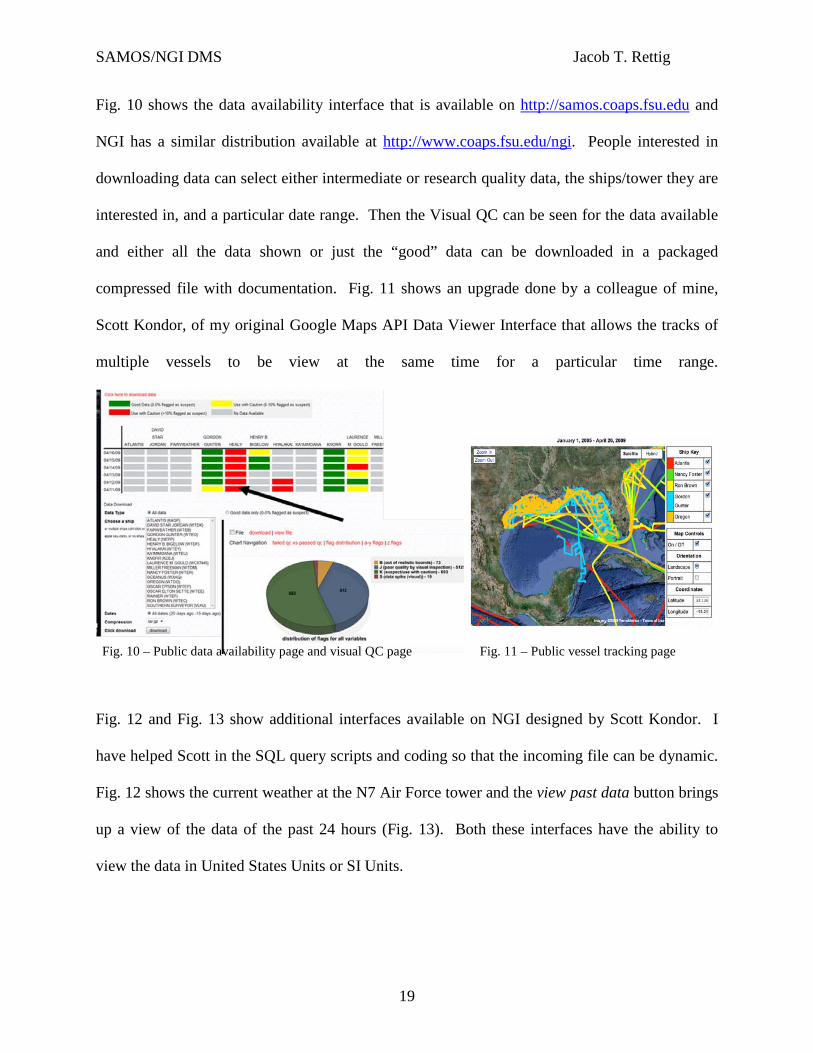
Fig. 10 shows the data availability interface that is available on http://samos.coaps.fsu.edu and
NGI has a similar distribution available at http://www.coaps.fsu.edu/ngi. People interested in
downloading data can select either intermediate or research quality data, the ships/tower they are
interested in, and a particular date range. Then the Visual QC can be seen for the data available
and either all the data shown or just the “good” data can be downloaded in a packaged
compressed file with documentation. Fig. 11 shows an upgrade done by a colleague of mine,
Scott Kondor, of my original Google Maps API Data Viewer Interface that allows the tracks of
multiple vessels to be view at the same time for a particular time range.
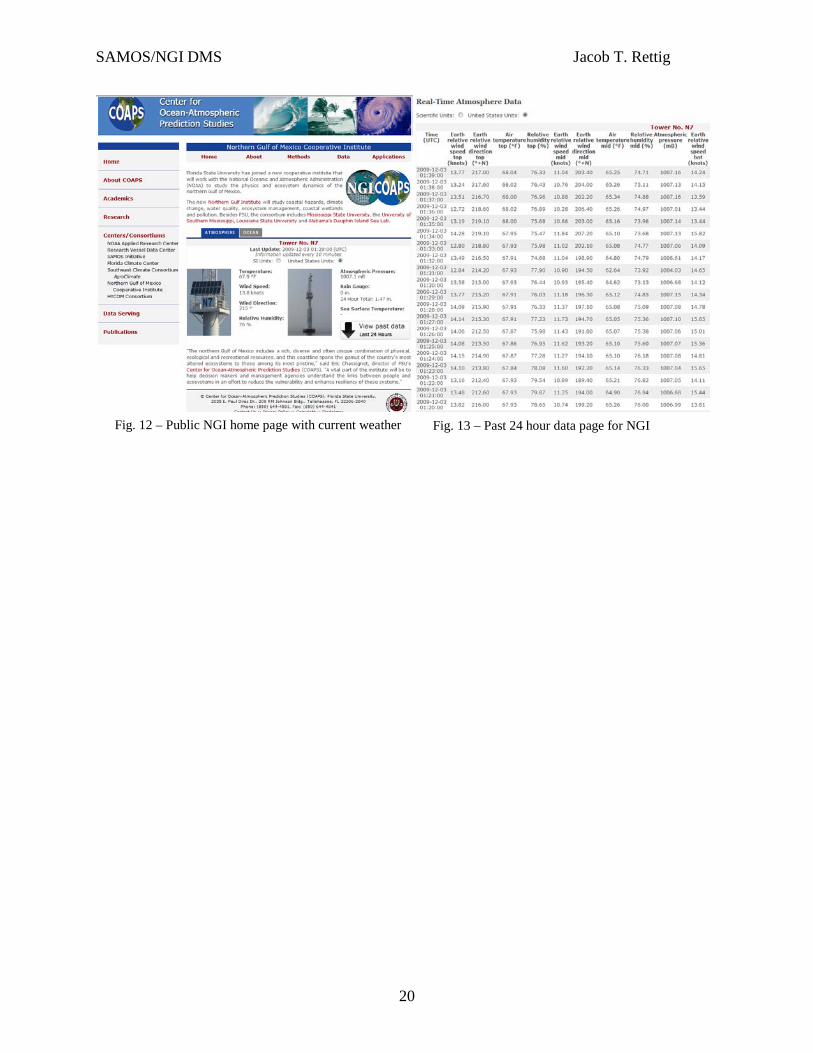
Fig. 12 and Fig. 13 show additional interfaces available on NGI designed by Scott Kondor. I
have helped Scott in the SQL query scripts and coding so that the incoming file can be dynamic.
Fig. 12 shows the current weather at the N7 Air Force tower and the view past data button brings
up a view of the data of the past 24 hours (Fig. 13). Both these interfaces have the ability to
view the data in United States Units or SI Units.
Fig. 10 – Public data availability page and visual QC page Fig. 11 – Public vessel tracking page
SAMOS/NGI DMS Jacob T. Rettig
20
Fig. 12 – Public NGI home page with current weather Fig. 13 – Past 24 hour data page for NGI
SAMOS/NGI DMS Jacob T. Rettig
21
Chapter 3. Project Components Implementations
3.1 SAMOS to NGI Modifications
The primary responsibility of my research assistantship was to develop the NGI DMS. The first
challenge was getting the data from the tower. The purposed solution was to use a line of site
radio frequency (RF) transmitter. The N7 Air Force tower is in line of site to the FSU Coastal
and Marine Laboratory in St. Teresa, FL so a RF antenna was set up on the N7 tower and at the
Marine Lab by Jim Waller. To hold the data at the Marine Lab a PC running the Windows XP
operating system and the LoggerNet 3.4 logging software by Campbell Scientific, Inc. was set up
by Jim Waller and Paul Ruscher.
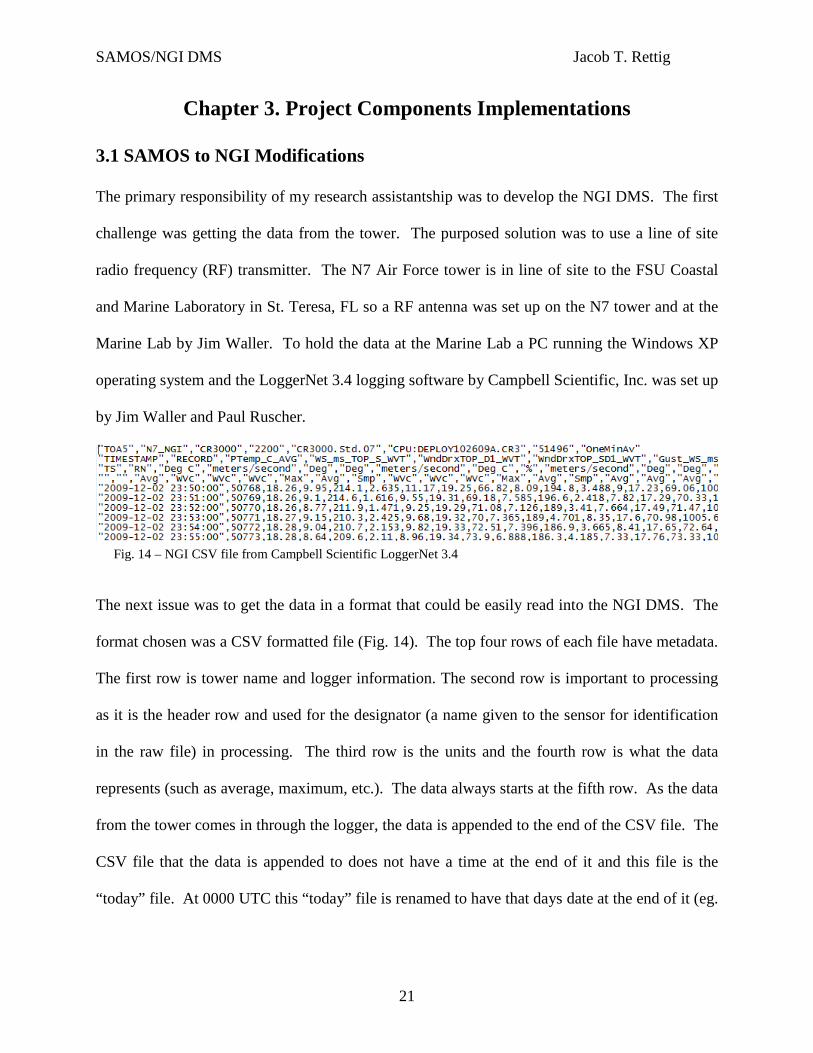
The next issue was to get the data in a format that could be easily read into the NGI DMS. The
format chosen was a CSV formatted file (Fig. 14). The top four rows of each file have metadata.
The first row is tower name and logger information. The second row is important to processing
as it is the header row and used for the designator (a name given to the sensor for identification
in the raw file) in processing. The third row is the units and the fourth row is what the data
represents (such as average, maximum, etc.). The data always starts at the fifth row. As the data
from the tower comes in through the logger, the data is appended to the end of the CSV file. The
CSV file that the data is appended to does not have a time at the end of it and this file is the
“today” file. At 0000 UTC this “today” file is renamed to have that days date at the end of it (eg.
Fig. 14 – NGI CSV file from Campbell Scientific LoggerNet 3.4
SAMOS/NGI DMS Jacob T. Rettig
22
N7NGI_ts.csv and N7NGI_ts_20091201.csv) and the next data that comes in will have the
logger create a new “today” file with the headers.
The next challenge was to get the data file to the COAPS DAC so that it can be processed by the
DMS. Using the email transfer protocol that SAMOS uses was decided to be unnecessary as
both ends of the transfer are trusted by the other. The plan for transfer was using directory and
file synchronization via the Linux program rsync to pull the files to the COAPS DAC over FTP.
An FTP server was setup on the Marine Lab PC and a cron job running every 10 minutes at the
COAPS DAC executed the rsync. Now that the files are at the COAPS DAC, the system must
know which files are new and need to be processed by the DMS. For SAMOS, the process was
triggered by an incoming email. The solution for NGI is to use the verbose output of the rsync to
determine which files have been updated. These files are copied to a directory designated as the
unprocessed directory for NGI that the NGI DMS can use as a processing queue. This completes
the requirements for a new file transfer protocol for NGI.
The next step is to copy all the SAMOS DMS processing code, web interfaces, and database to a
new location for an independent NGI DMS. This only requires a database copy, copying the
code and web files to a new location, and modifying the configuration files that were setup for
easy system migration. After that the code that reads in the raw data files and converts them into
a format recognized by the rest of the processing code had to be modified to read in the NGI
CSV file. The preliminary driver for SAMOS is executed by the mail server and the attachment
is sent through standard I/O. NGI was extended so that if there was no input through standard
I/O, then it checks for the NGI protocol. This NGI branch checks the unprocessed directory for
SAMOS/NGI DMS Jacob T. Rettig
23
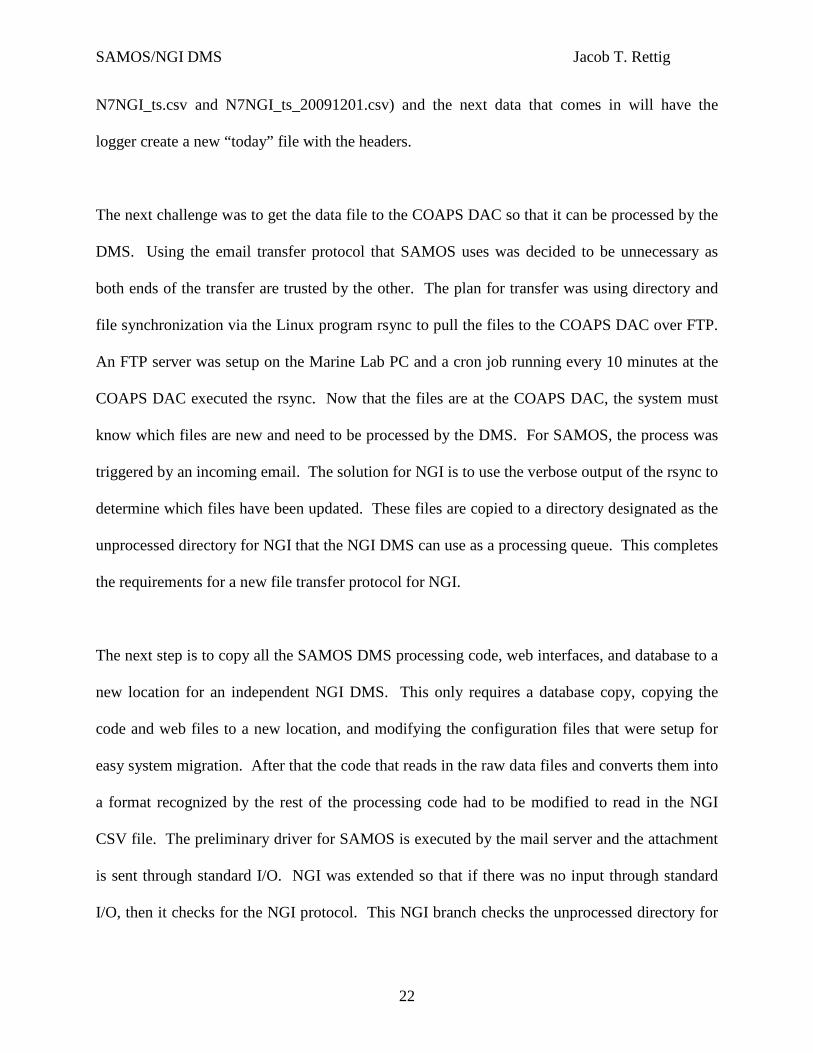
Fig. 15 – SAMOS v001 formatted file from the research vessel Atlantis
any files in it and executes all the programs in the preliminary processing in the same way as
SAMOS.
The first two programs in the preliminary processing checks the format of the file to see if there
is at least one line of usable data and creates a file of the commands needed to create the netCDF
file. These programs need new incoming file processing code since the SAMOS code only reads
SAMOS v001 formatted files (Fig. 15). The major challenges were that the designator is in a
different location and that the date was not numeric only (it has dashes, colons, and spaces). The
code first queries the database for the expected file format. When it is determined to be NGI
CSV, the code reads in the second line for the designators and stores their positions in the file.
Then the code can begin collecting the data that starts at line 5. The line is checked if it has the
same number of values as the header line. Invalid lines are rejected and logged. The values are
read in and converted if the required units do not match the units in the incoming file. The
database is queried to get the units metadata for the observations. If a designator in the file is not
in the database, then the value is ignored. The conversion for the collection time had to be
modified as there is a numeric value check in SAMOS. The numeric check was removed in this
case and a check to determine if the converted COAPS time (number of minutes from January 1,
1980 00:00) is a valid date is considered sufficient. The web interface moved over with little
modifications and the public distribution interface had to be placed inside a new template that
required some coding to fix visual issues. The rest of the code functioned with little
modification other than compilation issues of some FORTRAN code due to machine migration
SAMOS/NGI DMS Jacob T. Rettig
24
from IRIX to LINUX (a separate project for which I was a team member). Other than
maintenance, the wish list requirement of the NGI DMS being fully automated was achieved.
Also no human interactions are required when the system functions properly.
Other web interfaces created for NGI were projects of a colleague of mine, Scott Kondor. I have
helped design the ability of the interfaces to evolve with the incoming NGI CSV data files so that
no major recoding, if any at all, is required if the file content changes. These interfaces are
designed replicate the interfaces of other weather station sites (Fig. 12 and Fig 13). There is a
short description of these at the end of section 2.3.
3.2 Metadata Update Interfaces
One of my first major coding projects at COAPS was the MUI for SAMOS. The project arose
when the collection of metadata via a Microsoft Word document with tables to enter the
information was not very successful. The information was tedious to the ship operator as they
had to type it in to the tables and email it back to COAPS and also to the SAMOS personnel as
they had to manually read and enter the data into a tedious to use interface that was just a series
of text boxes and pull downs. Only one variable could have its metadata edited at a time,
requiring a lot of extra mouse clicks and page loads.
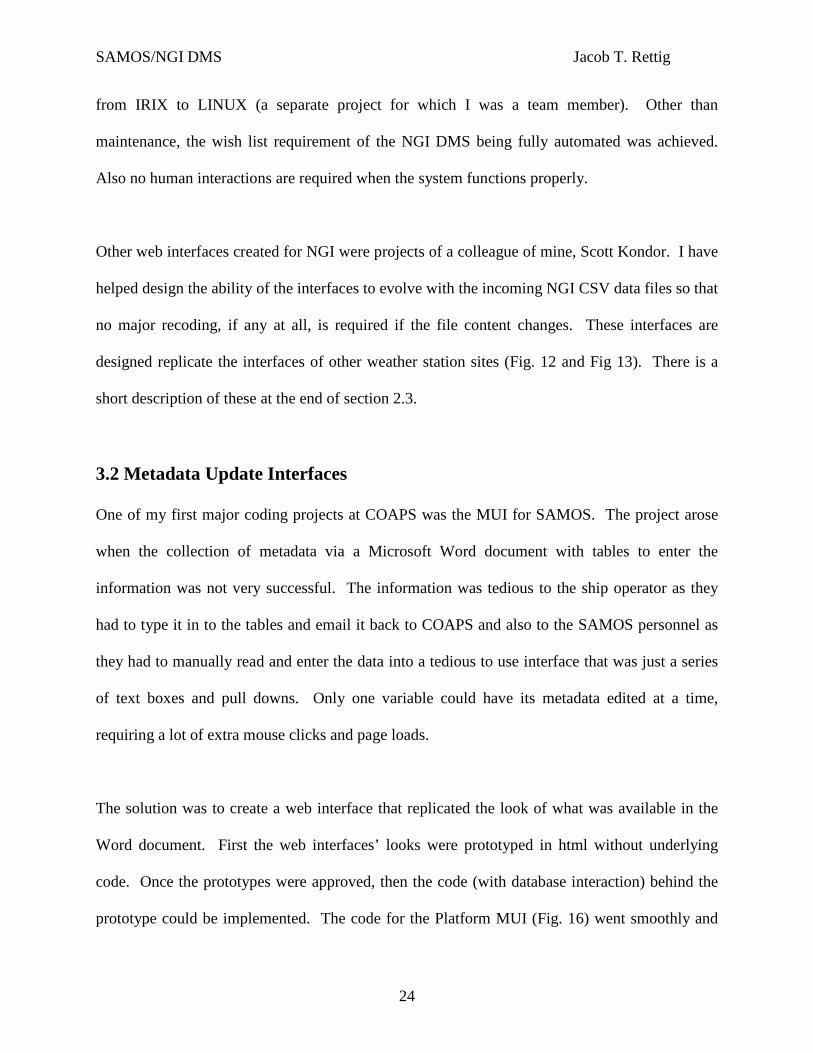
The solution was to create a web interface that replicated the look of what was available in the
Word document. First the web interfaces’ looks were prototyped in html without underlying
code. Once the prototypes were approved, then the code (with database interaction) behind the
prototype could be implemented. The code for the Platform MUI (Fig. 16) went smoothly and
SAMOS/NGI DMS Jacob T. Rettig
25
Fig. 16 – Platform MUI showing the research vessel Atlantis (one long webpage)
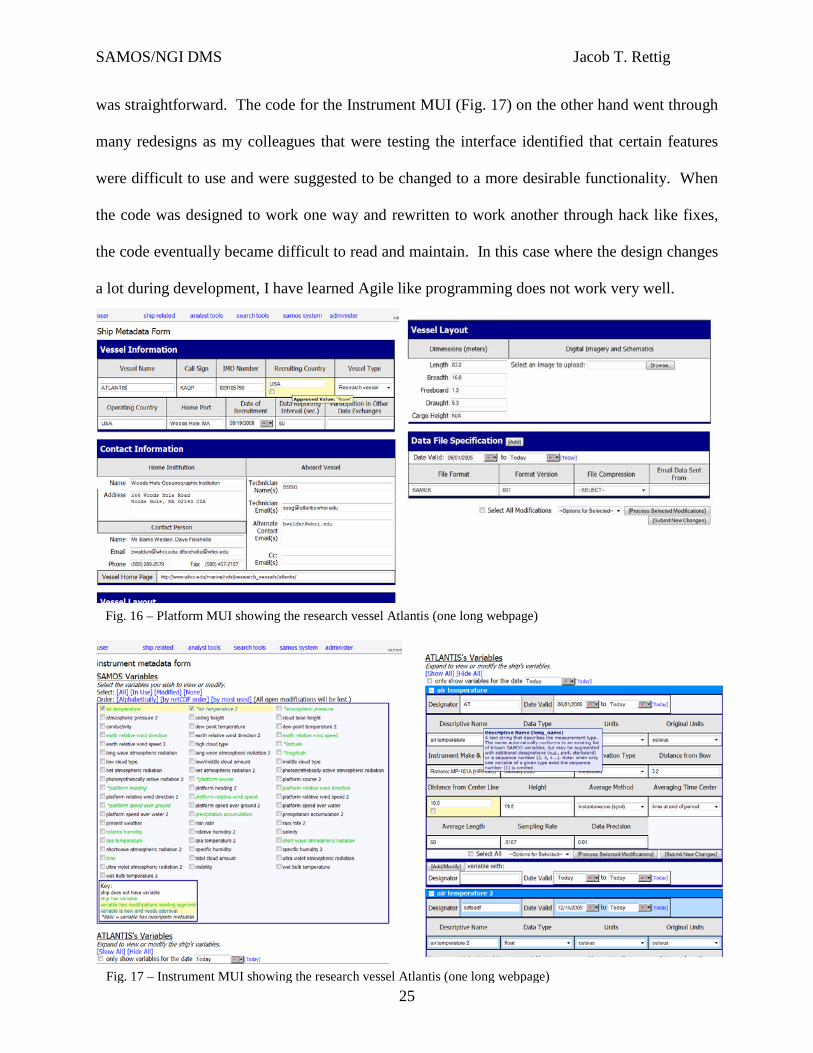
was straightforward. The code for the Instrument MUI (Fig. 17) on the other hand went through
many redesigns as my colleagues that were testing the interface identified that certain features
were difficult to use and were suggested to be changed to a more desirable functionality. When
the code was designed to work one way and rewritten to work another through hack like fixes,
the code eventually became difficult to read and maintain. In this case where the design changes
a lot during development, I have learned Agile like programming does not work very well.
Fig. 17 – Instrument MUI showing the research vessel Atlantis (one long webpage)
SAMOS/NGI DMS Jacob T. Rettig
26
The implementation of choice was to have a list of each available variable with a checkbox that
turns off and on a variable box below designated for updating the metadata of that variable. To
make it more user friendly, it was decided that each of these variable metadata update boxes are
in a separate html form that uses AJAX. This allows upon a refresh of a particular variable only
that variable box section of the page is refreshed and not the whole page. This allows all the
checkboxes and written information in the other metadata update boxes to remain unchanged
during an update. The variable boxes were given titles and allowed on a click to show and hide
the metadata below it. Date valid range attributes were in the old interface so this interface was
also given that capability. An add option was added to the bottom of each variable box to add
the variable the first time and for a new time range. The date range is checked on an update to
ensure there is no time overlap and required attributes such as original units are also checked.
It was decided that the external vessel operators should not be given access to modify the actual
value in the database that is queried during processing, so an update approval had to be
implemented. My design replicates the ship, variable, and file_format tables’ structure and
makes new tables called respectively ship_update, variable_update, and file_format_update.
Coding for the case of updating a variable was easy; just use the same primary key id for the
element in the non-update and update database tables. If the entry exists in the update table,
then the attribute has pending changes. To represent a new variable, just use the next available
negative primary key id. Using these changes to the database, the interface was updated so that
updated attributes have a background of yellow and new attributes have a background of yellow
with blue text. A hover-over on the updated attributes was created to show the functioning
value. On the administrator enabled interface, new approval functionality had to be designed.
SAMOS/NGI DMS Jacob T. Rettig
27
To approve new variables, an approve button was added to the bottom of the variable box. To
approve updated attributes, checkboxes were added to the attributes with pending changes, a
select all checkbox for convenience, a pull down for approve or deny changes, and a separate
submit button to approve/deny the changes. To make it more user friendly, hover-overs with
html inside them were created for the attributes to give a description of what value is supposed to
be placed there. To make the hover-overs modifiable via the web interface, a new attribute was
added to the variable_attribute table to hold the hover-over contents and an attribute for the
variable attribute to have a more human readable name on the form. These changes work well
enough for their purpose and were also made to the Platform MUI.
Many visual and convince enhancements were also made to the Instrument MUI. One such
enhancement is having the variable list box variable names be color coded green for in use, black
for not, blue background for new variable pending, and yellow background for updated attribute
pending. Links with JavaScript coding behind them were created to select all, all in use, all the
modified, or none, of the variables and links to expand all the variable boxes. The links are for
the convenience of less mouse clicks.
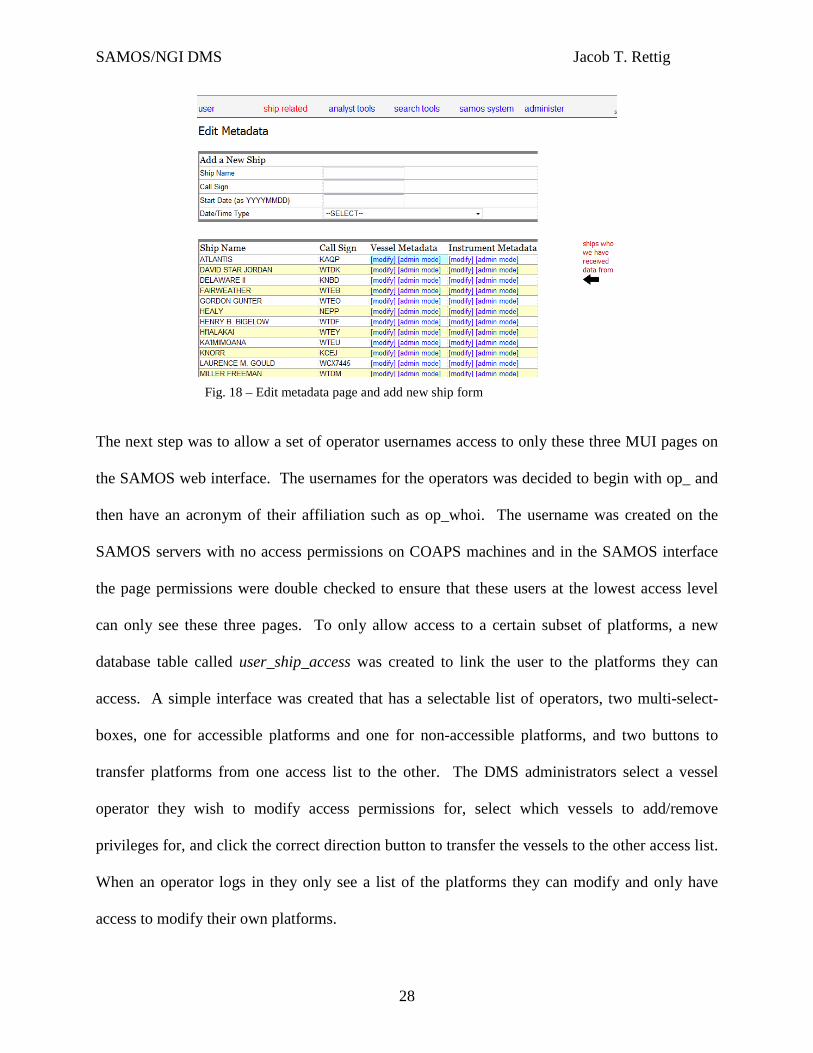
A separate page was created called edit metadata (Fig. 18) that has a list of all the ships like the
main ships page, but with links to these two MUIs. The background color of the links changes
when there is pending changes; a convenience for a quick view of all the ships and seeing if there
are any pending changes. The form to add a new ship also resides on this page.
SAMOS/NGI DMS Jacob T. Rettig
28
The next step was to allow a set of operator usernames access to only these three MUI pages on
the SAMOS web interface. The usernames for the operators was decided to begin with op_ and
then have an acronym of their affiliation such as op_whoi. The username was created on the
SAMOS servers with no access permissions on COAPS machines and in the SAMOS interface
the page permissions were double checked to ensure that these users at the lowest access level
can only see these three pages. To only allow access to a certain subset of platforms, a new
database table called user_ship_access was created to link the user to the platforms they can
access. A simple interface was created that has a selectable list of operators, two multi-select-
boxes, one for accessible platforms and one for non-accessible platforms, and two buttons to
transfer platforms from one access list to the other. The DMS administrators select a vessel
operator they wish to modify access permissions for, select which vessels to add/remove
privileges for, and click the correct direction button to transfer the vessels to the other access list.
When an operator logs in they only see a list of the platforms they can modify and only have
access to modify their own platforms.
Fig. 18 – Edit metadata page and add new ship form
SAMOS/NGI DMS Jacob T. Rettig
29
sub db_interface { # Get serialized string from php script $command = "/usr/local/bin/php -f $php_code"; $str = `$command @_ `; chomp $str; # Unserialize returned string and return return unserialize($str); }
Fig. 19 – Original Perl wrapper function
3.3 Database Interaction Upgrades
While upgrading the SAMOS code to include NGI, I also worked on improving the processing
time of the DMS. On the old IRIX machine it used to take between 2.5 to 3 minutes per order
number. The new LINUX machine has brought the processing time down 30-45 seconds, but
that still seems excessive on the work the DMS is doing. I came up with hypothesis that the way
that the Perl code interacts with the database is the root of the problem. The implemented
solution brought processing time down to rarely over 10 seconds. At the time the SAMOS DMS
was originally designed, Perl did not have the ability to communicate with the SQL server
directly. The solution was to write database interaction functions in another language (PHP) that
could call the PHP function in a Perl wrapper function that uses a system call, and returns the
results via serialize on the PHP side and deserialize on the Perl side. Serialization allows arrays,
classes, and other coding objects to be represented in a sequence of bits for the purpose of
transmission and can be reconstructed on the other side as an exact clone. It is the overhead of
the system call’s creating and destroying a process on the machine that I have hypothesized to be
the problem. To resolve this I have purposed to rewrite all the database interaction functions
originally in PHP to Perl so that the wrapper function, rather than making a system call, would
just have to call a function.
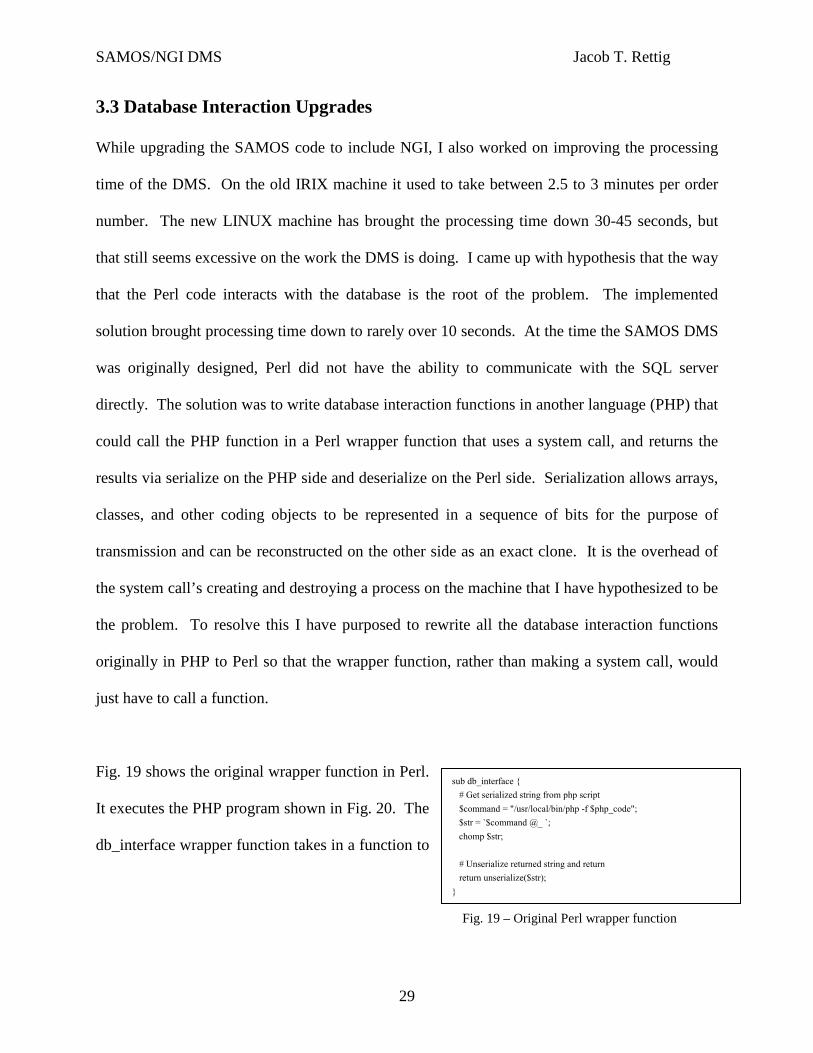
Fig. 19 shows the original wrapper function in Perl.
It executes the PHP program shown in Fig. 20. The
db_interface wrapper function takes in a function to
SAMOS/NGI DMS Jacob T. Rettig
30
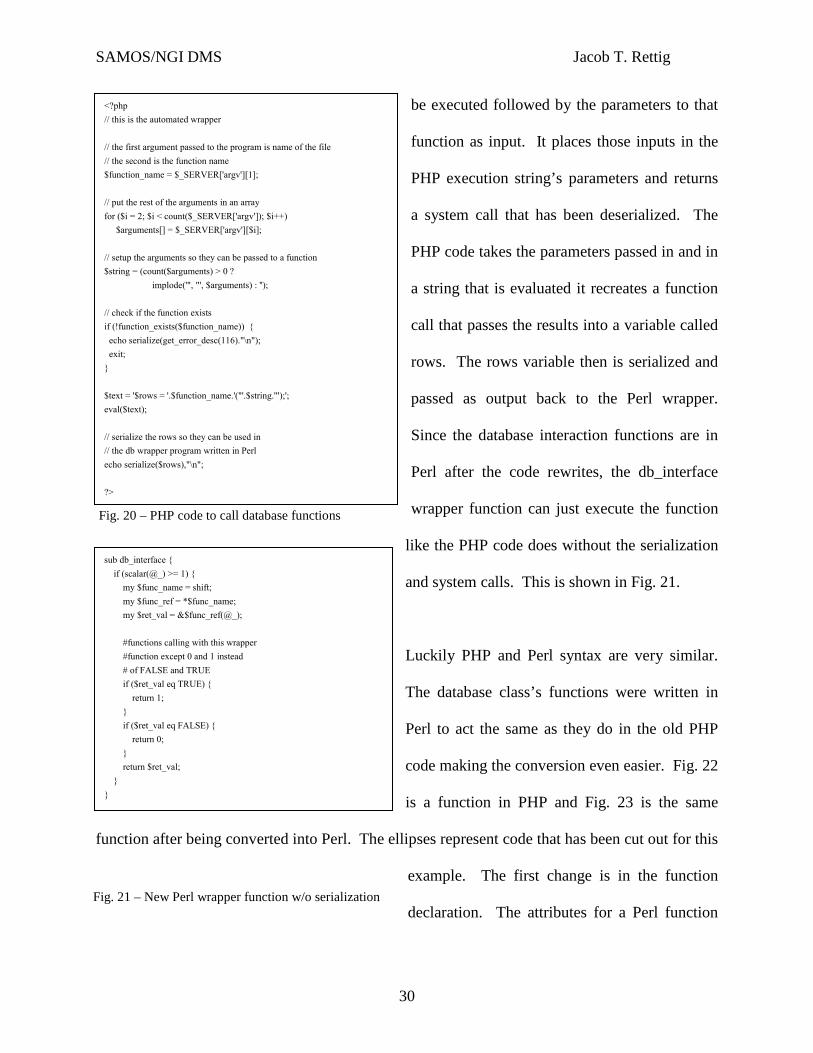
Fig. 21 – New Perl wrapper function w/o serialization
<?php // this is the automated wrapper // the first argument passed to the program is name of the file // the second is the function name $function_name = $_SERVER['argv'][1]; // put the rest of the arguments in an array for ($i = 2; $i < count($_SERVER['argv']); $i++) $arguments[] = $_SERVER['argv'][$i]; // setup the arguments so they can be passed to a function $string = (count($arguments) > 0 ?
implode('", "', $arguments) : ''); // check if the function exists if (!function_exists($function_name)) { echo serialize(get_error_desc(116)."\n"); exit; } $text = '$rows = '.$function_name.'("'.$string.'");'; eval($text); // serialize the rows so they can be used in // the db wrapper program written in Perl echo serialize($rows),"\n"; ?>
Fig. 20 – PHP code to call database functions
sub db_interface { if (scalar(@_) >= 1) { my $func_name = shift; my $func_ref = *$func_name; my $ret_val = &$func_ref(@_); #functions calling with this wrapper #function except 0 and 1 instead # of FALSE and TRUE if ($ret_val eq TRUE) { return 1; } if ($ret_val eq FALSE) { return 0; } return $ret_val; } }
be executed followed by the parameters to that
function as input. It places those inputs in the
PHP execution string’s parameters and returns
a system call that has been deserialized. The
PHP code takes the parameters passed in and in
a string that is evaluated it recreates a function
call that passes the results into a variable called
rows. The rows variable then is serialized and
passed as output back to the Perl wrapper.
Since the database interaction functions are in
Perl after the code rewrites, the db_interface
wrapper function can just execute the function
like the PHP code does without the serialization
and system calls. This is shown in Fig. 21.
Luckily PHP and Perl syntax are very similar.
The database class’s functions were written in
Perl to act the same as they do in the old PHP
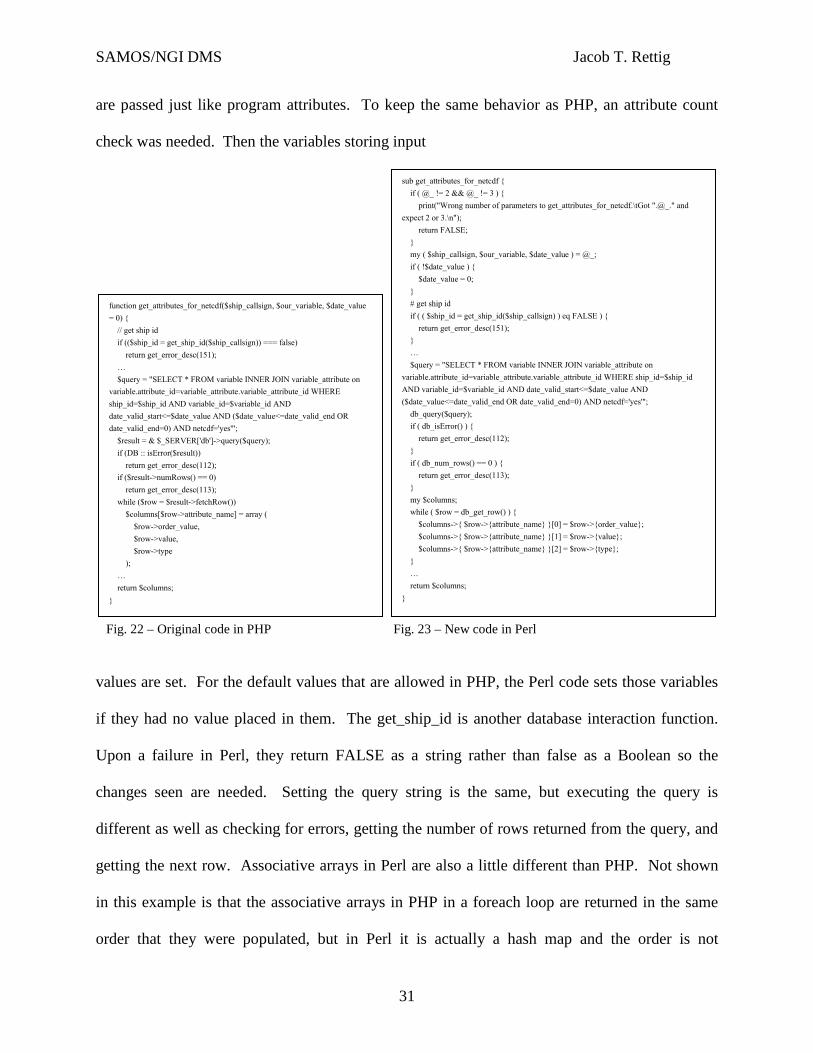
code making the conversion even easier. Fig. 22
is a function in PHP and Fig. 23 is the same
function after being converted into Perl. The ellipses represent code that has been cut out for this
example. The first change is in the function
declaration. The attributes for a Perl function
SAMOS/NGI DMS Jacob T. Rettig
31
are passed just like program attributes. To keep the same behavior as PHP, an attribute count
check was needed. Then the variables storing input
values are set. For the default values that are allowed in PHP, the Perl code sets those variables
if they had no value placed in them. The get_ship_id is another database interaction function.
Upon a failure in Perl, they return FALSE as a string rather than false as a Boolean so the
changes seen are needed. Setting the query string is the same, but executing the query is
different as well as checking for errors, getting the number of rows returned from the query, and
getting the next row. Associative arrays in Perl are also a little different than PHP. Not shown
in this example is that the associative arrays in PHP in a foreach loop are returned in the same
order that they were populated, but in Perl it is actually a hash map and the order is not
sub get_attributes_for_netcdf { if ( @_ != 2 && @_ != 3 ) { print("Wrong number of parameters to get_attributes_for_netcdf.\tGot ".@_." and expect 2 or 3.\n"); return FALSE; } my ( $ship_callsign, $our_variable, $date_value ) = @_; if ( !$date_value ) { $date_value = 0; } # get ship id if ( ( $ship_id = get_ship_id($ship_callsign) ) eq FALSE ) { return get_error_desc(151); } … $query = "SELECT * FROM variable INNER JOIN variable_attribute on variable.attribute_id=variable_attribute.variable_attribute_id WHERE ship_id=$ship_id AND variable_id=$variable_id AND date_valid_start<=$date_value AND ($date_value<=date_valid_end OR date_valid_end=0) AND netcdf='yes'"; db_query($query); if ( db_isError() ) { return get_error_desc(112); } if ( db_num_rows() == 0 ) { return get_error_desc(113); } my $columns; while ( $row = db_get_row() ) { $columns->{ $row->{attribute_name} }[0] = $row->{order_value}; $columns->{ $row->{attribute_name} }[1] = $row->{value}; $columns->{ $row->{attribute_name} }[2] = $row->{type}; } … return $columns; }
function get_attributes_for_netcdf($ship_callsign, $our_variable, $date_value = 0) { // get ship id if (($ship_id = get_ship_id($ship_callsign)) === false) return get_error_desc(151); … $query = "SELECT * FROM variable INNER JOIN variable_attribute on variable.attribute_id=variable_attribute.variable_attribute_id WHERE ship_id=$ship_id AND variable_id=$variable_id AND date_valid_start<=$date_value AND ($date_value<=date_valid_end OR date_valid_end=0) AND netcdf='yes'"; $result = & $_SERVER['db']->query($query); if (DB :: isError($result)) return get_error_desc(112); if ($result->numRows() == 0) return get_error_desc(113); while ($row = $result->fetchRow()) $columns[$row->attribute_name] = array ( $row->order_value, $row->value, $row->type ); … return $columns; }
Fig. 22 – Original code in PHP Fig. 23 – New code in Perl
SAMOS/NGI DMS Jacob T. Rettig
32
conserved. This is a minor problem that caused bugs in the DMS where order conservation was
needed. A key sort has solved this issue.
3.4 Google Maps API Data Viewer Interface
Many times during visual quality control, it is helpful to know where the vessels are located. For
example when the data is flagged for being on land it is good to know if the vessel is in port and
it is also helpful to know what path the vessel has travelled for strange changes in any one of the
sensors. I have heard good things of the Google Maps API and saw that it is all JavaScript and
well documented. The first map used the maximum and minimum latitude and longitude values
in the qc_summary and merged_qc_summary database tables to create a box of where the ship
was during that day. Once the hourly average data points were inserted in the database after the
secondary processing, I saw the chance to use those values to plot a vessel track on the map.
This preliminary interface worked great, but there was no way to determine which end of the
track was the beginning and the end and where the vessel was at a particular time. I wrote some
code that gave weighted averages of colors represented in hexadecimal to use in making a linear
contour plot. That way I could give the code any array of colors in hexadecimal for the contour.
It is currently in 5 colors of the rainbow from blue to red or red to blue. The line was then
modified to be colored by what hour it represents. Later the options were added to color the
tracking plot by the value between the maximum and minimum of any of the variables. These
features are all shown in Fig. 24. It was this interface that was later used as a base to add the
functionality to allow the tracks of multiple vessels to be viewed at the same time for a particular
time range (Fig. 11).

SAMOS/NGI DMS Jacob T. Rettig
33
Fig. 24 – Google Maps API Data Viewer Interface
SAMOS/NGI DMS Jacob T. Rettig
34
Chapter 4. Future Work
Currently there is only one instrumented tower in the NGI project, but this is scheduled to
expand by one or two additional towers in 2010. Also in 2010 a subsurface cable is to be buried
at the N7 tower to offer near real time ocean data in addition to the meteorological data currently
available. The quality controlled observations from SAMOS vessels and the NGI towers will be
provided to the Integrated Oceanographic Observing Systems Regional Associations (e.g.,
GCOOS, SECOORA) to support a wide range of NOAA activities [3]. In 2010, plans will be
made to develop SAMOS 2.0. The initial plans were to upgrade SAMOS to take in higher
temporal rates than 1-minute averaged intervals for higher frequency products as well as better
control over how the 1-minute averages are computed and other numeric calculations that will be
more accurate by using high frequencies of data. The new plan is to have a PC on each research
vessel that is configured at COAPS for the SAMOS project. The advantages are that data
transmission on low budget research vessels can be kept small if the SAMOS v001 files are
created on the PC then transmitted, the PC can have a large terabyte hard drive that can store the
high frequency data that can wait until data transmission is cheap, and the data from different
vessels will be more uniform if all the averaging code is done by COAPS. Neither idea is
finalized. As funds allow, SAMOS can also evolve to process additional oceanographic
parameters and include new QC techniques. One such program that has a lot of potential is
SASSI. SASSI can include a module that can flag a variable based on certain value ranges such
as wind speed sensors near an obstructing object have certain directions that should be flagged as
suspect. SASSI can also be improved in adding self tuning as currently it is tuned by an analyst
through informed guesses. Other future work is to develop an automated metadata protocol so
that the metadata associated with the incoming files is more complete and up to date.
SAMOS/NGI DMS Jacob T. Rettig
35
Chapter 5. Conclusion
The work I have done for COAPS has been great work experience over the past three years. I
have solved real world coding problems individually and in a team environment. The NGI
project is thriving and evolving well. The data collected by the NGI DMS is being used in
research projects at the COAPS, Meteorology, and Oceanography groups of FSU and it is
anticipated to be used by the National Weather Service (NWS) to verify and strengthen marine
forecasts. The MUI has beneficial and disappointing results. The MUI interface works great for
inserting and updating variable metadata into the DMS and is very much preferred by the data
center staff over the old interface. The vessel operators are great at inserting the metadata into
the DMS via the MUI, but the unfortunate result is that the anticipated cooperation with the
vessel operators keeping metadata up to date is seen rarely. A protocol that sends metadata with
the data is proposed to keep the metadata up to date. The recoding of the database functions
from PHP to Perl works great. There were a few bugs such as element order in associative
arrays, otherwise the operation ran smoothly. The changes make maintenance easier as all the
processing code is now in the same code directory and the DMS processing time has decreased
by a factor of 3 to 4. The Google Maps API Data Viewer Interface was a wonderful success.
The map showing the vessel track has helped the analyst in knowing where the vessel is for
Visual QC and for my curiosity of vessel locations. The Google Maps API Data Viewer
Interface has also set a base for other mapping interfaces such as the vessel track map created by
Scott Kondor. These work experiences at COAPS are very educational and will help in my
future employment.
SAMOS/NGI DMS Jacob T. Rettig
36
References
[1] Smith, S. R., J. T. Rettig, J. Rolph, J. Hu, E. C. Kent, E. Schulz, R. Verein, S. Rutz, and C. Paver, 2010:
The Data Management System for the Shipboard Automated Meteorological and Oceanographic System
(SAMOS) Initiative. Proceeding, OceanObs'09: Sustained Ocean Observations and Information for
Society, Venice, Italy, IOC/UNESCO and ESA, (in press).
[2] Smith, S. R., (2009). SAMOS Pilot Program [Online]. Available: http://samos.coaps.fsu.edu/html/pilot.php
[3] Rettig, J. T., M. A. Bourassa, J. Hu, E. M. McDonald, J. J. Rolph, and S. R. Smith (2009), Data
management system to collect, quality control, distribute, and archive near real-time marine data, E-journal
of Data Integration and Management on the Gulf of Mexico, 4 pp.
[4] da Silva, A. M., C. C. Young, and S. Levitus, 1994: Atlas of Surface Marine Data, Vol. 1: Algorithms and
Procedures. NOAA Atlas NESDIS 6, U. S. Department of Commerce, NOAA, 83pp. Available from:
NOAA/NODC, Customer Service, E/OC, 1315 East-West Highway, Silver Spring, MD 20910.
[5] Smith, S. R., (2009). FSU DAC Quality Evaluation Flags [Online]. Available:
http://samos.coaps.fsu.edu/html/samos_quality_flag.php
[6] Smith, Shawn R., Mark A. Bourassa, Anton Dmitriev, Rich Gange, Jiangyi Hu, E. Michael McDonald,
Barrett Olafson, Jacob T. Rettig, Jeremy J. Rolph, Tina Suen, and Scott Tesoriere, “SAMOS: The Data
Processing” draft, (document), unpublished. Available from: Florida State University, Center for Ocean-
Atmospheric Prediction Studies, 2035 E. Paul Dirac Dr., 200 R.M. Johnson Bldg., Tallahassee, FL, 32306-
2840.
[7] Tesoriere, Scott, Rich Gange, and Jacob T. Rettig, “SAMOS: database structure” draft, (document),
unpublished. Available from: Florida State University, Center for Ocean-Atmospheric Prediction Studies,
2035 E. Paul Dirac Dr., 200 R.M. Johnson Bldg., Tallahassee, FL, 32306-2840.
[8] Tesoriere, Scott, Rich Gange, and Jacob T. Rettig, “SAMOS: The User Interface” draft, (document),
unpublished. Available from: Florida State University, Center for Ocean-Atmospheric Prediction Studies,
2035 E. Paul Dirac Dr., 200 R.M. Johnson Bldg., Tallahassee, FL, 32306-2840.
SAMOS/NGI DMS Jacob T. Rettig
37
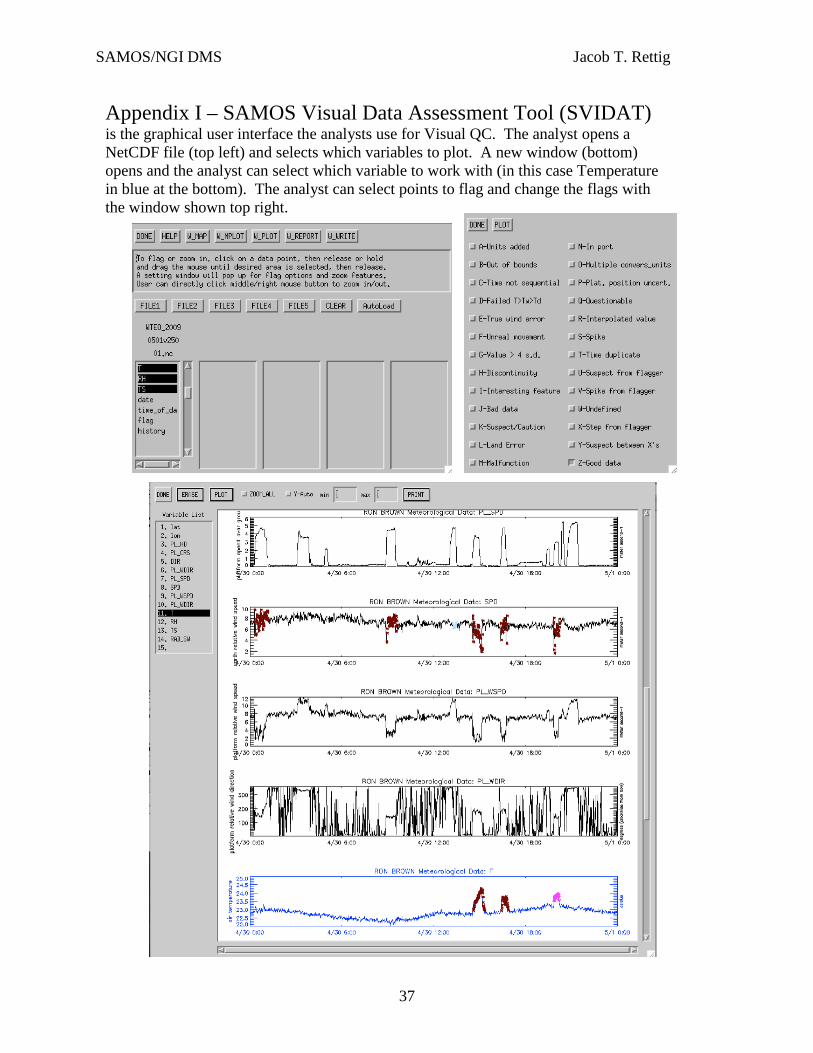
Appendix I – SAMOS Visual Data Assessment Tool (SVIDAT) is the graphical user interface the analysts use for Visual QC. The analyst opens a NetCDF file (top left) and selects which variables to plot. A new window (bottom) opens and the analyst can select which variable to work with (in this case Temperature in blue at the bottom). The analyst can select points to flag and change the flags with the window shown top right.
SAMOS/NGI DMS Jacob T. Rettig
38
variable_attribute_value
U1 vav_id
FK1 attribute_id value name
qc_summary
PK,FK1,U1 daily_file_history_idPK,FK2,I1,U1 known_variable_id
a b c d e f g h i j k l m n o p q r s t u v w x yI2 zI3 total special missing min max
merged_file_history
U1 merged_file_history_id
FK1 merged_file_idFK2,I2 version_id user date_processed description passFK2 process_version_no
daily_file_history
U1 daily_file_history_id
FK1 daily_file_piece_idFK2,I2 version_id user date_processed description passFK2 process_version_no
global_attribute
U1 gid
name valueI1 order_value table_name column_name datatype
variable_view
U1 variable_view_id
FK1 variable_idFK2,I2 attribute_id
ship
U1 ship_id
I2 vessel_nameI3 vessel_call_sign vessel_type_rvI1 imo_number vessel_home_port vessel_home_institution_name vessel_home_institution_address vessel_primary_contact_name vessel_primary_contact_email vessel_primary_contact_phone vessel_primary_contact_fax vessel_technician_names vessel_technician_emails alternate_vessel_email cc_vessel_email vessel_operating_country vessel_recruiting_country vessel_home_page instrument_system_name instrument_system_version date_of_recruitment other_data_exchanges vessel_dimension_length vessel_dimension_breadth vessel_dimension_freeboard vessel_dimension_draught vessel_dimension_cargo_height data_reporting_interval vessel_side_view instrument_mast top_view side_view bs_view
version_no
U1 version_idU2 process_version_no
description
merged_qc_summary
PK,FK2,FK3,U1 merged_file_history_idPK,FK1,I1,U1 known_variable_id
a b c d e f g h i j k l m n o p q r s t u v w x yI2 zI3 total special missing min max
daily_file_piece
U1 daily_file_piece_id
FK1 daily_file_idFK2,I2 original_file_idFK3,I3 current_version_id date_received order_noFK3 process_version_no
variable
U1 ship_variable_id
FK1,I2 variable_idFK2 ship_id date_id date_valid_start date_valid_endFK3,I3 attribute_id valueI4 abbreviation
cruise
PK cruise_id
home_institution_cruise_id cruise_track_code program_tag expocode cruise_start_date cruise_end_date data_start_date data_end_date chief_scientist_name chief_scientist_emailFK1,I1 ship_id
known_variable
U1 variable_id
I2 variable_name long_name data_type unitsI1 order_value maximum_value minimum_value missing_value special_value
variable_attribute
U1 variable_attribute_id
attribute_nameI1 order_value type netcdf name_on_form description_on_form seen_on_form
error
U1 error_id
I1 error_no error_description
original_file
U1 original_file_id
provider verified description date_received filename
file_format
U1 file_format_id
FK1 ship_id date_id date_valid_start date_valid_end compression file_format_name file_format_version from_email
merged_file
U1 merged_file_id
FK1 daily_file_idFK2,I2 current_version_id order_noFK2 process_version_no
daily_file
U1 daily_file_id
FK1 ship_idI1 date_collectedI2 datetime_collected
Appendix II – Database tables used in processing
SAMOS/NGI DMS Jacob T. Rettig
39
user_level
U1 id
descriptionI1 level
user_ship_access
FK2 usernameFK1,I1 ship_id
ship
U1 ship_id
users
username
access levelFK1,I1 user_level
version_no
U1 version_id
ship_graphics
U1 graphic_id
FK2,I2 ship_id date_valid_start date_valid_endFK1 graphic_type_id graphic_file_name description
graphic_types
U1 graphic_type_id
name descriptionI2 order_value
navigation_item
U1 id
I6 linkU2 name class descriptionI4 parentI5 sort_valueFK1,FK2,I1 minimum_view_levelFK3,FK4,I2 minimum_edit_levelFK5,FK6,I3 minimum_delete_level visible show_title
time_avg_data
FK2 time_avg_data_history_idFK1,I1 known_variable_id time
I3 valueI2 flag
known_variable
U1 variable_id
time_avg_data_history
U1 time_avg_data_history_id
FK1 daily_file_id user date_processedI2 order_noFK2,I1 version_id descriptionI3 pass
daily_file
U1 daily_file_id
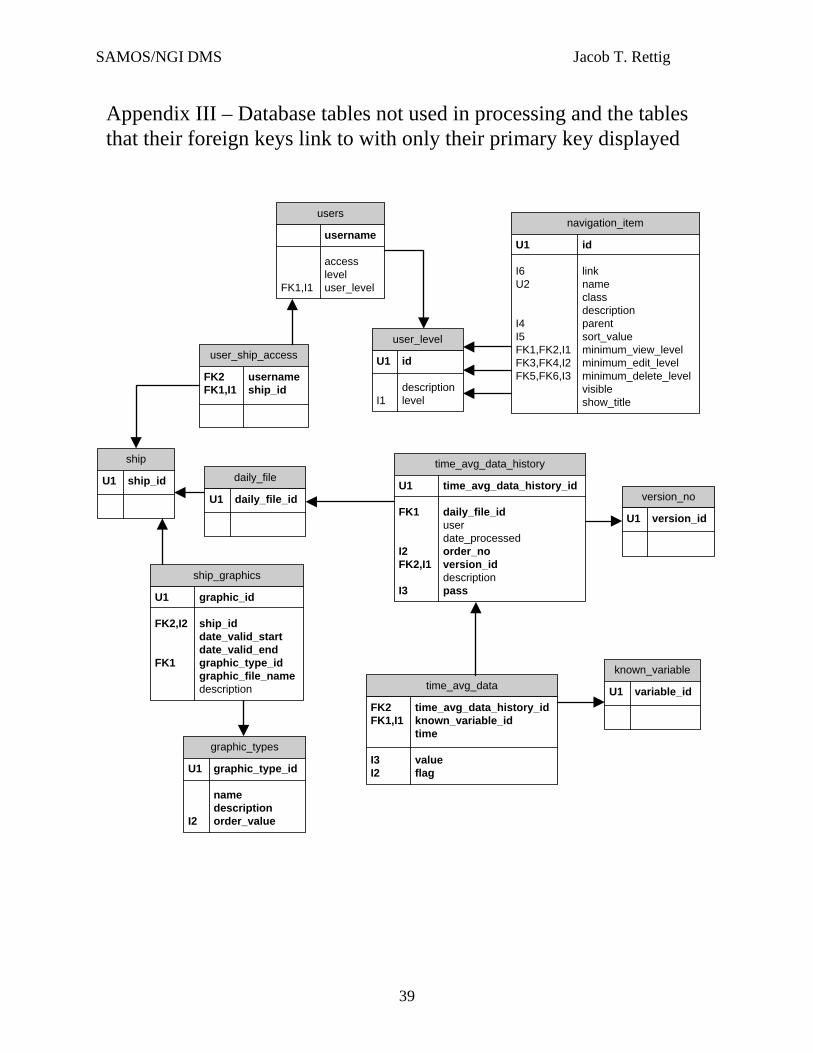
Appendix III – Database tables not used in processing and the tables that their foreign keys link to with only their primary key displayed