Embed Size (px)
Citation preview

Chapter 2
Salt tolerance in Salicornia 23
Chapter 2. Salt tolerance in the halophyte Salicornia
dolichostachya Moss: Growth, morphology and physiology
Diana Katschnig, Rob Broekman, Jelte Rozema
Systems Ecology, Department of Ecological Science, Faculty of Earth and Life Sciences, VU
University Amsterdam, De Boelelaan 1085, 1081 HV Amsterdam, The Netherlands
Adapted from: Environmental and Experimental Botany (2013) 92: 32-42


Chapter 2
Salt tolerance in Salicornia 25
Chapter 2. Salt tolerance in the halophyte Salicornia
dolichostachya Moss: Growth, morphology and physiology
Abstract
Salinization of agricultural land is an increasing problem. Because of their high
tolerance to salinity, Salicornia spp. could become model species to study salt tolerance.
Moreover, they also represent promising saline crops. The salinity-growth response curve for
Salicornia dolichostachya Moss was evaluated at 10 different salt concentrations in a
hydroponic study in a greenhouse and at 5 different seawater dilutions in an outside setting.
Salt concentrations ranged between 0 mM and 500 mM NaCl (≈ seawater salinity). Plants
were grown for six weeks, and morphological and physiological adaptations in different plant
parts were evaluated.
S. dolichostachya had its growth optimum in the range between 100 and 300 mM
NaCl in the root medium, independent of the basis on which growth was expressed. The
relative growth rate (RGR) in the greenhouse experiment was comparable with RGR-values
in the outdoor growth-experiment. Leaf succulence and stem diameter had the highest values
at the growth optimum (300 mM NaCl). Carbon isotope discrimination (δ13
C) decreased upon
salinity. S. dolichostachya maintained a lower leaf sap osmotic potential relative to the
external solution over the entire salinity range, this was mainly accomplished by
accumulation of Na+ and Cl
–. Glycine betaine concentrations did not significantly differ
between the treatments. Na+:K
+-ratio and K
+-selectivity in the shoots increased with
increasing salinity, both showed variation between expanding and expanded shoot parts. I
concluded that S. dolichostachya is highly salt tolerant and showed salt requirement for
optimal growth.

2.1. Introduction
The need for salt tolerant crops increases as substantial percentages of cultivated land
worldwide are affected by salinity (FAO 2002). The prospect is that fresh water will become
scarce due to an increasing demand of the growing world population (UN 2010). Moreover,
as a result of global warming, arable land may suffer from increasing saline and dry
conditions in the future, whereas sea-level rise will particularly threaten coastal lowlands.
Most conventional crop species are salt sensitive, e.g. rice, chickpea, corn and most fruit
crops. Plants growing on saline soils face several challenges. Water uptake is hampered
because of the low water potential of the soil (Munns and Tester 2008). Salts accumulate
within the plant to toxic levels (Greenway and Munns 1980) and deficiencies of essential
nutrients occur, e.g. K+ (Flowers and Colmer 2008; Flowers et al. 1986). Plants that naturally
possess the traits needed to grow and reproduce on saline soils at salt concentrations of at
least 200 mM are termed halophytes by Flowers and Colmer (2008). By studying the diverse
set of mechanisms that halophytes employ to deal with salt, we might gain insight into which
parameters are most promising to target for increasing salt tolerance in conventional crops.
The taxonomic diversity of halophytes prompted Glenn et al. (1999) to predict the
prospective of introducing salt tolerance in crops by small changes in the genetic makeup,
although this has proved to be fairly difficult thus far (Flowers and Flowers 2005).
Alternatively, domestication of halophytes can convert them into high yielding crops
(Rozema and Flowers 2008) or halophytes can be used for remediation and reclamation of
salt-affected lands (Barrett-Lennard 2002).
The plant order of the Caryophyllales contains the highest percentage of halophytic
species amongst all orders of flowering plants (Flowers et al. 2010), 21.4% of all halophytic
species are within this order. Within this order the family of the Amaranthaceae comprises
the highest number of halophytic genera (Flowers et al. 1986). The genus Salicornia belongs
to the Amaranthaceae and consists of highly salt tolerant annuals without salt glands or salt
bladders. Salicornia spp. occur in saline environments around the globe, except for Australia
and South America where other salt tolerant members of the Salicornioideae occur (Kadereit
et al. 2007). There is no general consensus of the number of Salicornia species due to the
large phenotypic variation within the same species and morphological parallelism between
different species (Davy et al. 2001; Kadereit et al. 2007). The estimations lie around 25–30
species in the genus (Kadereit et al. 2007). Several economically viable applications have

Chapter 2
Salt tolerance in Salicornia 27
been suggested for Salicornia species. Salicornia bigelovii has been proposed as a promising
oil seed crop with yields comparable to conventional crops under non-saline conditions
(Glenn et al. 1991). Salicornia spp. have been successfully grown in aquaculture systems
(Grattan et al. 2008) and can be used for human food consumption. Due to the high salt
tolerance, high growth rate, short generation time, its capability of producing many seeds and
agronomic value, Salicornia spp. can become valuable model species to study salt tolerance
mechanisms and as a saline crop.
Salicornia dolichostachya Moss is a tetraploid species that is native to The
Netherlands below the mean high water line (MHWL) and is subjected to flooding on a
regular basis (Rozema et al. 1987). The present study determined the salinity-growth
response curve for S. dolichostachya in hydroponic culture at 10 external NaCl
concentrations with small intervals between the salt concentrations. Additionally, the growth
response curve was determined in two seawater treatments in the greenhouse and compared
with the growth response of plants grown in an outside setting. I tried to characterize the
morphological and physiological traits underlying the growth response. Succulence, stem
diameter, δ13
C, osmotic potential of leaf sap and organ solute concentrations (Na+, Cl
–, K
+,
Mg2+
and glycine betaine) were measured in roots and expanding and expanded shoot parts.
2.2. Materials and methods
2.2.1. Plant material
Seeds of S. dolichostachya were collected below the MHWL at Lutjestrand,
Wieringen, The Netherlands in November 2010. Before sowing, seeds were stored dry in a
refrigerator at 7ºC for 50 d, to simulate a stratification period. Two separate experiments were
done. In experiment 1, I investigated the effect of a range of NaCl concentrations in the root
medium (0–5–50–100–150–200–250–300–400–500 mM NaCl) and two seawater treatments
(electric conductivity (EC) 20 and 40 dS/m, this is ~210 and ~420 mM NaCl, respectively) on
growth and a set of physiological parameters in S. dolichostachya. This experiment was
conducted in a greenhouse. In experiment 2, I grew S. dolichostachya in an inland seawater
drip-irrigation system to be able to compare the relative growth rate (RGR) in experiment 1
to the RGR of the same species in an outside setting.

2.2.2. Experiment 1: greenhouse growth experiment
2.2.2.1. Plant growth and NaCl treatments
Seeds were sown on peat soil (seed pot soil; Jongkind, Aalsmeer, The Netherlands).
61 Days after germination, seedlings were washed free of soil and transplanted individually
in black 1-L polyethylene pots containing (in mM): K+, 3.001; Ca
2+, 2; Mg
2+, 0.5; NO3
–, 5;
NH4+, 1.001; HPO4
2–, 1; SO4, 0.516; Cl
–, 0.001; H2BO3
–, 0.025; Mn
2+, 0.002; Zn
2+, 0.002;
Cu2+
, 0.001; Mo2+
, 0.001; Fe–Na–EDTA, 0.01, buffered with 2 mM MES (pH 6.0). Seedlings
were grown for 14 d to recover from transplanting; over these 14 d the plants resumed growth
as demonstrated by an increase in length of the main stem. During the recovery period no
NaCl was added to the nutrient solution and seedlings were covered with transparent plastic
pots to keep the relative humidity of the air above 90%. After the recovery period salt
treatments were started. Plants were randomly allocated to 12 treatment groups, consisting of
0, 5, 50, 100, 150, 200, 250, 300, 400 and 500 mM NaCl and two seawater treatments with
EC values of 20 and 40 dS/m (seawater was collected at Bergen aan Zee, The Netherlands,
March 2011). Extra nutrients were added (KNO3 0.85 mM, NH4H2PO4 0.03 mM and Fe-
EDDHMA 0.03 mM) to the two seawater treatments to prevent shortage of essential
nutrients. Each treatment group consisted of 9 replicate plants. NaCl treatments were applied
by adding NaCl to the nutrient solution in steps of 50 mM per day to prevent an osmotic
shock (Munns 2005), salinity in plants subjected to the seawater treatments was also
increased daily with the equivalent (5 dS/m) of 50 mM NaCl. Nutrient solutions were
changed weekly. Plants were grown in a randomized design in a naturally lit greenhouse with
additional lamps (PAR of 300 μmol m–2
s–1
at plant level, 14/10 h light/dark) in March–May
2011 in Amsterdam, The Netherlands, maximal outdoor light intensity was PAR of ~1500
μmol m–2
s–1
. The temperature was 20 ± 2/16 ± 2 ºC day/night, and the relative humidity of
the air 70 ± 10/90 ± 2% day/night, respectively. Pots were randomly re-located every week.
The duration of the treatment was 42 d.
2.2.2.2. Harvest
Plants were harvested after the recovery period before the start of the salt treatment
(initial harvest) and after 42 d of the start of the salt treatment. Plants allocated to the 0 and 5
mM NaCl treatments started to flower 14 d after commencement of treatment, and were
harvested 21 d after the start of the treatment due to retarded growth, indicated by a light
brown or yellow color, and wilting. At harvest plants were rinsed in de-mineralized water 3

Chapter 2
Salt tolerance in Salicornia 29
times for 5 s and carefully blotted dry. Thereafter, the plants were separated into succulent
shoots, woody shoots (i.e. not succulent) and roots. Note that because of the reduced growth
form of Salicornia it is impossible to separate the leaves from the stem, and throughout this
paper the term ‘leaf’ denotes a pair of leaves fused with a stem internode. Succulent shoots
were further divided into expanding succulent shoots, assumed to be the first 1–4 mm from
the tip (apex) of the shoot, and expanded succulent shoots, assumed to be from 4 mm of the
tip of the shoot onward (away from the apex). Expanding and expanded shoot parts were
separated with a razor blade. Fresh biomass of the expanding and expanded shoot parts and
roots were recorded and total leaf area of the green parts was estimated with a leaf area meter
(LI-COR 3100, Li-Cor Inc., Lincoln, NE, USA). From a subgroup of plants (3 plants per
treatment) diameter and length of all individual branches were recorded and leaf area
calculated. Leaf area measurements with the leaf area meter gave a systematically lower
value for leaf area than the leaf area calculations on the basis of diameter and length; this will
be because of the cylindrical growth form of the plants. Therefore, a correction for leaf area
determined by the diameter-length method was applied on the leaf area values measured with
the leaf area meter. The reason to continue the use the leaf area meter is that the diameter-
length measurements are more laborious and time consuming due to the many branches the
plant develops. After measuring leaf area, subsamples of shoots and roots were shock-frozen
in liquid nitrogen and either stored at –20ºC, –80ºC or freeze-dried for 5 d. Other subsamples
were oven dried at 70 ºC for 72 h after which dry masses were recorded. Dried plant material
was ground into a fine powder using mortar and pestle. Material stored at –20ºC was used to
measure osmotic potential. Freeze-dried material was used to analyze glycine betaine. Oven-
dried material was used to measure Na+, Cl
–, K
+ and Mg
2+ and to calculate the RGR, with the
formula (Hunt et al. 2002):
RGR = Ln(w2) − Ln(w1)
t2 − t1
where W1 and W2 is the dry mass or ash-free dry mass of the plants at initial and final
harvest, respectively, and t2–t1 is the time in days between the two harvests. Ash-free dry
mass was determined by subtracting the Na+, Cl
–, K
+ and Mg
2+ content from the dry mass.

2.2.2.3. Carbon isotope composition
Measurements of carbon isotope composition were made on subsamples of oven-dried
expanding and expanded shoot parts and were determined using an elemental analyzer
(NC2500, ThermoQuest Italia, Rodano, Italy) coupled online to a stable isotope ratio mass
spectrometer (Delta plus, ThermoQuest Finnigan, Bremen, Germany). To check for the
reproducibility of the method, a plant sample (–28.50‰; 45.2% C) was measured in triplicate
in each run. Expanding and expanded shoot samples were measured in duplicate. Stable
isotope abundance was expressed using the δ notation:
δ13C (‰) =
Rsample − Rstandard
Rstandard × 1000
In this formula, δ13
C is the 13
C content and Rsample and Rstandard refer to the 13
C/12
C-ratio of the
sample and of the standard (Vienna PeeDee Belemnite), respectively.
2.2.2.4. Analyses of Na+, Cl
–, K
+, Mg
2+
Expanding shoots, expanded shoots, woody shoots and roots were measured for Na+,
Cl–, K
+ and Mg
2+ contents. Material was prepared by heating (~100°C) 50 mg of plant
material in 5 ml de-mineralized water for 2 h, hereafter material was filtered with 4-7 μm
cellulose filters (597, Whatman GmbH, Dassel, Germany). Na+, K
+ and Mg
2+ concentrations
were determined in the supernatant on a flame atomic spectrophotometer (Perkin-Elmer
1100B; Perkin Elmer Inc., Waltman, MA, USA). Chloride was measured with a chloride
analyzer (Chloride analyzer 926, Sherwood Scientific Ltd, Cambridge, UK).
2.2.2.5. Glycine betaine
Glycine betaine concentrations were determined in subsamples of shoots and roots
using high performance liquid chromatography (HPLC) by the method of Carillo and Gibon
(2011). Before analyses samples were filtered over 0.22 μm nylon centrifuge filters (Costar
Spin-X, Corning Inc., NY, USA) and analyzed by injection of 100 μl of sample into the
HPLC (Waters 2690 Alliance system equipped with two Nova-Pak C18 columns (150 mm
length x 3.9 mm internal diameter) and a Nova-Pak C18 guard column with a Waters 996
photo diode-array detector; Waters Corporation, Milford, MA, USA). Reliability of the
method was checked by injection of known amounts of glycine betaine (obtained from
Sigma–Aldrich, Germany) into the plant samples.
Chapter 2
Salt tolerance in Salicornia 31
2.2.2.6. Sap osmotic potential
Plants samples were shock-frozen in liquid nitrogen immediately after harvest and
stored at –20 ºC in plastic vials. The material was crushed, left to thaw and spun for 30 s at
13.000 rpm (Micro Centaur, Beun De Ronde, Abcoude, The Netherlands) while still in the
vial just before measurement. 10 μl of the supernatant was used to measure osmolality using
a vapor pressure osmometer (Wescor Model 5500, Wescor Inc., Logan, UT, USA).
Calibration of the osmometer was checked every 10th
sample. Samples were measured in
duplicate. The osmotic potential (ψs) was determined according to the van’t Hoff equation:
ψs = −𝑐 ∙ R ∙ T
Where, c is the osmolality of the solution (osmol L–1
), R is the universal gas constant (kg
mol–1
K–1
) and T is the temperature (°K). Ion activity coefficients were assumed to be 0.92
(Robinson and Stokes 1959).
2.2.3. Experiment 2: outside growth experiment
2.2.3.1. Plant cultivation and growth measurements
A closed seawater drip irrigation system was used located at the island of Texel at the
NIOZ harbor (53°00’N and 4°47’E) in The Netherlands. In May 2011, seeds of the same
population of S. dolichostachya as in experiment 1 were sown onto coarse sand in wooden
crates of 1 m2 and 20 cm height. Plants were not watered for two weeks after sowing but
received sufficient rain for germination. Treatment was started 2 weeks after sowing by drip
irrigation with dilutions of Waddensea water: 0–10–20–30 and 40 dS/m, with added nutrients
(KNO3 0.85 mM, NH4H2PO4 0.03 mM and Fe-EDDHMA 0.03 mM). Drip irrigation water
was applied for 30 minutes every hour during 15 hours a day. The distance between the holes
in the irrigation tubes was 30 cm. Holes in the bottom of the crates allowed drainage of the
irrigation water, which was collected in a second crate and returned to the main reservoir with
a volume of 1000 L. Reservoirs were completely changed at least every 2 weeks and more
often if the electrical conductivity (EC) of the solutions deviated more than 10% from the
intended EC. Precipitation was measured with a rain gauge. There were 8 replicate crates for
the 10, 20 and 40 dS/m treatment and 4 replicate crates for the 0 and 30 dS/m treatment. An
initial harvest of the plants was done at the start of the treatments and 2nd
and 3rd
harvests
were done after 27 and 67 d after commencement of the treatment, respectively. At harvest,

plants were rinsed in de-mineralized water for 3 times 5 s and carefully blotted dry. Fresh
masses of leaves and roots were recorded and leaf area was measured as described in
experiment 1. After measuring leaf area plants were oven dried at 70 ºC for 72 h after which
dry masses were recorded. RGR was calculated over the 40 d period between the second and
third harvest with the formula described in experiment 1.
2.2.4. Statistical analyses
Before analysis normality and homogeneity of the data was checked. One-way
ANOVA with Tukey’s post hoc test was used to assess the effect of salt treatment on the
different parameters measured. If the normality or homogeneity assumptions were violated,
data were either transformed, or a non-parametric test (Kruskal–Wallis) was used. I analyzed
the effects of salinity on carbon isotope discrimination, osmotic potential, K+-selectivity and
Na+:K
+-ratio in different plant parts (expanding and expanded shoot parts) using mixed
model regression analysis, with individual measurements nested within measurement series
and plant identity. Plant parts and salinity level were treated as fixed factors and
measurement series and plant identity as random factors. Data analysis was performed using
SPSS 17.0.

Chapter 2
Salt tolerance in Salicornia 33
2.3. Results
Figure 1. Effect of NaCl treatments on (A) fresh mass
(B) dry mass and (C) ash-free dry mass of shoots and
roots of Salicornia dolichostachya hydroponically
grown at 50–500 mM NaCl in the root medium for 42
d. Values are mean ± S.E. of 7–9 replicates. Mean
values with different letters indicate a significant
difference in the same plant parts between treatments
(Tukey’s test, p < 0.05). No significant differences
occurred between treatments in (B) root dry mass and
(C) root ash-free dry mass.
2.3.1. Growth
The results of the final harvest of
the 16 weeks old plants (50–500 mM
NaCl treatments) are shown in Fig. 1. The
shoot fresh mass (Fig. 1A) and dry mass
(Fig. 1B) increased between 50 and 300
mM NaCl and declined at 300–500 mM
NaCl. Shoot fresh mass and dry mass at
300 mM NaCl, was significantly higher
compared to the lowest (50 mM) and
highest (500 mM) salt treatments. Shoot
dry mass at 50 and 500 mM NaCl was 48
and 50% respectively of the dry mass in
the 300 mM treatment. Shoot ash free dry
mass (Fig. 1C) showed almost the same
pattern as for dry mass, except that 400
mM NaCl in the root medium also resulted
in a significant decrease in ash-free dry
mass. Root fresh mass showed a
significant effect of increased salinity (Fig.
1A). At 400 and 500 mM NaCl in the root
medium root fresh mass decreased by 45
and 48% respectively, in comparison with
the 300-mM NaCl treatment. In contrast to
the shoots, the salt treatments had no
effect on root dry mass (Fig. 1B) or root
ash-free dry mass (Fig. 1C).

Table 1. Effect of salinity on growth of Salicornia spp. under a variety of conditions in salt dose response experiments performed up until 1th
of August 2011. Literature was searched
with the database Web of Science using the search terms: Salicornia and salt (434 hits) or Salicornia and salinity (196 hits). Studies were only included when they were conducted in
either greenhouses or controlled environment rooms, reported dry mass for at least 2 different salt treatment levels of which one control treatment (< 10 mM NaCl) and were written in
English. Dry mass data given in graphs were made numeric with DataThief III (Shareware; version 1.6). All dry mass data were systematically expressed in the same unit preferably as
plant dry mass, in two studies only shoot dry mass was given. Dry mass at the recorded optimal salinity per study was expressed as percentage of the dry mass at the control in the same
study. If plants were grown under a number of different conditions, the conditions that gave the highest dry mass values were chosen.
Salt treatments Dry mass at recorded optimal salinity as % of control
Treatment specifications
Salicornia spp. Origin plants Control (mM) Recorded optimal salinity (mM) Growth media
Pre-cultivation method (d)
Treatment duration (d) Source
S. europaea Inland salt marsh < 1 170 109 Hydroponic culture in perlite 61 21 Aghaleh et al.(2011)
S. europaea Inland salt marsh < 1 200 102 Hydroponics Germination 46 Aghaleh et al. (2009)
S. europaea Inland salt marsh < 1 300 231 Soil 15 45 Balnokin et al. (2005)
S. europaea Inland salt marsh < 1 170 273 Hydroponic culture in vermiculite Seedlings 28 Ungar (1978)
S. europaea Coastal salt marsh < 1 < 1 100a Hydroponics at 50% relative
humidity 20 21 Wang et al. (2009)
S. europaea Coastal salt marsh < 1 300 252 Hydroponics with agar Plants from the field 47 Ozawa et al. (2007)
S. europaea Not available < 1 171 405 Hydroponics 14 35 Ushakova et al. (2006)
S. europaea Not available < 1 85 143 Hydroponic culture in perlite Plants from the field 21 Moghaieb et al. (2004)
S. brachiata Coastal salt marsh < 1 200 249 Hydroponics at 60% relative humidity
61 21 Parida and Jha (2010)
S. ramossissima verdemilho
Coastal salt marsh < 1 < 1 100 Hydroponic sand culture Seedlings 70 Silva et al. (2007)
S. ramossissima varela
Coastal salt marsh < 1 < 1 100 Hydroponic sand culture Seedlings 70 Silva et al. (2007)
S. rubra Inland salt marsh < 1 < 1 100 Hydroponics 1 cm tall plants 60 Khan et al. (2001)
S. rubra Inland salt marsh < 1 327 195 Hydroponics 2-3 cm tall plants 84 Tiku (1976)
S. bigelovii Coastal salt marsh 0.5 ppt (equivalent to ~9 mM)
10 ppt (equivalent to ~180 mM)
118a Seawater (aquaculture effluent) in
sand Germination 86 Brown et al. (1999)
S. bigelovii Coastal salt marsh 5 200 301 Hydroponics at 25 - 50% relative humidity
48-55 39 Ayala & O'Leary (1995)
S. persica Inland salt marsh < 1 170 109 Hydroponic culture in perlite 61 21 Aghaleh et al. (2011)
S. persica Inland salt marsh < 1 100 136 Hydroponics Germination 45 Aghaleh et al. (2009)
S. utahensis Inland salt marsh < 1 600 146 Hydroponic sand culture Young seedlings 60 Gul et al. (2009)
S. subterminalis Sweetwater marsh < 1 394 151 Seawater in sand, silt and clay mixture
30 224 Kuhn and Zedler (1997)
S. fruticosa Coastal salt marsh < 1 342 262 Hydroponics Plants from the field 60 Abdulrahmam and Williams (1981)
a percentage calculated from shoot dry mass only
Chapter 2
Salt tolerance in Salicornia 35
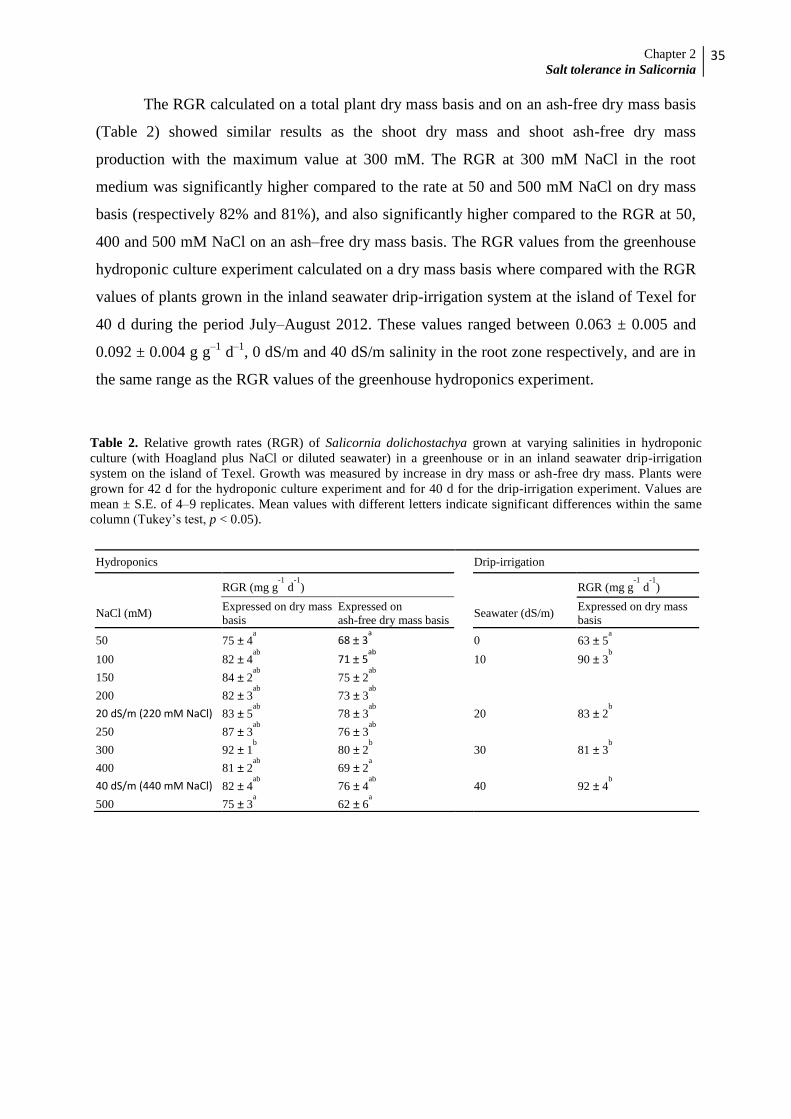
The RGR calculated on a total plant dry mass basis and on an ash-free dry mass basis
(Table 2) showed similar results as the shoot dry mass and shoot ash-free dry mass
production with the maximum value at 300 mM. The RGR at 300 mM NaCl in the root
medium was significantly higher compared to the rate at 50 and 500 mM NaCl on dry mass
basis (respectively 82% and 81%), and also significantly higher compared to the RGR at 50,
400 and 500 mM NaCl on an ash–free dry mass basis. The RGR values from the greenhouse
hydroponic culture experiment calculated on a dry mass basis where compared with the RGR
values of plants grown in the inland seawater drip-irrigation system at the island of Texel for
40 d during the period July–August 2012. These values ranged between 0.063 ± 0.005 and
0.092 ± 0.004 g g–1
d–1
, 0 dS/m and 40 dS/m salinity in the root zone respectively, and are in
the same range as the RGR values of the greenhouse hydroponics experiment.
Hydroponics Drip-irrigation RGR (mg g
-1 d
-1)
RGR (mg g-1
d-1
) NaCl (mM) Expressed on dry mass
basis Expressed on ash-free dry mass basis
Seawater (dS/m) Expressed on dry mass
basis 50 75 ± 4
a 68 ± 3a
0 63 ± 5
a 100 82 ± 4
ab 71 ± 5ab
10 90 ± 3
b 150 84 ± 2
ab 75 ± 2ab
200 82 ± 3ab 73 ± 3
ab 20 dS/m (220 mM NaCl) 83 ± 5
ab 78 ± 3ab
20 83 ± 2
b 250 87 ± 3
ab 76 ± 3ab
300 92 ± 1b 80 ± 2
b
30 81 ± 3b
400 81 ± 2ab 69 ± 2
a 40 dS/m (440 mM NaCl) 82 ± 4
ab 76 ± 4ab
40 92 ± 4
b 500 75 ± 3
a 62 ± 6a
Table 2. Relative growth rates (RGR) of Salicornia dolichostachya grown at varying salinities in hydroponic
culture (with Hoagland plus NaCl or diluted seawater) in a greenhouse or in an inland seawater drip-irrigation
system on the island of Texel. Growth was measured by increase in dry mass or ash-free dry mass. Plants were
grown for 42 d for the hydroponic culture experiment and for 40 d for the drip-irrigation experiment. Values are
mean ± S.E. of 4–9 replicates. Mean values with different letters indicate significant differences within the same
column (Tukey’s test, p < 0.05).

The interaction between NaCl treatment and carbon isotope discrimination did not differ
significantly between the expanding and expanded shoot parts (p = 0.066).
Figure 2. Effect of NaCl treatments on (A) leaf water
content (B) leaf succulence and stem diameter (3rd
succulent internode from the shoot base) of Salicornia
dolichostachya hydroponically grown at 50–500 mM
NaCl in the root medium for 42 d. Values are mean ±
S.E. of 7–9 replicates. ANOVA p-values were for: (A)
leaf water content p = 0.071, (B) succulence p < 0.05,
and stem diameter p = 0.074. Note that the scales on the
y-axis are different.
Figure 3. Effect of NaCl treatments on carbon isotope
discrimination in expanding and expanded shoot parts
of Salicornia dolichostachya hydroponically grown at
50–500 mM NaCl in the root medium for 42 d. Values
are mean ± S.E. of 7–9 replicates. Mixed model
regression analysis showed: treatment p < 0.05, and
plant part x treatment p = 0.066.
2.3.2. Water content, succulence and
stem diameter
Water content of succulent shoot
parts was calculated as the difference
between fresh and dry mass and is
expressed on a dry mass basis (Fig. 2A).
The water content did not change
significantly up to 400 mM NaCl in the
root medium, and there was a trend
towards a decrease in water content at 500
mM NaCl in the root zone (not statistically
significant, p = 0.071). Measurements of
succulence and stem diameter (Fig. 2B)
showed the highest values at 300 mM
NaCl in the root medium. Differences in
succulence between treatments were
statistically significant (p < 0.05),
differences in stem diameter were not (p =
0.074).
2.3.3. Carbon isotope discrimination
Values of carbon isotope
discrimination were measured in
expanding and expanded shoot parts (Fig.
3). Values of δ13
C significantly increased
(e.g. less negative values) in expanding
and expanded shoot parts with increasing
NaCl concentrations in the root medium.

Chapter 2
Salt tolerance in Salicornia 37
2.3.4. Leaf sap osmotic potential
Molarity of Na+, Cl
– and K
+ of expanding and expanded shoot parts (Table 3) was
calculated from the ion data and expressed on a water basis (the difference between fresh and
dry mass). Contributions of Na+ and Cl
– to the leaf sap osmotic potential (Table 3) were
calculated from the molarity data, assuming that Na+, Cl
– and K
+ in the plant are osmotically
active with an osmotic coefficient of 0.92 along the salinity range 50–500 mM NaCl
(Robinson and Stokes 1959). Na+ and Cl
– were estimated to account for 66–75% of the sap
osmotic potential of expanding shoot parts and for 68–83% of the sap osmotic potential of
expanded shoot parts.
The osmotic potential of expressed leaf sap significantly decreased as the osmotic
Treatment salinity
NaCl (mM)
Expanding shoot parts
Expanded shoot parts
Molarity (mM) Na+, Cl- and K+
contribution to Ψs (%)
Molarity (mM)
Na+, Cl- and K+
contribution to Ψs (%)
Na+ Cl- K+
Na+ Cl- K+
50
321 266 73
74
273 353 132
82
100
319 296 50
67
257 313 78
75
150
298 298 43
56
337 376 51
73
200
345 313 35
62
372 403 61
78
250
356 315 30
64
457 400 33
78
300
386 330 26
64
438 402 33
76
400
504 457 35
78
534 472 38
78
500 574 631 32 77 662 613 43 86
The osmotic potential of expressed leaf sap significantly decreased as the osmotic
potential of the solution decreased (Fig. 4). The difference between osmotic potential of sap
of expanding and expanded shoot parts and the osmotic potential of the root medium
Table 3. Molarity of Na+, Cl
– and K
+ in expanding and expanded shoot parts and the contribution of Na
+, Cl
–
and K+ to the osmotic potential of the shoot of Salicornia dolichostachya hydroponically grown at 50–500 mM
NaCl in the root medium for 42 d. The molarities of Na+, Cl
– and K
+ were calculated from the ion data. Values
are mean ± S.E. of 5–9 replicates. Kruskal–Wallis p–values were: p < 0.05 for the ion molarities.

-3.50
-3.00
-2.50
-2.00
-1.50
-1.00
-0.50
0.00
50 100 150 200 250 300 400 500
Osm
oti
c pote
nti
al (
MP
a)
Treatment NaCl (mM)
Expanding shoot tissueExpanded shoot tissueSolution
succulent shoots and between 168.5 and 275.9 μmol g–1
dm for roots, at 150 and 500 mM
NaCl in the root medium, respectively (data not shown). Expressed on a water basis, glycine
betaine concentrations were between 29.3 and 44.7 mM in the succulent shoot parts and
between 25.4 and 35.1 mM in the roots (Table 4) and not changing with increasing salinity,
although there was a trend (p = 0.054) towards higher concentrations of glycine betaine in
succulent shoot parts at 500 mM NaCl compared to the plants grown at 100–400 mM NaCl in
the root medium.
Treatment salinity NaCl (mM) Glycine betaine concentration (mM)
Shoot
Root
50
38.5 ± 6.1
28.3 ± 4.7
100
30.2 ± 2.9
25.9 ± 7.2
150
29.3 ± 0.9
25.4 ± 3.5
200
32.0 ± 2.6
28.8 ± 3.5
250
35.4 ± 2.7
28.4 ± 1.3
300
32.2 ± 0.5
29.3 ± 8.3
400
33.8 ± 2.9
33.0 ± 2.6
500 44.7 ± 3.1 35.1 ± 2.0
Figure 4. Effect of NaCl treatments on osmotic potentials of
expanding and expanded shoot parts of Salicornia
dolichostachya hydroponically grown at 50–500 mM NaCl
in the root medium for 42 d. Values are mean ± S.E. of 7–9
replicates. Mixed model regression analysis showed:
treatment p < 0.05, and plant partx treatment p > 0.05.
Table 4. Glycine betaine concentrations expressed on a water basis (mM) in shoots and roots of Salicornia
dolichostachya hydroponically grown with 50–500 mM NaCl in the root medium for 42 d. Concentrations of
glycine betaine at commencement of the treatments were 14.9 ± 1.8 in shoots and 15.5 ± 1.9 mM in roots.
Values are mean ± S.E. of 3 replicates. ANOVA p-values were for: shoots p = 0.054 and for roots p > 0.05.
significantly decreased from 1.574 and
1.521 MPa, respectively, at 50 mM NaCl
in the root medium to 0.636 and 0.744
MPa, respectively, at 500 mM NaCl in
the root medium. The osmotic potential
of both shoot parts reacted in the same
way to the NaCl treatments.
2.3.5. Glycine betaine
Concentrations of glycine betaine
expressed on dry mass basis ranged
between 343 and 486 μmol g–1
dm for

Chapter 2
Salt tolerance in Salicornia 39
2.3.6. Ions in the different plant parts
Concentrations of Na+, Cl
–, K
+, and Mg
2+ were determined in roots, woody shoots,
and expanding and expanded shoot parts. Na+, Cl
–, K
+ concentrations expressed on a water
basis in expanding and expanded shoot parts are shown in table 3, concentrations in woody
shoots and roots are not shown. Na+ and Cl
– significantly increased in all of these plant parts
when NaCl concentrations in the root medium were increased. In contrast to Na+ and Cl
–,
concentrations of K+ decreased in all plant parts when NaCl concentrations in the root
medium were increased from 50 to 150 mM NaCl and remained fairly stable when
concentrations were further increased from 150 to 500 mM NaCl.
Figure 5. Effect of NaCl treatments on (A) Na+:K
+–ratio
and (B) K+–selectivity of expanding and expanded shoot
parts of Salicornia dolichostachya hydroponically grown at
50–500 mM NaCl in the root medium for 42 d. Values are
mean ± S.E. of 7–9 replicates. Mixed model regression
analysis showed in (A) and (B): treatment p < 0.05, and
plant part x treatment p < 0.05.
Concentrations of Mg2+
significantly decreased in succulent
shoots and roots when NaCl
concentrations in the root medium were
increased from 50 to 150 mM NaCl (data
not shown). Mg2+
concentrations in
woody shoot parts did not change with
increasing salinity in the root medium.
The Na+:K
+-ratio of expanding and
expanded shoot parts significantly
increased upon increasing NaCl
concentrations in the root medium (Fig.
5A). There was a significant interaction
between treatment and plant part (p <
0.05). Selectivity for K+ over Na
+ in the
plant was calculated as the ratio of K+
concentrations in expanding or expanded
shoot parts to that of the root
medium, divided by the ratio of Na+ concentrations in expanding or expanded shoot parts in the plant
to that of the medium (Fig. 5B). K+-selectivity (SK+,Na+) significantly increased in both shoot
parts with increasing NaCl concentrations in the root medium.

2.4. Discussion
2.4.1. Growth
The present study shows that growth of Salicornia dolichostachya increased when salt
concentrations in the root medium were increased from 50 to 300 mM NaCl (Fig. 1). Optimal
growth occurred in the range from 100 to 300 mM NaCl, and growth declined when
concentrations were further increased to 500 mM NaCl. The basis upon which growth is
expressed in succulent halophytes can be deceptive. If growth is expressed on fresh mass or
dry mass basis, a high water content and a large contribution of inorganic ions, Na+, Cl
–, K
+
(i.e. ash), can obscure an organic growth effect (Yeo and Flowers 1980). Optimal growth
expressed as dry mass at concentrations of 50–250 mM NaCl in the root medium has been
observed for a substantial number of dicotyledonous halophytes, to a lesser extent growth
stimulation of organic dry mass has been reported (cf. Flowers and Colmer 2008; Flowers et
al. 1986). The growth optimum at 300 mM NaCl in the root medium in this study was the
same regardless if growth was expressed on fresh mass, dry mass or ash-free dry mass basis,
indicating that the observed growth stimulation is not merely based on inorganic-ion
accumulation. This has also been previously reported for S. bigelovii (Ayala and O’Leary
1995). Nevertheless, the contribution of ash compared with shoot dry-mass increased
gradually with increasing NaCl in the root medium, resulting in lower values of ash-free dry
mass at higher (400–500 mM NaCl) salt concentrations in the root medium (Fig. 1C).
Regardless of large contributions of inorganic ions to dry mass, most salinity growth
experiments performed with Salicornia spp. only report growth expressed on a dry-mass
basis. I summarized the literature data on growth response (expressed on dry-mass basis) of
Salicornia spp. to external salinity (Table 1). Of the 20 papers included in table 1, for a
description of the criteria for literature search see caption of Table 1, 16 papers reported
better growth of plants when the salinity of the external medium was higher than the salinity
of the control treatment, the latter being defined as less than 10 mM NaCl in the root
medium. In contrast, four papers did not find better growth in response to salinity at all. The
reported growth stimulation in response to salinity differed in extent: between 102% and
405% of the control dry-mass, and occurred at different external salt concentrations: ranging
from 85 to 600 mM NaCl. There were, as well, large differences in absolute values of dry
mass between papers referring to the same species of Salicornia e.g.; absolute dry-mass

Chapter 2
Salt tolerance in Salicornia 41
values ranged from 2.3 mg plant–1
for S. europaea at 200 mM NaCl in the root medium for 45
d (Aghaleh et al. 2009) to 13.8 g plant–1
for S. europaea at 300 mM NaCl in the root medium
for 45d (Balnokin et al. 2005).
The taxonomy of Salicornia spp. is described as notoriously difficult (Davy et al.
2001; Kadereit et al. 2007) with large phenotypic differences within single species and
morphological parallelism between different species, which can readily lead to wrong
identification. Identification of S. dolichostachya in this study was established based on the
morphological features described in Huiskes et al. (1985) and confirmed by Dr Henk Schat,
one of the authors of this article. Singh et al. 2014 showed based on analysis of External
Transcribed Spacer (EST) sequence that the species used in this study is indeed S.
dolichostachya (Singh et al. 2014). As might be expected, environmental factors also
influence the shape and height of the growth response curve (Barbour 1970), such as,
nitrogen availability (Rozema et al. 1987), availability of other minerals in the culture
medium (e.g., Ca2+
, Munns and Tester 2008) and light intensity (Ushakova et al. 2008).
Furthermore, differences in the experimental treatments influence the recorded growth (rate),
e.g. the duration of the treatments and age of the plants at the start of the treatment, because
differences in biomass between salinity treatments become more pronounced with time.
Another reason for the different outcome between studies may have risen from the number of
NaCl treatments used and the NaCl concentration intervals between the treatments. A limited
number of concentrations and wide intervals allow only a coarse indication of the response
curve. Finally, another complicating factor with comparing growth curves of species between
different experimental setups lies in the choice of an appropriate control. In this study, 14 d
after the start of the salt treatment, the plants at 0 and 5 mM NaCl in the root medium started
to flower, ceased to grow and looked unhealthy, indicated by a light brown or yellow color
and wilting. The plants received only trace quantities of NaCl present in the potting soil
during the first 61 d of the pre-cultivation period, and in the 14 d before start of the salt
treatment they were grown on water culture with 0.01 mM Na+. Poor survival of S. bigelovii
at low Na+ concentrations was also found by Webb (1966). Yeo and Flowers (1980) and
Subbarao et al. (2003) stated that NaCl-free solutions can be regarded as deficient for
dicotyledonous halophytes that have optimal growth at NaCl concentrations above 50 mM. In
contrast, numerous coastal plants demonstrate optimal growth at 0 mM NaCl in hydroponic
culture (Rozema and van Diggelen 1991). In the literature, it has been concluded that there is
no obligate salt-requirement for growth of dicotyledonous halophytes (Barbour 1970;
Flowers et al., 1977), except for plants with a C4-photosynthetic pathway, which require

small amounts (< 0.1 mM) of Na+ for regeneration of phosphoenolpyruvate (Brownell and
Crosslan 1972). However, the observation that 0 and 5 mM NaCl in the external environment
was insufficient to maintain growth of S. dolichostachya suggests a Na+ requirement for
growth in this species. The precise nature of this apparent physiological Na+ dependency is
unknown. NaCl concentrations in the environments where Salicornia spp. naturally occur
generally range from approximately 250 mM in early spring to as much as 750 mM in
autumn (Mahall and Park 1976), and were found to be seldom lower than 20 mM (Silva et al.
2007). A good control would be to choose a NaCl concentration towards the lower values in
this range, still sufficient for the plants to sustain some growth. Overall, comparing growth
curves from different experiments requires a standardized way of conducting growth
experiments and expressing growth.
It has been suggested that, as a consequence of salt tolerance, halophytes might grow
slowly (Niu et al. 1995). In this study, the highest RGRs, 0.092 g g–1
d–1
expressed on a dry
mass basis and 0.080 g g–1
d–1
on an ash-free dry mass basis, coincided with the optimal
external salinity (300 mM NaCl), as was found for growth expressed on fresh mass, dry mass
and ash-free dry mass basis (Fig. 1). The RGR values measured in the outside seawater drip-
irrigation system were compared to the RGR values found in the hydroponic greenhouse
experiment (Table 2). These RGR values were in the same range, which indicated that growth
in the greenhouse experiment was not restricted by e.g. light intensity and relative humidity
compared to the outside growth experiment. RGR values expressed on ash-free dry mass
basis were lower than RGR values expressed on dry mass basis, but showed the same pattern.
Only a few of the previous studies conducted with Salicornia spp. in hydroponic culture
reported RGR values. The highest RGR values reported (expressed on an ash-free dry mass
basis) were for S. bigelovii; 0.160 g g–1
d–1
at 200 mM NaCl in the root medium (Ayala and
O’Leary 1995) and for S. europaea; ~0.3 g g–1
d–1
during 7 d at 0 mM NaCl after 21 d of
growth at 540 mM NaCl (Glenn and O’Leary 1984).
To investigate if a trade-off between salt tolerance and RGR exists, I measured the
RGR (Table 2), and compared it to RGR values for a variety of plants species in the
literature. When I compared these RGRs and the RGR of S. dolichostachya in this study to
the potential RGRs found in a comparison of over 100 wild plant species (though not in
relation the salinity, Grime and Hunt 1975), the RGRs of Salicornia spp. laid towards the
middle (S. dolichostachya, this experiment) or higher range (S. bigelovii, Ayala and O’Leary
1995; S. europaea, Glenn and O’Leary 1984) of the RGR values in the comparison of Grime
and Hunt (1975). Grime and Hunt (1975) reported RGRs between 0.05 g g–1
d–1
and 0.3 g g–1

Chapter 2
Salt tolerance in Salicornia 43
d–1
. This implies that a high salt tolerance is not necessarily linked with a low growth rate.
This also agrees with reports on the yield of halophytes (a.o. S. bigelovii) under saline field
conditions being comparable with those of conventional crops (cf. Glenn et al. 1999), which
confirms the potential use of Salicornia in saline agriculture.
2.4.2. Morphological and physiological aspects of salt tolerance in S. dolichostachya
Both leaf succulence (water content per unit leaf area) and leaf diameter in S.
dolichostachya showed the highest values at 300 mM NaCl in the root medium (Fig. 2),
coinciding with the NaCl concentration at which optimal growth was observed in this
experiment. Increased leaf succulence and stem diameter may be achieved by an increase in
the size of the cells and the relative size of their vacuoles, or an increase in the number of cell
layers (Flowers et al. 1986; Shabala and Mackay 2011). It has been suggested that an
increase in thickening of the shoots in response to salinity is a direct response to provide an
increased storage area for ions (i.e. Na+ and Cl
–) (Jennings 1968) and to reduce the surface
area, which leads to an increased water use efficiency.
Carbon isotope discrimination is often related to stomatal conductance: more carbon
isotope discrimination occurs when stomata are open. In this study, carbon isotope
discrimination decreased (i.e. δ13
C values increased) linearly with increased salinity in the
root medium (Fig. 3), indicating stomatal closure at higher salinities. Open stomata facilitate
water loss and at the same time discrimination against 13
CO2. Lower discrimination against
13C is correlated with closure of stomata (Farquhar et al. 1989) and, as soon as transpiration is
decreased, also with increased long-term water use efficiency. Decreased carbon isotope
discrimination with increasing salinity has previously been reported for S. bigelovii, (Ayala
and O’Leary 1995) and for S. rubra (Khan et al. 2001). Note that the lowest δ13
C values in
Fig. 4 (at 500 mM NaCl in the root medium) did not coincide with the highest values for
succulence and stem diameter (at 300 mM NaCl), although these three factors are all assumed
to be correlated with water use efficiency. As I did not measure plant transpiration, I was
unable to calculate water use efficiency as the ratio of biomass increase per unit of water,
therefore, I do not know how water use efficiency changed with increasing salinity.
One of the biggest challenges of growing in a saline environment is to assure water
uptake. This means that plants have to adjust their water potential to a level that is lower (e.g.
more negative) than that of the soil water. The total water potential of the plant is described
by the formula: ψw = ψs + ψp, where; ψw is the total water potential, ψs is the osmotic potential

and ψp the turgor pressure. Adjustment of the water potential to a lower (more negative) level
can be achieved by osmotic adjustment (e.g., through ion uptake), decreased turgor or
decreased cell volume. Osmotic adjustment is the main factor in lowering the water potential,
which is in dicotyledonous halophytes largely achieved by accumulation of Na+ and Cl
– in
the vacuole (Gorham et al. 1980, Flowers et al. 1977; Greenway and Osmond 1972). In this
study, S. dolichostachya was able to keep the osmotic potential of the leaves more negative
than the water potential of the external solution (Fig. 3). The contributions of the major ions
Na+ and Cl
– to the osmotic potential increased significantly with increasing external salt
concentrations (Table 2). Concentrations of Na+ and Cl
– in expanding shoot parts at 50–500
mM NaCl in the root medium (Table 3) were between 321–574 mM and 266–631 mM,
respectively. In expanded shoot parts, Na+ and Cl
– concentrations were slightly higher at 500
mM NaCl in the root medium. Molality of the cell sap was calculated using the water content
and the ion data, assuming that Na+ and Cl
– are predominantly present in the vacuole
(Flowers et al. 1986), and that these ions are evenly distributed in cells of different organs
and tissues, although the latter can be argued against (Conn and Gilliham 2010; Fricke et al.
1996; Karley et al. 2000). Taken together, Na+ and Cl
– contributed between 66–75 % and 68–
83% to the measured osmotic potential, in expanding and expanded shoot parts, respectively.
Note that in this study, the water potential was not measured, but Ayala and O’Leary (1995)
showed in a study with S. europaea a strong linear relationship between water potential and
osmotic potential and no significant effect of turgor pressure over an external salinity range
of 5–500 mM NaCl. In addition to increased accumulation of Na+ and Cl
–, concentrating ions
in the cell sap due to lower water content could be an additional mechanism in lowering the
water potential at above optimal salinity, as found for S. europaea (Glenn and O’Leary
1984).
It is generally assumed that storage of Na+ and Cl
– is restricted to the vacuoles to
avoid toxic salt concentrations in the cytoplasm (Flowers et al. 1977; Greenway and Osmond
1972). Other organic solutes, like glycine betaine, are thought to accumulate in the cytoplasm
to maintain water-potential equilibrium within the cell (Storey and Wyn Jones 1979). They
might also serve to stabilize enzymes in the presence of salts (Jolivet et al. 1982; Pollard and
Wyn Jones 1979), as ROS scavenger (cf. Bohnert et al. 1995) or as ion channel regulator
(Cuin and Shabala 2007). Glycine betaine is thought to be the main organic osmolyte in
Salicornia spp. (Gorham et al. 1980) and in other species of the family of the Amaranthaceae
(Weretilnyk et al. 1989). In this experiment, the concentrations of glycine betaine in
succulent shoots and roots expressed on dry mass basis are consistent with the concentrations

Chapter 2
Salt tolerance in Salicornia 45
previously reported in the literature (S. europaea, Gorham et al. 1980; S. europaea,
Moghaieb et al. 2004). Glycine betaine concentrations expressed on a dry mass basis differed
significantly between treatments in both shoots and roots. However, assuming that glycine
betaine in the cell is dissolved in water, expressing concentrations on a water basis makes
more sense. When expressed on a water basis, glycine betaine concentrations were in
succulent shoots between 29.3 and 44.7 mM and in roots between 25.4 and 35.1 mM (Table
4). Glycine betaine concentrations did not differ significantly between the treatments,
although there was a trend towards higher glycine betaine concentrations in shoots at 500
mM NaCl in the root medium (p = 0.054). Previous studies with dicotyledonous halophytes
reported either increased accumulation of glycine betaine with increasing salinity (S.
europaea, Moghaieb et al. 2004; A. spongiosa, Storey and Wyn Jones 1975) or, as in this
study, no correlation between glycine betaine accumulation and increased salinity (S.
monoica, Storey and Jones 1975). Assuming that glycine betaine is solely present in the
cytoplasm (Hall et al. 1978) and that the volume of the cytoplasm is approximately 10% of
the cell volume (Hajibagheri et al. 1984) then glycine betaine concentrations would be 10-
fold higher, between 293 and 447 mM and thus osmotically relevant. Such concentrations
would be in a range capable of balancing a substantial part, ~50 % in this study at an external
salinity between 50 and 400 mM, of the osmotic potential generated in the vacuole by Na+
and Cl–. It is likely that glycine betaine together with other compatible solutes (Gorham et al.
1980; Hasegawa et al. 2000) can generate a sufficient osmotic potential to maintain the water
potential equilibrium within the cell. Interestingly, the glycine betaine concentrations did not
change between the different salinity treatments. However, the concentrations of NaCl and
glycine betaine showed more or less the same trend across the treatment range, which is in
agreement with a role of glycine betaine in osmotic adjustment of the cytoplasm or, more
specifically, that it functions to counterbalance salt accumulation in the vacuole.
High external Na+ concentrations can lead to K
+ deficiencies in plants (Flowers et al.
1977) because of the great similarity of these monovalent cations in physical and chemical
properties. K+ is regarded as an essential ion for enzyme functioning, whereas only plants
with a C4-photosynthetic pathway require Na+ as a micronutrient (Brownell and Crosslan
1972). However, Na+ can be regarded an essential ion in halophytes like Salicornia (as
discussed above). In this study, the Na+:K
+-ratio in expanding and expanded shoot parts
increased significantly with increasing NaCl concentrations in the root medium over the
range of 50–500 mM NaCl (Fig. 5A). The leaf Na+:K
+-ratios of S. dolichostachya were much
higher compared to Na+:K
+-ratios of most species (Flowers et al. 1986). The halophytic

species of the Amaranthaceae family together with the members of the Azoceae have
generally the highest Na+:K
+-ratios, which suggest that there must be a specific trait present
in these families to be able to sustain such high ratios, which are detrimental to most other
species. Although absolute values of Na+ increased and K
+ decreased in S. dolichostachya,
K+-selectively (SK+,Na+) significantly increased upon increasing NaCl concentrations in the
root medium in both expanding and expanded shoot parts (Fig. 5B). The increase in SK+,Na+
in expanding shoot parts was gradual upon increasing salinity, whereas the SK+,Na+ in
expanded shoot parts increased in general over the salinity range of 50–500 mM NaCl, but
reached its lowest values at 250 mM NaCl in the root medium. High K+ affinity has been
reported in a dicotyledonous halophyte (Suaeda monoica, Storey and Wyn Jones 1979). This
increased SK+,Na+ indicates that S. dolichostachya possesses a mechanism to efficiently
absorb K+ in the presence of high external Na
+ levels and to partition Na
+ and K
+ between
different types of shoots.

Chapter 2
Salt tolerance in Salicornia 47
2.5. Conclusions
In this study, S. dolichostachya showed growth stimulation in the range from 100 to
300 mM NaCl in the root medium. At 50 and 500 mM NaCl in the root medium, dry mass
was reduced by 48 and 50% respectively, in comparison with the dry mass at 300 mM root
zone salinity. The growth response curve upon salinity was the same whether expressed as
fresh mass, dry mass or ash-free dry mass, although the contribution of ions to the dry mass
increased with increasing external salinity. The 0-mM and 5-mM NaCl treatments were not
sufficient for the plants to maintain growth, suggesting a salt requirement for S.
dolichostachya for prolonged periods of growth. No general conclusion based on a
comparison between growth response curves of Salicornia spp. from the literature could be
drawn, which might be due to differences in cultivation and experimental conditions. The
highest succulence and thickest stem diameter coincided with the growth optimum at 300
mM NaCl, indicating a correlation between these parameters and the salt-stimulated growth
of S. dolichostachya. Stomatal aperture (as inferred from δ13
C) changed in response to salt
treatment, stomata were gradually closed with increasing external salinity. The leaf sap
osmotic potential gradually decreased over the salinity range of 0–500 mM NaCl. Leaf sap
osmotic potential was chiefly lowered by accumulation of Na+ and Cl
–. Glycine betaine
concentrations did not change significantly upon salinity. Na+:K
+-ratio and K
+-selectivity
increased over the salinity range and differed between expanding and expanded shoot parts,
suggesting partitioning of Na+ and K
+ between different shoot parts.