Embed Size (px)
Citation preview
Page 1/25
Genome-Wide Association Analysis RevealsGenetic Variations and Candidate Genes Associatedwith Salt Tolerance Related Traits in GossypiumHirsutumPeng Xu
Jiangsu Academy of Agricultural SciencesQi Guo
Jiangsu Academy of Agricultural SciencesShan Meng
Jiangsu Academy of Agricultural SciencesXianggui Zhang
Jiangsu Academy of Agricultural SciencesZhenzhen Xu
Jiangsu Academy of Agricultural SciencesWangzhen Guo
Nanjing Agricultural UniversityXinlian Shen ( [email protected] )
Chinese Academy of Agricultural Sciences https://orcid.org/0000-0002-0111-9850
Research article
Keywords: Gossypium hirsutum, Genome-wide association mapping, Genotyping By-Sequencing, salttolerance, Virus-induced gene silencing assay
Posted Date: September 8th, 2020
DOI: https://doi.org/10.21203/rs.3.rs-66236/v1
License: This work is licensed under a Creative Commons Attribution 4.0 International License. Read Full License
Version of Record: A version of this preprint was published at BMC Genomics on January 6th, 2021. Seethe published version at https://doi.org/10.1186/s12864-020-07321-3.
Page 2/25
AbstractBackground: As a pioneer industrial crop in saline-alkali lands, cotton is more resistant to salt anddrought stresses. However, abiotic stresses still have signi�cant negative effects on its growth anddevelopment. It is therefore important to breed salt tolerance varieties which can help accelerate theimprovement of cotton production. The development of molecular markers linked to causal genes hasprovided an effective and e�cient approach for improving salt tolerance.
Results: In this study, a genome-wide association study of salt tolerance related traits at seedling stagewas performed based on two years of phenotype identi�cation for 217 representative upland cottoncultivars by Genotyping By-Sequencing platform. A total of 51,060 polymorphic SNPs unevenlydistributed in 26 chromosomes were screened across the cotton cultivars, and 25 associations with 27SNPs scattered over 12 chromosomes were detected signi�cantly (-log10
p>4) associated with three salttolerance related traits in 2016 and 2017. Among these, the associations on chromosome A13 and D08for RPH, A07 for RSFW, A08 and A13 for RSDW were expressed in both two environments, indicating thatthey were likely to be stable QTLs. A total of 12 salt-induced candidate genes were identi�ed differentiallyexpressed by the combination of GWAS and transcriptome analysis. Three promising genes wereselected to conduct preliminary function veri�cation of salt tolerance. The increase of GH_A13G0171-silenced plants in salt related traits under salt stress indicated its negative function in regulating the saltstress response.
Conclusions: These results provided important genetic variations and candidate genes for accelerate theimprovement of salt tolerance in cotton.
BackgroundThe competition for arable land between food crops and cotton (Gossypium spp.) has existed for a longtime in China. However, as population continues to grow, the emphasis on food security has inadvertentlymoved cotton production to more marginal soils in saline-alkali areas and coastal beaches. Cotton as thelargest source of textiles �ber in the world is more resistant to abiotic stresses such as high salt anddrought stresses than other crop. However, excessive salt in the soil can severely affects its growth anddevelopment of cotton plants [1], with injury resulting in a reduction in �ber yield by as much as 60% [2].Therefore, breeding for cotton varieties with improved salt tolerance could alleviate the con�ict betweenfood crops and cotton by reclaiming and utilizing saline-alkali coastal lands for production. Similarly, inthe northwestern inland cotton production region of China, the availability of salt tolerant varieties wouldexpand the area of cotton production by promoting the synchronous growth of food crops and cotton.
The genetic architecture of salt tolerance is one of the most important subjects in plant science. Salttolerance is a complex quantitative trait, which is controlled by multiple genes and involves a variety ofphysiological and biochemical metabolic pathways in cotton. In addition, the expression of each gene issensitive to external environment. In the current study, the main conventional breeding approaches for

Page 3/25
developing salt tolerant varieties are screening and collecting salt-tolerant germplasm resources, thentransferring elite loci by hybridization, composite hybridization and backcrossing methods. The progressof conventional breeding of salt tolerance in upland cotton is impeded due to the lack of high salt-tolerantresources [3], low heritability [4], genetic complexity, and the di�culties in phenotyping [5].
The development of molecular markers linked to causal genes for a trait has provided an effective ande�cient approach for improving quantitative traits. Once identi�ed, markers linked to a quantitative traitlocus (QTL) such as for salt tolerance can then serve as a selection tool for rapid and e�cient marker-assisted selection (MAS). QTL mapping via bi-parental populations is an important method forquantitative trait research, and has been widely employed to map a number of traits including salttolerance in various crops [6]. In addition to QTL mapping, association mapping based on linkagedisequilibrium (LD) is another approach for detecting molecular markers tightly linked with quantitativetraits in a natural germplasm population. Association analysis is time- and cost-effective, and can minefor genetic variations existing in the natural population, and more importantly, it takes advantage of therecombination information that has accumulated in the natural population over the long-term evolutionprocess, thus achieving a higher mapping resolution, possibly identifying the causative genes [7, 8].Because of its effectiveness in QTL identi�cation, association mapping has been widely used in cropspecies and plays an important role in molecular breeding [9–14].
Genotyping By-Sequencing (GBS) is a reduced representation genotyping platform, and has a broadapplication in crop genetics and breeding [15–18]. In general, the GBS approach begins with anenzymatic digestion to reduce genome complexity using barcoding restriction enzymes, then performsmultiple sequencing of barcoding DNA fragments on the high-throughput Next-Generation Sequencingplatform. A bioinformatics analysis of indexed sequence reads is followed to identify genetic variants.Finally, genetic diversity analysis is carried out based on a sample-by-variant matrix [19]. GBS is apowerful and cost-effective tool to assess variations across populations.
Since the �rst molecular marker-based genetic map of cotton published in 1994 [20], cotton scientistshave identi�ed a large number of important agronomic traits QTLs, including �ber quality traits, yieldtraits, and disease resistance. However, only limited reports have been published on salt tolerance incotton [21–25]. Herein, we reported the genome-wide association mapping of salt tolerant QTLs duringthe seedling stage performed over two years of phenotyping on 217 representative upland cottoncultivars. These results provided important genetic variations and candidate genes for accelerating theimprovement of salt tolerance in cotton.
Results
Phenotypic diversity analysisIn order to evaluate the phenotypic variation of salt tolerance related traits in the association mappingpopulation, we analyzed 3 traits related to salt tolerance in two years. To determine the salt tolerance, the
Page 4/25
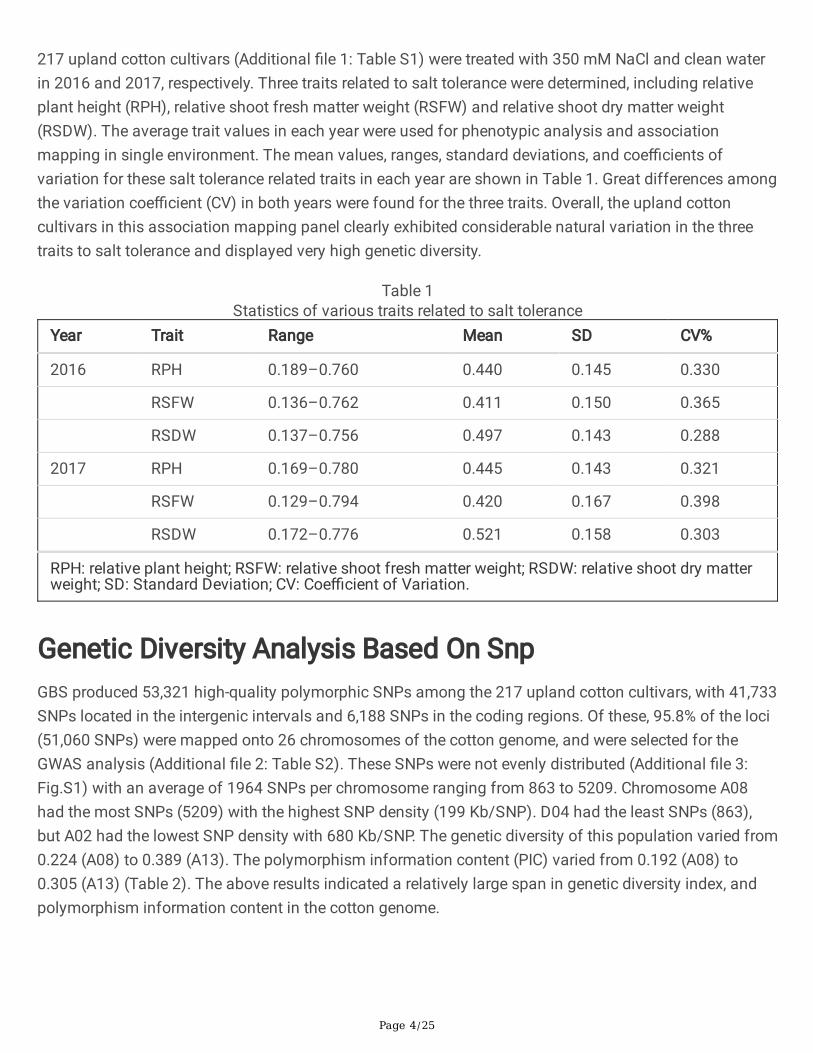
217 upland cotton cultivars (Additional �le 1: Table S1) were treated with 350 mM NaCl and clean waterin 2016 and 2017, respectively. Three traits related to salt tolerance were determined, including relativeplant height (RPH), relative shoot fresh matter weight (RSFW) and relative shoot dry matter weight(RSDW). The average trait values in each year were used for phenotypic analysis and associationmapping in single environment. The mean values, ranges, standard deviations, and coe�cients ofvariation for these salt tolerance related traits in each year are shown in Table 1. Great differences amongthe variation coe�cient (CV) in both years were found for the three traits. Overall, the upland cottoncultivars in this association mapping panel clearly exhibited considerable natural variation in the threetraits to salt tolerance and displayed very high genetic diversity.
Table 1Statistics of various traits related to salt tolerance
Year Trait Range Mean SD CV%
2016 RPH 0.189–0.760 0.440 0.145 0.330
RSFW 0.136–0.762 0.411 0.150 0.365
RSDW 0.137–0.756 0.497 0.143 0.288
2017 RPH 0.169–0.780 0.445 0.143 0.321
RSFW 0.129–0.794 0.420 0.167 0.398
RSDW 0.172–0.776 0.521 0.158 0.303
RPH: relative plant height; RSFW: relative shoot fresh matter weight; RSDW: relative shoot dry matterweight; SD: Standard Deviation; CV: Coe�cient of Variation.
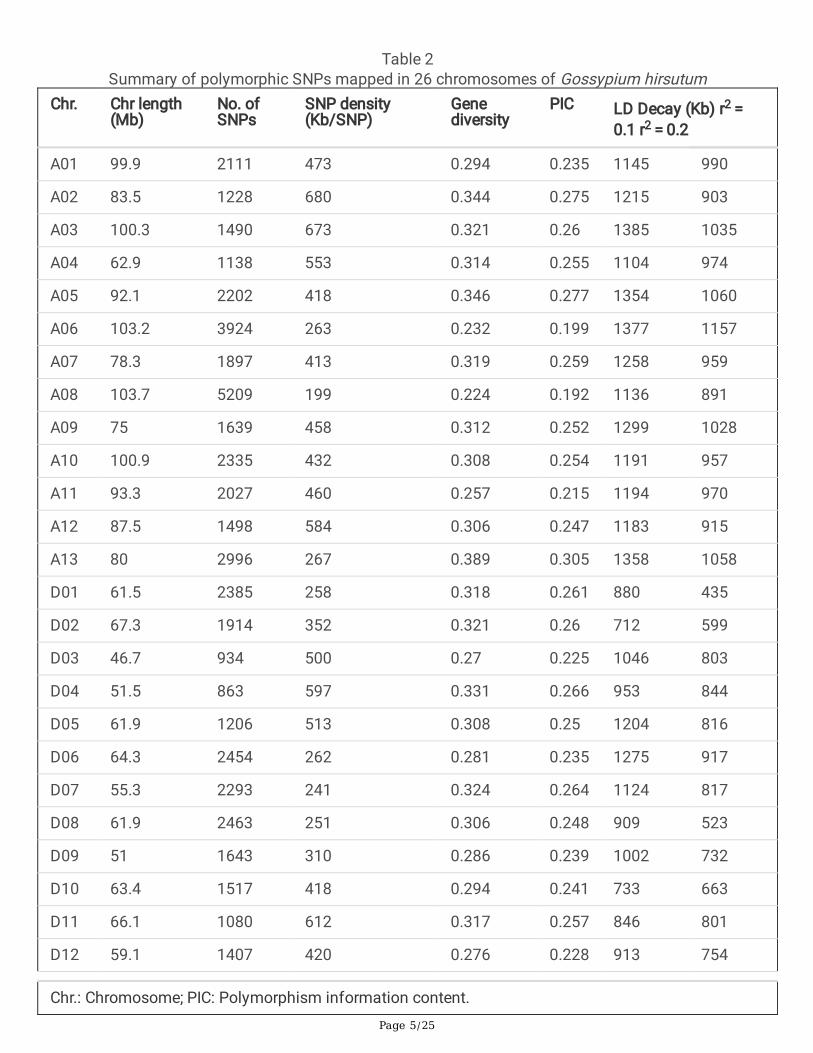
Genetic Diversity Analysis Based On SnpGBS produced 53,321 high-quality polymorphic SNPs among the 217 upland cotton cultivars, with 41,733SNPs located in the intergenic intervals and 6,188 SNPs in the coding regions. Of these, 95.8% of the loci(51,060 SNPs) were mapped onto 26 chromosomes of the cotton genome, and were selected for theGWAS analysis (Additional �le 2: Table S2). These SNPs were not evenly distributed (Additional �le 3:Fig.S1) with an average of 1964 SNPs per chromosome ranging from 863 to 5209. Chromosome A08had the most SNPs (5209) with the highest SNP density (199 Kb/SNP). D04 had the least SNPs (863),but A02 had the lowest SNP density with 680 Kb/SNP. The genetic diversity of this population varied from0.224 (A08) to 0.389 (A13). The polymorphism information content (PIC) varied from 0.192 (A08) to0.305 (A13) (Table 2). The above results indicated a relatively large span in genetic diversity index, andpolymorphism information content in the cotton genome.
Page 5/25
Table 2Summary of polymorphic SNPs mapped in 26 chromosomes of Gossypium hirsutum
Chr. Chr length(Mb)
No. ofSNPs
SNP density(Kb/SNP)
Genediversity
PIC LD Decay (Kb) r2 = 0.1 r2 = 0.2
A01 99.9 2111 473 0.294 0.235 1145 990
A02 83.5 1228 680 0.344 0.275 1215 903
A03 100.3 1490 673 0.321 0.26 1385 1035
A04 62.9 1138 553 0.314 0.255 1104 974
A05 92.1 2202 418 0.346 0.277 1354 1060
A06 103.2 3924 263 0.232 0.199 1377 1157
A07 78.3 1897 413 0.319 0.259 1258 959
A08 103.7 5209 199 0.224 0.192 1136 891
A09 75 1639 458 0.312 0.252 1299 1028
A10 100.9 2335 432 0.308 0.254 1191 957
A11 93.3 2027 460 0.257 0.215 1194 970
A12 87.5 1498 584 0.306 0.247 1183 915
A13 80 2996 267 0.389 0.305 1358 1058
D01 61.5 2385 258 0.318 0.261 880 435
D02 67.3 1914 352 0.321 0.26 712 599
D03 46.7 934 500 0.27 0.225 1046 803
D04 51.5 863 597 0.331 0.266 953 844
D05 61.9 1206 513 0.308 0.25 1204 816
D06 64.3 2454 262 0.281 0.235 1275 917
D07 55.3 2293 241 0.324 0.264 1124 817
D08 61.9 2463 251 0.306 0.248 909 523
D09 51 1643 310 0.286 0.239 1002 732
D10 63.4 1517 418 0.294 0.241 733 663
D11 66.1 1080 612 0.317 0.257 846 801
D12 59.1 1407 420 0.276 0.228 913 754
Chr.: Chromosome; PIC: Polymorphism information content.

Page 6/25
Chr. Chr length(Mb)
No. ofSNPs
SNP density(Kb/SNP)
Genediversity
PIC LD Decay (Kb) r2 = 0.1 r2 = 0.2
D13 60.5 1207 501 0.287 0.236 1325 988
Total 1931.1 51060 427 0.303 0.248 1120 869
Chr.: Chromosome; PIC: Polymorphism information content.
Population Structure And Linkage Disequilibrium AnalysisIt is important for genome-wide association mapping to control the effect of population structure,because population strati�cation could eliminate spurious associations between genotypes andphenotypes [26, 27]. STRUCTURE software was used to calculate the Bayesian clustering from K = 1 to 10for �ve repetitions. LnP (D) value continued to increase from K = 1 to K = 10 without a signi�cantin�ection point (Fig. 1a). However, there was an obvious spike at the value of ΔK = 3 (Fig. 1b), suggestingthat the population could be divided into 3 subgroups (Fig. 1c). Taking the corresponding Q matrix at k = 3 as the covariate could reasonably eliminate spurious association effects and improve the associationmapping accuracy.
The LD distribution among chromosomes of the 217 upland cotton cultivars was shown in Table 2. TheLD decay distance was 869 Kb and 1120 Kb when the r2 dropped to 0.2 and 0.1, respectively. The LDdecay distance was not evenly distributed among chromosomes, ranged from 435 Kb (D01) to 1157 Kb(A06) when r2 was set at 0.2 and ranged from 712 Kb (D02) to 1377 Kb (A06) when r2 was set at 0.1, theoverall LD decay in the At subgenome was signi�cantly higher than that in the Dt subgenome.
Association AnalysisIn order to explore the genetic factors underlying salt tolerance, the mixed linear models (MLMs) wasperformed by simultaneously accounting for population structure and relative kinship matrix to conduct aGWAS. A total of 25 signi�cant associations (-log10
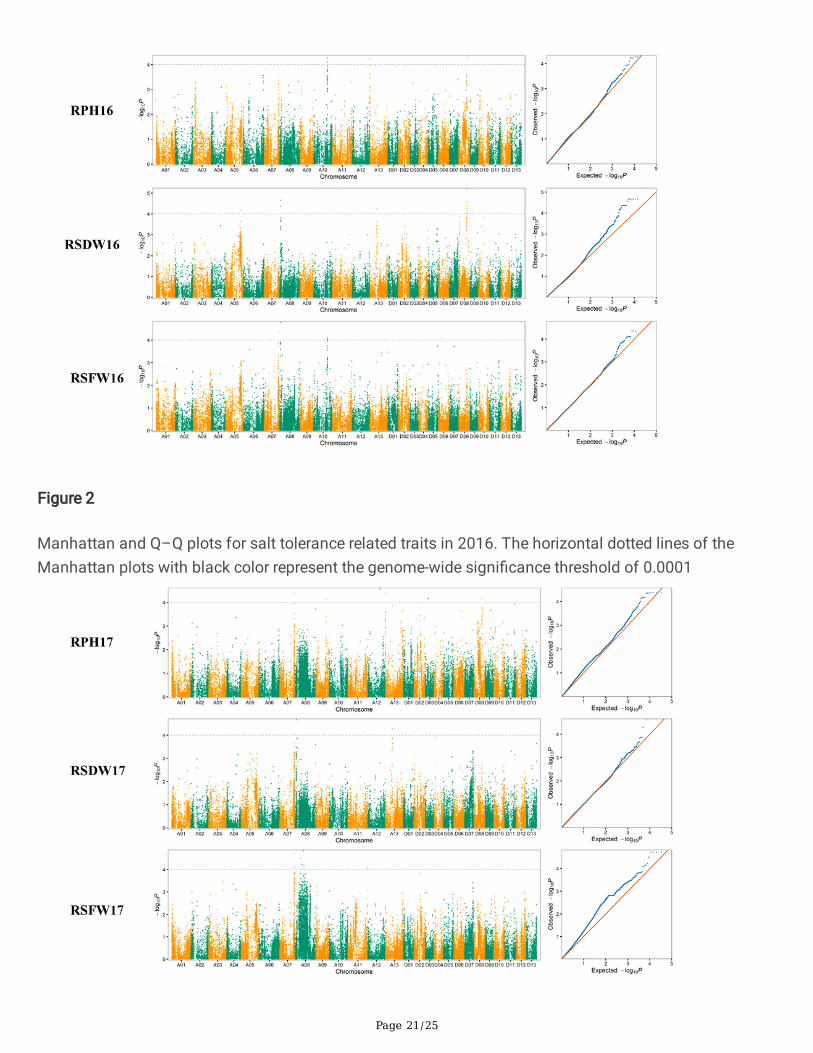
p > 4) with 27 signi�cant SNPs located onchromosomes A05, A07, A08, A09, A10, A11, A12, A13, D02, D03, D06, and D09 were detected for thethree salt tolerance related traits in the 2016 and 2017 dataset. Eleven associations with 12 SNPs weredetected in 2016 (Fig. 2) and nine associations with 9 SNPs were detected in 2017 (Fig. 3). In addition,�ve associations with 6 SNPs were detected in both 2016 and 2017 dataset. The phenotypic varianceexplained (PVE) by individual QTL ranged from 1.29–7.00% (Table 3).

Page 7/25
Table 3Summary of SNPs signi�cantly associated with salt tolerance related traits
Traits Chr. Site Allele MAF -Log10(P) PVE Environment
RPH A10 84786908 C/T 0.15(T) 4.27 5.67 2016
A10 84851927 G/A 0.20(A) 4.10 4.31 2016
A13 1869056 C/G 0.33(C) 4.22, 4.36 4.41,4.93 2016, 2017
A07 90682411 C/T 0.12(T) 4.35 4.58 2017
A09 62356818 A/G 0.19(A) 4.13 7.00 2017
A12 74098493 G/A 0.49(A) 4.58 5.51 2017
D02 38449756 T/A 0.47(T) 4.01 1.50 2017
D03 18961034 T/G 0.11(G) 4.18 2.54 2017
D08 49014753 C/T 0.13(T) 4.34, 4.16 4.35,3.83 2016, 2017
D08 49080865 G/A 0.13(A) 4.34, 4.16 4.35,3.83 2016, 2017
RSFW A08 5515194 C/T 0.10(T) 4.79 4.23 2016
A10 84786908 C/T 0.15(T) 4.19 2.95 2016
D06 19966743 C/G 0.5(G) 4.09 3.56 2016
A07 90532061 C/G 0.13(G) 4.73 5.23 2017
A07 90682411 C/T 0.12(T) 4.13, 4.73 2.40, 5.25 2016, 2017
A08 41804418 T/A 0.09(T) 4.23 2.74 2017
A08 53916411 G/A 0.088(G) 4.15 2.35 2017
A11 117938337 G/A 0.32(A) 4.09 3.08 2017
RSDW A05 94406259 C/T 0.33(T) 4.17 2.92 2016
A08 5589045 G/A 0.19(A) 4.67 4.85 2016
A08 6254890 T/G 0.22(G) 4.36,4.66 3.52,4.33 2016,2017
A13 42992196 A/T 0.48(T) 4.27,4.28 2.79,3.03 2016,2017
D08 47703450 C/T 0.096(T) 4.35 1.93 2016
D08 48527413 C/A 0.12(A) 4.23 1.29 2016
D08 48911757 C/G 0.13(G) 4.44 2.62 2016
Chr.: Chromosome; RPH: relative plant height; RSFW: relative shoot fresh matter weight; RSDW:relative shoot dry matter weight; MAF: Minor Allele Frequency; PVE: phenotypic variance explained.
Page 8/25
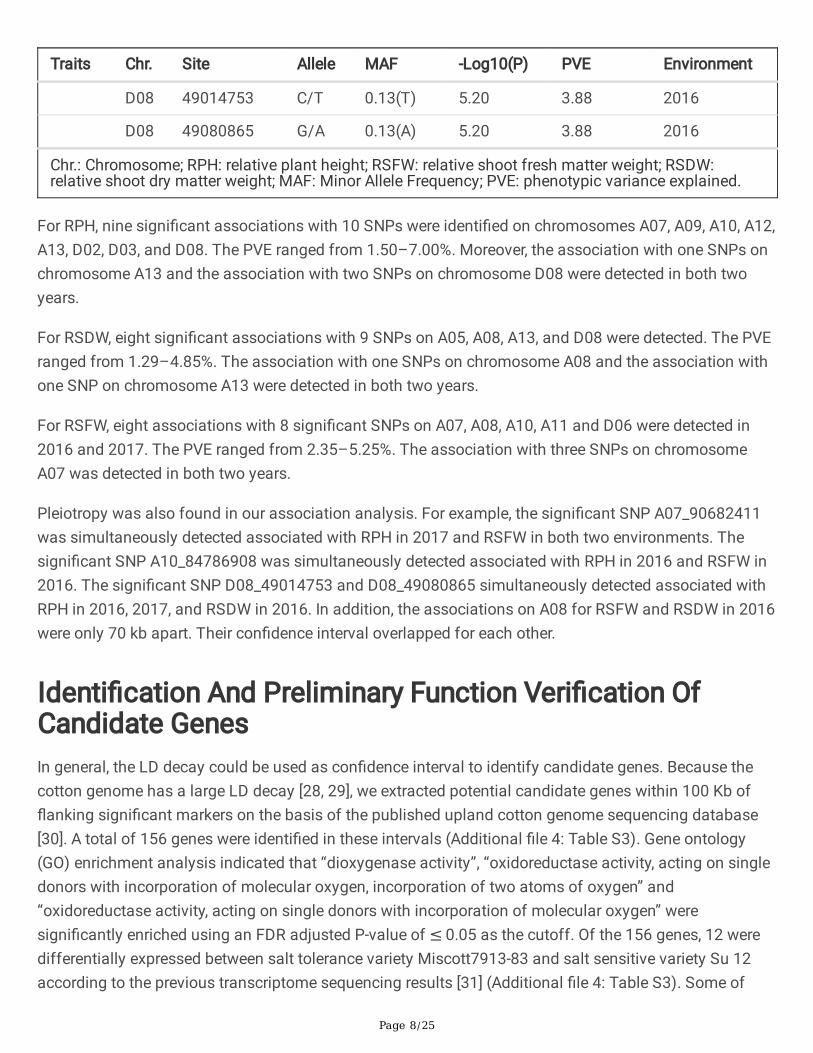
Traits Chr. Site Allele MAF -Log10(P) PVE Environment
D08 49014753 C/T 0.13(T) 5.20 3.88 2016
D08 49080865 G/A 0.13(A) 5.20 3.88 2016
Chr.: Chromosome; RPH: relative plant height; RSFW: relative shoot fresh matter weight; RSDW:relative shoot dry matter weight; MAF: Minor Allele Frequency; PVE: phenotypic variance explained.
For RPH, nine signi�cant associations with 10 SNPs were identi�ed on chromosomes A07, A09, A10, A12,A13, D02, D03, and D08. The PVE ranged from 1.50–7.00%. Moreover, the association with one SNPs onchromosome A13 and the association with two SNPs on chromosome D08 were detected in both twoyears.
For RSDW, eight signi�cant associations with 9 SNPs on A05, A08, A13, and D08 were detected. The PVEranged from 1.29–4.85%. The association with one SNPs on chromosome A08 and the association withone SNP on chromosome A13 were detected in both two years.
For RSFW, eight associations with 8 signi�cant SNPs on A07, A08, A10, A11 and D06 were detected in2016 and 2017. The PVE ranged from 2.35–5.25%. The association with three SNPs on chromosomeA07 was detected in both two years.
Pleiotropy was also found in our association analysis. For example, the signi�cant SNP A07_90682411was simultaneously detected associated with RPH in 2017 and RSFW in both two environments. Thesigni�cant SNP A10_84786908 was simultaneously detected associated with RPH in 2016 and RSFW in2016. The signi�cant SNP D08_49014753 and D08_49080865 simultaneously detected associated withRPH in 2016, 2017, and RSDW in 2016. In addition, the associations on A08 for RSFW and RSDW in 2016were only 70 kb apart. Their con�dence interval overlapped for each other.
Identi�cation And Preliminary Function Veri�cation OfCandidate GenesIn general, the LD decay could be used as con�dence interval to identify candidate genes. Because thecotton genome has a large LD decay [28, 29], we extracted potential candidate genes within 100 Kb of�anking signi�cant markers on the basis of the published upland cotton genome sequencing database[30]. A total of 156 genes were identi�ed in these intervals (Additional �le 4: Table S3). Gene ontology(GO) enrichment analysis indicated that “dioxygenase activity”, “oxidoreductase activity, acting on singledonors with incorporation of molecular oxygen, incorporation of two atoms of oxygen” and“oxidoreductase activity, acting on single donors with incorporation of molecular oxygen” weresigni�cantly enriched using an FDR adjusted P-value of ≤ 0.05 as the cutoff. Of the 156 genes, 12 weredifferentially expressed between salt tolerance variety Miscott7913-83 and salt sensitive variety Su 12according to the previous transcriptome sequencing results [31] (Additional �le 4: Table S3). Some of

Page 9/25
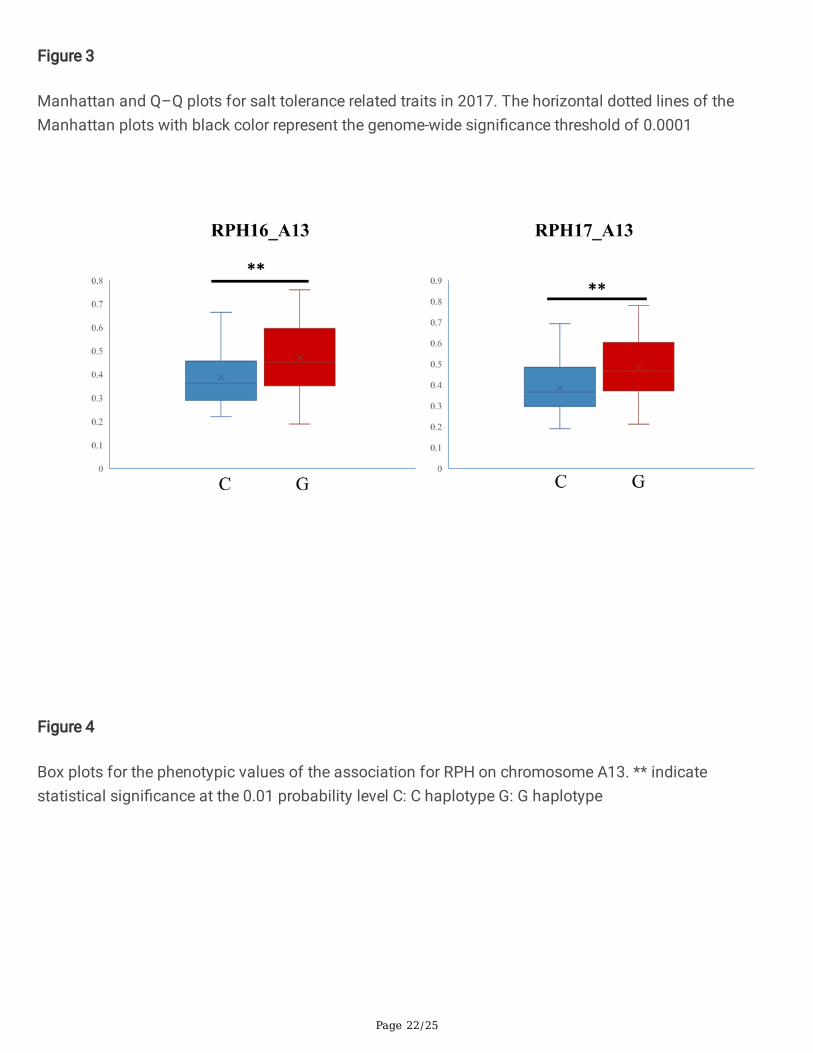
these genes may be associated with salt stress, such as GH_A08G0488 and GH_A10G1620 encodingprotein kinase. Protein kinase has been proved to play an important role in salt tolerance in cotton [32].Another gene GH_A13G0171, which encodes aquaporin, was also likely to regulate the salt stressresponse [33]. The con�dence interval contains GH_A13G0171 was simultaneously detected in bothyears. Through a t test, we found that the salt tolerance of upland cotton cultivars with the G haplotypewas signi�cantly higher than that of cultivars with the C haplotype in both years (Fig. 4).
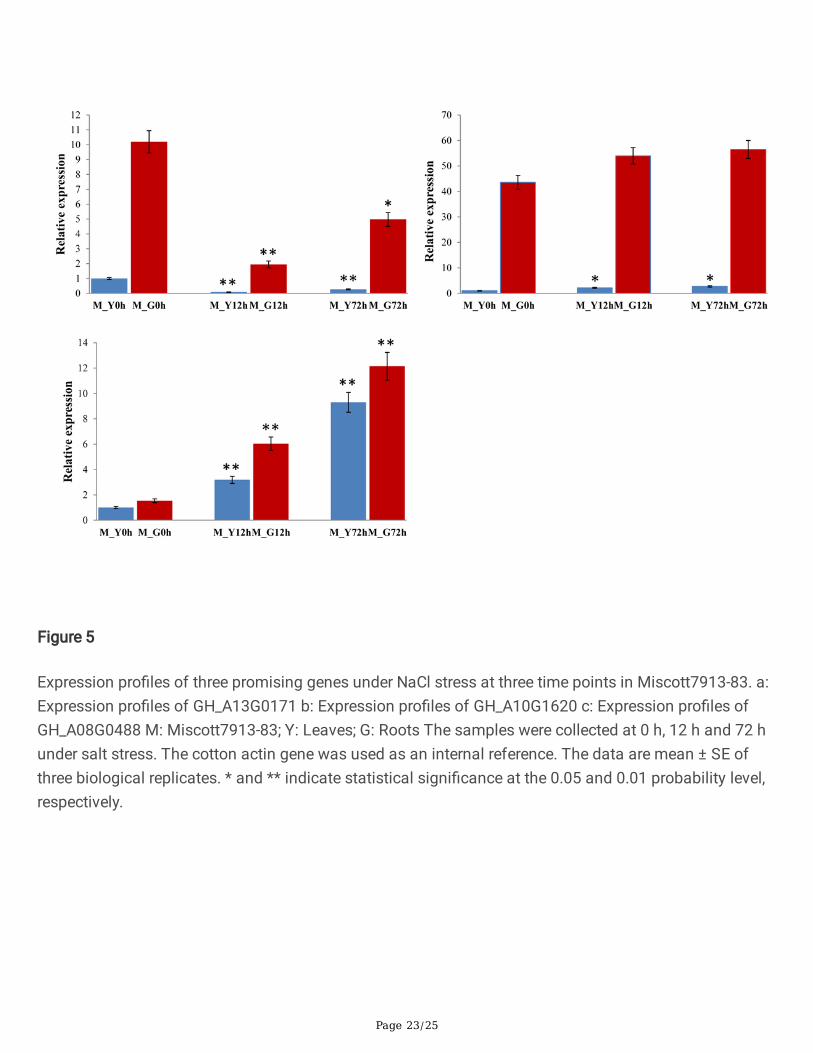
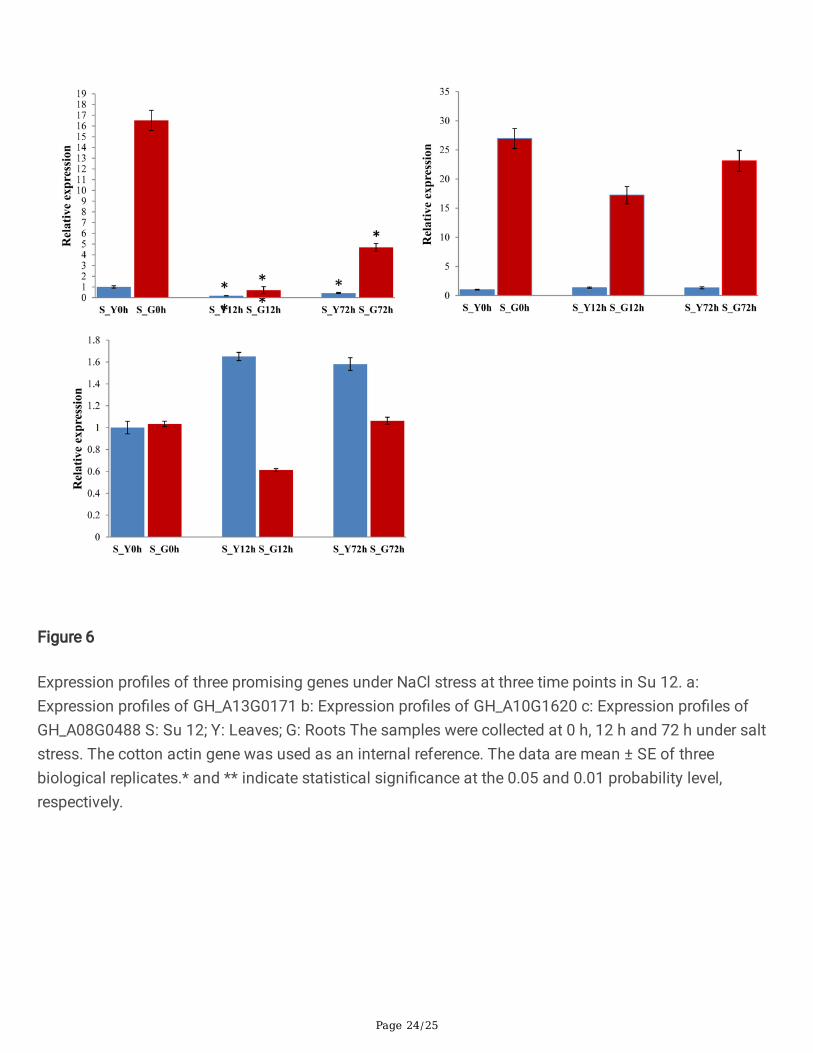
The three promising genes (GH_A08G0488, GH_A10G1620 and GH_A13G0171) were selected to conductpreliminary function veri�cation of salt tolerance in cotton. Analysis of gene expression patterns couldprovide important clues for gene function determination. Quantitative RT-PCR was performed to analyzethe expression levels of GH_A08G0488, GH_A10G1620 and GH_A13G0171 in roots and leaves under saltstress treatment in salt tolerance variety Miscott7913-83 and salt sensitive variety Su 12. As shown inFig. 5, the three genes were induced by salt stress and displayed distinct expression patterns in responseto salt stress in salt tolerance variety Miscott7913-83. The three genes had a much higher expressionlevel in roots than in leaves. The gene GH_A13G0171 exhibited a signi�cantly down-regulated expressionin both root and leaf tissues after salt stress. The gene GH_A08G0488 exhibited a signi�cantly up-regulated expression in both root and leaf tissues. The expression level of GH_A10G1620 showed anincrease in leaf and no signi�cant changes in the root tissues. As shown in Fig. 6, the three genes werealso displayed distinct expression patterns in response to salt stress in sensitive variety Su 12. The geneGH_A13G0171 exhibited an identical expression pattern in Miscott7913-83 and Su 12. The expressionlevels of GH_A10G1620 and GH_A08G0488 were not signi�cant different.
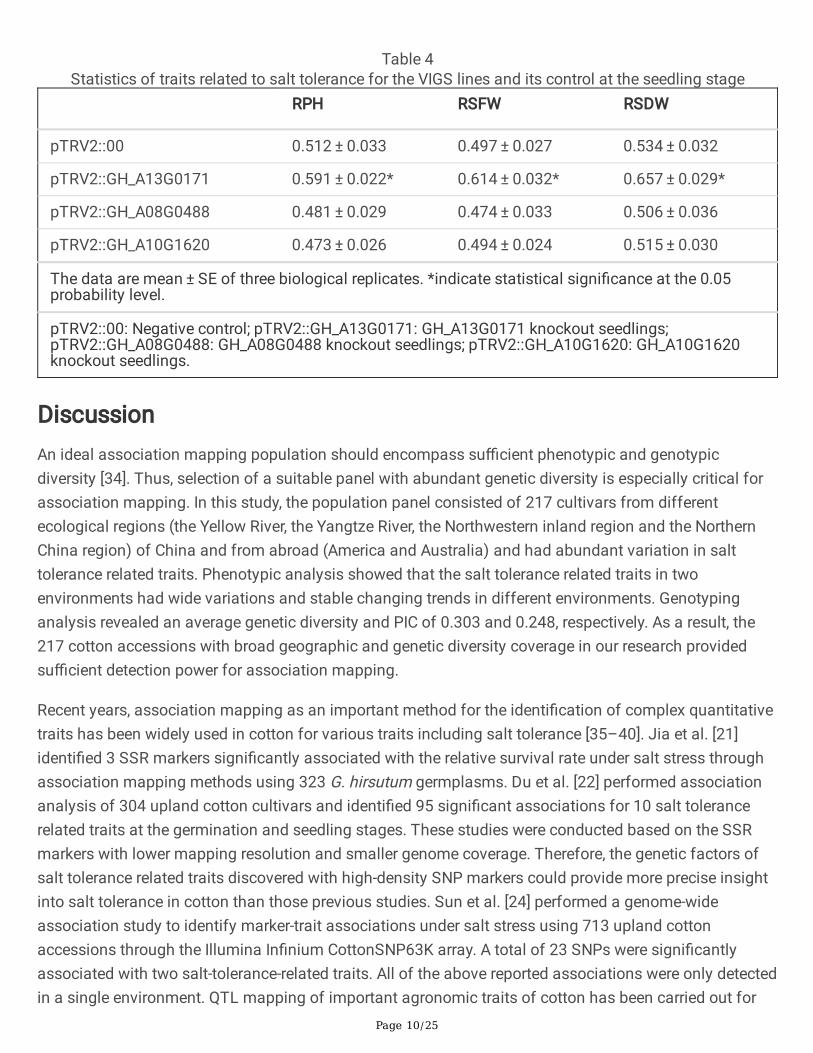
To con�rm the functional roles of GH_A08G0488, GH_A10G1620 and GH_A13G0171 genes under saltstress, virus-induced gene silencing (VIGS) assay was used to repress expression of these genes in salttolerance variety Miscott2111 plants. The inoculated seedlings were grown in three light incubators at23 °C under a 16-h light and 8-h dark cycle as three biological replicates. At the developmental periodwhen two leaves had formed, the pTRV2 :: GH_A08G0488, pTRV2 :: GH_A10G1620, pTRV2::GH_A13G0171 and pTRV2::00 inoculated plants were treated with 350 mM NaCl. After 15 days, the plantheight, fresh and dry shoot matter weight were determined and the corresponding relative values werecalculated. The transcripts of the three genes in the VIGS leaves were signi�cantly reduced compared tothe untreated Miscott2111 plants, indicating that they were effectively silenced in VIGS plants (Additional�le 5: Fig.S2). Compared with the control pTRV2::00, no signi�cance effect on their phenotypes wasobserved in pTRV2 :: GH_A08G0488 and pTRV2::GH_A10G1620 inoculated plants, and the plant height,fresh and dry shoot matter weigh of GH_A13G0171-silenced plants were signi�cantly higher than that ofpTRV2::00 inoculated plants (Table 4; Fig. 7), indicating that GH_A13G0171 could reduce seedlingtolerance to salt stress. The corresponding markers SNP_A13_1869056 could be applied for improvementof cotton salt tolerance.
Page 10/25
Table 4Statistics of traits related to salt tolerance for the VIGS lines and its control at the seedling stage
RPH RSFW RSDW
pTRV2::00 0.512 ± 0.033 0.497 ± 0.027 0.534 ± 0.032
pTRV2::GH_A13G0171 0.591 ± 0.022* 0.614 ± 0.032* 0.657 ± 0.029*
pTRV2::GH_A08G0488 0.481 ± 0.029 0.474 ± 0.033 0.506 ± 0.036
pTRV2::GH_A10G1620 0.473 ± 0.026 0.494 ± 0.024 0.515 ± 0.030
The data are mean ± SE of three biological replicates. *indicate statistical signi�cance at the 0.05probability level.
pTRV2::00: Negative control; pTRV2::GH_A13G0171: GH_A13G0171 knockout seedlings;pTRV2::GH_A08G0488: GH_A08G0488 knockout seedlings; pTRV2::GH_A10G1620: GH_A10G1620knockout seedlings.
DiscussionAn ideal association mapping population should encompass su�cient phenotypic and genotypicdiversity [34]. Thus, selection of a suitable panel with abundant genetic diversity is especially critical forassociation mapping. In this study, the population panel consisted of 217 cultivars from differentecological regions (the Yellow River, the Yangtze River, the Northwestern inland region and the NorthernChina region) of China and from abroad (America and Australia) and had abundant variation in salttolerance related traits. Phenotypic analysis showed that the salt tolerance related traits in twoenvironments had wide variations and stable changing trends in different environments. Genotypinganalysis revealed an average genetic diversity and PIC of 0.303 and 0.248, respectively. As a result, the217 cotton accessions with broad geographic and genetic diversity coverage in our research providedsu�cient detection power for association mapping.
Recent years, association mapping as an important method for the identi�cation of complex quantitativetraits has been widely used in cotton for various traits including salt tolerance [35–40]. Jia et al. [21]identi�ed 3 SSR markers signi�cantly associated with the relative survival rate under salt stress throughassociation mapping methods using 323 G. hirsutum germplasms. Du et al. [22] performed associationanalysis of 304 upland cotton cultivars and identi�ed 95 signi�cant associations for 10 salt tolerancerelated traits at the germination and seedling stages. These studies were conducted based on the SSRmarkers with lower mapping resolution and smaller genome coverage. Therefore, the genetic factors ofsalt tolerance related traits discovered with high-density SNP markers could provide more precise insightinto salt tolerance in cotton than those previous studies. Sun et al. [24] performed a genome-wideassociation study to identify marker-trait associations under salt stress using 713 upland cottonaccessions through the Illumina In�nium CottonSNP63K array. A total of 23 SNPs were signi�cantlyassociated with two salt-tolerance-related traits. All of the above reported associations were only detectedin a single environment. QTL mapping of important agronomic traits of cotton has been carried out for

Page 11/25
nearly two decades, but there are few successful examples of breeding new varieties by marking-assistedbreeding [41]. An important reason is the insu�cient of available information on multi-environmentaldetected QTLs. Salt tolerance as a complex quantitative trait controlled by multiple genes needs repeatedphenotypic evaluations in multiple environments. In this study, a total of 25 signi�cant associations with27 SNPs scattered over 12 chromosomes were detected for salt tolerance related traits. Among these, theassociations on chromosome A13 and D08 for RPH, A07 for RSFW, A08 and A13 for RSDW wereexpressed in both two environments, indicating that they were likely to be stable QTLs. These resultsprovided important genetic variations for accelerating the improvement of salt tolerance in cotton.
By comparing our association mapping results with those of previous reports showed that most of the 25associations were novel reported loci. The physical location of the SSR marker NAU2561 on A05signi�cantly associated with the relative MDA content reported by Du et al. (2016) [22] was only 1.7 Mbfrom SNP_A05_ 94406377, which was signi�cantly associated RSDW in 2016. The physical distancebetween BNL1231, which was reported by Du et al. (2016) [22] to be associated with relative SOD activity,and SNP_A11_117938337 which was associated with RSFW in 2017 was only 1 Mb. Considering largerLD decay distances in the cotton genome, it is reasonable to presume that these two loci could be thesame loci.
Many studies have reported the positive effects of AQPs in improving plant tolerance to salt stresses. Inthis study, both gene expression and silencing analyses showed that GH_A13G0171, which encodesaquaporin (AQP) PIP-type, was likely to regulate the salt stress response. AQPs play an important role inmaintaining water homeostasis in the responses of plants to environmental stress by regulating watermovement across vacuolar membranes [42]. Overexpression of MaPIP2-7 in banana improved toleranceto drought, cold, and salt stresses [43]. Overexpression of SpAQP1 promoted seed germination and rootgrowth under salt stress in transgenic tobaccos [33]. The negative effect of AQP also has been reported.Wang et al. [44] found that overexpression of GsTIP2;1 in Arabidopsis thaliana depressed salt toleranceand dehydration stress. Plants with overexpressed GsTIP2;1 exhibited higher dehydration rate, suggestingthat this gene may mediate stress response by increasing water loss. Our data showed thatGH_A13G0171-silenced plants were signi�cantly increased in salt tolerance related traits, indicating itsnegative effect in regulating the salt stress response. The exact role of this gene still needs furtherveri�cation by RNA interference or CRISPR technology. Nonetheless, this study adds further credence tothe relationship between AQPs and plant stress response.
ConclusionsIt is of great signi�cance to explore the genetic variants and the underlying candidate genes in uplandcotton for salt tolerance improvement. In this study, we reported the genome-wide association mappingof salt tolerant QTLs during the seedling stage by GBS platform. A total of 25 associations with 27 SNPsscattered over 12 chromosomes were detected signi�cantly associated with three salt tolerance relatedtraits in two environments. Among of which, �ve associations were simultaneously expressed in both twoenvironments. The VIGS assay revealed that GH_A13G0171, which encodes aquaporin PIP-type, was
Page 12/25
negative to regulate the salt stress response. These results will contribute to the genetic improvement ofsalt tolerance in cotton.
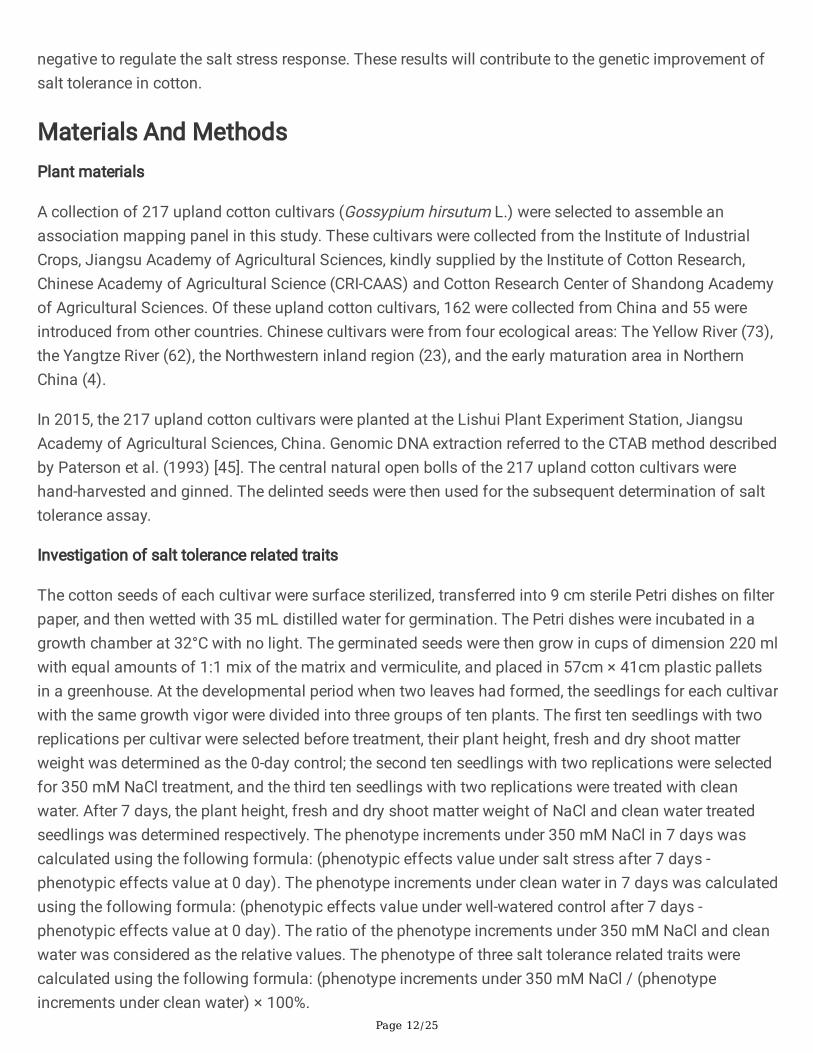
Materials And MethodsPlant materials
A collection of 217 upland cotton cultivars (Gossypium hirsutum L.) were selected to assemble anassociation mapping panel in this study. These cultivars were collected from the Institute of IndustrialCrops, Jiangsu Academy of Agricultural Sciences, kindly supplied by the Institute of Cotton Research,Chinese Academy of Agricultural Science (CRI-CAAS) and Cotton Research Center of Shandong Academyof Agricultural Sciences. Of these upland cotton cultivars, 162 were collected from China and 55 wereintroduced from other countries. Chinese cultivars were from four ecological areas: The Yellow River (73),the Yangtze River (62), the Northwestern inland region (23), and the early maturation area in NorthernChina (4).
In 2015, the 217 upland cotton cultivars were planted at the Lishui Plant Experiment Station, JiangsuAcademy of Agricultural Sciences, China. Genomic DNA extraction referred to the CTAB method describedby Paterson et al. (1993) [45]. The central natural open bolls of the 217 upland cotton cultivars werehand-harvested and ginned. The delinted seeds were then used for the subsequent determination of salttolerance assay.
Investigation of salt tolerance related traits
The cotton seeds of each cultivar were surface sterilized, transferred into 9 cm sterile Petri dishes on �lterpaper, and then wetted with 35 mL distilled water for germination. The Petri dishes were incubated in agrowth chamber at 32°C with no light. The germinated seeds were then grow in cups of dimension 220 mlwith equal amounts of 1:1 mix of the matrix and vermiculite, and placed in 57cm × 41cm plastic palletsin a greenhouse. At the developmental period when two leaves had formed, the seedlings for each cultivarwith the same growth vigor were divided into three groups of ten plants. The �rst ten seedlings with tworeplications per cultivar were selected before treatment, their plant height, fresh and dry shoot matterweight was determined as the 0-day control; the second ten seedlings with two replications were selectedfor 350 mM NaCl treatment, and the third ten seedlings with two replications were treated with cleanwater. After 7 days, the plant height, fresh and dry shoot matter weight of NaCl and clean water treatedseedlings was determined respectively. The phenotype increments under 350 mM NaCl in 7 days wascalculated using the following formula: (phenotypic effects value under salt stress after 7 days -phenotypic effects value at 0 day). The phenotype increments under clean water in 7 days was calculatedusing the following formula: (phenotypic effects value under well-watered control after 7 days -phenotypic effects value at 0 day). The ratio of the phenotype increments under 350 mM NaCl and cleanwater was considered as the relative values. The phenotype of three salt tolerance related traits werecalculated using the following formula: (phenotype increments under 350 mM NaCl / (phenotypeincrements under clean water) × 100%.
Page 13/25
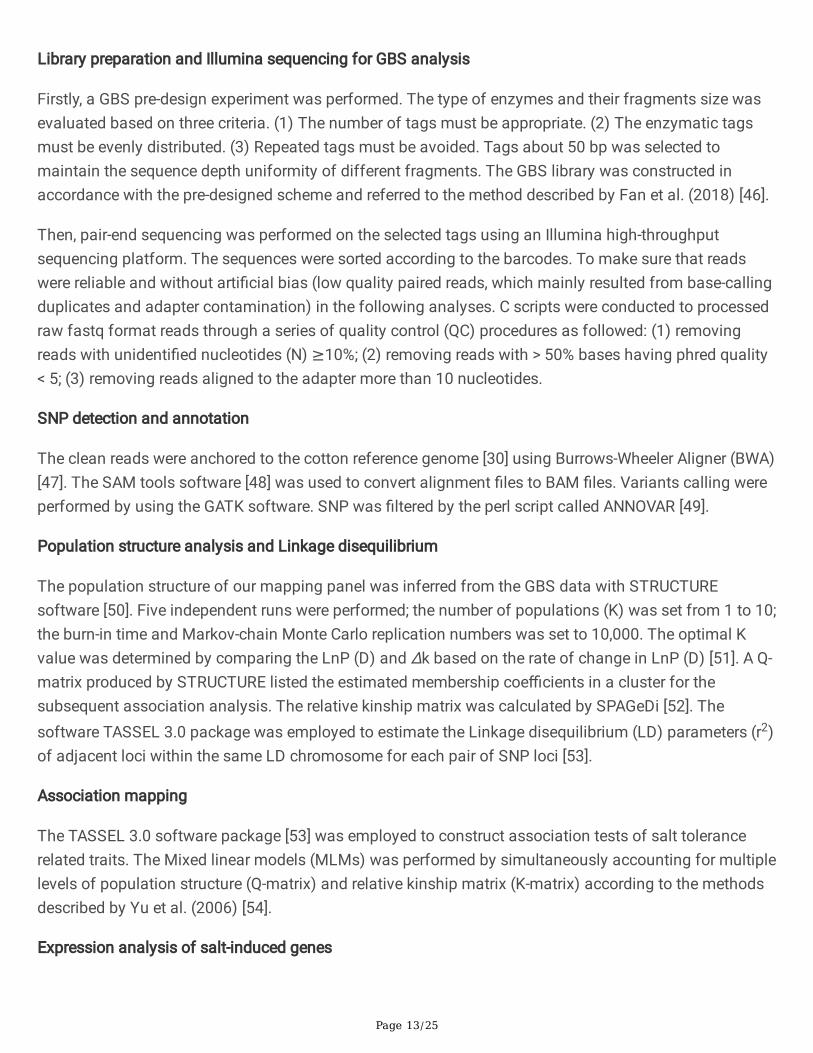
Library preparation and Illumina sequencing for GBS analysis
Firstly, a GBS pre-design experiment was performed. The type of enzymes and their fragments size wasevaluated based on three criteria. (1) The number of tags must be appropriate. (2) The enzymatic tagsmust be evenly distributed. (3) Repeated tags must be avoided. Tags about 50 bp was selected tomaintain the sequence depth uniformity of different fragments. The GBS library was constructed inaccordance with the pre-designed scheme and referred to the method described by Fan et al. (2018) [46].
Then, pair-end sequencing was performed on the selected tags using an Illumina high-throughputsequencing platform. The sequences were sorted according to the barcodes. To make sure that readswere reliable and without arti�cial bias (low quality paired reads, which mainly resulted from base-callingduplicates and adapter contamination) in the following analyses. C scripts were conducted to processedraw fastq format reads through a series of quality control (QC) procedures as followed: (1) removingreads with unidenti�ed nucleotides (N) ≥10%; (2) removing reads with > 50% bases having phred quality< 5; (3) removing reads aligned to the adapter more than 10 nucleotides.
SNP detection and annotation
The clean reads were anchored to the cotton reference genome [30] using Burrows-Wheeler Aligner (BWA)[47]. The SAM tools software [48] was used to convert alignment �les to BAM �les. Variants calling wereperformed by using the GATK software. SNP was �ltered by the perl script called ANNOVAR [49].
Population structure analysis and Linkage disequilibrium
The population structure of our mapping panel was inferred from the GBS data with STRUCTUREsoftware [50]. Five independent runs were performed; the number of populations (K) was set from 1 to 10;the burn-in time and Markov-chain Monte Carlo replication numbers was set to 10,000. The optimal Kvalue was determined by comparing the LnP (D) and Δk based on the rate of change in LnP (D) [51]. A Q-matrix produced by STRUCTURE listed the estimated membership coe�cients in a cluster for thesubsequent association analysis. The relative kinship matrix was calculated by SPAGeDi [52]. Thesoftware TASSEL 3.0 package was employed to estimate the Linkage disequilibrium (LD) parameters (r2)of adjacent loci within the same LD chromosome for each pair of SNP loci [53].
Association mapping
The TASSEL 3.0 software package [53] was employed to construct association tests of salt tolerancerelated traits. The Mixed linear models (MLMs) was performed by simultaneously accounting for multiplelevels of population structure (Q-matrix) and relative kinship matrix (K-matrix) according to the methodsdescribed by Yu et al. (2006) [54].
Expression analysis of salt-induced genes

Page 14/25
Total RNA was extracted using an improved CTAB method [55]. For quantitative real-time PCR,PrimeScript RT Master Mix (Perfect Real Time) from TaKaRa (Dalian, China) was used to synthesize �rst-strand cDNA. The qRT-PCR program was performed on an ABI QuantStudio 5 RealTime PCR System. TheqRT-PCR reaction system referred to the method described by Xu et al. (2017) [56]. Quantitative real-timePCR was carried out with three biological replicates. The cotton actin gene was employed as a referencegene. The speci�c primers for qRT-PCR are listed in Additional �le 6: Table S4.
Virus-induced gene silencing assay
About 300-500 bp fragments overlapped the C-terminal and 3’ UTR from 3 differentially expressed genes(GH_A08G0488, GH_A10G1620 and GH_A13G0171) were isolated in Moscott2111. The speci�c primerswere listed in Additional �le 6: Table S4. These fragments were sequenced and cloned into doubleenzyme (EcoRI and BamHI) digested pTRV2, generating a new vector named pTRV2::gene. The pTRV1,pTRV2::gene, pTRV2::CLA1 (positive control) and pTRV2::00 (negative control) were introduced intoAgrobacterium tumefaciens strain GV3101 by heat shock method. The VIGS assay was performedaccording to the protocol described by Gao et al. (2011) [57]. A ratio of 1:1 mixed pTRV1 andpTRV2::gene were injected into the seedlings with mature cotyledons but without a visible true leaf via asyringe in�ltration. The inoculated seedlings were grown in a light incubator at 23°C under a 16-h lightand 8-h dark cycle. Two weeks later, the inoculated plants RNA was isolated to detect whether the targetgene was still expressed. For each gene, a total of 100 seedlings were knocked out for subsequent salttolerance identi�cation.
AbbreviationsGWAS: Genome-wide association study; GBS: Genotyping By-Sequencing; BWA: Burrows-Wheeler Aligner;LD: Linkage disequilibrium; VIGS: Virus-induced gene silencing; CV: Coe�cients of variation; GO: GeneOntology; MLM: Mixed linear model; PIC: Polymorphism information content; SNPs: Single nucleotidepolymorphisms; RPH: relative plant height; RSFW: relative shoot fresh matter weight; RSDW: relativeshoot dry matter weight;
DeclarationsAcknowledgments
We would like to thank the Institute of Cotton Research, Chinese Academy of Agricultural Science andCotton Research Center of Shandong Academy of Agricultural Sciences for providing cotton accessionsused in this study. We would like to thank Dr. Peng W. Chee from Molecular Cotton Breeding Laboratory,University of Georgia for helpful comments.
Authors’ contributions
Experiments were designed by XLS and WZG. Experiments were performed by PX,

Page 15/25
QG, SM, XGZ and ZZX. PX drafted the manuscript, XLS revised the manuscript. All authors read andapproved the �nal manuscript.
Funding
This work was supported by grants from the Natural Science Foundation of Jiangsu Province(BK20160580), the Major Project of the National Transgene (2016ZX08005-004)
Ethics approval and consent to participate
Not applicable.
Consent for publication
Not applicable.
Competing interests
The authors declared that they had no competing interests.
Availability of data and materials
All data used in the current study are included in this published article or are available from thecorresponding author on reasonable request.
References1. Qadir M, Shams M. Some agronomic and physiological aspects of salt tolerance in cotton
(Gossypium hirsutum L.). Journal Agronomy Crop Science. 1997;179:101–6.
2. Greenway H, Munns R. Mechanisms of salt tolerance in nonhalophytes. Annual Review PlantPhysiology. 1980;31:149–90.
3. Ye W, Liu J. Identi�cation technology on salt tolerance of cotton germplasm and its application.China Cotton. 1998;25(9):37–8.
4. Tiwari RS, Picchioni GA, Steiner RL, Jones DC, Hughs SE, Zhang J. Genetic variation in salt toleranceat the seedling stage in an interspeci�c backcross inbred line population of cultivated tetraploidcotton. Euphytica. 2013;194:1–11.
5. Flowers TJ. Improving crop salt tolerance. J Exp Bot. 2004;55:307–19.
�. Ashraf M, Foolad MR. Crop breeding for salt tolerance in the era of molecular markers and marker-assisted selection. Plant Breeding. 2013;132:10–20.
7. Zhang D, Song HN, Chen H, Hao DR, Wang H, Kan GZ, Jin HX, Yu DY. The acid phosphatase-encodinggene GmACP1 contributes to soybean tolerance to low-phosphorus stress. PLOS Genetics.2014;10(1):e1004061.

Page 16/25
�. Chu S, Wang J, Zhu Y, Liu S, Zhou X, Zhang H, Wang CE, Yang W, Tian Z, Cheng H, Yu D. An R2R3-type MYB transcription factor, GmMYB29, regulates iso�avone biosynthesis in soybean. PLOSGenetics. 2017;13(5):e1006770.
9. Iquira E, Humira S. François B. Association mapping of QTLs for sclerotinia stem rot resistance in acollection of soybean plant introductions using a genotyping by sequencing (GBS) approach. BMCPlant Biol. 2015;15:5.
10. Nambeesan SU, Mandel JR, Bowers JE, Marek L, Ebert D, Corbi J, Rieseberg L, Knapp SJ, Burke JM.Association mapping in sun�ower (Helianthus annuus L.) reveals independent control of apical vs.basal branching. BMC Plant Biol. 2015;15:84.
11. Zanke CD, Rodemann B, Ling J, Muqaddasi QH, Plieske J, Polley A, Kollers S, Ebmeyer E, Korzun V,Argillier O, Stiewe G, Zschäckel T, Ganal MW, Röder MS. Genome–wide association mapping ofresistance to eyespot disease (Pseudocercosporella herpotrichoides) in European winter wheat(Triticum aestivum L.) and �ne–mapping of Pch1. Theor Appl Genet. 2017;130:505–14.
12. Zhao Y, Wang H, Chen W, Zhao P, Gong H, Sang X, Cui Y. Regional association analysis-based �nemapping of three clustered QTL for verticillium wilt resistance in cotton (G. hirsutum.L). BMC Genom.2017;18:661.
13. Rahimi Y, Bihamta MR, Taleei A, Alipour H, Ingvarsson PK. Genome-wide association study ofagronomic traits in bread wheat reveals novel putative alleles for future breeding programs. BMCPlant Biol. 2019;19(1):541.
14. Thapa R, Tabien RE, Thomson MJ, Septiningsih EM. Genome-wide association mapping to identifygenetic loci for cold tolerance and cold recovery during germination in rice. Front Genet. 2020;11:22.
15. Edae EA, Olivera PD, Jin Y, Poland JA, Rouse MN. Genotype-by-sequencing facilitates geneticmapping of a stem rust resistance locus in Aegilops umbellulata, a wild relative of cultivated wheat.BMC Genom. 2016;17:1039.
1�. Navarro J, Wilcox M, Burgueño J, Romay C, Swarts K, Trachsel S, Preciado E, Terron A, Delgado HV,Vidal V, Ortega A, Banda AE, Montiel N, Ortiz-Monasterio I, Vicente FS, Espinoza AG, Atlin G, Wenzl P,Hearne S, Bucker ES. A study of allelic diversity underlying �owering-time. Nat Genet. 2017;49:476–80.
17. Wu X, Guo X, Wang A, Liu P, Wu W, Zhao Q, Zhao M, Zhu Y, Chen Z. Quantitative trait loci mapping ofplant architecture-related traits using the high-throughput genotyping by sequencing method.Euphytica, 2019, 215 (12).
1�. Saxena RK, Kale S, Mir RR, Mallikarjuna N, Yadav P, Das RR, Molla J, Sonnappa M, Ghanta A,Narasimhan Y, Rathore A, Kumar CVS, Varshney RK. Genotyping–by–sequencing and multilocationevaluation of two interspecifc backcross populations identify QTLs for yield–related traits inpigeonpea. Theor Appl Genet. 2020;133(3):737–49.
19. Peterson GW, Dong YB, Horbach C, Fu YB. Genotyping by-sequencing for plant genetic diversityanalysis: a lab guide for SNP genotyping. Diversity. 2014;6:665–80.
Page 17/25
20. Reinisch AJ, Dong JM, Brubaker CL, et al. A detailed RFLP map of cotton, Gossypium hirsutum ×Gossypium barbadense: Chromosome organization and evolution in a disomic polyploid genome.Genetics. 1994;138:829–47.
21. Jia Y, Sun J, Wang X, Zhou Z, Pan Z, He S, Pan B, Wang L, Du X. Molecular diversity and associationanalysis of drought and salt tolerance in Gossypium hirsutum L. Germplasm. Journal of IntegrativeAgriculture. 2014;13(9):1845–53.
22. Du L, Cai C, Wu S, Zhang F, Hou S, Guo W. Evaluation and exploration of favorable QTL alleles forsalt stress Rrelated traits in cotton cultivars (G. hirsutum L.). PLOS One. 2016;11(3):e0151076.
23. Zhao YL, Wang HM, Shao BX, Chen W, Guo ZJ, Gong HY, Sang XH, Wang JJ, Ye WW. SSR-basedassociation mapping of salt tolerance in cotton (Gossypium hirsutum L.). Genetics and molecularresearch, 2016, 15(2): gmr.15027370.
24. Sun Z, Li H, Zhang Y, Li Z, Ke H, Wu L, Zhang G, Wang X, Ma Z. Identi�cation of SNPs and candidategenes associated with salt tolerance at the seedling stage in cotton (Gossypium hirsutum L.). FrontPlant Sci. 2018;9:1011.
25. Yasir M, He S, Sun G, Geng X, Pan Z, Gong W, Jia Y, Du X. A genome-wide association study revealedkey SNPs/genes associated with salinity stress tolerance in upland cotton. Genes. 2019;10:829.
2�. Stich B, Maurer HP, Melchinger AE, Frisch M, Heckenberger M, van der Voort JR, Peleman J, SorensenAP, Reif JC. Comparison of linkage disequilibrium in elite European maize inbred lines using AFLPand SSR markers. Mol Breeding. 2006;17:217–26.
27. Yang XH, Yan JB, Zheng YP, Yu JM, Li JS. Reviews of association analysis for quantitative traits inplants. Acta Agronomica Sinica. 2007;33:523–30.
2�. Sun Z, Wang X, Liu Z, Gu Q, Zhang Y, Li Z, Ke H, Yang J, Wu J, Wu L, Zhang G, Zhang C, Ma Z.Genome-wide association study discovered genetic variation and candidate genes of �bre qualitytraits in Gossypium hirsutum L. Plant biotechnology journal. 2017;15(8):982–96.
29. Huang C, Nie X, Shen C, You C, Li W, Zhao W, Zhang X, Lin Z. Population structure and genetic basisof the agronomic traits of upland cotton in China revealed by a genome-wide association studyusing high-density SNPs. Plant Biotechnol J. 2017;15:1374–86.
30. Hu Y, Chen J, Fang L, Zhang Z, Ma W, Niu Y, Ju L, Deng J, Zhao T, Lian J, Baruch K, Fang D, Liu X,Ruan YL, Rahman M, Han J, Wang K, Wang Q, Wu H, Mei G, Zang Y, Han Z, Xu C, Shen W, Yang D, SiZ, Dai F, Zou L, Huang F, Bai Y, Zhang Y, Brodt A, Ben-Hamo H, Zhu X, Zhou B, Guan X, Zhu S, Chen X,Zhang T. Gossypium barbadense and Gossypium hirsutum genomes provide insights into the originand evolution of allotetraploid cotton. Nat Genet. 2019;51(4):739–48.
31. Xu P, Yang Y, Guo Q, Zhang X, Xu Z, Shen X. Development of EST-SSR and EST-InDel markersassociated with salt tolerance in upland cotton. Cotton Science. 2016;28(1):65–74.
32. Zhao J, Gao Y, Zhang Z, Chen T, Guo W, Zhang T. A receptor-like kinase gene (GbRLK) fromGossypium barbadense enhances salinity and drought-stress tolerance in Arabidopsis. BMC PlantBiol. 2013;13:110.
Page 18/25
33. Chang W, Liu X, Zhu J, Fan W, Zhang Z. An aquaporin gene from halophyte Sesuviumportulacastrum, SpAQP1, increases salt tolerance in transgenic tobacco. Plant Cell Rep.2016;35:385–95.
34. Flint-Garcia SA, Thuillet AC, Yu JM, Pressoir G, Romero SM, Mitchell SE, Doebley J, Kresovich S,Goodman MM, Buckler ES. Maize association population: a high-resolution platform for quantitativetrait locus dissection. Plant J. 2005;44:1054–64.
35. Nie X, Huang C, You C, Li W, Zhao W, Shen C, Zhang B, Wang H, Yan Z, Dai B, Wang M, Zhang X, LinZ. Genome-wide SSR-based association mapping for �ber quality in nation-wide upland cottoninbreed cultivars in China. BMC Genom. 2016;17:352.
3�. Fang L, Wang Q, Hu Y, Jia Y, Chen J, Liu B, Zhang Z, Guan X, Chen S, Zhou B, Mei G, Sun J, Pan Z, HeS, Xiao S, Shi W, Gong W, Liu J, Ma J, Cai C, Zhu X, Guo W, Du X, Zhang T. Genomic analyses incotton identify signatures of selection and loci associated with �ber quality and yield traits. NatGenet. 2017;49:1089–98.
37. Wang M, Tu L, Lin M, Lin Z, Wang P, Yang Q, Ye Z, Shen C, Li J, Zhang L, Zhou X, Nie X, Li Z, Guo K,Ma Y, Huang C, Jin S, Zhu L, Yang X, Min L, Yuang D, Zhang Q, Lindsey K, Zhang X. Asymmetricsubgenome selection and cis-regulatory divergence during cotton domestication. Nat Genet.2017;49:579–87.
3�. Dong C, Wang J, Chen Q, Yu Y, Li B. Detection of favorable alleles for yield and yield components byassociation mapping in upland cotton. Genes Genomics. 2018;40:725–34.
39. Ma J, Liu J, Pei W, Ma Q, Wang N, Zhang X, Cui Y, Li D, Liu G, Wu M, Zhang X, Song J, Zhang J, Yu S,Yu J. Genome-wide association study of the oil content in upland cotton (Gossypium hirsutum L.)and identi�cation of GhPRXR1, a candidate gene for a stable QTL qOC-Dt5-1. Plant Science, 2019,286:89–97.
40. Zhu G, Gao W, Song X, Sun F, Hou S, Liu N, Huang Y, Zhang D, Ni Z, Chen Q, Guo W. Genome-wideassociation reveals genetic variation of lint yield components under salty �eld conditions in cotton(Gossypium hirsutum L.). BMC Plant Biol. 2020;20(1):23.
41. Guo WZ, Zhang TZ, Zhu XF, Pan JJ. Modi�ed backcross pyramiding breeding with molecular marker-assisted selection and its applications in cotton. Acta Agronomica Sinica. 2005;31(8):963–70.
42. Kapilan R, Vaziri M, Zwiazek JJ. Regulation of aquaporins in plants under stress. Biol Res. 2018;51:4.
43. Xu Y, Hu W, Liu J, Song S, Hou X, Jia C, Li J, Miao H, Wang Z, Tie W, Xu B, Jin Z. An aquaporin geneMaPIP2-7 is involved in tolerance to drought, cold and salt stresses in transgenic banana (Musaacuminate L.). Plant Physiol Biochem. 2020;147:66–76.
44. Wang X, Li Y, Ji W, Bai X, Cai H, Zhu D, Sun X, Chen L, Zhu Y. A novel Glycine soja tonoplast intrinsicprotein gene responds to abiotic stress and depresses salt and dehydration tolerance in transgenicArabidopsis thaliana. J Plant Physiol. 2011;168:1241–8.
45. Paterson AH, Brubaker CL, Wendel JF. A rapid method for extraction of cotton (Gossypium spp.)genomic DNA suitable for RFLP or PCR analysis. Plant Molecular Biology Reporter. 1993;11(2):122–7.
Page 19/25
4�. Fan L, Wang L, Wang X, Zhang H, Zhu Y, Guo J, Geng H, Chen Q, Qu Y. A high-density genetic map ofextra-long staple cotton (Gossypium barbadense) constructed using genotyping-by sequencingbased single nucleotide polymorphic markers and identi�cation of �ber traits-related QTL in arecombinant inbred line population. BMC Genom. 2018;19:489.
47. Li H, Durbin R. Fast and accurate short read alignment with Burrows-Wheeler transform.Bioinformatics. 2009;25(14):1754–60.
4�. Li H, Handsaker B, Wysoker A, et al. The sequence alignment/map format and SAMtools.Bioinformatics. 2009;25(16):2078–9.
49. Wang K, Li M, Hakonarson H. ANNOVAR: functional annotation of genetic variants from high-throughput sequencing data. Nucleic acids research. 2010;38(16):e164.
50. Pritchard JK, Wen W. Documentation for STRUCTURE software. Chicago: The University of ChicagoPress; 2004.
51. Evanno G, Regaut S, Goudet J. Detecting the number of clusters of individuals using the softwareSTRUCTURE: A simulation study. Mol Ecol. 2005;14:2611–20.
52. Hardy OJ, Vekemans X. SPAGEDi: a versatile computer program to analyse spatial genetic structureat the individual or population levels. Mol Ecol Notes. 2002;2:618–20.
53. Bradbury PJ, Zhang Z, Kroon DE, Casstevens RM, Ramdoss Y, Buckler ES. TASSEL: Software forassociation mapping of complex traits in diverse samples. Bioinformatics. 2007;23:2633–5.
54. Yu J, Pressoir G, Briggs WH, Vroh Bi I, Yamasaki M, Doebley JF, McMullen MD, Gaut BS, Nielsen DM,Holland JB, Kresovich S, Buckler ES. A uni�ed mixed-model method for association mapping thataccounts for multiple levels of relatedness. Nat Genet. 2006;38:203–8.
55. Hu G, Yu S. Extraction of high-quality total RNA in cotton leaf with improved CTAB Method. CottonScience. 2007;19:69–70.
5�. Xu P, Gao J, Cao Z, Chee PW, Guo Q, Xu Z, Paterson AH, Zhang X, Shen X. Fine mapping andcandidate gene analysis of qFL-chr1, a �ber length QTL in cotton. Theor Appl Genet. 2017;130:1309–19.
57. Gao X, Britt RC Jr, Shan L, He P. Agrobacterium mediated virus-induced gene silencing assay incotton. Journal of Visualized Experiments. 2011;54:e2938.
Figures

Page 20/25
Figure 1
Population structure analysis of 217 cotton cultivars. a Estimated LnP(K) of possible clusters (K) from 1to 10. b Delta K based on the rate of change of LnP(K) between successive K. c Population structure of217 Upland cotton accessions based on STRUCTURE when K=3
Page 21/25
Figure 2
Manhattan and Q–Q plots for salt tolerance related traits in 2016. The horizontal dotted lines of theManhattan plots with black color represent the genome-wide signi�cance threshold of 0.0001
Page 22/25
Figure 3
Manhattan and Q–Q plots for salt tolerance related traits in 2017. The horizontal dotted lines of theManhattan plots with black color represent the genome-wide signi�cance threshold of 0.0001
Figure 4
Box plots for the phenotypic values of the association for RPH on chromosome A13. ** indicatestatistical signi�cance at the 0.01 probability level C: C haplotype G: G haplotype
Page 23/25
Figure 5
Expression pro�les of three promising genes under NaCl stress at three time points in Miscott7913-83. a:Expression pro�les of GH_A13G0171 b: Expression pro�les of GH_A10G1620 c: Expression pro�les ofGH_A08G0488 M: Miscott7913-83; Y: Leaves; G: Roots The samples were collected at 0 h, 12 h and 72 hunder salt stress. The cotton actin gene was used as an internal reference. The data are mean ± SE ofthree biological replicates. * and ** indicate statistical signi�cance at the 0.05 and 0.01 probability level,respectively.
Page 24/25
Figure 6
Expression pro�les of three promising genes under NaCl stress at three time points in Su 12. a:Expression pro�les of GH_A13G0171 b: Expression pro�les of GH_A10G1620 c: Expression pro�les ofGH_A08G0488 S: Su 12; Y: Leaves; G: Roots The samples were collected at 0 h, 12 h and 72 h under saltstress. The cotton actin gene was used as an internal reference. The data are mean ± SE of threebiological replicates.* and ** indicate statistical signi�cance at the 0.05 and 0.01 probability level,respectively.

Page 25/25
Figure 7
Functional characterization of GH_A13_G0171 VIGS in Miscot2111 a: Transcript levels of GH_A13G0171in pTRV2::00 and pTRV2:: GH_A13G0171 inoculated plants. The cotton actin gene was used as aninternal reference. The data are mean ± SE of three biological replicates. ** indicate statisticalsigni�cance at the 0.01 probability level, respectively. b: Phenotype identi�cation of salt tolerance of theVIGS line and its control in seedling stage
Supplementary Files
This is a list of supplementary �les associated with this preprint. Click to download.
Additional�le6.xlsx
Additional�le5.tif
Additional�le4.xlsx
Additional�le3.tif
Additional�le2.xlsx
Additional�le1.xlsx