Embed Size (px)
Citation preview
Accepted Manuscript
Title: Salt tolerance in the halophyte Salicorniadolichostachya Moss: growth, morphology and physiology
Authors: Diana Katschnig, Rob Broekman, Jelte Rozema
PII: S0098-8472(12)00089-5DOI: doi:10.1016/j.envexpbot.2012.04.002Reference: EEB 2541
To appear in: Environmental and Experimental Botany
Received date: 27-1-2012Revised date: 29-3-2012Accepted date: 9-4-2012
Please cite this article as: Katschnig, D., Broekman, R., Rozema, J., Salt tolerance inthe halophyte Salicornia dolichostachya Moss: growth, morphology and physiology,Environmental and Experimental Botany (2010), doi:10.1016/j.envexpbot.2012.04.002
This is a PDF file of an unedited manuscript that has been accepted for publication.As a service to our customers we are providing this early version of the manuscript.The manuscript will undergo copyediting, typesetting, and review of the resulting proofbefore it is published in its final form. Please note that during the production processerrors may be discovered which could affect the content, and all legal disclaimers thatapply to the journal pertain.
Page 1 of 49
Accep
ted
Man
uscr
ipt
Salt tolerance in the halophyte Salicornia dolichostachya Moss: growth, morphology and 1
physiology 2
3
4
Diana Katschnig*, Rob Broekman, Jelte Rozema 5
6
7
Systems Ecology, Department of Ecological Science, Faculty of Earth and Life Sciences, VU 8
University Amsterdam, De Boelelaan 1085, 1081 HV Amsterdam, The Netherlands 9
10
11
*Corresponding author: 12
Diana Katschnig, Systems Ecology, Department of Ecological Science, Faculty of Earth and Life 13
Sciences, VU University Amsterdam, De Boelelaan 1085, 1081 HV Amsterdam, The 14
Netherlands. 15
Tel.: +31 20 5982777; E-mail address: [email protected] 16
17
Page 2 of 49
Accep
ted
Man
uscr
ipt
29
30
31
Abstract 32
Salinization of agricultural land is an increasing problem. Because of their high tolerance 33
to salinity, Salicornia spp. could become models to study salt tolerance; they also represent 34
promising saline crops. The salinity-growth response curve for Salicornia dolichostachya Moss 35
was evaluated at 12 salt concentrations in a hydroponic study in a greenhouse and at 5 different 36
seawater dilutions in an outside setting. Salt concentrations ranged between 0 mM and 500 mM 37
NaCl (≈seawater salinity). Plants were grown for six weeks and morphological and physiological 38
adaptations in different tissues were evaluated. 39
S. dolichostachya had its growth optimum at 300 mM NaCl in the root medium, 40
independent of the basis on which growth was expressed. The relative growth rate (RGR) in the 41
greenhouse experiment was comparable with RGR-values in the outdoor growth experiment. 42
Page 3 of 49
Accep
ted
Man
uscr
ipt
Leaf succulence and stem diameter had the highest values at the growth optimum (300 mM 43
NaCl). Carbon isotope discrimination (δ 13C) decreased upon salinity. S. dolichostachya 44
maintained a lower leaf sap osmotic potential relative to the external solution over the entire 45
salinity range, this was mainly accomplished by accumulation of Na+ and Cl-. Glycine betaine 46
concentrations did not significantly differ between the treatments. Na+:K+-ratio and K+-47
selectivity in the shoots increased with increasing salinity, both showed variation between 48
expanding and expanded shoot tissue. We conclude that S. dolichostachya was highly salt 49
tolerant and showed salt requirement for optimal growth. Future growth experiments should be 50
done under standardized conditions and more work at the tissue and cellular level needs to be 51
done to identify the underlying mechanisms of salt tolerance. 52
Keywords: Salicornia dolichostachya Moss, salinity tolerance, salt stimulated growth, Na+:K+-53
ratio and K+-selectivity, glycine betaine 54
55
1. Introduction 56
The need for salt tolerant crops increases as substantial percentages of cultivated land 57
worldwide are affected by salinity (FAO 2002). The prospect is that fresh water will become 58
scarce as a result of an increasing demand of the growing world population (UN 2010). 59
Moreover, as a result of global warming, arable land may suffer from increasing saline and dry 60
conditions in the future, whereas sea level rise will particularly threaten coastal lowlands. Most 61
conventional crop species are salt sensitive, e.g. rice, chickpea, corn and most fruit crops. Plants 62
growing on saline soils face several challenges. Water uptake is hampered because of the low 63
water potential of the soil (Munns and Tester, 2008). Salts accumulate within the plant to toxic 64

Page 4 of 49
Accep
ted
Man
uscr
ipt
levels (Greenway and Munns, 1980) and deficiencies of essential nutrients occur, e.g. K+ 65
(Flowers and Colmer, 2008; Flowers et al., 1986). Plants that naturally possess the traits needed 66
to grow and reproduce on saline soils at salt concentrations of at least 200 mM are termed 67
halophytes by Flowers and Colmer (2008). By studying the diverse set of mechanisms that 68
halophytes employ to deal with salt, we might gain insight into which parameters are most 69
promising to target for increasing salt tolerance in conventional crops. The taxonomic diversity 70
of halophytes prompted Glenn et al. (1999) to predict the prospective of introducing salt 71
tolerance in crops by small changes in the genetic makeup, although this has proved to be fairly 72
difficult thus far (Flowers and Flowers, 2005). Alternatively, domestication of halophytes can 73
convert them into high yielding crops (Rozema and Flowers, 2008) or halophytes can be used for 74
remediation and reclamation of salt affected lands (Barrett-Lennard, 2002). 75
The plant order of the Caryophyllales contains the highest percentage of halophytic species 76
amongst all orders of flowering plants (Flowers et al., 2010), 21.4% of all halophytic species are 77
within this order. Within this order the family of the Amaranthaceae comprises the highest 78
number of halophytic genera (Flowers et al., 1986). The genus Salicornia belongs to the 79
Amaranthaceae and consists of highly salt tolerant annuals without salt glands or salt bladders. 80
Salicornia spp. occur in saline environments around the globe, except for Australia and South 81
America where other salt tolerant members of the Salicornioideae occur (Kadereit et al., 2007). 82
There is no general consensus of the number of Salicornia species due to the large phenotypic 83
variation between the same species and morphological parallelism between different species 84
(Davy et al., 2001; Kadereit et al., 2007). The estimations lie around 25–30 species in the genus 85
(Kadereit et al., 2007). Several economically viable applications have been suggested for 86
Salicornia species. Salicornia bigelovii has been proposed as a promising oil seed crop with 87
Page 5 of 49
Accep
ted
Man
uscr
ipt
yields comparable to conventional crops under non-saline conditions (Glenn et al., 1991). 88
Salicornia spp. have been successfully grown in aquaculture systems (Grattan et al., 2008) and 89
can be used for human food consumption. Due to the high salt tolerance, high growth rate, short 90
generation time, its capability of producing many seeds and agronomic value, Salicornia spp. can 91
become valuable model species to study salt tolerance mechanisms and as a saline crop. 92
Salicornia dolichostachya Moss is a tetraploid species that is native to The Netherlands 93
below the mean high water line (MHWL) and is subjected to flooding on a regular basis 94
(Rozema 1987). The present study determined the salinity-growth response curve for S. 95
dolichostachya in hydroponic culture at 10 external NaCl concentrations with small intervals 96
between salt concentrations (50 mM NaCl). Additionally, the growth response curve was 97
determined in two seawater treatments in the greenhouse and compared with the growth response 98
of plants grown in an outside setting. We tried to characterize the morphological and 99
physiological traits underlying the growth response. Succulence, stem diameter, δ13C, osmotic 100
potential of leaf sap and tissue solute concentrations (Na+, Cl-, K+, Mg2+ and glycine betaine) 101
were measured in root tissue and expanding - and expanded succulent shoot tissue. 102
103
2. Materials and methods 104
2.1 Plant material 105
Seeds of Salicornia dolichostachya were collected below the mean high water line 106
(MHWL) at Lutjesstrand, Wieringen, The Netherlands in November 2010. Before sowing, seeds 107
were stored dry in a refrigerator at 7 ºC for 50 d, to simulate a stratification period. Two separate 108
experiments were done. In experiment 1 we investigated the effect of a range of NaCl 109
concentrations in the root medium (0-5-50-100-150-200-250-300-400-500 mM NaCl) and two 110
Page 6 of 49
Accep
ted
Man
uscr
ipt
seawater treatments (electric conductivity (EC) 20 and 40 dS/m, this is ~210 and ~420 mM 111
NaCl, respectively) on growth and a set of physiological parameters in S. dolichostachya and this 112
experiment was conducted in a greenhouse. In experiment 2 we grew S. dolichostachya in an 113
inland seawater drip-irrigation system, to be able to compare the relative growth rate (RGR) in 114
experiment 1 to the RGR of the same species in an outside setting. 115
116
2.2 Experiment 1: Greenhouse growth experiment 117
Plant growth and NaCl treatments. Seeds were sown on peat soil (seed pot soil; 118
Jongkind, Aalsmeer, The Netherlands) and grown for 61 d. Seedlings were washed free of soil 119
before being transplanted individually in black 1-L polyethylene pots containing (in mM): K+, 120
3.001 ; Ca2+, 2 ; Mg2+, 0.5 ; NO3-, 5 ; NH4
+, 1.001 ; HPO42-, 1 ; SO4, 0.516 ; Cl-, 0.001 ; H2BO3
-, 121
0.025 ; Mn2+, 0.002 ; Zn2+, 0.002 ; Cu2+, 0.001 ; Mo2+, 0.001 ; Fe-Na-EDTA, 0.01, buffered with 122
2 mM MES, (pH 6.0). Seedlings were grown for 14 d to recover from transplanting; over these 123
14 d the plants resumed growth as demonstrated by an increase in length of the main stem. 124
During the recovery period no NaCl was added to the nutrient solution and seedlings were 125
covered with transparent plastic pots to keep the relative humidity of the air above 90%. After 126
the recovery period salt treatments were started. Plants were randomly allocated into 12 127
treatment groups, consisting of 0, 5, 50, 100, 150, 200, 250, 300, 400 and 500 mM NaCl and two 128
seawater treatments with EC values of 20 and 40 dS/m (seawater was collected at Bergen aan 129
Zee, The Netherlands, March 2011). Extra nutrients were added (KNO3 85.5 mg L-1, NH4H2PO4 130
3.3 mg L-1 and Fe-EDDHMA 5 mg L-1) to the two seawater treatments to prevent shortage of 131
essential nutrients. Each treatment group consisted of 9 replicate plants. NaCl treatments were 132
applied by adding NaCl to the nutrient solution in steps of 50 mM per day to prevent an osmotic 133

Page 7 of 49
Accep
ted
Man
uscr
ipt
shock (Munns 2005), salinity in plants subjected to the seawater treatments was also increased 134
daily with the equivalent (5 dS/m) of 50 mM NaCl. Nutrient solutions were changed weekly. 135
Plants were grown in a randomized design in a naturally lit greenhouse with additional lamps 136
(PAR of 300 μmol m-2 s-1 at plant level, 14/10 h light/dark) in March-May 2011 in Amsterdam, 137
The Netherlands, maximal outdoor light intensity was PAR of ~1500 μmol m-2 s-1. The 138
temperature was 20±2/16±2 ºC day/night, and the relative humidity of the air 70±10/90±2 % 139
day/night, respectively. Pots were randomly re-located every week. The duration of the treatment 140
was 42 d. 141
Non-destructive growth measurements. During the experiment growth was followed 142
weekly non-destructively as increase of main stem length, number of internodes of the main 143
stem, number of branches and thickness of the 3rd succulent internode from the shoot base 144
measured with a thickness gauge (NO. 2046-08, accuracy 0.01 mm, Mitutuyo, Japan). 145
Harvest. Plants were harvested after the recovery period before the start of the salt 146
treatment (initial harvest) and after 42 d of the start of the salt treatment. Plants allocated to the 0 147
and 5 mM NaCl treatments started to flower 14 d after commencement of treatment, and were 148
harvested 21 d after the start of the treatment due to retarded growth, indicated by a light brown 149
yellowish color and wilting. At harvest plants were rinsed in de-mineralized water 3 times for 5 s 150
and carefully blotted dry. Thereafter, the plants were separated into succulent leaf tissue, woody 151
leaf tissue (i.e. not succulent) and roots. Note that because of the reduced growth form of 152
Salicornia the words leaf and stem are interchangeable in this paper. Succulent leaf tissue was 153
further divided into expanding succulent leaf tissue, assumed to be the first 1-4 mm from the tips 154
(apexes) of the stems, and expanded succulent leaf tissue, assumed to be from 4 mm of the tips 155
of the stems onward (away from the apexes). Separating expanding and expanded shoot tissue 156

Page 8 of 49
Accep
ted
Man
uscr
ipt
was done by cutting with a razor blade. Fresh biomass of different shoot tissues and roots were 157
recorded and total leaf area of the green tissues was estimated with a leaf area meter (LI-COR 158
3100, Li-Cor inc., Lincoln, NE, USA). From a subgroup of plants (3 plants per treatment) 159
diameter and length of all individual branches were recorded and leaf area calculated. Leaf area 160
measurements with the leaf area meter gave a consequent lower value for leaf area than the leaf 161
area calculations on the basis of diameter and length; this is because of the cylindrical growth 162
form of the plants. Therefore a correction for leaf area determined by the diameter-length method 163
was applied on the leaf area values measured with the leaf area meter. The reason to still use the 164
leaf area meter is that the diameter-length measurements are more laborious and time consuming 165
due to the many branches the plant develops. After measuring leaf area, subsamples of shoot and 166
root tissues were shock-frozen in liquid nitrogen and either stored at -20ºC, -80ºC or freeze-dried 167
for 5 d. Other subsamples were oven dried at 70 ºC for 72 h after which dry masses were 168
recorded. Dried plant material was ground into a fine powder using mortar and pestle. Material 169
stored at -20ºC was used to measure osmotic potential. Freeze-dried material was used to analyze 170
glycine betaine. Oven-dried material was used to measure Na+, Cl-, K+ and Mg2+ and to calculate 171
the RGR, with the formula (Hunt et al., 2002): 172
173
Where, W1 and W2 is the dry weight or ash-free dry weight of the plants at initial and final 174
harvest, respectively, and t2-t1 is the time in days between the two harvests. 175
Carbon isotope composition. Measurements of carbon isotope composition were made 176
on subsamples of oven-dried expanding and expanded leaf tissue and were determined using an 177
elemental analyzer (NC2500, ThermoQuest Italia, Rodano, Italy) coupled online to a stable 178
isotope ratio mass spectrometer (Delta plus, ThermoQuest Finnigan, Bremen, Germany). To 179
Page 9 of 49
Accep
ted
Man
uscr
ipt
check for the reproducibility of the method a plant sample (-28.50 ‰; 45.2 % C) was measured 180
in triplicate in each run. Expanding and expanded leaf tissue samples were measured in 181
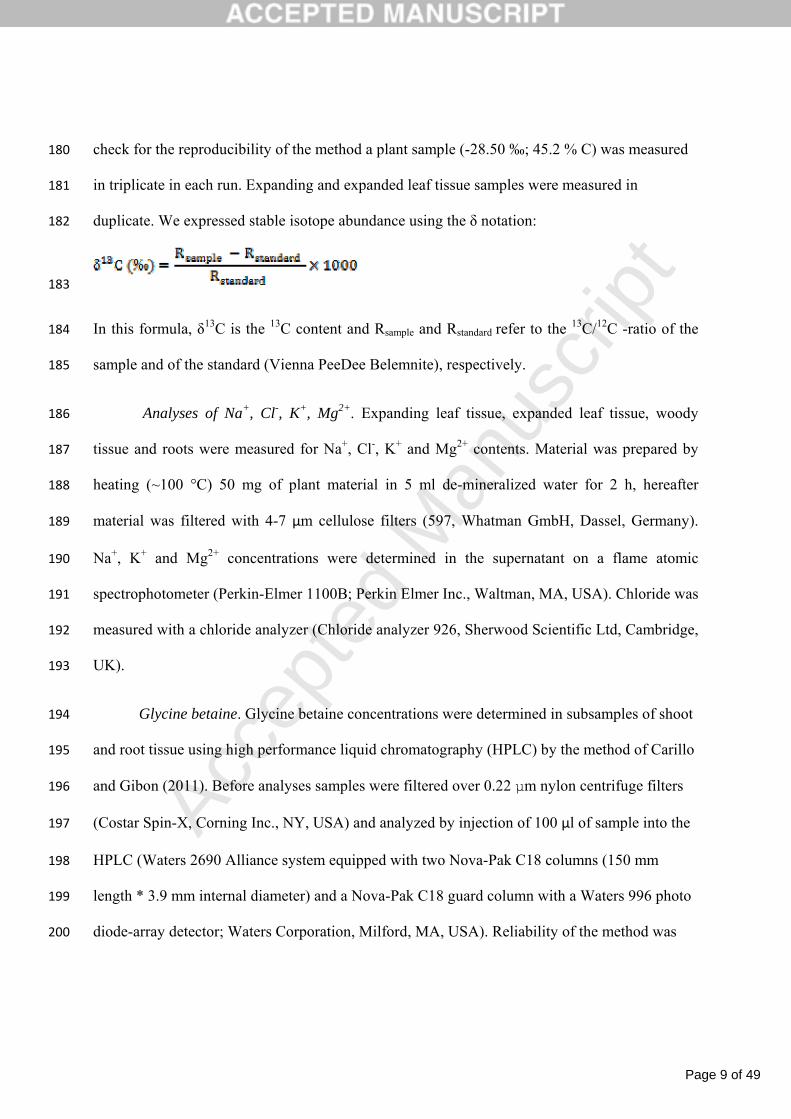
duplicate. We expressed stable isotope abundance using the δ notation: 182
183
In this formula, δ13C is the 13C content and Rsample and Rstandard refer to the 13C/12C -ratio of the 184
sample and of the standard (Vienna PeeDee Belemnite), respectively. 185
Analyses of Na+, Cl-, K+, Mg2+. Expanding leaf tissue, expanded leaf tissue, woody 186
tissue and roots were measured for Na+, Cl-, K+ and Mg2+ contents. Material was prepared by 187
heating (~100 °C) 50 mg of plant material in 5 ml de-mineralized water for 2 h, hereafter 188
material was filtered with 4-7 μm cellulose filters (597, Whatman GmbH, Dassel, Germany). 189
Na+, K+ and Mg2+ concentrations were determined in the supernatant on a flame atomic 190
spectrophotometer (Perkin-Elmer 1100B; Perkin Elmer Inc., Waltman, MA, USA). Chloride was 191
measured with a chloride analyzer (Chloride analyzer 926, Sherwood Scientific Ltd, Cambridge, 192
UK). 193
Glycine betaine. Glycine betaine concentrations were determined in subsamples of shoot 194
and root tissue using high performance liquid chromatography (HPLC) by the method of Carillo 195
and Gibon (2011). Before analyses samples were filtered over 0.22 μm nylon centrifuge filters 196
(Costar Spin-X, Corning Inc., NY, USA) and analyzed by injection of 100 μl of sample into the 197
HPLC (Waters 2690 Alliance system equipped with two Nova-Pak C18 columns (150 mm 198
length * 3.9 mm internal diameter) and a Nova-Pak C18 guard column with a Waters 996 photo 199
diode-array detector; Waters Corporation, Milford, MA, USA). Reliability of the method was 200
Page 10 of 49
Accep
ted
Man
uscr
ipt
checked by injection of known amounts of glycine betaine (obtained from Sigma-Aldrich, 201
Germany) into tissue samples. 202
Sap osmotic potential. Plants samples were shock-frozen in liquid nitrogen immediately 203
after harvest and stored at -20 ºC in plastic vials. The material was crushed, left to thaw and spun 204
for 30 s at 13000 rpm (Micro Centaur, Beun De Ronde, Abcoude, The Netherlands) while still in 205
the vial just before measurement. 10 μl of the supernatant was used to measure osmolality using 206
a vapour pressure osmometer (Wescor model 5500, Wescor Inc., Logan, UT, USA). Calibration 207
of the osmometer was checked every 10th sample. Samples were measured in duplicate. The 208
osmotic potential (ψs) was determined according to the van‘t Hoff equation: 209
Where, c is the osmolality of the solution (osmol L-1), R is the universal gas constant (kg mol-1 210
K-1) and T is the temperature (°K). Ion activity coefficients of root medium and tissue were 211
assumed to be 0.92 (Robinson and Stokes 1959). 212
213
2.3 Experiment 2: Outside growth experiment 214
Plant cultivation and growth measurements. We used a closed seawater drip irrigation 215
system located at the island of Texel at the NIOZ harbor (53°00’N and 4°47’E) in The 216
Netherlands. In May 2011, seeds of the same population of S. dolichostachya as in experiment 1 217
were sown onto coarse sand in wooden crates of 1 m2 and 20 cm height. Plants were not watered 218
for two weeks after sowing but received sufficient rain water for germination. Treatment was 219
started 2 weeks after sowing by drip irrigation with dilutions of Waddensea water: 0-10-20-30 220
and 40 dS/m, with added nutrients (KNO3 85.5 mg L-1, NH4H2PO4 3.3 mg L-1 and Fe-EDDHMA 221
5 mg L-1). Drip irrigation water was applied for 30 minutes every hour during 15 hours a day. 222
The distance between the holes in the irrigation tubes was 30 cm. Holes in the bottom of the 223
Page 11 of 49
Accep
ted
Man
uscr
ipt
crates allowed drainage of the irrigation water, which was collected in a second crate and 224
returned to the main reservoir with a volume of 1000 L. Reservoirs were completely changed at 225
least every 2 weeks and more often if the electrical conductivity (EC) of the solutions deviated 226
more than 10% from the intended EC. Precipitation was measured with a rain gauge. There were 227
8 replicate crates for the 10, 20 and 40 dS/m treatment and 4 replicate crates for the 0 and 30 228
dS/m treatment. An initial harvest of the plants was done at the start of the treatments and 2nd and 229
3rd harvests were done after 27 and 67 d after commencement of the treatment, respectively. At 230
harvest, plants were rinsed in de-mineralized water for 3 times 5 s and carefully blotted dry. 231
Fresh masses of leaves and roots were recorded and leaf area was measured as described in 232
experiment 1. After measuring leaf area plants were oven dried at 70 ºC for 72 h after which dry 233
masses were recorded. RGR was calculated over the 40 d period between the second and third 234
harvest with the formula described in experiment 1. 235
236
2.4 Statistical analyses 237
Before analysis normality and homogeneity of the data was checked. One-way ANOVA 238
with Tukey’s post hoc test was used to assess the effect of salt treatment on the different 239
parameters measured. If the normality or homogeneity assumptions were violated, data were 240
either transformed or a non-parametric test (Kruskal-Wallis) was used. We analyzed the effects 241
of salinity on carbon isotope discrimination, osmotic potential, K+-selectivity and Na+:K+-ratio in 242
different tissue types (expanding and expanded plant tissues) with mixed model regression 243
analysis, with individual measurements nested within measurement series and plant identity. 244
Tissue type and salinity level were treated as fixed factors and measurement series and plant 245
identity as random factors. Data analysis was performed using SPSS 17.0. 246

Page 12 of 49
Accep
ted
Man
uscr
ipt
247
3. Results 248
3.1 Growth 249
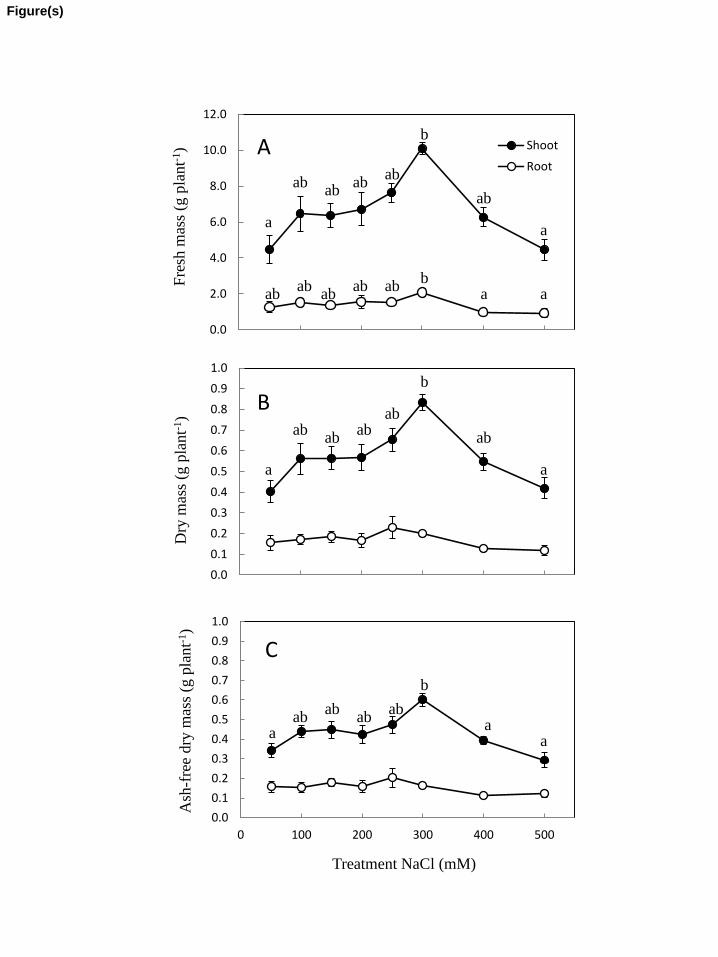
The results of the final harvest of the 13 weeks old plants (0 and 5 mM NaCl treatments) 250
and 16 weeks old plants (50-500 mM NaCl treatments) are shown in figure 1. Growth was 251
measured as differences in fresh mass, dry mass and ash free dry mass between treatments. 252
Plants subjected to the 0 and 5 mM NaCl treatments where harvested 21 d after start of the 253
treatment. Shoot and root fresh mass, dry mass and ash free dry mass at 0 and 5 mM NaCl 254
treatments did not differ significantly after three weeks of growth (data not shown) in these 255
plants. In the 50-500 mM NaCl treatments shoot fresh mass (Fig. 1A) and dry mass (Fig. 1B) 256
increased between 50-300 mM NaCl and declined at 300-500 mM NaCl. Shoot fresh mass and 257
dry mass at 300 mM NaCl, was significantly higher compared to the lowest (50 mM) and highest 258
(500 mM) salt treatments. Shoot dry mass at 50 and 500 mM NaCl was 48 and 50% respectively 259
of the dry mass in the 300 mM treatment. Shoot ash free dry mass (Fig. 1C) showed almost the 260
same pattern as for dry mass, except that 400 mM NaCl in the root medium also resulted in a 261
significant decrease in ash-free dry mass. Root fresh mass showed a significant effect of 262
increased salinity (Fig. 1A), 400 and 500 mM NaCl in the root medium decreased root fresh 263
mass by 45 and 48% respectively, in comparison with the 300 mM NaCl treatment. In contrast to 264
the shoots, the salt treatments had no effect on root dry mass (Fig. 1B) or root ash-free dry mass 265
(Fig. 1C) at 50-500 mM NaCl over the 42 d. 266
267
*Figure 1 near here* 268
269
Page 13 of 49
Accep
ted
Man
uscr
ipt
The RGR calculated on a total plant dry mass basis and on ash-free dry mass basis (Table 270
2) showed similar results as the shoot dry mass and shoot ash-free dry mass production with the 271
maximum value at 300 mM. The RGR at 300 mM NaCl in the root medium was significantly 272
higher compared to the rate at 50 and 500 mM NaCl on dry mass basis (respectively 82% and 273
81%), and also significantly higher compared to the RGR at 50, 400 and 500 mM NaCl on a ash-274
free dry mass basis. The RGR values from the greenhouse hydroponic culture experiment 275
calculated on a dry mass basis where compared with the RGR values of plants grown in the 276
inland seawater drip-irrigation system at the island of Texel for 40 d during the period July–277
August 2012. These values ranged between 0.063±0.005 and 0.092±0.004 g g-1 d-1, 0 dS/m and 278
40 dS/m salinity in the root zone respectively, and are in the same range as the RGR values of 279
the greenhouse hydroponics experiment. 280
281
*Table 2 near here* 282
283
3.2 Water content, succulence and stem diameter 284
Water content of succulent leaf tissue was calculated as the difference between fresh and 285
dry mass and is expressed on a dry mass basis (Fig. 2A). The water content remained constant up 286
to 400 mM NaCl in the root medium, there was a trend towards a decrease in water content at 287
500 mM NaCl in the root zone (not statistically significant, p=0.071). Measurements of 288
succulence and stem diameter (Fig. 2B) showed the highest values at 300 mM NaCl in the root 289
medium. Differences in succulence were statistically significant (p<0.05), differences in stem 290
diameter were not statically significant (p=0.074) between the different salinity treatments. 291
292
Page 14 of 49
Accep
ted
Man
uscr
ipt
*Figure 2 near here* 293
294
3.3 Carbon isotope discrimination 295
Values of carbon isotope discrimination were measured in expanding and expanded leaf 296
tissues (Fig. 3). Values of δ13C significantly increased (e.g. less negative values) in expanding 297
and expanded leaf tissue with increasing NaCl concentrations in the root medium. The 298
interaction between NaCl treatment and carbon isotope discrimination did not differ significantly 299
between the two tissue types (p=0.066). 300
301
*Figure 3 near here* 302
303
3.4 Leaf sap osmotic potential 304
Molarity of Na+, Cl-and K+ of expanding and expanded leaf tissues (Table 3) was 305
calculated from tissue ion data and expressed on a water basis as the difference between fresh 306
and dry mass. Contributions of Na+ and Cl- to the leaf tissue sap osmotic potential (Table 3) were 307
calculated from the tissue molarity data, assuming that Na+, Cl- and K+ in the plant are 308
osmotically active with an osmotic coefficient of 0.92 along the salinity range 50-500 mM NaCl 309
(Robinson and Stokes 1959). Na+ and Cl- were estimated to account for 66-75% of the sap 310
osmotic potential of expanding leaf tissue and for 68-83% of the sap osmotic potential of 311
expanded leaf tissue. 312
The osmotic potential of expressed leaf sap significantly decreased as the osmotic 313
potential of the solution decreased (Fig. 4). The difference between osmotic potential of sap of 314
Page 15 of 49
Accep
ted
Man
uscr
ipt
expanding and expanded leaf tissue and the osmotic potential of the root medium significantly 315
decreased from 1.574 and 1.521 MPa, respectively, at 50 mM NaCl in the root medium to 0.636 316
and 0.744 MPa, respectively, at 500 mM NaCl in the root medium. The osmotic potential of both 317
tissue types reacted in the same way to the NaCl treatments. 318
319
*Table 3 and figure 4 near here* 320
321
3.5 Glycine betaine 322
Concentrations of glycine betaine expressed on dry mass basis ranged between 343 and 323
486 μmol g-1 dm for succulent leaf tissue and between 168.5 and 275.9 μmol g-1 dm for roots, at 324
150 and 500 mM NaCl in the root medium, respectively (data not shown). Expressed on a water 325
basis (the difference between fresh and dry mass), glycine betaine concentrations were between 326
29.3 and 44.7 mM in the succulent leaf tissue and between 25.4 and 35.1 mM in the roots (Table 327
4) and not changing with increasing salinity, although there was a trend (p=0.054) towards 328
higher concentrations of glycine betaine in succulent leaf tissue at 500 mM NaCl compared to 329
the plants grown at 100-400 mM NaCl in the root medium. 330
331
*Table 4 near here* 332
333
3.6 Tissue ions 334
Concentrations of Na+, Cl-, K+, and Mg2+ were determined in roots, woody leaf tissue, 335
and expanding and expanded leaf tissue. Na+, Cl-, K+ concentrations expressed on a water basis 336
in expanding and expanded leaf tissue are shown in table 3, concentrations in woody leaf tissue 337
Page 16 of 49
Accep
ted
Man
uscr
ipt
and roots are not shown. Na+ and Cl- significantly increased in all of these tissues when NaCl 338
concentrations in the root medium were increased. In contrast to Na+ and Cl-, concentrations of 339
K+ decreased in all tissues when NaCl concentrations in the root medium were increased from 50 340
to 150 mM NaCl and remained fairly stable when concentrations were further increased from 341
150 to 500 mM NaCl in the root medium. Concentrations of Mg2+ significantly decreased in 342
succulent leaf tissue and root tissue when NaCl concentrations in the root medium were 343
increased from 50-150 mM NaCl (data not shown). Mg2+ concentrations in woody leaf tissue did 344
not change with increasing salinity in the root medium. 345
The Na+:K+-ratio of expanding and expanded leaf tissue significantly increased upon 346
increasing NaCl concentrations in the root medium (Fig. 5A). There was a significant interaction 347
between treatment and tissue type (p<0.05). Selectivity for K+ over Na+ in the plant was 348
calculated as the ratio of K+ concentrations in expanding or expanded leaf tissue to that of the 349
root medium, divided by the ratio of Na+ concentrations in expanding or expanded leaf tissue in 350
the plant to that of the medium (Fig. 5B). K+-selectivity significantly increased in both 351
tissues with increasing NaCl concentrations in the root medium. The interaction effect between 352
the in the two tissue types upon NaCl concentrations in the root medium was 353
significantly different. 354
355
*Figure 5 near here* 356
357
4. Discussion 358
Growth 359

Page 17 of 49
Accep
ted
Man
uscr
ipt
The present study shows that growth of Salicornia dolichostachya increased when salt 360
concentrations in the root medium were increased from 50 to 300 mM NaCl (Fig. 1). Optimal 361
growth occurred at 300 mM NaCl, and growth declined when concentrations were further 362
increased to 500 mM NaCl. The basis upon which growth is expressed in succulent halophytes 363
can be deceptive. If growth is expressed on fresh mass or dry mass basis, a high water content 364
and a large contribution of inorganic ions; Na+, Cl-, K+ (i.e. ash), can obscure an organic growth 365
effect (Yeo and Flowers, 1980). Optimal growth expressed as dry mass at concentrations of 50-366
250 mM NaCl in the root medium has been observed for a substantial number of dicotyledonous 367
halophytes, to a lesser extent growth stimulation of organic dry mass has been reported (cf. 368
Flowers and Colmer, 2008; Flowers et al., 1986). The growth optimum at 300 mM NaCl in the 369
root medium in this study was the same regardless of growth expression on fresh mass, dry mass 370
or ash-free dry mass basis, indicating that the observed growth stimulation is not merely based 371
on inorganic ion accumulation. This has also been previously reported for S. bigelovii (Ayala and 372
Oleary, 1995). Nevertheless, the contribution of ash to shoot dry weight increased gradually with 373
increasing NaCl in the root medium, resulting in lower values of ash-free dry mass at higher 374
(400-500 mM NaCl) salt concentrations in the root medium (Fig. 1C). Regardless of large 375
contributions of inorganic ions to dry mass, most salinity growth experiments performed with 376
Salicornia spp. only report growth expressed on a dry mass basis. We summarized the literature 377
data on growth response (expressed on dry mass basis) of Salicornia spp. to external salinity 378
(Table 1). Of the 20 papers included in table 1 (for a description of the criteria for literature 379
search see caption of Table 1), 16 papers reported higher growth of plants when the salinity of 380
the external medium was higher than the salinity of the control treatment, the latter being defined 381
as less than 10 mM NaCl in the root medium. In contrast, four papers did not find higher growth 382
Page 18 of 49
Accep
ted
Man
uscr
ipt
upon salt addition in the root medium at all. The reported growth stimulation by NaCl differed in 383
extent; between 102 and 405% of the control dry weight, and occurred at different external salt 384
concentrations; ranging from 85 to 600 mM NaCl. There were, as well, large differences in 385
absolute values of the recorded dry masses between the papers even referring to the same species 386
within the genus Salicornia e.g.; absolute dry mass values ranged from 2.3 mg plant-1 for S. 387
europaea at 200 mM NaCl in the root medium for 45 d (Aghaleh et al., 2009) to 13.8 g plant-1 for 388
S. europaea at 300 mM NaCl external salinity grown as well for 45d (Balnokin et al., 2005). 389
Treatments started at germination or 14 d after germination, respectively. 390
391
*Table 1 near here* 392
393
The taxonomy of Salicornia spp. is described as notoriously difficult (Davy et al., 2001; 394
Kadereit et al., 2007) with large phenotypic differences between the same species and 395
morphological parallelism between different species, which can readily lead to wrong 396
identification of the species. Identification of S. dolichostachya in this study was established 397
based on the morphological features described in Huiskes et al. (1985) and confirmed by one of 398
the authors of this article. Also, the collection of seeds from the solitary plants at the lowest 399
locations in the salt marsh gave additional support that the species used in this study is most 400
likely S. dolichostachya. As might be expected, environmental factors also influence the shape 401
and height of the growth response curve (Barbour, 1970), such as, nitrogen availability (Rozema 402
1987), availability of other minerals in the culture medium (e.g., Ca2+, Munns and Tester, 2008) 403
and light intensity (Ushakova et al., 2008). Furthermore, differences in the experimental 404
treatments influence the recorded growth (rate), e.g. the duration of the treatments and age of the 405
Page 19 of 49
Accep
ted
Man
uscr
ipt
plants at the start of the treatment because differences in growth between salinity treatments 406
become more pronounced with increasing time. Another reason for differences between studies 407
may arise from the number and size of the interval in NaCl concentrations in the treatments; a 408
limited number of concentrations and wide intervals allow only a coarse indication of the 409
response curve. Finally, another complicating factor with comparing growth curves of species 410
between different experimental setups lies in the choice of an appropriate control. In this study, 411
the plants at 0 and 5 mM NaCl in the root medium started to flower, ceased to grow and looked 412
unhealthy (indicated by a light brown yellowish color and wilting) 14 d after the start of the salt 413
treatment. The plants received only trace quantities of NaCl present in the potting soil during the 414
first 61 days of the pre-cultivation period, 14 d before start of the salt treatment they were grown 415
on water culture with 0.01 mM Na+. Poor survival of S. bigelovii at low Na+ concentrations was 416
also found by Webb (1966). In contrast, numerous coastal plants demonstrate optimal growth at 417
0 mM NaCl in hydroponic culture (Rozema and van Diggelen, 1991). In the literature, it has 418
been concluded that there is no obligatory salt requirement for growth of dicotyledonous 419
halophytes (Flowers et al., 1977). Except for, plants with a C4-photosynthetic pathway that 420
requires small amounts (< 0.1 mM) of Na+ for regeneration of phosphoenolpyruvate (Brownell 421
and Crosslan, 1972). Although, use of NaCl-free solutions can be regarded as deficient for 422
dicotyledonous halophytes that have optimal growth at NaCl concentrations above 50 mM 423
(Subbarao et al., 2003), as for S. dolichostachya in this study. Does impaired growth of 424
Salicornia plants in 0-5 mM NaCl then reflect a NaCl requirement of Salicornia over a 425
prolonged time period? And if so, which part(s) of the metabolism of Salicornia plants require(s) 426
NaCl? To our knowledge this question remains unanswered. NaCl concentrations in the 427
environments where Salicornia spp. naturally occur generally range from approximately 250 428
Page 20 of 49
Accep
ted
Man
uscr
ipt
mM in early spring to as much as 750 mM in autumn (Mahall and Park, 1976), and were found 429
to be seldom lower than 20 mM (Silva et al., 2007). A good control would be to choose a NaCl 430
concentration towards the lower values in this range which is still sufficient for the plants to 431
sustain minimal growth. Overall, comparing growth curves from different experiments requires a 432
standardized way of conducting growth experiments and expressing growth. 433
It has been suggested that as a consequence of salt tolerance halophytes might be slow 434
growing (Niu et al., 1995). To investigate if a trade–off between salt tolerance and relative 435
growth rate (RGR) exists, we measured the RGR (Table 2) and compare it to RGR values for a 436
variety of plants species in the literature. In this study, the highest RGRs, 0.092 g g-1 d-1 and 437
0.080 g g-1 d-1 expressed on dry mass and ash-free dry mass basis, respectively, coincide with the 438
optimal external salinity (300 mM NaCl) as was found for growth expressed on fresh mass, dry 439
mass and ash-free dry mass basis (Fig. 1). The RGR values of the outside seawater drip-440
irrigation system were compared to the RGR values found in the hydroponic greenhouse 441
experiment (Table 2). These RGR values were in the same range, which indicates that growth in 442
the greenhouse experiment was not restricted by e.g. light intensity and relative humidity 443
compared to the outside growth experiment. RGR values expressed on ash-free dry mass basis 444
were lower than RGR values expressed on dry mass basis, but showed the same pattern. Only a 445
few of the previous studies conducted with Salicornia spp. in hydroponic culture reported RGR 446
values. The highest RGR values reported (expressed on an ash-free dry mass basis) were for S. 447
bigelovii; 0.160 g g-1 d-1 at 200 mM NaCl in the root medium (Ayala and Oleary, 1995) and for 448
S. europaea; ~0.3 g g-1 d-1 during 7 d at 0 mM NaCl after 21 d of growth at 540 mM NaCl 449
(Glenn and Oleary, 1984). If we compare these RGRs and the RGR of S. dolichostachya in this 450
study to the potential RGRs found in a comparison of over 100 wild plant species (though not in 451
Page 21 of 49
Accep
ted
Man
uscr
ipt
relation the salinity (Grime and Hunt, 1975)), the RGRs of Salicornia spp. lie towards the middle 452
(S. dolichostachya, this experiment) or higher range (S. bigelovii, Ayala and Oleary, 1995; S. 453
europaea, Glenn and Oleary, 1984) of the RGR values in the comparison of Grime and Hunt 454
(1975). Grime and Hunt (1975) reported RGRs between 0.05 g g-1 d-1 and 0.3 g g-1 d-1. Reports 455
on the yield of halophytes (a.o. S. bigelovii) under saline field conditions listed yields that were 456
comparable with conventional crops (cf. Glenn et al., 1999), which shows the potential use of 457
Salicornia in saline agriculture. 458
459
Morphological and physiological aspects of salt tolerance in S. dolichostachya 460
Leaf succulence (water content per unit leaf area) and leaf diameter in S. dolichostachya 461
both showed the highest values at 300 mM NaCl in the root medium (Fig. 2), this coincides with 462
the NaCl concentration at which optimal growth is observed in this experiment. Increase in leaf 463
succulence and leaf stem diameter may be achieved by an increase in size of the cells and the 464
relative size of their vacuoles or an increase in the number of cell layers (Flowers et al., 1986; 465
Shabala and Mackay, 2011). It has been suggested that an increase in thickening of the leaf 466
tissues in response to salinity is a direct response to have increased storage area for ions (i.e. Na+ 467
and Cl-) (Jennings, 1968) and to reduce the surface area which leads to increased water use 468
efficiency. 469
Carbon isotope discrimination is often related to stomatal conductance; more carbon 470
isotope discrimination occurs when stomata are open. In this study, carbon isotope 471
discrimination decreased (i.e. δ13C values increased) linearly with increased salinity in the root 472
medium (Fig. 3), indicating stomatal closure at higher salinities. Open stomata facilitate water 473
loss and at the same time discrimination against 13CO2 is high. Lower discrimination against 13C 474
Page 22 of 49
Accep
ted
Man
uscr
ipt
is correlated with closure of stomata (Farquhar et al., 1989) and when this leads to reduced 475
transpiration also with increased long term water use efficiency. Decreased carbon isotope 476
discrimination with increasing salinity has previously been reported for S. bigelovii, (Ayala and 477
Oleary, 1995) and for S. rubra (Khan et al., 2001). Note that the lowest δ13C values in Fig. 4 (at 478
500 mM NaCl in the root medium) do not coincide with the highest values for succulence and 479
stem diameter (at 300 mM NaCl), although these three factors are all thought to be correlated 480
with water use efficiency. As we did not measure plant transpiration we are unable to calculate 481
water use efficiency as the ratio of biomass increase per unit water, therefore we do not know 482
how water use efficiency changes with increasing salinity. 483
One of the biggest challenges of growth in a saline environment is to assure water 484
absorption. This means that plants have to adjust their tissue water potential to a level that is 485
lower (e.g. more negative) than that of the soil water. The total water potential of the plant is 486
described by the formula: ψw=ψs+ψp, where; ψw is the total water potential, ψs is the osmotic 487
potential and ψp the turgor pressure. Adjustment of the water potential to a lower (more negative) 488
level can be achieved by osmotic adjustment (a.o. ion uptake), decreased turgor or decreased cell 489
volume. It is generally assumed that in dicotyledonous halophytes osmotic adjustment is the 490
main factor in lowering the water potential, and that this is largely achieved by accumulation of 491
Na+ and Cl- in the vacuole (Gorham et al., 1980, Flowers et al., 1977; Greenway and Osmond, 492
1972). In this study, S. dolichostachya was able to keep the difference between the osmotic 493
potential of the leaves more negative than the water potential of the external solution (Fig.3). The 494
contributions of the major ions Na+ and Cl- to the osmotic potential increased significantly, with 495
increasing external salt concentrations (table 2). Concentrations of Na+ and Cl- were between 496
321-574 mM and 266-631 mM, respectively, in expanding leaf tissue at 50-500 mM NaCl in the 497

Page 23 of 49
Accep
ted
Man
uscr
ipt
root medium (Table 3). In expanded leaf tissue values Na+ and Cl- were slightly higher at 500 498
mM NaCl in the root medium. Molality of the cell sap was calculated using the water content 499
and the tissue ion data, assuming that Na+ and Cl- are predominantly present in the vacuole 500
(Flowers et al., 1986) and these ions are evenly distributed in cells of different tissues (the latter 501
can be argued; Conn and Gilliham, 2010; Fricke et al., 1996; Karley et al., 2000). Taken together 502
Na+ and Cl- contributed between 66-75 % and 68-83% to the measured osmotic potential, in 503
expanding and expanded leaf tissue, respectively. Note that in this study we did not measure 504
water potential, but Ayala and Oleary (1995) showed in a study with S. europaea a strong linear 505
relationship between water potential and osmotic potential and no significant effect of turgor 506
pressure over an external salinity range of 5-500 mM NaCl. Supplementary to increased 507
accumulation of Na+ and Cl-, concentrating ions in the cell sap due to lower water content, could 508
be an additional mechanism in lowering the water potential at above optimal salinity, as found 509
for S. europaea (Glenn and Oleary, 1984). 510
It is generally assumed that storage of Na+ and Cl- is restricted to the vacuoles to avoid 511
critical salt concentrations in the cytoplasm (Flowers et al., 1977; Greenway and Osmond, 1972). 512
Other organic solutes, like glycine betaine, are thought to accumulate in the cytoplasm to 513
maintain water potential equilibrium within the cell (Storey and Wyn Jones, 1979), where they 514
might also serve a function in stabilizing enzymes in the presence of salts (Jolivet et al., 1982; 515
Pollard and Wyn Jones, 1979), as ROS scavenger (cf. Bohnert 1995) or as ion channel regulator 516
(Cuin and Shabala, 2007). Glycine betaine is thought to be the main organic osmolyte in 517
Salicornia spp. (Gorham et al., 1980) and other species of the family of the Amaranthaceae 518
(Weretilnyk et al., 1989). In this experiment, concentrations of glycine betaine in succulent leaf 519
tissue and roots expressed on dry mass basis are consistent with concentrations previously 520
Page 24 of 49
Accep
ted
Man
uscr
ipt
reported in the literature (S. europaea, Gorham et al., 1980; S. europaea, Moghaieb et al., 2004). 521
Glycine betaine concentrations expressed on a dry mass basis differed significantly between 522
treatments in both shoot and root tissue. However, assuming that glycine betaine is dissolved in 523
water in the cell, expressing concentrations on a water basis makes more sense. When expressed 524
on a water basis glycine betaine concentrations in succulent leaf tissue are between 29.3 and 44.7 525
mM and in roots between 25.4 and 35.1 mM (Table 4). Glycine betaine concentrations did not 526
differ significantly between the treatments, although there was a strong trend towards higher 527
glycine betaine concentrations in leaf tissue at 500 mM NaCl in the root medium (p=0.054). 528
Previous studies with dicotyledonous halophytes reported either increased accumulation of 529
glycine betaine with increasing salinity (S. europaea, Moghaieb et al., 2004; A. spongiosa, 530
Storey and Wyn Jones, 1975) or, as in this study, no correlation between glycine betaine 531
accumulation and increased salinity (S. monoica, Storey and Jones, 1975). Supposing that 532
glycine betaine is solely present in the cytoplasm (Hall et al., 1978) and that the volume of the 533
cytoplasm is approximately 10% of the cell volume (Hajibagheri et al., 1984), then glycine 534
betaine concentrations would be 10 fold higher, between 293 and 447 mM and thus osmotically 535
relevant. These glycine betaine concentrations in the cytoplasm would be in a range capable of 536
balancing a substantial part, ~50 % in this study at an external salinity between 50 and 400 mM, 537
of the osmotic potential generated in the vacuole by Na+ and Cl-. It is likely that glycine betaine 538
together with other compatible solutes (Gorham et al., 1980; Hasegawa et al., 2000), can 539
generate a sufficient osmotic potential to maintain water potential equilibrium within the cell. 540
Interestingly, is that the glycine betaine concentrations did not change between the different 541
salinity treatments. Therefore, one could argue a primary role for glycine betaine in osmotic 542
adjustment. 543
Page 25 of 49
Accep
ted
Man
uscr
ipt
High external Na+ concentrations can lead to K+ deficiencies in plants (Flowers et al., 544
1977), because of the great similarity of these monovalent cations in physical and chemical 545
properties. K+ is regarded as an essential ion for enzyme functioning, whereas only plants with a 546
C4-photosynthetic pathway require Na+ as a micronutrient (Brownell and Crosslan, 1972). 547
However, Na+ can be regarded an essential ion in halophytes like Salicornia (discussed above). 548
In this study, the Na+:K+-ratio in expanding and expanded leaf/stem cells increased significantly 549
with increasing NaCl concentrations in the root medium over the range of 50-500 mM NaCl 550
(Fig. 5A). The leaf Na+:K+-ratios of S. dolichostachya are much higher compared to Na+:K+-551
ratios of most species (Flowers et al., 1986). The halophytic species of the Amaranthaceae 552
family together with the members of the Azoceae have generally the highest Na+:K+-ratios, 553
which suggest that there must be a specific trait present in these families to be able to sustain 554
such high ratios which are detrimental to most other species. Although absolute values of Na+ 555
increased and K+ decreased in S. dolichostachya, K+-selectively significantly increased 556
upon increasing NaCl concentrations in the root medium in both expanding and expanded leaf 557
tissue (Fig. 5B). The increase in in expanding leaf tissue was gradual upon increasing 558
salinity, whereas the in expanded tissue increased in general over the salinity range of 559
50-500 mM NaCl, but reached its lowest values at 250 mM NaCl in the root medium. High K+ 560
affinity has been reported before in a dicotyledonous halophyte (Suaeda monoica, Storey and 561
Wyn Jones, 1979). This increased indicates that S. dolichostachya possesses a 562
mechanism to specifically absorb K+ in the presence of high external Na+ levels, and that the 563
partitioning of Na+ and K+ might vary between different types of leaf tissues. 564
565
Conclusions 566

Page 26 of 49
Accep
ted
Man
uscr
ipt
In this study, Salicornia dolichostachya showed growth stimulation at 300 mM NaCl in 567
the root medium. At 50 and 500 mM NaCl in the root medium dry mass was reduced by 48 and 568
50% respectively in comparison with the dry mass at 300 mM root zone salinity. The growth 569
response curve upon salinity was the same whether expressed on fresh mass, dry mass or ash-570
free dry mass, although the contribution of ions to the dry mass increased with increasing 571
external salinity. 0 and 5 mM NaCl in the root medium were not sufficient for the plants to 572
maintain growth, suggesting a salt requirement for S. dolichostachya for prolonged time periods 573
of growth. No general conclusion based on a comparison between growth response curves of 574
Salicornia spp. from the literature could be drawn, due to differences in cultivation and 575
experimental conditions. The highest succulence and thickest stem diameter coincided with the 576
growth optimum at 300 mM NaCl, indicating a correlation between these parameters and salt 577
stimulated growth of S. dolichostachya. Stomatal closure (measured as δ13C) and expressed leaf 578
sap osmotic potential gradually increased and decreased, respectively, over the salinity range of 579
0-500 mM NaCl. Leaf sap osmotic potential was chiefly lowered by accumulation of Na+ and Cl-580
. Glycine betaine concentrations did not change significantly upon salinity. Na+:K+-ratio and K+-581
selectivity increased over the salinity range and differed between expanding and expanded leaf 582
tissue, suggesting partitioning of Na+ and K+ between different tissue types. Future growth 583
evaluations should be done under standardized conditions and need to be conducted at the tissue 584
or cellular level to be able to pinpoint the processes underlying the salt requirement, salt 585
stimulation and salt tolerance of Salicornia spp. 586
587
Acknowledgements 588
Page 27 of 49
Accep
ted
Man
uscr
ipt
We thank Lia Auliaherliaty for the δ13C measurements, Dr. Nadejda Soudzilovskaia for advice 589
on the statistical analyses and Bas Bruning and Dr. Henk Schat for helpful discussions. The 590
authors are also grateful to Prof. Dr. Tim Flowers for useful remarks on a draft of the manuscript. 591
This study was carried out within the PhD project of D.K. and was financed by: Project 2.3.2 of 592
the Dutch National Research Program Knowledge for Climate with co financing of Project ZKK-593
1 of Zilte Kennis Kring. 594
595
References 596
Abdulrahman, F.S., Williams, G.J., 1981. Temperature and salinity regulation of growth and gas-597
exchange of Salicornia fructicosa L. Oecologia 48, 346-352. 598
Aghaleh, M., Niknam, V., Ebrahimzadeh, H., Razavi, K., 2009. Salt stress effects on growth, 599
pigments, proteins and lipid peroxidation in Salicornia persica and S. europaea. Biologia 600
Plantarum 53, 243-248. 601
Aghaleh, M., Niknam, V., Ebrahimzadeh, H., Razavi, K., 2011. Effect of salt stress on 602
physiological and antioxidative responses in two species of Salicornia (S. persica and S. 603
europaea). Acta Physiol. Plant. 33, 1261-1270. 604
Ashraf, M., Foolad, M.R., 2007. Roles of glycine betaine and proline in improving plant abiotic 605
stress resistance. Environ. Exp. Bot. 59, 206-216. 606
Ayala, F., Oleary, J.W., 1995. Growth and physiology of Salicornia bigelovii Torr. at suboptimal 607
salinity. Int. J. Plant Sci. 156, 197-205. 608
Page 28 of 49
Accep
ted
Man
uscr
ipt
Balnokin, Y.V., Myasoedov, N.A., Shamsutdinov, Z.S., Shamsutdinov, N.Z., 2005. Significance 609
of Na+ and K+ for sustained hydration of organ tissues in ecologically distinct halophytes of the 610
family Chenopodiaceae. Russian Journal of Plant Physiology 52, 779-787. 611
Barbour, M.G., 1970. Is any angiosperm an obligate halophyte. Am. Midl. Nat. 84, 105-&. 612
Barrett-Lennard, E.G., 2002. Restoration of saline land through revegetation. Agric. Water 613
Manage. 53, 213-226. 614
Bohnert, H.J., Nelson, D.E., Jesen, R.G., 1995 Adaptations to environmental stresses. The Plant 615
Cell. 7, 1099-1111. 616
Brown, J.J., Glenn, E.P., Fitzsimmons, K.M., Smith, S.E., 1999. Halophytes for the treatment of 617
saline aquaculture effluent. Aquaculture 175, 255-268. 618
Brownell, P.F., Crosslan, C.J., 1972. Requirement for sodium as a micronutrient by species 619
having C4 dicarboxylic photosynthetic pathway. Plant Physiol. 49, 794-&. 620
Carillo, P., Gibon, Y., 2011. Extraction and determination of glycine betaine. PrometheusWiki, 621
Available at: http://www.publish.csiro.au/prometheuswiki/tiki-pagehistory.php?page=Extraction 622
and determination of glycine betaine&preview=10. Accessed November 30, 2011, 13:01. 623
Conn, S., Gilliham, M., 2010. Comparative physiology of elemental distributions in plants. Ann. 624
Bot. 105, 1081-1102. 625
Cuin, T.A., Shabala, S., 2007. Compatible solutes reduce ROS-induced potassium efflux in 626
Arabidopsis roots. 30, 875-885. 627
Page 29 of 49
Accep
ted
Man
uscr
ipt
Davy, A.J., Bishop, G.F., Costa, C.S.B., 2001. Salicornia L. (Salicornia pusilla J. Woods, S. 628
ramosissima J. Woods, S. europaea L., S. obscura P.W. Ball & Tutin, S. nitens P.W. Ball & 629
Tutin, S. fragilis P.W. Ball & Tutin and S. dolichostachya Moss). J. Ecol. 89, 681-707. 630
FAO, 2002. World agriculture towards 2015/2030 - summary report. Rome, Italy, Available at: 631
http://www.fao.org/docrep/004/y3557e/y3557e08.htm#m. 632
Farquhar, G.D., Ehleringer, J.R., Hubick, K.T., 1989. Carbon isotope discrimination and 633
photosynthesis. Annu. Rev. Plant Physiol. Plant Molec. Biol. 40, 503-537. 634
Flowers, T.J., Colmer, T.D., 2008. Salinity tolerance in halophytes. New Phytol. 179, 945-963. 635
Flowers, T.J., Flowers, S.A., 2005. Why does salinity pose such a difficult problem for plant 636
breeders? Agric. Water Manage. 78, 15-24. 637
Flowers, T.J., Galal, H.K., Bromham, L., 2010. Evolution of halophytes: multiple origins of salt 638
tolerance in land plants. Funct. Plant Biol. 37, 604-612. 639
Flowers, T.J., Hajibagheri, M.A., Clipson, N.J.W., 1986. Halophytes. Quarterly Review of 640
Biology 61, 313-337. 641
Flowers, T.J., Troke, P.F., Yeo, A.R., 1977. Mechanism of salt tolerance in halophytes. Annu. 642
Rev. Plant Physiol. Plant Molec. Biol. 28, 89-121. 643
Fricke, W., Leigh, R.A., Tomos, A.D., 1996. The intercellular distribution of vacuolar solutes in 644
the epidermis and mesophyll of barley leaves changes in response to NaCl. J. Exp. Bot. 47, 645
1413-1426. 646
Page 30 of 49
Accep
ted
Man
uscr
ipt
Glenn, E.P., Brown, J.J., Blumwald, E., 1999. Salt tolerance and crop potential of halophytes. 647
Crit. Rev. Plant Sci. 18, 227-255. 648
Glenn, E.P., Oleary, J.W., 1984. Relationship between salt accumulation and water-content of 649
dicotyledonous halophytes. Plant Cell Environ. 7, 253-261. 650
Glenn, E.P., Oleary, J.W., Watson, M.C., Thompson, T.L., Kuehl, R.O., 1991. Salicornia 651
bigelovii Torr.- an oilseed halophyte for seawater irrigation. Science 251, 1065-1067. 652
Gorham, J., Hughes, L.L., Wynjones, R.G., 1980. Chemical composition of salt-marsh plants 653
from Ynys-mon (Anglesy) – The concept of physiotypes. Plant Cell Environ. 3, 309-318. 654
Grattan, S.R., Benes, S.E., Peters, D.W., Diaz, F., 2008. Feasibility of irrigating pickleweed 655
(Salicornia bigelovii. Torr) with hyper-saline drainage water. J. Environ. Qual. 37, S149-S156. 656
Greenway, H., Munns, R., 1980. Mechanisms of salt tolerance in non-halophytes. Annu. Rev. 657
Plant Physiol. Plant Molec. Biol. 31, 149-190. 658
Greenway, H., Osmond, C.B., 1972. Salt responses of enzymes from species differing in salt 659
tolerance. Plant Physiol. 49, 256-&. 660
Grime, J.P., Hunt, R., 1975. Relative growth rate – its range and adaptive significance in a local 661
flora. J. Ecol. 63, 393-422. 662
Gul, B., Ansari, R., Khan, M.A., 2009. Salt tolerance of Salicornia utahensis from the great 663
basin desert. Pak. J. Bot. 41, 2925-2932. 664
Hajibagheri, M.A., Hall, J.L., Flowers, T.J., 1984. Stereological Analysis of Leaf Cells of the 665
Halophyte Suaeda maritima (L.) Dum J. Exp. Bot. (1984) 35(10): 1547-1557 666

Page 31 of 49
Accep
ted
Man
uscr
ipt
Hall, J.L., Harvey, D.M.R., Flowers, T.J., 1978. Evidence for the cytoplasmic localization of 667
betaine in leaf cells of Suaeda maritima. Planta 140, 59-62. 668
Hasegawa, P.M., Bressan, R.A., Zhu, J.K., Bohnert, H.J., 2000. Plant cellular and molecular 669
responses to high salinity. Annu. Rev. Plant Physiol. Plant Molec. Biol. 51, 463-499. 670
Hunt, R., Causton, D.R., Shipley, B., Askew, A.P., 2002. A modern tool for classical plant 671
growth analysis. Ann. Bot. 90, 485-488. 672
Huiskes, A.H.L., Schat, H., Elenbaas. P.F.M., 1985. Cytotaxonomic status and morphological 673
characterisation of Salicornia dolichostachya and Salicornia brachyastachya. Acta Bot. Neerl. 674
34, 271-282. 675
Jennings, D.H., 1968. Halophytes succulence and sodium in plants – a unified theory. New 676
Phytol. 67, 899-&. 677
Jolivet, Y., Larher, F., Hamelin, J., 1982. Osmoregulation in halophytic higher plants – the 678
protective effect of glycine betaine against the heat destabilization of membranes. Plant Science 679
Letters 25, 193-201. 680
Kadereit, G., Ball, P., Beer, S., Mucina, L., Sokoloff, D., Teege, P., Yaprak, A.E., Freitag, H., 681
2007. A taxonomic nightmare comes true: phylogeny and biogeography of glassworts 682
(Salicornia L., Chenopodiaceae). Taxon 56, 1143-1170. 683
Karley, A.J., Leigh, R.A., Sanders, D., 2000. Where do all the ions go? The cellular basis of 684
differential ion accumulation in leaf cells. Trends Plant Sci. 5, 465-470. 685

Page 32 of 49
Accep
ted
Man
uscr
ipt
Khan, M.A., Gul, B., Weber, D.J., 2001. Effect of salinity on the growth and ion content of 686
Salicornia rubra. Commun. Soil Sci. Plant Anal. 32, 2965-2977. 687
Kuhn, N.L., Zedler, J.B., 1997. Differential effects of salinity and soil saturation on native and 688
exotic plants of a coastal salt marsh. Estuaries 20, 391-403. 689
Mahall, B.E., Park, R.B., 1976. Ecotone between Spartina foliosa Trin and Salicornia virginica 690
L. in salt marshes of northern San Francisco bay .2. Soil-water and salinity. J. Ecol. 64, 793-809. 691
Moghaieb, R.E.A., Saneoka, H., Fujita, K., 2004. Effect of salinity on osmotic adjustment, 692
glycinebetaine accumulation and the betaine aldehyde dehydrogenase gene expression in two 693
halophytic plants, Salicornia europaea and Suaeda maritima. Plant Science 166, 1345-1349. 694
Munns, R., Tester, M., 2008. Mechanisms of salinity tolerance. Annual Review of Plant Biology 695
59, 651-681. 696
Niu, X.M., Bressan, R.A., Hasegawa, P.M., Pardo, J.M., 1995. Ion homeostasis in NaCl stress 697
environments. Plant Physiol. 109, 735-742. 698
Ozawa, T., Wu, J., Fujii, S., 2007. Effect of inoculation with a strain of Pseudomonas 699
pseudoalcaligenes isolated from the endorhizosphere of Salicornia europea on salt tolerance of 700
the glasswort. Soil Sci. Plant Nutr. 53, 12-16. 701
Parida, A.K., Jha, B., 2010. Antioxidative Defense Potential to Salinity in the Euhalophyte 702
Salicornia brachiata. Journal of Plant Growth Regulation 29, 137-148. 703
Pollard, A., Wyn Jones, R.G., 1979. Enzyme activities in concentrated solutions of 704
glycinebetaine and other solutes. Planta 144, 291-298. 705
Page 33 of 49
Accep
ted
Man
uscr
ipt
Robinson, R.A., Stokes, R.H., 1959. Electrolyte solutions, in: Milburn, J.A., Water flow in 706
plants. Longman Inc., New York, pp. 196. 707
Rozema, J., Flowers, T., 2008. Ecology - Crops for a Salinized World. Science 322, 1478-1480. 708
Rozema, J., Vanderlist, J.C., Schat, H., Vandiggelen, J., Broekman, R.A., 1987. 709
Ecophysiological response of Salicornia dolichostachya and Salicornia brachyastachya to 710
seawater inundation, in: Huiskes, A.H.L., Blom C.W.P.M., Rozema, J., (Eds), Vegetation 711
between land and sea. Kluwer Academic Publishers Group, Dordrecht, pp. 180-186. 712
Rozema, J., van Diggelen, J., 1991. A comparative study of growth and photosynthesis of 4 713
halophytes in response to salinity. Acta Oecologica-International Journal of Ecology 12, 673-714
681. 715
Shabala, S., Mackay, A., 2011. Ion Transport in Halophytes, Plant Responses to Drought and 716
Salinity Stress: Developments in a Post-Genomic Era. Academic Press Ltd-Elsevier Science Ltd, 717
London, pp 151-199. 718
Silva, H., Caldeira, G., Freitas, H., 2007. Salicornia ramosissima population dynamics and 719
tolerance of salinity. Ecological Research 22, 125-134. 720
Storey, R., Ahmad, N., Wyn Jones, R.G., 1977. Taxonomic and ecological aspects of distribution 721
of glycinebetaine and related compounds in plants. Oecologia 27, 319-332. 722
Storey, R., Wyn Jones, R.G., 1975. Betaine and choline levels in plants and their relationship to 723
NaCl stress. Plant Science Letters 4, 161-168. 724
Page 34 of 49
Accep
ted
Man
uscr
ipt
Storey, R., Wyn Jones, R.G., 1979. Responses of Atriplex spongiosa and Suaeda monoica to 725
salinity. 63, 156-162. 726
Subbarao, G.V., Ito, O., Berry, W.L., Wheeler, R.M., 2003. Sodium - A functional plant nutrient. 727
Crit. Rev. Plant Sci. 22, 391-416. 728
Tiku, B.L., 1976. Effect of salinity on photosynthesis of halophyte Salicornia rubra and 729
Distichlis stricta. Physiol. Plant. 37, 23-28. 730
United Nations, 2010. Department of Economic and Social Affairs, World population prospects, 731
Available at: http://esa.un.org/unpd/wpp/Analytical-Figures/htm/fig_1.htm. Accessed November 732
30, 2011, 15:57. 733
Ungar, I.A., 1978. Effects of salinity and hormonal treatments on growth and ion uptake of 734
Salicornia europaea. Bulletin De La Societe Botanique De France 125, 95-104. 735
Ushakova, S.A., Kovaleva, N.P., Tikhomirova, N.A., Gribovskaya, I.V., Kolmakova, A.A., 736
2006. Effect of photosynthetically active radiation, salinization, and type of nitrogen nutrition on 737
growth of Salicornia europaea plants. Russian Journal of Plant Physiology 53, 785-792. 738
Ushakova, S.A., Zolotukhin, I.G., Tikhomirov, A.A., Tikhomirova, N.A., Kudenko, Y.A., 739
Gribovskaya, I.V., Balnokin, Y., Gros, J.B., 2008. Some Methods for Human Liquid and Solid 740
Waste Utilization in Bioregenerative Life-Support Systems. Applied Biochemistry and 741
Biotechnology 151, 676-685. 742

Page 35 of 49
Accep
ted
Man
uscr
ipt
Wang, X.C., Fan, P.X., Song, H.M., Chen, X.Y., Lil, X.F., Li, Y.X., 2009. Comparative 743
Proteomic Analysis of Differentially Expressed Proteins in Shoots of Salicornia europaea under 744
Different Salinity. Journal of Proteome Research 8, 3331-3345. 745
Webb, K.L., 1966. NaCl effects on growth and transpiration in Salicornia bigelovii a salt-marsh 746
halophyte. Plant Soil 24, 261-&. 747
Weretilnyk, E.A., Bednarek, S., McCue, K.F., Rhodes, D., Hanson, A.D., 1989. Comparative 748
biochemical and immunological studies of the glycine betaine synthesis pathway in diverse 749
families of dicotyledons. Planta 178, 342-352. 750
Yeo, A.R., Flowers, T.J., 1980. Salt tolerance in the halophyte Suaeda maritima L. Dum – 751
evaluation of the effects of salinity upon growth. J. Exp. Bot. 31, 1171-1183. 752
753

Page 36 of 49
Accep
ted
Man
uscr
ipt
753
Table legends 754
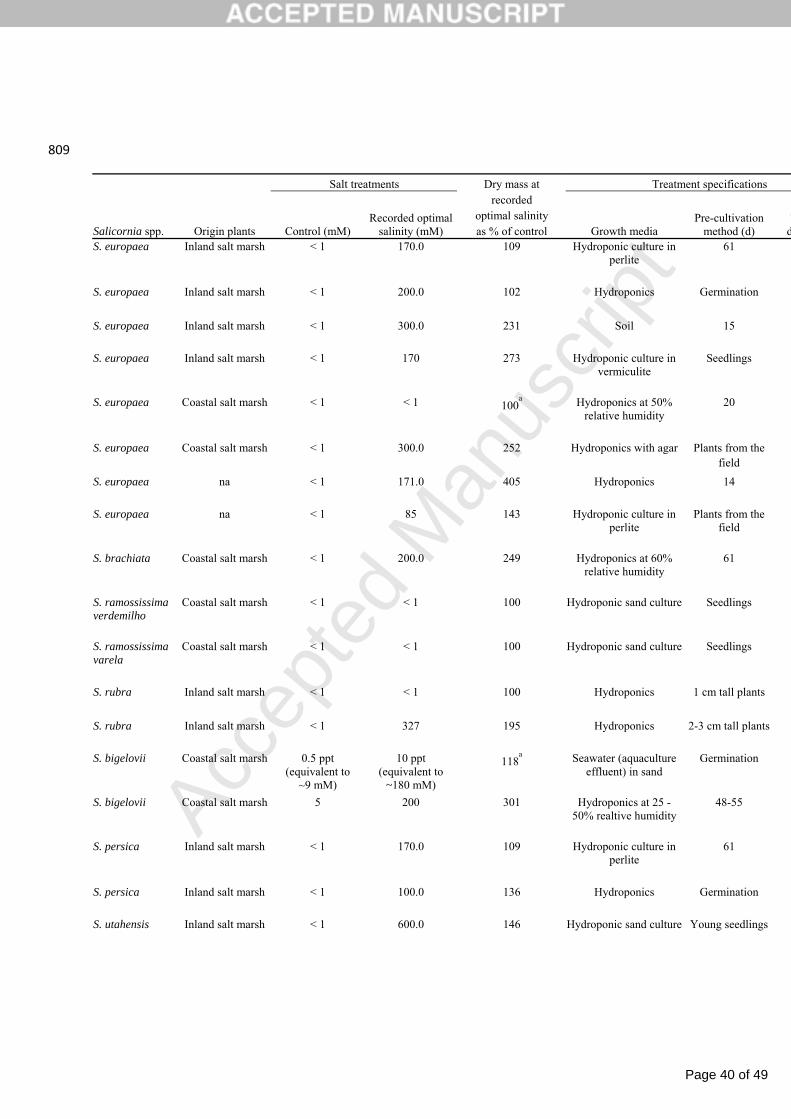
Table 1. Effect of salinity on growth of Salicornia spp. under a variety of conditions in salt dose 755
response experiments performed up until 1th of August 2011. Literature was searched with the 756
database Web of Science using the search terms: Salicornia and salt (434 hits) or Salicornia and 757
salinity (196 hits). Studies were only included when they were conducted in either greenhouses 758
or controlled environment rooms, reported dry mass for at least 2 different salt treatment levels 759
of which one control treatment (< 10 mM NaCl) and were written in English. Dry mass data 760
given in graphs were made numeric with DataThief III (Shareware; version 1.6). All dry weight 761
data were systematically expressed in the same unit preferably as plant dry mass, in two studies 762
only shoot dry mass was given. Dry mass at the recorded optimal salinity per study was 763
expressed as percentage of the dry mass at the control in the same study. If plants were grown 764
under a number of different conditions, the conditions that gave the highest dry mass values were 765
chosen. 766
Table 2. Relative growth rates (RGR) of Salicornia dolichostachya grown at varying salinities in 767
hydroponic culture (with Hoagland plus NaCl or diluted seawater) in a greenhouse or in an 768
inland seawater drip-irrigation system on the island of Texel. Growth was measured by increase 769
in dry mass or ash-free dry mass. Plants were grown for 42 d for the hydroponic culture 770
experiment and for 40 d for the drip-irrigation experiment. Values are means ± S.E. of 4-9 771
replicates. Mean values with different letters indicate significant differences within the same 772
column (Tukey’s test, p<0.05). 773
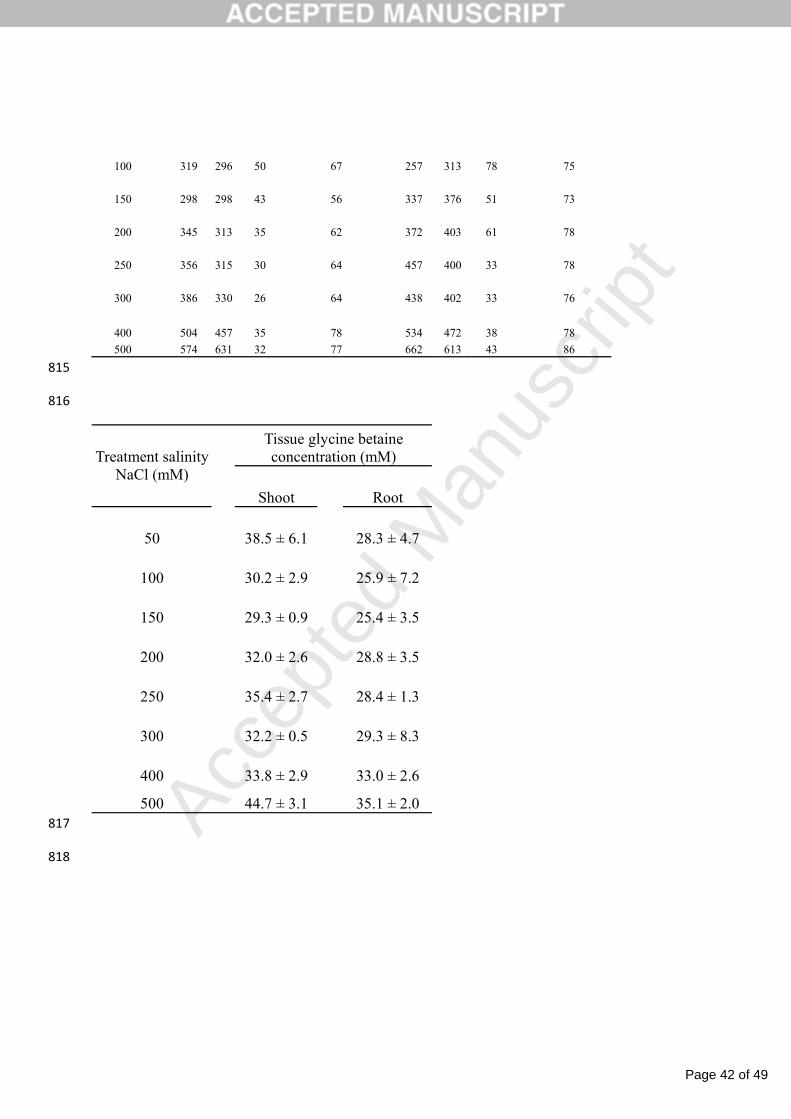
Table 3. Molarity of Na+, Cl- and K+ in expanding and expanded leaf tissue and the contribution 774
of Na+, Cl- and K+ to the osmotic potential of the leaf tissue of Salicornia dolichostachya 775
Page 37 of 49
Accep
ted
Man
uscr
ipt
hydroponically grown at 50-500 mM NaCl in the root medium for 42 d. The molarities of Na+, 776
Cl- and K+ were calculated from tissue ion data. Values are means ± S.E. of 5-9 replicates. 777
Kruskal-Wallis p-values were: p<0.05 for the ion molarities. 778
Table 4. Glycine betaine concentrations expressed on a water basis (mM) in shoot and root 779
tissue of Salicornia dolichostachya hydroponically grown with 50-500 mM NaCl in the root 780
medium for 42 d. Concentrations of glycine betaine at commencement of the treatments were 781
14.9 ±1.8 and 15.5 ± 1.9 mM in shoots and roots respectively. Values are means ± S.E. of 3 782
replicates. ANOVA p-values were for: shoots p=0.054 and for roots p>0.05.783
Page 38 of 49
Accep
ted
Man
uscr
ipt
784
Figure legends 785
Figure 1. Effect of NaCl treatments on (A) fresh mass (B) dry mass and (C) ash-free dry mass of 786
shoots and roots of Salicornia dolichostachya hydroponically grown at 50-500 mM NaCl in the 787
root medium for 42 d. Values are means ± S.E. of 7-9 replicates. Mean values with different 788
letters indicate a significant difference in the same tissue between treatments (Tukey’s test, 789
p<0.05). No significant differences occurred between treatments in (B) root dry mass and (C) 790
root ash-free dry mass. 791
Figure 2. Effect of NaCl treatments on (A) leaf water content (B) leaf succulence and stem 792
diameter (3nd succulent internode from the shoot base) of Salicornia dolichostachya 793
hydroponically grown at 50-500 mM NaCl in the root medium for 42 d. Values are means ± S.E. 794
of 7-9 replicates. ANOVA p-values were for: (A) leaf water content p=0.071, (B) succulence 795
p<0.05, and stem diameter p=0.074. Note that the scales on the y-axis are different. 796
Figure 3. Effect of NaCl treatments on carbon isotope discrimination in expanding and expanded 797
leaf tissue of Salicornia dolichostachya hydroponically grown at 50-500 mM NaCl in the root 798
medium for 42 d. Values are means ± S.E. of 7-9 replicates. Mixed model regression analysis 799
showed: treatment p<0.05, and tissue type • treatment P=0.066. 800
Figure 4. Effect of NaCl treatments on osmotic potentials of expanding and expanded leaf tissue 801
of Salicornia dolichostachya hydroponically grown at 50-500 mM NaCl in the root medium for 802
42 d. Values are means ± S.E. of 7-9 replicates. Mixed model regression analysis showed: 803
treatment p<0.05, and tissue type • treatment P>0.05. 804
Figure 5. Effect of NaCl treatments on (A) Na+:K+-ratio and (B) K+-selectivity of expanding and 805
expanded leaf tissue of Salicornia dolichostachya hydroponically grown at 50-500 mM NaCl in 806

Page 39 of 49
Accep
ted
Man
uscr
ipt
the root medium for 42 d. Values are means ± S.E. of 7-9 replicates. Mixed model regression 807
analysis showed in (A) and (B): treatment p<0.05, and tissue type • treatment P<0.05. 808
809
Page 40 of 49
Accep
ted
Man
uscr
ipt
809
Salt treatments Treatment specifications
Salicornia spp. Origin plants Control (mM) Recorded optimal salinity (mM)
Dry mass at recorded
optimal salinity as % of control Growth media Pre-cultivation
method (d) Td
S. europaea Inland salt marsh < 1 170.0 109 Hydroponic culture in perlite
61 S. europaea Inland salt marsh < 1 200.0 102 Hydroponics Germination S. europaea Inland salt marsh < 1 300.0 231 Soil 15 S. europaea Inland salt marsh < 1 170 273 Hydroponic culture in
vermiculite Seedlings
S. europaea Coastal salt marsh < 1 < 1 100a
Hydroponics at 50% relative humidity
20 S. europaea Coastal salt marsh < 1 300.0 252 Hydroponics with agar Plants from the
field S. europaea na < 1 171.0 405 Hydroponics 14 S. europaea na < 1 85 143 Hydroponic culture in
perlite Plants from the
field S. brachiata Coastal salt marsh < 1 200.0 249 Hydroponics at 60%
relative humidity 61
S. ramossissima verdemilho
Coastal salt marsh < 1 < 1 100 Hydroponic sand culture Seedlings S. ramossissima varela
Coastal salt marsh < 1 < 1 100 Hydroponic sand culture Seedlings S. rubra Inland salt marsh < 1 < 1 100 Hydroponics 1 cm tall plants
S. rubra Inland salt marsh < 1 327 195 Hydroponics 2-3 cm tall plants
S. bigelovii Coastal salt marsh 0.5 ppt (equivalent to ~9 mM)
10 ppt (equivalent to ~180 mM)
118a
Seawater (aquaculture effluent) in sand
Germination S. bigelovii Coastal salt marsh 5 200 301 Hydroponics at 25 -
50% realtive humidity48-55
S. persica Inland salt marsh < 1 170.0 109 Hydroponic culture in perlite
61 S. persica Inland salt marsh < 1 100.0 136 Hydroponics Germination S. utahensis Inland salt marsh < 1 600.0 146 Hydroponic sand culture Young seedlings

Page 41 of 49
Accep
ted
Man
uscr
ipt
S. subterminalis Sweetwater marsh < 1 394 151 Seawater in sand, silt and clay mixture
30 S. fruticosa Coastal salt marsh < 1 342 262 Hydroponics Plants from the
field na, not available 810 a percentage calculated from shoot dry mass only
811 812
813
Hydroponics Drip-irrigation
RGR (mg g-1
d-1
) RGR (mg g
-1 d
-1)
NaCl (mM) Expressed on dry mass basis
Expressed on ash-free dry mass
basis Seawater (dS/m) Expressed on dry mass basis
50 75 ± 4a 68 ± 3
a 0 63 ± 5a
100 82 ± 4ab 71 ± 5
ab 10 90 ± 3b
150 84 ± 2ab 75 ± 2
ab
200 82 ± 3ab 73 ± 3
ab
20 dS/m (220 mM NaCl) 83 ± 5
ab 78 ± 3ab 20 83 ± 2
b 250 87 ± 3
ab 76 ± 3ab
300 92 ± 1b 80 ± 2
b 30 81 ± 3b
400 81 ± 2ab 69 ± 2
a
40 dS/m (440 mM NaCl) 82 ± 4
ab 76 ± 4ab 40 92 ± 4
b 500 75 ± 3
a 62 ± 6a
814
Expanding shoot tissue Expanded shoot tissue
Molarity (mM)
Molarity (mM) Treatment
salinity NaCl (mM)
Na
+ Cl- K
+ Na
+, Cl
- and K
+
contribution to Ψs (%) Na
+Cl
-K
+ Na
+, Cl
- and K
+
contribution to Ψs (%)
50
321 266 73
74 273 353 132
82
Page 42 of 49
Accep
ted
Man
uscr
ipt
100
319 296 50
67 257 313 78
75 150
298 298 43
56 337 376 51
73
200
345 313 35
62 372 403 61
78 250
356 315 30
64 457 400 33
78
300
386 330 26
64 438 402 33
76 400
504 457 35
78 534 472 38
78
500 574 631 32 77 662 613 43 86 815
816
Tissue glycine betaine concentration (mM) Treatment salinity
NaCl (mM) Shoot
Root
50
38.5 ± 6.1
28.3 ± 4.7
100
30.2 ± 2.9
25.9 ± 7.2
150
29.3 ± 0.9
25.4 ± 3.5
200
32.0 ± 2.6
28.8 ± 3.5
250
35.4 ± 2.7
28.4 ± 1.3
300
32.2 ± 0.5
29.3 ± 8.3
400
33.8 ± 2.9
33.0 ± 2.6
500 44.7 ± 3.1 35.1 ± 2.0 817
818
Page 43 of 49
Accep
ted
Man
uscr
ipt
1
2
3
4
5
6
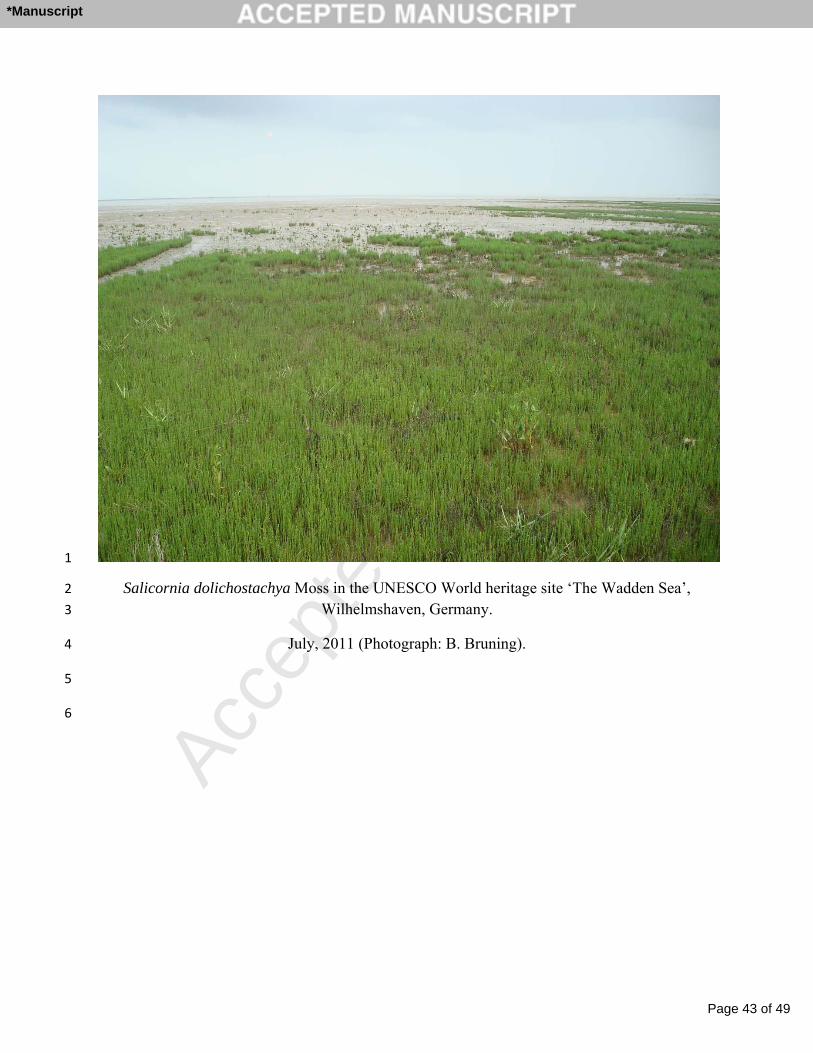
Salicornia dolichostachya Moss in the UNESCO World heritage site ‘The Wadden Sea’, Wilhelmshaven, Germany.
July, 2011 (Photograph: B. Bruning).
*Manuscript
Page 44 of 49
Accep
ted
Man
uscr
ipt
0.0
2.0
4.0
6.0
8.0
10.0
12.0
Fre
sh m
ass
(g p
lant-1
) Shoot
Root
0.0
0.1
0.2
0.3
0.4
0.5
0.6
0.7
0.8
0.9
1.0
Dry
mas
s (g
pla
nt-1
)
0.0
0.1
0.2
0.3
0.4
0.5
0.6
0.7
0.8
0.9
1.0
0 100 200 300 400 500
Ash
-fre
e dry
mas
s (g
pla
nt-1
)
Treatment NaCl (mM)
A
B
C
a
ab ab
ab ab
b
ab
a
a
ab ab
ab
ab
b
a
a a b
ab ab ab
ab ab
ab
a a
a ab
ab ab
ab
b
Figure(s)
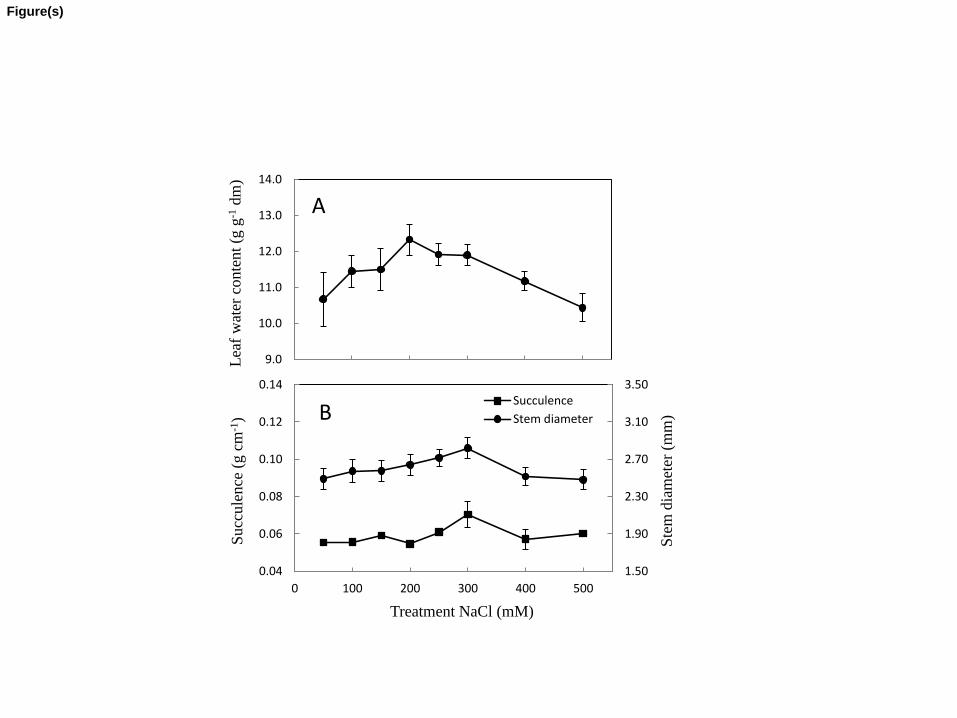
Page 45 of 49
Accep
ted
Man
uscr
ipt
9.0
10.0
11.0
12.0
13.0
14.0
Lea
f w
ater
conte
nt
(g g
-1 d
m)
A
1.50
1.90
2.30
2.70
3.10
3.50
0.04
0.06
0.08
0.10
0.12
0.14
0 100 200 300 400 500
Succ
ule
nce
(g c
m-1
)
Ste
m d
iam
eter
(m
m)
Treatment NaCl (mM)
Succulence
Stem diameter B
Figure(s)
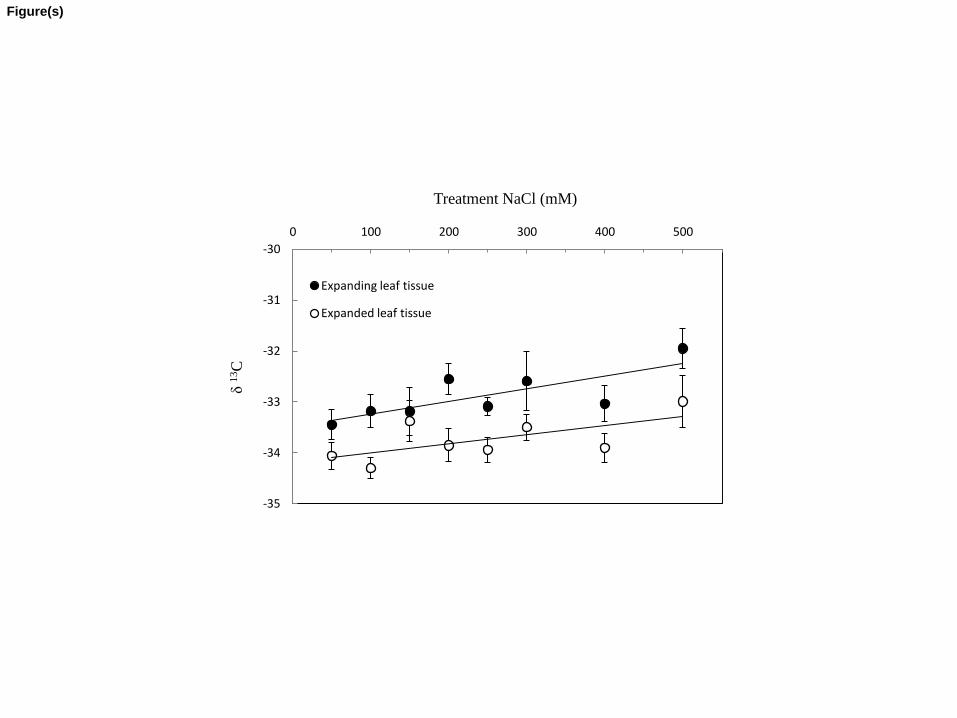
Page 46 of 49
Accep
ted
Man
uscr
ipt
-35
-34
-33
-32
-31
-30
0 100 200 300 400 500 δ 1
3C
Treatment NaCl (mM)
Expanding leaf tissue
Expanded leaf tissue
Figure(s)
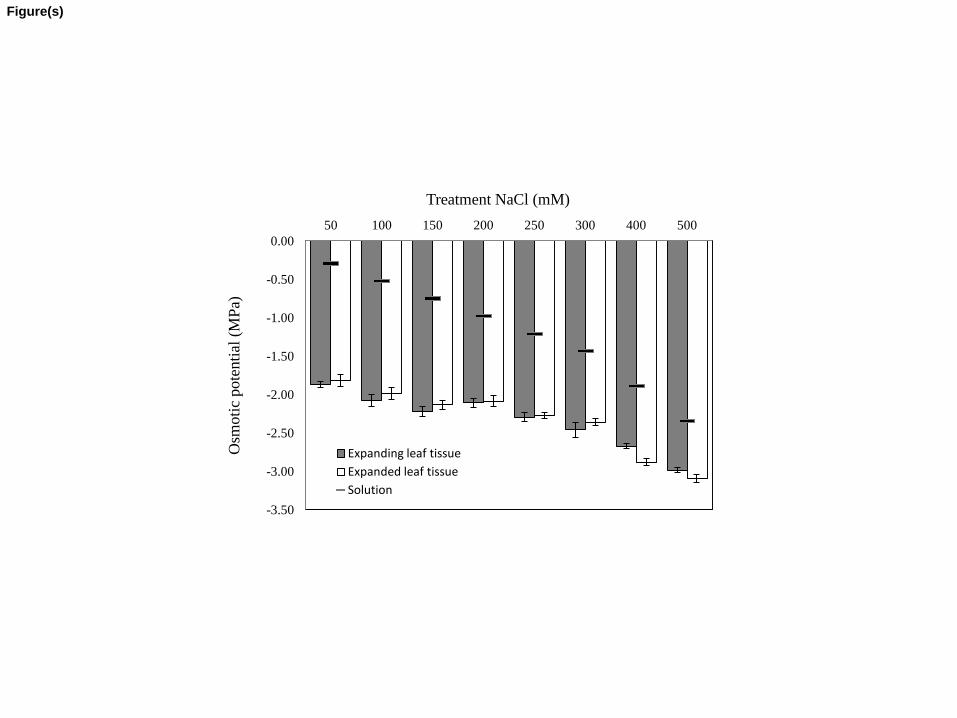
Page 47 of 49
Accep
ted
Man
uscr
ipt
-3.50
-3.00
-2.50
-2.00
-1.50
-1.00
-0.50
0.00
50 100 150 200 250 300 400 500 O
smoti
c pote
nti
al (
MP
a)
Treatment NaCl (mM)
Expanding leaf tissue
Expanded leaf tissue
Solution
Figure(s)
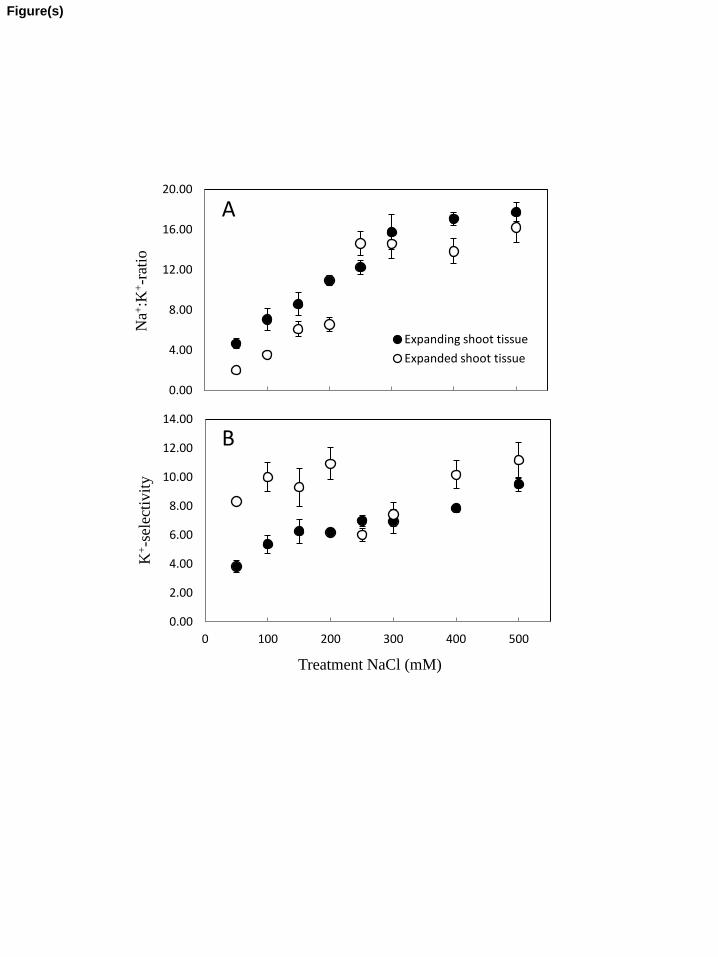
Page 48 of 49
Accep
ted
Man
uscr
ipt
A
0.00
4.00
8.00
12.00
16.00
20.00
Na+
:K+-r
atio
Expanding shoot tissue
Expanded shoot tissue
0.00
2.00
4.00
6.00
8.00
10.00
12.00
14.00
0 100 200 300 400 500
K+-s
elec
tivit
y
Treatment NaCl (mM)
B
Figure(s)
Page 49 of 49
Accep
ted
Man
uscr
ipt
Research highlights
- Salicornia dolichostachya had its growth optimum at 300 mM NaCl in the root medium.
- The highest values of succulence and stem diameter coincide with the growth optimum.
- Plants maintained a lower leaf osmotic potential than that of the medium.
- Carbon isotope discrimination decreased linear with increasing external salinity.
- Leaf and root glycine betaine concentrations did not change with external salinity.