Embed Size (px)
Citation preview
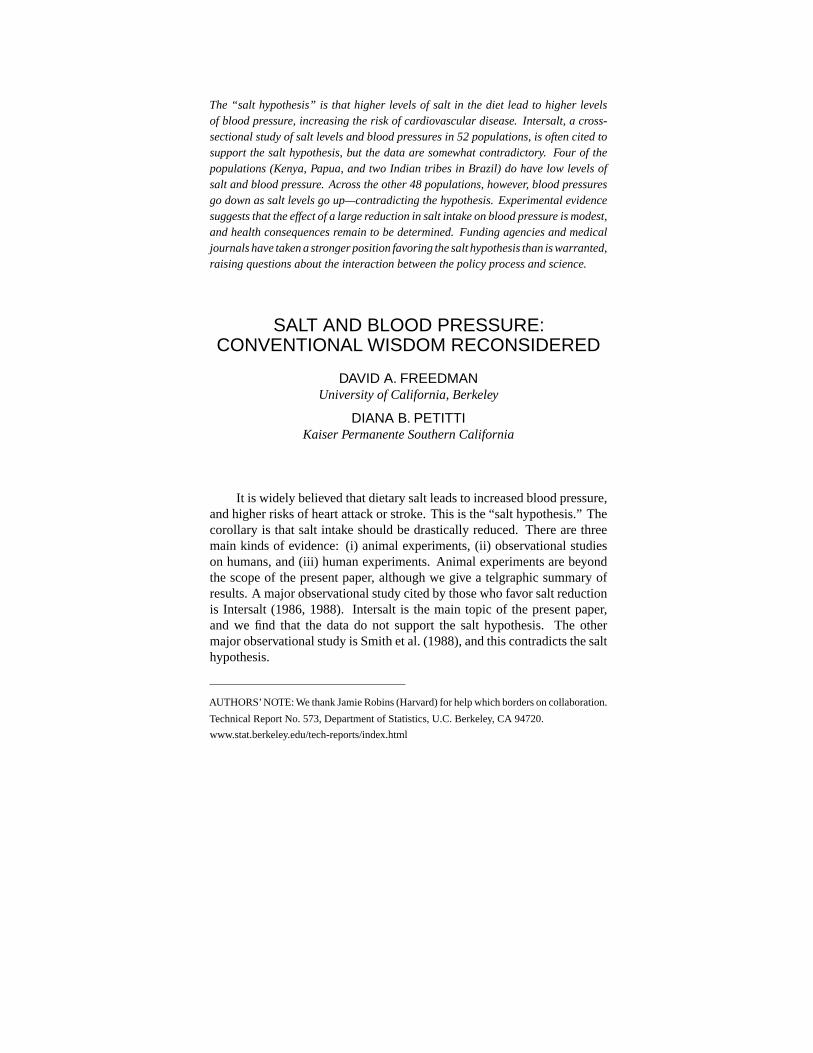
The “salt hypothesis” is that higher levels of salt in the diet lead to higher levelsof blood pressure, increasing the risk of cardiovascular disease. Intersalt, a cross-sectional study of salt levels and blood pressures in 52 populations, is often cited tosupport the salt hypothesis, but the data are somewhat contradictory. Four of thepopulations (Kenya, Papua, and two Indian tribes in Brazil) do have low levels ofsalt and blood pressure. Across the other 48 populations, however, blood pressuresgo down as salt levels go up—contradicting the hypothesis. Experimental evidencesuggests that the effect of a large reduction in salt intake on blood pressure is modest,and health consequences remain to be determined. Funding agencies and medicaljournals have taken a stronger position favoring the salt hypothesis than is warranted,raising questions about the interaction between the policy process and science.
SALT AND BLOOD PRESSURE:CONVENTIONAL WISDOM RECONSIDERED
DAVID A. FREEDMANUniversity of California, Berkeley
DIANA B. PETITTIKaiser Permanente Southern California
It is widely believed that dietary salt leads to increased blood pressure,and higher risks of heart attack or stroke. This is the “salt hypothesis.” Thecorollary is that salt intake should be drastically reduced. There are threemain kinds of evidence: (i) animal experiments, (ii) observational studieson humans, and (iii) human experiments. Animal experiments are beyondthe scope of the present paper, although we give a telgraphic summary ofresults. A major observational study cited by those who favor salt reductionis Intersalt (1986, 1988). Intersalt is the main topic of the present paper,and we find that the data do not support the salt hypothesis. The othermajor observational study is Smith et al. (1988), and this contradicts the salthypothesis.
AUTHORS’NOTE: We thank Jamie Robins (Harvard) for help which borders on collaboration.
Technical Report No. 573, Department of Statistics, U.C. Berkeley, CA 94720.
www.stat.berkeley.edu/tech-reports/index.html

2 Salt and Blood Pressure
There have been many intervention studies on humans, and severalmeta-analyses. Although publication bias is a concern, the experiments dosuggest some reduction in blood pressure for hypertensive subjects fromaggressive reduction in salt intake; the effect for normotensives is smaller.Recently, the DASH studies manipulated diet and salt intake. Both havean effect, and there is an interaction. Intervention studies on humans area second topic of our paper. To document the effect of salt reduction onmorbidity or mortality, much larger intervention studies would be needed,with much longer followup. This point is discussed too. Finally, implicationsfor policy analysis are noted.
Animal Studies
Rodents, the best-studied species, show strain-specific effects of saltintake on blood pressure. In some strains, a diet high in salt leads to amarked increase in pressure; but in other strains, there is no effect. Studiesof non-human primates, which are more limited, suggest that some animalsare salt-sensitive and some are not. In other words, for some animals, bloodpressure increases when salt is added to the diet; for other animals, there isno response.
THE INTERSALT STUDY
Intersalt was an observational study, conducted at 52 centers in 32countries; about 200 subjects age 20–59 were recruited in each center. Thetwo Brazilian centers were Indian tribes, the Yanomamo and Xingu. Therewas a center in Kenya, and one in Papua New Guinea. In Canada, therewere centers in Labrador and in St. John’s (Newfoundland). In the UnitedStates, there was a center in Hawaii, a center in Chicago, and four centers inMississippi.
Blood pressure (systolic and diastolic) was measured for each subject,along with urinary sodium and potassium (mmols/24 hrs), and various con-founders such as body mass index (weight/height2). Other confounders (likealcohol consumption) were obtained by questionnaire. Replicate urine mea-surements were obtained for a sub-sample of the subjects. Table 1 indicatessome of the data available for the various centers; units are explained below.
Within each center, the subjects’ blood pressures were regressed ontheir ages: the slope of the resulting line indicates how rapidly blood pressureincreases with age. (Complications will be discussed later.) Slopes were thencorrelated with salt levels across centers. The correlation was significant,

Freedman and Petitti 3
and seems to be the major finding of Intersalt as well as the basis for muchadvice to restrict salt intake.
In each center, the subjects’ blood pressures were also regressed ontheir urinary salt levels. The within-center regression coefficients were vari-able, some being positive, some negative, and some insignificant. Within-center regression coefficients were “pooled”—averaged—across centers,with weights inversely proportional to estimated variances. Generally, thewithin-center coefficients were adjusted for age and sex; sometimes, forage, sex, body mass index, alcohol, and potassium intake; the likely size ofmeasurement error in urinary salt was estimated from the replicate measure-ments, and statistical procedures were sometimes used to adjust results ofcross-center regressions for measurement error.
Pooled results were highly significant, especially after correction formeasurement error. The estimated effect of salt on blood pressure dependson the statistical adjustments: reduction of salt amounting to 100 mmol perday is estimated to lead to a reduction in systolic pressure in the range from 1to 6 mm Hg; for diastolic pressure, the estimated reduction ranges from .03to 2.5 mm Hg. See Intersalt (1988, Table 1) and Elliott et al. (1996, Table 1).By way of comparison, the urinary salt level in the Chicago center was 134mmol, not far from the current U.S. average; a reduction of 100 mmol getsdown to the level in Kenya or Papua New Guinea (Table 1).
Table 1: Intersalt data on systolic blood pressure. Selected centers. Medianurinary salt (mmol Na/24 hrs); median blood pressure (mm Hg);slope of blood pressure on age (mm Hg/yr); slope of blood pressureon urinary salt (mm Hg/mmol Na/24 hrs).
Na BP BP on Age BP on Na
Yanomamo, Brazil 0.2 95 .079 −.173Xingu, Brazil 6 99 .052 −.037Papua New Guinea 27 108 .149 +.037Kenya 51 110 .206 +.033
......
......
...
Hawaii 130 124 .638 +.044Chicago 134 115 .287 +.001Labrador 149 119 .500 +.043
......
......
...
Tianjin, PRC 242 118 .640 +.035

4 Salt and Blood Pressure
Units for Salt and Blood Pressure
The units in Table 1 may be unfamiliar and irritating, but they arestandard in the field. Relatively little salt is retained or excreted other thanin the urine, and dietary measurements are quite troublesome, so intake ismeasured by urinary excretion. Table salt is sodium chloride (NaCl), andurinary salt levels are measured in terms of sodium content, by weight. Theunit of weight is the millimole (mmol), that is, 1/1,000 of the gram molecularweight. Sodium (Na) has atomic weight nearly 23; so a mole of Na weighs23 grams, and 1 gram of Na is 1/23 = .0435 moles= 43.5 mmols. A dietaryintake of 2.5 grams per day of table salt corresponds to 1 gram per day ofsodium and 43.5 mmols per day of urinary sodium excretion; the other 1.5grams is the chlorine. By way of calibration, a typical American dietaryintake is 8.5 grams per day of salt, which corresponds to 8.5/2.5 = 3.4grams per day of sodium, and 3.4 × 43.5
.= 150 mmols per day of urinarysodium.
BP is blood pressure, measured in two phases—systolic and diastolic.The systolic phase corresponds to blood being pumped out of the heart, andthe pressure is higher; the diastolic phase corresponds to blood flowing backinto the heart, and pressure is lower. Pressure is measured relative to theheight of a column of mercury; units are millimeters of mercury (mm Hg).Average U.S. systolic pressure for persons over the age of 18 is about 125mm Hg; average diastolic pressure is about 75 mm Hg: standard deviationsare about 20 and 12, respectively.
Averages and standard deviations for BP are computed from NHANESIII—the third replication of the National Health and Nutrition Examina-tion Survey. Each replication is based on a large probability sample ofthe U. S. population; subjects fill out questionnaires describing diet, socio-economic status, and so forth; they also undergo a thorough medical exam-ination. The NHANES data will come up again, later.
A blood pressure of 140/75 means 140 systolic and 75 diastolic. “Nor-motensive” persons have normal blood pressures, and “hypertensives” havehigh blood pressures. Precise definitions vary from one study to another, but160/95 would generally be considered diagnostic of hypertension. In somestudies, even 140/90 would be classified as hypertension.
PATTERNS IN THE INTERSALT DATA
The correlational pattern across the Intersalt centers between salt leveland blood pressure is complex, and has not received the attention it de-

Freedman and Petitti 5
serves. Figure 1A plots the median systolic blood pressure against the me-dian level of urinary salt. The data are clearly non-linear, because thereare four outliers—centers with extremely low levels of salt and blood pres-sure. These are the two Brazilian tribes, Papua New Guinea, and Kenya;see Table 1. The four outliers show the expected upward trend. In the other48 centers, the trend is downward, although not significantly. (The adjust-ments contemplated by Intersalt create a positive slope, but significance isnot achieved; with 48 points, the adjusted slope is .0251 andP = .33; if all52 points are used, the adjusted slope is .0446 andP < .01; Intersalt 1988,Figure 3.)
90
100
110
120
130
0 50 100 150 200 250
Median Salt in Urine
Med
ian
Sys
tolic
Blo
od P
ress
ure
(A)
.00
.25
.50
.75
1.00
1.25
1.50
0 50 100 150 200 250
Median Salt in Urine
Rat
e of
Incr
ease
of S
ysto
lic B
P w
ith A
ge
(B)
Figure 1: Panel (A). Systolic blood pressure vs urinary salt. Median levels.Excluding the two Brazilian tribes, Papua New Guinea, and Kenya, the trendis downward but not significant (n = 48, r = −.14, P = .34, two-sided).Panel (B). Rate of increase of systolic blood pressure with age, plotted againstthe median level of salt in the urine for subjects at that center. Even in the48 centers, there is a significant upward trend (n = 48, r = .27, P = .05,two-sided).NOTES: The units for the horizontal axis in Figures 1–6 are mmols perday of urinary sodium—not sodium chloride. The data are from summarystatistics reported by Intersalt (1988, Appendix I).
Figure 1B plots the rate of change of systolic blood pressure with ageat each center, against the median level of urinary salt. There is a significant,positive relationship: at centers with higher levels of salt, systolic blood

6 Salt and Blood Pressure
pressure generally increases more rapidly with age. In combination, how-ever, Figures 1A and 1B lead to a paradox. For each of the 48 study centers,the regression line of blood pressure on age must pass through the middleof the scatter diagram, so that blood pressure at middle age should equalthe average blood pressure. In middle age, there is at best no cross-centerrelationship between salt and blood pressures (Figure 1A). Since blood pres-sures increase more rapidly in the centers with higher salt levels (Figure 1B),it follows that young people in the high-salt centers must have lower bloodpressures than their counterparts in the centers with lower salt intake.
In more detail, suppose (i) there is a linear relationship between age(x)
and blood pressure(y) for subjects within each of the 48 centers; (ii) acrossthe centers, as average salt intake goes up, the slope of the line goes up;(iii) subjects in all 48 centers have the same average age(x) and averageblood pressure(y). As always, the regression line for each center has to gothrough the point of averages(x, y) for that center. The point of averagesis the same for all the centers—assumption (iii). Therefore, the lines for thehigh-salt centers have to start lower than the lines for the low-salt centers,in order not to pass over them atx.
Assumption (i), with random error around the line, seems to be a drivingforce behind the analyses presented by Intersalt. Assumption (ii), again withsome noise, is just Figure 1B. Assumption (iii), at least with respect to bloodpressure, is the content of Figure 1A; yet again, there is noise in the data. Ifaverage blood pressures go down as average salt intake goes up—across the48 centers—that only sharpens the paradox. Noise, on the other, will blurthe effect.
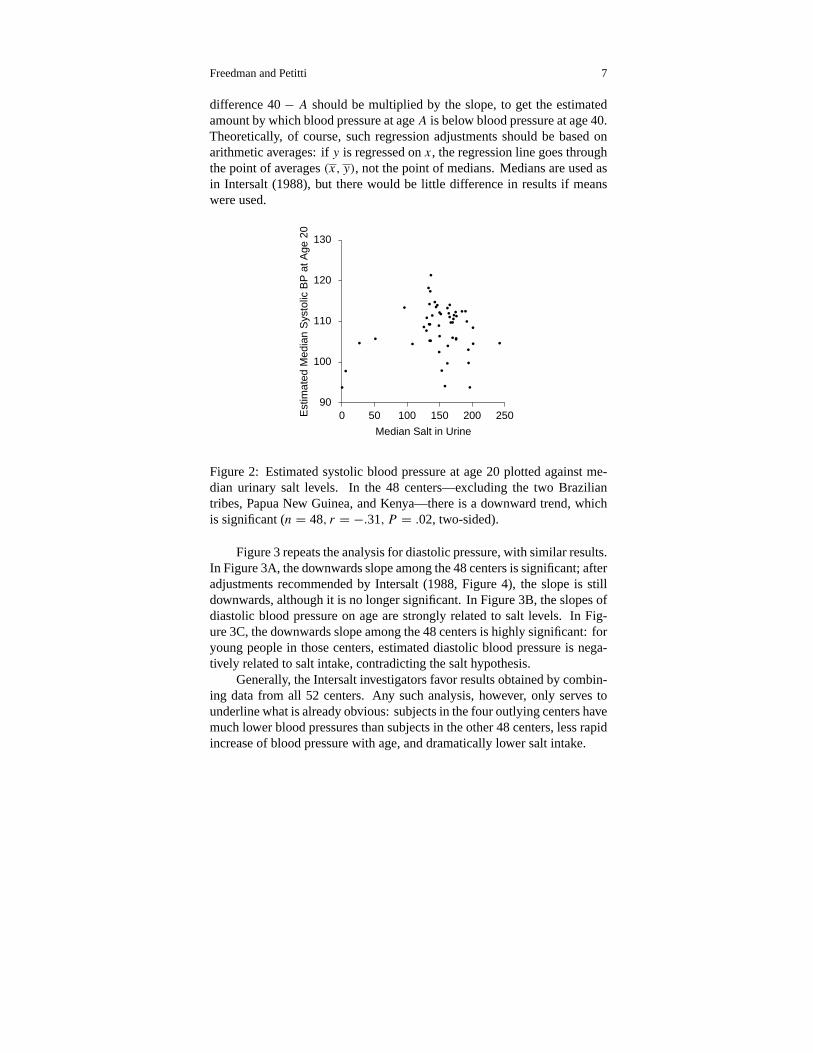
The paradox is shown graphically in Figure 2. Estimated systolic bloodpressure at age 20 in the various centers is plotted along the vertical axis; thehorizontal axis plots the levels of urinary salt. Excluding the four outliers,the relationship is negative and significant. If dietary advice is to be drawnfrom these data, it would seem to be the following. Live the early part ofyour life in a high-salt country, so your blood pressure will be low as ayoung adult; then move to a low-salt country, so your blood pressure willincrease slowly. The alternative position, which seems more realistic, isthat differences in blood pressures among the Intersalt study populations aremainly due to uncontrolled confounding—not variations in salt intake.
The underlying Intersalt data do not seem to be available, as discussedbelow, so Figure 2 takes the average age at each center as the midpointof the age range, namely, 40. Blood pressure at age 20 in each centercan then be estimated (by regression) as the overall median at that center,less 20 times the slope of blood pressure on age. There is an annoyingnumerical coincidence here: age 20 is 20 below the midrange of 40; the
Freedman and Petitti 7
difference 40− A should be multiplied by the slope, to get the estimatedamount by which blood pressure at ageA is below blood pressure at age 40.Theoretically, of course, such regression adjustments should be based onarithmetic averages: ify is regressed onx, the regression line goes throughthe point of averages(x, y), not the point of medians. Medians are used asin Intersalt (1988), but there would be little difference in results if meanswere used.
90
100
110
120
130
0 50 100 150 200 250
Median Salt in Urine
Est
imat
ed M
edia
n S
ysto
lic B
P a
t Age
20
Figure 2: Estimated systolic blood pressure at age 20 plotted against me-dian urinary salt levels. In the 48 centers—excluding the two Braziliantribes, Papua New Guinea, and Kenya—there is a downward trend, whichis significant (n = 48, r = −.31, P = .02, two-sided).
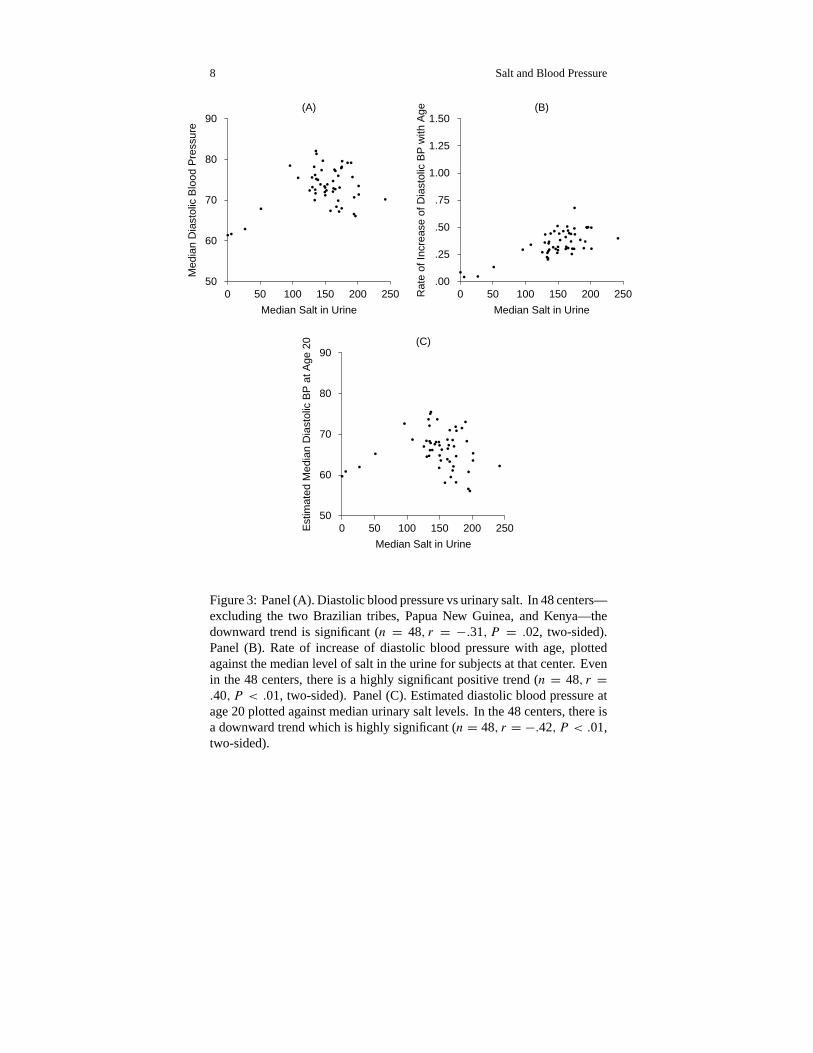
Figure 3 repeats the analysis for diastolic pressure, with similar results.In Figure 3A, the downwards slope among the 48 centers is significant; afteradjustments recommended by Intersalt (1988, Figure 4), the slope is stilldownwards, although it is no longer significant. In Figure 3B, the slopes ofdiastolic blood pressure on age are strongly related to salt levels. In Fig-ure 3C, the downwards slope among the 48 centers is highly significant: foryoung people in those centers, estimated diastolic blood pressure is nega-tively related to salt intake, contradicting the salt hypothesis.
Generally, the Intersalt investigators favor results obtained by combin-ing data from all 52 centers. Any such analysis, however, only serves tounderline what is already obvious: subjects in the four outlying centers havemuch lower blood pressures than subjects in the other 48 centers, less rapidincrease of blood pressure with age, and dramatically lower salt intake.
8 Salt and Blood Pressure
50
60
70
80
90
0 50 100 150 200 250
Median Salt in Urine
Med
ian
Dia
stol
ic B
lood
Pre
ssur
e
(A)
.00
.25
.50
.75
1.00
1.25
1.50
0 50 100 150 200 250
Median Salt in Urine
Rat
e of
Incr
ease
of D
iast
olic
BP
with
Age (B)
50
60
70
80
90
0 50 100 150 200 250
Median Salt in Urine
Est
imat
ed M
edia
n D
iast
olic
BP
at A
ge 2
0 (C)
Figure 3: Panel (A). Diastolic blood pressure vs urinary salt. In 48 centers—excluding the two Brazilian tribes, Papua New Guinea, and Kenya—thedownward trend is significant (n = 48, r = −.31, P = .02, two-sided).Panel (B). Rate of increase of diastolic blood pressure with age, plottedagainst the median level of salt in the urine for subjects at that center. Evenin the 48 centers, there is a highly significant positive trend (n = 48, r =.40, P < .01, two-sided). Panel (C). Estimated diastolic blood pressure atage 20 plotted against median urinary salt levels. In the 48 centers, there isa downward trend which is highly significant (n = 48, r = −.42, P < .01,two-sided).

Freedman and Petitti 9
P-values
The Intersalt investigators useP -values to assess their results; we fol-low suit, although the interpretation ofP may be somewhat problematic inthese contexts. (i) The 48 study centers might be viewed as a random sam-ple from some imaginary collection of potential study centers; additionalstatistical assumptions (such as linearity and homoscedasticity) may needto be imposed on this hypothetical superpopulation, depending on the anal-ysis that is to be rationalized. (ii) It might be assumed that the data weregenerated in accordance with some linear regression model, with a null hy-pothesis specifying that a certain coefficient vanishes. Although options (i)and (ii) have their aficionados, we find them unattractive (Abbott 1997; Berkand Freedman 1995; Goldthorpe 1998; Freedman 1999, 1995, with furthercitations).
There is at least one other possibility: for scatter diagrams like thosepresented here, with the four outliers set aside,P approximates the prob-ability of obtaining larger correlations than the observed ones—if thex-andy-coordinates are randomly paired (Freedman and Lane 1983). In anyevent, our test statistic wast = √
48− 2r/√
1 − r2, referred to a normaldistribution; equivalently, a straight line is fitted to the 48 points, and theslope is examined to see if it is significantly different from 0.
The Protocol
The Intersalt investigators offered a large number of analyses of thedata, and have returned to the topic more than once; see Intersalt (1988),Elliott et al. (1996), and Stamler (1997); for additional detail, seeJournalof Human Hypertension(1989, Vol. 3, No. 5). The results are not entirelyconsistent, and the protocol (Intersalt 1986) must now be considered.
(1) “The primary hypothesis to be tested in INTERSALT is that av-erage blood pressure and prevalence of hypertension are linearly relatedacross populations to the average levels of sodium intake, potassium intake(inversely) and the sodium-potassium intake ratio.” p. 781
(2) “The variation in electrolyte intake across the study population isjudged to be large enough to permit, as a second hypothesis, examiningalso these same relationships at the level of individuals, despite well knownwithin-individual variability in such intake.” p. 782
(3) “It is not expected that useful estimates will be possible. . . at thelevel of particular study populations; but it will be possible to look at therelations in individuals across the study as a whole. . . . The individual and

10 Salt and Blood Pressure
group relationships will be jointly explored by multi-level analytic tech-niques.” p. 785
(4) Adjustment for (random) measurement error is suggested withincenter but not across center, p. 783.
(5) Possible confounders include height, weight, physical activity, typeof work, socio-economic status, alcohol, family history, medication. pp. 783–84.
The primary Intersalt hypothesis—point (1) above—is rejected by thedata. As Figures 1 and 4 demonstrate, average blood pressure levels are notlinearly related to salt intake across the study populations: (i) the four outliersare different from the other 48 centers, and (ii) the relationship betweenblood pressure and salt is different in the two groups of data—positive in thefirst, negative in the second. In short, the relationship does not even seemto be monotone. The Intersalt investigators have paid comparatively littleattention to prevalence of hypertension, also mentioned as a primary variablein point (1), but the relationship between prevalence and salt is much likethat shown in Figures 1–3 for blood pressure and salt.
With respect to potassium intake, Intersalt (1988, 324) acknowledgesthat “potassium was inconsistently related to blood pressure in these cross-center analyses.” What they mean is that blood pressure is positively relatedrather than negatively related to potassium levels; the correlation is eitherhighly significant or not significant, depending on the details. In the 48centers,r = .40, P < .01 for the systolic phase, andr = .19, P = .19 fordiastolic. For all 52 centers, the correlations are .15 and .03. (Dropping thefour outliers makes a difference, because the Xingu and Yanomamo havevery high potassium levels and very low blood pressures.) In any event, theprimary study hypothesis is rejected by the data, for potassium as well assodium.
Adjusting cross-center regressions for measurement error appears to bea post hoc exercise—point (4). Pooling the within-center coefficients is alsopost hoc, and seems to replace more obvious multi-level regression analysessuggested by (2) and (3). The protocol (Intersalt 1986) does not mention theidea of pooling within-center regression coefficients. Furthermore, thesepost-hoc analyses are of doubtful validity, even on their own terms: theweights used to compute the overall average effect depend critically onunverified assumptions about the error structure in the regressions, and thereare equally unverified assumptions about the nature of the measurement errorin the urine variables. (Taking an average may be harmless, but the force ofthe assumptions will be felt when deriving standard errors andP -values.)
No adjustment is made for measurement error in confounders such as

Freedman and Petitti 11
alcohol consumption. Moreover, numerous confounders remain completelyuncontrolled. Diet—apart from its sodium or potassium content—wouldseem to be one major unmeasured confounding variable, as discussed below.Other potential confounders are listed in the protocol—point (5)—but notcontrolled in the data analysis: for example, physical activity, type of work,and socio-economic status. More generally, Intersalt’s chief analytic idea isthat people in Chicago can be converted to Yanomamo Indians by running aregression with a few control variables, a vision that will commend itself tosome observers but not others.
The rate of increase of blood pressure with age versus the salt level isalso a post hoc analysis. This has been acknowledged, if indirectly, by theprincipal figure in the Intersalt group—Stamler (1997, 634S). At scientificmeetings where these issues are raised, Intersalt investigators respond thatage by blood pressure was to have been the primary analysis, according tominutes of the working group. The response is peculiar—what else is in thoseminutes? Moreover, Intersalt (1988, 320) clearly states that results “wereassessed both within and across centres in accordance with prior plans,” cit-ing the published protocol (Intersalt 1986). Finally, the investigators cannotso easily brush aside the paradoxical implications of their models: for youngpeople, blood pressure is negatively related to salt intake.
HUMAN EXPERIMENTS
This section turns to human experiments, where salt intake is manipu-lated and the effect on blood pressure is determined. There have been manysuch experiments, and three recent meta-analyses—by Midgley et al. (1996),Cutler et al. (1997), and Graudal et al. (1998). Midgley et al. and Cutler etal. both regress blood pressure reduction on salt reduction and look for a sig-nificant slope; reductions are measured by comparing data in the treatmentand control conditions. Cutler et al. find significance, Midgley et al. do not.By contrast with Midgley et al., Cutler et al. force their line to go throughthe origin. Apparently, the decision to force the line through the origin iswhat leads to significance (Graudal et al. 1998, 1389).
Presumably, the idea behind the constraint is that zero reduction in bloodpressure corresponds to zero reduction in salt intake. Notably, however,the control groups in the experiments generally achieve some reduction inblood pressure. Thus, zero reduction in salt intake may well have an effect,depending on attendant circumstances. Generally, confounding due to flawsin experimental design—for instance, lack of blinding—can push the line

12 Salt and Blood Pressure
away from the origin (Cutler et al. 1997, 644S; Midgley et al. 1996, 1592–94;Graudal et al. 1998, 1389; Swales 2000, 4).
Table 2 shows the estimated reduction in systolic and diastolic bloodpressure (mm Hg) for normotensive and hypertensive subjects, correspond-ing to a 100 mmol per day reduction in urinary sodium. There is a largereffect on systolic than diastolic pressure, and hypertensives are more af-fected than normotensives. However, agreement among the three studies isnot good. Indeed, Midgley et al. and Graudal et al. report only a minimaleffect for normotensives, while Cutler et al. find a bigger effect. As notedbefore, a typical American dietary intake is 8.5 grams per day of salt (NaCl),which corresponds to 3.4 grams per day of sodium (Na), and 150 mmols perday of urinary sodium excretion. On this scale, a 100 mmol reduction insodium is striking.
Table 2: Estimated reduction in blood pressure (mm Hg) due to reductionin urinary sodium by 100 mmols per day; three meta-analyses.
Normotensive HypertensiveSystolic Diastolic Systolic Diastolic
Cutler et al. (1997) 2.3 1.4 5.8 2.5Midgley et al. (1996) 1.1 0.1 3.7 0.9Graudal et al. (1998) 0.8 0.2 3.6 1.6
NOTES: “Normotensives” have normal blood pressure, “hypertensives”have high blood pressure.
Given the lack of concordance in Table 2, it will not come as a surprisethat the three meta-analyses differ at the bottom line. Cutler et al. are stronglyanti-sodium, while the other two papers are relatively neutral. Thus, Cutler etal. (1997, 648S) find “conclusive evidence that moderate sodium reductionlowers systolic and diastolic blood pressure. . . .” However, according toMidgley et al. (1996, 1590), “dietary sodium restriction might be consideredfor older hypertensive individuals, but. . . the evidence in the normotensivepopulation does not support current recommendations for universal dietarysodium restriction.” Similarly, Graudal et al. (1998, 1383) conclude that thedata “do not support a general recommendation to reduce sodium intake.”
Publication Bias
Cutler et al. (1997, 648S) say there was “no indication for diastolicblood pressure from graphic and regression analysis that small negative

Freedman and Petitti 13
studies were underrepresented”; for systolic blood pressure, “the graphicplot was more suggestive,” although significance is not reached. Midgley etal. conclude that publication bias is evident, using a funnel plot to make theassessment.
Figure 4 is a funnel plot showing changes in systolic blood pressureplotted against sample size. (Occasionally, treatment and control groupswere of slightly different sizes; then the average of the two was used.) Studieson hypertensives and normotensives are represented by different symbols;data are from Cutler et al. Most of the studies find a reduction in bloodpressure, plotted as a negative value. In a few studies, salt reduction leadsto increased blood pressure, plotted as a positive value. The smaller studiesgenerally find more dramatic decreases in blood pressure. The differencebetween estimated effect sizes in the large studies and the small ones is whatindicates publication bias: unpublished small studies cannot make it into thepicture.
–15
–10
–5
0
5
10
15
0 5 10 15 20
Square Root of Sample Size
Cha
nge
in B
lood
Pre
ssur
e
Figure 4: Funnel plot. Studies with hypertensive subjects are marked bydots; normotensives, by crosses. Change in systolic blood pressure plottedagainst square root of sample size. In some studies, treatment increasesblood pressure, plotted as positive values on they-axis. Smaller studiesshow bigger effects, suggesting publication bias.
It may be helpful to describe the funnel plot more abstractly. The effectmeasure is plotted on the vertical axis and a measure of sample size on

14 Salt and Blood Pressure
the horizontal axis. In the absence of publication bias, the graph should—because of sampling variability—have the shape of a funnel with the wideopening to the left. The tip should point to the right and center on the trueeffect size. The funnel should be horizontal. The large studies and the smallones should be symmetrically distributed around the true effect size. If thereis bias against the publication of small studies with null results or resultsthat are unexpected, the wide part of the funnel will be distorted. For morediscussion, see Petitti (1999) or Swales (2000).
Some analysts assess publication bias by estimating the number ofimaginary zero-effect trials that would be needed to change the results fromsignificant to non-significant. If the number is large, that is evidence againstpublication bias. However, this “file-drawer” approach assumes that themissing estimates are centered on zero, and ignores the possibility thatsmaller studies with contrarian findings—significant or insignificant—arethe ones that have been withheld from publication. See Rosenthal (1979),Oakes (1986), Iyengar and Greenhouse (1988), or Petitti (1999). The funnelplot seems preferable.
After a systematic review of non-pharmacologic interventions to lowerblood pressure, including salt reduction, Ebrahim and Smith (1998, 441,444) find the evidence to be “surprisingly inadquate,” in part because “themajority of RCTs were of low methodological quality and bias often tendedto increase the changes observed.” Swales (2000) makes a similar pointwith respect to nonrandomized studies which suggest large effects and arefrequently cited. For additional discussion of meta-analysis in the medicalcontext, see for instance Shapiro (1994) or Bailar (1997, 1999).
DASH—Dietary Approaches to Stop Hypertension
DASH-1 assessed the effect on blood pressure of three diets: a controldiet, a fruit-and-vegetables diet, and a combination diet; the latter was richin fruit and vegetables, dairy products, whole grains, with limited amountsof fish, poultry, and meat. All three diets had the same moderate salt lev-els, 3 grams per day of sodium. The DASH-1 combination diet achievedquite striking reductions in blood pressure among hypertensive subjects(11.4 mm Hg systolic, 5.5 diastolic, relative to the control diet). See Harshaet al. (1999), Moore et al. (1999), or Appel et al. (1997).
The DASH-2 trial has a factorial design with two diets and three levelsof daily sodium: 3.3 grams, 2.4 grams, and 1.5 grams. The control dietis meant to resemble what typical Americans eat; the other diet is like theDASH-1 combination diet: compare Svetkey et al. (1999). Before publica-tion of study results, the investigators issued a press release on May 17, 2000

Freedman and Petitti 15
(http://www.nhlbi.nih.gov). The impact of salt reduction was emphasized—
NHLBI Study Shows Large Blood Pressure Benefit From ReducedDietary Sodium
The lower the amount of sodium in the diet, the lower the blood pressure,for both those with and without hypertension, according to a NationalHeart, Lung, and Blood Institute (NHLBI)-supported clinical study.
But diet has a considerable impact too, and there are interactions (Sacks etal. 2001, Figure 1). For normotensives on the DASH diet, according to chartspresented at scientific meetings, cutting salt in half reduces blood pressureonly by 1 or 2 mm—an effect which does not reach statistical significance,and is minor at best. The charts do not appear in the published article(compare Sacks et al. 2001, Figure 2; also see Taubes 2000). The publishedarticle contends that the “results should be applicable to most people inthe United States,” although the study population was chosen from groupsthat are relatively sensitive to changes in salt intake (high blood pressureat baseline, 134/86 compared to an age-adjusted U. S. average of 122/76;overweight, 85 kg compared to 77 kg; 56% African-American, compared to12%; Sacks et al. 2001, 8, Tables 1 and 2; NHANES III). Such complicationshave so far been ignored. Further comment must await publication of moredetails on the experiment and the statistical analysis.
HEALTH EFFECTS OF SALT
In essence, the Intersalt investigators argue that substantially reducingsalt intake will make a small reduction in blood pressure. Other epidemio-logic evidence suggests that lowering blood pressure by small amounts innormotensive populations reduces the risk of heart attack and stroke. How-ever, even if both propositions are accepted, the link between salt and riskremains to be established. See, for instance, the exchange between Psatyet al. (1999) and Temple (1999) on the general usefulness of surrogate end-points.
There is a huge literature on the health effects of salt; some of the morerecent and salient papers will now be mentioned. Smith et al. (1988) rana large observational study in Scotland (7354 men and women age 40–59),and found no effect of salt on blood pressure after adjusting for potassiumintake. He et al. (1999) find adverse health effects from high salt intakefor overweight persons; however, for persons of normal weight, there is noassociation between health risks and salt intake: data are from long-term

16 Salt and Blood Pressure
followup of subjects in NHANES I, and salt intake was measured by dietaryquestionnaire. Of course, with better measures of salt intake, the studymight have turned out differently. In other observational studies, Aldermanet al. (1991, 1995) find risks in salt reduction; Kumanyika and Cutler (1997)disagree. Also see Graudal et al. (1998) on health risks from salt reduction.Resnick (1999) stresses the role of calcium; also see McCarron and Reusser(1999).
Port et al. (2000) discuss non-linearities in risk due to blood pressure:their reanalysis of the Framingham data suggests that risk rises more slowlywith increasing blood pressure among normotensives, and more rapidlyamong hypertensives. The U. S. Preventive Services Task Force (1996, 625)finds “There is insufficient evidence to recommend for or against counselingthe general population to reduce dietary sodum intake. . . to improve healthoutcomes, but recommendations to reduce sodium intake may be made onother grounds.” Taubes (1998) has a scathing review of the salt epidemiol-ogy.
To determine the effect of salt reduction—or dietary interventions—onmortality or morbidity, large-scale long-term intervention studies would beneeded, and diet seems more promising. The DASH trials had a two- or three-month study period, with several hundred subjects, which is adequate onlyfor assessing effects on surrogate endpoints like blood pressure or chemistry.Also see Graudal et al. (1998, 1389), Ebrahim and Smith (1998, 4).
BACK TO INTERSALT
Hanneman (1996) notes the paradox in the Intersalt data, by estimatingthe blood pressure of infants. Law (1996) and Stamler et al. (1996) findthis argument “bizarre” and think “it is incorrect” to extrapolate beyond theages in the study (the present analysis uses age 20). The latter authors callattention to the large range in average blood pressures across centers forsubjects age 50–59. The range may be large, but its relevance is obscure.More to the point, predicted blood pressures at age 60 show no relationshipto salt levels, when the four outliers in the data are excluded (n = 48, r =.04 systolic,r = −.10 diastolic). If high salt intake leads to high bloodpressure at old age, the correlations should be strongly positive. On theother hand, if the data are non-linear and predictions from regression modelsare not trustworthy, the investigators should not be using regressions togenerate summary statistics, or drawing biological conclusions from modelparameters.

Freedman and Petitti 17
The difficulties in correcting for measurement error are discussed bySmith and Phillips (1996), with a response by Dyer et al. (1996). MacGregorand Sever (1996) defend Intersalt by reference to other data, but this begs asalient question: do the Intersalt data speak for or against the salt hypothesis?The Intersalt investigators have declined to make the underlying data public,“because of the need to preserve the independence of scientific investigation,the integrity of the data, and the confidentiality of information. . . . (Elliottet al. 1996, 1249).” We cannot see how releasing data threatens integrity orcompromises scientific independence; reversing these propositions makesthem more plausible. Moreover, data can be released without identifyingsubjects, so confidentiality need not be an issue.
Our review of the literature is no doubt incomplete in various respects,but it is sufficient to provide context for questions about the Intersalt data.
The Salt Epidemiologists Respond
The National Heart Lung and Blood Institute convened a workshop toaddress criticisms of the salt hypothesis, as in Taubes (1998). However, thesecriticisms are barely acknowledged in the official report on the workshop(Chobanian and Hill 2000), according to which
[S]tudies show unequivocally that lowering high blood pressure can re-duce the likelihood of developing or dying from CVD [cardiovasculardisease]. Second, dietary factors in individuals and in the populationat large have important effects on blood pressure levels, which are gen-erally assumed to translate to CVD risk. . . . An abundance of scientificevidence indicates that higher sodium consumption is associated withhigher levels of blood pressure. This evidence is found in animal stud-ies, observational epidemiologic studies, and clinical studies and trials.
The INTERSALT findings support similar studies that show a relation-ship between sodium intake and blood pressure. The discussion relativeto INTERSALT emphasized that its strengths are its large sample sizeand sophisticated statistical analyses. . . . it was noted that difficult sta-tistical issues are involved in the interpretation of the INTERSALTdata.
If this is the concession, it is too subtle. And the language is hauntinglysimilar to Stamler’s (1997, 626S) defense of his study:
The INTERSALT results, which agree with findings from other diversestudies, including data from clinical observations, therapeutic interven-tions, randomized controlled trials, animal experiments, physiologic

18 Salt and Blood Pressure
investigations, evolutionary biology research, anthropologic research,and epidemiologic studies, support the judgment that habitual high saltintake is one of the quantitatively important preventable mass expo-sures causing the unfavorable population-wide blood pressure patternthat is a major risk factor for epidemic cardiovascular disease.
Next, we quote from the editors of the British Medical Journal. The senti-ments seem eminently reasonable to many proponents of the salt hypothesis.Persons not in the fold may react differently.
Like any group with vested interests, the food industry resists regu-lation. Faced with a growing scientific consensus that salt increasesblood pressure and the fact that most dietary salt (65–85%) comesfrom processed foods, some of the world’s major food manufactur-ers have adopted desperate measures to try to stop governments fromrecommending salt reduction. Rather than reformulate their products,manufacturers have lobbied governments, refused to cooperate with ex-pert working parties, encouraged misinformation campaigns, and triedto discredit the evidence. (Godlee 1996, 1239).
Drafts of our paper have been circulated in the community of salt epidemi-ologists. Reactions can be paraphrased as follows.
The regression of blood pressure on age within center doesn’t indicatehow rapidly blood pressure increases with age, because the data aren’tlongitudinal. [Fair enough, but then what were the Intersalt peopledoing?]
Epidemiologists can never wait for final proof. Instead, recommenda-tions must be made in the interest of promoting good health for thepublic.
The effect of salt reduction may be detectable only in hypertensives,but today’s normotensives are tomorrow’s hypertensives.
Public health guidelines to reduce sodium consumption from threegrams to one gram will hurt no one, and may benefit thousands.
Access to data can distort, confuse, intimidate, and muddy the watersof medical care and public health.
In summary, the public must be protected from salt, from the machinationsof industry, and above all from the data.

Freedman and Petitti 19
POLICY IMPLICATIONS
One segment of the public health community—funded by the the Na-tional Heart Lung and Blood Institute and endorsed by many journals inthe field—has decided that salt is a public health menace. Therefore, saltconsumption must be drastically curtailed. The force with which this con-clusion is presented to the public is not in any reasonable balance with thestrength of the evidence. Programs, once in place, develop a life of theirown; the possibility of health benefits becomes probability, and probabilitybecomes certainty. After all, the public is easily confused by complications,only professionals can weigh the evidence, and where is the harm in saltreduction?
The harm is to public discourse. The appearance of scientific unanimityis a powerful political tool, especially when the evidence is weak. Dissentbecomes a threat, which must be marginalized. If funding agencies andjournals are unwilling to brook opposition, rational discussion is curtailed.There soon comes about the pretense of national policy based on scientificinquiry—without the substance. In our view, salt is only one example of thisphenomenon.
REFERENCES
Abbott, A. 1997. Of time and space: the contemporary relevance of theChicago school.Social Forces75:1149–82.
Alderman, M. H., S. Madhavan, H. Cohen, et al. 1995. Low urinary sodiumis associated with greater risk of myocardial infarction among treated hyper-tensive men.Hypertension25:1144–52.
Alderman, M. H., S. Madhavan, W. L. Ooi, et al. 1991. Association of therenin-sodium profile with the risk of myocardial infarction in patients withhypertension.New England Journal of Medicine324:1098–1104.
Appel, L. J., T. .J. Moore, E. Obarzanek, et al. 1997. A clinical trial of theeffects of dietary patterns on blood pressure. DASH Collaborative ResearchGroup.New England Journal of Medicine336:1117–24.
Bailar, J. C. 1997. The promise and problems of meta-analysis.New EnglandJournal of Medicine337:559–61.
Bailar, J. C. 1999. Passive smoking, coronary heart disease, and meta-analysis.New England Journal of Medicine340:958–59.
Berk, R. and D. A. Freedman. 1995. Statistical assumptions as empiricalcommitments. InPunishment and social control: essays in honor of Sheldon
20 Salt and Blood Pressure
L. Messinger. Thomas G. Blomberg and Stanley Cohen, editors. New York:Aldine de Gruyter. Pp. 245–258.
Chobanian,A.V. and M. Hill. 2000. National Heart, Lung, and Blood InstituteWorkshop on Sodium and Blood Pressure: a critical review of current scientificevidence.Hypertension35:858–63. Quotes are from the on-line unabridgedversion (www.nhlbi.nih.gov).
Cutler, J. A., D. Follmann, and P. S. Allender. 1997. Randomized trials ofsodium reduction: an overview.American Journal of Clinical Nutrition65Suppl:643S–651S.
Dyer, A. R., P. Elliott, M. Marmot, et al. 1996. Commentary: strength andimportance of the relation of dietary salt to blood pressure.British Journal ofMedicine312:1663–65.
Ebrahim, S. and G. Davey-Smith. 1998. Lowering blood pressure: a system-atic review of sustained effects of non-pharmacological interventions.Journalof Public Health Medicine20:441–8.
Elliott, P., J. Stamler, R. Nichols, et al. 1996. Intersalt revisited: furtheranalyses of 24 hour sodium excretion and blood pressure within and acrosspopulations.British Journal of Medicine312:1249–53.
Freedman, D. A. 1995. Some issues in the foundation of statistics.Founda-tions of Science1 19–83.
Freedman, D. A. 1999. From association to causation: some remarks on thehistory of statistics.Statistical Science14: 243–58.
Freedman, D.A. and D. Lane. 1983. A nonstochastic interpretation of reportedsignificance levels.Journal of Business and Economic Statistics1:292-8.
Godlee, F. 1996. The food industry fights for salt.British Journal of Medicine312:1239–40.
Goldthorpe, J. H. 1998.Causation, statistics and sociology. Twenty-ninthGeary Lecture, Nuffield College, Oxford. Published by the Economic andSocial Research Institute, Dublin, Ireland.
Graudal, N. A., A. M. Galløe, and P. Garred. 1998. Effects of sodium restric-tion on blood pressure, renin, aldosterone, catecholamines, cholesterols, andtriglyceride. A meta-analysis.Journal of the American Medical Association279:1383–91.
Hanneman, R. L. 1996. Intersalt: hypertension rise with age revisited.BritishJournal of Medicine312:1283–84.
Harsha, D. W., P. H. Lin, E. Obarzanek, et al. 1999. Dietary approachesto stop hypertension: a summary of study results.Journal of the AmericanDietetic Association99 Suppl:35–39.
Freedman and Petitti 21
He, J., L. G. Ogden, S. Vupputuri, et al. 1999. Dietary sodium intake andsubsequent risk of cardiovascular disease in overweight adults.Journal of theAmerican Medical Association282:2027–34.
Intersalt Cooperative Research Group. 1986. Intersalt study. An internationalco-operative study on the relation of blood pressure to electrolyte excretion inpopulations. Design and methods.Journal of Hypertension4:781–7.
Intersalt Cooperative Research Group. 1988. Intersalt: an international studyof electrolyte excretion and blood pressure. Results for 24 hour urinary sodiumand potassium excretion.British Journal of Medicine297:319–28.
Iyengar, S. I. and J. B. Greenhouse. 1988. Selection models and the filedrawer problem.Statistical Science3:109–117.
Kumanyika, S. K. and J. A. Cutler. 1997. Dietary sodium reduction: is therecause for concern?Journal of the American College of Nutrition16:192–203.
Law, M. 1996. Commentary: evidence on salt is consistent.British Journalof Medicine312:1284–85.
MacGregor, G. A. and P. S. Sever. 1996. Salt—overwhelming evidence butstill no action: can a consensus be reached with the food industry?BritishJournal of Medicine312:1287–89.
McCarron, D. A. and M. E. Reusser. 1999. Finding consensus in the dietarycalcium-blood pressure debate.Journal of the American College of Nutrition18 Suppl:398S-405S.
Midgley, J. P., A. G. Matthew, C. M. Greenwood, and A. G. Logan. 1996.Effect of reduced dietary sodium on blood pressure.Journal of the AmericanMedical Association275:1590-97.
Moore, T. J., W. M. Vollmer, L. J. Appel, et al. 1999. Effect of dietarypatterns on ambulatory blood pressure: results from the Dietary Approachesto Stop Hypertension (DASH) Trial. DASH Collaborative Research Group.Hypertension34:472–7.
Oakes, M. 1986.Statistical Inference. Chestnut Hill, Mass.: EpidemiologyResources Inc.
Petitti, D. B. 1999.Meta-Analysis, Decision Analysis, and Cost-EffectivenessAnalysis. 2nd ed. New York: Oxford University Press.
Port, S., L. Demer, R. Jennrich, D. Walter, and A. Garfinkel. 2000. Systolicblood pressure and mortality.Lancet355:175–80.
Psaty, B. M., N. S. Weiss, C. D. Furberg, et al. 1999. Surrogate end points,health outcomes, and the drug-approval process for the treatment of risk fac-tors for cardiovascular disease.Journal of the American Medical Association282:786–90.
Resnick, L. M. 1999. The role of dietary calcium in hypertension: a hierar-chical overview.American Journal of Hypertension12:99–112.

22 Salt and Blood Pressure
Rosenthal, R. 1979. The “file drawer” and tolerance for null results.Psycho-logical Bulletin86:638–41.
Sacks, F. M., L. P. Svetkey, W. M. Vollmer, et al. 2001. Effects on blood pres-sure of reduced dietary sodium and the dietary approaches to stop hypertension(DASH) diet. New England Journal of Medicine344:3–10.
Shapiro, S. 1994. Meta-analysis, Shmeta-analysis. With discussion.Ameri-can Journal of Epidemiology140:771–91.
Smith, G. D. and A. N. Phillips. 1996. Inflation in epidemiology: “The proofand measurement between two things” revisited.British Journal of Medicine312:1659–63.
Smith, W. C., I. K. Crombie, R. T. Tavendale, et al. 1988. Urinary electrolyteexcretion, alcohol consumption, and blood pressure in the Scottish heart healthstudy.British Journal of Medicine297:329–30.
Stamler, J. 1997. The Intersalt study: background, methods, findings, andimplications.American Journal of Clinical Nutrition65 Suppl:626S–42S.
Stamler, J., P. Elliott, A. R. Dyer, et al. 1996. Commentary: Sodium andblood pressure in the Intersalt study and other studies—in reply to the SaltInstitute.British Journal of Medicine312:1285–87.
Svetkey, L. P., F. M. Sacks, E. Obarzanek, et al. 1999. The DASH diet, sodiumintake and blood pressure trial (DASH-sodium): rationale and design.Journalof the American Dietetic Association99 Suppl:96–104.
Swales J. 2000. Population advice on salt restriction: the social issues.Amer-ican Journal of Hypertension13:2–7.
Taubes, G. 1998. The (political) science of salt.Science281:898–907.
Taubes, G. 2000. A DASH of data in the salt debate.Science288:1319.
Temple, R. 1999. Are surrogate markers adequate to assess cardiovasculardisease drugs?Journal of the American Medical Association282:790–5.
U. S. Preventive Services Task Force. 1996. Guide to Clinical PreventiveServices. 2nd. ed. Baltimore: Williams & Wilkins.
David A. Freedman is professor of statistics and mathematics at the University ofCalifornia, Berkeley. His research interests are in the foundation of statistics, mod-eling, and policy analysis. He has published numerous articles and several books,including a standard introductory text (with Robert Pisani and Roger Purves).
Diana B. Petitti is a physican and epidemiologist who is currently Director of Re-search for Kaiser Permanente Southern California. She is board-certified in Preven-tive Medicine and has written widely on the use of evidence in making recommenda-tions to the public about interventions to prevent disease.
Neither author consults for the salt industry.