Embed Size (px)
Citation preview
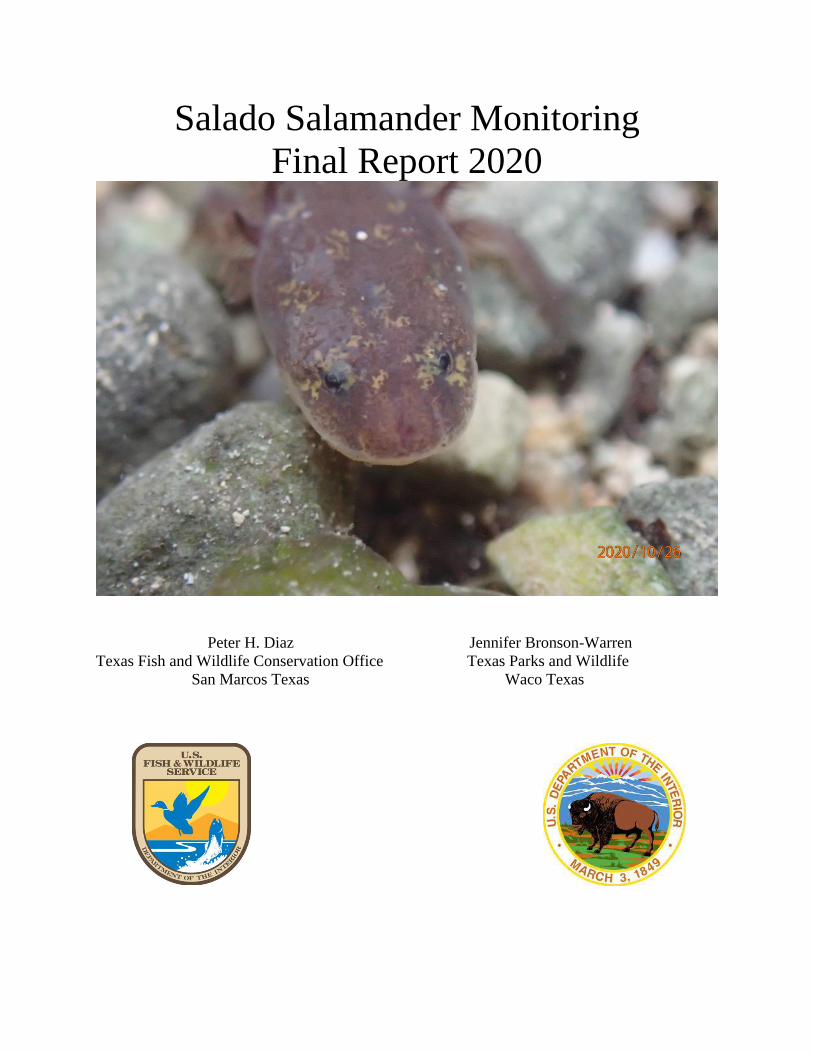
Salado Salamander Monitoring
Final Report 2020
Peter H. Diaz Jennifer Bronson-Warren
Texas Fish and Wildlife Conservation Office Texas Parks and Wildlife
San Marcos Texas Waco Texas

Table of Contents Executive Summary ........................................................................................................................ 3
Introduction ..................................................................................................................................... 3
Methods........................................................................................................................................... 4
Results ............................................................................................................................................. 6
Robertson and Downtown Spring Complex ............................................................................... 6
Solana Ranch Spring #1 .............................................................................................................. 7
Aquifer Invertebrates .................................................................................................................. 8
Well Sampling ............................................................................................................................ 9
Gault Archeological Site ............................................................................................................. 9
Population Genetic Study ......................................................................................................... 10
Discussion ..................................................................................................................................... 10
Literature Cited ............................................................................................................................. 22
Acknowledgements
We appreciate the assistance of Justin Crow from the San Marcos Aquatic Resources Center and TPWD
biologist for help with the collections. To Tim Brown for the support over the years. A number of
specialized taxonomists including Okan Kulkoyluoglu (Ostracoda), Felipe Soto-Adames (Collembola),
Kathryn Perez (Gastrapoda), Kelly Miller (Dytiscidae), Ian Smith (Acari), Charles Stephan
(Pseudoscorpions), Marshal Hedin (Cicurina sp.), Paul Marek (Millipedes), Mary Jones (Palpigrades),
Robert Anderson (Curcuilionidae), and Ana Camacho (Bathynellacea) have been irreplaceable in
gathering the species information on taxa and distributions. We appreciate the support from Bell County,
the Village of Salado, and Clearwater Underground Water Conservation District for funding this work.
Executive Summary Monitoring of the Salado salamander concluded in January of 2021 finalizing the sixth
year of monitoring by the Texas Fish and Wildlife Conservation Office (TXFWCO) at the
Salado Downtown Spring Complex (DSC) and at Robertson Springs in Bell County. A total of
14 Salado salamanders were detected this year at Robertson and the DSC. Almost all
salamanders were captured at the DSC (n = 11). Within the DSC, Side Spring had the most
detections of salamanders over the course of the year (n = 10). Only three detections were
documented at Robertson Springs during 2020, due to the lack and loss of discharge from springs
on the property in August, and a missed sampling event in Spring due to Covid-19. As of
January, Robertson has flow from only a small number of low flowing springs below Ludwigia
Spring. All salamanders were captured during active searches.
Monitoring continued at Solana Ranch Spring #1 (SR1), providing a second year of
quarterly count data. Monitoring producing a total of 123 detections producing, including 87
individual salamanders (determined through photographic analysis) over the quarterly
monitoring period. The majority of salamanders captured at Solana were adults. There was a
recapture of an individual salamander caught in September of 2017 and then recaptured again
this year in August.
Other monitoring conducted in 2020 included sampling wells within the southern portion
of Bell County. This sampling produced no salamanders or aquatic invertebrates. Well sampling
in 2021 will include a net similar to a plankton tow net, instead of passive bottle traps. A drift net
was deployed at the Gault Archeological Site in September to collect data for future aquifer
studies. The population genetics project, in collaboration with Dr. Chris Nice at Texas State
University, is currently in review at Conservation Genetics and we hope to have it published
shortly.
Introduction The Salado salamander (Eurycea chisholmensis) was first described as a species in 2000
(Chippendale et al. 2000). Although the salamander had been discovered earlier and was in a
collection kept at Baylor University by B.C. Brown, no formal description had been made. In
addition, collecting individuals from this population proved to be difficult (Chippendale et al.
2000). Due to the limited knowledge about the species (population density, life history patterns),
potential threats (dewatering and urbanization), and limited geographical range, this species was
listed as threatened by the U.S. Fish and Wildlife Service (USFWS) on February 21, 2014. The
USFWS is in the process of designated critical habitat for this species.
The Salado salamander is highly restricted geographically and is hypothesized to have a
very low population within Central Texas (Norris et al. 2012). It has been proposed, that a much
more streamlined phylogenetic hypothesis may apply to Central Texas Eurycea, (Forstner et al.
2012) and that the additional Eurycea within the Central Texas area had not been analyzed in
context with congeners, but that is not the case. A peer-reviewed publication by Pyron and
Weins (2011) genetically examined all Spelerpines, a subfamily under the family Plethodontidae,
which included all Eurycea (E. chisholmensis, E. naufragia, and E. tonkawae). Pyron and Weins
(2011) suggests that the phylogenetic analysis by Chippendale et al. (2004) was appropriate and
that indeed these are distinct species. In addition, a recent study, funded through a Section 6
grant (#443022) by Dr. Hillis of the University of Texas, confirms the species designation was
indeed scientifically valid (Devitt et al. 2019).
Before monitoring by Texas Fish and Wildlife Conservation Office (TXFWCO), there
was no active research or monitoring program in place for this species. The TXFWCO proposes
to conduct long term monitoring of the species within its known geographical range. A long-term
data set will eventually provide a statistically valid sample size to base future management
Methods Sampling was conducted quarterly this year at the DSC, Robertson Springs, and SR1
(Figure 1). Timed searches were used at Robertson, while Side and Anderson spring were
searched entirely due to the small area of the springs. Solana Ranch Spring #1 was sampled from
the spring orifice to a location where the spring run fans and enters the main channel. Areas
where the water emerged from under the gravel and cobble pile were searched. Another smaller
spring adjacent to the main spring was also searched each visit. All springs were actively
searched by turning over rocks and debris. Captured salamanders were placed into mesh bags
and kept in the spring run for processing. During timed searches all mesohabitats were searched
for salamanders.
Drift nets with 250 µm mesh were used for passive sampling used at a number of
locations at Robertson and SR1. Nets were left in place for seven days as part of the passive
sampling for the monitoring regime. Aquatic invertebrates captured during drift netting were
taken back to the lab, sorted, identified, and enumerated. Most taxa were photographed using a
dissecting scope with certain taxa sent to experts for identification.
If a salamander was captured during any survey the primary substrate and vegetation
were documented. If a salamander was captured in the drift net placed over an orifice, a
designation of cave conduit was applied for substrate. All captured salamanders had two sets of
photographs taken. First, photographs alongside a ruler were taken to determine total length of
the salamander (mm) using the program ImageJ (Schneider et al. 2012). Following that, a close-
up photograph of the head was taken to be used with the program WildID (Bolger et al. 2012) to
determine if any individuals were recaptures (Bendik et al. 2013).
Due to low surface densities encountered at the sites over the years, the data have been
collapsed and examined cumulatively. As in previous reports the overall dataset has been
updated to include the 2020 collections. Data was grouped into seasonal blocks for a size
distribution analysis. The relative abundance of the salamanders was calculated for each season
based upon size classes. Size classes are from 0-19, 20-29, 30-39, 40-49, 50-59, 60-69 mm.
Associated substrate and vegetation percentages were updated to reflect the new collections.
The salamanders from Solana Ranch Spring #1 were examined by creating a probability
from the 2019 and 2020 capture history of each salamander. These years were selected as there
are quarterly data available for each. This data is from six sampling events, including 64
individuals in 2019, and five sampling events with 80 individuals in 2020. Each time a
salamander was captured and identified, it received a 1, therefore the capture history of a
salamander for 2019 may resemble 101001 (six number places for six events, 0 = not detected, 1
= detected). For this example the probability is just the sum of the captures divided by the
number of events, therefore, 0.5. By examining average probabilities of the capture history for
the salamanders, there might be some insight into the effort of sampling between years.
Other sampling that occurred this year and over the history of the monitoring program are
presented in the results. These data include sampling at the Gault Archeological Site (Gault Site)
and from wells in the southern portion of Bell County. The Gault Site is located within the know
range of the Salado salamander The Gault Site sampling consists of passive techniques to detect
the presence of salamanders and collect aquifer invertebrates using drift nets. Compared to the
Gault Site, the wells sampled used bottle traps to collect samples at 14 sites.
Water level and flow data was collected from the Cemetery Well (Monitor well
#5804628) and from the USGS gauge on the Salado Creek (USGS #08104300) from 2014 to
2020. This data was plotted with the total collection of salamanders from each year of sampling
since 2015. This analysis was conducted to determine if there is an indicator for the issuance of
spring flow at Robertson, and to identify preliminary trends associated with the salamander
collections.
Results
Robertson and Downtown Spring Complex
A total of 14 salamanders were detected at Robertson and the DSC (Table 1). Of these
14, three were juveniles (< 25 mm total length; Bowles et al 2006) and 10 were adults, with one
escaping before it could be photographed. Most salamanders were captured from the DSC at
Side Spring (n = 10) with one additional specimen from Anderson Spring (n = 1). Robertson
Springs produced three salamanders, two at Middle Spring (n = 2), and one at Ludwigia (n =1)
(Figure 2). By June of 2020, flow at Robertson Springs complex was only issuing from the
lowest downstream orifice at the Ludwigia spring zone. Flows at Robertson had still not returned
to the Headwater, Middle, or Ludwigia zones by January 12, 2021. Drift netting captured zero
salamanders at Robertson Springs. No orifice were netted at the DSC in 2020.
A total of 171 Salado salamanders have been captured since 2015. Some salamanders do
not have associated substrate or vegetation data, leaving 168 salamanders to examine the
substrate and vegetation associations. A total of 65 (38%) salamanders have been captured in
drift nets, presumably leaving the aquifer. Of the remaining 103 salamanders caught on the
surface, 66 (64%) have been caught in gravel as the primary substrate, and 28 (27%) have been
caught in cobble as the primary substrate (Table 2). Data from past habitat sampling at Robertson
Springs has shown around 50% of the substrate to be silt (Diaz et al. 2016). Salamanders have
been captured in many types of vegetation, but 43 (41%) have been shown to associate with
watercress (Nasturtium sp.), and 38 (36%) have been captured in areas with no vegetation.
From the 171 total individuals detected, 163 were used to examine the temporal shift in
size for surface populations at the DSC and Robertson. The updated temporal shift in size of the
surface population show a classic size progression from smaller to larger, over the course of the
year (Figure 3). In spring, the majority of salamanders captured were in the smallest size class
ranging from 10 to 19 mm. The line for spring is minimally expressing a bimodal hump, with a
smaller hump in the fifth size class. In summer, the smallest size class is still prevalent, however,
the second hump is comparable in the third size class. During fall, the bimodal hump resembles
the inverse of the spring line as the 4th size class is the most expressed. The winter line is similar
to the fall line except the initial hump of the line is in the first size class other than the second
size class as in fall. Overall, the most salamanders have been detected in spring, with the least
detected in winter (Figure 4).
There appears to be a trend with juvenile salamanders and their appearance on the
surface. While juvenile salamanders have been captured throughout the year, there is some
clustering from spring to summer, indicating young of the year being detected on the surface
(Figure 5). To test for this we ran a chi-squared test, where we assume that juvenile salamanders
should be present equally over the course of the year. This would be the case if there is no
breeding season. To estimate the age of the juvenile salamanders, we used growth curves from
the San Marcos Aquatic Resource Center that show a salamander under 20 mm is about a month
old (unpublished data). Therefore, using these assumptions a chi-squared test was run and a
significant difference was detected with season and juvenile salamanders under 20 mm in total
length which are hypothesized to be around 30 days old (x-squared = 37; df = 3; p = <0.0001).
Solana Ranch Spring #1
A total of 123 salamanders were captured at SR1 during 2020. After removing recaptures
of individual adult salamanders, the capture history shows that 94 individual adult salamanders
were detected and photographed during 2020. In 2019, 64 individual adults were detected and
photographed. Monitoring data from 2020 identified two recaptured salamanders dating back to
September 2017. The average capture probability for detecting an individual at SR1 this year
was 0.24 compared to 0.27 from 2019.
Twelve salamanders were considered juveniles (<25 mm). Reviewing the salamanders
capture data at SR1, dating back to 2017, the majority of the surface population were adults
(85%). The size average, based on the 317 salamanders detected since 2017, is 48.18 mm. The
largest Salado salamander (87 mm), captured to date, was captured at SR1 in October 2020. This
was the first detection of this “large” individual salamander.
The temporal shifts in size class follow the same trends as the DSC and Robertson data,
but the overall population exhibits larger salamanders on the surface year round (Figure 6).
During the fall there have been no documented occurrences of salamanders in the first or second
size class.
Cannibalism was documented in 2019 during the mark and recapture work. One
individual salamander was caught with three eyes at first glance (Photo 1). Following a closer
inspection a juvenile salamander was seen with the head out of the other salamanders mouth. The
juvenile salamander appeared incapacitated and was left in place.
Aquifer Invertebrates
Drift net sampling at a number of springs within the Robertson and at Anderson springs
has been conducted in order to examine surface recruitment and detect juveniles exiting the
aquifer. It has also provided a detailed data set of the karst invertebrates present at each spring
opening or complex. Sampling the springs with drift nets has shown large range extensions for a
number of aquifer dwelling taxa (Alvear et al. 2020a) and provided samples of undescribed
species (Alvear et al. 2020b, Gibson et al. In Review) present within this section of the Northern
Edwards Aquifer.
Based on samples collected since 2015, we have a basic understanding of the stygofaunal
(aquifer dwelling taxa) community structure at the springs studied in Bell County. Drift net
sampling from a cumulative sampling period of over 2,100 days (2015 to June of 2018),
collected over 4,500 aquifer dwelling individuals (Table 3). Data shows that the majority of the
community is comprised of Stygobromus spp. (45%; Amphipoda; three species) and aquifer
snails (28%; five species). Two families of snails were the most abundant out of the 32%, the
first family Hydrobiidae (Phreatodrobia conica; 14%) and then the family Lithoglyphidae
(Phreatocerus taylori; 9%). The isopod, Lirceolus spp. was at 16% and has three different
species present in the community (Schwartz et al. 2020). All of these stygofauna are within the
size range, during all life stages, to be prey items for salamanders. Two studies suggest that there
are increases in other aquifer snails, although a different family, during the summer (Johnson et
al. 2019) and spring (Diaz et al. 2020). In addition to the aquifer invertebrates, many terrestrial
karst invertebrates have been captured over the monitoring period. Most interesting from the
terrestrial group include specimens of Cicurina sp, Speodesmus sp., and Lymantes nadineae
(Photo 2). In the 2015 report, Myrmecodesmus reddelli, was stated as being present at Robertson
Springs. Paul Marek, a millipede expert at Virginia Tech, was sent the specimens and in May of 2019
a determination was made that the Myrmecodesmus in question is indeed, M. formicarius, not
Myrmecodesmus reddelli, which would have been a large range extension.
Well Sampling
This year a series of 14 wells were sampled in collaboration with the Texas Water
Development Board (TWDB). The wells ranged in depth from 1010 ft to 95 ft and were sampled
using bottle traps to examine other areas not accessible by spring orifice for Salado salamanders
and aquifer dwelling invertebrates. Traps were deployed on March 3, 2020, with the intent of
checking them periodically (once every two weeks). On March 10th traps were checked and no
salamanders or aquifer invertebrates were detected. The traps were left in place and then Covid-
19 restrictions occurred. Traps remained in the wells until June 6th and June 16th 2020. No
salamanders or aquifer invertebrates were detected in the duration of the well work. All wells
will be sampled again using active sampling methods with a device similar to a plankton tow net
in 2021.
Stream Flow and Well Height Data
This analysis shows the tracking of the Cemetery Well with the capture of salamanders
(Figure 7. Although there have been varying levels of effort over the years, if the springs are dry
no salamanders will be surfacing. Once the springs on the Robertson property go dry a large
percentage of salamanders are removed from the overall potential total at year end. Only when
flows return to the springs at the Robertson property do the probabilities of capturing a
salamander return. This year, the flows did not return at the end of the year as they have in the
past and flows from the productive spring zones at Robertson began to fade out in early June.
This graph shows the tracking of the Cemetery Well with the capture of salamanders and the
mirroring of the USGS guage (Figure 8).
Gault Archeological Site
No salamanders have been captured at the Gault Site. Drift nets have been used as the
primary sampling technique for a total of 183 days to determine the presence of salamanders at
this site. The karst aquatic invertebrate community is typical for the area of Bell County, based
off of collections made at other spring locations over the last four years (Table 3). Certain spring
adapted taxa occur at the Gault Site and include aquifer snails, Heterelmis sp. (Riffle beetle), and
Stygobromus sp. (Amphipoda). One of the Hydrobiidae snails may potentially be a new species
(Photo 3). Samples of this specimen have been sent to Dr. Kathryn Perez at the University of
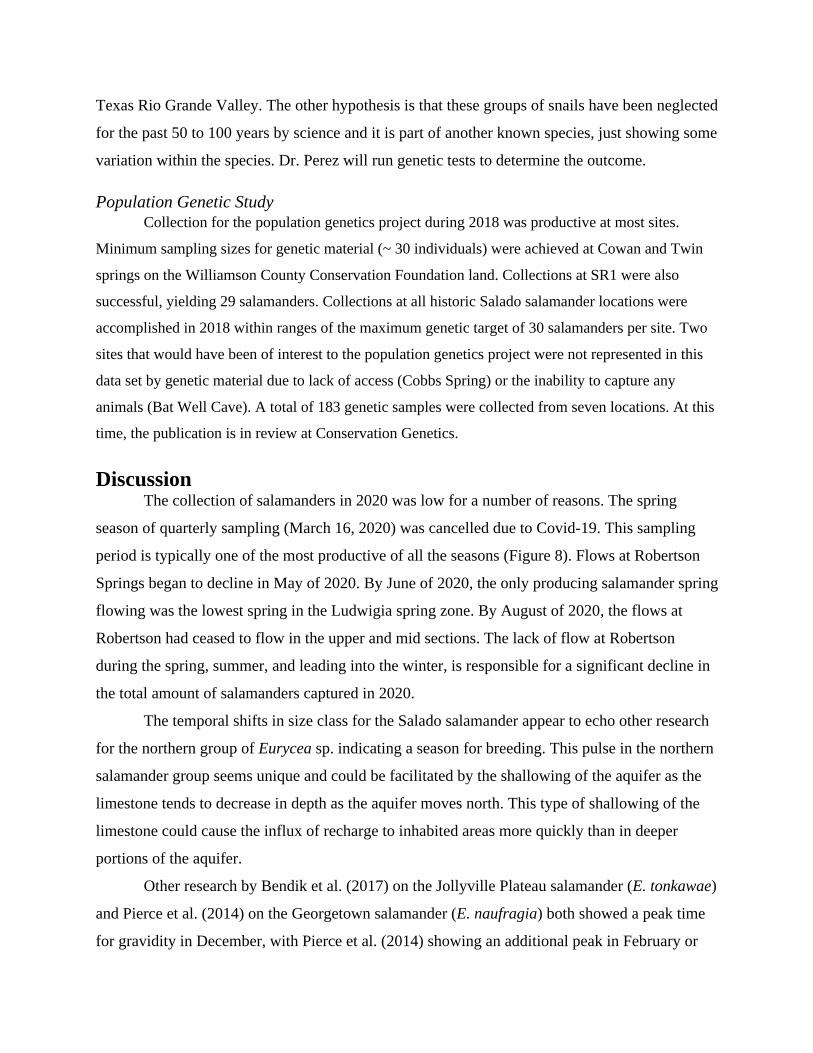
Texas Rio Grande Valley. The other hypothesis is that these groups of snails have been neglected
for the past 50 to 100 years by science and it is part of another known species, just showing some
variation within the species. Dr. Perez will run genetic tests to determine the outcome.
Population Genetic Study
Collection for the population genetics project during 2018 was productive at most sites.
Minimum sampling sizes for genetic material (~ 30 individuals) were achieved at Cowan and Twin
springs on the Williamson County Conservation Foundation land. Collections at SR1 were also
successful, yielding 29 salamanders. Collections at all historic Salado salamander locations were
accomplished in 2018 within ranges of the maximum genetic target of 30 salamanders per site. Two
sites that would have been of interest to the population genetics project were not represented in this
data set by genetic material due to lack of access (Cobbs Spring) or the inability to capture any
animals (Bat Well Cave). A total of 183 genetic samples were collected from seven locations. At this
time, the publication is in review at Conservation Genetics.
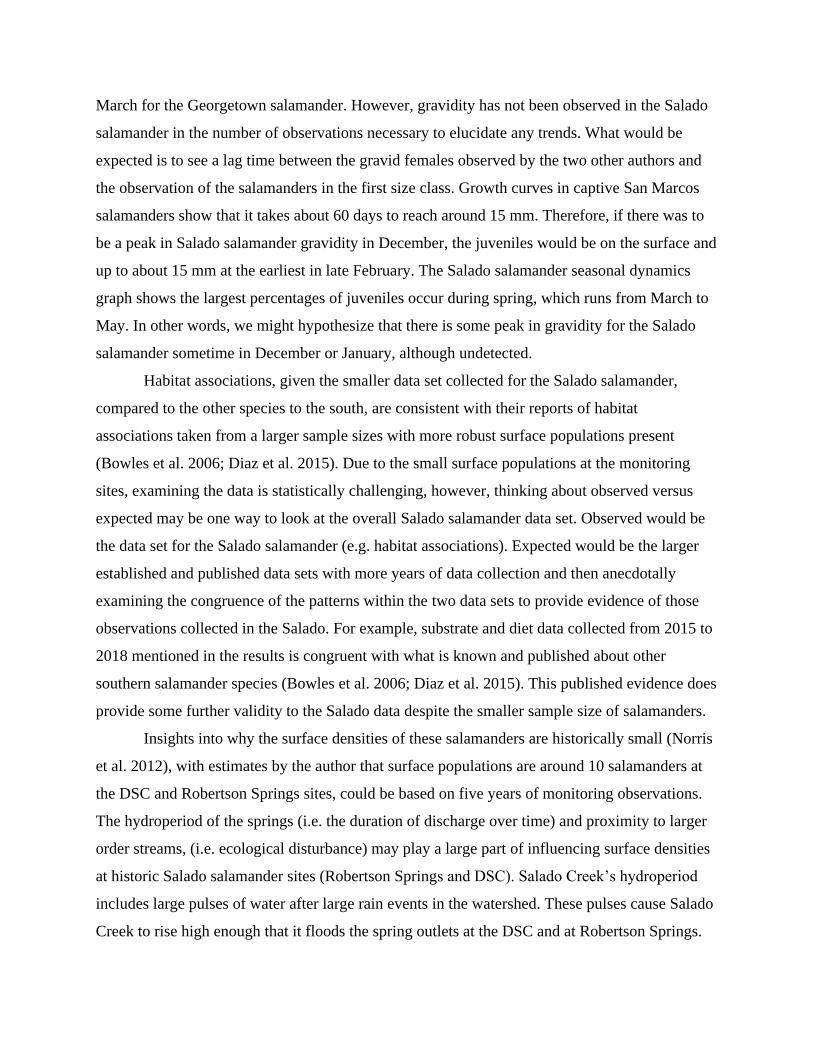
Discussion The collection of salamanders in 2020 was low for a number of reasons. The spring
season of quarterly sampling (March 16, 2020) was cancelled due to Covid-19. This sampling
period is typically one of the most productive of all the seasons (Figure 8). Flows at Robertson
Springs began to decline in May of 2020. By June of 2020, the only producing salamander spring
flowing was the lowest spring in the Ludwigia spring zone. By August of 2020, the flows at
Robertson had ceased to flow in the upper and mid sections. The lack of flow at Robertson
during the spring, summer, and leading into the winter, is responsible for a significant decline in
the total amount of salamanders captured in 2020.
The temporal shifts in size class for the Salado salamander appear to echo other research
for the northern group of Eurycea sp. indicating a season for breeding. This pulse in the northern
salamander group seems unique and could be facilitated by the shallowing of the aquifer as the
limestone tends to decrease in depth as the aquifer moves north. This type of shallowing of the
limestone could cause the influx of recharge to inhabited areas more quickly than in deeper
portions of the aquifer.
Other research by Bendik et al. (2017) on the Jollyville Plateau salamander (E. tonkawae)
and Pierce et al. (2014) on the Georgetown salamander (E. naufragia) both showed a peak time
for gravidity in December, with Pierce et al. (2014) showing an additional peak in February or
March for the Georgetown salamander. However, gravidity has not been observed in the Salado
salamander in the number of observations necessary to elucidate any trends. What would be
expected is to see a lag time between the gravid females observed by the two other authors and
the observation of the salamanders in the first size class. Growth curves in captive San Marcos
salamanders show that it takes about 60 days to reach around 15 mm. Therefore, if there was to
be a peak in Salado salamander gravidity in December, the juveniles would be on the surface and
up to about 15 mm at the earliest in late February. The Salado salamander seasonal dynamics
graph shows the largest percentages of juveniles occur during spring, which runs from March to
May. In other words, we might hypothesize that there is some peak in gravidity for the Salado
salamander sometime in December or January, although undetected.
Habitat associations, given the smaller data set collected for the Salado salamander,
compared to the other species to the south, are consistent with their reports of habitat
associations taken from a larger sample sizes with more robust surface populations present
(Bowles et al. 2006; Diaz et al. 2015). Due to the small surface populations at the monitoring
sites, examining the data is statistically challenging, however, thinking about observed versus
expected may be one way to look at the overall Salado salamander data set. Observed would be
the data set for the Salado salamander (e.g. habitat associations). Expected would be the larger
established and published data sets with more years of data collection and then anecdotally
examining the congruence of the patterns within the two data sets to provide evidence of those
observations collected in the Salado. For example, substrate and diet data collected from 2015 to
2018 mentioned in the results is congruent with what is known and published about other
southern salamander species (Bowles et al. 2006; Diaz et al. 2015). This published evidence does
provide some further validity to the Salado data despite the smaller sample size of salamanders.
Insights into why the surface densities of these salamanders are historically small (Norris
et al. 2012), with estimates by the author that surface populations are around 10 salamanders at
the DSC and Robertson Springs sites, could be based on five years of monitoring observations.
The hydroperiod of the springs (i.e. the duration of discharge over time) and proximity to larger
order streams, (i.e. ecological disturbance) may play a large part of influencing surface densities
at historic Salado salamander sites (Robertson Springs and DSC). Salado Creek’s hydroperiod
includes large pulses of water after large rain events in the watershed. These pulses cause Salado
Creek to rise high enough that it floods the spring outlets at the DSC and at Robertson Springs.
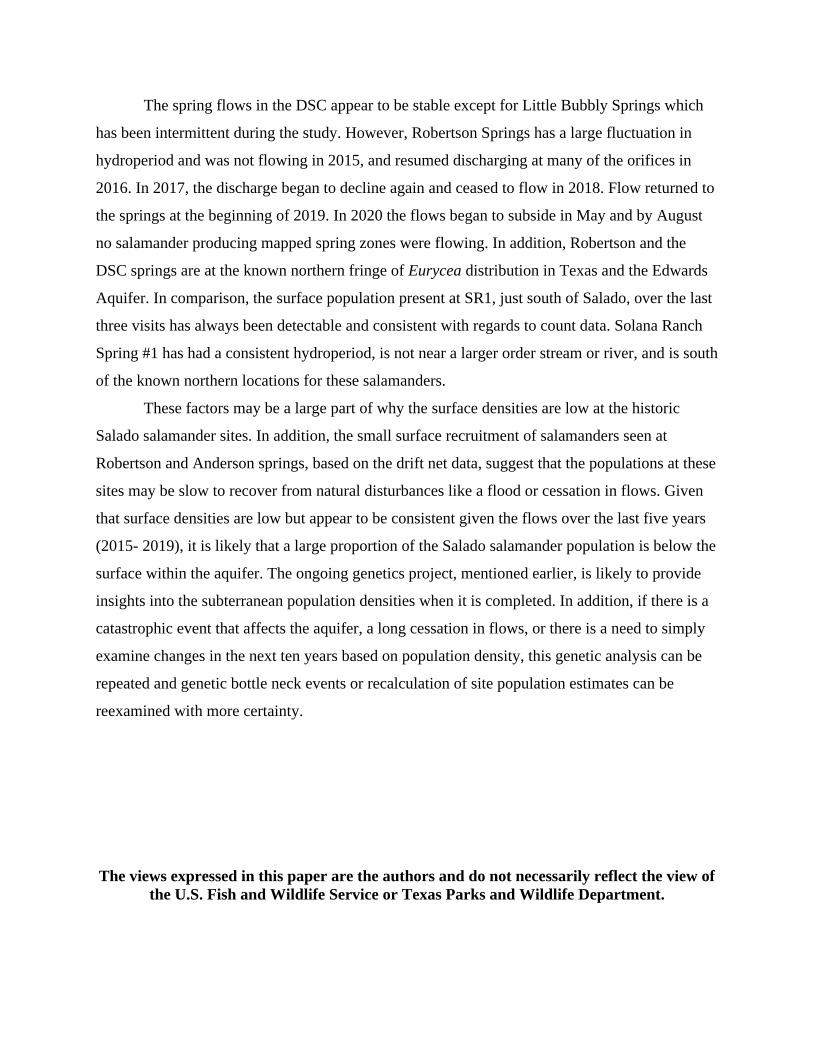
The spring flows in the DSC appear to be stable except for Little Bubbly Springs which
has been intermittent during the study. However, Robertson Springs has a large fluctuation in
hydroperiod and was not flowing in 2015, and resumed discharging at many of the orifices in
2016. In 2017, the discharge began to decline again and ceased to flow in 2018. Flow returned to
the springs at the beginning of 2019. In 2020 the flows began to subside in May and by August
no salamander producing mapped spring zones were flowing. In addition, Robertson and the
DSC springs are at the known northern fringe of Eurycea distribution in Texas and the Edwards
Aquifer. In comparison, the surface population present at SR1, just south of Salado, over the last
three visits has always been detectable and consistent with regards to count data. Solana Ranch
Spring #1 has had a consistent hydroperiod, is not near a larger order stream or river, and is south
of the known northern locations for these salamanders.
These factors may be a large part of why the surface densities are low at the historic
Salado salamander sites. In addition, the small surface recruitment of salamanders seen at
Robertson and Anderson springs, based on the drift net data, suggest that the populations at these
sites may be slow to recover from natural disturbances like a flood or cessation in flows. Given
that surface densities are low but appear to be consistent given the flows over the last five years
(2015- 2019), it is likely that a large proportion of the Salado salamander population is below the
surface within the aquifer. The ongoing genetics project, mentioned earlier, is likely to provide
insights into the subterranean population densities when it is completed. In addition, if there is a
catastrophic event that affects the aquifer, a long cessation in flows, or there is a need to simply
examine changes in the next ten years based on population density, this genetic analysis can be
repeated and genetic bottle neck events or recalculation of site population estimates can be
reexamined with more certainty.
The views expressed in this paper are the authors and do not necessarily reflect the view of
the U.S. Fish and Wildlife Service or Texas Parks and Wildlife Department.
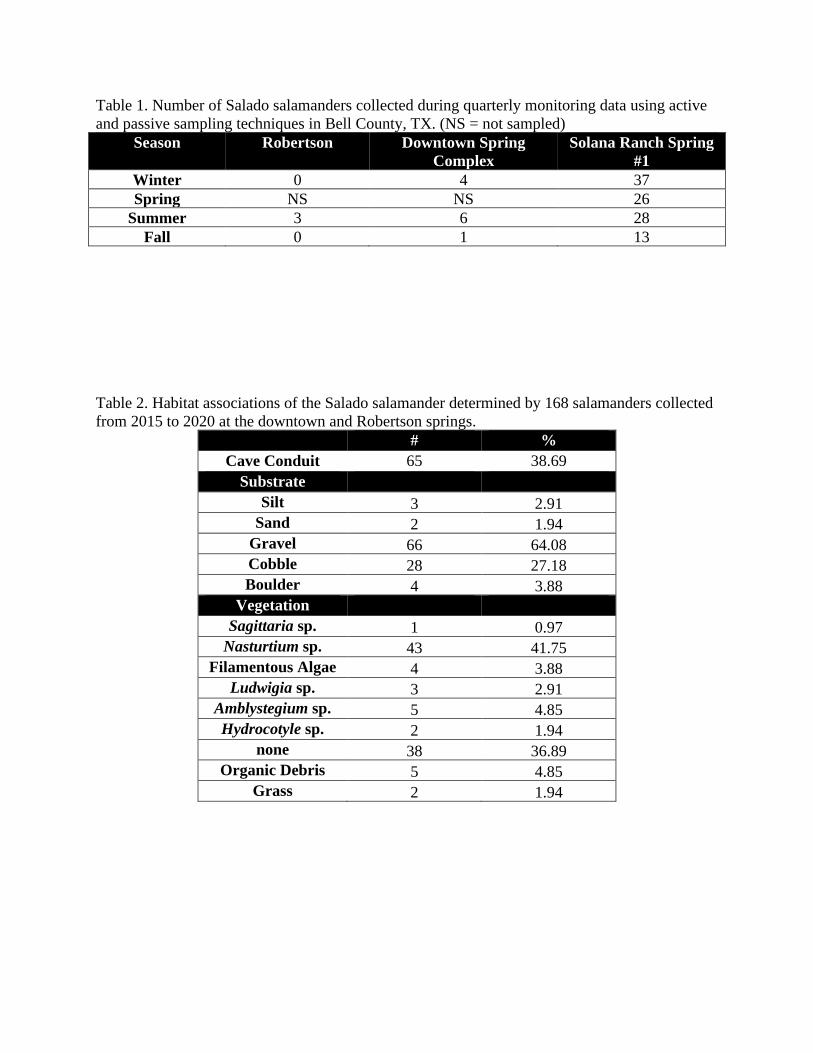
Table 1. Number of Salado salamanders collected during quarterly monitoring data using active
and passive sampling techniques in Bell County, TX. (NS = not sampled)
Season Robertson Downtown Spring
Complex
Solana Ranch Spring
#1
Winter 0 4 37
Spring NS NS 26
Summer 3 6 28
Fall 0 1 13
Table 2. Habitat associations of the Salado salamander determined by 168 salamanders collected
from 2015 to 2020 at the downtown and Robertson springs. # %
Cave Conduit 65 38.69
Substrate
Silt 3 2.91
Sand 2 1.94
Gravel 66 64.08
Cobble 28 27.18
Boulder 4 3.88
Vegetation
Sagittaria sp. 1 0.97
Nasturtium sp. 43 41.75
Filamentous Algae 4 3.88
Ludwigia sp. 3 2.91
Amblystegium sp. 5 4.85
Hydrocotyle sp. 2 1.94
none 38 36.89
Organic Debris 5 4.85
Grass 2 1.94
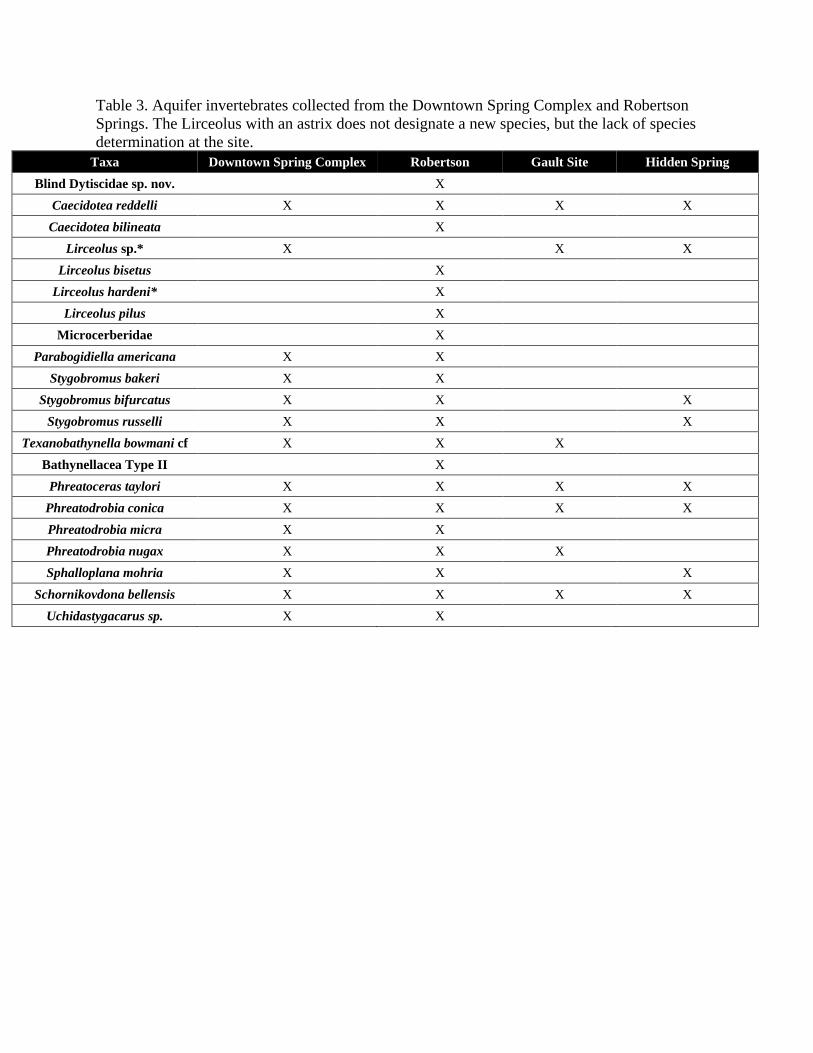
Table 3. Aquifer invertebrates collected from the Downtown Spring Complex and Robertson
Springs. The Lirceolus with an astrix does not designate a new species, but the lack of species
determination at the site.
Taxa Downtown Spring Complex Robertson Gault Site Hidden Spring
Blind Dytiscidae sp. nov. X
Caecidotea reddelli X X X X
Caecidotea bilineata X
Lirceolus sp.* X X X
Lirceolus bisetus X
Lirceolus hardeni* X
Lirceolus pilus X
Microcerberidae X
Parabogidiella americana X X
Stygobromus bakeri X X
Stygobromus bifurcatus X X X
Stygobromus russelli X X X
Texanobathynella bowmani cf X X X
Bathynellacea Type II X
Phreatoceras taylori X X X X
Phreatodrobia conica X X X X
Phreatodrobia micra X X
Phreatodrobia nugax X X X
Sphalloplana mohria X X X
Schornikovdona bellensis X X X X
Uchidastygacarus sp. X X
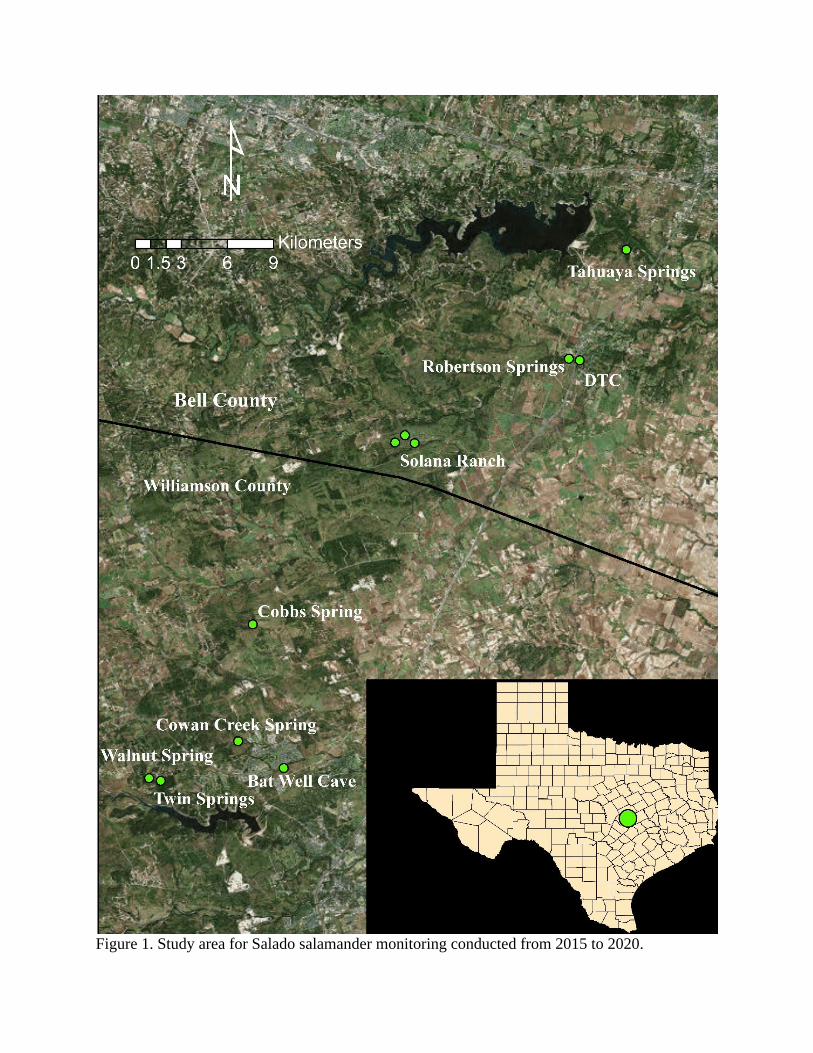
Figure 1. Study area for Salado salamander monitoring conducted from 2015 to 2020.
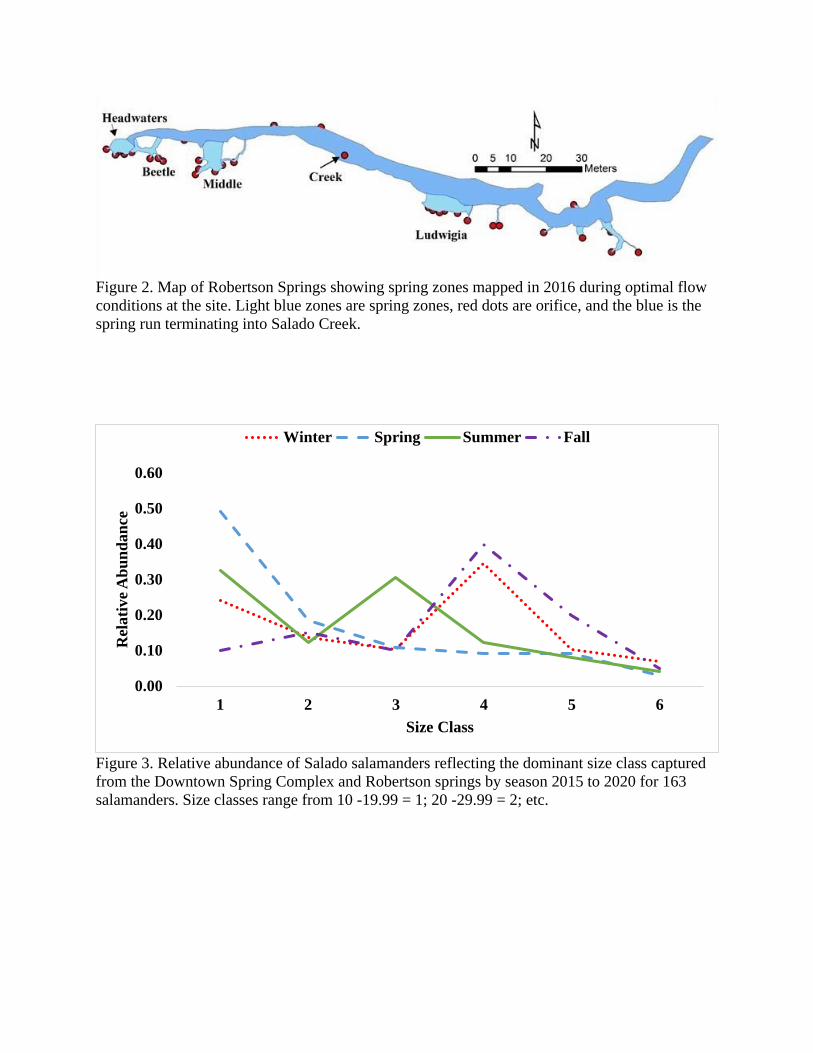
Figure 2. Map of Robertson Springs showing spring zones mapped in 2016 during optimal flow
conditions at the site. Light blue zones are spring zones, red dots are orifice, and the blue is the
spring run terminating into Salado Creek.
Figure 3. Relative abundance of Salado salamanders reflecting the dominant size class captured
from the Downtown Spring Complex and Robertson springs by season 2015 to 2020 for 163
salamanders. Size classes range from 10 -19.99 = 1; 20 -29.99 = 2; etc.
0.00
0.10
0.20
0.30
0.40
0.50
0.60
1 2 3 4 5 6
Rel
ati
ve
Ab
un
da
nce
Size Class
Winter Spring Summer Fall

Figure 4. Pooled collections by month of 163 Salado salamanders collected from 2015 to 2020.
0
5
10
15
20
25
30
Sa
lam
an
der
det
ecte
dSalamanders per Month
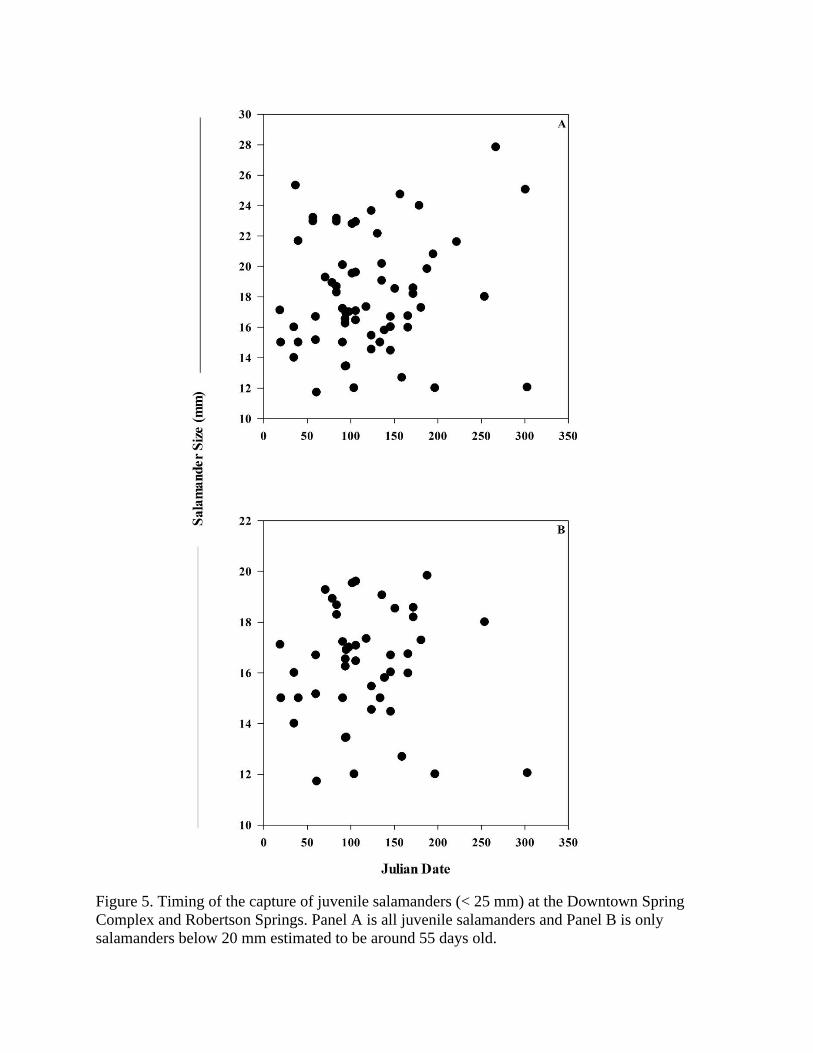
Figure 5. Timing of the capture of juvenile salamanders (< 25 mm) at the Downtown Spring
Complex and Robertson Springs. Panel A is all juvenile salamanders and Panel B is only
salamanders below 20 mm estimated to be around 55 days old.
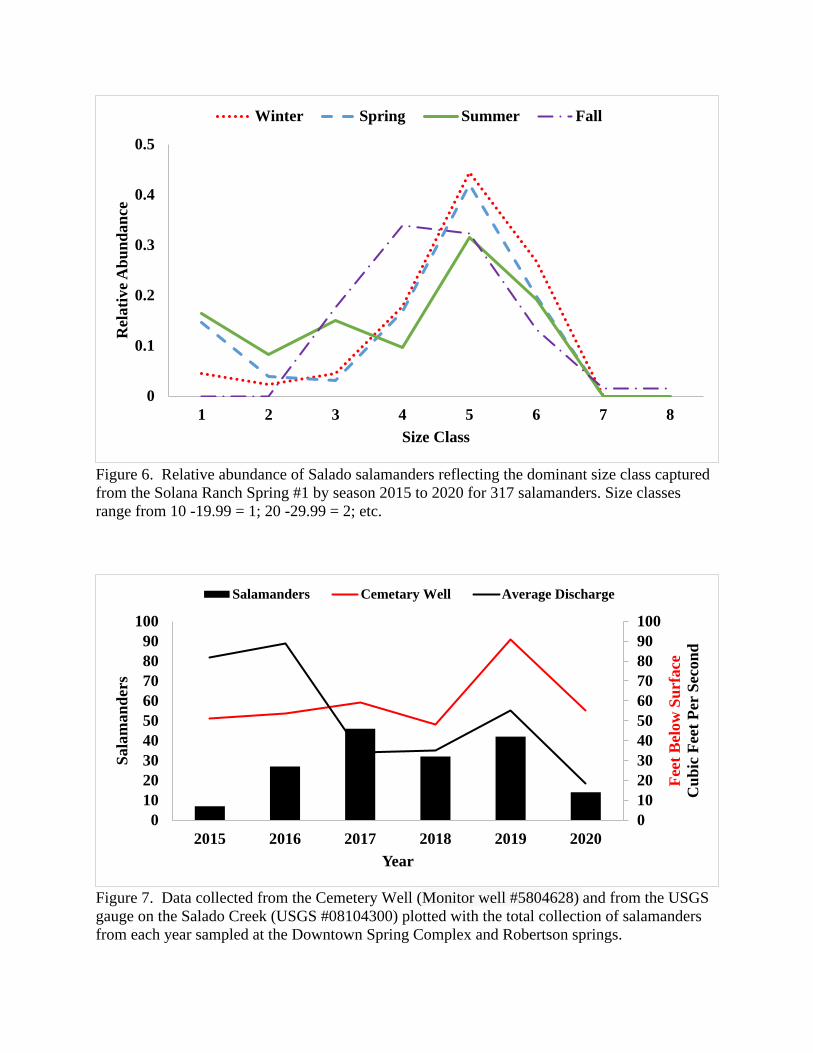
Figure 6. Relative abundance of Salado salamanders reflecting the dominant size class captured
from the Solana Ranch Spring #1 by season 2015 to 2020 for 317 salamanders. Size classes
range from 10 -19.99 = 1; 20 -29.99 = 2; etc.
Figure 7. Data collected from the Cemetery Well (Monitor well #5804628) and from the USGS
gauge on the Salado Creek (USGS #08104300) plotted with the total collection of salamanders
from each year sampled at the Downtown Spring Complex and Robertson springs.
0
0.1
0.2
0.3
0.4
0.5
1 2 3 4 5 6 7 8
Rel
ati
ve
Ab
un
da
nce
Size Class
Winter Spring Summer Fall
0
10
20
30
40
50
60
70
80
90
100
0
10
20
30
40
50
60
70
80
90
100
2015 2016 2017 2018 2019 2020
Fee
t B
elow
Su
rface
Cu
bic
Fee
t P
er S
eco
nd
Sala
man
der
s
Year
Salamanders Cemetary Well Average Discharge
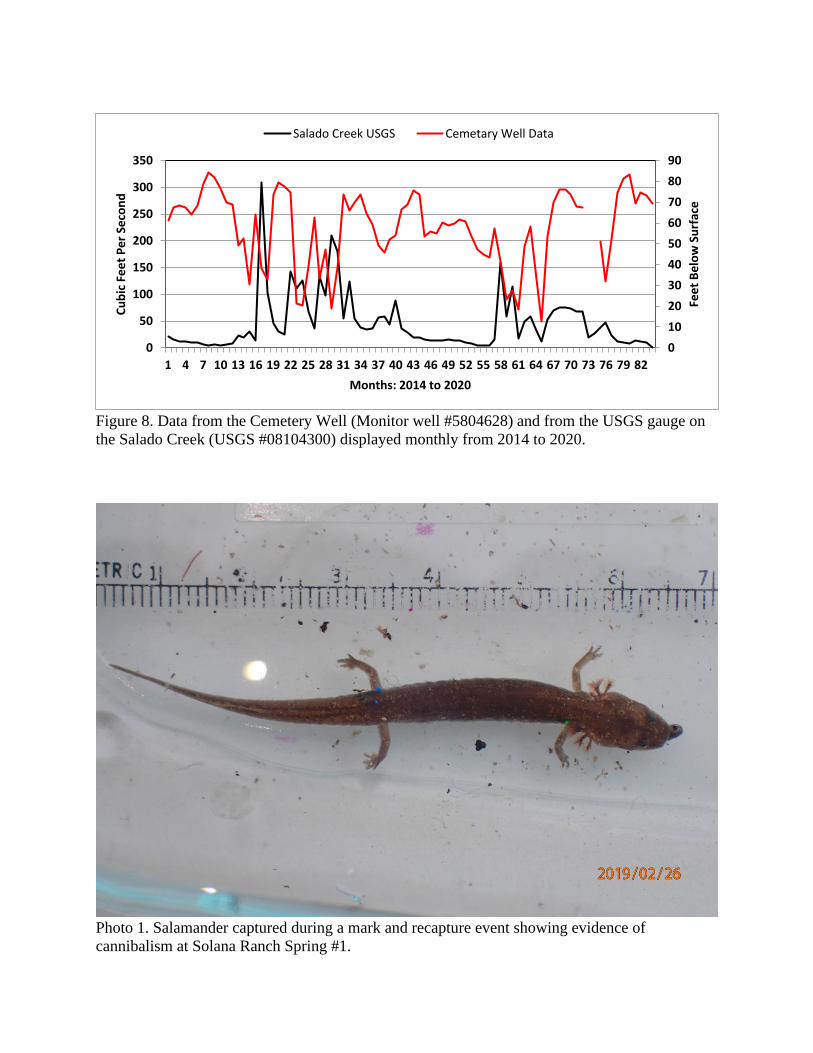
Figure 8. Data from the Cemetery Well (Monitor well #5804628) and from the USGS gauge on
the Salado Creek (USGS #08104300) displayed monthly from 2014 to 2020.
Photo 1. Salamander captured during a mark and recapture event showing evidence of
cannibalism at Solana Ranch Spring #1.
0
10
20
30
40
50
60
70
80
90
0
50
100
150
200
250
300
350
1 4 7 10 13 16 19 22 25 28 31 34 37 40 43 46 49 52 55 58 61 64 67 70 73 76 79 82
Fee
t B
elo
w S
urf
ace
Cu
bic
Fe
et
Pe
r Se
con
d
Months: 2014 to 2020
Salado Creek USGS Cemetary Well Data
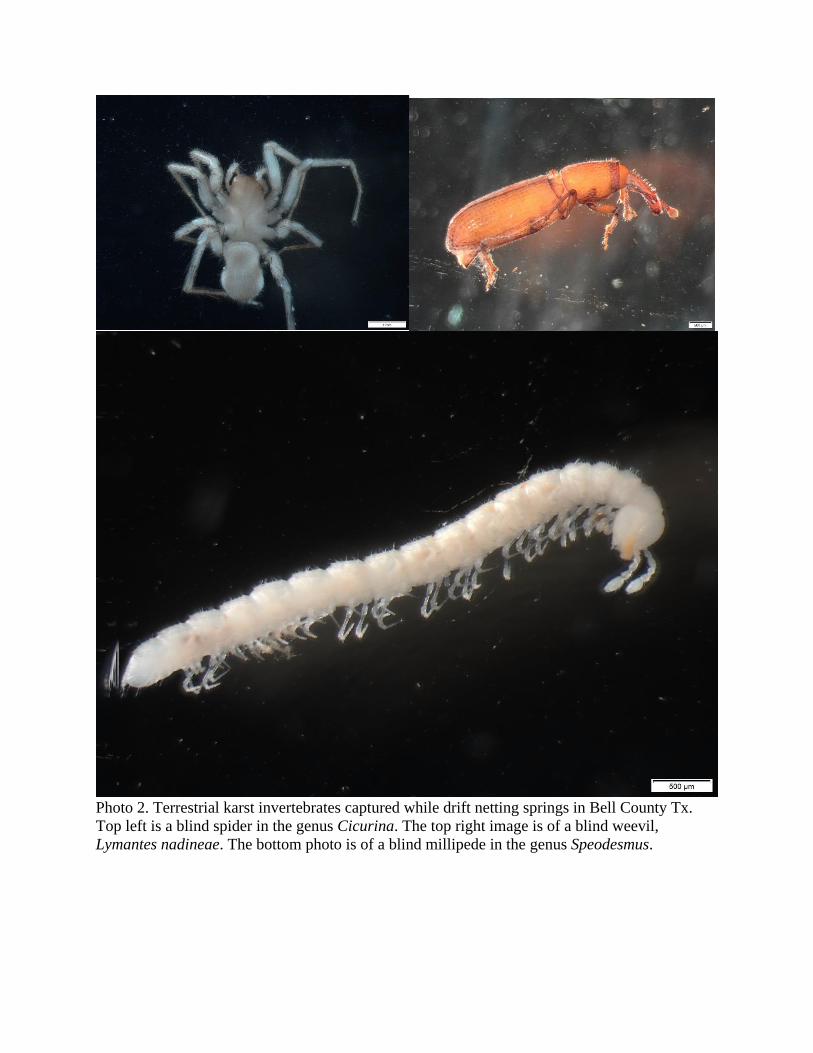
Photo 2. Terrestrial karst invertebrates captured while drift netting springs in Bell County Tx.
Top left is a blind spider in the genus Cicurina. The top right image is of a blind weevil,
Lymantes nadineae. The bottom photo is of a blind millipede in the genus Speodesmus.
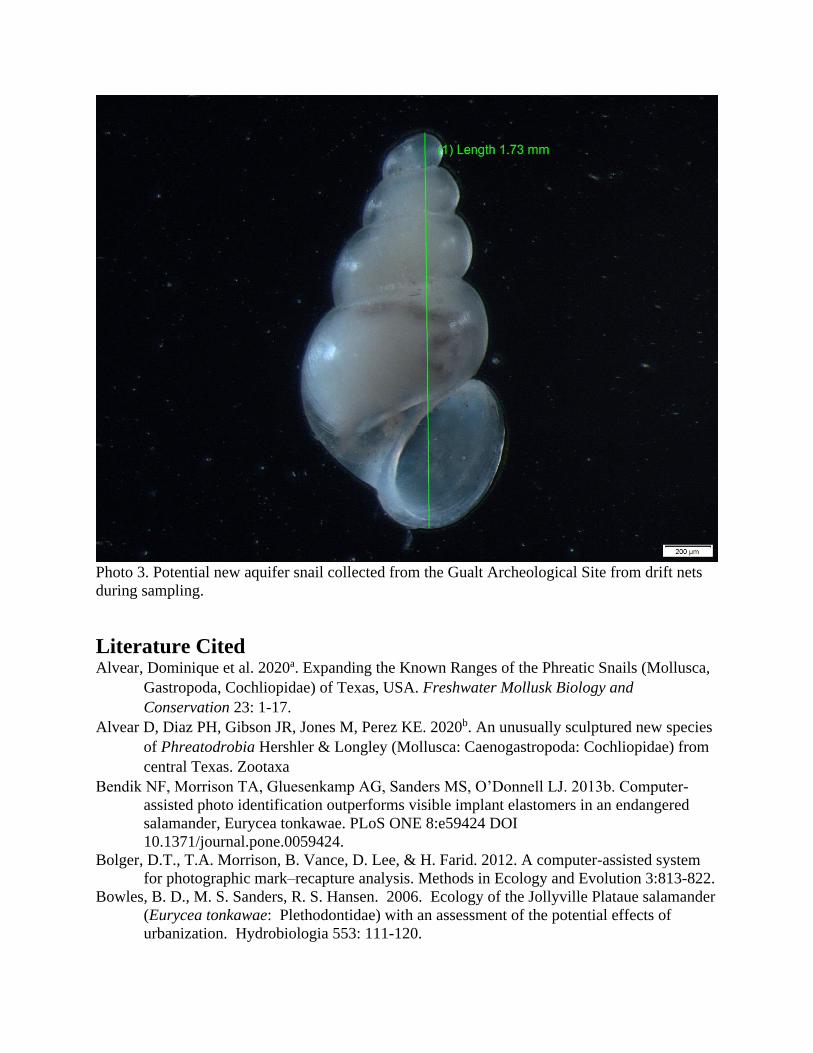
Photo 3. Potential new aquifer snail collected from the Gualt Archeological Site from drift nets
during sampling.
Literature Cited Alvear, Dominique et al. 2020a. Expanding the Known Ranges of the Phreatic Snails (Mollusca,
Gastropoda, Cochliopidae) of Texas, USA. Freshwater Mollusk Biology and
Conservation 23: 1-17.
Alvear D, Diaz PH, Gibson JR, Jones M, Perez KE. 2020b. An unusually sculptured new species
of Phreatodrobia Hershler & Longley (Mollusca: Caenogastropoda: Cochliopidae) from
central Texas. Zootaxa
Bendik NF, Morrison TA, Gluesenkamp AG, Sanders MS, O’Donnell LJ. 2013b. Computer-
assisted photo identification outperforms visible implant elastomers in an endangered
salamander, Eurycea tonkawae. PLoS ONE 8:e59424 DOI
10.1371/journal.pone.0059424.
Bolger, D.T., T.A. Morrison, B. Vance, D. Lee, & H. Farid. 2012. A computer-assisted system
for photographic mark–recapture analysis. Methods in Ecology and Evolution 3:813-822.
Bowles, B. D., M. S. Sanders, R. S. Hansen. 2006. Ecology of the Jollyville Plataue salamander
(Eurycea tonkawae: Plethodontidae) with an assessment of the potential effects of
urbanization. Hydrobiologia 553: 111-120.
Chippindale, P. T., A. H. Price, J. J. Wiens, & D. M. Hillis. 2000. Phylogenetic relationships
and systematic revision of central Texas hemidactyliine plethodontid salamanders.
Heretological Monographs 14:1-80.
Chippindale, P. T., R. M. Bonett, A. S. Baldwin, & J. J. Wiens. 2004. Phylogenetic evidence for
a major reversal of life-history evolution in plethodontid salamanders. Evolution
58:2809–2822.
Diaz, P., M. Montagne, J.R. Gibson. 2016. Salado Salamander Monitoring Final Report 2016.
Texas Fish
and Wildlife Conservation Office. U.S. Fish and Wildlife Service, San Marcos, Texas.
Diaz PH, Alvear D, Perez KE. 2020. Mesohabitat associations of the Devil Tryonia (Tryonia
diaboli (Gastropoda: Truncatelloidea: Cochliopidae). Freshwater Mollusk Biology and
Conservation 23: 18-24.
Forstner, M. 2012. An evaluation of the existing scientific evidence for the currently proposed
hyperdiversity of salamanders (Eurycea sp.) in central Texas. Unpublished report
prepared for the Texas Salamander Coalition. June, 2012, 28 pp.
Johnson, W. P., M. J. Butler, J. I. Sanchez, and B. E. Wadlington. 2019. Development of
monitoring techniques for endangered spring endemic invertebrates: An assessment of
abundance. Natural Areas Journal 39:150–168.
Pyron, R. A., Wiens J. J. 2011. A large-scale phylogeny of Amphibia including over 2800
species, and a revised classification of extant frogs, salamanders, and caecilians.
Molecular Phylogenetics and Evolution 61(2): 543-
583. http://dx.doi.org/10.1016/j.ympev.2011.06.012
Schneider, C.A., Rasband, W.S., Eliceiri, K.W. 2012. "NIH Image to ImageJ: 25 years of image
analysis". Nature Methods 9, 671-675.
Schwartz, B., C. C. Nice, W. Coleman, W.H. Nowlin. 2020. Status assessment and ecological
characterization of the Texas Troglobitic Water slater (Lirceolus smithii). Texas Parks
and Wildlife Department Report. 26pp.