Embed Size (px)
Citation preview

Sartorius Group2018 Annual Report

1) Underlying = excluding extraordinary items2) After non-controlling interest, adjusted for extraordinary items and non-cash amortization, as well as based on the normalized financial
result, including the corresponding tax effects for each of these items3) Restated4) 2014 to 2015 adjusted for stock split; rounded values5) Amounts suggested by the Supervisory Board and the Executive Board of Sartorius AG6) Including discontinued operation
All figures are given in millions of ¤ according 2018 2017 2016 2015 2014 to the IFRS, unless otherwise specified
Order intake, sales revenue and earningsOrder intake 1,662.5 1,501.4 1,334.7 1,172.7 929.2
Sales revenue 1,566.0 1,404.6 1,300.3 1,114.8 891.2
Underlying EBITDA1) 405.0 353.2 325.4 263.2 186.8
Underlying EBITDA1) as a % of sales revenue 25.9 25.1 25.0 23.6 21.0
Relevant net profit for continuing operations2) 175.6 144.0 132.6 107.4 66.1
Relevant net profit2) 175.6 144.0 132.6 107.4 73.7
Research and development costs 78.2 68.8 59.4 52.5 43.63)
Financial data per share4)
Earnings per share, continuing operations2)
per ordinary share (in ¤) 2.56 2.10 1.93 1.57 0.96
per preference share (in ¤) 2.57 2.11 1.94 1.58 0.97
Earnings per share2)
per ordinary share (in ¤) 2.56 2.10 1.93 1.59 1.07
per preference share (in ¤) 2.57 2.11 1.94 1.60 1.08
Dividends
per ordinary share (in ¤) 0.615) 0.50 0.45 0.37 0.26
per preference share (in ¤) 0.625) 0.51 0.46 0.38 0.27
Balance sheetBalance sheet total 2,526.9 2,297.7 1,753.0 1,437.2 1,273.0
Equity 973.4 806.6 736.8 644.8 497.7
Equity ratio (in %) 38.5 35.1 42.0 44.9 39.1
FinancialsCapital expenditures 237.8 209.4 152.1 113.1 80.9
Capital expenditures as a % of sales 15.2 14.9 11.7 10.1 9.1
Depreciation and amortization 113.4 98.3 75.7 58.9 52.7
Net cash from operating activities 244.5 206.5 170.4 124.4 129.7
Net debt 959.5 895.5 485.9 344.0 335.66)
Gearing (underlying) 2.4 2.5 1.5 1.3 1.76)
Total number of employees as of December 31 8,125 7,501 6,911 6,185 5,611
Key Figures
Order Intake and Sales Revenue ¤ in millions 929.2 1,172.7 1,334.7 1,501.4 1,662.5 891.2 1,114.8 1,300.3 1,404.6 1,566.0
1,800
1,500
1,200
900
600
2014 2015 2016 2017 2018
Order intake Sales revenue
Underlying EBITDA and Margin1) 186.8 263.2 325.4 353.2 405.0 21.0 23.6 25.0 25.1 25.9
500 30
375 27
250 24
125 21
0 18
2014 2015 2016 2017 2018
Underlying EBITDA in millions of ¤ Underlying EBITDA margin in %

Mission & Vision
Mission
We empower scientists and engineers to simplify and accelerate progress in life science and bioprocessing, enabling the development of new and better therapies and more affordable medicine.
Vision
As pioneers, we are a magnet and a dynamic platform for the leading experts in our field. We bring creative minds together for a common goal: technological breakthroughs that lead to better health for more people.

An Overview of Our DivisionsAs a leading international partner of biopharmaceutical research and the industry, Sartorius supports its customers in the development and manufacture of biotech medications and vaccines. Our goal is to make complex and expensive development of biopharmaceuticals and their production safer and more efficient. We cover the entire value-added chain of the biophar-maceutical industry and help with our products and services to ensure that novel therapies reach the market faster and are accessible to more people worldwide. Sartorius employs over 8,000 people across the globe and has Group companies in more than 30 countries.
Bioprocess Solutions
In the Bioprocess Solutions Division, Sartorius offers a broad product portfolio that covers all steps in the pro-duction of a biopharmaceutical. The company has held leading market positions for years in its core technologies, such as filtration, fermentation, cell cultivation and single-use bags and containers.
Key Figures
1) In constant currencies
¤ in millions 2018 2017 Δ Δ in %
Sales revenue 1,143.1 1,010.3 14.8 1)
Order intake 1,233.7 1,091.3 14.9 1)
Underlying EBITDA 326.9 282.4 15.7
– As a % of sales 28.6 28.0
Employees as of Dec. 31 5,498 4,980 10.4

Lab Products & Services
The Lab Products & Services Division offers laboratories in the pharmaceutical and biopharmaceutical industries as well as at academic research institutes innovative solu-tions for bioanalytics, in addition to premium laboratory products, consumables and services. Sartorius is among the market leaders in laboratory balances, pipettes and lab consumables.
Key Figures
1) In constant currencies
¤ in millions 2018 2017 Δ Δ in %
Sales revenue 423.0 394.2 9.1 1)
Order intake 428.8 410.1 6.3 1)
Underlying EBITDA 78.1 70.8 10.4
– As a % of sales 18.5 18.0
Employees as of Dec. 31 2,627 2,521 4.2

This annual report contains statements concerning the Sartorius Group’s future performance. These statements are based on assumptions and estimates. Although we are convinced that these forward-looking statements are realistic, we cannot guarantee that they will actually apply. This is because our assumptions harbor risks and uncertainties that could lead to actual results diverging substantially from the expected ones. It is not planned to update our forward-looking statements.
This is a translation of the original German-language annual report. Sartorius shall not assume any liability for the correctness of this translation. The original German annual report is the legally binding version. Furthermore, Sartorius reserves the right not to be responsible for the topicality, correctness, completeness or quality of the information provided. Liability claims regarding damage caused by the use of any informa-tion provided, including any kind of information which is incomplete or incorrect, will therefore be rejected.
Throughout the Annual Report, differences may be apparent as a result of rounding during addition.
01 To Our Shareholders
8 Report of the Executive Board
10 Executive Board
11 Group Executive Committee
12 Report of the Supervisory Board
16 Sartorius Shares
Contents
02 Combined Group Management Report
22 Structure and Management of the Group
24 Business Model, Strategy and Goals
28 Research and Development
29 Macroeconomic Environment and Conditions in the Sectors
33 Group Business Development
39 Net Worth and Financial Position
42 Business Development of Bioprocess Solutions
47 Business Development of Lab Products & Services
50 Assessment of Economic Position
51 Annual Financial Statements of Sartorius AG
54 Opportunity and Risk Report
62 Forecast Report
66 Report on Material Events
67 Description of the Key Features of the Internal Control Management System
69 Explanatory Report of the Executive Board
71 Report and Declaration on Corporate Governance
76 Remuneration Report
Non-Financial Declaration
86 Our Approach to Sustainability
89 Shaping the Future
96 A Reliable Partner
102 GRI Content Index
106 Report of the Independent Auditor
03 Consolidated Financial Statements and Notes
110 Statement of Profit or Loss | Other Comprehensive Income
112 Statement of Financial Position
113 Statement of Cash Flows
114 Statement of Changes in Equity
116 Notes to the Financial Statements
128 Notes to the Statement of Profit or Loss
134 Notes to the Statement of Financial Position
162 Other Disclosures
164 Declaration of the Executive Board
165 Independent Auditors’ Report
170 Executive Board and Supervisory Board
04 Supplementary Information
175 Glossary
178 Index
190 A Local Presence Worldwide
193 Financial Schedule

[Dummy]
Leerseite

To Our Shareholders
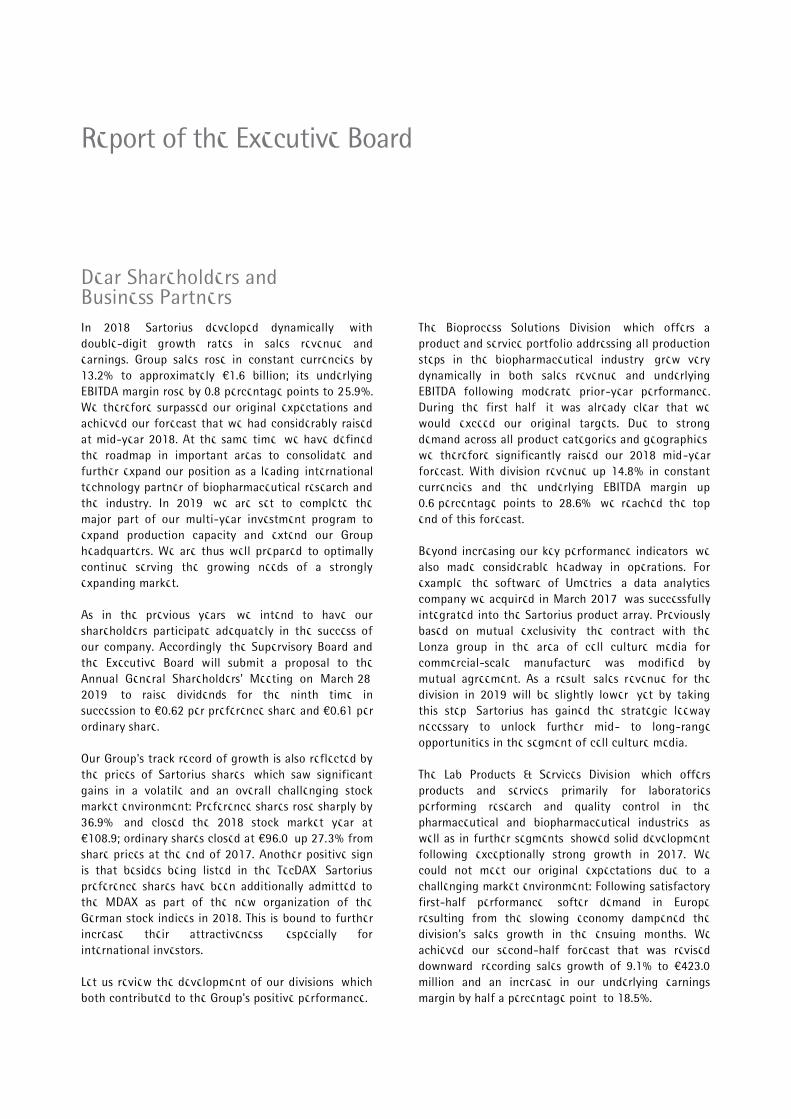
In 2018, Sartorius developed dynamically, with double-digit growth rates in sales revenue and earnings. Group sales rose in constant currencies by 13.2% to approximately €1.6 billion; its underlying EBITDA margin rose by 0.8 percentage points to 25.9%. We therefore surpassed our original expectations and achieved our forecast that we had considerably raised at mid-year 2018. At the same time, we have defined the roadmap in important areas to consolidate and further expand our position as a leading international technology partner of biopharmaceutical research and the industry. In 2019, we are set to complete the major part of our multi-year investment program to expand production capacity and extend our Group headquarters. We are thus well prepared to optimally continue serving the growing needs of a strongly expanding market.
As in the previous years, we intend to have our shareholders participate adequately in the success of our company. Accordingly, the Supervisory Board and the Executive Board will submit a proposal to the Annual General Shareholders' Meeting on March 28, 2019, to raise dividends for the ninth time in succession to €0.62 per preference share and €0.61 per ordinary share.
Our Group's track record of growth is also reflected by the prices of Sartorius shares, which saw significant gains in a volatile and an overall challenging stock market environment: Preference shares rose sharply by 36.9%, and closed the 2018 stock market year at €108.9; ordinary shares closed at €96.0, up 27.3% from share prices at the end of 2017. Another positive sign is that besides being listed in the TecDAX, Sartorius preference shares have been additionally admitted to the MDAX as part of the new organization of the German stock indices in 2018. This is bound to further increase their attractiveness, especially for international investors.
Let us review the development of our divisions, which both contributed to the Group's positive performance.
The Bioprocess Solutions Division, which offers a product and service portfolio addressing all production steps in the biopharmaceutical industry, grew very dynamically in both sales revenue and underlying EBITDA following moderate prior-year performance. During the first half, it was already clear that we would exceed our original targets. Due to strong demand across all product categories and geographies, we therefore significantly raised our 2018 mid-year forecast. With division revenue up 14.8% in constant currencies and the underlying EBITDA margin up 0.6 percentage points to 28.6%, we reached the top end of this forecast.
Beyond increasing our key performance indicators, we also made considerable headway in operations. For example, the software of Umetrics, a data analytics company we acquired in March 2017, was successfully integrated into the Sartorius product array. Previously based on mutual exclusivity, the contract with the Lonza group in the area of cell culture media for commercial-scale manufacture was modified by mutual agreement. As a result, sales revenue for the division in 2019 will be slightly lower, yet by taking this step, Sartorius has gained the strategic leeway necessary to unlock further mid- to long-range opportunities in the segment of cell culture media.
The Lab Products & Services Division, which offers products and services primarily for laboratories performing research and quality control in the pharmaceutical and biopharmaceutical industries, as well as in further segments, showed solid development following exceptionally strong growth in 2017. We could not meet our original expectations due to a challenging market environment: Following satisfactory first-half performance, softer demand in Europe resulting from the slowing economy dampened the division's sales growth in the ensuing months. We achieved our second-half forecast that was revised downward, recording sales growth of 9.1% to €423.0 million and an increase in our underlying earnings margin by half a percentage point, to 18.5%.
Report of the Executive Board
Dear Shareholders and Business Partners,

Due to the acquisitions of the bioanalytics companies IntelliCyt and Essen BioScience in 2016 and 2017, we today have a highly attractive and innovative cell analytics portfolio. As a result, we have significantly strengthened the position of our Lab Products & Services Division among biopharma customers and research institutes in the life sciences segment: With the growing differentiation of the market for biologics, development of new active pharmaceutical ingredients is coming under increasing time and cost pressure. Efficiency will therefore be a key competitive advantage. Our innovative solutions support our customers in bringing new active compounds out on the market. We are convinced that the significance of bioanalytics will increase, and will continue to systematically promote market penetration of our technologies on the lab market.
Which targets have we set for the future?
Against the backdrop of global trends that we estimate will lead to a steadily increasing demand for biopharmaceuticals, all signs point to growth for Sartorius. In addition to our 2020 targets, which remain unchanged, we therefore set new, ambitious medium-term guidance for sales and profitability in February of the reporting year: We aim to double our sales revenue to €4 billion and increase our underlying EBITDA margin to about 28% in the period of 2020 to 2025. Two-thirds of this growth are projected to be achieved organically, and the remaining one-third is expected to be generated by acquisitions. This growth is likely to be accompanied by the creation of a considerable number of jobs; therefore, we assume that we will nearly double the number of our employees from currently around 8,000 to some 15,000.
For the fiscal year currently in progress, we expect further profitable growth. Consolidated sales revenue is projected to grow by about 7% to 11% in constant currencies, with our forecast already allowing for the change in the sales alliance with the Lonza group. Without this change, sales growth would probably be around 2 percentage points higher. Regarding our underlying EBITDA margin, we anticipate that it will
increase by about one percentage point to slightly more than 27.0%, with the operating gain projected to be about half a percentage point and the remaining increase expected to result from a change in the accounting rules required to be applied. Our ratio of capital expenditures to sales revenue is forecasted to be around 12%, down from the 2018 figure of roughly 15%.
At Sartorius, the team is what makes all the difference. The success of our company would be inconceivable without the expertise of our approximately 8,000 staff members worldwide, their 100% customer focus and, where necessary, their fighting spirit. On behalf of the entire Executive Board, I would like to cordially thank them for their willingness not to settle for the status quo and thus for their ceaseless efforts in contributing to the ongoing further development of our products and services as well as of our business processes.
My thanks also go out to you, our esteemed shareholders, customers and business partners . Over the past year again, you placed your trust in us and thus promoted the positive development of Sartorius in many different ways.
Yours sincerely,
Dr. Joachim Kreuzburg CEO and Executive Board Chairman

Rainer LehmannMember of the Board
Finance, Information Technology, Business Processes
Board member since 2017
Reinhard VogtMember of the Board until December 31, 2018
Marketing, Sales & Services
René FáberMember of the Board since January 1, 2019
Leiter Sparte Bioprocess Solutions
Gerry MackayMember of the Board since January 1, 2019
Leiter Sparte Lab Products & Services
Joachim KreuzburgCEO
Group Strategy, Human Resources, Corporate Research, Legal & Compliance, Communications
Board member since 2003
Executive BoardThe Group’s central management entity is the Executive Board of Sartorius AG. It defines the strategy, is responsible for the operational management of the Group and controls the distribution of resources within the organization.

Group Executive Committee (until December 31, 2018)
In the reporting year, the Group Executive Committee (GEC) supported the Executive Board in coordinating and mana-ging global business activities. The GEC consisted of the members of the Sartorius AG Executive Board and additional top managers who were appointed by the Executive Board and had cross-divisional responsibility. Upon the appointment of two executive division heads to the Executive Board on January 1, 2019, the GEC was disbanded.
Members of the GEC and responsibilities:
Joachim KreuzburgGroup Strategy, Human Resources, Legal & Compliance, Communications
Rainer LehmannFinance, Information Technology, Business Processes
Oscar-Werner ReifResearch & Development
Volker NiebelProduction, Procurement, Business Operations
Reinhard VogtMarketing, Sales & Services der Sparte Bioprocess Solutions
Gerry MackayMarketing, Sales & Services der Sparte Lab Products & Services

We look back yet again upon a successful fiscal year of very high growth for Sartorius. The company performed excellently in both divisions and across all geographies, and fully attained its financial targets raised at mid-year. To support our strong organic expansion, we invested considerably in additional production capacity and the extension of our IT infrastructure at several sites.
In fiscal 2018, the Supervisory Board intensively dealt with the situation and prospects of the company. We advised the Executive Board concerning corporate management and performed the tasks assigned by German corporate law and the company’s Articles of Association. The Executive Board kept us informed by providing regular, prompt and comprehensive reports, both written and verbal, about all relevant corporate planning and strategic development issues, the progress of business in the divisions, the situation of the Group, including its risk situation, risk management and internal control systems, as well as about compliance. All of the company's significant transactions were discussed in depth by the respective committees responsible, as well as by the full Supervisory Board, on the basis of the reports provided by the Executive Board. Following thorough review of the Executive Board's reports and proposed resolutions, we voted on these to the extent that our vote was required.
Cooperation between the Supervisory Board and the Executive Board was always characterized by openness, constructive dialogue and trust.
Focus of the Supervisory Board’s Conferences
In the reporting year, the Supervisory Board convened at four ordinary meetings, which the Executive Board also attended, provided these conferences did not concern the latter board's matters. We regularly conferred on the development of sales revenue, earnings and employment for the Group; the financial situation of the company and of its affiliates; and on strategic projects.
At our meeting on February 20, 2018, we fully reviewed the annual and consolidated financial statements for fiscal 2017 and endorsed them based on the reports given by the Audit Committee and the independent auditors who were present during this item of the agenda. Following the report given by the independent auditors and a discussion, we moreover endorsed our non-financial Group statement. Beyond this, we conferred upon and approved the agenda, along with the proposed resolutions, for the 2018 Annual Shareholders' Meeting and the proposal for appropriation of the annual profit. Furthermore, we decided upon the remuneration of the Executive Board members for 2018. The Executive Board additionally gave us an oral report on the progress of implementing the various digitalization initiatives. Further topics on the agenda involved announcement of the newly defined midterm targets for up to 2025, as well as the planned further development of the internal Group organization.
In the meeting on April 5, 2018, we dealt thoroughly with various strategic projects. The Executive Board also provided an overview on IT and data security in the company and reported on the progress of various investment activities.
At the Supervisory Board meeting on August 30, 2018, topics involving innovation management were on the agenda. The Executive Board described a number of current projects and initiatives designed to connect Sartorius to an even greater degree with the community driving innovations outside the company. Beyond this, the Executive Board reported on several alternatives to further develop business with cell culture media.
Topics on corporate governance and compliance were dealt with at the meeting on December 6, 2018. After our consultations, we decided upon the wording of the Declaration of Compliance in accordance with the German Corporate Governance Code (GCGC), with this Declaration confirming that Sartorius complies in full with the recommendations of the current Code. In addition, the Supervisory Board Chairman reported on
Report of the Supervisory Board
Dear Shareholders and Business Partners,

the suggestions presented for consultation by the government commission for reforming GCGC. The Supervisory Board also examined the results of the efficiency review of its work and approved the budget submitted by the Executive Board for 2019.
A further focus of the conference was on the appointment of two new members to the Executive Board, as well as on the wording of the particular terms and conditions of the Executive Board contracts, which had been prepared in the Executive Task Committee. Discussions included the results of the comparison of Executive Board remuneration, which the Supervisory Board had assigned to an independent compensation consultant in the reporting year.
Activity Report of the Committees
Four committees support the work of the Supervisory Board. They prepare topics that are then dealt with by the full Supervisory Board and, in individual cases, take decisions in lieu of the full board, as far as permitted. The committee chairpersons reported regularly to the Supervisory Board on the details of their committee work.
The Executive Task Committee met at an above-average rate, nine times, during the reporting year. Besides conferring on various strategic measures of the company, the committee above all reviewed Executive Board and personnel matters. In particular, it intensively discussed and prepared for appointments to the new Executive Board positions as well as decisions on their remuneration. In addition, the Executive Task Committee received information on the progress of various Group projects and considered the succession planning for top managers, as well as amendments to the Corporate Governance Code, to prepare resolution proposals to be approved by the full Supervisory Board.
In the year under review, the Audit Committee held five meetings. The committee prepared for the full Supervisory Board's conference on endorsement and
approval of the consolidated annual financial statements for fiscal 2017 and discussed the quarterly and first-half financial reports of 2018. Additional focal points were monitoring the effectiveness of the Group-wide risk management and internal control system by the Internal Auditing Department as well as measures for further improvement of compliance. The committee also conferred on the subjects of Group financing.
Beyond these items, the committee reviewed the Internal Auditing Department report, which did not indicate any material discrepancies in business transactions, and also considered the department's plans for the upcoming months. With respect to the audit of the annual financial statements for fiscal 2018, the committee confirmed the independence of the auditors, and deliberated in detail on selecting auditors to recommend at the Annual Shareholder’s Meeting for appointment and commissioning to perform an audit review, as well as on defining and monitoring the audit procedure and the focal points of the audit.
The Nomination Committee that draws up proposals to be submitted to the Annual Shareholders' Meeting for electing shareholder representatives to the Supervisory Board did not meet in the year under review. The Conciliation Committee pursuant to Section 27, Subsection 3, of the German Codetermination Law ("MitBestG“) likewise did not have to be convened.
Audit of the Annual and Consolidated Financial Statements; Review of the Non-Financial Group Statement
The annual and consolidated financial statements prepared by the Executive Board for fiscal 2018 and the management report of Sartorius AG were reviewed by the independent auditing company KPMG Wirtschaftsprüfungsgesellschaft based in Hanover, Germany. This company had been commissioned by the Audit Committee of the Supervisory Board pursuant to the resolution passed at the Annual Shareholders’

Meeting on April 5, 2018. The independent auditors issued an unqualified audit certificate.
They attended the Audit Committee meeting on February 13, 2019, and the Supervisory Board Meeting on February 14, 2019, and reported on the essential results of their audits.
Sufficient time was allotted for discussion of all issues with the auditors. Written information and audit reports had been sent to all Supervisory Board members on time and were discussed in detail during the meetings mentioned. On the basis of its own examination of the annual Sartorius AG and consolidated financial statements, the Sartorius AG management report and the Group management report, the Supervisory Board concurred with the results of the audit conducted by KPMG and, at the meeting on February 14, 2019, endorsed the financial statements of Sartorius AG and the Group on recommendation by the Audit Committee. The annual financial statements were thus approved. The Supervisory Board and the Executive Board will submit a proposal at the Annual Shareholders’ Meeting on March 28, 2019, to pay dividends of €0.62 per preference share and €0.61 per ordinary share to shareholders from the retained profit.
Furthermore, the Executive Board submitted a Non-Financial Group Statement based on the German Law to Strengthen Companies’ Non-Financial Reporting to implement the EU CSR Directive. The content of this statement was submitted to a voluntary review by KPMG AG Wirtschaftsprüfungsgesellschaft based on a limited assurance engagement. On the basis of this review, KPMG issued an unqualified opinion. The auditing company attended the Supervisory Board meeting on February 14, 2019, and reported on the results of its audit review. Following intensive discussions and examination, the Non-Financial Group Statement was also endorsed by the Supervisory Board members.
Composition of the Supervisory Board and the Executive Board
In fiscal 2018, there were no personnel changes in the Supervisory Board or the Executive Board. Effective January 1, 2019, Dr. René Fáber, Head of the Bioprocess Solutions Division, and Gerry Mackay, Head of the Lab Products & Services Division, were appointed new members of the Executive Board. Executive Board member Reinhard Vogt stepped down from his position on the Executive Board as of December 31, 2018, by mutual and amicable agreement on the best of terms. The Supervisory Board thanks him for his exceptionally successful service that he dedicated to the benefit of the company for more than 35 years in various functions, the most recent of which as a member of the Executive Board since 2009.
Moreover, the Supervisory Board would like to thank the Executive Board and all employees across the globe for their great commitment and successful hard work throughout the fiscal year ended. In addition, the Supervisory Board expresses its appreciation to its shareholders for the confidence they have shown yet again in the company.
Hamburg, February 2019
For the Supervisory Board
Dr. Lothar Kappich Chairman


16 To Our Shareholders Sartorius Shares
Persistent and High Volatility in Stock Markets
Gains and relatively steady growth among the international stock exchanges marked the year 2017. In contrast, the year under review was characterized by substantial fluctuations and falling share prices. Political uncertainties, international trade conflicts and the interest-rate reversal in the United States caused high volatility that also affected the leading German stock index. Although the DAX reached an all-time high of more than 13,500 points in January 2018, it fell considerably during the following months and finished the 2018 stock-market year down 18.3% at 10,559 points. The MDAX dropped 17.6% and the German technology index TecDAX, to which the Sartorius preference shares also belong, declined 4.3%. The index relevant to the biotech industry, NASDAQ Biotechnology, registered a drop of 9.3%.
Sartorius Shares Rise Substantially; Added to MDAX
The prices of both classes of Sartorius AG shares developed positively in spite of the volatile stock exchanges. Contributing factors included the announcement of medium-term financial targets for 2025, better-than-expected business performance halfway through 2018 and the inclusion of our preference share in various indices. Our preference share finished the 2018 stock-market year at a closing price of €108.90 – up 36.9% year on year. The ordinary share price rose by 27.3%, closing at €96.00.
The preference share joined the MDAX in September 2018 as part of the German Stock Exchange’s reorganization of its index structure; it has additionally been listed on the TecDAX since 2012. At the end of 2018, the share certificates on the MDAX were in 15th place in terms of market capitalization and ranked 32nd per trading volume. And on the TecDAX, the share certificates finished last year 8th in terms of market capitalization (2017: 8th) and 13th with respect to trading volume (2017: 14th). In addition, the MSCI Germany Index added our share certificates in May 2018.
Facts about the Shares
ISIN DE0007165607 (ordinary shares)
DE0007165631 (preference shares)
Designated sponsor Oddo Seydler Bank AG | M.M. Warburg & Co. (AG & Co.) KGaA
Market segment Prime Standard
Indexes MDAX | TecDAX | HDAX | CDAX | MSCI World | MSCI Europe | MSCI Germany | STOXX Europe 600
Stock exchanges Xetra | Frankfurt | Hanover | Dusseldorf | Munich | Berlin | Hamburg | Bremen | Stuttgart
Number of shares 74,880,000 no-par individual share certificates with a calculated par value of €1 per share Of which 37,440,000 ordinary shares
37,440,000 preference shares
Of which shares outstanding 34,212,224 ordinary shares
34,176,068 preference shares
1) without treasury shares Sources: Bloomberg, Deutsche Börse AG
Sartorius Shares
Trading Volume and Share Price Development
2018 2017 Change in %
Preference share in € (Xetra year-end closing price) 108.90 79.54 36.9 Ordinary share in € (Xetra year-end closing price) 96.00 75.42 27.3
Market capitalization in millions of €1) 7,006.1 5,298.7 32.2
Average daily trading volume of preference shares 107,761 82,434 30.7
Average daily trading volume of ordinary shares 2,153 1,605 34.1
Trading volume of preference shares in millions of € 3,571.1 1,655.0 115.8
Trading volume of ordinary shares in millions of € 61.3 30.0 104.3
Total trading volume in millions of ¤ 3,632.4 1,685.0 115.6 TecDAX (Jahresschlusskurse XETRA) 1,960.7 2,529.0 –22.5
MDAX (XETRA year-end closing price) 21,588.0 26,200.7 –17.6
DAX (Jahresschlusskurse XETRA) 10,559.0 12,917.6 –18.3

To Our Shareholders Sartorius Shares 17
January 1, 2014 to December 31, 2018
Sartorius share prices from January 1, 2014, to June 13, 2016, adjusted for stock split1)
Preference ShareOrdinary Share2014 2015 2016 2017 2018
Preference Share Ordinary Share
0
20
40
60
80
100
120
140
160
Sartorius Share1) in €
January 1, 2018, to December 31, 2018
Preference ShareDAXNASDAQ Biotechnology IndexOrdinary ShareTecDaxMDAXJan. Feb. March April May June July Aug. Sep. Oct. Nov. Dec.
50
75
100
125
150
175
200
Preference Share DAX NASDAQ Biotechnology IndexOrdinary Share TecDax MDAX
Sartorius Shares in Comparison to the DAX, MDAX, TecDAX and NASDAQ Biotechnology Index

18 To Our Shareholders Sartorius Shares
Market Capitalization and Trading Volume
The market capitalization of Sartorius AG ordinary and preference shares rose by around 32% in the reporting year and – as of December 31, 2018 – stood at €7.0 billion, up from €5.3 billion in 2017.
The average number of preference shares traded daily on the Frankfurt Stock Exchange (Xetra and trading floor) increased substantially during the year under review from 82,434 to 107,761 shares. The respective trading volume rose even more strongly in the reporting year, reaching €3.6 billion, up from €1.7 billion a year earlier.
Due to the low free float of Sartorius’ ordinary shares, they are traded only to a limited extent. Thus, the average number of ordinary shares traded daily was 2,153 compared with 1,605 the previous year. The corresponding trading volume was around €61.3 million (2017: €30.0 million).
Investor Relations
Sartorius investor relations activities follow the objective of making the current and future development of the company transparent for its stakeholders. To achieve this objective, Sartorius maintains an ongoing, open dialog with shareholders, potential investors and financial analysts.
Besides providing quarterly, first-half and annual reports, we inform the capital market and the interested public at quarterly teleconferences and in regularly published press releases about the current development of our business and other material events at the company. Moreover, Group management and our IR team were present for talks and factory tours with capital-market participants at our sites in Göttingen, Germany and Aubagne, France. Management and IR specialists also took part at conferences and roadshows in various financial centers. In February 2018, our Group`s headquarter hosted a capital market day, with a focus on discussing our medium-term financial targets for 2025. Manager Magazin and the HHL Leipzig Graduate School of Management awarded Sartorius an Investors’ Darling Prize in September 2018 in recognition of our financial-market communications; we finished third among TecDAX companies. Our IR team also came in third among competitors in the German technology index for the German Investor Relations Award, which the industry association DIRK issues every year based on data from surveying capital-market participants.
All information and publications about our company and its shares are available on our website at www.sartorius.com.
Analysts
The assessments and recommendations of financial analysts serve as an important foundation for the decisions of private and institutional investors when acquiring shares. During the reporting year, we maintained an ongoing dialog with a total of eighteen institutes.
Research Coverage
Date Institute Price
target in € Recommend
ation
Jan. 31, 2019 Commerzbank 133.00 Hold
Jan. 30, 2019 Kepler Cheuvreux 107.00 Sell
Jan. 30, 2019 M.M. Warburg 145.00 Buy
Jan. 30, 2019 Metzler 128.00 Hold
Jan. 30, 2019 Janney 140.00 Hold
Jan. 29, 2019 Mainfirst 140.00 Buy
Jan. 29, 2018 Berenberg 110.00 Hold
Jan. 29, 2018 UBS 142.00 Buy
Oct. 24, 2018 AlphaValue 118.00 Sell
Oct. 24, 2018 DZ Bank 92.00 Sell
Oct. 24, 2018 Hauck & Aufhäuser 105.00 Hold
Oct. 24, 2019 LBBW 120.00 Hold
Oct. 23, 2019 Deutsche Bank 115.00 Hold
Oct. 18, 2018 HSBC 99.00 Sell
Jul. 27, 2018 Oddo BHF 109.00 Sell
Jul. 26, 2018 EQUI.TS 125.00 Hold
Jul. 26, 2018 Nord LB 80.00 Sell

To Our Shareholders Sartorius Shares 19
Dividends
The Sartorius Group strives to enable its shareholders to participate appropriately in the company’s success and has continuously raised dividends over the past years. Our dividend policy is basically oriented toward distributing an approximately stable share of relevant net profit (see definition on page 36) to our shareholders.
The Supervisory Board and the Executive Board will submit a proposal to the Annual Shareholders’ Meeting on March 28, 2019, to pay dividends of €0.62 per preference share and €0.61 per ordinary share for fiscal 2018.
If approved, the dividend would increase for the ninth consecutive year and the total profit distributed would rise by a considerable 21.8%, from €34.5 million last year to €42.1 million. The corresponding dividend payout ratio would be on the previous year`s level of 24.0 %. Based on the 2018 year-end prices, this would result in a dividend yield of 0.6% for ordinary shares (previous year: 0.7%) and 0.6% for preference shares (previous year: 0.6%). Treasury shares held by the company are not entitled to dividend payments.
Shareholder Structure
Sartorius AG’s issued capital comprises 37,440,000 million ordinary shares and the same number of preference shares, each with a calculated par value of €1 per share. A good 50% of the ordinary shares are held by the Sartorius families and are under the management of an executor. Approximately 5% are held directly by members of the Sartorius families, and some 9% are owned as treasury shares by the corporation itself. According to a mandatory announcement published in 2011, the U.S. company Bio-Rad Laboratories Inc. held approximately 30% of the ordinary shares at that time; based on the most recent information available, the company now holds around 34%. To our knowledge, the remaining approximately 2% of the ordinary shares are in free float.
Around 91% of the company's preference shares are in free float; roughly 9% are held as treasury shares by the corporation.
2014 to 2015 adjusted for stock split; rounded values
Amounts suggested by the Supervisory Board and theExecutive Board of Sartorius AG
1)
2)
0.27 0.38 0.46 0.51 0.620.26 0.37 0.45 0.50 0.61
in €
2014 2015 2016 2017 20182)
0.27 0.38 0.46 0.51 0.620.26 0.37 0.45 0.50 0.61
Preference sharesOrdinary shares
0.00
0.20
0.40
0.60
0.80
Dividends1)
in %
Administered by an Executor
Bio-Rad Laboratories Inc.
Treasury shares
Members of the familyFree float
> 50
~ 34
~ 9
~ 5~ 2
Shareholder Structure: Ordinary Shares
Information on shareholdings and shares in free float pursuant toSections 33 et seq. of the German Securities Trading Act (WpHG).Reporting obligations refer only to ordinary shares and not tonon-voting preference shares.
1)
in %
Free float
Treasury shares
~ 91
~ 9
Shareholder Structure: Preference Shares1)

20 To Our Shareholders Sartorius Shares
Key Figures for Sartorius Shares1)
2018 2017 2016 2015 2014
Ordinary shares2) in € Reporting date 96.00 75.42 72.80 78.50 24.50
High 139.00 89.41 87.50 78.50 25.89
Low 76.80 73.66 54.50 24.63 21.50
Preference shares2) in € Reporting date 108.90 79.54 70.50 60.11 25.31
High 158.60 93.73 79.85 60.19 26.11
Low 80.15 64.35 50.54 24.75 19.10
Market capitalization3) in millions of € 7,006.1 5,298.7 4,900.1 4,740.1 1,698.3
Dividend per ordinary share4) in € 0.61 0.50 0.45 0.38 0.27
Dividend per preference share4) in € 0.62 0.51 0.46 0.38 0.27
Total dividends4) 5) in millions of € 42.1 34.5 31.1 25.8 18.2
Payout ratio4) 6) in % 24.0 24.0 23.5 24.0 24.7
Dividend yield per ordinary share7) in % 0.6 0.7 0.6 0.5 1.1
Dividend yield per preference share7) in % 0.6 0.6 0.7 0.6 1.1
1) Share prices and dividends for 2014 to 2015 adjusted for stock split; rounded values 2) Xetra daily closing price 3) Without treasury shares 4) For 2018, amounts suggested by the Supervisory Board and the Executive Board of Sartorius AG 5) Calculated on the basis of the number of shares entitled to dividends 6) Based on the relevant net profit: net profit adjusted for extraordinary items and non-cash amortization, based on the normalized
financial result, including the corresponding tax effects 7) In relation to the closing price in the year concerned

Combined Group Management Report

22 Group Management Report Structure and Management of the Group
Group Legal Structure
Sartorius is a globally operating company with subsidiaries in more than 30 countries. The holding company Sartorius AG is the parent corporation of the Sartorius Group. The corporation is headquartered in Göttingen, Germany, and is listed on the German Stock Exchange.
Sartorius manages its bioprocess business as a legally independent subgroup whose parent corporation is Sartorius Stedim Biotech S.A., which is listed on Euronext Paris. As of December 31, 2018, Sartorius AG held around 74% of the shares of Sartorius Stedim Biotech S.A. The Group’s lab business is legally combined in a further subgroup whose parent company is Sartorius Lab Holding GmbH, in which Sartorius AG holds a 100% stake.
The consolidated financial statements include Sartorius AG and all major affiliates in which Sartorius AG has a controlling interest pursuant to IFRS 10.
Organization and Management of the Group
The Group’s central management entity is the Executive Board of Sartorius AG. In collaboration with the Supervisory Board, the Executive Board defines the Group's strategy, is responsible for the operational management of the Group and controls the distribution of resources within the organization. Until the end of 2018, the Executive Board was supported by the Group Executive Committee (GEC), in which further senior executives, who were appointed by the Executive Board and had global responsibilities, were members. As the internal organizational structures were further developed in the reporting year and two division heads were appointed as of January 2019, the GEC was disbanded.
The Sartorius Group conducts its operating business in two divisions: Bioprocess Solutions and Lab Products & Services. The divisions each combine their respective businesses for the same fields of application and user groups, and share part of the infrastructure and central services.
To align our business as closely as possible with our customers' needs, our organizational structure is tailored based on our two divisions. All operational functions such as Sales and Marketing and Production, including production-related functions, as well as Product Development since the reporting year, are organized by division. Administrative functions,
Structure and Management of the Group
Sartorius Stedim Biotech S.A. Sartorius Lab Holding GmbH
Service and infrastructure companies
Sartorius Stedim Biotech subgroup Laboratory subgroup
Sales and manufacturing companies
Sales and manufacturing companies
~ 74% 100%
Sartorius AG
100%

Group Management Report Structure and Management of the Group 23
support functions and the Corporate Research unit operate Group-wide to use synergies between the divisions.
Implementing the Group’s various strategies and projects at the local level is the responsibility of the national affiliates. The management bodies of the local companies run their organizations in accordance with the applicable statutory provisions, articles of association and rules of procedure and in keeping with the principles of corporate governance that apply throughout the Sartorius Group worldwide.
Financial Controlling and Key Performance Indicators
The Sartorius Group is managed using a number of key performance indicators, which are also decisive for the determination of the variable remuneration component for the Executive Board and managers.
A key management parameter that Sartorius uses to measure the development of its size is currency-adjusted growth of sales revenue. The key profitability measure is EBITDA adjusted for extraordinary items, i.e. underlying EBITDA, and the corresponding margin.
With respect to the Sartorius Group's debt financing capacity, the key indicator is the ratio of net debt to underlying EBITDA for the last twelve months. Furthermore, the capex ratio, i.e., capital expenditures in proportion to sales revenue, represents a key control parameter.
In addition, the following financial and non-financial indicators are reported on a regular basis:
– Order intake – Relevant net profit | Earnings per share – Annual net profit | Earnings per share – Equity ratio – Net working capital – Net cash flow from operating activities – Number of employees
As a rule, the annual financial forecast that is published at the beginning of a fiscal year for the Group and the divisions refers to the development of sales revenue and of the underlying EBITDA margin. The expected capex ratio, as well as a directional forecast for the ratio of net debt to underlying EBITDA, is additionally indicated for the Group.
Additional non-financial indicators are disclosed in the non-financial statement.

24 Group Management Report Business Model, Strategy and Goals
As a leading partner of the biopharmaceutical industry, we help our customers to develop medications faster and manufacture them more efficiently. Our objective is to propel science forward and contribute toward enabling more people to have access to healthcare.
We are a leading player in an attractive market, which is characterized by strong growth momentum and long-term trends. Primary growth drivers are a growing world population and an increase in age-related diseases in industrialized countries. In addition, rising incomes in emerging countries are leading to improved access to healthcare and rising demand for medications. Medical advances are also driving the ongoing development and approval of new biopharmaceuticals as well as of emerging biosimilars, which are highly similar to established biologics already licensed, and account for a share of the biopharma market that is currently still small, but fast-growing. As a result of these factors, the volumes of biotech medications are steadily increasing and so is the demand for the appropriate production technologies. This market is largely independent of business cycles.
The maturity and intensity of competition in this still comparably young biopharmaceutical industry are successively increasing. In addition to achieving scientific success, our customers will find it more important, in view of mounting cost pressure on healthcare systems, to increase the efficiency of their research, development and manufacturing processes. We help them meet this challenge by further developing our product portfolio. One of the decisive success factors of Sartorius is to use technology in order to differentiate ourselves from our competitors . Our innovative power rests on three pillars: our own specialized product development, the integration of innovations via acquisitions, and alliances with partners in complementary fields.
Another competitive advantage of Sartorius is its broad understanding of applications, which is based on its clear focus on the sector. We are thoroughly familiar with our customers' entire added-value chains, especially the interactivity of the systems in these chains. All this makes us a strategic partner of these customers who drive forward innovations in bioprocess technology.
Beyond the biopharmaceutical industry, Sartorius also supports related sectors, such as laboratories in the chemical and food industries, with a wide portfolio of laboratory instruments and consumables used to ensure safe and reliable performance of quality-critical processes.
The Sartorius Group has organized its business in two divisions: Bioprocess Solutions and Lab Products & Services. We outline the divisions' market positioning and strategy in the sections that follow.
Business Model, Strategy and Goals

Group Management Report Business Model, Strategy and Goals 25
Bioprocess Solutions
In the Bioprocess Solutions Division, Sartorius offers a broad portfolio of products that focuses on all major steps in the manufacture of a biopharmaceutical, as well as in process development as prerequisite procedures. Our technologies cover, inter alia, cell line technologies, cell culture media, bioreactors, and a wide range of products for separation, purification and concentration of biological intermediates and finished products, as well as solutions for their storage and transportation. Sartorius also offers data analytics software for modeling and optimizing processes of biopharmaceutical development and production. In its core technologies, the company has leading market positions with high double-digit market shares.
The breadth of our product portfolio sets us apart from our competitors. We provide customers with an entire production unit from a single source, as well as assist with preceding project planning, process integration and subsequent validation.
As an innovation leader, Sartorius was moreover one of the first biopharmaceutical suppliers to specialize in single-use technologies, which account for approximately three-quarters of the division's sales revenue. Due to their cost advantages and their greater flexibility and safety compared with reusable technologies, the pharmaceutical industry is increasingly relying on single-use products.
Particularly in pre-commercial production processes, single-use products have almost completely supplanted classic stainless steel components. Industry observers believe that market penetration is likely to continue as commercial production also increasingly moves toward single-use products.
As a result, the division generates a large share of sales from repeat business. The high approval requirements placed on our customers' products are also contributing to this growth. Because our customers' production processes must be validated by the health authorities responsible, the technological components initially used can be replaced only at considerable expense once they have been approved. The manufacturers of medications are therefore closely tied to the suppliers for the life cycle of a medication. Beyond this, our broad and stable customer base that we address through our specialized sales force directly for the most part also contributes to this favorable risk profile.
The division’s strong strategic positioning and the above-average expansion of the sector are a good foundation for profitable growth in the future as well. Beyond realizing our organic development potential, we also aim to further expand the division's portfolio through complementary acquisitions and alliances.
Information on the business development of this division is given in the chapter on Business Development of Bioprocess Solutions.
Strategic Focus on Biopharma Applications from Molecule Development to Production of Biopharmaceuticals
Production upstream and downstream
Quality | Testing | Validation
Molecule development
Cell line and process development
Lab Products & Services Division
Bioprocess Solutions Division

26 Group Management Report Business Model, Strategy and Goals
Lab Products & Services
The Lab Products & Services Division concentrates on research laboratories in the pharmaceutical and biopharmaceutical industries, as well as on academic research institutes. We provide scientists and laboratory staff the laboratory instruments and lab consumables they need to make their research and quality control easier, faster and more successful. For example, we provide our life science customers with innovative systems for live cell analysis to enable them to perform key analytical steps in molecule development. Earlier, these were mostly carried out manually, and can now be automated with the use of our products. In this way, considerably larger quantities of samples can be examined and extensive sets of data generated and evaluated within a short time, substantially accelerating the identification of suitable drug candidates.
Beyond this, the division offers a wide range of premium laboratory instruments for sample preparation – such as laboratory balances, pipettes and lab water systems – as well as consumables, such as filters and microbiological test kits. In these product categories, Sartorius has leading market positions and significant market shares. Our solutions are designed to boost the efficiency and productivity of routine yet quality-critical lab processes and industry-specific workflows. Beyond the biopharmaceutical industry, this portfolio is also tailored to quality control labs in the chemical and food industries.
With its innovative technology platforms for bioanalytics and its comprehensive portfolio for sample preparation, the Lab Products & Services Division has a strong foundation for further significant organic growth. Due to economies of scale and product mix effects, growth is projected to be accompanied by a continuous increase in profitability. In addition, Sartorius plans to extend the division's portfolio through acquisitions and strategic partnerships.
Information on the business development of this division is provided in the chapter on Business Development of Lab Products & Services.

Group Management Report Business Model, Strategy and Goals 27
Sartorius 2020 and 2025 Strategies
In 2011, Sartorius presented its strategy and targets for profitable growth up to 2020 according to which sales revenue is projected to increase to around €2 billion with an underlying EBITDA margin of 26% to 27%. At a Capital Markets Day in February of the reporting year, management extended its time horizon, introducing its strategy and long-term targets up to 2025.
While the targets for 2020 still continue to apply unchanged, Sartorius plans to double its revenue in the period of 2020 to 2025 to around €4 billion, given the high market dynamics and the company's strong strategic positioning. Management expects to achieve around two-thirds of this growth organically and around one-third by acquisitions. The underlying EBITDA margin is forecasted to increase to around 28%. For the Bioprocess Solutions Division, the company projects that the division's sale revenue will reach approximately €2.8 billion, with an underlying EBITDA margin of around 30%. For the Lab Products & Sevices Division, the company forecasts sales revenue of around €1.2 billion and an underlying EBITDA margin of about 25%.
In these projections, management assumes that the margins of any future acquisitions in the Group after integration would be on average at a level comparable to that of the existing business and that no significant changes in key exchange rates would occur.
These targets are being implemented by various growth initiatives with the following focal points :
Expansion of the Product Portfolio
Sartorius has a broad product portfolio that is continuously expanded in line with the value-added chain of the biopharmaceutical industry. Aside from our own research and development activities and strategic partnerships, acquisitions that are complementary to or extend our strengths appropriately will remain part of the portfolio strategy of both divisions. We see opportunities in digital networking of products, for example, in the integration of software solutions for bioprocess production control, among others. Expansion into adjacent applications, such as regenerative medicine, is also conceivable. At the focus of our efforts will be products that offer solutions to the challenges our customers face and that make our offering even more attractive from the customers' perspective.
Regional Growth Initiatives
North America and Asia are the key focal areas of our regional growth strategy.
North America is the world's largest market for bioprocess equipment and laboratory products. Yet because it is home to the main competitors for both company divisions, Sartorius has lower market share in this region than in Europe and Asia. Accordingly, the company is striving to gain additional market share, primarily by strengthening its sales and service capacities.
A further strategic focus is on China. This market has sizable growth potential owing to rising private and public healthcare expenditures and the rapid development of regional biopharmaceutical plants. To benefit from the dynamic development of this market, Sartorius has already been investing heavily in its sales infrastructure and plans to expand production capacity levels there over the medium term.
Optimization of Work Processes
Sufficient production capacity and a powerful supply chain are an essential foundation of future growth. For this reason, in recent years Sartorius has substantially expanded its capacities for membranes, filters and single-use bags at various Group sites. Beyond this, a new ERP system based on Group-wide standardized business processes was introduced, the implementation of which is due to be completed in 2019.
Following these significant infrastructural expansions, our focus is increasingly shifting to optimization of our processes. Thus, we are driving forward digitalization and process automation in all parts of the company to further enhance the performance power of our supply chain and our customer contact interfaces. This also includes extending our activities in the areas of e-commerce, digital marketing and analytics.

28 Group Management Report Research and Development
As a leading company in the life science sector, our goal is to collaborate with expert scientific communities worldwide in order to contribute toward accelerating the discovery of new medical drugs and making their manufacture more efficient. To this end, we provide our biopharmaceutical customers with innovative instruments and solutions that support them in meeting this challenge.
One of the areas we focus on is to further develop our existing product portfolio to meet the needs of our customers in their end markets. Our core technologies include filter and single-use bag products, and also the automation of laboratory processes and software solutions for process control, among others. A detailed explanation of our developmental focal points can be found in the division chapters on pages 42 and 47.
Corporate Research is a functional area that operates Group-wide in close cooperation with external partners on overarching innovation projects. Its most important task and objective consists of identifying and developing key technologies and application fields of the future. In addition to collaborating closely with customers, research institutes and startups, Corporate Research pursues its own research activities in selected fields.
Research and Development

Group Management Report Macroeconomic Environment and Conditions in the Sectors 29
The sectors in which the Sartorius Group is active differ in their dependence on the economy. The Bioprocess Solutions Division, for instance, operates in an environment that is largely independent of economic fluctuations. The Lab Products & Services Division, in contrast, is active in sectors whose development is more strongly affected by economic factors.
Macroeconomic Environment
According to the International Monetary Fund (IMF), the global economy exhibited dynamic growth in 2018 again. Gross domestic product (GDP) rose by 3.7% worldwide, thus reaching the level of the previous year. Industrialized countries reported a gain of 2.4%; the economies in emerging and developing countries grew by 4.7%. The IMF downgraded its initial forecasts for 2018 global growth during the year. Decisive factors for this were a loss of momentum in economic growth in the United Kingdom and the eurozone as well as the struggling economies in emerging countries such as Argentina, Brazil, Iran and Turkey. In addition, the trade war between the United States and China and the corresponding imposition of tariffs had increasingly had a negative effect on companies’ investing activities and global exports.
The growth forecasts for Sartorius’ European core markets in particular were revised during 2018 owing to worsening economic data. For instance, growth in Germany amounted to approximately 1.9% (2017: 2.5%), whereas the IMF had originally forecasted growth of 2.5%. In France and the United Kingdom, the respective growth rates of 1.6% (2017: 2.3%) and 1.4% (2017: 1.7%) were likewise lower than first anticipated. The GDP of the entire European Union increased by 2.2% (2017: 2.7%).
In our largest market, the United States, the dynamic was different: Driven by higher consumer spending and more exports, economic output rose by 2.9% – after growth of 2.2% in 2017.
The Asia-Pacific economic area grew overall by 5.6% (2017: 5.7%). India exhibited growth of 7.3% (2017: 6.7%) and the Chinese economy – despite the tariff and trade war with the United States – continued its robust growth, registering a rise of 6.6% (2017: 6.9%). Sartorius also generated significant revenue in South Korea and Japan. South Korean economic output grew in 2018 by 2.8% (2017: 3.1%); growth was likewise slower in Japan, at 1.1% (2017: 1.7%).
3.4 3.2 3.3 3.7 3.7
in %
2014 2015 2016 2017 2018
International Monetary FundSource:
0.0
1.0
2.0
3.0
4.0
3.4 3.2 3.3 3.7 3.7
Global Development GDP (2014 to 2018)3.7 1.9 2.9 5.63.7 2.4 2.2 5.7
in %
Global EU US Asia|Pacific
International Monetary FundSource:
0.0
1.5
3.0
4.5
6.0
3.7 1.9 2.9 5.63.7 2.4 2.2 5.7
20182017
Gross Domestic Product by Region
Macroeconomic Environment and Conditions in the Sectors

30 Group Management Report Macroeconomic Environment and Conditions in the Sectors
Exchange Rate Trends
In addition to the euro, the currencies relevant to the Sartorius Group include the U.S. dollar in particular as well as the South Korean won, the Chinese renminbi, the Swiss franc and the British pound.
The U.S. dollar gained ground against the euro in the year under review. The exchange rate rose sharply in the first quarter of 2018, reaching a multi-year high of U.S. $1.25 on February 15. This trend went into reverse, however, in mid-April. The more restrictive monetary policy of the U.S. Federal Reserve in contrast to the European Central Bank combined with higher money-market yields in the U.S. ensure the ongoing appeal of the U.S. dollar. The exchange rate thus ended the year on December 31, 2018 at 1.14 U.S. dollars, compared with 1.20 at the end of 2017.
In addition, the exchange rate between the euro and the South Korean won remained virtually unchanged over the course of the year. The Chinese renminbi dropped about 0.9% in value compared to the euro. The Swiss franc gained 3.8% on the euro; in contrast, the British pound depreciated by 1.6% against the continent’s common currency. Because Sartorius produces in the United Kingdom and the company’s income in pounds was on a comparable level to its costs in pounds, the depreciation had only a minor influence on consolidated sales revenue and profit.
Interest Rate Trends
Interest rates remained at a very low level on average throughout the reporting year. The European Central Bank kept its key interest rate at 0.00%. The 3-month EURIBOR rate – the rate of interest on fixed-term deposits denominated in euros in interbank business – stood at -0.31% on December 31, 2018 (2017: -0,33%).
Sources: International Monetary Fund, World Economic Outlook,
October 2018; Bloomberg.
Conditions in the Sectors
Sartorius’ key customer groups include the biopharmaceutical and pharmaceutical industries as well as public research institutions. In addition, the company counts quality assurance laboratories in the chemicals and food industries among its customers. The progress of the Group's business accordingly depends on developments in these industries.
Strong Growth in the Biopharmaceutical Market
According to estimates from several market observers, the global pharmaceutical market showed positive development once again in 2018, with an increase of approximately 4% to 5%. Within the pharmaceutical market, the segment for medications and vaccinations manufactured using biotech methods has grown faster than the rest of the market for many years now. In 2018, the biopharmaceutical market was estimated at a volume of €217 billion, an increase of approximately 8% to 9% over the previous year. The steadily growing significance and acceptance of biopharmaceutical substances is reflected in its increasing share of the sales revenue in the global pharmaceutical market and the development activities of the pharmaceutical industry. For example, biopharmaceutical compounds account for more than 40 % of the R&D pipeline.
It is estimated that nearly €13 billion in sales were generated in 2018 with products and technologies for the manufacture of biopharmaceuticals. In contrast to its moderate growth in 2017, the supplier industry considerably increased sales in the year under review. There was once again a dynamic rise in demand in emerging countries – especially China and India – where many commercial biopharmaceutical production facilities have opened in recent years to meet domestic demand. But there was also considerable investment in the United States and Europe, where the highest bioreactor capacities are located.
Market growth fundamentally depends more on medium- to long-term trends than on short-term economic developments. The major growth driver is the increasing demand worldwide for medications. In addition, the approval and market launch of new biopharmaceuticals boosts growth. In the year under review, the U.S. Food and Drug Administration (FDA) approved a record 17 biopharmaceuticals. A growing number of active pharmaceutical ingredients manufactured using biotech production methods is being approved for the treatment of rare illnesses that have been untreatable so far. There has been recent progress in cell and gene therapies: the United States and Europe have now granted market approval to

Group Management Report Macroeconomic Environment and Conditions in the Sectors 31
three therapies. A growing number of approved biopharmaceuticals as well as an increasing variety of therapy types and substance classes coupled with growing demand for medications are the main drivers for the worldwide increase in production capacities for biopharmaceuticals.
Biosimilars, or generic versions of biologics similar to originally patented medicines, are playing an increasingly important role in the biotechnology market. Although sales volume was comparatively low at an estimated €6 billion in 2018, the market is expected to generate an average annual growth rate of around 30% until 2022. Through the approval and market launch of new biosimilars, further progress was made in the reporting period. The biosimilars market could continue growing in coming years due to the expiration of patents for a number of high-margin biopharmaceuticals. In addition, the regulatory, patent law-related and marketing challenges and hurdles that have hindered faster market penetration of biosimilars to date are likely to decrease gradually.
Single-Use Systems for Biopharmaceutical Production Continue to Gain Importance
Biotech production methods are much more complex and cost-intensive than traditional methods for producing medications. Consequently, manufacturers and suppliers are continually looking to develop more efficient technologies. In this context, single-use products play a decisive role, as they require significantly less capital expenditure, reduce costs for cleaning and validation, and minimize downtime. They also offer greater flexibility in production and help accelerate time to market.
Owing to these advantages, single-use technologies are already an established part of many process steps.
Single-use systems are primarily employed in pre-commercial development activities and production phases and in small batch manufacturing. It can be expected that single-use technologies will become increasingly popular for the production of high-volume commercial quantities. This is particularly relevant to the production of biotech substances, whose clinical development takes place in single-use systems. Sartorius offers the sector’s most extensive portfolio of single-use technologies, with scalable products for every step of manufacturing. The company is also actively helping the biopharmaceutical industry convert to these technologies in the production of medications.
Moderate Growth in the Global Laboratory Market
Demand for laboratory instruments and supplies primarily stems from the biopharmaceutical and pharmaceutical industries as well as from public research initiatives. Laboratory products from Sartorius are also used by research and quality assurance laboratories in the chemicals and food sectors.
According to estimates by the market research firm Frost & Sullivan, the global laboratory market grew by approximately 3.6% to €39 billion in the reporting year. Following a lackluster first quarter, budget increases for academic and public research institutes during 2018 led to rising demand. And investing activities in the private sector remained stable due to the positive economic situation.
While Europe reported an increase of 3.1%, the United States – the largest market for laboratory products – registered growth of 3.3%. Significant growth was once again reported in Asian countries such as China and India, in which the laboratory market enjoyed an above-average expansion of 7.5 % (China) and 8.5 % (India).
6 11
2009-2013 2014-2018
6 11
0
3
6
9
12
Average Number of New Approvals of Biotech Medicationsin the USA per Year

32 Group Management Report Macroeconomic Environment and Conditions in the Sectors
Competitive Position
The Bioprocess Solutions Division operates as a solution provider, covering the core process steps in biopharmaceutical production and upstream process development. It holds a leading global position in key technological fields, and offers an extensive portfolio – particularly with regard to single-use technologies. The Bioprocess Solutions Division's principal competitors include certain business units at Merck KGaA, Danaher Corp., General Electric Co. and Thermo Fisher Scientific Inc.
The Lab Products & Services Division is positioned as a premium provider of laboratory instruments. This division also serves both R&D laboratories and quality assurance laboratories, with a focus on the biopharmaceutical industry. The product range includes laboratory balances, pipettes, and instruments for bioanalytics as well as a wide range of consumables. The division ranks among the leading providers worldwide in most of these areas. Principal competitors include certain business units at Mettler Toledo Intl. Inc., Thermo Fisher Inc., Merck KGaA, Danaher Corp. and Eppendorf AG.
Sources: IQVIA Institute: 2018 and Beyond: Outlook and Turning
Points, March 2018; Evaluate Pharma: World Preview 2018,
Outlook to 2024, June 2018; BioPlan: 15th Annual Report and
Survey of Biopharmaceutical Manufacturing Capacity and
Production, April 2018; Frost & Sullivan: 2018 Mid-year Report:
Forecast and Analysis of the Global Market for Laboratory
Products, May 2018; BCC Research: Biosimilars: Global Markets,
March 2018; Daedal Research: Global Biologics Market: Size,
Trends & Forecasts, February 2018; www.fda.gov

Group Management Report Group Business Development 33
Sales Revenue and Order Intake
In the reporting year, Sartorius continued its dynamic growth: Sales revenue in constant currencies rose by double digits, by 13.2% to €1,566.0 million and was thus within the range of our forecast that was raised to 12% to 15% at mid-year. In particular, this increase was due to high organic growth, while non-organic growth was around one percentage point. Sales were up 11.5% on a reported basis, i.e., including currency effects.
Order intake also grew significantly in the reporting period, rising 12.5% to €1,662.5 million in constant currencies. On a reported basis, this increase was 10.7%.
For a full comparison of the Group’s business development with its forecast, see page 50.
Sales Revenue and Order Intake
€ in millions 2018
2017
in %
reported in % wb1)
Sales revenue 1,566.0 1,404.6 11.5 13.2
Order intake 1,662.5 1,501.4 10.7 12.5
1) In constant currencies
Sales Driven by Both Divisions
Both divisions contributed to sales growth in the reporting year of 2018 as well. After the previous year's comparably moderate performance, momentum for the Bioprocess Division in particular considerably picked up in the year under review. The division's sales revenue rose in constant currencies by 14.8% to €1,143.1 million (reported +13.1%) and was fueled by strong demand across all product categories and geographies. The increase in sales revenue was achieved almost completely organically, whereas the software company Umetrics acquired in April 2017 contributed around half a percentage point of non-organic growth.
After a satisfactory first half in 2018, development of the Lab Products & Services Division was dampened in the second half as a result of softer demand in Europe. Following high growth in the prior-year period, the division's sales in constant currencies increased by 9.1% to €423.0 million (reported: +7.3%). Finalized in March 2017, the acquisition of Essen BioScience, a specialist in cell analysis, contributed non-organic growth of around 2.5 percentage points in line with expectations.
Sales by Division
€ in millions 2018
2017
in %
reported in %
cc
Bioprocess Solutions 1,143.1 1,010.3 13.1 14.8
Lab Products & Services 423.0 394.2 7.3 9.1
Further information on the business development of the Group divisions is given on pages 42 et seq. for the Bioprocess Solutions Division and on pages 47 et seq. for the Lab Products & Services Division.
€ in millions
2014 2015 2016 2017 2018
891.2 1,114.8 1,300.3 1,404.6 1,566.0891.2 1,114.8 1,300.3 1,404.6 1,566.0
600
850
1,100
1,350
1,600
Sales Revenue 2014 - 2018
Group Business Development

34 Group Management Report Group Business Development
Gains in All Regions
In the reporting year, Sartorius recorded gains in all three regions. In EMEA, the region contributing the highest share of revenue of around 42%, sales rose solidly by 9.4% to €657.7 million. While the Bioprocess Solutions Division achieved a gain of 12.7%, growth for the Lab Products & Services Division was 2.2% against a high prior-year base and due to softer demand caused by the slowing economic cycle.
After development in the Americas in 2017 had been dampened by several temporary effects, this region saw the highest dynamics in the reporting year, with sales up 16.6%, to €520.1 million. As a result of this growth, the corresponding share of Group sales rose to 33%. Following a decline in the prior year, the Bioprocess Solutions Division in particular grew robustly, by 17.1%. The Lab Products & Services Division also increased its sales revenue by 14.5% due to strong organic growth and sales contributed by an acquisition.
The Asia | Pacific region, which accounted for around 25% of Group revenue in 2018, showed very dynamic development again, with sales up 15.5% to €388.2 million. Despite its strong growth reported in the year earlier, the Bioprocess Solutions Division again boosted its revenue by 15.0%, and the Lab Products & Services Division also increased its regional revenue by double digits, by 16.6%. All growth rates are in constant currencies unless otherwise stated.
Sales by Region
€ in millions 2018
2017
in %
reported in %
cc
EMEA 657.7 604.5 8.8 9.4
Americas 520.1 455.5 14.2 16.6
Asia | Pacific 388.2 344.6 12.7 15.5
Costs and Earnings
In the reporting year, the cost of sales stood at €762.4 million. In comparison with sales revenue growth of 11.5%, the cost of sales increased underproportionately by 9.3%, which was due to product mix effects and economies of scale. The cost of sales ratio was 48.7% relative to 49.7% a year ago.
Selling and distribution costs rose by 11.1% to €329.8 million so the ratio of these costs to sales revenue of 21.1% remained at approximately the previous year's level.
Expenses for research and development rose year over year by 13.7% to €78.2 million. The ratio of R&D expenses to sales revenue was 5.0%, slightly above the prior-year level of 4.9%.
Concerning general administrative expenses, Sartorius reported an increase of 13.1% to €94.2 million. In relation to sales revenue, general administrative expenses rose slightly from 5.9% in the previous year to 6.0% in the reporting year.
In fiscal 2018, the balance of other operating income and expenses significantly improved to -€2.7 million relative to -€38.6 million a year earlier. This year-over-year change was mainly driven by significant increases in extraordinary items. In the previous year, this balance totaled -€35.5 million and was due to various cross-divisional projects, expenses related to acquisitions and to the consequences of Hurricane Maria. In the reporting year, modification of the contract with the life science company Lonza on the exclusive distribution and marketing rights for specific cell culture media and buffers resulted in income of €35.2 million. This was offset by expenses for cross-divisional projects and the introduction of a new ERP system and by costs related to acquisitions of the previous years so that extraordinary items totaled -€1.7 million.
In constant currencies
Acc. to customers' location
1)
2)
€ in millions unless otherwise specified
EMEA
Americas
Asia | Pacific
657.7 | +9.4%
520.1 | +16.6%
388.2 | +15.5%
Sales Revenue and Growth1) by Region2)

Group Management Report Group Business Development 35
In the year under review, the Group’s EBIT increased robustly by 36.1% to €298.6 million, especially due to higher sales revenue and to the improvement mentioned above in the other operating income and expenses. As a consequence, and despite slightly higher depreciation, the Group's EBIT margin rose from 15.6% a year earlier to 19.1%.
The financial result was -€27.9 million in 2018 relative to -€18.2 million in 2017. This was essentially attributable to valuation effects related to foreign currency liabilities and hedging instruments.
In the reporting year, tax expenses of €73.2 million were substantially higher than the prior-year total of €41.9 million as these were positively impacted by one-time effects of €16 million related to the U.S. tax reform. The company's tax rate was 27.0 % compared with 20.8% in the year before.
Net profit for the period rose 23.9% to €197.5 million (2017: €159.3 million).
Net profit attributable to shareholders of Sartorius AG amounted to €141.3 million in 2017. Non-controlling interest stood at €56.1million (2017: €44.6 million), which essentially reflected shares in Sartorius Stedim Biotech S.A. not held by the Sartorius Group.
Statement of Profit or Loss
€ in millions 2018 2017 ∆ in %
Sales revenue 1,566.0 1,404.6 11.5
Cost of sales –762.4 –697.7 –9.3
Gross profit on sales 803.6 706.8 13.7 Selling and distribution costs –329.8 –296.8 –11.1
Research and development costs –78.2 –68.8 –13.7
General administrative expenses –94.2 –83.3 –13.1
Other operating income and expenses –2.7 –38.6 92.9
Earnings before interest and taxes (EBIT) 298.6 219.4 36.1 Financial income 7.7 13.6 –43.5
Financial expenses –35.6 –31.7 –12.1
Financial result –27.9 –18.2 –53.6 Profit before tax 270.7 201.2 34.6
Income taxes –73.2 –41.9 –74.9
Net profit for the period 197.5 159.3 23.9
Attributable to:
Equity holders of Sartorius AG 141.3 114.7 23.2
Non-controlling interest 56.1 44.6 25.9
Underlying EBITDA
The Sartorius Group uses underlying EBITDA – earnings before interest, taxes, depreciation and amortization and adjusted for extraordinary items – as its key profitability indicator to provide a better picture of its operating development, also in an international comparison. More information on extraordinary items is provided on page 119.
Reconciliation from EBIT to Underlying EBITDA
€ in millions 2018 2017
EBIT 298.6 219.4
Extraordinary items 1.7 35.5
Amortization | depreciation 104.7 98.3
Underlying EBITDA 405.0 353.2
In fiscal 2018, the Sartorius Group increased its earnings significantly yet again. Underlying EBITDA thus rose by 14.7% to €405.0 million. The Group's respective underlying EBITDA margin improved to 25.9% (2017: 25.1%) particularly due to economies of scale, thus slightly exceeding our forecast made at the beginning of the year.
Underlying EBITDA by Divisions
Underlying EBITDA
€ in millions
Underlying EBITDA margin
in %
Group 405.0 25.9 Bioprocess Solutions 326.9 28.6
Lab Products & Services 78.1 18.5
Underlying EBITDA for the Bioprocess Solutions Division was €326.9 million, significantly up 15.7% from €282.4 million a year ago. The division's margin rose to 28.6%, especially due to the positive effects of economies of scale. The Lab Products & Services Division also increased its earnings: its underlying EBITDA rose by 10.4% from €70.8 million a year earlier to €78.1 million. The division's earnings margin benefited from volume effects and the Essen BioScience acquisition and was up 18.5% from the prior-year figure of 18.0%.

36 Group Management Report Group Business Development
Relevant Net Profit
The relevant net profit attributable to the shareholders of Sartorius AG rose sharply by 21.9% from €144.0 million in 2017 to €175.6 million in 2018. This figure is the basis for determining the profit to be appropriated and is calculated by adjusting for extraordinary items and eliminating non-cash amortization, and is based on the normalized financial result as well as the corresponding tax effects for each of these items. The underlying earnings per ordinary share climbed by 22.0% to €2.56, up from €2.10 a year earlier, and by 21.9% per preference share to €2.57 euros, up from €2.11 euros a year ago.
€ in millions 2018 2017
EBIT 298.6 219.4
Extraordinary items 1.7 35.5
Amortization 37.1 34.8
Normalized financial result1) –16.9 –17.7
Normalized income tax (2018: 27%, 2017: 29%)2) –86.5 –78.9
Underlying earnings 233.9 193.1
Non-controlling interest –58.4 –49.1
Underlying earnings after taxes and non-controlling interest 175.6 144.0
Underlying earnings per share
per ordinary share (in €) 2.56 2.10
per preference share (in €) 2.57 2.11
1) Financial result excluding fair value adjustments of hedging instruments and non-periodic expenses and income
2) Underlying income tax, based on the underlying profit before taxes and non-cash amortization
Further information on earnings development and extraordinary items for the Group divisions is given on pages 42 et seq. and 47 et seq.
in €
20143) 2015 2016 2017 2018
1.09 1.58 1.94 2.11 2.571.08 1.57 1.93 2.10 2.56
Adjusted for extraordinary items and non-cash amortization, based on the normalized financial result, including the corresponding tax effects
2014-15 adjusted for stock split; arounded values
Including discontinued operation
1)
2)
3)
Preference shareOrdinary share
1.09 1.58 1.94 2.11 2.571.08 1.57 1.93 2.10 2.56
0.00
0.70
1.40
2.10
2.80
Underlying Earnings per Share1)2)

Group Management Report Group Business Development 37
Research and Development
Sartorius continually invests in both new and further development of its products as well as the integration of new technologies through alliances. In 2018, the Sartorius Group spent €78.2 million on R&D, corresponding to an increase of 13.7% over the previous year's investment of €68.8 million. The ratio of R&D costs to sales revenue stood at 5.0%, slightly above last year’s 4.9%.
The IFRS require that certain development costs be capitalized on the statement of financial position and then amortized over subsequent years. In the reporting year, these development investments amounted to €33.0 million compared with €27.4 million the year before. This equates to a share of 29.7% (previous year: 28.5%) of the Group’s total R&D expenses. Amortization related to capitalized development costs totaled €8.3 million in 2018 (previous year: €8.4 million). These expenses were disclosed in the cost of sales.
We pursue a strategic intellectual and industrial property rights policy across our divisions to protect our expertise. Sartorius systematically monitors compliance with these rights on a cost | benefit basis to determine which specific individual rights are to be maintained.
In 2018, we filed a total of 158 applications for intellectual and industrial property rights (2017: 161). As a result of these applications, including those of prior years, we were issued 270 patents and trademarks during the reporting year (2017: 263). As of the reporting date, we had a total of 4,125 patents and trademarks in our portfolio (2017: 3,699).
Further information is provided in the sections covering the individual divisions on pages 42 et seq. and 47 et seq.
Capital Expenditures
Against a backdrop of strong organic growth in recent years, Sartorius made above-average investments in the development of new capacity in 2018 as well. In the reporting year, these development investments amounted to €237.8 million relative to €209.4 million the year before. At 15.2% (previous year: 14.9%), the ratio of capital expenditures to sales revenue was within the range of our forecast.
At our Group headquarters in Göttingen, Germany, production capacities are being expanded and two formerly separate sites consolidated into one.
At our site in Yauco, Puerto Rico, Sartorius is investing in expanding its production capacities for filters and single-use bags. The company is also making investments in additional capacity at our plant in Aubagne, France. (Further information is provided in the chapter covering the division on page 46).
To extend production capacities in cell line development, we began construction in 2017 on a new R&D and manufacturing facility in Ulm, Germany, which is scheduled to start up operations at the end of 2019.
Sartorius also made progress on the implementation of its new ERP system: in the reporting year, the system was introduced at 15 further Group company sites and implementation is due to be completed in 2019, as planned.

38 Group Management Report Group Business Development
Employees
The numbers of employees reported include all staff members of the Sartorius Group, except for vocational trainees, interns, employees on extended leaves of absence and those participating in an early retirement plan. Numbers are reported as head counts.
On December 31, 2018, the Sartorius Group employed 8,125 people in 33 countries – 624 or 8.3% more than in the previous year.
Employees
2018
2017 Growth
in %
Group 8,125 7,501 8.3% Bioprocess Solutions 5,498 4,980 10.4%
Lab Products & Services 2,627 2,521 4.2%
In the Bioprocess Solutions Division, 5,498 people were employed as of the end of the reporting year, 518 or 10.4% more than at year-end 2017.
The Lab Products & Services Division employed 2,627 people as of the year ended December 31, 2018; this was an increase of 106 or 4.2% compared with the year-earlier period.
Employees in central administrative functions were allocated to the divisions in proportion to cost of the services they performed during the year.
Regionally, EMEA with the highest number of employees, added 10.1% or 523 new people. As of the end of the reporting year, Sartorius employed 3,056 people in Germany, or 37.6% of the total Group workforce, of which most staff members work at the Göttingen-based headquarters.
The Americas region saw an increase of 6.9% or 82 new people.
The number of employees in the Asia | Pacific region grew by 1.7% or 19 people.
Most employees at Sartorius work in production; at the end of 2018, they numbered 4,706, thus 9.5% more than at the end of 2017. In our production head count, we also include service staff and employees who perform services such as testing as part of our customers' core processes.
In marketing and sales, 1,946 people were employed at year-end, close to 4.7% more than a year ago.
In R&D, head count was 682 for the year ended December 31, 2018, thus around 6.9% higher than twelve months earlier.
As of the reporting date, 792 employees worked in administration, 11.8% more than in the prior year.
Expressed in percentages, close to 58% of Sartorius employees worked in production, around 24% in marketing and sales, 8% in research and development and some 10% in administration at the end of 2018.
For more information on employees, see the Non-Financial Group Declaration starting on page 85.
EMEA Americas Asia| Pacific
5,702 1,264 1,159
5,179 1,182 1,140
0
1,500
3,000
4,500
6,000
5,702 1,264 1,1595,179 1,182 1,140
20182017
Employees by Region
4,706 1,946 682 792
4,297 1,858 638 708
Production Marketing| Sales
Research & Development
Administration
0
1,200
2,400
3,600
4,800
20182017
4,706 1,946 682 7924,297 1,858 638 708
Employees by Function

Group Management Report Net Worth and Financial Position 39
Cash Flow
In the reporting year, Sartorius again increased its net cash flow from operating activities. This figure amounted to €244.5 million relative to €206.5 million a year ago, which equates to growth of 18.4% and essentially reflects the improvement in EBITDA.
Cash outflows from investing activities rose in the reporting period by 21.8% to €242.5 million. These investments were for expansion of production capacities at our site in Yauco, Puerto Rico, and for consolidation and extension of our Group headquarters in Göttingen, Germany.
As Sartorius did not make any acquisitions in the reporting year, net cash flow from investing activities and acquisitions | divestitures likewise stood at -€242.5 million. The prior-year figure of -€555.1 million included acquisition-related expenses of €355.9 million from the purchase of Essen BioScience and Umetrics.
Net cash flow from financing activities, which includes payment of dividends of €46.2 million for fiscal 2017, totaled -€16.7 million. This compares to a high cash inflow of €347.9 million in the previous year, which mainly stems from placement of a note loan for refinancing the acquisitions mentioned above.
Cash Flow Statement Summary
€ in millions 2018 2017
Net cash flow from operating activities 244.5 206.5
Net cash flow from investing activities and acquisitions –242.5 –555.1
Net cash flow from financing activities –16.7 347.9
Cash and cash equivalents 45.2 59.4
Gross debt 1,004.6 955.0
Net debt 959.5 895.5
Consolidated Statement of Financial Position
The balance sheet total of the Sartorius Group was €2,526.9 million as of the end of fiscal 2018 and thus €229.2 million higher than the prior-year level of €2,297.7 million.
This increase is predominantly attributable to higher carrying amounts of property, plant and equipment and growth-driven higher inventories and trade receivables. This is offset by the decrease in other intangible assets because of the contractual modification of the sales alliance in the area of cell culture media with the life science company Lonza.
Non-current assets rose €147.2 million to €1,772.9 million primarily due to continuation of the Group's extensive investment program.
Current assets increased by €81.9 million to €753.9 million compared with the previous year, particularly because of the buildup in working capital.
Key Figures for Working Capital
in days 2018 2017
Days inventory outstanding Inventories | Sales revenue x 360 74 63
Days sales outstanding Trade receivables | Sales revenue x 360 71 72
Days payables outstanding Trade payables | Sales revenue x 360 40 35
Net working capital days
Net working capital1) | Sales revenue x 360 105 99
1) Sum of inventories and trade receivables less the trade payables
Net Worth and Financial Position

40 Group Management Report Net Worth and Financial Position
Driven by strong earnings, equity grew by €166.8 million to €973.4 million in 2018. The equity ratio for the Sartorius Group improved to 38.5% (2017: 35.1%) and thus continued to remain at a comfortable level.
In the reporting year, current and non-current liabilities for the Sartorius Group of €1,553.5 million were higher than the previous year's figure of €1,491.2 million, which was above all due to the buildup in working capital. By contrast, the increase in these liabilities was dampened by a decrease in the other current and non-current financial liabilities, which was attributable to the modification of the Lonza contract mentioned above.
At the end of fiscal 2018, gross debt stood at €1,004.6 million relative to €955.0 million in fiscal 2017 and is comprised of liabilities to banks, including note loans (“Schuldscheindarlehen”), as well as liabilities from finance leases. Net debt, defined as gross debt less cash and cash equivalents, also rose only slightly from €895.5 million a year ago to €959.5 million.
Ratio of Net Debt to Underlying EBITDA
Regarding the Sartorius Group's debt financing capacity, the ratio of net debt to underlying EBITDA is a key financial ratio that is calculated as the quotient of net debt and underlying EBITDA. As of December 31, 2018, it edged down slightly from 2.5 a year earlier to 2.4 despite the company's extensive investment program and was thus within the range of our forecast.
in %
2017 2018 2017 2018
Non-currentassetsCurrentassets
EquityNon-currentliabilitiesCurrentliabilities
0
50
100
70.8 70.235.1 38.5
29.2 29.847.8 42.517.1 19.0
70.8 70.235.1 38.5
29.2 29.847.8 42.517.1 19.0
Balance Sheet Structure
Assets Equity & Liabilities
2014 2015 2016 2017 2018
0.0
1.0
2.0
3.0
4.0
Underlying
Including discontinued operation 2014
1)
2)
1.7 1.3 1.5 2.5 2.41.7 1.3 1.5 2.5 2.4
Ratio of Net Debt to Underlying EBITDA1)2)

Group Management Report Net Worth and Financial Position 41
Financing | Treasury
Our financing strategy aims to ensure our solvency at all times, limit risks associated with financing instruments and optimize our cost of capital. Sartorius covers its financing needs through a combination of operating cash flows and the assumption of short-, medium- and long-term financial liabilities. The major debt financing instruments are shown in the graphic below.
A major pillar in our financing mix is the syndicated credit line of €400 million, whose term will run until December 2021. In addition, Sartorius placed three note loans ("Schuldscheindarlehen") in 2012, 2016 and 2017, respectively, with a year-end volume outstanding of approximately €580 million. Moreover, the company has several long-term loans in place that total around €270 million and are being used in part for the expansion of production capacities. In addition to these loans, Sartorius has various working capital and guaranteed credit lines totaling around €80 million.
The financing instruments mentioned above comprise those with both fixed and variable interest rates.
As of December 31, 2018, the total volume of all available loan capital and guaranteed credit lines amounted to €480 million. Of this amount, Sartorius has drawn on €135 million, leaving available credit of €345 million at the end of 2018. Therefore, this ensures that all Group companies have sufficient funds to finance their business operations and new investments.
In consideration of the note loans ("Schuldscheindarlehen") and the bilateral loans, the Group’s maturity profile is broadly diversified – with a large share of medium- and long-term financing facilities.
As of the 2018 reporting date, Sartorius met its financial covenants, the standard financial key ratios specified in the loan agreements: net debt in proportion to underlying Group EBITDA.
Due to its global business activities, Sartorius is exposed to fluctuations in foreign exchange rates, which are partially hedged by forward contracts. At the end of 2018, foreign exchange contracts amounted to €189 million on a reported basis, with a market value of €1.6 million.
€ in millions
Syndicated credit line
Long term loans
Note loans
Working capital andguaranteed credit lines
~ 400
~ 270
~ 580
~ 80
Main Financing Instruments
As of December 31, 2018, major financing instruments1)
€ in millions
2019 2020 2021 2022 2023 >2024
0
150
300
450
600
13.0 42.0 560.0 180.0 120.0 315.013.0 42.0 560.0 180.0 120.0 315.0
Maturity Profile of the Financing Facilities1)

Filters for sterilization of biopharmaceutical media
Business Development of Bioprocess Solutions
Double-digit growth in sales revenue and earnings
Momentum picked up considerably after moderate performance in 2017
Strong demand for all products categories in all regions
Single-use bag for cell cultivation and storage of biopharmaceuticals
Single-use bioreactor systems for cell cultivation processes of up to 2,000 L
Culture media and buffers for cell cultivation
Products for Biopharmaceutical Manufacture
Fully automated single-use centrifuge for cell harvesting
Single-use-based, multi-parallel bioreactor system for process development
Sales Revenue and Growth 1) by Region 2)
EMEA 464.7 | +12.7%
Asia | Pacific 268.4 | +15.0%
Americas 410.0 | +17.1%
€1,143.1 million
¤ in millions, unless otherwise specified
¤ in millions 2018 2017 Δ Δ in %
Sales revenue 1,143.1 1,010.3 14.8 1)
Order intake 1,233.7 1,091.3 14.9 1)
Underlying EBITDA 326.9 282.4 15.7
as a % of sales 28.6 28.0
Employees as of Dec. 31 5,498 4,980 10.4
Key Figures
1) In constant currencies2) Acc. to customers’ location

Group Management Report Business Development of Bioprocess Solutions 43
Sales Revenue and Order Intake
In 2018, the Bioprocess Solutions Division grew by double digits in sales revenue and earnings. After the previous year's comparably moderate performance that was impacted by a few temporary effects, momentum considerably picked up in the reporting period. The division's sales revenue rose in constant currencies by 14.8% to €1,143.1 million (reported: +13.1%) and was driven by the highly competitive product portfolio and rising demand across all product categories. Thus, the division reached the upper end of the bandwidth of its forecast substantially raised at mid-year to 12% to 15%. The increase in sales was attributable to excellent organic growth, whereas consolidation of the software company Umetrics acquired in April 2017 contributed around half a percentage point of non-organic growth.
Sales Revenue and Order Intake
€ in millions 2018
2017
in %
reported in % wb1)
Sales revenue 1,143.1 1,010.3 13.1 14.8
Order intake 1,233.7 1,091.3 13.0 14.9
The division increased its revenue in all regions. EMEA, the region generating the highest revenue for the division and representing around 41% of its total sales, recorded a gain of 12.7% to €464.7 million against a low prior-year revenue base. In the Americas region, which represented around 36% of revenue, sales rose dynamically, after a year-earlier decline predominantly caused by temporary effects, by 17.1% to €410.0 million. The Asia | Pacific region, which accounted for around 23% of the division's sales, also saw strong growth despite its strong prior-year performance. Here, sales revenue grew by double digits again, by 15.0% to €268.4 million.
Order intake showed positive development in the reporting year. Orders rose more strongly than division sales, and were up 14.9% in constant currencies to €1,233.7 million. On a reported basis, this increase was 13.0%.
Sales by Region
€ in millions 2018
2017
in %
reported in %
cc
EMEA 464.7 413.8 12.3 12.7
Americas 410.0 357.1 14.8 17.1
Asia | Pacific 268.4 239.4 12.1 15.0
Overproportionate Increase in Earnings
In the reporting year, the Bioprocess Solutions Division significantly increased its underlying EBITDA by 15.7% from €282.4 million to €326.9 million, particularly due to economies of scale. The division's respective margin was up year over year by 0.6 percentage points to 28.6%.
Underlying EBITDA and EBITDA Margin
2018 2017
Underlying EBITDA in € millions 326.9 282.4
Underlying EBITDA margin in % 28.6 28.0
In the year under review, the Bioprocess Solutions Division recorded positive extraordinary items of €13.0 million relative to -€21.6 million a year earlier. This significant year-over-year increase is due to income related to the modifications of its contract with Lonza.
€ in millions
2014 2015 2016 2017 2018
615.6 809.2 975.0 1,010.3 1,143.1
0
300
600
900
1,200
615.6 809.2 975.0 1,010.3 1,143.1
Sales Revenue 2014 to 2018

44 Group Management Report Business Development of Bioprocess Solutions
Products and Sales
The Bioprocess Solutions Division sells products and services for the entire added-value chain in biopharmaceutical production and upstream process development. The portfolio includes cell lines, cell culture media, bioreactors, a wide range of products for separation, purification and concentration, and systems for the storage and transport of intermediate and finished biological products.
New Products with a Focus on Automation
As an industry leader in fermentation, during the reporting year Sartorius introduced a fully automated bioreactor system based on single-use technologies. It can be used to portray the development of bioprocesses even on an especially small scale. The ambr 250 system allows customers to execute up to 24 fermentation processes simultaneously during the development and optimization of processes.
In 2018, we launched an automation platform for the process control of single-use bioreactors and various filtration systems, which we developed with Siemens. With this offer, we extend our expertise as a partner for our customers' automation solutions.
In the year under review, Sartorius and the U.S. bioprocess company Repligen reached an agreement that helps customers more quickly establish single-use solutions for continuous bioprocessing. At the core of the collaboration is the idea that through continuous processing, the production of biopharmaceuticals can be intensified and system output increased in order to reduce manufacturing costs.
Modified Relationship with Lonza for Cell-Culture Media Business
Since late 2012, Sartorius has been working on cell culture media with the life science company Lonza. The contract then signed by the two companies gave Sartorius exclusive sales and marketing rights for certain cell culture media and buffers developed and manufactured by Lonza for use in biopharmaceutical manufacturing processes. During the reporting year, Sartorius and Lonza modified the contract by mutual accord. Starting in 2019, Sartorius will retain current and future Lonza media and buffers in its portfolio of products for cell-based development and manufacture; mutual exclusivity, however, no longer applies. The new agreement offers both contractual partners greater leeway with regard to advancements and strategic positioning.
Sales Activities Expanded
The Bioprocess Solutions Division markets its product portfolio directly through its own field sales representatives. Sales activities for key accounts are coordinated and supported by global key account management. During the reporting year, we expanded key account management and added more customers to the corresponding programs.
As part of our strategy to position our product portfolio as a platform, we entered into various agreements during the reporting year. The life science group Abzena plc selected Sartorius as its preferred partner for equipping its integrated contract development and manufacturing organization (CDMO) systems in Bristol, Pennsylvania and San Diego, California. ABL Europe, a subsidiary of the U.S. contract production and laboratory research company ABL Inc., chose Sartorius as its primary supplier of single-use systems.

Group Management Report Business Development of Bioprocess Solutions 45
Product Development
Activities in product development encompass both new and advanced in-house product developments in our own core technologies as well as the integration of new products through collaborations and acquisitions.
Development activities at Sartorius focus on technology areas such as membranes, which are the core component of all types of filter products; various base technologies, such as single-use containers and sensors; and control technologies for processes such as fermentation. Additional focal areas include developments in materials and components such as plastic, elastomers and intelligent polymers; expanded data analysis; and cell line development.
In the reporting year, one emphasis was on developing the next generation of integrity testing applications and a system for virus filtration that can be integrated as a single-use solution, even in stainless steel units.
Another key task in 2018 was the ongoing integration into our systems of software from Umetrics, which Sartorius acquired in 2017. It should become possible in 2019 to use the programs in the downstream process, as well.
In addition, we are investing in the development of applications for regenerative medicine and plan to launch an analytical solution for lentiviruses, which include human immunodeficiency (HI) viruses, on the market in 2019. We also intend to launch an innovative single-use centrifuge and a membrane-based chromatography system on the market.
Our largest site for product development is Göttingen, Germany. Other key sites are Aubagne, France; Guxhagen, Germany; Bangalore, India; Bohemia, New York, United States; Royston, United Kingdom; and Umeå, Sweden.
Simplified diagram
Virus removalfiltration
Viral clearance
PolishingFinal filling
Cryopreservation ConcentrationSterile filtration
Culture media preparation FermentationSeed cultivation Scale-up
Clarification & centrifugation
Upstream
Downstream

46 Group Management Report Business Development of Bioprocess Solutions
Production and Supply Chain Management
The Bioprocess Solutions Division has a very well developed production network around the world. The largest production sites are located in Germany, France and Puerto Rico. This division also manufactures in the United Kingdom, Switzerland, Tunisia, India, the United States and, since 2018, in China.
Expansion of Production Capacity
A new manufacturing facility for filters opened in Göttingen during the reporting year. Sartorius also expanded production capacity at its Yauco site in Puerto Rico where membrane filters and sterile bags are manufactured principally for the U.S. market. For products manufactured in Yauco, the company also began operating a warehouse in Florida, USA, which helps ensure a smooth supply to customers on the U.S. mainland.
A new logistics center, which opened in Aubagne in 2018 and covers 12,000 square meters, provides the capacity that the company will need in the years to come. An additional cleanroom in Aubagne also boosts the site’s production output.
Construction of the development and production center for cell lines in Ulm, Germany is on schedule. With 6,000 square meters of usable floor space, the new center will be about twice as large as the current facility in Laupheim, near Ulm. The company plans to move operations from Laupheim to Ulm in late 2019.
In addition, Sartorius has begun producing sterile single-use bags in Beijing, China, where it plans to manufacture additional products.

Laboratory balances for reliable and convenient weighing processes
The lightest and smallest electronic pipette on the market
Filter membranes for microbiological testing in the lab
Business Development of Lab Products & Services
Growth below initial expectations following strong development in the prior year
Increase in sales revenue dampened by softer demand in Europe
Earnings margin increased due to economies of scale and product mix effects
Products for Laboratories in Quality Assurance and Research
Syringe filters for analytical sample preparation and sterile filtration
Cell screening platform that has already won several awards
Real-time live-cell imaging system for cell analysis
Sales Revenue and Growth 1) by Region 2)
EMEA 193.1 | +2.2%
Asia | Pacific 119.8 | +16.6%
Americas 110.1 | +14.5%
¤ in millions, unless otherwise specified
Key Figures
€423.0 million
¤ in millions 2018 2017 Δ Δ in %
Sales revenue 423.0 394.2 9.1 1)
Order intake 428.8 410.1 6.3 1)
Underlying EBITDA 78.1 70.8 10.4
as a % of sales 18.5 18.0
Employees as of Dec. 31 2,627 2,521 4.2
1) In constant currencies2) Acc. to customers’ location

48 Group Management Report Business Development of Lab Products & Services
Sales Revenue and Order Intake
After a satisfactory first half, development of the Lab Products & Services Division was dampened in the second half as a result of softer demand in Europe. Compared with the division's strong prior-year performance, sales revenue in constant currencies grew robustly by 9.1% (reported: +7.3) to €423.0 million, which was below original expectations, yet within the forecast revised downward upon release of nine-month figures. The division's portfolio expansion into bioanalytics by the acquisition of Essen BioScience at the end of March 2017 delivered around 2.5 percentage points of non-organic growth, as projected.
Sales Revenue and Order Intake
€ in millions 2018
2017
in %
reported in %
cc
Sales revenue 423.0 394.2 7.3 9.1
Order intake 428.8 410.1 4.6 6.3
In EMEA, the region contributing the highest share of revenue of around 46%, the division achieved a slight increase in sales of 2.2% to €193.1 million in the reporting year despite the effects mentioned above and in comparison with the high prior-year revenue base. The Americas region, whose share of revenue rose to around 26%, grew very robustly by 14.5% to €110.1 million due to strong organic performance and the acquisition of Essen BioScience. The Asia | Pacific region, which accounts for a good 28% of business for the Lab Products & Services Division, also grew by double digits, by 16.6% to €119.8 million.
Order intake in the year under review rose on a reported basis by 4.6% in comparison with the very high previous year's level. In constant currencies, order intake was up 6.3% to €428.8 million.
Sales by Region
€ in millions 2018
2017
in %
reported in %
cc
EMEA 193.1 190.7 1.2 2.2
Americas 110.1 98.4 11.9 14.5
Asia | Pacific 119.8 105.2 13.9 16.6
Earnings
The Lab Products & Services Division increased its underlying EBITDA in the reporting period by 10.4% from €70.8 million a year ago to €78.1 million, which was due to economies of scale as well as effects contributed by its acquisition of Essen BioScience. Despite currency headwinds, the division’s corresponding margin improved from 18.0% in the previous year to 18.5%.
Underlying EBITDA and EBITDA Margin
2018 2017
Underlying EBITDA in € millions 78.1 70.8
Underlying EBITDA margin in % 18.5 18.0
The Lab Products & Services Division recorded extraordinary items of -€14.7 million in the reporting year relative to -€13.9 million a year ago.
275.5 305.5 325.3 394.2 423.0
2014 2015 2016 2017 2018
€ in millions
0
100
200
300
400
275.5 305.5 325.3 394.2 423.0
Sales Revenue 2014 to 2018

Group Management Report Business Development of Lab Products & Services 49
Products and Sales
With its products, the Lab Products & Services Division focuses on research laboratories in the pharmaceutical and biopharmaceutical industries as well as academic research institutes.
In the area of bioanalytics, the division offers life-science customers innovative systems for cell analysis. They enable the time-intensive development of new substances to be greatly accelerated through the automation and digitalization of core steps in analysis.
Beyond this, the product range includes a broad array of premium laboratory instruments for sample preparation such as laboratory balances, pipettes and lab water systems, as well as consumables such as filters and microbiological tests. This Sartorius portfolio is tailored to the biopharmaceutical industry, but also to research and quality-assurance labs in the chemicals and food industries.
Range of Services and Test Laboratories in All Regions
The services offered by the Lab Products & Services Division cover the entire life cycle of laboratory products, from device installation and commissioning to verification, calibration, regular maintenance and repair. Our services are not limited to Sartorius instruments; they are offered to a limited degree for devices from other manufacturers as well. This extensive range enables our customers to minimize the number of service providers they use and to reduce complexity and costs.
Our application laboratories in all regions offer customers the opportunity to test Sartorius products, even using their own samples, and to take training courses.
Additional Expansion of Sales Activities
The division sells its products through three channels: laboratory dealers, direct sales and e-business. The dealer sales channel is already well established; direct sales and the digital channels are being expanded continually with an increasing focus on life science customers.
Besides expanding our sales structures we also focus on ongoing improvements in sales efficiency, in part through the creation of synergies between the two divisions. With the acquisition of Essen BioScience in 2017, Sartorius strengthened its bioanalytics expertise in the Lab Products & Service Division and thus improved the company’s positioning among
biopharmaceutical customers and life science research institutes. The Lab Products & Service Division thus also gains access to customers of the Bioprocess Solutions Division, and the latter can naturally likewise tap new sales opportunities in return.
Our bioanalytics products offer strong unique selling points, and our penetration of the laboratory market with our bioanalytics technologies should accelerate in 2019 through greater efficiency in the use of the global Sartorius sales platform and even greater development of direct sales. For this purpose, sales and business operations at Essen BioScience und Intellicyt were merged during the reporting year.
Product Development
The division has extensive technological expertise in the areas of bioanalytics, laboratory instruments and laboratory consumables. The product portfolio is expanded continuously to meet customer requirements through new and advanced developments in our own core technologies as well as the integration of new products through collaborations and acquisitions. Software and hardware advancements in our cell-analysis products create many new evaluation opportunities for our customers. They are the foundation for the development of new tools that can process and present large amounts of data usefully in the appropriate application. We expect that such software solutions will become increasingly important.
In the process, compliance with regulatory requirements is critical for our customers. Product development priorities for Sartorius therefore include data management, connectivity and process automation.
Most of the development for the Lab Products & Services Division is conducted at Group headquarters in Göttingen, but Sartorius also carries out development activities at its sites in Helsinki, Finland and Stonehouse, U.K. as well as Ann Arbor, Michigan and Albuquerque, New Mexico in the United States .
Production and Supply Chain Management
The Lab Products & Services Division operates plants in Germany, China, Finland, the U.K. and the U.S. These plants serve as centers of competence and tend to focus on one product group or a small set of product groups. In 2018, laboratory balances were manufactured in Göttingen and Beijing, China for example, and pipettes in Kajaani, Finland. The sites in Ann Arbor and Albuquerque manufacture bioanalytical systems; microbiological test kits are produced in Stonehouse and most membrane-based products in Göttingen.

50 Group Management Report Assessment of Economic Position
The Sartorius Group’s Business Performance
Sartorius continued on the profitable growth track in fiscal 2018. Its positive development was significantly fueled by the Bioprocess Solutions Division: After the division had grown moderately in the previous year due to a few temporary effects, momentum considerably picked up in the reporting period. Strong demand for equipment and single-use technologies resulted in double-digit gains across all geographies so management raised its sales forecast for the Bioprocess Solutions Division and, therefore, also for the entire Group at mid-year 2018. In view of the sustained positive market environment, management specified its expectations for the division upon release of the company's nine-month figures, and projected that sales revenue would increase at the upper range of the bandwidth communicated. Forecasts for the Sartorius Group remained unchanged.
The Lab Products & Services Division grew profitably, despite its strong prior-year performance, especially in the first half of 2018. In the second half, softer demand in Europe slowed its further expansion. Therefore, the division's forecast for both sales revenue and its underlying earnings margin was revised downward from the guidance released for the company's nine-month figures.
Consolidated sales revenue rose during 2018 by 13.2% in constant currencies to €1,566.0 million, thus achieving the forecast raised considerably at mid-year. The Group's earnings margin, based on underlying EBITDA, also increased significantly to 25.9%, slightly above our expectations.
The ratio of net debt to underlying EBITDA for the last twelve months stood at 2.4 as of December 31, 2018 (2017: 2.5), which was in the range of our adjusted forecast. As a result, the Sartorius Group continues to have significant financing flexibility to further implement its strategy.
In the context of its ambitious growth targets, Sartorius has been making above-average investments in the expansion of its manufacturing capacities, its IT systems, and in the consolidation and extension of its Group headquarters in Göttingen, Germany. Capital expenditures rose accordingly in the reporting year from €209.4 million to €237.8 million.
Projected | Actual Comparison for the Year 2018
Actual Guidance Guidance Guidance Actual
2017 January 2018 July 2018 October 2018 2018
Sartorius Group Sales growth1) 9.3% ~9% –12% ~12% –15% ~12 - 15% 13.2%
Underlying EBITDA margin in % 25.1% ~+0.5%1) ~+0.5%1) ~+0.5%1) 25.9%
Gearing (underlying) 2.5 < 2.5 < 2.5 < 2.5 2.4
CAPEX ratio 14.9% ~15% ~15% ~15% 15.2%
Sartorius Sparten Bioprocess Solutions
Sales growth1) 4.9% ~8% –11% ~12% –15% ~12% –15% (upper end) 14.8%
Underlying EBITDA margin in % 28.0% ~+0.5%1) ~+0.5%1) ~+0.5%1) 28.6%
Lab Products & Services
Sales growth1) 22.0% ~12% –15% ~12% –15% ~8% –10% 9.1%
Underlying EBITDA margin in % 18.0% ~+1%1) ~+1%1) ~+0.5%1) 18.5%
1) In constant currencies 2) Possible acquisitions are not considered
Assessment of Economic Position

Group Management Report Annual Financial Statements of Sartorius AG 51
The retained profit of Sartorius AG is the key reference value for the payment of dividends to our shareholders. Whereas the Sartorius Group financial statements are drawn up according to the International Financial Reporting Standards (IFRS), the annual financial statements for Sartorius AG are prepared by applying the rules and regulations of the German Commercial Code (HGB).
The Management Report of Sartorius AG and the Group Management Report for fiscal 2018 are combined. The HGB annual financial statements of Sartorius AG and the combined management report are published simultaneously in the German Federal Gazette (Bundesanzeiger).
Business Operations, Corporate Strategy, Corporate Management and Oversight, Overview of Business Development
Sartorius AG has exercised only the functions of the strategic, group-leading management holding entity for the Sartorius Group since the beginning of fiscal 2011, and we refer in this connection to the explanatory reports concerning business operations, corporate strategy, corporate management and oversight, as well as the overview of business development, presented on pages 22 et seq. of the combined management report of Sartorius AG and the Group.
Earnings
Sales revenue of Sartorius AG essentially consists of cost transfers to affiliated companies within the Group for management services rendered as well as of the rental of buildings on Sartorius Campus.
Income from investments of €31.5 million relative to €28.7 million a year ago concern dividends paid out for the French subsidiary Sartorius Stedim Biotech S.A.
The total profit received under profit and loss transfer agreements was €10.1 million. Of this amount, €3.5 million was transferred to Sartorius Corporate Administration GmbH (2017: loss of €0.1 million accepted) and €6.6 million to Sartorius Lab Holding GmbH, compared with a loss of €39.9 million that the latter had accepted in 2017.
The loss incurred by Sartorius Lab Holding GmbH essentially resulted from the valuation effects.
Net Worth and Financial Position
The balance sheet total of Sartorius AG rose in the reporting year by €18.0 million to €1,2433 million. This increase was primarily due to the acquisitions executed in the USA and investments made at the Göttingen site.
The balance sheet structure of Sartorius AG reflects its function as the management holding entity for the Sartorius Group. Fixed assets consist essentially of financial assets and, in the reporting year, stood at €520.2 million (2017: €507.4 million). Accordingly, fixed assets accounted for 41.8% of the balance sheet total (2017: 41.4%). The equity ratio for fiscal 2018 was 21.7% relative to 22.5% in 2017.
Annual Financial Statements of Sartorius AG

52 Group Management Report Annual Financial Statements of Sartorius AG
Statement of Profit and Loss of Sartorius AG Based on the total cost accounting method according to Section 275, Subsection 2, of HGB 1
€ in K 2018 2017
1. Sales revenue 10,090 6,930
2. Other operating income 3,596 9,833
3. Employee benefits expense –7,218 –5,611
4. Depreciation and amortization –2,482 –1,116
5. Other operating expenses –9,547 –14,129
6. Income from investments 31,487 28,749
7. Profit received under a profit and loss transfer agreement 10,098 0
8. Loss accepted under a profit and loss transfer agreement 0 –39,979
9. Interest and similar income 8,329 11,252
10. Interest and similar expenses –13,996 –12,964
11. Income tax expense –1,516 –1,000
12. Profit after tax 28,841 –18,035
13. Other taxes –23 –23
14. Net profit for the period | net loss for the period (-) 28,818 –18,058
15. Profit brought forward 107,329 159,923
16. Retained profits incl. net profit for the period 136,147 141,865
1) HGB = German Commercial Code
Balance Sheet of Sartorius AG According to HGB1), € in K
Assets Dec. 31, 2018 Dec. 31, 2017
A. Fixed Assets I. Property, plant and equipment 78,308 63,731
II. Financial assets 441,736 443,622
520,044 507,353
B. Current Assets I. Trade and other receivables 719,922 713,536
II. Cash on hand, deposits in banks 1,500 2,099
721,422 715,635
C. Prepaid Expenses 1,832 2,298
1,243,298 1,225,286
Equity and Liabilities Dec. 31, 2018 Dec. 31, 2017
A. Equity I. Subscribed capital 74,880 74,880
Nominal value of treasury shares –6,492 –6,492
Issued capital 68,388 68,388 II. Capital reserves 54,569 54,065
III. Earnings reserves 10,867 10,867
IV. Retained profits incl. net profit for the period 136,147 141,865
269,971 275,185
B. Provisions 31,201 27,559 C. Liabilities 942,126 922,542 1,243,298 1,225,286
1) HGB = German Commercial Code

Group Management Report Annual Financial Statements of Sartorius AG 53
Proposal for Appropriation of Profits
The Executive Board will submit a proposal to the Annual Shareholders’ Meeting to appropriate the retained profit of €136,147,298.29 reported by Sartorius AG for the year ended December 31, 2018, as follows:
in €
Payment of a dividend of €0.61 per ordinary share 20,869,456.64
Payment of a dividend of €0.62 per preference share 21,189,162.16
Unappropriated profit carried forward 94,088,679.49
136,147,298.29
Research and Development
Detailed information about the research and development activities of the Sartorius Group and of its divisions is given on pages 42 et seq. and 47 et seq.
Employees
Sartorius AG as a holding company does not employ any staff to be disclosed pursuant to Section 285, No. 7, of HGB.
Risks and Opportunities
The opportunities and risks affecting the business development of Sartorius AG as the management holding entity are essentially equivalent to those of the Sartorius Group. Sartorius AG shares in the risks to which its investments and subsidiaries are exposed in proportion to the extent of its investment. Where expedient and feasible, we adopted countermeasures and | or arranged for balance sheet measures during the reporting year to cover all discernible risks within Sartorius AG that had the potential to negatively impact our net worth, financial position and profitability.
A detailed Opportunity and Risk Report for the Sartorius Group is provided on pages 54 to 61; a description of the internal control and risk management system, on pages 67 to 68.
Please refer to page 66 to read the Report on Material Events for Sartorius AG and the Sartorius Group.
Forecast Report
Earnings trends for Sartorius AG depend substantially on the progress of its subsidiaries and, hence, on the Sartorius Group.
The development of the Sartorius Group's business is discussed in the Forecast Report on pages 62 to 65.

54 Group Management Report Opportunity and Risk Report
Principles
Every business activity entails opportunities and risks, which have to be managed. The skill with which this is done is a decisive success factor in determining the future development of a company's shareholder value.
It is not the task of risk management to eliminate risks, but to avoid them as far as possible. Rather, our approach is to intentionally take a certain measure of risk in our business activities in order to be successful in unlocking opportunities. In this endeavor, it is important to keep risks contained within acceptable limits and to control them carefully. Through appropriate guidelines, we ensure that risk assessments are taken into account in the decision-making processes from the very beginning.
At Sartorius, identification and management of opportunities and risks is a cross-functional component of Group management. To this extent, our risk management organization reflects a global functional organization in the two divisions of Bioprocess Solutions and Lab Products & Services. Within this organization, individuals heading a functional area, so-called "risk owners," are each responsible for their own management of opportunities and risks. The cross-divisional Finance & Controlling department is responsible for organizing the respective reporting process, including further developing the Group's risk management system. The risk management process and the Group's guidelines and strategies are currently reviewed and amended. In this context, we have already implemented some changes with regard to refining responsibilities and adapting the risk matrix. Further optimization phases are planned for the next fiscal year.
Managing Opportunities
Our opportunity management centers on the analysis of target markets and sector environments, as well as the assessment of trends, both of which give strong indications as to future business opportunities. The identification of the potential for development in this context is one of the key roles of the relevant managers and initially takes place at the local rather than the central level. Particularly the market-facing functions, such as strategic marketing and product management in each of the two divisions, play a leading role in this respect. The central Business Development unit additionally supports these areas with market monitoring, data analysis and the implementation of strategic projects.
The Group strategy is regularly reviewed and adapted where necessary. As part of strategy reviews, formerly the members of the Group Executive Committee (until Dec. 31, 2018) and now of the Executive Board (since Jan. 1, 2019) regularly meet with the managers having operational responsibility and with the Business Development unit to discuss short-, medium- and long-term opportunity potential for the various business areas. If the opportunities are short-term in nature, they are considered in annual budget planning. Medium- and longer-term opportunities are tracked systematically as part of strategic planning.
As a supplier for the biopharmaceutical and laboratory industries, Sartorius operates in future-oriented and high-growth sectors. The significant opportunities generated by the various market and technology trends are described in detail in the sections entitled "Sector Conditions" and "Outlook for the Sectors" on pages 30 and 63, respectively.
Our assessments rank the Sartorius Group as one of the global market leaders in many subsegments and product areas. We believe the high quality of our products, our strong brand recognition and our established customer relationships give us strong opportunities to stabilize and continue extending our market leadership. The corresponding division strategies and the growth opportunities and initiatives based on them are discussed in the section on the strategy of the Bioprocess Solutions Division, which begins on page 25, and in the section on the strategy of the Lab Products & Services Division, which starts on page 26.
Strict management of processes and costs provides opportunities to further increase our profitability. Key target areas in this respect include continued enhancements of our procurement chain and ongoing efforts to optimize production, which we present on pages 45 and 49.
Risk Management
Organization
The overall responsibility for the maintenance of an effective risk management system ensuring comprehensive and consistent management of all material risks rests with the Executive Board. The Finance & Controlling Department is responsible for coordinating and developing this system and for consolidated risk reporting, while the particular functional areas are responsible for identifying,
Opportunity and Risk Report

Group Management Report Opportunity and Risk Report 55
analyzing and reporting individual risks. This includes the assessment of their potential impact and the decision on taking the appropriate countermeasures.
The Supervisory Board of Sartorius AG monitors the effectiveness of the risk management system, with the preparatory work being performed by the Audit Committee. Furthermore, while carrying out their statutory audit mandate for the annual financial statements and consolidated financial statements, the independent auditors assess whether the early warning system in place is capable of prompt identification of risks that could jeopardize the future of the company. Finally, the Internal Audit Department regularly reviews the risk management process and system.
Insurance
We have taken out insurance policies to cover a wide range of risks where possible and economically advisable. These insurance policies include coverage against product liability, property damage, business interruption, transport, material and pecuniary damages and other risks, and provide comprehensive coverage for legal costs. An independent department working in conjunction with an external insurance broker regularly reviews the nature and extent of our insurance protection and makes any adjustments as necessary.
When choosing our insurers, we particularly consider the credit rating of these entities as potential contractual partners, as well as aim to achieve a high degree of diversity in order to mitigate the related risks.
Risk Management System and Risk Reporting
The risk management system of the Sartorius Group is documented in a Risk Management Handbook that applies throughout the entire Group and includes definitions of the framework, the structural organization, processes, risk reporting and monitoring and controls of the effectiveness of the risk management system. This handbook is based on the internationally recognized COSO (Committee of Sponsoring Organizations of the Treadway Commission) standard. There are also a number of other sources that contain stipulations for handling risks, including the articles of association and rules of procedure of the Group companies and other internal guidelines.
The strong growth of the Group over the past years and the rising demands of customers and regulators meanwhile require that we continue to adapt our guidelines and rules.
The prescribed reporting process in the risk categories subsequently described establishes the rules for the ongoing review of and information on risk situations. If any specific risks are discernible, these are documented with respect to their assessment, probability of occurrence and measures to be taken to eliminate such risks or to mitigate their impact. In addition, as soon as these risks reach defined size criteria, they are reported to the central risk management system. We have an urgent reporting procedure in place to ensure that when a new or emerging significant risk to our net worth, financial position and profitability is identified, the Executive Board of Sartorius AG receives all of the necessary details without undue delay.
To classify risks appropriately, we have defined four main categories: external risks, operating risks, financial risks and compliance risks. Each main category is divided into several subcategories that are described in the following sections.
Moreover, we have defined a so-called risk matrix that categorizes the probability of occurrence and potential impact of risks into classes.
Probability of Occurrence
Remote < 10%
Possible 10% - 50%
Probable 50% – 90%
Very likely > 90%
Significance
in millions of € Impact on
Earnings
Insignificant < 10
Moderate 10 – 50
Significant 50 – 100
Critical > 100
External Risks and Opportunities
General Risks
In principle, our ability to foresee and mitigate the direct and indirect effects of risks entailed by life in general is limited. Such risks include natural catastrophes or force majeure, and their associated damage to commercially significant and critical infrastructure and monetary crises. Yet we proactively take measures, whenever feasible, to ensure that we can respond appropriately and at short notice or are insured against any damage entailed by such risks.

56 Group Management Report Opportunity and Risk Report
Our largest sites in Germany and France do not face any major risks from natural catastrophes, while, for example, our production plant in Puerto Rico is exposed to the risk of severe hurricanes and can be impacted accordingly. We endeavor to counteract this risk by applying the highest possible safety standards to the buildings and explicitly consider this risk in our warehousing and production network strategy.
Furthermore, political developments, such as the referendum on the United Kingdom’s leaving the European Union ("Brexit") or the change in politics in the USA, can have an impact on the Group’s business.
In the U.K., the Group operates several manufacturing and sales entities with a significant business volume. Any development that has a negtive impact on trade between the U.K. and other countries, such as the introduction of customs duties could therefore lead to a corresponding decrease in Group's earnings. The further developments are being closely observed so that measures can be taken to reduce such risks, as necessary.
The tax reform implemented in the United States in 2017 has so far reduced the Group's tax payments; however, other measures in the area of customs tarrifs might have negative impacts (for more on the subject of exchange rates, see the section on Exchange Rate Risks).
Business Cycle Risks
The nature of our different business areas entails that Sartorius is exposed as a whole to a much lesser extent to cyclical business effects. While macroeconomic effects have very little bearing on the progress of the Bioprocess Solutions Division, they can impact part of the business of Lab Products & Services Division, representing a risk to the latter's growth in this context. Our strategy of also aligning the Lab Products & Services Division more strongly to the biopharma sector reduces these risks.
Operating Risks and Opportunities
Our supply chain extends from procurement to production to sales and distribution. Problems within this workflow can have consequential effects, including delays in deliveries. The global supply chain management system we have instituted throughout our production processes to prevent such problems largely minimizes the associated risks. On the other hand, the strongly international alignment of our organization opens up a whole series of opportunities. The various risks and opportunities encountered within our supply chain are explained in detail below.
Procurement Risks and Opportunities
We purchase a wide range of raw materials, components, parts and services from suppliers and are consequently exposed to the risks of unexpected delivery bottlenecks and | or price increases.
Over the past years, we have implemented powerful tools and robust processes in our Materials Management unit to manage risks arising from critical materials. These means enable us to meet the expectations of our customers with respect to assurance of supply and transparency. Important measures in this respect are to maintain security stock and to define alternative suppliers as part of our second supplier policy. In addition, we conduct regular supplier reviews and use early warning systems.
Risks arising from raw material prices play a rather subordinate role in most of our business areas. On the one hand, the proportion of raw materials in our production costs is rather low. On the other hand, we purchase a wide range of materials so that price increases for certain materials do not represent any significant factor.
Opportunities can arise in the area of procurement when our growth enables us to increase order quantities and thereby strengthen our position with our suppliers, such as by receiving price discounts or preferential treatment as a "preferred customer." In addition, we maintain a list of preferred suppliers for key vendors in parallel, with whom we enter into long-term business relationships to our mutual benefit.
Increased globalization of our supplier pool holds the prospect of purchasing on more favorable terms, moreover, and there is also a possibility of our expanded purchasing activities in the international markets leading us to identify suppliers with special product and technical expertise that could eventually enhance our own competitive edge.

Group Management Report Opportunity and Risk Report 57
Production Risks and Opportunities
Based on our core technology expertise, we ourselves manufacture a significant proportion of the products that involve a high level of vertical integration. Examples include filters and laboratory balances. Other products, such as reusable fermenters and bioreactors, are manufactured in collaboration with suppliers so that some of the production risks are transferred to external third parties. Where we manufacture products ourselves, we also bear the associated risks of capacity bottlenecks or overcapacity, production downtimes, excessive reject rates and high levels of tied-up working capital, as well as dependency on individual manufacturing sites.
We contain and reduce these risks by planning production capacities carefully, using versatile machines, semi-automated individual workstations and flextime work schedules, and by continuously monitoring production processes. Moreover, our global manufacturing network enables us to compensate for any capacity bottlenecks by shifting production to other regional plants and to minimize our dependency on individual local manufacturing sites. Furthermore, we have taken out policies for business interruption insurance to compensate for any possible losses due to production downtimes.
We consider it an opportunity that our investments in infrastructure and production resources, among other things, have given us high flexibility in our manufacturing operations and that we are capable of meeting our customers' requirements and regulatory standards with respect to business continuity concepts. In addition, this approach ensures that our individual production sites can concentrate on specific manufacturing technologies, gaining added efficiency as a result. Our international manufacturing network also makes it possible to capitalize on the cost advantages offered by individual sites. Furthermore, continuous improvements in production, such as simplifying processes and increasing levels of automation, help drive manufacturing efficiency even higher.
Sales and Distribution Risks and Opportunities
We use a variety of channels to sell and distribute our products around the world. The potential risks entailed are unexpected changes in the demand structure, growing price pressure and non-compliance with supply agreements concluded with customers. We employ targeted market analyses to identify emerging demand trends in individual segments early on so that we have time to respond appropriately. Our technical innovations and the fact that a large number of our
products are used in validated production processes in the biopharmaceutical industry reduce our exposure to the risk of growing price pressure. We have lowered our risk exposure in the area of logistics in recent years by setting up and using central warehouses to optimize distribution logistics.
Opportunities arise in the area of sales and distribution when the increasing breadth of our product range – in both bioprocess and lab segments – puts us in a position to sell new products to existing customers. Moreover, our business relationships, most of which are established for the long term, and our global presence provide opportunities. Finally, through our acquisitions in cell analysis, we offer customers in the biopharmaceutical industry, a key sector for us, comprehensive product solutions to address needs ranging from research laboratories all the way to production processes.
Sartorius sources its key customers from the pharmaceutical, chemical and food industries and from research and educational institutions of the public sector. These customers are usually relatively large organizations that have been in existence for some time and have strong credit ratings. Most of our business areas have a highly diversified customer base so the Group as a whole is not dependent on individual key accounts to any significant degree.
Competitive Risks and Opportunities
Sartorius has a leading competitive position in most of its markets and competes with mainly larger rivals sharing our status as a globally operating company. As we serve a large number of customers from highly regulated sectors like the pharmaceutical and food industries, and the technology barriers to market entry are rather high, we regard the probability of new competitors emerging within the short term as relatively low. Overall, the competitive environment is therefore very stable.
The fact that many of our products are used in validated processes, especially those in the biopharmaceutical industry, reduces the risk of losing significant market share within a short timeframe. Vice versa, the hurdles for Sartorius to win over customers from our competitors in this industry are also higher.
Changes in the competitive environment, for example, further consolidation in the markets, can pose further risks but also opportunities. Sartorius has been continuously making acquisitions in recent years, thus further strengthening its market position and opening up new potential synergies.

58 Group Management Report Opportunity and Risk Report
Quality Risks and Opportunities
Our customers use Sartorius products in a wide range of critical production processes, including the manufacture of medications, foods and chemicals, and in research and development laboratories. The main risk encountered in these areas is non-compliance with agreed quality criteria, which can lead to losses for our customers, or their customers, for which we may be made liable through compensation claims.
We employ rigorous quality checks and advanced production methods and processes, such as cleanroom technology, to ensure that our products satisfy the most stringent quality standards and high regulatory requirements. These manufacturing methods and processes are subject to constant review under our continual improvement processes, moreover, and are optimized as requirements evolve. Our successful completion of a host of annual audits by customers and implementation of quality systems compliant with ISO 9001 and, where applicable, with ISO 13485 document the high level of quality achieved in Sartorius products and processes. Irrespective of these measures, we also maintain significant insurance coverage against product liability risks. In addition, Sartorius has established a traceability system that enables us to recall an entire production batch immediately, if necessary, and minimize any adverse consequences in the event that a defect or non-conforming item is discovered in a product.
We have also installed a complaints management system to deal with customer requests and to ensure full documentation.
In the sectors we address, quality requirements are growing more and more stringent all the time, not least as a result of increasing requirements on protection of medical patients and on product safety by regulatory authorities. Increasing and changing requirements typically entail the risk that a new prerequisite might be overlooked or be difficult to achieve, but for Sartorius these are opportunities that open up new market prospects. The reason is that challenging quality demands represent a considerable barrier to entry for potential new competitors and provide stimulus for further technical innovation. Moreover, through our work on professional committees, membership in industry associations and standards committees we actively take part in drafting new standards and guidelines, and are able to identify these emerging requirements at an early stage and prepare ourselves accordingly.
Research and Development Risks and Opportunities
We devote a considerable share of our resources to research and development. Potential risks in this area may arise from development results that diverge from market needs and application requirements and from exceeding planned development deadlines. Our advanced project management, intensive R&D controlling and early involvement of our customers in the development process substantially limit these R&D risks. In particular, we ensure that product developments are always reviewed very promptly with regard to how well they meet the customers' needs so products can be adapted accordingly as required. Patents and continuous tracking of the technologies and competitors relevant to us secure our technology and marketing position.
On the other hand, we see a number of opportunities in the area of R&D. Not least, our intensive collaboration with partners that rank among the global market leaders in their own fields opens up the opportunity for us to jointly develop products with an especially high level of innovation. In areas such as membrane technology and plastics technology, sensorics and biopharmaceutical process engineering, as well as measurement technology for laboratory applications, in turn, the expertise of our own specialists puts us at the very forefront of global research and development, presenting us with an opportunity to turn this technical knowledge into potential sales and an even stronger position on the market. The combination of different innovative activities in a separate Corporate Research Department further enables us to identify and benefit from promising developments and emerging trends at universities, startups and at our customers' plants.
Acquisition Risks and Opportunities
By nature, acquisitions provide many opportunities, such as sales growth, extension of our product portfolio and development of new markets. By contrast, the purchase and sale of companies or parts of companies entail a number of typical risks, such as incorrect valuation assumptions or insufficient usage of anticipated synergy effects.
To prevent these risks, we take various measures, such as performing a standard due diligence review of important areas and carrying out comprehensive analysis of the market concerned. In addition, we involve external consultants and experts in the purchase or sales process as required. We especially focus on drafting transaction contracts so that they adequately counter such risks, especially by clauses

Group Management Report Opportunity and Risk Report 59
assuring specific characteristics or by contractual warranty or guarantee provisions, as well as agreements on mechanisms for adjustment of the purchase price and on liability clauses or by taking out the appropriate insurance policies. Immediately after an acquisition has taken place, an integration phase is initiated in which any potential risks can likewise be detected as early as possible and prevented or minimized by taking the appropriate counteractions.
Personnel Risks and Opportunities
As an innovative technology group, Sartorius employs a large percentage of highly qualified people. We endeavor to retain employees in key positions over the long term by offering performance-related remuneration models, targeted continuing professional development options, further attractive social benefits and interesting people development opportunities.
The success of these measures is apparent in the low attrition rates of recent years and the many years of seniority our people accumulate on average. Employment contracts in certain cases contain a clause prohibiting any move to a direct competitor.
We counter the risk of demographic change above all by offering continuous education and training of junior staff. This, in turn, results in opportunities for Sartorius as we can further qualify employees on our own and retain such staff over the long term, thus covering company needs for qualified personnel particularly well.
IT Risks and Opportunities
The business processes of the Sartorius Group are supported by a large number of specific IT applications and systems. Failure or other impairment of the relevant IT systems or (cyber)attacks can considerably disrupt the smooth functioning of the company's business processes and lead to manipulation or to uncontrolled loss or leakage of knowledge or data.
We reduce this risk by continuously investing in the setup and operation of secure IT systems and applications and by continuously further developing and implementing our conceps and security measures based on the International Standard ISO 27001, Information Security Management System. In addition, we incorporate the results of regular audits and vulnerability assessments carried out by external companies specializing in IT security.
Protection of our data against misuse is ensured by specific authorization and authentication policies based on the assignment of rights limited to a "need-to-know" basis for performing certain tasks, and the application of such policies is reviewed at regular intervals.
We protect our systems against failure and data loss by regular data backups, recovery testing based on rolling disaster scenarios and risk-based use of redundant IT infrastructures. Multi-factor authentication solutions enable us to prevent malware threats.
We assume that the threat of cyberattacks is growing worldwide, both in number and intensity. This is why we are continuously extending and strengthening our activities: We are improving our activities by further automating management of authorizations and reducing the potential for data misuse, among other measures. We inform our staff in a targeted way about possible threats and risks, involving our employees by providing them with simple but effective options for decentralized defense and for reporting suspicious emails to IT for checking.
By extending our means for competent and fast response to cyberattacks, including other IT security incidents, we supplement our organizational basis for running the Sartorius system and applications at the lowest possible risk across the entire landscape.
Financial Risks
The global nature of the Sartorius Group’s operations entails that its business activities are inevitably exposed to financial risks. The most significant of these are exchange rate risks, interest rate risks and liquidity risks. Financial risks, most notably exchange rate risks and interest rate risks, are typically balanced by opportunities of approximately equal magnitude.

60 Group Management Report Opportunity and Risk Report
Exchange Rate Risks
As a consequence of its global business activities, the Sartorius Group is exposed to foreign currency fluctuations. Since we generate around two-thirds of consolidated sales revenue in foreign currencies and, of this figure, approximately two-thirds of this total revenue in U.S. dollars or in currencies pegged to the U.S. dollar, we are positively or negatively impacted by currency effects, especially when converting the currencies of balance sheet items and profit or loss items, respectively. Besides the U.S. dollar, other key currencies are the South Korean won, the Chinese renminbi, the Swiss franc and the British pound.
Our global production network enables us to offset the lion’s share of sales revenues received in foreign currency within the Group against costs likewise incurred in foreign currency. For example, we manufacture many of our products for the North American market locally, and are not disadvantaged on the cost side in competing with our U.S. rivals, insofar as this general currency risk is concerned.
In order to evaluate and steer the remaining risk based on the expected net exposure for the next 12 months and take into consideration hedging transactions already executed, we continuously calculate our risk exposure with a cash flow at-risk model. We use this as a basis to decide on whether to use additional derivative financial instruments, especially spot, forward and swap transactions, to adjust for maximum loss. Hedging transactions are set up by one group of staff and monitored by another, separate group.
Interest Rate Risks
We have concluded fixed interest agreements for approximately two-thirds of our outstanding loans so that any changes in the interest rate will not have any positive or negative effects on consolidated earnings . The remaining portion of the financial instruments outstanding on the reporting date is subject to variable interest based on the market rate. We monitor interest rate trends and our interest rate exposure constantly and have the facility to arrange for hedging transactions where we consider it necessary and economically advisable to do so for individual loans. As of December 31,2018, we did not have any interest rate derivatives in our portfolio of financial instruments.
Liquidity Risks
The Sartorius Group actively manages liquidity centrally in order to check and minimize liquidity risks in the individual Group companies, on the one hand, and to optimize liquidity management within the organization, on the other. For this purpose, we use various long- and short-term financial instruments. Regarding the maturities of our loans, we make it a policy to take a risk-averse approach.
For short-term liquidity procurement, we also employ various instruments. In addition to the syndicated credit line that can be accessed and repaid at short notice, we have a number of bilateral credit lines in place on a smaller scale for individual Group companies. Furthermore, we use cash pooling agreements between selected Group companies as the primary tool to manage liquidity within the Group.
Under the present loan agreements, the Group is required to comply with standard financial key ratios, or covenants. In this context, the ratio of net debt to underlying EBITDA may not be greater than 3.25 and 4.00, respectively. There is a basic risk in this connection that the Group might not comply with these covenants, which could lead to a termination of its loan agreements. Based on the current information available, this is considered unlikely.
Compliance Risks
Regulatory Risks
Our role as a supplier to the biopharmaceutical industry and healthcare providers means that Sartorius can also be affected by underlying developments in these areas. The possibility of the regulatory authorities (FDA, EMA) adopting a more restrictive approach to the approval of new medications remains the principal source of risk in this context. Such a move would reduce the number of new pharmaceutical products to be marketed and would consequently downgrade future prospects for Sartorius over the medium term.
Environmental Risks
Sartorius has established an environmental management system that encompasses, and is integrated into, both divisions and covers a whole series of environmentally relevant regulations to minimize environmental risks. This management system has been certified for compliance with ISO 14001 at a number of the company's relatively

Group Management Report Opportunity and Risk Report 61
large manufacturing sites. The respective company organizational units ensure at the particular sites that the laws and regulations relating to environmental protection are observed and that further technical possibilities for limiting environmental risks are identified on an ongoing basis.
The increasing importance of sustainability considerations in many industries represents an opportunity. That is why this aspect is a key element in our supplier selection process for assessing the suitability of a particular company as a business partner. For further information on this group of topics, please refer to our Non-Financial Group Statement.
Litigation Risks
Litigation risks for Sartorius can arise from pending or forthcoming legal disputes or from administrative proceedings. All judicial or extrajudicial disputes are attended to by the company’s own attorneys and legal experts, who engage external lawyers as needed.
At present, there are no pending or discernible legal disputes or proceedings that lack any cost coverage allowances in the statement of financial position or that could have a substantial negative impact on Group.
Assessment of the Overall Risk Situation and Risk Outlook
Where feasible, we adopted countermeasures and | or arranged for balance sheet measures during the reporting year to cover all discernible risks within the Sartorius Group, and those of a defined probability of occurrence, that had the potential to damage our net worth, financial situation and profitability.
For the purposes of this report, we have assessed the probability of occurrence of the risks as shown below and, in the adjacent columns, classify their particular significance for the entire Group.
Risk Category Probability of Occurrence Significance
External risks
General risks Possible Significant
Business cycle risks Possible Moderate
Operating risks
Procurement risks Remote Significant
Production risks Remote Significant
Sales and distribution risks Possible Significant
Competitive risks Remote Moderate
Quality risks Remote Significant
Research and development risks Remote Significant
Acquisition risks Possible Significant
Personnel risks Remote Moderate
IT risks Possible Significant
Financial risks
Exchange rate risks Probable Moderate
Interest rate risks Probable Insignificant
Liquidity risks Remote Moderate
Compliance risks
Regulatory risks Possible Significant
Environmental risks Remote Moderate
Litigation risks Possible Moderate
After thorough analysis of the entire risk situation and according to our current review, there are no discernible risks at present that could jeopardize the continued existence of the Group.
Similarly, based on our current review, there are no discernible risks that could jeopardize the future existence of the Group.

62 Group Management Report Forecast Report
Future Macroeconomic Environment
Following a global economic upturn that lasted for years, the mood among market participants and the economic dynamics are increasingly cooling in important economic regions, such as Europe but also China. The International Monetary Fund (IMF) stated in its most recent outlook from January 2019 that it expects the global economy to grow more slowly this year, with a gain of 3.5%. Risks to global economic growth arise from an escalation of the trade disputes between the United States and China, more restrictive monetary policies at the central banks and greater risk aversion among investors, which could lead to capital drain from emerging countries. In addition, a no-deal exit of the United Kingdom from the European Union would also have negative consequences.
The IMF expects 2.0% growth for the European Union in 2019. The slower momentum is due primarily to a decrease in exports and investments as well as an inflation-induced decrease in household purchasing power. Experts forecast that Germany, the largest economy in Europe, will grow by 1.3% in 2019 (2018: 1.5%); GDP growth in France is expected to remain steady at 1.5% (2018: 1.5%); and a research institute in the United Kingdom anticipates minor growth there of 1.5% (2018: 1.4%).
Currently, economic expansion of 2.5% is estimated in the United States in 2019, compared with 2.5% in 2018. Early indicators such as consumer confidence and purchasing managers' indices are at high levels – indicative of sustained strong growth momentum. Yet fiscal stimulus measures are slowly unwinding this year. The trade dispute with China could negatively affect exports. Risks also arise from the ongoing budget battle and the corresponding shutdown of many public institutions. As a result, overall growth of the U.S. economy is expected to weaken in 2019.
The Asia-Pacific economic area is likely to grow by about 5.4% this year, or slightly less than last year. Growth will be fueled by the expanding economies of India and China. The IMF anticipates growth in India of 7.5% in 2019 (2018: 7.3%). GDP in China will likely increase somewhat less than last year, by 6.2%, at a slightly slower growth rate than in 2018 (2018: 6.6%). Although the trade dispute with the United States has hardly affected growth so far, Chinese exports could soon be hampered as a result – a conclusion also supported by less optimistic data from industry surveys, particularly regarding orders abroad. Tax relief for private households in China, however, could ultimately counteract the impact of lower exports on the economy there. Economic growth in Japan is expected to improve by 0.2 percentage points to 1.1%.
Future Exchange and Interest Rate Trends
Experts predict that base interest rates will remain at a very low level in 2019, as they did last year.
Market forecasts of the euro-U.S. dollar exchange rate for the course of 2019 range between 1.08 euros to the U.S. dollar and 1.31 euros to the U.S. dollar.
Sources: International Monetary Fund, World Economic Outlook,
October 2018; International Monetary Fund, World Economic
Outlook Update, January 2019; M.M. Warburg & Co.,
Kapitalmarktperspektiven, November 2018; Reuters Forex Poll,
December 2018.
3.5 2.0 2.5 5.4
in %
Global EU US Asia|Pacific
0.0
2.0
4.0
6.0
8.0
International Monetary FundSource:
3.5 2.0 2.5 5.4
Forecasted GDP Growth Rates for 2019
Forecast Report

Group Management Report Forecast Report 63
Outlook for the Sectors
Biopharmaceutical Industry Maintains Dynamic Growth
Strong, long-term trends drive growth in the pharmaceutical industry, which is almost entirely independent of business cycles. Market observers estimate growth of the world's pharmaceutical market to reach between 3% and 6% per year during the period up to 2022. Experts forecast that the biopharma segment of the pharmaceutical market, which has been enjoying particularly strong growth for years, will continue to outperform the market. Forecasts anticipate average annual growth of around 8% or 9% through 2022, which would increase market volume from a current €217 billion to €300 billion. The share of biological medications and vaccines in the total revenue generated by the global pharmaceutical market is expected to continue rising.
In coming years, the most dynamic market will likely be China. Although the biopharmaceutical market there is still in its infancy, the country offers especially high growth potential owing to favorable policy conditions, an increasing number of domestic biotech companies and rising demand for advanced biopharmaceuticals. Experts also anticipate considerable growth in the United States and Europe, driven in particular by a growing need for medications for aging societies as well as the rising number of chronically ill and multi-morbid patients. In addition, more and more medications are being approved.
For example, biopharmaceuticals are increasingly being used in yet-to-be fully explored therapeutic areas and in the treatment of rare diseases that have so far been untreatable. Innovative types of therapy for regenerative medicine and new substance classes, such as antibody drug conjugates (ADCs), are increasing the number and range of approved biopharmaceuticals as well as necessitating investments in innovative production technologies.
This relatively young biopharmaceuticals segment is driving sector growth with its high innovative power, as reflected in the strong research and development pipelines. Of the estimated 10,000+ medications in R&D pipelines, over 40% are based on biological manufacturing processes. These include more than 950 biosimilars and 550 biobetters, which are generic versions of biologic agents with better efficacy or fewer side effects than the original compounds.
Biosimilars are contributing increasingly to the growth of the biotechnology market. Governments in emerging and developing countries are fostering the creation of domestic production capacities intended to meet the rising demand for medications, which in turn encourages the founding of new biotech companies. The biosimilars market in industrialized countries is also likely to expand considerably in coming years due to the expiration of patents for high-volume biopharmaceuticals and an increasing number of approved biosimilars. In addition, the regulatory, patent-law and marketing challenges that have slowed progress in the past will likely decrease incrementally. Against this backdrop, current estimates indicate that by 2022, the market could grow by an annual average of 30% and amount to a volume of around €18 billion.
Strong Growth in the Biopharma Market
1) Evaluate Pharma®: World Preview 2018, Outlook to 2024; June 2018; CAGR 2018 to 2024
■ Growing & aging population
■ Increasing access to healthcare
■ Strong R&D pipelines
■ Emerging biosimilars market
~ 9% CAGR1)
■ Conventional | Unclassified ■ Biotechnology
2018 27%
2024 31%

64 Group Management Report Forecast Report
The biopharmaceutical industry must meet a growing demand for medications while also producing an increasing number of approved medications and new types of therapy. For these reasons, industry observers expect that worldwide bioreactor capacities will continue to expand at a similar pace in the years to come. At the same time, the industry faces rising cost pressure. This increases the significance of innovations for boosting flexibility and cost efficiency in biopharmaceutical research and production. In the future, the biopharmaceutical market will shift away from a low number of especially high-volume medications that account for a majority of total production volume towards an expanding range of products for smaller groups of patients. What’s more, technological progress leads to ongoing improvements in the productivity of biopharmaceutical production processes. Manufacturers will therefore, according to the research and consulting institute BioPlan, likely rely increasingly on single-use technologies for the commercial production of many new medications. Particularly in the case of relatively small batches, single-use products and technologies already ensure more cost-effective production than conventional stainless steel systems. To master these challenges, more and more pharmaceutical companies are relying on digitalization and automation as well as innovative software solutions for controlling and optimizing their processes.
Labor Market Remains Stable while Macroeconomic Risks Increase
According to Frost & Sullivan, global demand for laboratory products is likely to continue increasing, with growth of 3.8% in 2019. Budget increases for academic and public research institutes are projected to fuel growth. Risks could arise from a large downturn in global economic growth, because the demand for laboratory products is subject to macroeconomic effects. The U.S. market is expected to generate growth of 3.5%, in part due to the sustained strength of its biopharmaceutical industry and its business-friendly climate. In Europe, experts anticipate growth of 3.3% – although especially in this region, macroeconomic and political uncertainties constitute a risk. As before, market observers expect the highest growth rates in Asian countries, such as China and India, in which the individual labor markets are likely to grow by around 7.2% to 8.7% in 2019.
Sources: IQVIA Institute: 2018 and Beyond: Outlook and Turning
Points, March 2018; Evaluate Pharma: World Preview 2018,
Outlook to 2024, June 2018; BioPlan: 15th Annual Report and
Survey of Biopharmaceutical Manufacturing Capacity and
Production, April 2018; Frost & Sullivan: 2018 Mid-year Report:
Forecast and Analysis of the Global Market for Laboratory
Products, May 2018; BCC Research: Biosimilars: Global Markets,
March 2018

Group Management Report Forecast Report 65
Outlook for 2019
Our forecast for 2019 reflects the sector environment and economic trends, as well as the opportunities and risks outlined in this Annual Report. All forecasted figures are expressed in constant currencies; potential acquisitions are not considered.
Sartorius Group
Sartorius expects continued profitable growth in 2019. Consolidated sales revenue is projected to grow by about 7% to 11%. This forecast reflects the changes to our sales alliance with Lonza for cell culture media. Without these changes, sales growth would probably be some 2 percentage points higher.
Regarding profitability, management forecasts that the company's EBITDA margin will increase to slightly more than 27.0% over the prior-year figure of 25.9%, with the operating gain projected to be about half a percentage point and the remaining increase expected to result from a change in the accounting rules.1)
The ratio of capital expenditures to sales revenue is forecasted to be around 12%, down from the 2018 figure of 15.2%. Key capital expenditures will entail completing expansion of our production facility for single-use products in Puerto Rico and increasing various production capacities in Germany.
Concerning our financial position, management projects that the ratio of net debt to underlying EBITDA will edge down slightly again at the end of 2019. This ratio was at 2.4 at the end of 2018.
Division Forecasts
For the Bioprocess Solutions Division, management expects dynamic growth to continue in 2019. It anticipates that sales revenue will increase by about 8% to 12% over the previous year’s high revenue base, – without considering the modification of our partnership with Lonza, between approximately 11% and 15%. Management forecasts that the division's underlying EBITDA margin will increase to slightly more than 29.5% relative to the prior-year figure 28.6%. The operating gain is expected to account for around half a percentage point.1)
The Lab Products & Services Division is partly dependent on the development of economic cycles . A number of indicators now signal that economic development is slowing in important economic regions. Against this backdrop, management forecasts that sales revenue will increase by about 5% to 9% and the underlying EBITDA margin to slightly more than 20.0% (previous year: 18.5%), with the operating gain accounting for about half a percentage point.1)
A no-deal exit of the U.K. from the E.U. might impact our supply chains in both divisions to a certain degree in spite of the measures already taken to counteract this development. A reliable prognosis concerning possible effects cannot be made at the current time.
1) IFRS 16 required to be applied as of 2019 regulates accounting of leasing contracts. Ultimately, this will result in the disclosure of longer-term lease payments as depreciation and, accordingly, to a somewhat higher EBITDA, among other things. This will not entail any material changes concerning the Group’s relevant net profit or earnings per share

66 Group Management Report Report on Material Events
No material events occurred after the close of fiscal 2018.
Report on Material Events

Group Management Report Description of the Key Features of the Internal Control Management System 67
In relation to the Group Accounting Process (Section 289, Subsection 4, and Section 315, Subsection 4, of the German Commercial Code [HGB])
Definitions and Elements of the Internal Control Management System at the Sartorius Group
The internal control system of Sartorius AG and the Sartorius Group encompasses all of the principles, procedures and measures adopted to ensure the organizational implementation of management decisions. The main priority of the system as it relates to Sartorius AG’s and the Group’s accounting process is to make sure that accounting is effective, cost-efficient and formally correct and that it complies with the pertinent legal provisions.
The internal control system of the Sartorius AG and the Sartorius Group consists of a combination of process-integrated and non-process-integrated monitoring measures. The process-integrated safeguarding measures are subdivided, in turn, into organizational measures and other control measures. The Supervisory Board, specifically in this case the Audit Committee of Sartorius AG, and the Legal Affairs & Compliance unit with its Group Auditing department are involved in the Sartorius Group’s internal control system through their non-process-integrated audit activities. The Audit Committee regularly reviews quarterly reports in addition to the annual financial statements of the parent corporation and the consolidated annual financial statements.
Moreover, to ensure systematic, early identification of risks across the entire Group, a “monitoring system for early group-wide detection of risks with the potential to jeopardize the company’s continued existence” as defined in Section 91, Subsection 2, of the German Stock Corporation Law (AktG) is in place at the Sartorius Group. The efficacy of the early risk detection system, which the Sartorius Group adapts promptly in response to any relevant changes in circumstances, is assessed by the independent auditors of Sartorius AG in accordance with Section 317, Subsection 4, of the German Commercial Code (HGB). An integral component of this system is also operational risk management, which involves activities such as the transfer of risk to insurance companies through coverage for damage and liability risks, and the arrangement of suitable hedges to limit currency and interest rate risks.
Organizational Measures
Accounting processes are strictly organized according to the principle of segregation of functions and comply with the dual-review principle – i.e. review by two individuals. Duties and responsibilities are clearly assigned to different specialized units, companies and regional units. The separation of administrative, executive, settlement and approval functions reduces the possibility of fraud. It also continues to play a significant role in ensuring that any possible errors are discovered early and any potential misconduct is prevented.
The IT applications used in the company's accounting processes have access restrictions, which allow only authorized persons to have controlled access to the accounting system and data. Each access right is assigned specifically according to the tasks to be performed and is subject to annual review. Furthermore, the dual-review principle is also applied in IT process design and the assignment of access rights.
In addition, defined written local and global operating procedures exist, particularly the Group accounting guidelines, which are regularly updated and communicated throughout the Group. The scope of regulation at Group level also extends to the central definition of measurement rules and parameters, among other factors. Additional data for the presentation of external information in the notes to the financial statements and in the Group management report is also prepared and aggregated at Group level.
Continuous coordination of internal accounting during the year for planning and control with external accounting contributes significantly to the quality of Group financial reporting. Reporting itself is done through a standardized management reporting system implemented throughout the Group. This system visualizes all consolidation processes. Internal controls, on the one hand, and the Group auditors of Sartorius AG, on the other hand, ensure that Group financial reports are accurately generated from the consolidated Group companies' financial statements.
Description of the Key Features of the Internal Control Management System

68 Group Management Report Description of the Key Features of the Internal Control Management System
The employees involved in the accounting process meet qualitative standards and receive regular training. The Group Financial Reporting department assists the local units in resolving complex accounting issues, such as measuring fair value, to ensure consistent and accurate reporting in the consolidated financial statements. Complex evaluations, such as actuarial reports and company valuations or purchase price allocations, are assigned to specialized service providers who involve the respectively qualified in-house staff.
Control Measures
Comprehensive control activities are performed by managers and staff to ensure effective and reliable accounting. As a result, this ensures compliance with legal requirements and internal guidelines as well as properly conducted business transactions. Examples of such control activities include the analysis of situations and developments with reference to specific key indicators. Moreover, every month individual reporting units comment on and explain special characteristics or variances using Group-wide standardized analytical tools as the basis. Further specific control activities performed to ensure effective and reliable Group accounting encompass the analysis and, where applicable, correction of the individual financial statements submitted by the Sartorius Group companies. A large number of control mechanisms already incorporated into the consolidated reporting system enable erroneous information to be identified and corrected at Group level. Impairment tests are conducted centrally for the specific cash-generating units, known as CGUs, from the Group's perspective to ensure that consistent, standardized evaluation criteria are applied.
The Legal Affairs & Compliance unit annually draws up a risk-based audit plan and reviews in spot checks whether basic legal requirements and internal group guidelines are complied with for the entire control and risk management system of the Group. This monitoring function covers, in particular, audits of the functional efficiency and effectiveness of defined control measures. The results of these audits are reported directly to the audited units, making it possible to efficiently remedy any identified deficiencies and to further enhance the company’s internal control system (ICS). The Executive Board and the Supervisory Board regularly receive reports on audit activities.
A manual on the company's internal control system that focuses on the business processes of our company further contributes toward strengthening ICS. This manual combines all ICS-relevant requirements that
we consider of material importance into one standardized document and will be supplemented by further appropriate rules as necessary.
Qualifying Statements
The internal control and risk management system enables the complete recording, processing and evaluation of company-related matters on the basis of the organizational, control and monitoring structures defined in the Sartorius Group, as well as their accurate presentation in Group accounting.
In particular, decisions based on personal judgment, erroneous controls, criminal acts and other circumstances cannot be ruled out. They impair the efficacy and reliability of the internal control and risk management system, so that even the application throughout the Group of the systems adopted cannot provide absolute assurance as to the accurate, complete and timely recording of matters in Group accounting.
The statements made relate solely to the subsidiaries included in the consolidated financial statements of Sartorius AG, whose financial and business policies Sartorius AG can directly or indirectly determine in order to obtain benefits from their activities.

Group Management Report Explanatory Report of the Executive Board 69
On the Disclosures Pursuant to Section 289a, Subsection 1, and Section 315a, Subsection 1, of the German Commercial Code (HGB)
Composition of the Issued Capital | Limitations to Voting Rights
Sartorius AG’s capital stock totals €74,880,000. It comprises 74,880,000 no par value individual bearer shares, 37,440,000 of which are ordinary shares and 37,440,000 of which are non-voting preference shares. Each share certificate represents a calculated proportion of €1 of the issued capital.
The rights and obligations associated with these shares are governed by the provisions of the German Stock Corporation Law (Aktiengesetz, abbreviated “AktG”). According to the company’s Articles of Association, preference shares are entitled to a dividend payment that is one euro cent higher per share than that for ordinary shares. However, this entitlement to receive dividends shall be at least two euro cents per preference share. Apart from the cases provided for in Sections 140 and 141 of AktG, preference shares are non-voting. Beyond this, preference shares grant all other rights to which every shareholder is entitled.
The company holds 3,227,776 ordinary shares and 3,263,932 preference shares; these do not entitle the company to any membership rights.
Direct or Indirect Equity Ownership Exceeding 10% of Voting Rights
The community of heirs consisting of Ms. U. Baro, resident of Munich, Germany; Ms. C. Franken, resident of Bovenden, Germany; Mr. A. Franken, resident of Riemerling, Germany; Mr. K.-C. Franken, resident of Göttingen, Germany; and Ms. K. Sartorius-Herbst, resident of Northeim, Germany, holds a voting percentage of approximately 50.1% in Sartorius AG (18,754,160 votes; source: memo on voting rights dated March 20, 2018). The decedent Horst Sartorius ordered that his will be administered by an executor. Dr. Lothar Kappich, resident of Hamburg, Germany, is the appointed executor of Horst Sartorius' estate and exercises the specified voting rights at his own discretion as defined by Section 34, Subsection 1, sentence 1, item no. 6, of the German Securities Trading Act (Wertpapierhandelsgesetz, abbreviated “WpHG”).
According to a memo on voting rights dated April 1, 2011, Bio-Rad Laboratories Inc., 1000 Alfred Nobel Drive, Hercules, California 94547, USA, to which the voting rights of Bio-Rad Laboratories GmbH, Heidemannstr. 164, 80939 Munich, Germany, are ascribed according to Section 34, Subsection 1,
sentence 1, item no. 1, of WpHG, holds 30.01% of the voting rights in Sartorius AG (11,237,196 votes, taking into account the share capital increase from retained earnings that went into effect as of June 1, 2016).
Appointment and Dismissal of Executive Board Members | Amendment to the Articles of Association
Executive Board members of Sartorius AG are nominated and | or appointed as well as removed from office in accordance with Sections 84 et seq. of the German Stock Corporation Law (AktG) and Sections 31 and 33 of the German Codetermination Law (Mitbestimmungsgesetz, abbreviated “MitBestG”). Amendments to Sartorius AG’s Articles of Association are regulated by Sections 133 and 179 of the German Stock Corporation Law (AktG).
Powers of the Executive Board to Issue Shares
Subject to approval by the Supervisory Board, the Executive Board is authorized to sell treasury shares held by the corporation, including selling them through channels other than the stock exchange or by tendering an offer to all shareholders in proportion to their participation in the company, provided that these shares are transferred to third parties as contribution in kind, particularly in the (indirect) acquisition of companies, in return. Under these circumstances, the preemptive rights of the shareholders are excluded.
Material Agreements with Clauses Regulating the Event of a Change of Control
Sartorius AG has material loan agreements containing customary market clauses regulating the possible event of a change of control and giving the participating lenders the option of extraordinary termination of a particular agreement or requesting complete repayment of the respective loan:
These are a syndicated loan agreement concluded in 2014 for a current volume of €400 million and a term until December 2021; two note loans (“Schuldscheindarlehen”), for the amount of €200 million placed in 2016 and 2017, respectively; and a €350 million note loan for a maturity term of five to ten years; two promotional loans, each for €90 million, concluded in 2015 and 2016 for maturity terms of 8 years; and a note loan originally for €100 million and placed in 2012 for a maturity term of five to ten years. The repayment sum outstanding for these material loan agreements stands at approximately €820 million as of December 31, 2018.
Explanatory Report of the Executive Board

70 Group Management Report Report and Declaration on Corporate Governance
Corporate Governance Report
Corporate government aligned with the interests of stakeholders, lawful and responsible conduct, and constructive cooperation between the managerial bodies and within the company in a spirit of mutual trust constitute the essential cornerstones of Sartorius' corporate culture.
The Executive Board and the Supervisory Board report in the following declaration on the key aspects of corporate management and governance pursuant to § 289f of the German Commercial Code ("HGB") and to Article 3.10 of the German Corporate Governance Code.
Declaration of Compliance with Corporate Governance
Declaration of the Executive Board and of the Supervisory Board of Sartorius AG Concerning the Recommendations of the Government Commission on the German Corporate Governance Code Pursuant to § 161 of the German Stock Corporation Law ("Aktiengesetz"):
The Executive Board and the Supervisory Board declare that full compliance will be achieved with the recommendations made by the Government Commission on the German Corporate Governance Code and published by the German Federal Ministry of Justice in the official section of the German Federal Gazette (“Bundesanzeiger”), as amended on February 7, 2017.
Since last year’s Declaration of Compliance was issued, Sartorius AG has complied with the recommendations in the valid version of the Government Commission on the German Corporate Governance Code to the full extent.
Göttingen, December 6, 2018
For the Supervisory Board For the Executive Board
Dr. Lothar Kappich Dr. Joachim Kreuzburg
Further Remarks Concerning Corporate Governance
Sartorius AG is a joint stock corporation founded under German law and headquartered in Göttingen, Germany. With the Annual General Shareholders' Meeting, Supervisory Board and Executive Board, it has three corporate managerial bodies whose tasks and powers are essentially derived from the German Stock Corporation Law ("Aktiengesetz") and the company's Articles of Association.
As owners of the company, the shareholders exercise their rights at its Annual General Shareholders' Meeting, where they decide, in particular, on the appropriation of profits, measures concerning share capital, amendments to the Articles of Association, discharge of the Supervisory Board and the Executive Board and on the appointment of statutory auditors, as well as elect shareholder representatives to the Supervisory Board. The Annual General Shareholders' meeting is held at least once a year within the first eight months of the respective fiscal year.
In managing the company, the Supervisory Board and the Executive Board perform their tasks in a two-tier board structure, each with separate duties and powers.
The Supervisory Board appoints members to the Executive Board, determines their remuneration and monitors and advises the Executive Board in its management of the company. The Supervisory Board is not authorized to take any operational management measures for the business.
The Executive Board is responsible for independently managing the company. In particular, it defines corporate strategy, coordinates and agrees on this approach with the Supervisory Board and implements such corporate strategy. In line with established reporting obligations, the Executive Board regularly informs the Supervisory Board promptly and comprehensively, and requests the latter's approval for certain key business transactions.
Composition and Operating Mode of the Supervisory Board and Its Committees
The Supervisory Board has an equal number of shareholder representatives and employee representatives: six shareowner representatives elected by the Annual General Shareholders' Meeting and six employee representatives elected according to the German Codetermination Law ("Mitbestimmungsgesetz").
Report and Declaration on Corporate Governance

Group Management Report Report and Declaration on Corporate Governance 71
Details on the members of the Supervisory Board and its committees are provided on pages 168 to 169.
The Supervisory Board Chairman coordinates the work within this board, as well as convokes and conducts Supervisory Board meetings. Furthermore, he is the first individual for the Executive Board to contact and externally represents the matters of the Supervisory Board.
The Supervisory Board holds at least two meetings every six months; as a rule, four or more conferences take place, as required. This board has established four committees: the Executive Task Committee, the Audit Committee, the Conciliation Committee and the Nomination Committee. The Executive Task Committee, Audit Committee and Conciliation Committee each have four members and have an equal number of shareholder representatives and employee representatives. The Executive Task Committee and Audit Committee hold regular meetings; the Conciliation Committee and the Nomination Committee meet only as necessary.
The Executive Task Committee carries out preparatory work for resolutions and issues to be addressed in the meetings of the Supervisory Board. It also oversees the preparations for appointments, including the remuneration and employment contract conditions of members of the Executive Board. The Audit Committee supports the Supervisory Board in performing its supervisory function. The chairperson of the Audit Committee is an independent member of the Supervisory Board and has detailed knowledge and extensive experience in the application of accounting standards and internal control systems from his or her own professional practice. The Conciliation Committee meets if the majority required in connection with the appointment of members to the bodies authorized to represent the company for legal purposes is not reached. The Nomination Committee comprises representatives of the shareholders only. Its function is to propose suitable candidates to the Supervisory Board for the latter’s election proposals submitted to the Annual Shareholders’ Meeting. More information on the individual meetings held in the reporting year by the Supervisory Board and its committees is given in the Report of the Supervisory Board on pages 12 to 14.
The Supervisory Board regularly reviews the efficiency of its work based on a questionnaire sent in advance and by a discussion of the results of this questionnaire in a plenary session.
Appointment Objectives for the Supervisory Board; Diversity Policy and Competence Profile
Members of the Supervisory Board of Sartorius AG are to be appointed such that they, on the whole, have the knowledge, skills and experience that are necessary to perform the board's duties properly.
For this purpose and based on the recommendations of the German Corporate Governance Code, the Supervisory Board decided on the following appointment objectives:
– Independent members shall account for no less than 25% of the Supervisory Board.
– The upper age limit of 70 at the time of election should be taken into consideration, but may be waived in exceptional cases, provided there are no reservations about the suitability of the persons proposed and their election is expedient to the interests of the company in spite of the age limit being exceeded.
– As a matter of principle, no member may serve on the Supervisory Board for longer than five elected terms. This limit can be exceeded in individual cases if the Supervisory Board does not have any reservations about the suitability of an individual for serving longer and election of this person is apparently in the interest of the company.
– Care must be taken to ensure that each Supervisory Board member has sufficient time available to perform his or her mandate.
In addition, the Supervisory Board also defined a competence profile for itself. This also covers aspects such as diversity, for example, with regard to professional background and international experience. In view of achieving an appropriate gender balance, the legal quotas of at least 30% women and at least 30% men apply to the Sartorius Supervisory Board. The shareholder representatives and the employee representatives decided to fulfill these legal targets separately.
– In its election proposals for membership, the Supervisory Board is required to consider whether candidates have international experience or an international background within the scope of its current members.
– The Supervisory Board must have members with expertise in one or several of the international markets relevant for Sartorius.

72 Group Management Report Report and Declaration on Corporate Governance
– Members of the Supervisory Board need to bring in knowledge of technologies and products relevant to the Group, as well as of digitalization, and experience in research and development, particularly in the biopharmaceutical industry.
– The Supervisory Board must have members who have expertise in setting up and developing innovative business models, as well as knowledge of corporate strategies.
– Members of the Supervisory Board need to have in-depth knowledge of financial business processes and competences in financial controlling and risk management; at least one independent member of the Supervisory Board must have expert knowledge of accounting or auditing (§ 100, Subsection 5, of AktG).
– Members of the Supervisory Board must have expertise in law, corporate governance and compliance.
– The Supervisory Board needs to have in-depth knowledge and a thorough background in issues concerning human resources.
According to the Supervisory's self-assessment, the members on its board meet the diversity and competency requirements. The appointment objectives previously mentioned regarding independence and the age and membership limits are also met:
Concerning the criterion of independence, this is met by all members of the Supervisory Board with one exception: the executor of Horst Sartorius' estate. This individual is Dr. Lothar Kappich, who is concurrently Chairman of the Supervisory Board. In the opinion of the Supervisory Board, an appointment as an employee representative to this board or an existing employment contract with the company alone does not preclude the independence of this member because an employee is protected by the laws in force in performing his or her duties on the Supervisory Board.
None of the current Supervisory Board members was over the age of 70 at the time of his or her election and none has served for more than five elected terms.
In view of achieving an equal balance of gender, the Supervisory Board meets the quota of 30% set for the underrepresented gender. Seven men total (around 58%) are members of this board, of whom four are shareholder representatives and three employee representatives. In addition, five women (around 42%) are members of this board, among them two representatives of the share owners and three
representatives of the employees. As a result, the gender quota requirements are met on both sides of Supervisory Board representation and on the full Supervisory Board itself.
The proposal of the Supervisory Board submitted to the Annual General Shareholders' Meeting for election of shareholder representatives to this board was based on the target quotas stated above.
To facilitate comparison of the appointment objectives, brief resumés of the Supervisory Board members are available on the Sartorius website.
Composition and Operating Mode of the Executive Board
The Executive Board of Sartorius AG manages the company under its own responsibility, with the goal of increasing the company's sustainable value. It develops the company's strategy, coordinates it with the Supervisory Board and ensures implementation of this strategy. Beyond that, the rules of procedure for the Executive Board define the legal transactions requiring approval by the Supervisory Board in order for such transactions to be effected. The Executive Board is responsible for compliance with all provisions of the law and the company's internal policies, as well as for appropriate risk management.
Decision-making by the Executive Board is done at its regular meetings, which are convoked and conducted by the Chairman. If required, further specialists and mangers are invited to these meetings to provide advice and, additionally until the end of 2018, the members of the Group Executive Committee were usually invited to serve in this capacity.
The Executive Board members are jointly responsible as a collegiate body for matters of special significance. As for the board's remaining responsibilities, each member independently manages the area assigned to him or her according to the plan for allocation of areas of responsibilities, and is required to notify the Chairman of all material transactions and events.

Group Management Report Report and Declaration on Corporate Governance 73
Composition of the Executive Board, Diversity and Competency Requirements
In the opinion of the Supervisory Board, the basic qualification criteria for appointments to positions on the Executive Board are professional qualifications for heading each particular area of responsibility, a proven track record in the individual's career path and convincing managerial skills. In addition, the Supervisory Board also considers the aspect of diversity in its appointment decisions. Therefore, the Supervisory Board strives to appoint people with complementary profiles, professional and personal life experiences and in different age brackets to the Executive Board. Moreover, the latter board is required to have broad international experience.
Pursuant to the German Act on Equal Participation of Women and Men in Executive Positions in the Private and the Public Sectors, the Supervisory Board defined a target quota for the Executive Board that is defined in the following section.
Until 2018, the Sartorius Executive Board was a committee that consisted of three members and since January 1, 2019, has been a committee of four members. It is therefore relatively small so establishment of a rigid gender quota can be problematic. At present, the Executive Board of Sartorius AG has four male members. For the current deadline by June 30, 2022, the Supervisory Board decided on the target of appointing at least one woman to the Executive Board.
Also regarding the appointment of women to the Executive Board of Sartorius AG, the Supervisory Board supports the activities of the Executive Board to further increase the percentage of female executives at the first two management levels in the company. The Executive Task Committee and the full Supervisory Board regularly receive reports on the development of the proportions of women in senior-level management positions.
First and Second Management Levels Below the Executive Board
Disclosures Concerning the German Act on Equal Participation of Women and Men
The percentage of women at the first two management levels below the Executive Board has considerably increased on the whole and is already at a comparably high level.
For the next deadline by June 30, 2022, the Executive Board resolved in 2017 to increase the proportion of women at both levels of management below this board to around 30%. Currently, the proportion of women at the first management level is around 28%; that at the second level, 26%. As a result, these percentages are within the attainable range of the target quotas set. As a general observation, individual personnel changes may lead to considerable variations in the quota of women beause of the relatively low number of managers at the first level. Moreover, in the past, consolidation of the companies acquired usually diluted the percentages of women to a slight degree. This cannot be ruled out in the future either.
Further Corporate Governance Practices
Risk Management
Conscientious management of commercial risks is a key principle of good corporate governance. Sartorius AG and the Group have at their disposal enterprise-wide and company-specific reporting and control systems designed to facilitate the recording, assessment and management of commercial risks. These systems are developed and adapted continuously as conditions evolve. The Executive Board informs the Supervisory Board regularly of existing risks and their development. The Audit Committee is concerned, in particular, with monitoring of the following: the accounting process including reporting; the efficacy of the internal control system; risk management and the internal auditing system; compliance; and the independent statutory audit. Details on risk management are presented in the Opportunity and Risk Report.
Transparency
Sartorius AG places great importance on disclosing consistent and complete information promptly. Information about the economic position of the Group and new developments is consequently released regularly, without delay, as it becomes known in order to inform participants in the capital market and interested members of the public at large. The annual report, first-half financial report and quarterly reports are published within the timeframes specified for this purpose. Current developments and material events are publicized as press releases and, where appropriate, ad hoc announcements. This information is usually made available in German and English simultaneously and published via suitable media and on the internet.

74 Group Management Report Report and Declaration on Corporate Governance
The chief recurring events and publications, such as the Annual General Shareholders’ Meeting, the annual report and the interim reports, are listed on a financial calendar that may be viewed at any time on the Group website.
Share Trading Activities of Supervisory and Executive Board Members
We did not receive any reports, under the applicable mandatory disclosure requirements, of any purchases or sales of shares in Sartorius AG or related financial instruments made by the members of the Executive Board and the Supervisory Board or other persons with management responsibilities or their related parties.
Supervisory Board Chairman Dr. Lothar Kappich in his capacity as executor of the estate of Horst Sartorius holds approximately 50.1% of the ordinary shares issued by the company, but otherwise no member of the Executive Board or Supervisory Board has any holding of shares or financial instruments subject to the mandatory reporting requirements that directly or indirectly exceeds 1% of the shares issued by the company.
Considering the share capital increase, by use of retained earnings, that became effective June 1, 2016, the CEO and Chairman of the Executive Board Dr. Joachim Kreuzburg holds 100,000 ordinary shares and 100,000 preference shares in the company. These were transferred to him based on a corresponding agreement arising from his employment contract of December 18, 2015, and are subject to a minimum holding period of four years. For further information on this transfer, please see the Remuneration Report on pp. 75 et seq.
Accounting and Independent Statutory Audit
The consolidated financial statements and the Group Management Report, as well as the consolidated interim financial statements and reports, are prepared in accordance with the International Financial Reporting Standards (IFRS) as they are to be applied within the EU, and according to the commercial law regulations to be applied under Section 315a, Subsection 1, of the German Commercial Code, HGB. The annual financial statements of Sartorius AG are prepared in accordance with German commercial law, HGB. The consolidated financial statements and the annual financial statements are prepared by the Executive Board, audited by the independent auditors elected by the Annual General Shareholders’ Meeting and approved by the Supervisory Board.
It has been agreed with the independent auditors that they will notify the Supervisory Board directly of any potential disqualification or bias issues and any material findings and incidents identified during the audit. This also encompasses the corporate governance reporting duties pursuant to § 161 of the German Stock Corporation Law (Aktiengesetz).
Basic Principles of Our Compliance Management System | Code of Conduct
With its compliance management system that is valid worldwide, Sartorius ensures that the members of its individual boards, executives and employees comply with all legal regulations and codes, and perform their activities in accordance with the company’s internal rules and guidelines. Targeted training and awareness-raising prevent any misconduct, as well as economic damage and loss of image.
Sartorius makes every effort to ensure optimal risk management by using a combination of approaches: a preventive compliance approach designed to proactively stop any potential breaches before they occur and a repressive compliance approach intended to continuously monitor compliance with the company's rules. These processes are closely intermeshed, creating a standardized compliance management system that aims to offer the best possible protection against potential violations of rules and regulations. Sartorius has developed a Code of Conduct as a preventive component of its compliance management system and has committed to an Anti-Corruption Code. An internal system is available for reporting any suspicious circumstances involving potential compliance violations.
Further information is given in the Sustainability Report on pp. 67 et seq. and on the company’s internet website at www.sartorius.com.
The Supervisory Board | The Executive Board

Group Management Report Remuneration Report 75
1. Main Features of the Remuneration Plan for the Executive Board
General Information
The full Supervisory Board is responsible for establishing the remuneration paid to members of the Executive Board of Sartorius AG. The total value of the remuneration of an Executive Board member reflects the scope of the responsibilities of the Executive Board member concerned, the Executive Board member’s personal performance, the company’s economic situation and sustainable progress. In addition, the extent to which this amount of remuneration is typical is considered, taking into account peer companies and the remuneration structure in place in other areas of the company and in similar companies.
Remuneration is comprised of both fixed non-performance-based components and of variable performance-based components, and is reviewed regularly to ensure that it remains appropriate. The variable performance-based remuneration components consist of those to be paid annually and of multi-year components intended to have a long-term incentive. Fixed non-performance-based remuneration is paid in the year in which it is granted. For 100% target achievement, the variable annual and long-term performance-based components generally represent half of total remuneration, which excludes pension commitments under a defined benefit plan as well as fringe benefits.
Variable Performance-Based Remuneration
The portion of the variable performance-based remuneration that is paid annually is based on the following weighted components: sales revenue | order intake, underlying EBITDA and the ratio of net debt to EBITDA. Minimum target achievement is required for these components. The amount to be paid out depends on the degree to which the target is achieved, which the Supervisory Board defines by setting each individual subordinate target. A cap is provided for each variable component to be paid out. Variable performance-based remuneration is calculated upon approval of the company’s annual financial statements for the respective fiscal year and not settled and paid out until the following fiscal year.
Multi-year Components as Long-term Incentives
Weighted components determined by multi-year assessment depend on the development of consolidated net profit in a multi-year period, on the one hand, and on the development of the company’s share prices, on the other hand. Multi-year components providing a long-term incentive are based on a three-year average of consolidated net profit and on a four-year average of share prices, respectively. These components are paid out after two fiscal years for net profit and at the earliest after three fiscal years for share prices.
a) Consolidated Net Profit
For this subordinate target, the basis for assessment is the consolidated net profit after non-controlling interest excluding amortization (impairment of the value of intangible assets due to business combinations pursuant to IFRS 3). Target achievement for assessing annual variable remuneration in the particular year under review is based on the average taken over a period of three fiscal years, beginning with the particular year under review. To smooth the amounts to be paid out, a partial payment amounting to 50% of the target achievement for the first fiscal year of each respective average period will be effected. Any overpayments as a result of these partial payments will be offset against other remuneration components once the total target achievement has been determined after the third fiscal year of an average period. A cap for this component is provided as well.
b) Phantom Stock Plan
Through the issue of shadow shares, called phantom stock, Executive Board members are treated as if they were owners of a certain number of shares in Sartorius AG, without, however, being entitled to receive dividends. The development of the value of this phantom stock is linked with the development of the Sartorius share; both increases and decreases in the share price are taken into account. Later, the value of this phantom stock is assessed based on the share price at the time, and its equivalent is paid out, provided that the associated conditions are met. Phantom stock cannot be traded and does not entail any share subscription rights.
According to the Sartorius phantom stock plan, each Executive Board member is credited at the beginning of every year with phantom stock units valued at an
Remuneration Report

76 Group Management Report Remuneration Report
agreed monetary sum. The value of this phantom stock can be paid out only as an entire annual tranche. Payment can be requested, at the earliest, after a period of four years and no later than after eight years.
An Executive Board member is entitled to receive payment for phantom stock units only if the share price at the time of such payment request has appreciated at least 7.5% per year relative to the time the phantom stock was assigned or if the share price outperformed the TecDAX as a comparative index. The phantom stock plan rules out subsequent changes to the parameters used for comparative stock valuation. The amount to be paid is capped at a maximum of 2.5 times the share price at the time the phantom stock was assigned, based in each case on the actual annual tranche concerned.
Assignment of this phantom stock and later payment of its monetary equivalent depend on the mean value calculated from the average prices of both classes of Sartorius AG share, up to the year 2015, and as of the year 2016, on the mean value calculated from the average prices of the preference share, with said prices quoted in the closing auction of Xetra trading on the Frankfurt Stock Exchange over the last 20 days of trading of the previous year or over the last 20 days of trading prior to submission of a payment request. This serves to compensate for any short-term fluctuations in the share prices.
Payment for phantom stock is blocked for the four weeks preceding the scheduled publication date of quarterly and preliminary year-end results and for 20 days of trading on the stock exchange following the actual publication of quarterly and preliminary year-end results. These blackout periods are intended to prevent Executive Board members' profiting from their insider knowledge.
Pension Commitments
According to the company’s remuneration policy, Executive Board members of Sartorius AG receive performance-related benefit commitments under a defined benefit plan when reappointed for the first time. In addition to including a basic pension, these commitments provide for the Executive Board member to make his own contribution from his variable earnings and for the company to match this contribution by a bonus amount. An Executive Board member may choose to receive such defined benefits in the form of a retirement pension for old age or as a one-time payment to cover the member’s retirement pension for old age and invalidity as well as in the
form of survivor’s benefits for the surviving spouse and children of the decedent.
Beyond such commitments, an Executive Board member is additionally entitled under a former company pension scheme to receive performance-based retirement benefits based on the salary of a German federal civil servant classified as grade 10 of salary class B for ministry officials according to the Federal Civil Service Remuneration Act (Bundesbesoldungsgesetz). Such benefits are paid in the form of a retirement pension or old age and invalidity as well as in the form of survivors' benefits for the surviving spouse and children of the decedent.
After a member has turned 65, this shall be considered the regular age limit at which this member shall auto-matically be entitled to receive all such benefits.
Other Remuneration Components
The remuneration system provides that the Supervisory Board of Sartorius AG at its discretion may grant an Executive Board member special compensation based on that member's exceptional performance.
Early Termination of Executive Board Duties
In the event of any early termination of Executive Board duties, the employment contracts of Executive Board members provide for severance to be capped to a maximum of two annual salaries.
Non-Competition Clause
The employment contracts provide for a post-contractual non-competition clause for a duration of two years upon termination of employment with the company. In the event that this non-competition clause is not waived or is nullified, half of the remuneration last paid shall be granted for the duration of the non-competition period.
Fringe Benefits
Beyond the remuneration components stated above, the members of the Executive Board are each entitled to use a company car, reclaim expenses incurred on business travel and to be covered by accident insurance and D&O insurance as fringe benefits. D&O insurance provides for the application of a deductible or excess in the amount required by law.

Group Management Report Remuneration Report 77
Share-Based Payment
As a rule, the remuneration policy for Executive Board members does not provide for the transfer of Sartorius AG shares as compensation for members. An exception to this policy rule was made in December 2014 for Dr. Kreuzburg, who was granted entitlement to receive share-based remuneration due to the third extension of his appointment as a member of the Executive Board and as its Chairman and CEO; please refer to Section 3 in this chapter.
2. Remuneration of the Executive Board Members in the Reporting Year
In 2018, the total remuneration for active service provided by all Executive Board members totaled €5,703 K relative to €3,492 K in 2017. Of this aggregate total, €2,022 K accounted for non-performance-based components as “fixed remuneration” (2017: €1,836 K) and €1,719 K for variable performance-based components and multi-year components with a long-term incentive (2017: €1,452 K). Furthermore, as part of the pension commitments to the Executive Board members, the pension service cost totaling €393 K in the reporting year was expensed, following on €430 K in the prior year.
Total Remuneration of the Executive Board Pursuant to § 314, Subsec. 1, No. 6, of the German Commercial Code (HGB)
Executive Board
(total) Dr. Joachim
Kreuzburg
Rainer Lehmann (as of March 1,
2017)
Reinhard Vogt (until Dec. 31,
2018)
€ in K 2018 2017 2018 2017 2018 2017 2018 2017
Fixed remuneration 1,815 1,685 863 832 414 333 538 520
Fringe benefits1) 207 151 15 15 174 117 18 19
Fixed remuneration 2,022 1,836 878 847 588 450 556 539 Variable performance-based remuneration (1 year)2) 957 735 455 363 218 145 284 227
Variable multi-year components w/ long-term incentive Consolidated net profit (3 years)3) 307 296 189 184 0 0 118 112
Phantom stock plan (4-8 years)4) 455 421 216 208 104 83 135 130
1,719 1,452 860 755 322 228 537 469 #No_translation_Zugesagte Leistungen nach regulärer Beendigung# 1,962 0 0 0 0 0 1,962 0 Remuneration former Excecutive Board Members 0 204 Total remuneration 5,703 3,492 1,738 1,602 910 678 3,055 1,008
1) The amounts contributed to D&O insurance totaling €159 K (2017: €161 K) are not included as these refer to the executive bodies of all companies of the Sartorius Group and are not allocated to the individual insurees.
2) Amount corresponds to actual target achievement 3) Amount corresponds to actual target achievement of the plan in which a fiscal year ended; i.e., for 2017, consolidated net profits for
2015 –2017 (2016: consolidated net profits for 2015–2017) 4) Fair value at the time granted
As part of the remuneration component based on the consolidated net profit of three consecutive fiscal years, each Executive Board member receives a partial compensation payment of 50% of his respective target achievement for the first fiscal year under review. Once the total target achievement has been determined after the third fiscal year, final payment is then effected by deducting the particular partial payment already made. The amounts of the partial payments made in total at the end of the reporting year are shown as follows:
2018 ¤ in K
2017 € in K
Balance as of Jan. 1 of a fiscal year 391 387
Partial payments deducted –222 –165
Partial payments effected 185 169
Balance as of Dec. 31 of a fiscal year 354 391

78 Group Management Report Remuneration Report
3. Disclosures on Share-Based Payments
For multi-year components with a long-term incentive, the phantom stock plan must be generally classified as share-based payment just as is the share-based payment agreed to be granted to Dr. Kreuzburg in December 2014 in connection with the third extension of his appointment as a member of the Executive Board and its Chairman and CEO. Since December 18, 2015, Dr. Kreuzburg has held 100,000 ordinary shares and 100,000 preference shares. These shares transferred to him are subject to a holding period that will end on November 10, 2019. Should Dr. Kreuzburg leave the company prior to November 11, 2019, at his own request, he shall be required to transfer half of the shares granted to him back to the company.
The amount resulting since December 16, 2014, for the shares granted are to be spread as an employee benefits expense over the full vesting period and recognized as such in profit or loss. In fiscal 2018, an amount of €504 K was accordingly recognized as an employee benefits expense resulting from the grant of shares.
The employee benefits expense recognized in profit or loss in connection with the share-based payments is summarized as follows:
2018 ¤ in K
2017 € in K
Executive Board (total) Share-based payments 1,544 1,607 Phantom stock units 1,040 366
Shares granted 504 1,241
2018 ¤ in K
2017 € in K
Dr. Joachim Kreuzburg Share-based payments 995 1,404 Phantom stock units 491 163
Shares granted 504 1,241
2018 ¤ in K
2017 € in K
Rainer Lehmann (as of March 1, 2017) Share-based payments 162 65 Phantom stock units 162 65
Shares granted 0 0
2018 ¤ in K
2017 € in K
Jörg Pfirrmann (until Feb. 28, 2017) Share-based payments 80 36 Phantom stock units 80 36
Shares granted 0 0
2018 ¤ in K
2017 € in K
Reinhard Vogt (until Dec. 31, 2018) Share-based payments 307 102 Phantom stock units 307 102
Shares granted 0 0

Group Management Report Remuneration Report 79
Disclosure of Phantom Stock Units
Number of phantom
stock units
Price on assignment
in €
Fair value when
granted on Jan. 1 of
the particular
year € in K
Fair value at year-end on
Dec. 31, 2017
€ in K
Fair value at year-
end on Dec.
31, 2018 ¤ in K
Paid in fiscal 2018
€ in K
Change in value in fiscal
2018 € in K
Status
Dr. Joachim Kreuzburg Tranche for fiscal 2014 8,032 21.01 169 422 0 422 0 Paid out in 2018
Tranche for fiscal 2015 7,360 24.70 182 454 454 0 0 Not exercisable
Tranche for fiscal 2016 3,484 57.41 200 225 359 0 134 Not exercisable
Tranche for fiscal 2017 2,950 70.51 208 163 281 0 118 Not exercisable
Sum of the tranches from the previous years 21,826 759 1,264 1,094 422 252 Tranche for fiscal 2018 2,685 80.32 216 0 239 0 23 Not exercisable
Total sum of tranches 24,511 975 1,264 1,333 422 275
Reiner Lehmann Tranche for fiscal 2017 1,182 70.51 83 65 112 0 47 Not exercisable
Sum of the tranches from the previous years 1,182 83 65 112 0 47
Tranche for fiscal 2018 1,289 80.32 104 0 115 0 11 Not exercisable
Total sum of tranches 2,471 187 65 227 0 58
Jörg Pfirrmann Tranche for fiscal 2014 3,452 21.01 73 181 0 181 0 Paid out in 2018
Tranche for fiscal 2015 3,140 24.70 78 194 194 0 0 Not exercisable
Tranche for fiscal 2016 1,416 57.41 81 91 146 0 55 Not exercisable
Tranche for fiscal 2017 644 70.51 45 36 61 0 25 Not exercisable
Sum of the tranches from the previous years 8,652 277 502 401 181 80
Reinhard Vogt Tranche for fiscal 2014 4,880 21.01 103 256 0 256 0 Paid out in 2018
Tranche for fiscal 2015 4,456 24.70 110 275 275 0 0 Not exercisable
Tranche for fiscal 2016 2,176 57.41 125 140 224 0 84 Not exercisable
Tranche for fiscal 2017 1,844 70.51 130 102 176 0 74 Not exercisable
Sum of the tranches from the previous years 13,356 468 773 675 256 158
Tranche for fiscal 2018 1,673 80.32 134 0 149 0 15 Not exercisable
Total sum of tranches 15,029 602 773 824 256 173
The number of phantom stock units granted as well as the particular grant prices were adjusted to the proportions following the stock split executed in 2016.

80 Group Management Report Remuneration Report
4. Pension Commitments
The retirement plan for Executive Board members provides for an old age and disability pension for Dr. Kreuzburg and for an old age pension for Messrs. Lehmann and Vogt. To cover such pensions, a benefit contribution amounting to one percent of each pensionable income and of each pensionable bonus is paid into a reinsurance policy. The benefit contribution for Dr. Kreuzburg is 10%; for Mr. Vogt, 14% of his pensionable income; and for Mr. Lehmann, 9%, which equals their respective fixed remuneration.
If an Executive Board member elects to convert a portion of his salary to accrued retirement benefits by paying his own contribution into the reinsurance policy, Sartorius matches this by paying a corresponding additional benefit contribution on the reporting date. This amount matched by the company is 5% of the pensionable bonus earned by Dr. Kreuzburg and 7% of the same earned by Mr. Vogt. This pensionable bonus is comprised of their respective one-year variable remuneration and of their respective multi-year remuneration based on the consolidated net profit. The amount of the retirement benefits that Sartorius will pay later to each Executive Board member
and his surviving dependents is dependent on the maturity payment of the insurance policy accrued up to the maturity date, including the policyholders' bonuses earned by the insurance company. An Executive Board member does not acquire any rights to the reinsurance policy; Sartorius shall be solely vested with such rights at all times.
Furthermore, an earlier pension agreement granted to Dr. Kreuzburg provides that he will receive a monthly pension of 70% of the basic salary of a German federal civil servant classified as grade 10 of salary class B for ministry officials according to the Federal Civil Service Remuneration Act (Bundesbesoldungsgesetz) in the respective version applicable. With each full year of service, 5% of his full pension is vested until after his full pension will have been reached after 20 years. Arrangements for pensions of surviving dependents basically provide for a widow's pension of 60% and an orphan's pension for each child amounting to 20% of his pension.
The projected pension payments, the present value of pension obligations and service cost are shown in the following table:
Projected pension
payment Present value of the obligation (IFRS) Service cost (IFRS)
€ in K p.a. Dec. 31, 2018 Dec. 31, 2017 2018 2017
Dr. Joachim Kreuzburg 243 3,385 2,989 257 258
Rainer Lehmann 27 62 27 37 30
Jörg Pfirrmann 46 477 442 0 43
Reinhard Vogt 39 743 604 99 99
355 4,667 4,062 393 430

Group Management Report Remuneration Report 81
5. Disclosures Required by the German Corporate Governance Code (DCGK)
The following table shows the benefits granted for the year 2018, including the fringe benefits and the attainable maximum and minimum remuneration for the variable remuneration components in line with the requirements of the DCGK of lit. 4.2.5 of February 2017:
Dr. Joachim Kreuzburg Rainer Lehmann
(as of March 1, 2017) Jörg Pfirrmann
(until Feb. 28, 2017) Reinhard Vogt
(until Dec. 31, 2018)
Benefits granted € in K
2018 (min)
2018 (max)
2018 2017 2018 (min)
2018 (max)
2018 2017 2018 (min)
2018 (max)
2018 2017 2018 (min)
2018 (max)
2018 2017
Fixed remuneration 863 863 863 832 414 414 414 333 0 0 0 54 538 538 538 520
Fringe benefits 15 15 15 15 174 174 174 117 0 0 0 2 18 18 18 19
Total non-performance-based remuneration 878 878 878 847 588 588 588 450 0 0 0 56 556 556 556 539 Variable performance-based remuneration (1 year) 0 518 432 416 0 248 207 167 0 0 0 27 0 323 269 260
Variable multi-year components w/ long-term incentive Consolidated net profit (2018-2020) 0 259 216 0 125 104 0 0 0 0 162 135
Consolidated net profit (2017-2019) 208 83 45 130
Phantom stock plan 2018 (holding period 2018-2021) 0 540 216 0 260 104 0 0 0 0 335 134
Phantom stock plan 2017 (holding period 2017-2020) 208 83 45 130
878 2,195 1,742 1,679 588 1,221 1,003 783 0 0 0 173 556 1,376 1,094 1,059 Post-employment benefits 257 257 257 258 37 37 37 30 0 0 0 43 99 99 99 99
Total remuneration 1,135 2,452 1,999 1,937 625 1,258 1,040 813 0 0 0 216 655 1,475 1,193 1,158

82 Group Management Report Remuneration Report
The inflows of the various remuneration components in the reporting year are shown in the following table:
Dr. Joachim Kreuzburg Rainer Lehmann
(as of March 1, 2017) Jörg Pfirrmann
(until Feb. 28, 2017) Reinhard Vogt
(until Dec. 31, 2018)
Benefits received € in K
2018 2017 2018 2017 2018 2017 2018 2017
Fixed remuneration 863 832 414 333 0 54 538 520
Fringe benefits 1) 15 15 174 117 0 2 18 19
Total non-performance-based remuneration 878 847 588 450 0 56 556 539 Variable performance-based remuneration (1 year)1) 455 363 218 145 0 24 284 227
Variable multi-year components w/ long-term incentive Consolidated net profit (2016-2018)1) 189 0 0 118
Consolidated net profit (2015-2017)1) 184 0 79 112
Phantom stock plan 20142) 422 0 181 256
Phantom stock plan 20132) 397 0 172 242
1,944 1,791 806 595 181 331 1,214 1,120 Post-employment benefits 257 258 37 30 0 43 99 99
Total remuneration 2,201 2,049 843 625 181 374 1,313 1,219
1) Amount equal to actual target achievement 2) Paid out in the fiscal year

Group Management Report Remuneration Report 83
6. Main Features of the Remuneration Plan for the Supervisory Board
The remuneration for Supervisory Board members is defined in the Articles of Association of Sartorius AG and comprises fixed remuneration, meeting attendance fees and reimbursement of out-of-pocket expenses. Members serving as chairperson and vice chairperson of the Supervisory Board receive higher fixed remuneration.
Members and chairpersons of Supervisory Board committees are entitled to receive additional annual fixed amounts and meeting attendance fees and reim-bursement of their out-of-pocket expenses. These amounts do not apply in relation to the Nomination Committee or to the committee pursuant to Section 27, Subsection 3, of the German Codetermination Law (MitBestG).
7. Remuneration of the Supervisory Board Members
2018 ¤ in K
2017 € in K
Remuneration for the Supervisory Board Members Total remuneration 882 922 Fixed remuneration 600 587
Compensation for committee work 80 80
Meeting attendance fee 151 165
Total remuneration for the Sartorius Stedim Biotech subgroup 51 90
Remuneration from Sartorius Stedim Biotech GmbH, Göttingen 0 10
Remuneration from Sartorius Stedim Biotech S.A., Aubagne 51 80
2018 ¤ in K
2017 € in K
Dr. Lothar Kappich (Chairman) Total remuneration 221 142 Fixed remuneration 120 76
Compensation for committee work 24 13
Meeting attendance fee 26 15
Remuneration from Sartorius Stedim Biotech S.A., Aubagne 51 38
2018 ¤ in K
2017 € in K
Manfred Zaffke1) (Vice Chairman) Total remuneration 122 118 Fixed remuneration 80 81
Compensation for committee work 16 16
Meeting attendance fee 26 21
2018 ¤ in K
2017 € in K
Annette Becker1) Total remuneration 46 51 Fixed remuneration 40 40
Meeting attendance fee 6 11
2018 ¤ in K
2017 € in K
Uwe Bretthauer1) Total remuneration 82 77 Fixed remuneration 40 40
Compensation for committee work 16 16
Meeting attendance fee 26 21
2018 ¤ in K
2017 € in K
Michael Dohrmann1) Total remuneration 46 51 Fixed remuneration 40 40
Meeting attendance fee 6 11
2018 ¤ in K
2017 € in K
Dr. Daniela Favoccia Total remuneration 46 36 Fixed remuneration 40 30
Meeting attendance fee 6 6
2018 ¤ in K
2017 € in K
Petra Kirchhoff Total remuneration 46 51 Fixed remuneration 40 40
Meeting attendance fee 6 11

84 Group Management Report Remuneration Report
2018 ¤ in K
2017 € in K
Karoline Kleinschmidt1) Total remuneration 46 51 Fixed remuneration 40 40
Meeting attendance fee 6 11
2018 ¤ in K
2017 € in K
Dr. Guido Oelkers Total remuneration 46 8 Fixed remuneration 40 6
Meeting attendance fee 6 2
2018 ¤ in K
2017 € in K
Ilke Hildegard Panzer Total remuneration 46 36 Fixed remuneration 40 30
Meeting attendance fee 6 6
2018 ¤ in K
2017 € in K
Prof. Dr. Thomas Scheper Total remuneration 45 51 Fixed remuneration 40 40
Meeting attendance fee 5 11
2018 ¤ in K
2017 € in K
Prof. Dr. Klaus Rüdiger Trützschler Total remuneration 90 78 Fixed remuneration 40 40
Compensation for committee work 24 20
Meeting attendance fee 26 18
1) The employee representatives declared that they donate their Supervisory Board remuneration to the foundation Hans-Böckler-Stiftung according to the guidelines of the German Trade Union Association.
Beyond their Supervisory Board remuneration, the employee representatives who are employees within the Sartorius Group receive compensation that is not related to their service on the Supervisory Board.
Former Supervisory Board Members
2018 ¤ in K
2017 € in K
Prof. Dr. Dres. h.c. Arnold Picot (Chairman until July 9, 2017) Total remuneration 0 139 Fixed remuneration 0 62
Compensation for committee work 0 13
Meeting attendance fee 0 12
Total remuneration for the Sartorius Stedim Biotech subgroup 0 52
Remuneration from Sartorius Stedim Biotech GmbH, Göttingen 0 10
Remuneration from Sartorius Stedim Biotech S.A., Aubagne 0 42
2018 ¤ in K
2017 € in K
Dr. Dirk Basting (until April 6, 2017) Total remuneration 0 14 Fixed remuneration 0 11
Meeting attendance fee 0 3
2018 ¤ in K
2017 € in K
Prof. Dr. Gerd Krieger (until April 6, 2017) Total remuneration 0 19 Fixed remuneration 0 11
Compensation for committee work 0 2
Meeting attendance fee 0 6
8. Remuneration of Former Managing Directors
2018 ¤ in K
2017 € in K
Remuneration of Former Managing Directors Remuneration of former managing directors and members of the Executive Board as well as their surviving dependents 608 871
Retirement benefits and pension obligations to former managing directors and members of the Executive Board as well as their surviving dependents 8,531 8,098
Any circumstances beyond the disclosures made above and required to be reported according to Section 289, Subsection 4, and Section 315, Subsection 4, of the German Commercial Code “HGB” do not exist or are unknown.

Group Management Report Our Approach to Sustainability 85
For Sartorius, a company nearing its 150th year in business, sustainability is firmly embedded in its DNA. To us, sustainability means operating responsibly over the long term – with respect to customers, employees, investors, business partners and society as a whole. This also entails treating our natural resources responsibly. Sustainability is so important to Sartorius that it is one of our three company values besides openness and enjoyment.
Sartorius is a leading international partner of the biopharmaceutical industry. With our technologies, we are contributing significantly so that this industry can serve the health needs of people. In this respect, cooperation and partnerships have always been a hallmark of our way of doing business.
Sartorius has been a signatory of the United Nations Global Compact since May 2018 and is thus actively committed to sustainable global business.
With sustainable development goals (SDGs), the United Nations has developed political aims. The governments of all member nations have jointly agreed on SDGs; however, the success of implementing the latter will considerably depend on the actions and collaboration of all stakeholders, particularly on the commitment and engagement of the private economy. Sartorius has taken on this responsibility and has begun with this Non-Financial Group Statement to report on its SDGs.
Since October 2018, we have additionally been a member of econsense, the Forum for Sustainable Development of German Business. With ecosense, we have gained a partner that unites us with sustainability stakeholders in politics and civil society.
In the reporting year, we set up a Corporate Responsibility Steering Committee that meets least once a year. At the meetings led by the Executive Board Chairman, various senior-level managers and corporate responsibility officers discuss the current issues concerning sustainability and responsibility, data structure and collection, derivation of targets, action to take and approval of such action.
About the Non-Financial Group Statement
Sartorius defined non-financial indicators that enable assessment of the impact of its business activities on stakeholders, the environment and society.
This Non-Financial Group Statement was prepared in accordance with the disclosures set out in Sections 315b and 315c in conjunction with Sections 289c to 289e of the German Commercial Code (HGB). Pursuant to Section 315b, Subsection 1, sentence 3, of HGB, reference is also made to individual non-financial aspects contained elsewhere in the Group Management Report.
Concerning the reporting framework of our Non-Financial Group Statement, we apply the guidance provided by the Global Reporting Initiative (GRI) – the Sustainability Reporting Standards – using the “core” option. In this way, we aim to ensure transparency and comparability.
The reporting period for the Non-Financial Group Statement is the fiscal year. Unless otherwise indicated, the employee-related data covers all Sartorius companies. The environmental indicators encompass all our production companies, unless otherwise stated. In relation to our total headcount, this represents a degree of coverage of 72%.
This Non-Financial Group Statement was audited by KPMG AG in the form of an audit with limited assurance. Upon presentation of this Non-Financial Group Statement, our subgroup Sartorius Stedim Biotech S.A. has been exempted from the obligation of providing such a statement.
Organizational Profile
Please refer to pages 22-27 covering the sections "Structure and Management of the Group" and “Business Model, Strategy and Goals" of the Management Report.
Our Approach to Sustainability

86 Group Management Report Our Approach to Sustainability
Stakeholder Involvement
The Global Reporting Initiative guidelines focus in particular on identifying relevant stakeholders and material topics.
We define stakeholders as those persons, companies, institutions and interest groups that are able to influence the success of the Sartorius Group or that are impacted by the actions of our company. In particular, such stakeholders are our customers, employees, investors, suppliers and business partners, as well as neighboring companies and local residents.
Sartorius engages in a very close ongoing dialog with its stakeholders, using this exchange to regularly discuss sustainability aspects.
We also uphold open communication with our staff. Through staff meetings and structured annual performance reviews, as well as an open working atmosphere, we discover what our employees find satisfying about the company and where they see potential for improvement. We use the results of these surveys to implement specific plans of action at our local sites as needed. A further important stakeholder group for us in this respect are also potential employees.
Investor relations activities at Sartorius aim to create transparency and continuity for our investors. We engage in a dialog with our investors about our environmental and social responsibility as well as corporate governance topics at investor conferences and roadshows and as part of our own organized capital market days.
Sartorius participates in sustainability analyses and ratings to gauge its performance with respect to its environmental, social and governance-related business practices. In the EcoVadis Corporate Social Responsibility (CSR) rating platform, Sartorius moved up from bronze to the silver recognition level, positioning itself among the best 30 percent of the companies assessed.
We maintain good relationships and an intensive dialog with local residents and public authorities, and consider their interests in and expectations on our business activities. Such interests and expectations relate, in particular, to maintaining job security, complying with legal requirements, conserving and protecting environmental resources, and promoting infrastructure.
Materiality Analysis
Prioritization of Topics in Materiality Identification
We conducted a comprehensive materiality analysis in 2017 to determine the material topics for the business activities of the Sartorius Group.
For reporting in the year under review, we analyzed discussions with customers and investors as well as took into account the estimates of managers in Sales, Product Marketing, Purchasing, Quality Management, Legal & Compliance, Corporate Communications as well as Research and Development and Production. Dialogs with our stakeholders have shown that there is additionally a special interest in the topic of single-use products so this will be expanded upon in our reporting. The outcome of this process was discussed with the Executive Board for validation purposes and confirmed by the Board.
Material Areas
There were no changes to the material areas compared to last year’s so that we can confirm the following:
1 Availability of Medical Care
2 Innovation
3 Employees
4 Corporate Governance
5 Environmental Protection

Group Management Report Our Approach to Sustainability 87
Sustainable Development Goals
To determine which SDGs are related to Sartorius’ business activities, we also conducted a materiality analysis. In a first step, we considered the definitions of all SDGs, identifying the ones that are significant for Sartorius. In a second step, our analysis examined the relevance of each topic to our business, as well as the potential impacts on people and the environment. A topic is relevant for our business if potential effects on growth or costs result from it. Finally, in the third step, we determined whether the impacts are positive or negative and to which degree. Eight SDGs were defined as material in relation to the business activities of Sartorius:
The company reports on SDGs based on each significant topic identified in its materiality analysis.

88 Group Management Report Shaping the Future
Availability of Medical Care
Why It’s Important
In industrialized countries, many people suffer from diseases for which there is still no effective treatment. Examples include types of cancer, Alzheimer’s disease or dementia, autoimmune diseases and congenital metabolic disorders, as well as infectious diseases. At the same time, many diseases that would have proved fatal just a few generations ago can now be cured or treated effectively. This, coupled with declining birth rates, has resulted in an aging population in the industrialized nations. Healthy aging and social participation into old age are particularly desirable social objectives. For all patients who depend on medications, it is of crucial importance that these medical drugs be reliably available in a safe quality.
In developing countries and emerging markets, the availability and affordability of healthcare is considerably below the standards of industrialized nations: More than half of the world’s population has either no or inadequate access to healthcare. Every day, people die of diseases that are treatable using the simplest means or are even preventable. In 2017, around 19.5 million children, representing approximately one out of ten children, did not receive basic vaccines against diphtheria, tetanus and whooping cough.
Efficient development and safe production of vaccines as well as of biopharmaceuticals to treat serious and, in part, rare diseases is therefore of major importance to society.
Our Approach
It is Sartorius’ mission to enable better health for more people. With our two divisions, we aim to make development and production of biopharmaceuticals faster and more efficient. With diverse technologies, we offer our customers an integrated approach and optimize the interaction of many individual steps in such processes. In this way, vaccines and innovative medications can reach the market faster, in greater numbers, in high quality and at more affordable prices altogether.
Often, new approaches result by interdisciplinary collaboration among various experts. For this reason, our approach is to bring together experts from the scientific community, startups and industry, thus promoting an exchange of ideas and networking going forward. This is conducive to the generation of new and creative ideas and thus supports scientific progress.
Our Performance
According to the United Nations, health is considered one of the basic human rights and is a major indicator of sustainable development. This is why we gauge our performance concerning the
material topic “availability of health care” on how we contributed to SDG 3 “Good Health and Well-Being.” We are currently working on the development of suitable indicators.
Our impact on health becomes particularly clear by SDG 9 “Industry, Innovation and Infrastructure” because with our innovation activities, we are helping to improve the availability of healthcare. SDG 4 “Quality Education,” SDG 5 “Gender Equality,” and SDG 6 “Clean Water and Sanitation” as well as SDG 17 “Partnership for the Goals” equally contribute to the complex of topics under healthcare. We specifically report on each SDG in each section of this Non-Financial Group Statement.
Shaping the Future

Group Management Report Shaping the Future 89
Innovation
Why It’s Important
The biopharma market is rapidly developing – an area in which scientific breakthroughs leading to new therapies come at a high rate. At the same time, developing a new pharmaceutical drug continues to take around an entire decade and is extremely cost-intensive. We are committed to enabling our biopharmaceutical customers obtain usable results faster by automating research steps, making them less prone to error. Digitalization, which has played a rather subordinate role in comparison to other sectors until now, will gain considerable importance in the future. The manufacturing processes and technologies of this comparably young sector are progressing at a dynamic rate as well.
From day one of its incorporation, Sartorius has worked to maintain an open exchange with the scientific community and, in this way, has driven forward scientific insights and precisely tailored product development. Our goal is to promote scientific thinking and working in society, creating a broader basis for future research and development.
Our Approach
Innovation at the Sartorius Group rests on three pillars: Our own specialized product development combined with strategic corporate research activity, the integration of innovations via acquisitions, and cooperations and partnerships in complementary fields.
Product Development and Corporate Research
Our core portfolio is further developed in our two operating divisions. In this way, we can optimally focus on fast and customer-specific development of new products that can be made available in relatively short timelines. These R&D activities focus on our core competencies, such as membrane and cell culture technology, and the automation and control of instruments in laboratory and process scale. Knowledge and technologies that the company gains through alliances or acquisitions are developed further within the company, and thus lead to new technologies. Each of our international production sites fundamentally serves as a center of competence for specific technologies.
Sartorius has been operating a Group-wide Corporate Research unit since 2018. The major task of this unit is to establish close links with the many dynamic innovation processes within research institutes,
startups and other technology companies to systematically scout for new trends and opportunities on a fast and broad basis, unlocking this potential. At the center of the research work performed at this unit are new biotech applications, such as regenerative medicine, new materials and components, as well as data analytics.
The close exchange of ideas with our biopharmaceutical customers shows that bioanalytics can contribute decisively toward faster discovery of new active drug compounds. So far, many of the required procedural and analytical steps have been performed manually for the most part. Therefore, the purpose of cell analytics is to automate key analytical steps, thus reducing development timelines. Tools for cell analysis can also provide answers as to whether and how a potential active pharmaceutical ingredient acts on a cell. With real-time imaging technologies and powerful software, experiments can also be evaluated even better.
Complementary Acquisitions
We constantly explore the market for innovative technologies, following a differentiating acquisition strategy. Moreover, we aim to supplement our technologies, particularly those that complement our own expertise, through acquisitions.
Decisions on acquisitions are guided by our basic strategic orientation: We are striving to position ourselves more broadly across the value-added chain of our biopharma customers and become involved early in their development processes.
With startups, we gain new technologies and momentum. We attempt to retain our startup company founders at Sartorius, to keep their abilities and expertise within the Group. Such collaboration is also beneficial for the companies we acquire: They gain access to customers, financing capacity, an international network and a variety of resources.
With respect to acquisitions, Sartorius’ standard policy is to include non-financial aspects in the due diligence process. Examples of such aspects are whether a candidate has a record of complying with legal standards and maintaining effective compliance systems, among other things. Moreover, we include HR and environmental aspects in our assessment of risks and opportunities of such potential takeover candidates.

90 Group Management Report Shaping the Future
Cooperations and Partnerships
In addition to research alliances, technology partnerships with customers and suppliers are another important component of our research and development work. Direct partnerships best succeed in initiating joint learning and development processes.
Sartorius maintains many scientific alliances and partnerships, including, for example, with the University of Weihenstephan, the Institute of Technical Chemistry (TCI) at Leibnitz University of Hannover, the Hannover Medical School (MHH) and institutes of the Fraunhofer Society. Such partnerships provide a steady stream of new ideas and contribute to the identification of new fields of development.
In the reporting year, Sartorius Stedim Biotech and Penn State University in Pennsylvania, USA, entered into a collaborative partnership. This long-term relationship aims to support the education and preparation of the next generation of biotechnology leaders. For this purpose, Sartorius is providing the university with the most advanced fermentation technologies and is equipping Penn State's Center of Excellence in Industrial Biotechnology (CoEIB). Sartorius views this partnership as an opportunity to create a hub that will bring together future thought leaders and accelerate progress in biotechnology.
Sartorius launched a further cooperation project in 2018 by founding the independent Life Science Factory gGmbH, a non-profit that promotes scientific research in life sciences. Its objective is to strengthen research and development of innovative technologies with a clear application focus so that current research can be put to use as fast and best as possible to serve the interests of medical patients. Besides this, the Life Science Factory creates space for scientists willing to take their first steps beyond the comfort zone of academic institutions.
Our Performance
Within the scope of its innovation activities, Sartorius has a positive impact on several United Nations Sustainable Development Goals. These effects are interdependent and influence one another. For this reason, there are no neat dividing lines between them.
SDG 9 “Industry Innovation and Infrastructure” aims to extend scientific research in all countries throughout the world. While Sartorius does not have a direct influence on the areas of
infrastructure or sustainable industrialization, it does contribute in a wide variety of ways to achieve this innovation goal. As each of our production sites fundamentally serves as a center of competence, we extend scientific expertise at many sites across the globe.
Since 2011, we have acquired and successfully integrated eleven companies. In these cases, as well as those that preceded them, major locations have been expanded and additional jobs created in the wake of the acquisitions. A total of 628 people worked in R&D and Corporate Research Department during 2018, 44 more than in the previous year. This represents an increase of 8.4%. In the reporting year, the Sartorius Group spent €78.2 million on R&D.
Working in alliances and partnerships has been a part Sartorius’ corporate policy ever since it was spun off from the University of Göttingen. The company’s close ties with the scientific
community have remained to this very day. Sartorius maintains partnerships with around 120 scientific partners in various countries.
With its Research Xchange Forum, Sartorius also created a platform in 2017 for interdisciplinary exchanges between industry and science. The second Research Xchange Forum in March 2018 focused on encouraging industry and science to share knowledge and ideas on the topics of regenerative medicine and cell therapy. Among the keynote speakers, Dr. Stefan W. Hell, a professor and scientist at the Max Planck Institute for Biophysical Chemistry in Germany and a Nobel Prize Laureate in Chemistry, addressed an audience of more than 140 guests. During the expert conference, the Sartorius & Science Prize was also awarded, this time going to microbiologist Kole Roybal of the University of California in San Francisco for his development of a new class of T-cell immunotherapies that help the immune system to better identify cancer cells. As a result, precision cell therapies can be initiated to combat cancer.
Since 2017, the company has been awarding its annual Sartorius & Science Prize for Regenerative Medicine and Cell Therapy. The award, which comes with €40,000 prize money, is geared toward outstanding scientists who focus on basic or translational research in these fields. Besides its purpose of honoring outstanding achievements, another objective of the award is to draw attention to these research topics and their significance for the future.

Group Management Report Shaping the Future 91
The complementary fit of our products and technologies, as well as the use of digitalization, enables many months to be saved in the timeline needed for bringing a new medication from initial
drug discovery steps to readiness for market. This fast-forwards the entire workflow by approximately 30 percent. As a result, the use of our optimized process technologies makes production of biopharmaceuticals more efficient and flexible. Production quantities can be more quickly varied and adapted to changing needs. Sterile single-use equipment helps prevent cross-contamination from occurring, thus increasing safety in the manufacture of medical drugs.
Staff for Unlocking Future Potential
Why It’s Important
Sartorius is growing strongly. At our sites around the world, we add more than 1,000 new employees to our staff every year. To ensure the success of the company in the future as well, we need to continuously gain and retain talented and well-educated employees. In the process, one particular challenge all over the world is to recruit experienced specialists for the company.
A total of 8,125 employees currently contribute to the success of Sartorius. Continuing professional development, assumption of responsibility and opportunities to advance within the company are important for our employees’ satisfaction. Such skills safeguard their employability and open up new professional prospects for them.
As a globally operating company, we do business in many different regions and markets. At Sartorius, people from 77 countries work together as a team. The company’s global network shapes our daily work. Many of our departments cover multiple company locations and countries, and project teams are often made up of international members. The productive interaction of a variety of perspectives and experiences helps us understand our customers better, develop tailored solutions and remain competitive in a global economy. We believe that a working environment of mutual trust, appreciation and respect brings the best work results and increases our employees’ motivation and creativity, as well as their loyalty.
Ensuring the safety of our employees at work is our responsibility. The health of our employees is also important to us as a company, which is why we offer support in the form of a variety of preventative healthcare offers.
Our Approach
Finding Talent
A central success factor in recruiting new employees is our worldwide employer branding. In the reporting year, these activities were strengthened and combined in a separate department. Sartorius is less well-known as an employer in the international arena than it is in Germany. This is why we are defining and globally communicating aspects that are critical to potential employees when they make employment decisions.
According to our analysis, the following describes all factors that are suitable for creating confidence in the future: The company’s market leadership, sales growth and profit margin development, internationality and innovative activities and, not least, employees’ own development prospects within the company. Many job candidates are also interested in joining a company that offers a meaningful mission and enables staff to take on social responsibility.
The aim of our international Sartorius Scholarship program is to gain qualified young academics for our company, particularly from the global growth markets. For many years, we have been supporting talented students and graduates in scientific and technical disciplines. Undergraduates studying sales and marketing can also apply for a Sartorius scholarship. The company aids these recipients not just financially, but also gives them professional career guidance as well as support on a personal level. For example, each Sartorius scholarship holder is assigned a mentor from within our organization.
Moreover, Sartorius attaches great importance to thorough initial qualification. Because it is becoming increasingly important for the company to attract specialists, Sartorius has been hosting its own annual vocational training day since 2017 and takes part in several educational trade fairs. At these events , young people can obtain details on opportunities for learning and training at Sartorius and enter into a dialog with in-house trainees and students on the more than 20 different vocational and work-study programs.

92 Group Management Report Shaping the Future
Creating New Prospects
Sartorius retains its qualified employees by offering a wide range of continuing education courses consisting of language courses, management and communication training seminars, as well as technical training sessions, at all its sites. Annual performance reviews between employees and their managers provide a forum for discussing performance, targets and individual development opportunities. We conduct all annual performance reviews worldwide using the same criteria, and such reviews are mandatory.
Sartorius fills management positions from within its own ranks whenever possible. We use Sartorius’ leadership guidelines as the basis for a management development program in which all first-time managers participate with the goal of developing a common leadership culture. The program is already available at our companies in Germany, the U.K., France, Belgium, Italy, Spain, India and China. A development program for production managers has been established in Germany.
Sartorius encourages its employees to network within the company and to transfer temporarily to its other departments or sites. We consider deployment at other sites and global mobility an investment in the future of our company. In the reporting year, we set up a separate Global Mobility Department. The basic conditions for temporary assignments in foreign countries are transparently defined for all staff members.
Promoting Job Satisfaction
We offer our employees positive work conditions to encourage them to apply their skills in the best possible manner. Our policy on labor practices and social standards is defined, and we take standardized approaches throughout the Group in this area.
We aim to enable our employees to develop personally and professionally throughout their professional lives. To create the same opportunities for people regardless of their life situations, we have installed a flexible work scheduling model, flextime, at many of our companies. Employees are often able to choose among flextime, part-time and teleworking options, depending on their personal situation and the company's needs. Sartorius also enables many production employees to opt for flextime scheduling.
In addition to flexible work schedules, our response to the need for work-life balance includes child care opportunities. In Göttingen, for example, we have
offers for school-age children during school vacation periods. In 2018, the new children’s day care center opened on Sartorius Campus in Göttingen, ensuring conveniently close proximity for the company’s working parents. The center is integrative, meaning it offers spots for handicapped children as well. Sartorius has already won a number of awards for its family-friendly policies. It is part of our corporate culture that fathers also take family leave at Sartorius.
In line with the German Act on Equal Participation of Women and Men in Executive Positions in the Private and Public Sectors, Sartorius has set targets for the proportion of women at the first level of management below the Executive Board. By 2022, the company plans to increase the proportion of women in the first and second management tiers below the Executive Board to 30%. Currently, the proportion of women at all management levels is 30.2%.
Measures that promote equal opportunity in our company include the creation of transparency on salary structures. The majority of salaries at the German companies are linked to the rates agreed with the IG Metall trade union, with some paid in accordance with rates established for the German trade union IG Bergbau, Chemie, Energie. The remuneration paid to employees in France and Austria is also based on trade union rates. Using the union rates makes our remuneration more transparent.
The Group Employees’ Council represents the interests of our staff in Germany. Five of our six operating companies in Germany also have a local employees’ council. In addition to the employee council members, numerous representatives are available to Sartorius employees.
Offering Safety
Sartorius has high safety standards to minimize job-related medical conditions, risks to health, and potential causes of industrial accidents. The basic principles and core policies on occupational safety and health protection are defined throughout the Sartorius Group in its corporate policy on workplace safety and health. We continually improve our job safety and work organization conditions. Planned, mandatory employee training on topics of occupational health and safety and environmental protection ensures that our staff members recognize risks and avoid them accordingly.
Sartorius continuously analyzes all accidents and derives accident prevention measures from them that can also be used for other sites. At its local Group sites,

Group Management Report Shaping the Future 93
occupational health and safety committees consult at regular intervals to draw up plans of action to promote health and prevent work-related accidents.
The Group's corporate health management policy addresses both the physical and psycho-social elements of health to enhance employee performance and motivation, ensure their employability and reduce illness-related costs. It is compulsory for companies to provide an in-house medical service. In addition, an external provider is on hand to offer psychological help on any work-related or personal matter. Staff can reach this service via a hotline.
Our Performance
We contributed to SDG 4 “Quality Education” in various ways. To us, education is a valuable asset, and we consider it part of our corporate responsibility to support it in our sphere of influence.
At the company's major production sites in France, Germany, India, Puerto Rico and Tunisia, where 65% of the workforce is employed, a total of 60,428 hours were invested in further training initiatives during the reporting year. On average, each employee completed 11.8 hours of further training.
In Germany, the Group currently offers vocational training and education in 17 different professions and five work-study programs on the whole. As of the reporting date on December 31, 2018, Sartorius had a total of 121 vocational trainees and 12 work-study students, of whom 91 were male and 42 female.
People from 77 nations work closely together at Sartorius. Alone our Group headquarters in Göttingen, Germany, is home to employees from 46 nations. As of December 31, 2018, 62.4% of the Group's staff were employed outside Germany, 0.2 percentage points fewer than in the year before. Throughout its sites, Sartorius relies on local management. Nearly 70% of the approximately 831 managers at Sartorius are not of German nationality.
Over the past five years, Sartorius has gained 5,620 new recruits. The proportion of women in our workforce has been steadily increasing in recent years and, at the end of the reporting
year, was 38.2%, thus corresponding to the year-earlier figure.
In the reporting year, 6.2% or 500 people were working part-time at the Sartorius Group, 96 more than in 2017 and most of whom are in Germany.
Job Satisfaction
The success of our measures to create a positive working environment is reflected in permanently low attrition rates. Despite the large number of new hires as the result of the company's growth, seniority remains at a high level.
Excluding expired fixed-term contracts, the attrition, or turnover, rate at Sartorius was 8.7%, 0.4 percentage points above the low level of the previous year. In general, fluctuation is subject to regional differences. Europe typically has the lowest levels of staff turnover, whereas changing employers is more common in Asia, and fluctuation there is usually high. At Sartorius, too, staff turnover was very low at the Group's German sites, at 4.3%.
As a result of the consistently high number of new hires, the average seniority again decreased slightly in the reporting year. In 2018, about half of all employees had been with Sartorius for less than five years, while greater than one fifth had been with the company for 15 years or more.
In 2018, 13 staff meetings were held at which employees were informed and asked questions and could address their concerns to management.
9.8 9.5 8.9 8.8 8.3
in years
2014 2015 2016 2017 2018
7
8
9
10
11
9.8 9.5 8.9 8.8 8.3
Development of Average Seniority

94 Group Management Report Shaping the Future
2018 2017
Number of staff who left1) 77 78
Attrition rate2), excluding expired fixed-term contacts in % 8.7 8.3
Attrition rate2), including expired fixed-term contracts in % 10.2 10.5
1) As a result of termination by the employer 2) The number of people leaving as a percentage of the average
headcount in the reporting year; includes contracts terminated by either the employer or thge employee as well as retirements due to the statutory age limit and for other reasons
Occupational Safety and Health
The number of work-related accidents rose year over year from 67 to 135, which is primarily due to the tighter notification and reporting requirements in the Fermentation unit. At the same time, various measures were taken to improve safety at work, such as implementing new rules of conduct, new equipment and training courses. As a result of these improvements, the number of days lost through work-related accidents decreased by 806 days or 32% compared to 2017. The statistics on accident severity changed correspondingly, showing a decline by 76 days per million working hours to 129 days.
The absenteeism rate, defined as the proportion of scheduled working time not worked due to general absences, was 3.8% in the reporting year, around the level of the previous year. In general, this rate is strongly dependent on factors such as influenza waves. The average number of days missed per employee due to sickness was 7.2 days in the reporting year and 7.1 days a year earlier.
Statistics on Accidents at Work
2018 2017
Number of work accidents 135 67
Number of days lost due to work accidents 1,741 2,547
Frequency rate1) 10.0 5.4
Severity rate2) 128.5 205.4
1) Number of accidents per 1,000,000 working hours 2) Number of days lost due to work accidents per 1,000,000
working hours
.
3.6 3.7 3.6 3.7 3.8
in %
2014 2015 2016 2017 2018
Excluding time lost due to long-term health conditions and maternity, parental, sabbatical and unpaid leave
1)
3.6 3.7 3.6 3.7 3.8
3.0
3.3
3.5
3.8
4.0
Development of Absenteeism Rate1)
2014 2015 2016 2017 2018
in %
3,0
3,3
3,5
3,8
4,0
ohne Langzeitkranke, Abwesende wegen Mutterschutz, Elternzeit,Sabbatical und unbezahltem Urlaub
1)
3,6 3,7 3,6 3,7 3,03,6 3,7 3,6 3,7 3,0
Entwicklung Fehlzeitenquote1)

Group Management Report A Reliable Partner 95
Responsible Management
Why It’s Important
Global supply chains for the pharmaceutical market are sensitive and at the focus of many stakeholders. Above all, for medical patients at the end of each supply chain, it is of crucial importance that their medical drugs be readily available and safe. As our customers perform validated processes, quality and assurance of supply are especially important to them.
This is why our No. 1 concern is to conduct our business with utmost integrity. We are committed to respecting internationally recognized human rights and employee rights as the basis of our global business activities. A key task is to create a common understanding of fair working conditions – at all our sites and in our supply chain.
Our Approach
Sartorius conducts its business in compliance with globally accepted ethical standards and applicable national legal requirements. In particular, Sartorius follows the rules and recommendations of the German Corporate Governance Code in its current version of February 7, 2017.
Our globally applicable compliance system is intended to ensure that our Supervisory and Executive Board members, managers and employees comply with all legal regulations and codes, and act according to our internal guidelines. The Legal Affairs & Compliance Department is responsible for legal consulting, internal auditing, corporate security, data protection, anti-corruption, customs and export control.
In the reporting year, we further extended our functional area of Corporate Compliance within the company. Since January 2018, a dedicated team has been focusing their efforts on the implementation and enforcement of all Group compliance topics.
Code of Conduct and Anti-Corruption Code
The Sartorius Code of Conduct defines the requirements we place on our employees with respect to responsible conduct. The code helps employees act ethically and in accordance with the law in their daily work. In everything they do, employees are required to ask themselves the following questions: Are my actions
legal? Does my conduct correspond to our values and guidelines? Is it free of personal interests (that are not covered by labor-law regulations)? Will it stand up to public scrutiny? Specifically, our Code of Conduct covers compliance with international social and environmental standards, general rules of conduct and the way to deal with conflicts of interest.
Our Anti-Corruption Code forms the basis for raising employee awareness about corruption risks. It also serves as a guideline, instruction manual and aid in taking the necessary action to both prevent and fight corruption at specific companies or in specific sectors. An anti-corruption officer has been appointed by Group management as a contact person for corruption prevention. This officer pursues his or her duties independently.
We ensure that each and every one of our employees is familiar with the Code of Conduct and Anti-Corruption Code by requiring them at all our sites worldwide to complete an online training course, for which they are awarded a certificate. The course teaches employees how to deal with ethically or legally problematic situations.
Supplier Management
We intensively track the performance of our suppliers. Our four separate departments perform interrelated tasks to keep tabs on supplier performance, ensuring that our requirements on quality and safety are met: Sourcing, Quality, Local Quality and Operations.
We also expect our suppliers and service providers to comply with internationally recognized social and environmental standards, to respect the law and to uphold the tenets of fair competition, as well as respect human rights. We do not do any business with suppliers who pose a considerable risk in terms of compulsory, forced or child labor, other violations of human rights or negative effects on society, and terminate any relationship with suppliers who are identified as violating these standards. We have set out our requirements in our Code of Conduct for Suppliers and Service Providers. Our Sourcing Departments ensure that every supplier receives the Sartorius Code of Conduct for Suppliers. If a supplier does not sign our Code of Conduct for Suppliers, we check whether that supplier has an equivalent code in place that can be used as the contractual basis.
A Reliable Partner

96 Group Management Report A Reliable Partner
While Sartorius has several thousand suppliers, it sources the equivalent of more than 85 percent of its purchase volume from its A-suppliers. Based on its procurement volume as a gauge, less than two percent of its suppliers are located in regions with potential conflicts regarding human rights issues. Around 98 percent of the company’s procurement needs are sourced in Europe, the USA, Japan and Canada.
Respect for Human Rights
The United Nations Guiding Principles on Business and Human Rights clarify the responsibility of countries and businesses for protecting and respecting human rights. Therefore, this shifts the focus not only on prevention of human rights abuses, but also on the positive contribution that companies can make by their activities to promote protection of human rights.
In line with the United Nations Guiding Principles on Business and Human Rights, we respect and support the implementation of the values of the International Human Rights Charter, the OECD Guidelines for Multinational Enterprises and the Declaration of the International Labour Organization (ILO) on Fundamental Rights and Principles at Work by committing ourselves to consider these internationally recognized human rights relevant for our activities. We respect the laws of the countries in which we do business.
The Sartorius Basic Declaration on Respect for Human Rights has been communicated to all staff over the company intranet as of February 2019 and is available on the Internet for all stakeholders.
The Sartorius Basic Declaration on Respect for Human Rights is binding for the Group worldwide. It calls upon each and every employee to conduct themselves in an appropriate, a fair and a legal manner with respect to other coworkers, business partners and the community at large. We expect our business partners, supplier, customers and alliance partners to conduct their business activities in line with high ethical standards.
We are currently working on establishing procedures that serve to prevent and detect any actual and potential negative impacts on human rights. Our certification for compliance with ISO 14001 ensures management of environmental impacts, and this system is already in place at many of our company sites. In this way, potential, negative impacts on people’s health are identified and/or prevented in the first place.
A whistleblower system ensures that those responsible for compliance can be contacted and that all human rights issues as well as instances of damaging behavior, such as corruption, unequal treatment or sexual harassment, can be reported. Our compliance team can be contacted face-to-face, via a telephone hotline, the Compliance Department’s electronic mailbox or – in the case of anonymous reports – our whistleblower system. The relevant contact options are listed on the company’s intranet and are thus available Group-wide. In addition, contact options are available on the company’s start page of its website and therefore also available for all external people concerned.
Our Performance
Human rights are an overarching topic of importance and concern many areas. For this reason, we assess our impact on human rights according to the sustainable development goals (SDGs) of the United Nations and report on these in the respective chapters. There are potential impacts concerning the SDGs 6, 12, and 13 on the environment. Especially for the SDGs 3, 4, and 5 on the fundamental human rights of health, education and gender equality, we see substantial possibilities for making a positive contribution. We specifically report on each SDG in each section of this Non-Financial Group Statement.
In the reporting year, Code of Conduct and Anti-Corruption Code training was revised. All employees across the Group were requested to complete online training courses and pass the subsequent test. Both training courses must be held once a year. Compliance training sessions are currently available in Chinese, English, French and German.
In the year under review, 1,564 employees from 27 countries completed training on our Anti-Corruption Code and 1,928 employees from 31 countries on our Code of Conduct. The hours of training completed were 1,272 Code of Conduct for the and 1,032 for the Anti-Corruption Code.
No significant fines or non-monetary penalties resulting from violations of laws or regulations were imposed in the reporting year. There were no actual cases of corruption registered.
A procedure for assessment of our suppliers concerning the environment, human rights, employees, social responsibility and anti-corruption will be extended in 2019.

Group Management Report A Reliable Partner 97
High Environmental Protection Standards
Why It’s Important
Sartorius operates at 22 production sites at which it consumes the corresponding resources. In addition, greenhouse gases and waste are generated. We classify the environmental impact of our activities as comparatively low. At the same time, we are also aware of our responsibility for the environment and, for this reason, set high standards for environmental protection. As Sartorius continues to grow, it is constantly expanding its global production facilities to keep pace with demand.
Sartorius earns close to two-thirds of its sales with single-use products. As a result, production and sales of single-use products give rise to the question about their ecoological footprint during their life cycle and at the end of their useful product life.
Above all in the manufacture of membranes and final assembly of filters, we use considerable amounts of water and accordingly produce wastewater.
Our Approach
We define the basic principles and core topics of our environmental management in our environmental policy. Sartorius’ environmental policy is binding for all companies and sites in the Group. It is communicated to all employees via the intranet and the company website, helping us to anchor efficiency and environmental awareness in our daily business. In constructing new facilities, we follow recognized standards for sustainable building as guidance.
ISO Certification
An ISO 14001 environmental management system has been introduced at our two largest plants in Göttingen, Germany, as well as in Aubagne, France; Beijing, China; Bangalore, India; and Kajaani, Finland. This means that 27% of our manufacturing sites meet the requirements of the International Standard ISO 14001 on environmental protection, and 59% of our production staff work in compliance with this standard.
Ten of our production sites are also cerified for compliance with the ISO 9001 series of International Standards on quality. This corresponds to 70% of our manufacturing employees. The two standards ensure that we comply with quality requirements in the manufacture of our products, conserve the resources
we use and prevent environmental risks. We also operate an energy management system pursuant to ISO 50001 at our four German facilities, corresponding to an employee compliance rate of 43% at our manufacturing sites.
Our company in Beijing is additionally certified for compliance with OHSAS 18001.
Energy and Greenhouse Gases
It is our goal to keep increases in energy consumption and greenhouse gas emissions at underproportionate levels with respect to revenue growth. Currently, we are working on enhancng data quality as well as are defining specific targets and appropriate indicators.
Scope 2 emissions at Sartorius account for two-thirds of its climate-change-producing emissions (mostly from the consumption of electricity). The remaining one-third of climate-relevant emissions can be attributed to Scope 1 (mainly generated by combustion of fossil fuels). The primary energy sources we use include oil and natural gas. Our secondary energy, such as electricity, is mainly generated from primary energy sources and accounts for the majority of our energy consumption.
In response to the potentially increased risk of hurricanes on the Island of Puerto Rico, Sartorius decided to expand its product warehouse on the North American continent. That way, assurance of supply will be maintained for our customers even if the infrastructure on Puerto Rico happens to be impaired temporarily.
Water Consumption
The company takes care to reduce water consumption and soil sealing, particularly at manufacturing plants located in baseline water risk areas according to the Aqueduct Water Risk Atlas, such as Yauco, Bangalore and Beijing. In Yauco, for example, the company has established an additional system for rainwater use. Most of the water employed is for rinsing in the manufacture of filter membranes according to the precipitation bath method at the Göttingen site.

98 Group Management Report A Reliable Partner
Waste and Wastewater
We strive to reduce waste and use sorting systems to help ensure that reusable materials can be recycled, lowering the proportion of waste stored in landfills.
The majority of this hazardous waste results from the production of membranes. Organic solvents, which we need for manufacturing membranes used in sterile filters, are recovered and recycled in a multi-stage process. This is done directly on our plant site by a solvent reprocessing plant, and the solvents are then reused in production operations. In this way, we maintain closed-loop material cycles, minimize transportation requirements and reduce the quantities of water used and wastewater produced. As a result, emissions released into the air through the use of solvents are largely prevented. By conducting our own research and development, we also continuously lower the relative volume of solvents needed for membrane manufacture. While the distillation systems of our membrane casting machines operated in the precipitation bath mode permit about 99 percent recycling of the solvents used, the casting machines based on the evaporation process enable approx. 70 percent of solvents to be recycled. The remaining percentage of the solvents frozen for disposal are removed from the company premises as hazardous waste, which is then provided to a service company that specializes in sustainable solvent recovery and uses this waste to recover these solvents in a distillation process for other technical processes. Emissions released into the air as a result of these processes are low. Three of the four casting machines based on the evaporation method are located at our largest manufacturing site in Göttingen. In Germany, the proportion of hazardous waste relative to the Group’s total waste volume produced was 24% in the reporting year.
The use of hazardous materials, particularly, in membrane manufacturing, poses a potential risk for soil and groundwater, as well as a health hazard. An initial status report on soil and groundwater was consequently compiled for all the relevant substances within the scope of an approval procedure under immission control law. At a number of measuring stations for soil and groundwater, no contamination of these protected assets was found in the readings taken. A special monitoring concept at Sartorius is also designed to check the groundwater status, in particular, in the future.
Sartorius primarily sources its water from the public water supply; beyond this, the company also uses rainwater. The total volume of water discharged into
public sewage systems corresponds roughly to the company’s total water consumption.
We dispose of waste primarily in the country in which it is generated. Therefore, international waste transportation does not currently apply to us.
Single-Use Products
The single-use products Sartorius manufactures are predominantly utilized in the biopharmaceutical industry. To ensure the required sterility of these products during the manufacturing process, reusable systems must be thoroughly cleaned in between production of different batches, which entails considerable labor and expense. Large quantities of ultrapure water are used for cleaning, just as are various acids and bases. Moreover, each cleaning process is energy-intensive.
Systems based on single-use technologies require up to 30% less space than do reusable systems so that manufacturers use up less energy and materials due to smaller production units. This effect is yielded as biopharmaceutical processes performed with reusable systems place high requirements on the production conditions with regard to air quality and climate and are therefore energy-intensive.
Although single-use products during their usage phase have fewer negative effects on the environment than do reusable systems, utilization of the former produces more waste. After use in biopharmaceutical processes, single-use components, such as aseptic bags, filters or connectors, are usually disposed of just as is infectious hospital waste and incinerated accordingly.
Our Performance
Emissions that are caused by the direct operations of Sartorius are comparably low. Nevertheless, we are constantly seeking ways to reduce our emissions. The success of our action taken in this
respect is gauged by how well we contributed to SDG 13 “Climate Action.” This shows that despite substantial expansion of our manufacturing operations, both our energy consumption and gas emissions have remained at underproportionate levels with respect to revenue growth.
Emissions from solvents, which occur mainly in filter manufacturing at the Göttingen and Yauco sites, amounted to 27.9 metric tons of total carbon in the reporting year (2017: 28.9 metric tons).

Group Management Report A Reliable Partner 99
The proportion of total carbon relevant to greenhouse gas emissions has been taken into account when calculating the CO2 equivalent figure.
Since 2013, Sartorius has been recording greenhouse gas emissions in line with the Greenhouse Gas Protocol (GHG). We thus account for emissions not only of CO2 but of all gases relevant to climate change, and report them in CO2 equivalents (CO2eq). Currently, we report on direct climate-relevant emissions from our production sites (Scope 1) and on energy-indirect emissions resulting from power generation by external energy suppliers (Scope 2).
Energy Consumption and Greenhouse Gases
2018 2017
Total energy consumption in MWh 115,297 101,414
- of which electricity 65,745 56,165
- of which ... 49,551 45,249
Total greenhouse gas emissions in t CO2eq
1) 38,692 35,767
- Scope 12) 13,672 12,429
- Scope 2 25,020 23,338
Key indicators
CO2eq emissions per employee in t3) 6.7 6.8
1) Emissions in t of CO2eq were calculated by using "SoFi software supplied by Thinkstep"
2) Excluding fuel consumption for car fleet 3) Based on the average number of employees at the production
sites; 2018: 5,799
In view of competing interests for use of water, access to water represents a considerable challenge. This is why the supply, use, recycling and disposal of
water require a special degree of responsibility.
Water Consumption
2018 2017
Water consumption in cbm 432,971 430,608
Water consumption per employee in cbm1) 74.7 81.4
1) Based on the average number of employees at the production sites; 2018: 5,799
33.7 27.7 25.1 25.5 24.7
in proportion to annual sales, in t/€ in millions
2014 2015 2016 2017 2018
33.7 27.7 25.1 25.5 24.7
0
10
20
30
40
Development of Climate -Relevant Emissions
371.4 322.4 316.0 306.4 276.5
in proportion to annual sales, in cbm/€ in millions
2014 2015 2016 2017 2018
100
200
300
400
500
371.4 322.4 316.0 306.4 276.5
Development of Water Consumption

100 Group Management Report A Reliable Partner
The population is growing, and due to economical and demographic development, prudent use of natural resources is especially called for. This is why we measure our performance
concerning the environment based on their our on SDG 12 “Responsible Consumption and Production,” among others.
To us, treating natural resources responsibly not only concerns our own added value, but also the impact of our products.
In a typical commercial-scale manufacturing process of monoclonal antibodies, for instance, manufacturers who mostly use single-use products need up to 80 percent less water and up to 30 percent less energy than when they primarily use reusable systems.
The greatest impact of both single-use and reusable products results during their usage phase – above all caused by high energy requirements for steam sterilization, water purification and operation of stainless steel bioreactors. The impact at the end of their useful life is considered rather low in terms of their entire product life cycle. The high-purity of plastics we employ to make single-use products can be utilized as fuel in heat or power generation.
Amount of Waste
2018 2017
Total amount of waste in t 5,880 5,885 - of which waste for recycling in t 2,990 2,931
- of which waste for disposal in t 2,890 2,954
Waste per employee in t/€1) 1.01 1.11
Recycling quota in % 50.8 49.8
1) Based on the average number of employees at the production sites; 2018: 5,799
4.1 3.7 3.5 4.2 3.8
2014 2015 2016 2017 2018
in proportion to annual sales, in t/€ in millions
4.1 3.7 3.5 4.2 3.8
2
3
4
5
6
Development of Waste

Group Management Report GRI-Content Index 101
Organization and Report Profile
General Standard Disclosures
Page
Organizational Profile 102 - 1 102 - 2 102 - 3 102 - 4 102 - 5 102 - 6 102 - 7 102 - 8 102 - 9 102 - 10
Name of the organization Primary brands, products, and services Location of the organization’s headquarters Number of countries where the organization operates, and names of countries where either the organization has significant operations or that are specifically relevant to the sustainability topics covered in the report Nature of ownership and legal form Markets served Scale of the organization Employees profile, total number of employees Supply chain Significant changes to the organization and its supply chain
Structure and Management of the Group, p. 22 Strategy and Goals, pp. 24ff. Structure and Management of the Group, p. 22. Notes to the Financial Statements, pp. 122ff.; Supplementary Information, pp. 180ff. Structure and Management of the Group, p. 22 Strategy and Goals, pp. 27f. Structure and Management of the Group, pp. 22ff. Group Business Development, pp. 38f. Opportunity and Risk Report, pp. 56ff. Structure and Management of the Group, p. 23
Strategy and Analysis 102 - 14 102 - 15
Executive Board statement concerning the relevance of sustainability to Sartorius Description of the key impacts, risks, and opportunities
Report of the Executive Board, p. 8; Our Approach to Sustainability, p. 85 Opportunity and Risk Report, pp. 55ff.
Ethics and Integrity 102 - 16
Organization’s values, principles, standards and norms of behavior such as codes of conduct and codes of ethics
Report and Declaration on Corporate Governance, pp. 70ff.; Our Approach to Sustainability, p. 85
Governance 102 - 18 Governance structure of the organization, including
committees of the highest governance body Structure and Management of the Group, p. 22
Stakeholder Engagement 102 - 40 102 - 42 102 - 43 102 - 44
List of stakholders groups Basis for identification and selection of stakeholders with whom to engage Approach to stakeholder engagement Key topics and concerns that have been raised through stakeholder engagement
Our Approach to Sustainability, pp. 86f. Our Approach to Sustainability, pp. 86f Our Approach to Sustainability, pp. 86f Our Approach to Sustainability, pp. 86f
Identified Material Aspects and Boundaries 102 - 45 102 - 46 102 - 47
Entities included in the organization’s consolidated financial statements or equivalent documents Process for defining the report content and the aspect boundaries Material aspects identified in the process for defining report content
Our Approach to Sustainability, p. 86 Our Approach to Sustainability, p. 86 Our Approach to Sustainability, p. 86 f.
Report Profile 102 - 50 102 - 53 102 - 54 102 - 55 102 - 56
Reporting period Contact point for questions regarding the report Claims of reporting in accordance with the GRI Standards GRI content index External assurance
Our Approach to Sustainability, p. 85. Supplementary Information, p. 183 Our Approach to Sustainability, p. 85 GRI Content Index, pp. 101ff. Independent Auditor’s Report, p. 104
1 Reference to additional information voluntarily provided
GRI-Content Index1

102 Group Management Report GRI-Content Index
Category: Economic
Specific Standard Disclosures
Page
Aspect: Economic Performance
103 201 - 1
Disclosures on Management Approach Direct economic value generated and distributed
Explanatory Report of the Executive Board, p. 69 Annual Financial Statements of Sartorius AG, p. 51 Net Worth and Financial Position, p. 39 Remuneration Report, pp. 75f.
Aspect: Anti-corruption
103 205 - 2 205 - 3
Disclosures on Management Approach Communication and training on anti-corruption policies and procedures Confirmed incidents of corruption and actions taken
A Reliable Partner, p. 95 A Reliable Partner, p. 96 A Reliable Partner, p. 96
Category: Environmenta
Specific Standard Disclosures
Page
Aspect: Materials
103 301 - 2
Disclosures on Management Approach Recycled input materials used
Shaping the Future, p. 98 A Reliable Partner, p. 100.
Aspect: Energy 103 302 - 1
Disclosures on Management Approach Energy consumption within the organization
A Reliable Partner, p. 97 A Reliable Partner, p. 99
Aspect: Water 103 303 - 1
Disclosures on Management Approach Water withdrawal by source
Shaping the Future, pp. 97f. A Reliable Partner, pp. 98f.
Aspect: Biodiversity 103 304 - 2
Disclosures on Management Approach Significant impacts of activities, products, and services on biodiversty
A Reliable Partner, pp. 98f. A Reliable Partner, pp. 99f.
Aspect: Emissions 103 305 - 1 305 - 2
Disclosures on Management Approach Direct greenhouse gas (GHG) emissions (Scope 1) Energy indirect greenhouse gas (GHG) emissions (Scope 2)
A Reliable Partner, p. 97 A Reliable Partner, p. 97, p. 99 A Reliable Partner, p. 97, p. 99
Aspect: Water Discharge and Waste 103 306 - 1
Disclosures on Management Approach Total water discharge by quality and destination
Shaping the Future, p. 98 A Reliable Partner, p. 98
Aspect: Environmental Compliance
103 307 - 1
Disclosures on Management Approach Non-compliance with environmental laws and regulations
Opportunity and Risk Report, p. 60; A Reliable Partner, p. 97 A Reliable Partner, pp. 97f.

Group Management Report GRI-Content Index 103
Category: Social
Specific Standard Disclosures
Page
Labor Practices and Decent Work
Aspect: Employment 103 401 - 1
Disclosures on Management Approach Total number and rates of new employee hires and employment turnover by age group, gender, and region
Shaping the Future, pp. 91ff. Shaping the Future, pp. 94f.
Aspect: Training and Education 103 404 - 2
Disclosures on Management Approach Programs for skills management and lifelong learning that support the continued employability of employees and assist them in managing career endings
Shaping the Future, p. 92 Shaping the Future, p. 92
Aspect: Diversity and Equal Opportunity 103 405 - 1
Disclosures on Management Approach Composition of governance bodies and breakdown of employees per employee category according to gender, age group, minority group membership, and other indicators of diversity
Report and Declaration on Corporate Governance, pp. 69ff.; Shaping the Future, p. 92 Report and Declaration on Corporate Governance, p.73.; Shaping the Future, p. 92
Human Rights
Aspect: Child Labor 103 408 - 1
Disclosures on Management Approach Operations and suppliers identified as having significant risk for incidents of child labor, and measures taken to contribute to the effective abolition of child labor
A Reliable Partner, p. 96 A Reliable Partner, p. 95
Society
Aspect: Socioeconomic Compliance
103 419 - 1
Disclosures on Management Approach Non-compliance with laws and regulations in the social and economic area
Description of the Key Features of the Internal Control and Risk Management System, pp. 67f. A Reliable Partner, p. 95

104 Group Management Report Report of the Independent Auditor
Limited Assurance Report of the Independent Auditor regarding the Non-financial Group Statement1)
To the Supervisory Board of Sartorius Aktiengesellschaft, Göttingen
We have performed an independent limited assurance engagement on the Non-Financial Declaration of Sartorius AG, Göttingen, (further „Sartorius“) and the group as well as the by reference qualified parts “Structure and Management of the Group” and “Business Model, Strategy and Goals” (further: „Report“) according to §§ 315b and 315c in conjunction with 289c to 289e German Commercial Code (HGB) for the business year from January 1 to December 31, 2018.
Management’s Responsibility
The legal representatives of Sartorius are responsible for the preparation of the Report in accordance with §§ 315b and 315c in conjunction with 289c to 289e HGB.
This responsibility of the legal representatives includes the selection and application of appropriate methods to prepare the Report and the use of assumptions and estimates for individual disclosures which are reasonable under the given circumstances. Furthermore, this responsibility includes designing, implementing and maintaining systems and processes relevant for the preparation of the Report in a way that is free of – intended or unintended – material misstatements.
1) Our engagement applied to the German version of the Statement 2017. This text is a translation of the Independent Assurance Report issued in German language, whereas the German text is authoritative.
Independence and quality assurance on the part of the auditing firm
We are independent from the entity in accordance with the requirements of independence and quality assurance set out in legal provisions and professional pronouncements and have fulfilled our additional professional obligations in accordance with these requirements.
Our audit firm applies the national statutory provisions and professional pronouncements for quality assurance, in particular the Professional Code for German Public Auditors and Chartered Accountants (in Germany) and the quality assurance standard of the German Institute of Public Auditors (Institut der Wirtschaftsprüfer, IDW) regarding quality assurance requirements in audit practice (IDW QS 1).
Practitioner’s Responsibility
Our responsibility is to express a conclusion on the Report based on our work performed within our limited assurance engagement.
We conducted our work in accordance with the International Standard on Assurance Engagements (ISAE) 3000 (Revised): “Assurance Engagements other than Audits or Reviews of Historical Financial Information” published by IAASB. This Standard requires that we plan and perform the assurance engagement to obtain limited assurance whether any matters have come to our attention that cause us to believe that the Report of the entity for the business year January 1 to December 31, 2018 has not been prepared, in all material respects, in accordance with §§ 315b and 315c in conjunction with 289c to 289e HGB. We do not, however, provide a separate conclusion for each disclosure. In a limited assurance engagement the evidence gathering procedures are more limited than in a reasonable assurance engagement and therefore significantly less assurance is obtained than in a reasonable assurance engagement. The choice of audit procedures is subject to the auditor’s own judgement.
Report of the Independent Auditor

Group Management Report Report of the Independent Auditor 105
Within the scope of our engagement, we performed amongst others the following assurance procedures:
– Inquiries of personnel on group level, who are responsible for the materiality analysis, in order to gain an understanding of the processes for determining material sustainability topics and respective reporting boundaries of Sartorius
– A risk analysis, including a media search, to identify relevant information on Sartorius sustainability performance in the reporting period.
– Reviewing the suitability of internally developed Reporting Criteria.
– Evaluation of the design and implementation of the systems and processes for determining, processing and monitoring disclosures relating to environmental, employee and social matters, respect for human rights, and combating corruption and bribery, including the consolidation of the data.
– Inquiries of personnel on group level who are responsible for determining disclosures on concepts, due diligence processes, results and risks, for conducting internal controls and consolidation of the disclosures.
– Evaluation of selected internal and external documentation.
– Analytical evaluation of data and trends of quantitative information which are reported by all sites for consolidation on group level.
– Evaluation of local data collection, validation and reporting processes as well as the reliability of reported data based on a sample of the sites in Göttingen (Germany) and Bangelore (India).
– Assessment of the overall presentation of the disclosures.
Conclusion
Based on the procedures performed and the evidence obtained, nothing has come to our attention that causes us to believe that the Report of Sartorius for the business year from January 1 to December 31, 2018 is not prepared, in all material respects, in accordance with §§ 315b and 315c in conjunction with 289c to 289e HGB.
Restriction of use / AAB clause
This assurance report is issued for purposes of the Supervisory Board of Sartorius Aktiengesellschaft, Göttingen, only. We assume no responsibility with regard to any third parties.
Our assignment for the Supervisory Board of Sartorius AG, Göttingen, and professional liability is governed by the General Engagement Terms for Wirtschaftsprüfer and Wirtschaftsprüfungsgesellschaften (Allgemeine Auftragsbedingungen für Wirtschaftsprüfer und Wirtschaftsprüfungsgesellschaften) in the version dated January 1, 2017 (https://www.kpmg.de/bescheinigungen/lib/aab_english.pdf). By reading and using the information contained in this report, each recipient confirms notice of provisions of the General Engagement Terms (including the limitation of our liability for negligence to EUR 4 million as stipulated in No. 9) and accepts the validity of the General Engagement Terms with respect to us.
Munich, February 5, 2019
KPMG AG Wirtschaftsprüfungsgesellschaft
Signed by
Hell ppa. Dollhofer Auditor

106 Group Management Report Report of the Independent Auditor

Consolidated Financial Statements and Notes

108 Consolidated Financial Statements and Notes Statement of Profit or Loss | Other Comprehensive Income
Notes 2018 ¤ in K
2017 € in K
Sales revenue [9] 1,566,033 1,404,569
Cost of sales [10] –762,430 –697,726
Gross profit on sales 803,604 706,844
Selling and distribution expenses [10] –329,830 –296,838
Research and development expenses [10] –78,201 –68,779
General administrative expenses [10] –94,235 –83,296
Other operating income and expenses [11] –2,724 –38,574
Earnings before interest and taxes (EBIT) 298,614 219,357
Financial income [12] 7,663 13,557
Financial expenses [12] –35,582 –31,730
Financial result –27,919 –18,173 Profit before tax 270,695 201,185
Income taxes [13] –73,217 –41,859
Net profit for the period 197,478 159,326
Attributable to:
Equity holders of Sartorius AG 141,342 114,730
Non-controlling interest 56,135 44,596
Earnings per share [14] Earnings per ordinary share (€) (basic = undiluted) 2.06 1.67
Earnings per ordinary share (€) (diluted) 2.06 1.67
Earnings per preference share (€) (basic = undiluted) 2.07 1.68
Earnings per preference share (€) (diluted) 2.07 1.68
The figures for the reporting period 2017 have been restated due to finalization of the purchase price allocation for the acquisition of Essen BioScience. See note 8 for details.
Statement of Profit or Loss | Other Comprehensive Income

Consolidated Financial Statements and Notes Statement of Profit or Loss | Other Comprehensive Income 109
Statement of Comprehensive Income
2018 ¤ in K
2017 € in K
Net profit for the period 197,478 159,326 Cash flow hedges –14,480 33,473
Of which effective portion of the changes in fair value –24,627 34,032
Of which reclassified to profit or loss 10,147 –559
Income tax on cash flow hedges 4,344 –10,042
Net investment in a foreign operation 17,719 –45,250
Income tax on net investment in a foreign operation –5,314 1,173
Currency translation differences 5,649 –27,208
Items that may be reclassified to profit or loss, net of tax 7,918 –47,854 Remeasurements of the net defined benefit liability 692 –417
Income tax on remeasurements of the net defined benefit liability –733 –1,024
Items that will not be reclassified to profit or loss, net of tax –41 –1,441 Other comprehensive income after tax 7,877 –49,295 Total comprehensive income 205,355 110,031
Attributable to:
Equity holders of Sartorius AG 149,500 67,795
Non-controlling interest 55,855 42,236
The Notes to the Consolidated Financial Statements are an integral part of these statements.

110 Consolidated Financial Statements and Notes Statement of Financial Position
Notes Dec. 31, 2018
¤ in K Dec. 31, 2017
€ in K
Non-current assets Goodwill [15] 662,229 653,929
Other intangible assets [15] 401,027 427,346
Property, plant and equipment [16] 659,608 507,992
Financial assets 28,781 20,145
Other assets 678 36
Deferred tax assets [18] 20,606 16,242
1,772,929 1,625,690
Current assets Inventories [19] 321,695 246,124
Trade receivables [28] 307,364 282,206
Other financial assets [29] 29,256 28,231
Current tax assets 15,360 26,184
Other assets 35,106 24,660
Cash and cash equivalents [27] 45,164 59,423
Assets classified as held for sale 0 5,201
753,946 672,029 2,526,875 2,297,720
Notes Dec. 31, 2018
¤ in K Dec. 31, 2017
€ in K
Equity Equity attributable to Sartorius AG shareholders 740,568 617,793 Issued capital [20] 68,388 68,388
Capital reserves [21] 40,161 39,657
Other reserves and retained earnings [21] 632,018 509,748
Non-controlling interest [22] 232,822 188,766 973,389 806,559
Non-current liabilities Pension provisions [23] 64,724 64,945
Other provisions [24] 7,820 7,746
Loans and borrowings [30] 878,538 869,830
Finance lease liabilities [30] 16,108 17,568
Other financial liabilities [31] 21,913 51,360
Deferred tax liabilities [18] 83,684 86,046
1,072,787 1,097,494
Current liabilities Provisions [24] 16,260 13,351
Trade payables [32] 173,454 139,201
Loans and borrowings [30] 107,314 64,574
Finance lease liabilities [30] 2,664 2,998
Employee benefits 63,020 53,884
Other financial liabilities [33] 25,075 44,140
Current tax liabilities 38,070 35,400
Other liabilities [25] 54,843 40,120
480,699 393,668 2,526,875 2,297,720
The figures for the reporting period 2017 have been restated due to finalization of the purchase price allocation for the acquisition of Essen BioScience. See note 8 for details.
Statement of Financial Position

Consolidated Financial Statements and Notes Statement of Cash Flows 111
Notes 2018
¤ in K 2017
€ in K
Profit before tax 270,695 198,588
Financial result [12] 27,919 20,769
Earnings before interest and taxes (EBIT) 298,614 219,357 Depreciation | amortization of intangible and tangible assets [15] [16] 113,374 98,360
Increase | decrease in provisions [24] 2,097 –4,741
Gains from the disposal of fixed assets –466 0
Income taxes paid [13] –69,571 –54,591
Other non-cash transactions –31,869 5,869
Gross cash flows from operating activities 312,179 264,256 Increase | decrease in receivables [28] [29] –44,655 –53,479
Increase | decrease in inventories [19] –73,705 –20,632
Increase | decrease in liabilities 50,706 16,364
Net cash flow from operating activities 244,524 206,509
Capital expenditures [15] [16] –233,184 –197,104
Proceeds from the disposal of fixed assets 6,803 0
Other payments –16,103 –2,000
Net cash flow from investing activities –242,484 –199,104 Payments for acquisitions of consolidated subsidiaries and other business operations; net of cash acquired [8] 0 –355,947
Net cash flow from investing activities and acquisitions –242,484 –555,051
Interest received [12] 3,148 328
Interest paid and other financial charges [12] –23,229 –17,148
Dividends paid to:
- Shareholders of Sartorius AG –34,536 –31,116
- Non-controlling interest –11,699 –10,708
Gross cash flows from financing activities –66,316 –58,644 Loans and borrowings raised [6] [30] 90,787 510,815
Loans and borrowings repaid [6] [30] –41,170 –104,304
Net cash flow from financing activities –16,699 347,867
Net increase | decrease in cash and cash equivalents –14,658 –674
Cash and cash equivalents at the beginning of the period 59,423 62,027
Net effect of currency translation on cash and cash equivalents 400 –1,930
Cash and cash equivalents at the end of the period 45,164 59,423
Statement of Cash Flows

112 Consolidated Financial Statements and Notes Statement of Changes in Equity
€ in K Issued
capital Capital
reserves
Cash flow hedging reserves
Pension reserves
Retained earnings
Foreign currency
translation reserves
Equity attribu-table to
Sartorius AG share-
holders
Non-controlling interest
Total equity
Balance at Jan. 1, 2017 68,388 38,415 –7,301 –17,663 473,555 24,275 579,669 157,133 736,802 Net profit for the period 0 0 0 0 114,730 0 114,730 44,596 159,326
Cash flow hedges 0 0 26,704 0 0 0 26,704 6,769 33,473
Remeasurements of the net defined benefit liability 0 0 0 –245 0 0 –245 –172 –417
Currency translation differences 0 0 0 0 0 –20,157 –20,157 –7,051 –27,208
Net investment in a foreign operation 0 0 0 0 –45,250 0 –45,250 0 –45,250
Tax effects 0 0 –8,010 –1,149 1,173 0 –7,986 –1,907 –9,893
Other comprehensive income after tax 0 0 18,693 –1,394 –44,077 –20,157 –46,935 –2,360 –49,295
Total comprehensive income 0 0 18,693 –1,394 70,653 –20,157 67,795 42,236 110,031 Share-based payments 0 1,242 0 1,242 0 1,242
Dividends –31,116 –31,116 –10,708 –41,824
Other changes in equity 203 0 203 105 308
Balance at Dec. 31, 2017 68,388 39,657 11,392 –19,057 513,295 4,118 617,793 188,766 806,559
Adjustment on adoption of IFRS 9 431 431 431
Balance at Jan. 1, 2018 68,388 39,657 11,392 –19,057 513,726 4,118 618,224 188,766 806,990 Net profit for the period 0 0 0 0 141,342 0 141,342 56,135 197,478
Cash flow hedges 0 0 –11,508 0 0 0 –11,508 –2,972 –14,480
Remeasurements of the net defined benefit liability 0 0 0 571 0 0 571 121 692
Currency translation differences 0 0 0 0 0 3,929 3,929 1,721 5,649
Net investment in a foreign operation 0 0 0 0 17,719 0 17,719 0 17,719
Tax effects 0 0 3,453 –692 –5,314 0 –2,553 850 –1,703
Other comprehensive income after tax 0 0 –8,055 –121 12,405 3,929 8,158 –281 7,877
Total comprehensive income 0 0 –8,055 –121 153,747 3,929 149,500 55,855 205,355 Share-based payments 0 504 0 504 0 504
Dividends –34,536 –34,536 –11,699 –46,235
Purchase price liability Israel 7,081 7,081 0 7,081
Other changes in equity –205 –205 –100 –305
Balance at December 31, 2018 68,388 40,161 3,337 –19,178 639,813 8,046 740,568 232,822 973,389
Statement of Changes in Equity

Consolidated Financial Statements and Notes Statement of Changes in Equity 113
The dividends paid per share are as follows:
Per share
in ¤
2018 total ¤ in K
Per share in €
2017 total
€ in K
Dividend for ordinary shares 0.50 17,106 0.45 15,396
Dividend for preference shares 0.51 17,430 0.46 15,721
34,536 31,116

114 Consolidated Financial Statements and Notes Notes to the Financial Statements
1. General Information
Sartorius AG is a listed joint stock corporation established according to German law and is the highest-level parent company of the Sartorius Group. The corporation is recorded in the German Commercial Register of the District Court of Göttingen (HRB 1970) and is headquartered at Otto-Brenner-Str. 20 in Göttingen, Federal Republic of Germany.
The Sartorius Group is a leading international partner of biopharmaceutical research and the industry. With innovative laboratory instruments and consumables, the Group’s Lab Products & Services Division (LPS) concentrates on serving the needs of laboratories performing research and quality control at pharma and biopharma companies and those of academic research institutes. The Bioprocess Solutions Division (BPS) with its broad product portfolio focusing on single-use solutions helps customers to manufacture biotech medications and vaccines safely and efficiently
In compliance with § 315a, Subsection 1, of the Ger-man Commercial Code (HGB) in conjunction with Art. 4 of the Regulation (EC) No. 1606/2002 of the European Parliament and Council, dated July 19, 2002 (OJ L243 p. 1), the consolidated financial statements of the Sartorius Group for the year ended December 31, 2018, were prepared according to the IFRS and IFRIC Standards and Interpretations of the International Accounting Standards Board (IASB) as required to be applied by the European Union. These are available on the following site:
https://ec.europa.eu/info/business-economy-euro/company-reporting-and-auditing/company-reporting/financial-reporting_en.
The consolidated financial statements are prepared in euros. Unless otherwise specified, all amounts are disclosed in thousands of euros (abbreviated as € in K). In some cases, the sums of the figures given in this report may not precisely equal the stated totals, and percentages may not be exact due to rounding.
The Executive Board is scheduled to submit the consolidated financial statements on February 14 2019, to the Supervisory Board.
2. Effects from New or Amended Standards
Standards to Be Applied for the First Time in 2018
In particular, the following new accounting rules were applicable for the first time to the present consolidated financial statements of the Group:
– IFRS 9, Financial Instruments
This standard changes the accounting for financial instruments. For detailed information on these changes and the initial application of IFRS 9, see note 26.
– IFRS 15, Revenue from Contracts with Customers
– Clarifications to IFRS 15, Revenue from Contracts with Customers
This standard defines when and in which amount revenue is recognized. For detailed information on the related changes and the initial application of IFRS 15, see note 9.
The following new accounting rules were applicable for the first time to the present financial statements and had no material impact on the presentation of the company’s financial position and financial performance:
– Annual Improvements to IFRSs 2014 - 2016 Cycle, Amendments to IFRS 1 and IAS 28
The amendments are related to the first-time application of IFRS (IFRS 1) as well as the option for venture capital organizations and similar organizations to measure investments in associates or joint ventures at fair value through profit or loss (IAS 28).
– Amendments to IFRS 2, Classification and Measurement of Share-based Payment Transactions
The amendments include clarifications with regard to the accounting for share-based payment transactions.
– Amendments to IAS 40, Transfers of Investment Property
The amendments intend to clarify the guidance regarding transfers to, or from, investment properties.
– IFRIC 22, Foreign Currency Transactions and Advance Consideration
Notes to the Financial Statements

Consolidated Financial Statements and Notes Notes to the Financial Statements 115
The IFRIC 22 Interpretation addresses a question in relation to IAS 21. It clarifies which date of a transaction is to be used for translation when a foreign currency transaction involves an advance payment or receipt. The date of the transaction that is decisive for determining the exchange rate is the date on which this transaction first qualifies for initial recognition of the related asset, income or expense when an entity has received or paid advance consideration in a foreign currency.
New Standards and Interpretations Not Yet Applied
The Standards, Interpretations and Amendments to standards in the following were not yet applied to the consolidated financial statements of the reporting year as they had not yet been adopted by the EU or their application was not mandatory for 2018:
Standard | Interpretation Title
Applicable for financial years from1)
Endorsement by the
EU Commission
IFRS 14 Regulatory Deferral Accounts January 1, 2016 No
IFRS 16 Leases January 1, 2019 Yes
IFRIC 23 Uncertainty over Income Tax Treatments January 1, 2019 Yes
Amendments to IFRS 9 Prepayment Features with Negative Compensation January 1, 2019 Yes
Amendments to IAS 28 Long-term Interests in Associates and Joint Ventures January 1, 2019 No
Amendments to IFRS 3, IFRS 11, IAS 12 and IAS 23 Annual Improvements to IFRSs 2015 - 2017 Cycle (issued in Dec. 2017) January 1, 2019 No
Amendments to IAS 19 Plan Amendment, Curtailment or Settlement January 1, 2019 No
Amendments to IAS 1 and IAS 8 Definition of Material January 1, 2020 No
Various Standards / Framework Amendments to References to the Conceptual Framework in IFRS Standards January 1, 2020 No
Amendments to IFRS 3 Definition of a Business January 1, 2020 No
IFRS 17 Insurance Contracts January 1, 2021 No
Amendments to IFRS 10 and IAS 28 Sale or Contribution of Assets between an Investor and its Associate or Joint Venture n/a No
1) Application mandatory as adopted by the EU Commission. The standards themselves require earlier compulsory application. The Group does not plan to adopt any standard early.
IFRS 16, Leases
The Group did not yet apply IFRS 16, Leases, as the application of this Standard was not yet mandatory for the reporting period and will not be required until 2019 and onwards. IFRS 16 introduces a standardized accounting model according to which leases are gen-erally to be recognized on the lessee's balance sheet. A lessee recognizes a right-of-use asset representing its right to use a lease asset, as well as a liability resulting from the lease, which represents its obligation to make lease payments. There are exemptions for short-term leases and leases of low-value assets. Accounting for the lessor is comparable to that of the current Standard; i.e., lessors continue to classify leases as financial or operating leases.
The Group has analyed the effects of this new Standard on the consolidated financial statements during the reporting period 2018. The Group did not apply this standard early. It does not plan to apply the Standard retrospectively in accordance with IAS 8, but
rather to recognize the effect from initially applying IFRS 16 in consolidated retained earnings at the date of the Standard's initial application. The Group intends to use the exemptions for short-term leases and leases of low-value assets and to recognize the corresponding lease payments as an expense generally on a straight-line basis over the particular lease term.
IFRS 16 will lead to an increase in fixed assets and financial liabilities. Based on its present level of knowledge, the Group does not expect any significant impacts overall on its key figures, such as equity ratio or underlying EBITDA. During the preparation of the present consolidated financial statements, the Group analyzed its operating lease commitments in detail (see also note 17). On this basis, a balance sheet extension by about €55 million would be yielded for the period ended December 31, 2018. This would correspond to a reduction in the equity ratio by about one percentage point. Based on this analysis , the calculated full-year EBITDA margin would approximately increase by about one percentage point.

116 Consolidated Financial Statements and Notes Notes to the Financial Statements
3. Significant Accounting Policies
Basis of Preparation
The consolidated financial statements of the Group are based on the principle of the historical cost of acquisition, construction or production, with the exception of the items disclosed at fair value, such as derivative financial instruments.
Scope of Consolidated Financial Statements
The consolidated financial statements of Sartorius AG include the annual financial statements of all major companies, which are controlled directly or indirectly by Sartorius AG. In terms of IFRS 10, Consolidated Financial Statements, a controlling interest exists if the following criteria are met:
– Power, i.e., an investor must have existing rights that give it the current ability to direct the relevant activities of an investee with respect to the latter's returns
– Exposure, or rights, to variable returns from an investee
– Ability to use power in such a way that significantly affects the investee's returns
Such investees are included in the consolidated financial statements from the time when Sartorius AG or its subsidiaries acquire such control. They are no longer included as of the time control is transferred to an entity outside the Group.
Subsidiaries are included on the basis of their annual financial statements for the same reporting period as the parent company, using uniform Group recognition and measurement methods.
All intragroup assets and liabilities, equity, income, expenses and cash flows relating to transactions between members of the Group are eliminated in full on consolidation.
Business Combinations
Business combinations are measured according to the acquisition method. The identifiable assets acquired by the Group as well as liabilities and contingent liabilities assumed are recorded at fair value on the date of combination.
For significant acquisitions, the purchase price allocation is generally carried out with the assistance of independent third-party valuation specialists. The valuations are based on the information available at the acquisition date.
Expenses directly related to business combinations are reported in the profit for the period.
Foreign Currency Translation
Subsidiaries’ annual financial statements prepared in foreign currencies have been translated pursuant to IAS 21, The Effects of Changes in Foreign Exchange Rates, in accordance with the concept of a functional currency. Foreign subsidiaries are regarded as independent subdivisions of the Sartorius Group. Items on the statement of financial position are translated at the exchange rates on the reporting date. An exception to this is equity of consolidated subsidiaries, which is translated at historical cost. Income and expense items are converted at the average rates. Any translation differences resulting from the use of different exchange rates for items on the statement of financial position and the statement of profit or loss are recognized in the other comprehensive income in shareholders’ equity. By contrast, currency gains and losses in connection with financing activities, for example, from loans in foreign currencies, are recognized in the financial result.
In the individual financial statements of the consolidated companies, transactions in foreign currencies are translated to the functional currency of the company at the exchange rate on the date of the transaction. Monetary assets and liabilities denominated in a foreign currency are translated at the closing rate on the reporting date. Gains and losses on foreign currency transactions are recognized in other operating income or expenses. By contrast, currency gains and losses in connection with financing activities, such as loans in a foreign currency, are recognized in the financial result.
For certain defined loans granted on a long-term basis and for which repayment is neither planned nor probable, the Group applies the principle of "net investments in a foreign operation." The foreign currency translation differences resulting from these loans are recognized in other comprehensive income according to IAS 21.32.
The exchange rates for major currencies against the euro were considered as follows:

Consolidated Financial Statements and Notes Notes to the Financial Statements 117
Year-end exchange rates Average annual
exchange rates
2018 2017 2018 2017
USD 1.14500 1.19930 1.18129 1.12955
GBP 0.89453 0.88723 0.88465 0.87670
CHF 1.12690 1.17020 1.15517 1.11173
JPY 125.85000 135.01000 130.40242 126.70218
INR 79.72980 76.60550 80.69389 73.52751
KRW 1277.9300 1279.6100 1299.12464 1276.62397
CNY 7.87510 7.80440 7.80666 7.62790
Non-current Assets and Disposal Groups Held for Sale
According to IFRS 5, a non-current asset (or a disposal group) must be classified as held for sale if its carrying amount will be recovered principally through a sale transaction rather than through continuing use. This is the case if the asset (or disposal group) is available for immediate sale in its present condition and its sale is highly probable. A sale is considered highly probable if the appropriate level of management has committed to a plan to sell the asset; an active program to locate a buyer and complete the plan has already been initiated; an offer to sell the asset or disposal group at a reasonable price has been made; the sale is expected to be recognized as completed within twelve months from the date of classification; and if it is unlikely that significant changes to the plan will be made or that the plan will be withdrawn.
Non-current assets (or disposal groups) classified as held for sale are to be measured at the lower of their carrying amount and fair value less costs to sell. These assets are then no longer depreciated or amortized.
4. Critical Accounting Judgment and Key Sources of Estimation Uncertainty
During the preparation of consolidated financial statements, management uses estimates and assumptions based on their best knowledge of the current and future situation of the period. However, actual results may differ from these estimates. These estimates and assumptions are therefore revised on a regular basis, and the impact of all changes is immediately recognized in the statement of profit or loss for the period.
In addition, Group management exercises its judgment in defining the accounting treatment of specific transactions when the existing standards and interpretations do not explicitly treat the accounting problems concerned.
Assumptions and estimates primarily concern the following facts:
Business Combinations
Accounting for acquisitions requires certain estimates and assumptions to be made, especially concerning the fair value of the intangible assets and the property, plant and equipment acquired, the liabilities assumed on the acquisition date, as well as the useful lives of the intangible assets and of the property, plant and equipment acquired.
Their measurement is largely based on projected cash flows. Differences between the expected and actual cash flows may have a material impact on future Group results.
Impairment of Assets
The book values (carrying amounts) of property, plant and equipment and intangible assets are examined on whether there is any indication that an asset might be impaired, pursuant to IAS 36, Impairment of Assets. If there is any indication that an asset is impaired, the recoverable amount of the asset is estimated. The recoverable amount of an asset or a cash-generating unit is the higher of its fair value – less costs to sell the asset or its CGU – and its value in use. In the event the individual asset’s recoverable amount cannot be estimated, the recoverable amount of the asset’s cash-generating unit (CGU) is estimated.

118 Consolidated Financial Statements and Notes Notes to the Financial Statements
If the estimated recoverable amount of an asset (or a CGU) goes below its book value (carrying amount), this carrying amount must be reduced to the recoverable amount.
If the causes of the asset impairment are removed, the book value of the asset (or the CGU) is credited to the newly estimated recoverable amount (except for goodwill). However, the book value increase is limited to the value that the asset (or CGU) would have had if no asset impairment loss would have been assessed in previous financial years.
The calculation of the value in use is generally based on discounted cash flow methods that use cash flow projections of up to five years. These projections take into account past experiences and represent management's best estimates about future sales revenue and cost developments. Cash flows after the planning period are extrapolated using individual growth rates. Key assumptions on which management has based its determination of the value in use include estimated growth rates, weighted average cost of capital and tax rates. These estimates can have a material impact on the respective values and ultimately on the amount of any impairment. If the carrying amount exceeds the recoverable amount, an impairment loss is recognized.
Intangible Assets
The capitalization of self-constructed intangible assets includes a certain level of estimates and assumptions, e.g., the evaluation of the technical feasibility of a development project, its expected market prospects and determination of its useful live.
Employee Benefits – Provisions for Pension Obligations
Obligations for pensions and other post-employment benefits are determined in accordance with actuarial valuations. These valuations rely on key assumptions including discount rates, expected salary increases and mortality rates. The discount rate assumptions are determined by reference to market yields on high-quality, fixed-interest corporate bonds of appropriate duration and currency at the end of the reporting period.
Due to changing market and economic conditions, the underlying key assumptions may differ from actual developments and may lead to significant changes in pension obligations and other post-employment benefit obligations.
Such differences are recognized in full directly in equity in the period in which they occur without affecting profit or loss. For a sensitivity analysis, see Section 23 "Pension and Employee Benefits Provisions."
Provisions, Contingent Liabilities and Contingent Assets
Provisions are recognized for legal or constructive obligations that exist with respect to third parties at the end of the reporting date. To determine the amount of the obligations, certain estimates and assumptions need to be applied, including an evaluation of the probability that such an obligation could occur, and the amount of costs incurred. Typically, significant uncertainties are involved in the determination of provisions related to onerous contracts, warranty costs, closure of business locations, asset retirement obligations and legal proceedings.
Income Taxes
The Group operates in various tax jurisdictions and therefore must determine tax positions under respective local tax laws and tax authorities’ views, which can be complex and subject to different interpretations of taxpayers and local tax authorities.
Deferred tax assets have to be recognized for all deductible temporary differences and unused tax losses to the extent that it is probable that future taxable profit will be available against which the deductible temporary differences and unused tax losses can be utilized. As future developments are uncertain and partly beyond management’s control, assumptions are necessary to estimate future taxable profits as well as the period in which deferred tax assets will be recovered.
Estimates are revised in the period in which there is sufficient evidence to revise the assumption. If management considers it probable that all or a portion of a deferred tax asset cannot be realized, a corresponding valuation allowance is taken into account.

Consolidated Financial Statements and Notes Notes to the Financial Statements 119
Fair Value Measurement
A number of the Group’s accounting policies and disclosures require the measurement of fair values, for both financial and non-financial assets and liabilities, including Level 3 fair values (unobservable inputs).
If third party information, such as broker quotes or pricing services, is used to measure fair values, then management assesses the evidence obtained from the third parties to support the conclusion that these valuations meet the requirements of IFRS, including the level in the fair value hierarchy in which the valuations should be classified.
When measuring the fair value of an asset or a liability, the Group uses observable market data as far as possible.
If the inputs used to measure the fair value of an asset or a liability fall into different levels of the fair value hierarchy, then the fair value measurement is categorized in its entirety in the same level of the fair value hierarchy as the lowest level input that is significant to the entire measurement.
5. Operating Segments
According to IFRS 8, Operating Segments, the identification of reportable operating segments is based on the "management approach"; i.e., the segments are defined analogously to the internal control and reporting structure of an entity. Therefore, an area of activity is to be considered an operating segment if its business activities may result in revenues and expenses, its operating results are regularly reviewed by the entity's chief operating decision maker (= the Executive Board of Sartorius AG) and discrete financial information is available in its internal reporting. Consequently, the divisions called Bioprocess Solutions and Lab Products & Services are to be considered operating segments. Essential criteria for their definition are the products sold in the divisions and their particular customer groups.
“Underlying EBITDA" is the key performance indicator of the operating segments of the Group, as management uses this performance measure to control the Group and segments. EBITDA corresponds to earnings before interest (financial result), taxes, depreciation and amortization. “Underlying EBITDA” means EBITDA adjusted for extraordinary items. In this connection, extraordinary items are expenses and income that are of an exceptional or a one-time nature and accordingly distort the sustainable profitability of a segment and have a material impact on the net worth, financial position and earnings of the Group. Examples of such items are restructuring expenses, large Group projects and proceeds or losses from the disposal, sale or other transfer of financial assets or of property, plant and equipment, provided that these are not of a recurrent nature.
"Underlying EBITDA" is not a defined performance measure in IFRS. The Group’s definition of underlying EBITDA might not be comparable with similarly titled performance measures and disclosures by other entities.
Apart from that, the recognition and measurement methods for the reportable segments conform to the general Group accounting principles.
For intersegment receivables and payables, internal transfer prices are set at prices corresponding to those that would have been agreed upon with external third parties in the particular situation and under the given framework conditions. Essentially, these prices are calculated by applying the cost-plus-margin method and the resale price method or a combination of the two methods. The methods for determining the internal transfer prices are documented promptly and continuously maintained. The volume of such inter-segment receivables and payables is immaterial.
Segment assets and segment liabilities are not reported on a regular basis to the chief operating decision maker and are therefore not part of the segment report.

120 Consolidated Financial Statements and Notes Notes to the Financial Statements
Sales revenue Underlying EBITDA € in K 2018 2017 2018 2017
Bioprocess Solutions 1,143,054 1,010,343 326,871 282,419
Lab Products & Services 422,980 394,227 78,116 70,789
Total 1,566,033 1,404,569 404,987 353,208
Reconciliation to the profit before tax Depreciation and amortization –104,702 –98,328
Extraordinary items –1,671 –35,522
Earnings before interest and taxes (EBIT) 298,614 219,357 Financial result –27,919 –18,173
Profit before tax 270,695 201,185
The figures for the reporting period 2017 have been restated due to finalization of the purchase price allocation for the acquisition of Essen BioScience. See note 8 for details.
Depreciation and amortization Capital expenditure
€ in K 2018 2017 2018 2017
Bioprocess Solutions –68,474 –56,591 156,401 133,626
Lab Products & Services –44,900 –41,769 81,371 75,726
Total –113,374 –98,360 237,771 209,352
Geographical Information
External revenue and non-current assets are regionally distributed as follows :
Sales revenue Non-current assets
€ in K 2018 2017 2018 2017
EMEA 657,739 604,486 1,143,897 1,062,194 Of which Germany 181,833 165,837 566,500 502,404
Of which France 76,517 79,729 368,038 342,125
Americas 520,076 455,496 538,416 488,315 Of which USA 480,920 414,877 538,336 488,268
Asia | Pacific 388,218 344,587 40,551 38,757 Of which China 127,436 102,531 10,313 10,591
Of which South Korea 86,909 88,629 7,882 7,280
Group 1,566,033 1,404,569 1,722,864 1,589,267
The regional allocation of non-current assets refers to the particular company location; sales revenue is reported according to the customer’s location. The non-current assets correspond to property, plant and equipment as well as to intangible assets (including goodwill) of the Group affiliates that are to be allocated to these various regions.
In fiscal 2018 and the prior year, none of our customers accounted for more than 5% of sales revenue.

Consolidated Financial Statements and Notes Notes to the Financial Statements 121
6. Statement of Cash Flows
The statement of cash flows shows the impact of cash inflows and outflows on the cash and cash equivalents of the Group. The cash flows are classified by operating, investing and financing activities according to IAS 7, Statement of Cash Flows.
In this context, cash equivalents are assets than can be converted into cash within a short term (generally within three months). The amount considered in the statement of cash flows primarily includes cash on hand, bank balances and similar items.
The following non-cash transactions were concluded that are not reflected in the statement of cash flows:
– Additions to the fixed assets related to financial leases amounted to €68 K in 2018 and €799 K in 2017.
– The expenses incurred by granting shares to the CEO and Executive Board Chairman totaled €504 K in 2018 and €1,242 K in 2017.
– The income recognized in 2018, which results from the changes of the cooperation with Lonza, was entirely of a non-cash nature (see note 11 for further details).
Financial liabilities resulting from financing activities developed as follows:
Balance at Dec. 31, 2016
€ in K cash flows Currency
effects other non-cash
changes
Balance at Dec. 31, 2017
¤ in K
Loans and borrowings 525,996 408,520 –111 0 934,405
Finance lease liabilities 21,939 –2,009 –182 817 20,565
Liability for the acquisition of non-controlling interest in Sartorius Israel 13,809 0 –394 401 13,816
Liability for phantom units in connection with the AllPure acquisition 5,833 0 –706 155 5,282
Total financial liabilities from financing activities 567,577 406,511 –1,393 1,373 974,068
Balance at Dec. 31, 2017
€ in K cash flows Currency
effects other non-cash
changes
Balance at Dec. 31, 2018
¤ in K
Loans and borrowings 934,405 51,434 13 0 985,852
Finance lease liabilities 20,565 –1,817 –44 68 18,772
Liability for the acquisition of non-controlling interest in Sartorius Israel 13,816 0 –427 –6,654 6,735
Liability for phantom units in connection with the AllPure acquisition 5,282 0 250 3,206 8,739
Total financial liabilities from financing activities 974,068 49,617 –207 –3,380 1,020,098

122 Consolidated Financial Statements and Notes Notes to the Financial Statements
7. Scope of Consolidation
Ownership
in % Consolidated
Sartorius AG, Goettingen, Germany Parent
company X
Sartorius Stedim Biotech S.A., Aubagne, France, along with its subsidiaries: 74.3 X
EMEA Sartorius Stedim Belgium N.V., Brussels, Belgium 100.0 X
Distribo GmbH, Goettingen, Germany 26.0
Sartorius Stedim Biotech GmbH, Goettingen, Germany 100.0 X
Sartorius Stedim Plastics GmbH, Goettingen, Germany 100.0 X
Sartorius Stedim North America Holding GmbH, Goettingen, Germany 100.0 X
Sartorius Stedim Systems GmbH, Guxhagen, Germany 100.0 X
Sartorius Stedim Cellca GmbH, Laupheim, Germany 100.0 X
Sartorius Stedim Nordic Oy, Helsinki, Finland 100.0 X
Sartorius Stedim FMT S.A.S., Aubagne, France 100.0 X
Sartorius Stedim France S.A.S., Aubagne, France 100.0 X
Sartorius Stedim Aseptics S.A., Lourdes, France 100.0 X
Sartorius Stedim Ireland Ltd., Dublin, Ireland 100.0 X
Sartorius Stedim Italy S.p.A., Florence, Italy 100.0 X
Sartorius Stedim Netherlands B.V., Amersfoort, Netherlands 100.0 X
Sartorius Stedim Austria GmbH, Vienna, Austria 100.0 X
Sartorius Stedim Poland Sp. z o.o., Kostrzyn, Poland 100.0 X
LLC Sartorius Stedim RUS, St. Petersburg, Russia 100.0 X
Sartorius Stedim Data Analytics AB, Umeå, Schweden 100.0 X
Sartorius Stedim Switzerland AG, Tagelswangen, Switzerland 100.0 X
Sartorius Stedim Spain S.A., Madrid, Spain 100.0 X
Sartorius Stedim Bioprocess S.A.R.L., M'Hamdia, Tunisia 100.0 X
Sartorius Stedim Hungária Kft., Budapest, Hungary 100.0 X
Sartorius Stedim BioOutsource Ltd., Glasgow, UK 100.0 X
Sartorius Stedim UK Ltd., Epsom, UK 100.0 X
Sartorius Stedim Lab Ltd., Stonehouse, UK 100.0 X
TAP Biosystems Group Ltd., Royston, UK 100.0 X
TAP ESOP Management Ltd., Royston, UK 100.0 X
TAP Biosystems (PHC) Ltd., Royston, UK 100.0
TAP Biosystems Ltd., Royston, UK 100.0
The Automation Partnership Cambridge Ltd., Royston, UK 100.0 X
Americas Sartorius Stedim Filters Inc., Yauco, Puerto Rico 100.0 X
Sartorius Stedim North America Inc., Wilmington, Delaware, USA 100.0 X
Asia | Pacific Sartorius Stedim Australia Pty. Ltd., Dandenong South, Victoria, Australia 100.0 X
Sartorius Stedim Biotech (Beijing) Co. Ltd., Beijing, China 100.0 X
Sartorius Stedim (Shanghai) Trading Co. Ltd., Shanghai, China 100.0 X
Sartorius Stedim India Pvt. Ltd., Bangalore, India 100.0 X
Sartorius Stedim Japan K.K., Tokyo, Japan 100.0 X
Sartorius Korea Biotech Co. Ltd., Seoul, South Korea 69.0 X
Sartorius Stedim Malaysia Sdn. Bhd., Kuala Lumpur, Malaysia 100.0 X
Sartorius Stedim Singapore Pte. Ltd., Singapore, Singapore 100.0 X

Consolidated Financial Statements and Notes Notes to the Financial Statements 123
Ownership
in % Consolidated
EMEA Sartorius Belgium N.V., Brussels, Belgium 100.0 X
Sartorius Weighing Technology GmbH, Goettingen, Germany 100.0 X
Sartorius Corporate Administration GmbH, Goettingen, Germany 100.0 X
SI Weende-Verwaltungs-GmbH, Goettingen, Germany 100.0 X
SIV Weende GmbH & Co. KG, Goettingen, Germany 100.0 X
SI Grone 1-Verwaltungs-GmbH, Goettingen, Germany 100.0 X
SIV Grone 1 GmbH & Co. KG, Goettingen, Germany 100.0 X
SIV Grone 2 GmbH, Goettingen, Germany 100.0 X
SWT Treuhand GmbH, Goettingen, Germany 100.0 X
Sartorius Ventures GmbH, Goettingen, Germany 100.0 X
LabTwin GmbH, Berlin, Germany 100.0
Life Science Factory gGmbH, Goettingen, Germany 100.0
Sartorius Lab Holding GmbH, Goettingen, Germany 100.0 X
Sartorius Lab Instruments GmbH & Co. KG, Goettingen, Germany 100.0 X
Sartorius Biohit Liquid Handling Oy, Helsinki, Finland 100.0 X
Sartorius Nordic Oy, Helsinki, Finland 100.0 X
Sartorius France S.A.S., Dourdan, France 100.0 X
Sartorius Ireland Ltd., Dublin, Ireland 100.0 X
Sartorius Israel Ltd., Kibbutz Beit Haemek, Israel1) 49.0 X
Sartorius Italy S.r.l., Florence, Italy 100.0 X
Sartorius Netherlands B.V., Amersfoort, Netherlands 100.0 X
Sartorius Austria GmbH, Vienna, Austria 100.0 X
Sartorius Poland Sp. z o.o., Kostrzyn, Poland 100.0 X
LLC Sartogosm, St. Petersburg, Russia 100.0 X
LLC Sartorius RUS, St. Petersburg, Russia 100.0 X
Sartorius Spain S.A., Madrid, Spain 100.0 X
Sartorius Hungária Kft., Budapest, Hungary 100.0 X
EssenBioScience Ltd., Hertfordshire, UK 100.0 X
Sartorius UK Ltd., Epsom, UK 100.0 X
Americas Sartorius Argentina S.A., Buenos Aires, Argentina 100.0
Sartorius do Brasil Ltda., São Paulo, Brazil 100.0
Sartorius de México S.A. de C.V., Tepotzotlan, Mexico 100.0
Sartorius Peru S.A.C., Lima, Peru 100.0
Essen Instruments Inc., Ann Arbor,Michigan, USA 100.0 X
Sartorius North America Inc., Wilmington, Delaware, USA 100.0 X
Sartorius Corporation, Wilmington, Delaware, USA 100.0 X
Sartorius Canada Inc., Oakville, Canada 100.0 X

124 Consolidated Financial Statements and Notes Notes to the Financial Statements
Ownership
in % Consolidated
Asia | Pacific Sartorius Australia Pty. Ltd., Dandenong South, Victoria, Australia 100.0 X
Denver Instrument (Beijing) Co. Ltd., Beijing, China 100.0 X
Sartorius Scientific Instruments (Beijing) Co. Ltd., Beijing, China 100.0 X
Sartorius (Shanghai) Trading Co. Ltd., Shanghai, China 100.0 X
Biohit Biotech (Suzhou) Co. Ltd., Shanghai, China 100.0 X
Sartorius Hong Kong Ltd., Kowloon, Hong Kong 100.0 X
Sartorius India Pvt. Ltd., Bangalore, India 100.0 X
Essen BioScience K.K., Tokyo, Japan 100.0 X
Sartorius Japan K.K., Tokyo, Japan 100.0 X
Sartorius Malaysia Sdn. Bhd., Kuala Lumpur, Malaysia 100.0 X
Sartorius Singapore Pte. Ltd., Singapore, Singapore 100.0 X
Sartorius Korea Ltd., Seoul, South Korea 100.0 X
Sartorius Vietnam Co. Ltd., Ho Chi Minh City, Vietnam 100.0
Sartorius (Thailand) Co. Ltd., Bangkok, Thailand1) 49.0 X
1) The companies Sartorius Thailand and Sartorius Israel are included in the scope of consolidation due to contractual agreements (see also Section 22).
The companies marked as non-consolidated in the above table were not included in the scope of consolidation, because the figures were of minor importance for assessing the actual net worth, financial position and profitability of the Sartorius Group. The sales revenue and balance sheet total of the non-consolidated companies taken as a whole are below 5% of the Group figures. No associates or joint ventures were consolidated; all companies identified by an "X" are fully consolidated.
The entities Essen Holding Inc., Essen Intermediate Holding Inc. and IntellCyt Corp. were merged with Essen Instruments Inc. in 2018.

Consolidated Financial Statements and Notes Notes to the Financial Statements 125
8. Business Combinations
Acquisition of Essen BioScience
On March 24, 2017, the Group acquired the U.S. company Essen BioScience Inc. headquartered in Ann Arbor, Michigan, USA, purchasing 100% of the voting rights in this company. The acquisition has been expanding the bioanalytics portfolio of the Lab Products & Services Division and is also resulting in substantially increased synergies between the Group's two divisions.
Essen BioScience develops and markets novel cell imaging and analysis systems for medical drug research, which are increasingly becoming standard equipment in pharmaceutical laboratories. These systems represent a platform of instrumentation, software and reagents for real-time live-cell imaging and fully automated data analysis. The information delivered by these systems provides new insight and understanding into the mechanisms of healthy and diseased cells, which helps significantly accelerate often time-consuming discovery and development of new drugs.
Determination of the acquisition-date fair values of the assets acquired and liabilities assumed was completed in 2018. The following table presents the preliminary and final valuations:
Preliminary purchase price
allocation € in K
Final purchase price
allocation ¤ in K
Other intangible assets 173,134 173,134
Property, plant and equipment 1,270 1,270
Inventories 12,477 12,477
Trade receivables 9,877 9,877
Other assets 721 721
Cash and cash equivalents 14,936 14,936
Deferred taxes - net –59,799 –50,372
Other liabilities –18,470 –18,470
Net assets acquired 134,144 143,571
Purchase price 302,783 312,210
Goodwill 168,639 168,639
An amount of €302.8 million of the total converted purchase price of €312.2 million was paid in cash. The remaining purchase price in the amount of €9.4 million is related to an obligation to pass on certain tax advantages to the sellers.
Besides being attributable to the synergies realized by the acquiree's access to the Group's global sales and distribution network, the resulting goodwill recorded is due to the expansion of the product portfolio of the Lab Products & Services Division and to the extension of the Group's position with respect to biopharmaceutical customers. It is expected that this positioning of the Group will primarily benefit the Bioprocess Solution Division's business in early-stage biopharmaceutical development.

126 Consolidated Financial Statements and Notes Notes to the Statement of Profit or Loss
9. Sales Revenue
Initial Application of IFRS 15, Revenue from Contracts with Customers
IFRS 15, Revenue from Contracts with Customers, de-fines a comprehensive model to determine when to recognize revenue and which amount. It replaces existing guidelines for recognition of revenue, including IAS 18, Revenue; IAS 11, Construction Contracts; and IFRIC 13, Customer Loyalty Programmes.
The Group applied IFRS 15 for the first time as of January 1, 2018, on the basis of the modified retrospective method. Accordingly, the comparative period is presented in line with previous standards. Any effects of the initial application of IFRS 15 are recorded as an adjustment to the opening balance of retained earnings as of January 1, 2018. According to the option provided by the IFRS 15 Standard, the Group has been applying this Standard since initial adoption only to contracts that are not considered completed contracts at the date of initial application. Besides, the Group used the practical expedients offered regarding contract modifications that occurred prior to the date of initial application of IFRS 15 and
did not retrospectively restate such contracts. As the impact of the new standard on the Group’s consolidated financial statements is low, the use of this practical expedient is expected not to have a material impact.
For the major part of the Group's business there are no material effects as a result of the application of the new standard. However, as of the date of initial application, there are certain effects as a result of the new Standard with regard to construction contracts in the company's project business. Sales revenue of approximately €5 million, which was recognized in the past, is not recognized over time according to IFRS 15, but rather at a point in time. This results from new criteria introduced by IFRS 15 for revenue recognition over time for contracts on the construction of customer-specific goods. The effects resulted in a balance sheet extension by about €2 million at the date of initial application. There were no effects to be recognized in equity. The effects of applying the modified retrospective method on the opening statement of financial position as of January 1, 2018 are shown in the following table.
Carrying amount
Dec. 31, 2017 € in mn
Adjustments on adoptions of
IFRS 15 € in mn
Carrying amount
Jan. 1, 20183) € in mn
Inventories 246.1 4.1 250.3 Amounts due from customers for contract work 7.0 –1.9 5.0
Trade receivables 275.2 275.2
Trade receivables 282.2 –1.9 280.3
Trade payables | payments received for orders2) 47.5 2.2 49.7
Trade payables 91.7 91.7
Trade payables 139.2 2.2 141.4
1) Contract assets according to IFRS 15. 2) Contract liabilities according to IFRS 15. 3) Carrying amount without adjustments for the new credit impairment model according to IFRS 9.
If the Group had applied the previous standards, IAS 18 and IAS 11, respectively, during the reporting period, sales revenue as well as cost of sales would have been higher by about €0.6 million while there would be no impact on the net result. Total assets and total liabilities would have been lower by about €2 million. As the effects from the initial application of the new standard, the effects result from the revised criteria for
revenue recognition over time according to which revenue is now recognized at a point in time rather than over time for one project. The following table presents the impact on the consolidated statement of financial position as of December 31, 2018, which the continued application of the previous standards would have had in comparison with IFRS 15.
Notes to the Statement of Profit or Loss

Consolidated Financial Statements and Notes Notes to the Statement of Profit or Loss 127
Carrying amount
Dec. 31, 2018 € in mn
Adjustments on adoptions of
IFRS 15 € in mn
Carrying amount
Dec. 31, 2018 (IAS 11, IAS 18)
€ in mn
Inventories 321.7 –5.1 316.6 Amounts due from customers for contract work 3.9 2.9 6.8
Trade receivables 303.5 303.5
Trade receivables 307.4 2.9 310.3
Trade payables | payments received for orders2) 53.0 –2.2 50.8
Trade payables 120.5 120.5
Trade payables 173.5 –2.2 171.3
1) Contract assets according to IFRS 15. 2) Contract liabilities according to IFRS 15.
Disaggregation of Revenues
Under IFRS 15, revenue recognized from contracts with customers are disaggregated into the categories of the "nature of products and type of customer" as well as "geographical regions" and presented in the following table. The categorization by "nature of products and type of customer" corresponds to the
reportable segments as the identification of the reportable segments is based in particular on the dif-ferent products sold and on customer groups. Region-al disaggregation of revenue is according to the cus-tomer's location.
2018 2017
€ in K Group Bioprocess
Solutions Lab Products &
Services Group Bioprocess
Solutions Lab Products &
Services
Sales revenue 1,566,033 1,143,054 422,980 1,404,569 1,010,343 394,227 EMEA 657,739 464,671 193,068 604,486 413,794 190,693
Americas 520,076 409,972 110,104 455,496 357,116 98,380
Asia | Pacific 388,218 268,410 119,807 344,587 239,433 105,154

128 Consolidated Financial Statements and Notes Notes to the Statement of Profit or Loss
Other Disclosures
For details on the impairments on trade receivables and contract assets recognized in the reporting period see note 39. The following table presents the opening
balances as of January 1, 2018, and the balances as of December 31, 2018, for the Group’s contract liabilities. The balances of trade receivables and contract assets are presented in note 28.
Line item in statement of
financial position
Carrying amount Jan. 1,
2018 € in K
Carrying amount Dec.
31, 2018 ¤ in K
Deferred revenue Other liabilities 18,161 28,578
Payments received on account of orders Trade payables 49,708 52,987
Total contract liabilities 67,869 81,565
There were no extraordinary changes in the carrying amounts of the contract liabilities and contract assets in the reporting period. Revenue in the amount of €53,695 K was recognized in the reporting period that was included in the contract liability balance at the beginning of the reporting period.
The Group produces and sells instruments and con-sumables as well as related services in its segments BPS and LPS. The Group satisfies its performance obligations depending on the goods to be transferred and the promised services. The far majority of the revenues from sales of products is recognized at a point in time when the customer obtains control over the goods. This is typically the case when the significant risks and rewards of ownership of the goods are transferred to the customer. Therefore, the point in time may vary depending on the agreement with the individual customer.
For complex products that require installation at the customer’s site, revenue is recognized upon formal customer acceptance. To a low extent, revenue is rec-ognized over time in the customer-specific project business. In these cases, revenue is recognized ac-cording to the project progress which is measured based on the percentage of costs to date compared to the total estimated contract costs. The amount of actual costs incurred to date reflects the progress and the transfer of control to the customer appropriately as the Group has a right to a reimbursement of cost to date plus an appropriate margin, if the project is cancelled by the customer without cause. Revenue from services is generally recognized when the services are performed or have been performed. When the services are performed continuously over a period of time, the Group recognizes the related revenue over time. In this case, revenue is generally recognized pro
rata temporis in relation to the total contract period. Product sales are typically accompanied by the legally required warranty. Any material extended warranties are accounted for as separate performance obligations.
According to the general payment terms, customer payments are due in the short term, typically within 30 days. To some extent, the Group obtains advance payments, e.g., to avoid credit risks. Therefore, the Group regularly has contract liabilities (payments received on account of orders). In addition, the Group recognizes contract liabilities in connection with service contracts (deferred revenues) when customers pay in advance.
There are no material effects from contracts with significant financing components. The Group uses the practical expedient provided by IFRS 15 regarding the existence of a significant financing component. This means that a financing component is only taken into consideration when the length of time between the transfer of goods or services and the receipt of consideration is expected to exceed one year and the effect is material. As of December 31, 2018, the Group has refund liabilities in the amount of €8,317 K as a result from incentive agreements with customers.
The aggregate amount of the transaction price allocated to the performance obligations that are unsatisfied (or partially unsatisfied) at the end of the reporting period amounts to €533.9 million. There are no material amounts of consideration from customers that are excluded from this amount. The Group expects that these unsatisfied performance obligations will be satisfied for the most part in 2019.

Consolidated Financial Statements and Notes Notes to the Statement of Profit or Loss 129
10. Functional Costs
The statement of profit or loss is prepared according to the function of expense method, also known as "cost of sales." The expenses are allocated to the respective functional areas of production, sales and distribution, research and development, as well as to general administration.
Expenses relating to cross-functional initiatives or projects are assigned to the respective functional costs based on an appropriate allocation principle.
The item “Cost of sales” reports the costs of products sold and the acquisition costs of merchandise sold. Besides the directly imputable expenses, such as raw materials and supplies, employee benefits expense and energy expenses, the cost of sales also includes overhead, which can be allocated to the manufacturing area, and the corresponding depreciation and amortization.
The selling and distribution expenses pertain, in partic-ular, to the costs of the sales organization, distribution, advertising and marketing.
Research and development expenses comprise the costs for research and product and process develop-ment, insofar as these are not capitalized.
The item “General administrative expenses” primarily comprises employee benefits expense and the cost of materials of the general administrative area.
All profit and loss items that cannot be allocated to one of the functional areas mentioned are recognized as other operating income and expenses. These essen-tially include effects from currency translation, dispos-al of fixed assets, allowances on trade receivables, and extraordinary expenses. Income from grants related to expenses are recognized as other income, when there is reasonable assurance that the conditions attached to the grants will be complied with and the grants will be received.
The total expenses incurred by the functional areas for materials and employee benefits are presented as follows:
Raw Materials and Supplies
This item consists of the following:
2018 ¤ in K
2017 € in K
Expenses for raw materials and supplies and for purchased goods (incl. changes in inventories) 303,679 303,843
Cost of purchased services 102,074 85,037
405,753 388,880
Employee Benefits Expense
This item can be broken down as follows:
2018 ¤ in K
2017 € in K
Wages and salaries 431,958 389,967
Social security 86,036 79,072
Expenses for retirement benefits and pensions 9,297 11,064
527,291 480,104
11. Other Operating Income and Expenses
2018 ¤ in K
2017 € in K
Currency translation gains 13,323 10,515
Income from the decrease in allowances for bad debts 1,346 2,285
Income from grants 4,502 8,428
Extraordinary income 37,747 0
Other income 3,754 2,306
Other operating income 60,672 23,534 Extraordinary expenses –39,418 –35,522
Currency translation losses –13,660 –18,596
Allowances for bad debts –3,257 –1,576
Other expenses –7,061 –6,414
Other operating expenses –63,396 –62,108
Other operating income and expenses –2,724 –38,574

130 Consolidated Financial Statements and Notes Notes to the Statement of Profit or Loss
The item reported as income from grants discloses the grants for expenses (essentially related to research and development projects), which are recognized as income as soon as there is sufficiently reliable indication that the necessary prerequisites are met.
Extraordinary income for fiscal 2018 essentially includes the effects from the changes in the alliance with Lonza in the cell culture media business. In this case, the liability for the future purchase price was to be released; at the same time, immaterial assets were to be derecognized as well. The extraordinary items of fiscal 2017 and 2018 were essentially for various strategic Group projects as well as integration and acquisition costs.
12. Financial Result
2018 ¤ in K
2017 € in K
Interest and similar income 499 340
- of which from affiliated companies 189 62
Income from derivative financial instruments 4,470 1,698
Other financial income 2,694 11,519
Financial income 7,663 13,557 Interest and similar expenses –13,388 –13,470
Expenses for derivative financial instruments –9,347 –3,967
Interest for pensions and other retirement benefits –1,126 –1,084
Other financial charges –11,722 –13,209
Financial expenses –35,582 –31,730
–27,919 –18,173
The other financial expenses and income cover effects from discount reversals and evaluation of loans and other financial liabilities denominated in foreign currencies.
13. Income Taxes
2018 ¤ in K
2017 € in K
Current income taxes –83,064 –60,230
Deferred taxes 9,847 18,372
- of which from tax losses –6,154 –10,192
- of which from temporary differences 16,001 28,564
–73,217 –41,859
Current income taxes are calculated based on the particular national taxable income for the year, as well as according to national tax regulations. In addition, current taxes can contain adjusted amounts to cover any tax payments or refunds for years not yet assessed.
Considering the German average tax rate of approximately 30% and the different rates in other countries in which the Group operates, the expected tax rate for the Group is roughly 27%. The following table describes the differences between the tax expense to be expected and the income tax expenses reported for the particular financial year:
2018 ¤ in K
2017 € in K
Expected tax rate 27% 29%
Expected tax expense –73,088 –58,344
Difference from the Group average income tax rate 8,686 9,831
Effects from intragroup dividends and other non-deductible expenses –7,819 –4,732
Tax credits 1,217 3,628
Deductible temporary differences and tax losses not capitalized –4,781 –8,413
Taxes from previous years and adjustments from the revised evaluation of the recoverability of deferred tax assets 4,825 2,723
Withholding and similar taxes –990 –1,083
Changes in tax rates –576 14,451
Other –691 80
–73,217 –41,859
Effective tax rate 27.0% 20.8%
The change in the expected tax rate from 2017 to 2018 essentially results from the tax reform enacted in December 2017 in the USA, which lowered the corporate tax rate from around 35% to about 21%.

Consolidated Financial Statements and Notes Notes to the Statement of Profit or Loss 131
14. Earnings per Share
IAS 33, Earnings per Share, requires earnings per share to be calculated separately for each class of share. The undiluted earnings per share (basic EPS) are calculated based on the weighted average number of ordinary
shares outstanding during the period. Treasury shares are not to be considered in the calculation of the average number of shares outstanding.
2018 2017
Ordinary shares Basis for calculating basic earnings per ordinary share (net profit after non-controlling interest), € in K 70,538 57,224
Weighted average number of shares outstanding 34,212,224 34,212,224
Basic earnings per ordinary share in ¤ 2.06 1.67 Weighted average number of shares outstanding for calculating the diluted earnings per share 34,212,224 34,212,224
Diluted earnings per ordinary share, in € 2.06 1.67
Preference shares Basis for calculating basic earnings per preference share (net profit after minority interest), € in K 70,805 57,506
Weighted average number of shares outstanding 34,176,068 34,176,068
Basic earnings per preference share in ¤ 2.07 1.68 Weighted average number of shares outstanding for calculating the diluted earnings per share 34,176,068 34,176,068
Diluted earnings per preference share, in € 2.07 1.68

132 Consolidated Financial Statements and Notes Notes to the Statement of Financial Position
15. Goodwill and Intangible Assets
Goodwill
Goodwill ¤ in K
Gross book values at Jan. 1, 2017 467,831 Currency translation –28,598
Acquisitions through business combinations 214,696
Gross book values at Dec. 31, 2017 653,929 Amortization and impairment losses at Jan. 1, 2017 0 Currency translation 0
Amortization and impairment losses in 2017 0
Amortization and impairment losses at Dec. 31, 2017 0
Net book values at Dec. 31, 2017 653,929
Gross book values at Jan. 1, 2018 653,929 Currency translation 8,301
Acquisitions through business combinations 0
Gross book values at Dec. 31, 2018 662,229 Amortization and impairment losses at Jan. 1, 2018 0 Currency translation 0
Amortization and impairment losses in 2018 0
Amortization and impairment losses at Dec. 31, 2018 0
Net book values at Dec. 31, 2018 662,229
The item reported as goodwill in the amount of €662,229 K (2017: €653,929 K) is the capitalized difference in assets resulting from capital consolidation within the scope of business combinations. This amount also covers asset deals to some extent. The additions in fiscal 2017 are attributable to the acquisitions of Essen BioScience and Umetrics (see Section 8). Under IAS 36, goodwill may not be amortized on a scheduled basis, but rather must be tested annually for impairment.
Because of the integration of our businesses in the divisions of Bioprocess Solutions and Lab Products & Services and our respective positioning as a total solutions provider, several cash-generating units at this level are combined for the impairment test.
Thus, goodwill is distributed to the segments as follows:
Dec. 31, 2018
¤ in K Dec. 31, 2017
€ in K
Bioprocess Solutions 495,481 494,781
Lab Products & Services 166,748 159,148
662,229 653,929
The impairment tests for fiscal 2018 were conducted as of Novermber 30. The calculations measure the recoverable amount on the basis of the value in use of the particular cash-generating unit. Our cash flow forecasts consider previous experiences and are generally based on the current projections of Group management for a period of four years. For the Bioprocess Solutions Division, calculations were based on an average terminal growth rate of 2.5% for the fiscal years after 2022. This terminal growth rate is derived from market expectations, which forecast medium-term growth rates in the high upper single-digit range for the biopharmaceutical market targeted by the division. The major growth drivers will be, among others, the aging population, the increase in population and improved access to pharmaceutical markets in the emerging-market countries, as well as the currently ongoing paradigm shift towards utilization of single-use products in the manufacture of biopharmaceuticals. For the Lab Products & Services Division, a terminal growth rate of 1.5% was used for the fiscal years after 2022.
The discount rates of the cash-generating units correspond to their weighted average cost of capital (WACC) and were recognized as follows:
Before
tax
2018 After
tax Before
tax
2017 After
tax
Bioprocess Solutions 9.0% 7.2% 8.5% 6.8%
Lab Products & Services 9.9% 7.7% 9.6% 7.4%
In fiscal 2018, these impairment tests did not result in the recognition of impairment losses. Even realistic changes in the basic assumptions upon which mea-surement of the value in use is based would not result in the carrying amount of the cash-generating units' exceeding their value in use.
Notes to the Statement of Financial Position

Consolidated Financial Statements and Notes Notes to the Statement of Financial Position 133
Other Intangible Assets
Patents, licenses,
technologies and similar
rights € in K
Brand name € in K
Customer relationships
€ in K
Capitalized development
costs € in K
Payments on account
€ in K Total
€ in K
Gross book values at Jan. 1, 2017 203,867 22,992 139,529 97,371 325 464,084
Currency translation –16,751 –2,793 –7,646 –444 –31 –27,665
Acquisitions through business combinations 98,178 19,056 82,891 0 0 200,125
Capital expenditures 11,247 0 469 27,402 135 39,253
Disposals –291 –1 0 –2,685 –23 –3,001
Transfers 309 0 0 155 –181 283
Gross book values at Dec. 31, 2017 296,558 39,254 215,244 121,798 224 673,079 Amortization and impairment losses at Jan. 1, 2017 –64,260 –2,391 –78,100 –51,925 0 –196,675
Currency translation 1,992 101 1,164 141 0 3,398
Amortization and impairment losses in 2017 –26,286 –1,826 –18,044 –8,935 0 –55,090
Disposals 37 0 0 2,607 0 2,644
Transfers –9 0 0 0 0 –9
Amortization and impairment losses at Dec. 31, 2017 –88,526 –4,116 –94,979 –58,112 0 –245,733
Net book values at Dec. 31, 2017 208,032 35,138 120,265 63,687 224 427,346
Patents, licenses,
technologies and similar
rights € in K
Brand name € in K
Customer relationships
€ in K
Capitalized development
costs € in K
Payments on account
€ in K Total ¤ in K
Gross book values at Jan. 1, 2018 296,558 39,254 215,244 121,798 224 673,079
Currency translation 5,746 1,069 2,553 67 10 9,445
Acquisitions through business combinations 0 0 0 0 0 0
Capital expenditures 6,279 0 0 32,997 162 39,438
Disposals –12,955 0 –11,804 –1,822 –2 –26,583
Transfers 511 –12 0 0 –135 363
Gross book values at Dec. 31, 2018 296,140 40,311 205,994 153,040 258 695,743 Amortization and impairment losses at Jan. 1, 2018 –88,526 –4,116 –94,979 –58,112 0 –245,733
Currency translation –1,188 –116 –481 14 0 –1,771
Amortization and impairment losses in 2018 –31,442 –2,069 –23,031 –8,265 0 –64,807
Disposals 10,095 0 5,680 1,822 0 17,597
Transfers –12 9 0 0 0 –3
Amortization and impairment losses at Dec. 31, 2018 –111,073 –6,292 –112,811 –64,541 0 –294,717
Net book values at Dec. 31, 2018 185,067 34,020 93,183 88,499 258 401,027

134 Consolidated Financial Statements and Notes Notes to the Statement of Financial Position
Intangible assets acquired are stated at cost less the accumulated, regular amortization that is calculated according to the straight-line method. The useful life of an intangible asset is the period over which this asset is expected to contribute directly or indirectly to the cash flows of that entity.
Costs incurred within the scope of the development of new products and methods are capitalized as internally generated intangible assets if the following criteria are met:
– The technical feasibility of completing the intangible assets so that it will be available for use or sale;
– The intention to complete the intangible asset and use or sell it;
– The ability to use or sell the intangible asset;
– The demonstration of how the intangible asset will generate probable future economic benefits ;
– The availability of adequate technical, financial and other resources to complete the development and to use or sell the intangible asset;
– The ability to measure reliably the expenditure attributable to the intangible asset during its development.
The capitalized development costs essentially cover the costs that were allocated to the staff involved in R&D, to raw materials and supplies, outside services and to directly attributable overhead. Internally generated intangible assets are amortized over their useful life on a straight-line basis.
If an internally generated intangible asset may not be capitalized, the development costs are recognized as expenses in the period in which they are incurred. Costs for research activities are reported as expenses in the period in which they are incurred.
Amortization of intangible assets is based on the following periods of useful life:
Software 2 to 10 years
Customer relationships and technologies 5 to 15 years
Capitalized development expenses 4 to 6 years
Brand name 10 years to an
indefinite period
The brand name acquired in the Stedim transaction (book value: €10,779 K) is considered to have an indefinite useful life as there is no foreseeable limit to the period over which it is expected to generate net cash inflows for the company. Because of the integration of the "Stedim" brand into the "Sartorius Stedim Biotech" brand, a separate measurement of relevant cash flows is not possible, however. The recoverability of the brand name and of other intangible assets acquired within the scope of this business combination was considered at the next-higher level of the cash-generating unit (CGU), i.e., the Bioprocess Solutions Division.
For the remaining brand names acquired through the business combinations, their limited periods of useful life are estimated as up to 20 years on average.
Amortization of intangible assets is allocated to the corresponding functions in the statement of profit or loss. For capitalized development costs, amortization is disclosed in the cost of sales.
In fiscal 2018, the development costs of €32,997 K (2017: €27,402 K) were recognized as assets.
In fiscal 2018, impairment expenses of €8.5 million were recognized (2017: €0.6 million). Impairments essentially concerned technologies, customer relatoinships and software. The disposals include the assets derecognized as a result of the contractual changes in the alliance with Lonza. (see note 11).

Consolidated Financial Statements and Notes Notes to the Statement of Financial Position 135
16. Property, Plant and Equipment
Land, buildings and
improvements € in K
Technical machinery and
equipment € in K
Factory and office
equipment and other
equipment € in K
Payments on account and
construction in progress
€ in K Total
€ in K
Gross book values at Jan. 1, 2017 253,613 187,354 145,420 57,398 643,785
Currency translation –5,690 –4,027 –2,064 –4,748 –16,529
Acquisitions through business combinations 228 653 528 2 1,411
Capital expenditures 35,376 8,848 20,700 105,173 170,098
Disposals –542 –1,566 –7,867 –1,804 –11,778
Transfers 22,233 8,295 2,742 –33,073 198
Gross book values at Dec. 31, 2017 305,217 199,558 159,460 122,949 787,184 Depreciation and impairment losses at Jan. 1, 2017 –63,498 –100,885 –85,386 –5 –249,774
Currency translation 1,498 2,307 1,164 0 4,970
Amortization and impairment losses in 2017 –10,113 –15,528 –17,627 –3 –43,271
Disposals 523 1,592 7,240 0 9,355
Transfers –401 184 –254 0 –471
Depreciation and impairment losses at Dec. 31, 2017 –71,991 –112,330 –94,862 –9 –279,191
Net book values at Dec. 31, 2017 233,227 87,229 64,597 122,940 507,992
Land, buildings and
improvements € in K
Technical machinery and
equipment € in K
Factory and office
equipment and other
equipment € in K
Payments on account and
construction in progress
€ in K Total ¤ in K
Gross book values at Jan. 1, 2018 305,217 199,558 159,460 122,949 787,184
Currency translation 639 333 127 3,712 4,810
Acquisitions through business combinations 0 0 0 0 0
Capital expenditures 27,033 13,570 15,659 142,071 198,333
Disposals –4,448 –10,211 –16,861 –386 –31,906
Transfers 5,718 12,634 1,432 –20,185 –402
Gross book values at Dec. 31, 2018 334,160 215,884 159,816 248,160 958,020 Depreciation and impairment losses at Jan. 1, 2018 –71,991 –112,330 –94,862 –9 –279,191
Currency translation –28 –471 –131 0 –630
Depreciation and impairment losses in 2018 –12,943 –16,449 –19,174 0 –48,567
Disposals 4,090 9,024 16,476 0 29,590
Transfers –18 499 –95 0 386
Depreciation and impairment losses at Dec. 31, 2018 –80,890 –119,727 –97,786 –8 –298,412
Net book values at Dec. 31, 2018 253,269 96,157 62,030 248,152 659,608
The item “Property, plant and equipment” is reported at cost, and if subject to depreciation, is depreciated as scheduled. Impairment tests are conducted when impairment indicators are identified. The straight-line method is applied to depreciation reported in the consolidated financial statements.
Depreciation of fixed assets is based on the following periods of useful life:
Buildings 15 to 50 years
Machinery 5 to 15 years
Factory and office equipment 3 to 13 years
Depreciation is included in the statement of profit or loss according to use of the assets in the cost of sales, selling and distribution expenses, research and development expenses, administrative expenses and other operating expenses.

136 Consolidated Financial Statements and Notes Notes to the Statement of Financial Position
Borrowing costs are expensed as incurred unless they are directly attributable to the acquisition, construction or production of a qualifying asset and are therefore part of the cost of that asset. An asset is deemed to be a qualified asset if a substantial period of time (6 or 12 months) is required to ensure that it will be in the intended state ready for use or sale.
Grants related to assets are generally deducted from the cost of assets.
17. Leases
A lease is considered an agreement whereby the lessor conveys to the lessee in return for a payment or series of payments the right to use an asset for an agreed period of time. According to IAS 17, a lease is classified as either an operating lease or a finance lease. A finance lease is a lease that transfers substantially all the risks and rewards incidental to ownership of an asset. All other leases are designated as operating leases.
If the Group is a lessee in a finance lease, the amount equal to the fair value of the leased asset, or if lower, the present value of the minimum lease payments is recognized as an asset on the statement of financial position and simultaneously recognized as a financial liability, each at the inception of the lease. The mini-mum lease payments essentially consist of the finance charge and the reduction of the outstanding liability. A leased asset is depreciated on a straight-line basis over the period of its expected useful life or over the shorter lease term.
For an operating lease, the lease rates to be paid by the lessee are recognized as expenses and the lease rates received by the lessor are recognized as income, respectively. The leased asset continues to be recognized on the lessor's statement of financial position as fixed assets.
Capitalized property, plant and equipment for the reporting year include assets held under finance leases that amounted to €18,047 K (2017: €18,771 K). The cost of acquisition of these assets totals €27,006 K (2017: €26,273 K).
In fiscal year 2018, payments of €22.1 million were made as part of operating leases (2017: €20.3 million).
The following table presents the operating lease commitments as of December 31, 2018:
Dec. 31, 2018
€ in K Dec. 31, 2017
€ in K
Operating leases -due within one year 22,068 15,669
-due within 2 to 5 years 33,788 26,003
-due thereafter 9,472 5,897
See note 2 for an explanation of the effects as of fiscal 2019 due to the introduction of the new standard for lease accounting (IFRS 16).

Consolidated Financial Statements and Notes Notes to the Statement of Financial Position 137
18. Deferred Taxes
Deferred tax assets Deferred tax liabilities
Dec. 31, 2018
¤ in K Dec. 31, 2017
€ in K Dec. 31, 2018
¤ in K Dec. 31, 2017
€ in K
Other intangible assets 3,277 837 85,503 88,958
Tangible assets 0 185 7,575 7,237
Inventories 11,946 10,838 0 0
Receivables and other current assets 0 0 5,005 5,991
Provisions 9,008 10,010 0 0
Liabilities 4,936 1,265 645 2,097
Gross amount 29,166 23,135 98,728 104,283 Taxable losses carried forward 7,790 13,636 0 0
Interest carry-forwards 1,068 0 0 0
Tax on non-distributed earnings of subsidiaries 0 0 2,375 2,292
Offset –17,419 –20,529 –17,419 –20,529
20,606 16,242 83,684 86,046
Deferred tax assets and liabilities are determined based on temporary differences between the carrying amounts and the tax bases of assets and liabilities, including differences from consolidation. In addition, loss carry-forwards and tax credits are considered. Measurement is based on the tax rates expected to be effective in the period in which an asset is realized or a liability is settled. Changes in deferred tax assets and liabilities are reflected in income taxes in the statement of profit or loss. Exceptions to this are changes that must be recognized in other comprehensive income directly in equity, as well as effects from acquisitions and currency effects.
On principle, the tax rates and tax rules are used which have been enacted or substantively enacted at the reporting date. Deferred tax assets are recognized to the extent that it is probable that taxable profit at the level of the relevant tax authority will be available for the utilization of the deductible temporary differences or losses carried forward.
Deferred Tax Assets
On the reporting date, the Group had unused tax loss amounts carried forward of about €74 million (2017: around €85 million) to be deducted from future tax-able profits. For German companies, the average of the loss carry-forward calculated from corporate income tax and from commercial income tax was taken into account. A deferred tax amount was reported on approx. €30 million (2017: approx. €28 million) of these losses. Concerning the remaining losses to be carried forward, no deferred tax amounts were recognized because of the lack of foreseeability of future taxable profits. Of the unused tax losses, €10.4 million can still be carried
forward for a limited time (2017: €26.4 million) and of this carryforward amount, €10.4 million will expire in the next five years (2017: €10.3 million).
Deferred tax assets of approximately €1 million (2017: approx. €5 million) relate to companies that reported losses in this year under review or in the earlier reporting year. These losses carried forward were reported as assets because it is assumed that taxable profits would be available in future, against which the unused tax losses and the deductible temporary differences can be offset.
In addition, the Group had unused interest carry-forwards from German companies of the Group in the amount of €12 million (2017: €3 million). Deferred tax assets of €1.1 million were considered for these carry-forwards in the reporting year (2017: €0.0 million).
Deferred Tax Liabilities
The deferred tax liabilities in connection with intangible assets essentially refer to assets acquired in business combinations and, consequently, are mainly linked to customer relationships.
For temporary differences in connection with shares in subsidiaries, which amounted to €825 million (2017: €694 million), deferred tax liabilities were not recognized on these differences as the realization of such liabilities is not expected or planned within the foreseeable future. If these retained earnings were to be distributed, they would be subject to taxation at a rate of 5% in Germany; in addition, foreign withholding tax might be incurred.

138 Consolidated Financial Statements and Notes Notes to the Statement of Financial Position
In fiscal 2018, as in the previous years, a tax effect was yielded by reporting derivative financial instruments recognized outside the statement of profit or loss according to IFRS 9 (IAS 39) rules for hedge accounting, and the deferred tax assets from recognition of actuarial gains and losses were recognized in other comprehensive income. Likewise, the amount of current income taxes incurred by net investment in a foreign operation was recognized in other comprehensive income. The income taxes recognized in other comprehensive income are disclosed in the following table:
2018 ¤ in K
2017 € in K
Cash flow hedges 4,344 –10,042
Remeasurements of the net defined benefit liability –733 –1,024
Net investment in a foreign operation –5,314 1,173
Total –1,703 –9,893
The change in deferred tax assets and liabilities in fiscal years 2017 and 2018 is as follows:
Deferred tax assets € in K
Deferred tax liabilities
€ in K
Balance at Jan. 1, 2017 27,743 54,313
Currency translation –1,011 –4,431
Change in the scope of consolidation 640 55,771
Recognized in profit or loss in 2017 –2,110 –20,481
Recognized in other comprehensive income –9,019 874
Balance at Dec. 31, 2017 16,242 86,046
Deferred tax assets ¤ in K
Deferred tax liabilities ¤ in K
Balance at Jan. 1, 2018 16,242 86,046
Currency translation 117 1535
Change in the scope of consolidation 0 0
Recognized in profit or loss in 2018 4915 –4932
Recognized in other comprehensive income –668 1035
Balance at Dec. 31, 2018 20,606 83,685
19. Inventories
Dec. 31, 2018 ¤ in K
Dec. 31, 2017 € in K
Raw materials and supplies 97,142 81,241
Work in progress 84,040 63,566
Finished goods and merchandise 137,107 96,850
Payments on account 3,408 4,467
321,695 246,124
Dec. 31, 2018
¤ in K Dec. 31, 2017
€ in K
Gross amount inventories 345,237 265,599
Write-downs –23,541 –19,475
Net amount of inventories 321,695 246,124
Raw materials and supplies, including merchandise, are reported under “Inventories” at average cost. On principle, finished goods and work in progress are reported at cost of conversion. This cost includes direct costs, which can be allocated to these materials, and the appropriate portion of production and materials han-dling overhead, general administrative expenses and fixed assets at normal depreciation and | or amortization rates, provided that these expenses are caused by production.
Inventories must be measured at the lower amount of cost and the net realizable value. The net realizable value represents the estimated selling price in the ordi-nary course of business less the estimated costs of completion and the estimated costs necessary for marketing, sales and distribution. Where inventory risks exist, such as the risk of reduced shelf life as a result of storage periods or limited usability, inventories are marked down accordingly.
20. Issued Capital
The issued capital of Sartorius AG is divided into 37,440,000 bearer ordinary shares and the same number of non-voting preference shares, each with a calculated par value of €1.00. Preference share owners receive an increased dividend (surplus dividend) of €0.01 per preference share from the distributable profit; however, the dividend must amount to at least €0.02 per preference share. All shares are fully paid up.

Consolidated Financial Statements and Notes Notes to the Statement of Financial Position 139
Sartorius AG exercised the authority granted at the Annual Shareholders’ Meeting on June 21, 2000, to repurchase treasury shares in the amount of €16,082 K pursuant to § 71, Subsection 1, No. 8, of the German Stock Corporation Law (AktG). According to IAS 32, treasury shares were deducted from equity and capital reserves.
These shares are held in particular as currency for future acquisitions of companies. From October 27, 2000 to the reporting date, 831,944 ordinary shares were repurchased at an average price of €11.27 and 840,983 preference shares at an average price of €7.98 on the whole. In December 2015, 25,000 ordinary shares and 25,000 preference shares were issued to CEO and Executive Board Charmain Dr. Joachim Kreuzburg pursuant to his 2014 remuneration agreement.
Following the stock split carried out in 2016, 3,227,776 ordinary shares and 3,263,932 preference shares remain as treasury stock as part of share capital, thus constituting a proportion of €6,492 K (8.7%).
No treasury shares were purchased in fiscal 2018.
21. Reserves
Capital Reserves
Capital reserves include the amounts generated in the previous years beyond the nominal amount when Sartorius AG issued shares. As part of the stock split, an amount of €51,291 K was reclassified from the capital reserves to issued capital in fiscal 2016.
In fiscal 2018, capital reserves rose by €504 K (2017: €1,242 K) due to the employee benefits expense to be offset in connection with the share-based remuneration agreement with Dr. Kreuzburg.
Cash Flow Hedging Reserves
Amounts recognized in other comprehensive income as part of an effective hedgeing relationship are transferred to the cash flow hedging reserves. In particular, these are fluctuations in the fair value of currency hedges as well as their respective tax effects. The cumulative amount to be transferred to other comprehensive income as of the reporting date stands at €5,704 K (2017: 20,184 K).
Pension Reserves
Actuarial gains and losses from defined benefit plan commitments, including their respective tax effects, are included in the pension reserves .
22. Non-Controlling Interest
The Sartorius Stedim Biotech subgroup headquartered in Aubagne, France, accounts for the majority of non-controlling interest in the Sartorius Group. The latter holds approximately 74% of capital shares and 85% of the voting rights in this subgroup. The following subsidiaries account for further non-controlling interest amounts:
– Sartorius Korea Biotech based in Seoul, South Korea, with a 69% share in capital
– Sartorius Thailand located in Bangkok (with a 49% share in capital
– Sartorius Israel Ltd., Kibbutz Beit Haemek, Israel (49%)
The companies in Israel and Thailand were consolidated due to contractual arrangements to ensure control purposes.
2018 ¤ in K
2017 € in K
Cumulative non-controlling interest as of Dec. 31 Sartorius Stedim Biotech 222,530 180,228
Other 10,292 8,538
232,822 188,766 Profit or loss allocated to non-controlling interest Sartorius Stedim Biotech 53,553 41,607
Other 2,582 2,989
56,135 44,596 Dividends paid to non-controlling interest Sartorius Stedim Biotech 10,916 9,964
Other 783 744
11,699 10,708

140 Consolidated Financial Statements and Notes Notes to the Statement of Financial Position
The following condensed financial information refers to the Sartorius Stedim Biotech Group:
Condensed Statement of Financial Position
Dec. 31, 2018
¤ in K Dec. 31, 2017
€ in K
Non-current assets 1,018,932 913,060
Current assets 552,529 490,845
1,571,461 1,403,905
Equity 1,044,874 879,454
Non-current liabilities 144,612 174,007
Current liabilities 381,976 350,444
1,571,461 1,403,905
Condensed Statement of Profit or Loss and Other Comprehensive Income
2018 ¤ in K
2017 € in K
Sales revenue 1,212,152 1,081,033
Profit before tax 284,549 220,613
Income taxes –74,590 –56,849
Net profit for the period 209,959 163,763 Other comprehensive income after tax –1,342 –8,810
Total comprehensive income 208,617 154,953
Condensed Statement of Cash Flows
2018 ¤ in K
2017 € in K
Net cash flow from operating activities 227,289 174,688 Net cash flow from investing activities and acquisitions –176,540 –194,926
Net cash flow from financing activities –59,594 16,620
Net increase | decrease in cash and cash equivalents –8,844 –3,618 Cash and cash equivalents at the beginning of the period 32,552 34,756
Net effect of currency translation on cash and cash equivalents 268 1,414
Cash and cash equivalents at the end of the period 23,975 32,552
23. Pension and Employee Benefits Provisions
Pension provisions and similar obligations are recog-nized in the consolidated financial statements of the Sartorius Group in accordance with actuarial principles. IAS 19, Employee Benefits, stipulates the projected unit credit method as the method of measurement. In addition to known pensions and life expectancies, this expected cash value method takes into account future salary and pension increases.
Defined Contribution Plans
Most of the companies of the Group have defined contribution plans, frequently in the form of government-backed retirement insurance. In fiscal 2018, an amount of €30.3 million was recognized for defined contribution plans (2017: €28.7 million).
Defined Benefit Plans
Pension provisions and similar obligations have been recognized in the consolidated financial statements of the Sartorius Group in accordance with actuarial principles. All actuarial gains and losses are shown directly in other comprehensive income according to the IAS 19 Standard. The actuarial losses, which were transferred to the pension reserves, essentially resulted from a change in the discount rate and totaled -€28,020 K (2017: - €28,712 K).
An amount of €52,316 K (2017: €53,505 K) relates in particular to the net amount of pension provisions for retirement pension plans in Germany. These provisions are based on direct commitments under defined benefit pension plans. Under these commitments, the employees earn benefits for each year of service rendered to the company. The pension benefits are generally not funded with assets. A substantial portion of these provisions relate to Sartorius AG. In this case, the obligations measured pertain to the General Pension Plan ("Allgemeine Versorgungsordnung") for employees whose employment commenced prior to January 1, 1983, on the one hand. On the other, individual commitments to active and former Executive Board members and executives exist in the form of performance-based post-employment benefit plans.

Consolidated Financial Statements and Notes Notes to the Statement of Financial Position 141
Measurement of the post-employment benefit obligations of the German Group companies is based on the following actuarial assumptions:
2018 2017
Discount rate 1.81% 1.75%
Future salary increases 3.00% 3.00%
Future pension increases 2.00% 2.00%
The assumed discount factors reflect the interest rates that were paid on the reporting date for prime corporate (industrial) bonds with matching maturities and denominated in the relevant currencies. If such corporate bonds are not available with matching long-term maturities or are insufficiently available, their matching interest rates are determined by extrapolation.
Concerning the assumptions on mortality and invali-dity, the actuarial tables (RT) 2018 G compiled by Klaus Heubeck were used.
The following parameters were used for the French companies:
2018 2017
Discount rate 1.80% 1.70%
Future salary increases 2.00% 2.50%
Future pension increases 2.00% 2.00%
The amounts reported in the statement of profit or loss and in the statement of comprehensive income consist of the following:
2018 ¤ in K
2017 € in K
Service cost 1,776 1,786
Net interest cost 991 990
Components of defined benefit costs recognized in profit or loss 2,767 2,777 Return on plan assets (excl. interest) –56 –57
Actuarial gains | losses –636 473
Components of defined benefit costs recognized in other comprehensive income –692 417 Total defined benefit costs 2,075 3,193
In the statement of profit or loss, the current service cost is disclosed according to the assignment of employees to the respective functions.
The net amount or present value included in the consolidated statement of financial position arising from the Group's obligation in respect of defined benefit plans is as follows:
Dec. 31, 2018
¤ in K Dec. 31, 2017
€ in K
Present value of obligations 76,658 74,312
Fair value of the plan assets 11,935 9,367
Net liability 64,724 64,945
Defined Benefit Obligation
2018 ¤ in K
2017 € in K
Present value of obligations as of Jan. 1 74,312 71,759 Current service cost 2,262 2,194
Past service cost –485 –408
Interest cost 1,126 1,084
Actuarial gains | losses –783 478
Currency translation differences 386 –725
Retirement benefits paid in the reporting year –2,221 –2,132
Employer contributions 323 277
Employee contributions 261 220
Contributions by the plan participants 1,466 1,550
Other changes 14 15
Present value of obligations as of Dec. 31 76,658 74,312
The actuarial gains and losses of the defined benefit obligation are allocated as follows:
2018 ¤ in K
2017 € in K
Experience adjustments 325 843
Changes in demographic assumptions 762 274
Changes in financial assumptions –1,870 –639
Total –783 478

142 Consolidated Financial Statements and Notes Notes to the Statement of Financial Position
Plan Assets
2018 ¤ in K
2017 € in K
Plan assets at Jan. 1 9,367 7,677 Interest income 135 93
Return on plan assets (excl. interest) 56 57
Actuarial gains | losses –148 5
Group contribution & payments –887 –709
Employee contributions 261 220
Currency translation differences 279 –481
Employer contributions 1,406 899
Contributions by the plan participants 1,466 1,606
Other changes 0 0
Plan assets as of Dec. 31 11,935 9,367
Composition of Plan Assets
Plan assets essentially consist of insurance contracts with insurance companies in Germany and Switzerland. An amount of €2.4 million (2017: €1.8 million) is held by local banks as securities for a subsidiary in South Korea.
Risks
The defined benefit plans do not entail any significant entity-specific or plan-specific risks. Due to the rather low coverage of the defined benefit obligation by plan assets, liquidity risks basically arise, which are immaterial for the Group due to their low monetary amount.
Sensitivity Analysis
An increase or a decrease in the actuarial assumptions would have the following impacts on the defined benefit obligations for the year ended December 31, 2018 (a positive sign in front of the number means an increase in the obligation):
Demographic assumptions Change in life expectancy –1 year +1 year
Effect –2,187 2,207
Financial assumptions Change in discount rate –100 bps +100 bps
Effect 12,305 –9,719
Change in future salary increase –50 bps +50 bps
Effect –1,011 1,070
Change in future pension increase –25 bps +25 bps
Effect –1,727 1,809
Present value of the defined benefit obligations for the year ended December 31, 2017:
Demographic assumptions Change in life expectancy –1 year +1 year
Effect –1,809 1,836
Financial assumptions Change in discount rate –100 bps +100 bps
Effect 12,069 –9,530
Change in future salary increase –50 bps +50 bps
Effect –932 993
Change in future pension increase –25 bps +25 bps
Effect –1,712 1,795
The sensitivity analysis presented above might not be representative of the actual change in the defined benefit obligation as it is unlikely that the change in assumptions would occur in isolation of one another. Furthermore, the present value of the defined benefit obligation has been calculated using the same method that was applied in calculating the defined benefit obligation liability recognized in the statement of financial position (projected unit credit method).

Consolidated Financial Statements and Notes Notes to the Statement of Financial Position 143
Maturity Analysis
The undiscounted cash flows from defined benefit obligations can be allocated to maturities as follows:
Dec. 31, 2018
€ in K Dec. 31, 2017
€ in K
<1 year 3,059 2,894
1-5 years 14,300 13,434
6-10 years 19,909 19,083
>10 years 107,489 92,246
The weighted average duration of the defined benefit obligations is 15.7 years (2017: 16.3 years).
For fiscal 2019, payments of €3.5 million for defined benefit plan commitments are expected (2018: €3.2 million). These cover contributions to plan assets and payment of retirement benefits.
24. Other Non-Current Provisions
Provisions are set up if a legal or de facto obligation or liability with respect to third parties exists and if an outflow of resources is probable and the expected obligation can be reasonably estimated.
Restructuring provisions are set up in connection with measures that materially change the scope of business performed by a segment or business unit or the man-ner in which business is conducted. In most cases, these measures give rise to expenses related to termination benefits due to the termination of employment contracts or leases as well as to compensation payments to dealers, distributors and suppliers. Restructuring provisions are recognized if the company has begun or already commuicated a detailed and formal plan.
Non-Current Provisions
Payments to employees on early retirement plan
€ in K Other € in K
Total € in K
Balance at Jan. 1, 2017 4,719 3,086 7,805
Currency translation 0 –161 –161
Consumption –1,964 –35 –1,999
Additions 1,613 488 2,101
Balance at Dec. 31, 2017 4,368 3,377 7,746
Payments to employees on early retirement plan
€ in K Other € in K
Total ¤ in K
Balance at Jan. 1, 2018 4,368 3,377 7,746
Currency translation 2 117 119
Consumption –2,078 –82 –2,160
Reversals | Utilization –7 –22 –29
Additions 1,802 342 2,144
Balance at Dec. 31, 2018 4,087 3,732 7,820
The non-current provisions comprise mainly provisions for partial retirement agreements, a type of early retirement plan, and employee bonuses for their company anniversaries. These obligations arise mainly at German Group companies. The early retirement plans are partial retirement plans that permit employees to work part-time for 3 to 5 years directly before they are due to retire at the legal retirement age and that are financially supported by the company.
According to IAS 19, the expenses related to severance payments to be earned in future periods must be spread over the active employee's respective remaining period of service. Such actuarial gains and losses, as well as past service costs, are to be recognized as income or expense(s).

144 Consolidated Financial Statements and Notes Notes to the Statement of Financial Position
Bonuses for company anniversaries are generally granted to employees who have accumulated seniorities of 20, 25, 30 and 40 years, and cover additional special vacation as well as relatively small sums of money.
Non-current provisions are reported at their present value on the reporting date. The discount interest rate for employees on the early retirement plan is 0.1% (2017: 0.0%) and for provisions accrued for company anniversaries 1.45% (2017: 1.28%). In fiscal 2017 and 2018, the effect from compounding non-current provisions, including the effects of changes in the interest rate, were immaterial.
Current Provisions
Warranties
€ in K Other € in K
Total € in K
Balance at Jan. 1, 2017 6,421 11,682 18,104
Currency translation –135 –167 –303
Change in the scope of consolidation 0 0 0
Consumption –1,440 –2,650 –4,090
Reclassifications 0 –709 –709
Reversals –929 –5,832 –6,761
Additions 2,711 4,399 7,110
Balance at Dec. 31, 2017 6,628 6,723 13,351
Warranties
€ in K Other € in K
Total ¤ in K
Balance at Jan. 1, 2018 6,628 6,723 13,351
Currency translation 21 –16 6
Change in the scope of consolidation 0 0 0
Consumption –1,068 –1,490 –2,558
Reclassifications 0 –187 –187
Reversals –2,886 –797 –3,683
Additions 5,589 3,743 9,332
Balance at Dec. 31, 2018 8,284 7,976 16,260
Provisions for warranties cover expected return of products, replacement deliveries and repairs. Such provisions are set up to cover individual risks, provided that their occurrence is more probable than their non-occurrence, as well as to cover general warranty risks based upon past experience.
The other provisions essentially include those for pending losses on onerous contracts and for uncertain obligations concerning employee benefits.
25. Other Liabilities
Dec. 31, 2018
¤ in K Dec. 31, 2017
€ in K
Tax and social security 24,670 19,963
Other 30,173 20,157
Other liabilities 54,842 40,120

Consolidated Financial Statements and Notes Notes to the Statement of Financial Position 145
Financial Instruments | Financial Risks
Financial instruments are any contracts that give rise to a financial asset of one entity and a financial liability or equity instrument of another entity. Such financial instruments are recognized on the trade date. The following sections provide a comprehensive overview of the financial instruments used at Sartorius and additional information on the items including financial instruments of the statement of financial position.
26. Initial Application of IFRS 9, Financial Instruments: Transition Effects and Applied Accounting Policies
The initial date of application of IFRS 9, Financial Instruments, is January 1, 2018. The Group has applied IFRS 9 retrospectively, without restating the prior-year figures. Therefore, the comparative period is presented in line with previous rules. The aggregate effects from the transition to IFRS 9 are accounted for in equity by an adjustment to the opening balance of retained earnings (earnings reserves and retained profits) as of the initial date of application. The effect from the initial application of IFRS 9 results from the adjustment of the credit impairment approach for trade receivables and amounts to about €0.4 million.
As a result, this increased retained earnings from €513.3 million as of December 31, 2017, to €513.7 million as of January 1, 2018 .
IFRS 9 replaces the guidelines of IAS 39: Financial Instruments: Recognition and Measurement. The new International Financial Reporting Standard contains revised guidance for classification and measurement of financial instruments, including a new model of expected credit losses for calculating the impairment of financial assets, as well as new, general accounting principles for hedging instruments. IFRS 9 also adopts the guidance of IAS 39 for recognition and derecognition of financial instruments. In the year earlier, the categories of credits and receivables as well as of held-to-sell were relevant.
Under IFRS 9, the new classification and measurement approach for financial assets reflects both the entity's business model (held-to-collect, held-to-collect-and- sell, other) within the scope of which assets are held and the contractual cash flow characteristics (SPPI criterion). The following table shows the categories according to IAS 39 and IFRS 9, as well as the respective carrying amounts at the date of initial application of IFRS 9.

146 Consolidated Financial Statements and Notes Notes to the Statement of Financial Position
Carrying amounts of financial assets at the date of initial application of IFRS 9
Category acc. to IAS 39
Carrying amount
acc. to IAS 39 Dec. 31, 2017
€ in mn
Reclassifi-cation
€ in mn
Remeasure-ment
€ in mn
Carrying amount
acc. to IFRS 9 Jan. 1, 2018
¤ in mn
Category acc. to IFRS 9
Cash and cash equivalents Loans and
receivables 59.4 59.4 Measured at
amortized cost
Receivables and other assets Loans and
receivables 19.3 19.3 Measured at
amortized cost
Derivative financial instruments in hedge relationships n/a 9.0 9.0 n/a
Other financial assets (current) 28.2 28.2
Trade receivables Loans and
receivables 275.2 0.4 275.7 Measured at
amortized cost
Amounts due from customers for contract work n/a 7.0 0.0 7.0 n/a
Trade receivables 282.2 0.4 282.6
Financial assets Loans and
receivables 6.5 –2.3 4.2 Measured at
amortized cost
Financial investments Available for
sale 1.7 1.9 3.6
Debt instruments at
fair value through
profit or loss
Financial investments Available for
sale 2.1 2.1
Equity instruments at
fair value through profit
or loss
Financial assets (investments in non-consolidated subsidiaries) n/a 1.3 1.3
n/a (investments in
non- consolidated subsidiaries)
Derivative financial instruments in hedge relationships n/a 8.6 8.6 n/a
Financial assets (non-current) 20.1 –0.4 19.8
There were no effects on the Group's financial liabilities. The few reclassifications of financial assets were determined on the basis of individual assessments of the financial instruments, especially with regard to the contractual cash flow characteristics. For equity instruments that existed as of the date of initial application of the Standard and that were not held for trading, the Group decided to recognize future changes in the fair value of these instruments in profit or loss. This choice is generally to be made on an instrument-by-instrument basis upon initial recognition of the instrument. Reclassification did not lead to measurement effects. The measurement effects presented result from the adjustment of the impairment approach for trade receivables. In the reporting year of 2018, there were no reclassifications of financial instruments.
IFRS 9 replaces the incurred loss model for impairment measurement by the expected loss model. Financial assets are generally regarded as credit-impaired when
there are objective indications that cast doubt about the full recoverability of the cash flows of the respective financial assets. In the Sartorius Group, the simplified impairment approach is used, in particular, to measure trade receivables.
On the date of initial application of IFRS 9, the allowance for expected credit losses amounted to approx. €0.1 million. This amount includes the expected credit loss in relation to contract assets that do not contain a significant financing component according to IFRS 15. In the course of the transition to IFRS 9, the Group also analyzed and revised its approach for recognition of incurred losses, given its low level of historical losses. The resulting opposite effect resulting upon the date of initial application of IFRS 9 led to a total effect of about €0.4 million, which increased the Group's retained earnings as of January 1, 2018. The following table shows the effects resulting from the adjustments to the Group's impairment approach for trade receivables:

Consolidated Financial Statements and Notes Notes to the Statement of Financial Position 147
Valuation allowances at the date of initial application of IFRS 9
Category acc. to IAS 39
Closing loss allowances
acc. to IAS 39 Dec. 31, 2017
€ in mn
Remeasurement due to
implementation of IFRS 9
€ in mn
Opening loss allowances
acc. to IFRS 9 Jan. 1, 2018
€ in mn
Category acc. to IFRS 9
Trade receivables Loans and receivables –5.5 0.4 –5.1
Measured at amortized cost
Amounts due from customers for contract work n/a 0.0 0.0 0.0 n/a
Trade receivables –5.5 0.4 –5.1
Besides trade receivables, cash and cash equivalents are the most significant financial assets on the Group's statement of financial position at the date of initial application of IFRS 9 and as of the reporting date, December 31, 2018. No impairment was recognized due to materiality considerations. For the remaining financial assets measured at amortized cost, no impairment is recognized as of the date of initial application of IFRS 9 and for the period ended December 31, 2018, for the 12-month expected credit losses, given the Group's immaterial historical losses. Derivatives, i.e., derivative financial instruments such as forward contracts and interest rate swap contracts, are measured according to recognized mathematical methods at fair value based on the market data available at the time the value of derivatives are calculated. Instruments not classified as hedging instruments and for which hedge accounting is not applied, are classified by the company as held for trading. Changes in the fair value of derivative financial instruments are recognized either in profit or loss or, in the case of hedges, in other comprehensive income. The Group applies the new hedge accounting rules of IFRS 9 prospectively. As part of its hedge accounting, the Group uses forward transactions to hedge cash flow risks that result from changes in foreign exchange rates in relation to sales of products and the procurement of materials, and designates only the spot element of the hedging instrument. No transition effects result from the application of the new hedge accounting requirements.
Financial Assets
Financial assets are primarily comprised of cash and cash equivalents, trade receivables and liabilities from loans and borrowings, as well as derivatives with a positive fair value.
27. Cash and Cash Equivalents
The Group considers all highly liquid investments with up to three months' maturity from the date of acquisition to be cash or cash equivalents. These mainly comprise checks, cash on hand and deposits in banks. Cash and cash eqivalents are measured at cost. As of the reporting date on December 31, 2018, cash and cash equivalents stood at around €45,164 K (2017: €59,423 K).

148 Consolidated Financial Statements and Notes Notes to the Statement of Financial Position
28. Current Trade and Other Receivables
Dec. 31, 2018 ¤ in K
Dec. 31, 2017 € in K
Trade receivables from third parties 296,024 267,445
Amounts due from customers for contract work1) 3,902 6,967
Receivables from non-consolidated affiliates 7,438 7,793
Trade receivables 307,364 282,206
1) Contract assets according to IFRS 15 (see note 9).
The book values of trade receivables approximate the receivables' fair value due to their short terms. Contract assets result from customer-specific construction contracts that meet the criteria for recognition of revenue over time in accordance with IFRS 15.
Impairment losses on trade and other receivables are recognized using separate allowance accounts. For a description on the calculation of these allowances, see note 39.
29. Other Financial Assets
Dec. 31, 2018
¤ in K Dec. 31, 2017
€ in K
Derivative financial instruments 3,350 8,975
Loan receivables from affiliates 3,728 4,000
Miscellaneous other financial assets 22,178 15,256
Other financial assets 29,256 28,231
The book value of derivatives represents the positive market avalues of currency hedges. The remaining other financial assets are measured at amortized cost, less any impairment losses, by application of the effective interest method.
Financial Liabilities
Financial liabilities of the Group mainly comprise loans from banks, trade payables, finance lease liabilities and derivative financial instruments with a negative fair value. Except for derivative financial instruments, financial liabilities are measured at amortized cost using the effective interest method.
30. Loans and Borrowings and Finance Lease Liabilities
Balance at Dec. 31, 2018
¤ in K
Of which non-current ¤ in K
Balance at Dec. 31, 2017
€ in K
Of which non-current
€ in K
Loans and borrowings 985,852 878,538 934,404 869,830
Finance lease liabilities 18,772 16,108 20,565 17,568
1,004,624 894,646 954,969 887,398
The major pillar of financing for the Sartorius Group is the syndicated credit line of €400 million concluded in December 2014 with a maturity term of up to 2021. With this financing arrangement, Sartorius has replaced two syndicated credit lines ahead of schedule and has consolidated its financing within the Group.
Further elements of the company's financing are various note loans ("Schuldscheindarlehen") placed in 2012, 2016 and 2017, respectively, with an average outstanding loan balance of around €580 million and original maturities of up to 10 years. Moreover, the company has several non-current loans in place that total around €300 million and are being used in part for expansion of production capacities.
These long-term financing instruments are supplemented by various working capital loans and guaranteed credit lines totaling around €80 million.

Consolidated Financial Statements and Notes Notes to the Statement of Financial Position 149
31. Other Non-Current Liabilities
Dec. 31, 2018
¤ in K Dec. 31, 2017
€ in K
Derivative financial instruments 0 1,147
Other liabilities 21,913 50,213
Total 21,913 51,360
The derivative financial instruments represent the negative market values of hedging transactions for currency hedges.
Other non-current liabilities essentially include the liabilities in connection with the non-controlling interest of Sartorius Israel and the liability for so-called phantom units concerning AllPure shares. In 2017, these liabilities included a non-current part of the purchase price payment for the acquisition of Lonza's cell culture media business. As Sartorius was released from its legal payment obligation in the reporting year as part of the change in the alliance with Lonza, this financial liability no longer existed as of the reporting date on December 31, 2018. The effects on income were recognized in the other operating income (see note 11).
Valuation of the liabilities for AllPure and Sartorius Israel is based on the forecasted sales development for each entity. For valuation of the liability incurred for AllPure phantom units, a compound annual growth rate of more than 20% for sales was assumed. The new estimate of sales development yields an adjustment of the liability by around €3 million, which is expensed. An increase in sales expectations by 10% in each of the following years would lead to an increase in the liability by €0.9 million; a decrease in sales expectations by the same percentage in each of the successive years would result in a reduction of this liability by the same amount of €0.9 million.
Concerning the liability for the purchase of non-controlling interest in Sartorius Israel Ltd., a compound annual growth rate of 10% was assumed for sales planning due to slightly changed expectations for the
future. According to the accounting method applied for subsequent measurement of this liability due to the put option over non-controlling interest, a valuation effect of around €7 million based on the new estimate is recognized in equity. An increase of sales revenue by 10% in each of the following years would lead to an increase of this liability by €0.7 million, and a decrease in sales revenue by the same percentage in each of the following years would result in a decrease of this liability by the same amount of €0.7 million.
32. Trade Payables
Dec. 31, 2018
¤ in K Dec. 31, 2017
€ in K
Payments received on account of orders1) 52,987 47,508
Trade payables to third parties 120,393 91,639
Verbindlichkeiten gegenüber verbundenen Unternehmen und Beteiligungsunternehmen 74 54
Trade payables 173,455 139,201
1) Contract liabilities according to IFRS 15 (see note 9).
33. Other Current Financial Liabilities
Dec. 31, 2018
¤ in K Dec. 31, 2017
€ in K
Derivative financial instruments 1,732 1,991
Other 23,343 42,149
Other financial liabilities 25,075 44,140
34. Carrying Amounts and Fair Values
The following two tables compare the carrying amounts and the fair values of all categories of the Group financial instruments as of December 31, 2018 according to IFRS 9 and of those as of December 31, 2017, according to IAS 39.

150 Consolidated Financial Statements and Notes Notes to the Statement of Financial Position
Category acc.
to IAS 39
Carrying amount
Dec. 31, 2017 € in K
Fair value Dec. 31, 2017
€ in K
Financial investments Available for
sale 5,026 5,026
Financial assets Loans and
receivables 6,524 6,524
Derivative financial instruments in hedge relationships* n/a 8,595 8,595
Financial assets (non-current) 20,145 20,145
Trade receivables Loans and
receivables 282,206 282,206
Receivables and other assets Loans and
receivables 19,256 19,256
Derivative financial instruments in hedge relationships* n/a 8,975 8,975
Other financial assets (current) 28,231 28,231
Cash and cash equivalents Loans and
receivables 59,423 59,423
Loans and borrowings
Financial liabilities at
cost 934,404 945,116 Finance lease liabilities IAS 17 20,565 31,376
Trade payables
Financial liabilities at
cost 91,693 91,693
Trade payables | payments received for orders n/a 47,508 47,508
Trade payables 139,201 139,201 Derivative financial instruments in hedge relationships* n/a 1,439 1,439
Derivative financial instruments Held for trading 1,699 1,699
Other financial liabilities
Financial liabilities at
cost 92,362 97,554
Other financial liabilities 95,500 100,692
The figures for the comparative period have been restated due to finalization of the purchase price allocation for the acquisitions made in 2017.

Consolidated Financial Statements and Notes Notes to the Statement of Financial Position 151
Category acc.
to IFRS 9
Carrying amount
Dec. 31, 2018 ¤ in K
Fair value Dec. 31, 2018
¤ in K
Investments in non-consolidated subsidiaries n/a 13,449 13,449
Financial investments
Equity instruments at
fair value through profit
or loss 2,124 2,124
Financial investments
Debt instruments at
fair value through
profit or loss 7,789 7,789
Financial assets Measured at
amortized cost 5,419 5,419
Financial assets (non-current) 28,781 28,781
Amounts due from customers for contract work n/a 3,902 3,902
Trade receivables Measured at
amortized cost 303,463 303,463
Trade receivables 307,364 307,364
Receivables and other assets Measured at
amortized cost 25,906 25,906 Derivative financial instruments in hedge relationships* n/a 3,350 3,350
Other financial assets (current) 29,256 29,256
Cash and cash equivalents Measured at
amortized cost 45,164 45,164
Loans and borrowings
Financial liabilities at
cost 985,852 1,001,758
Trade payables
Financial liabilities at
cost 120,467 120,467
Trade payables | payments received for orders n/a 52,987 52,987
Trade payables 173,455 173,455
Derivative financial instruments in hedge relationships* n/a 1,732 1,732
Other financial liabilities
Financial liabilities at
cost 45,256 45,240
Other financial liabilities 46,988 46,972
* The amounts each contain the non-designated part of derivatives of a total of -€4.1million (2017: -€4.1 million).
The fair values of the financial instruments were determined on the basis of the market information available on the reporting date and are to be allocated to one of the three levels of the fair value hierarchy in accordance with IFRS 13.
Level 1 financial instruments are calculated on the basis of prices quoted on active markets for identical assets and liabilities. In Level 2, financial instruments are calculated on the basis of input factors, which are derivable from observable market data, or on the basis of market prices for similar instruments. Level 3 financial instruments are calculated on the basis of input factors that cannot be derived from observable market data.
The financial instruments to be recognized at fair value on the reporting date are derivatives in the form
of forward contracts. They were measured on the basis of their quoted exchange rates and market yield curves (Level 2).
The fair values to be disclosed for financial liabilities recognized at amortized cost, especially liabilities to banks and those related to note loans ("Schuldscheindarlehen"), were measured on the basis of the market interest rate curve, taking the current indicative credit spreads into account (Level 2).
The fair values of the remaining financial assets and liabilities to be disclosed approximate the carrying amounts on account of their predominantly short-term maturity. The maximum default risk to be disclosed is reflected by the carrying amounts of the financial assets recognized in the statement of financial position.

152 Consolidated Financial Statements and Notes Notes to the Statement of Financial Position
The Group recognizes transfers between the levels of the fair value hierarchies at the end of the reporting period during which the change has occurred. In the current reporting period, there were no transfers between the levels.
35. Net Result for Financial Instruments
The net gains and losses of the various categories of financial instruments are presented in the following table:
Category acc. to IFRS 9 2018 ¤ in K
Financial assets at amortized costs 3,114
Financial assets and liabilities at fair value through profit or loss 1,628
Financial liabilities at cost –14,086
Category acc. to IAS 39 2017
€ in K
Loans and receivables –5,182
Financial assets and liabilities held for trading 3,602
Financial liabilities at cost 2,771
The net result of financial assets measured at amortized cost primarily consists of currency translation effects as well as changes in allowances.
The net result of financial assets and liabilities held for trading is primarily comprised of changes in the fair value of derivative financial instruments, as well as of interest income and expenses for these instruments.
The net result of liabilities measured at amortized cost mainly consists of the effects of foreign currency translation.
The total interest income and expenses for financial assets and liabilities that are not recognized at fair value through profit and loss are as follows:
2018 ¤ in K
2017 € in K
Interest income 628 369
Interest expenses –14,704 –15,199
Capital and Financial Risk Management
Capital Management
In the Sartorius Group, capital is managed in order to maximize earnings of the company's stakeholders by optimizing the ratio of equity to liabilities.
Furthermore, we ensure that all Group companies operate under the premise of the going-concern principle.
The financial liabilities described in Section 30 are regarded as managed capital and, furthermore, so are the cash and cash equivalents as well as equity capital.
Goals of Financial Risk Management
The Treasury Management unit of the Group coordinates access to national and international financial markets. In addition, the Treasury Management unit monitors and controls financial risks, which essentially entail currency, interest rate and liquidity risks.
The Sartorius Group strives to minimize the impact of currency and interest rate risks using derivative financial instruments. Hedging transactions and their controlling are carried out by different staff members. Moreover, the Group’s Internal Auditing Department regularly monitors the use of such financial instruments. Trading with derivative financial instruments is done for hedging purposes only.
36. Management of Exchange Rate Risks and Hedge Accounting
The Group is exposed to currency risks as approximately one-third of sales revenue is generated in U.S. dollars or currencies linked to the U.S. dollar and, to a lesser extent, in other foreign currencies. At the same time, Sartorius' global manufacturing network enables the company to offset the lion’s share of sales revenues received in foreign currency within the Group against costs likewise incurred in foreign currency. The portion of sales revenue in foreign currency that remains after we have settled our costs, i.e., net currency exposure resulting from currency translation, is hedged to a large extent by derivative financial instruments. Our hedging strategy generally provides for hedging remaining net currency exposure up to 12 months ahead. These hedging measures are reviewed at regular intervals to adapt them, where necessary, to expected exchange rate fluctuations .

Consolidated Financial Statements and Notes Notes to the Statement of Financial Position 153
Using material forward contracts concluded by the end of the reporting date, we secure the right, and simultaneously create the obligation, to sell an established foreign currency amount on the exercise date at a specific exchange rate against the euro, independently of the exchange rate actually valid on this date. The profit or loss resulting from the difference between the current and the previously established exchange rate is generally measured as income or an expense in the statement of profit or loss.
As of the reporting date, the company had forward contracts for a total volume of U.S. $177 million (2017: $247 million) to hedge against the risk of fluctuation in the EUR | USD exchange rate.
The remaining net currency exposure related to the U.S. dollar is approx. €50 million for 2019.
December 31, 2017 Currency Volume Maturity
Fair value ¤ in K
Forward contract USD 150,000 2018 8,637
USD 97,000 2019 8,595
USD 247,000 17,232 Forward contract CHF –24,500 2018 –1,375
CHF –24,500 –1,375 Forward contract JPY 1,000,000 2018 103
JPY 1,000,000 103 Forward contract GBP 7,000 2018 –64
GBP 7,000 2018 –64 Forward contract CAD 12,600 2018 227
CAD 12,600 2018 227 Forward contract HKD 4,000 2018 8
HKD 4,000 2018 8
December 31, 2018 Currency Volume Maturity
Fair value ¤ in K
Forward contract USD 71,000 2019 –185
USD 63,000 2019 435
USD 25,000 2019 793
USD 18,000 2019 731
USD 177,000 1,775 Forward contract CHF –3,000 2019 4
CHF –3,000 4 Forward contract JPY 400,000 2019 –138
JPY 400,000 2019 –135
JPY 200,000 2019 –51
JPY 500,000 2019 –104
JPY 1,500,000 –429 Forward contract GBP 7,300 2019 63
GBP 7,300 63 Forward contract CAD 4,000 2019 71
CAD 4,000 2019 90
CAD 2,000 2019 43
CAD 10,000 204

154 Consolidated Financial Statements and Notes Notes to the Statement of Financial Position
Derivative financial instruments are measured at the time of acquisition at cost and at fair value on subsequent reporting dates. The changes in value of the derivative financial instruments are recognized in the statement of profit or loss on the reporting date.
If the derivative financial instruments serve to hedge against cash flow risk arising from exchange rate risks and a qualified hedging relationship exists based on the criteria of IAS 9, the valuation adjustments for the portion determined to be effective hedges are recognized in other comprehensive income. Only the change in the spot element of the forward contracts used as cash flow hedges are regularly designated. Amounts accumulated in equity are included in the profit or loss in the same periods in which the hedged item affects profit or loss. The changes in the cash flow hedging reserves are shown in the statement of changes in equity and in the statement of
comprehensive income. The non-designated or ineffective is recognized immediately through profit or loss in the financial result.
The critical terms match method is used to test the effectiveness of a hedging relationship; in other words, the economic relationship between the hedging instrument and the underlying hedged item is determined based on the consistency of the significant contractual features of the transactions. To this extent, the Group conducts a qualitative assessment. Hedge ineffectivenss may possibly arise if the timing of future transactions deviate from the original assumptions or the credit risk of the counterparties of a hedging instrument, i.e., forward contract, changes .
The following table shows the impact of foreign currency hedges on the net worth, financial position and earnings of the Group:
Currency
Carrying amount (assets)
Dec. 31, 2018
€ in K
Carrying amount
(liabilities) Dec. 31,
2018 € in K
Hedge ratio
Change in value of hedging
instruments
€ in K
Change in value of hedged
items € in K
Nominal amount in each foreign
currency
Maturity: 1 - 6
months
Maturity: 7 - 12
months
Average exercise
price
USD 6,648 851 100% 5,797 5,797 177,000 134,000 43,000 1.14
CHF 5 0 100% 5 5 3,000 3,000 0 1.13
CAD 238 0 100% 238 238 10,000 8,000 2,000 1.52
JPY 0 421 100% –421 –421 1,500,000 800,000 700,000 130.36
GBP 86 0 100% 86 86 7,300 7,300 0 0.90
On the statement of financial position, hedging instruments with a positive market value are disclosed in the items "Financial assets (non-current)" and in the "Other financial assets (current)" while such instruments with a negative market value are reported in the items "Other financial liabilities (non-current)" and "Other financial liabilities (current)."
Concerning the exchange rate of the U.S. dollar to the euro, the following sensitivities provide the estimated impacts: If the U.S. dollar would have depreciated 10% against the euro, equity would have been €13.1 million lower (2017: €16.4 million lower) than actually reported and annual profit before tax would have increased by €0.7 million (2017: €1.4 million lower) from the currently disclosed figure. Vice versa, if the U.S. dollar would have appreciated 10% against the euro, the resulting impact on the annual profit before tax would have been -€0.8 million (2017: +€1.7 million) and the impact on equity +€20.0 million (2017: +€20 million). These impacts include effects from the Group's intercompany loans, which are partially compensated for by effects of currency reserves for translation.
37. Interest Risk Management
The entire Sartorius Group is generally financed through Sartorius AG, which uses internal Group loans to ensure the financing of all Group companies. The Sartorius Group is exposed to interest rate risks as some loans are taken out at variable interest rates. As of the reporting date on December 31 2018, the Group predominantly obtains financing at fixed interest rates (approx. 70%) so the risk of interest rates is of minor significance for the Group's net worth, financial position and earnings. For this reason, the interest rate hedges in the form of interest swaps concluded by the Group in the past were terminated in the reporting year. As a result, there were no open interest derivative contracts in the reporting year to hedge the risk of increasing interest rates.

Consolidated Financial Statements and Notes Notes to the Statement of Financial Position 155
As of the reporting date of December 31, 2018, the volume of variable interest loans was around €300 million (2017: €300 million). For the financial instruments held as of the reporting date, a sensitivity analysis yields the following results: If the market interest rate would have been 1.0 percentage point higher, this would have had an impact of -€3.1 million resulting from the variable interest loan (2017: -€3.0 million).
The opposite effect would have been yielded by the valuation of the interest rate swaps of €0.6 million.
A decrease in the base interest rate to 0% was used to measure the sensitivities of declining interest rates. Under this condition, the corresponding effect on profit before tax would have been slightly positive (2018: €0.9 million; 2017: €0.4 million).
38. Liquidity Risk Management
The following table shows the liquidity analysis for financial liabilities, excluding derivatives, in the form of contractually agreed undiscounted cash flows based on conditions as of the reporting date:
Carrying amount
Dec. 31, 2017 € in K
Cash flow Dec. 31, 2017
€ in K
< 1 year
€ in K
1 - 5 years
€ in K
> 5 years
€ in K
Loans and borrowings 934,404 975,664 74,166 463,400 438,098
Finance leases 20,565 36,152 3,291 8,916 23,945
Trade payables 91,693 91,693 91,693 0 0
Other liabilities (excluding derivatives) 92,362 102,956 42,149 42,057 18,750
Financial liabilities 1,139,024 1,206,465 211,299 514,374 480,793
Carrying amount
Dec. 31, 2018 ¤ in K
Cash flow Dec. 31, 2018
¤ in K
< 1 year
€ in K
1 - 5 years
€ in K
> 5 years
€ in K
Loans and borrowings 985,852 1,035,266 114,561 603,967 316,738
Finance leases 18,772 35,359 2,983 10,238 22,138
Trade payables 120,467 120,467 120,467 0 0
Other liabilities (excluding derivatives) 45,256 50,513 31,138 14,662 4,712
Financial liabilities 1,170,347 1,241,605 269,149 628,867 343,588
The carrying amounts and cash flows for the derivatives are shown as follows:
Carrying amount
Dec. 31, 2017 € in K
Cash flow Dec. 31, 2017
€ in K
< 1 year
€ in K
1 - 5 years
€ in K
> 5 years
€ in K
Gross fulfillment Forward contracts 1,439 1,440 1,440 0 0 Payment obligation 30,691
Payment claim –29,251
Net fulfillment Interest rate swaps 1,699 1,696 1,476 220 0 Derivatives 3,138 3,136 2,916 220 0

156 Consolidated Financial Statements and Notes Notes to the Statement of Financial Position
Carrying amount
Dec. 31, 2018 ¤ in K
Cash flow Dec. 31, 2018
¤ in K
< 1 year
€ in K
1 - 5 years
€ in K
> 5 years
€ in K
Gross fulfillment Forward contracts 1,732 1,730 1,730 0 0 Payment obligation 50,107 0 0
Payment claim –48,377 0 0
Derivatives 1,732 1,730 3,460 0 0
The Group controls liquidity risks by maintaining credit lines and additional facilities with banks, continuously tracking the forecasted and actual cash flows and by managing the maturity profiles of financial assets and liabilities.
It is not expected that cash outflows will occur at materially different reporting dates or with materially different amounts.
As of December 31, 2018, there was no offsetting potential for financial instruments due to global netting agreements (2017: €3.0 million; German Master Agreement for Financial Futures).
Credit Lines
€ in K Credit line at Dec. 31, 2017 <1 year 1 to 5 years >5 years Interest rate
Credit line used at
Dec. 31, 2017
Credit line unused as of
Dec. 31, 2017
Syndicated credit lines 400,000 0 400,000 0 variabel 20,000 380,000
Note loan (Schuldscheindarlehen) 582,000 0 222,000 360,000
variabel und fix 582,000 0
Bilateral loans 300,463 27,623 208,435 64,405 variabel und fix 300,463 0
Bilateral credit line 78,480 78,480 0 0 variabel 31,941 46,539
Total 1,360,943 106,103 830,435 424,405 934,404 426,539
€ in K Credit line at
Dec. 31, 2018 <1 year 1 to 5 years >5 years Interest rate
Credit line used at
Dec. 31, 2018
Credit line unused as of
Dec. 31, 2018
Syndicated credit lines 400,000 0 400,000 0 variabel 80,000 320,000
Note loan (Schuldscheindarlehen) 582,000 10,500 291,500 280,000
variabel und fix 582,000 0
Bilateral loans 269,164 40,447 201,516 27,201 variabel und fix 269,164 0
Bilateral credit line 83,371 83,371 0 0 variabel 54,688 28,683
Total 1,334,535 134,318 893,016 307,201 985,852 348,683
As explained in Section 30, the Group is essentially financed by a syndicated loan, note loans ("Schuldscheindarlehen") and bilateral loans. Under these agreements, the Group is required to comply with standard financial key ratios, or covenants. In this context, the ratio of net debt to underlying EBITDA may not be greater than 3.25 and 4.00, respectively. In fiscal 2018, the Group achieved a ratio of net debt to underlying EBITDA of 2.4 compared with 2.5 in 2017 Based on the current information available, the company considers it unlikely that it would not comply with these covenants.
39. Credit Risk Management
Credit risk is the risk of financial loss to the Sartorius Group if a counterparty to a financial instrument fails to meet its contractual obligations. Credit risks arise in particular from cash and cash equivalents as well as from trade receivables. Moreover, the Group is exposed to credit risks arising from derivatives with a positive market value and, to a low degree, to other contractual cash flows from debt securities.

Consolidated Financial Statements and Notes Notes to the Statement of Financial Position 157
Credit risk is controlled centrally for the Group by the Treasury Management unit. The creditworthiness of banks and financial institutions as counterparties of the Group are continuously monitored in order to recognize increases in credit risks at an early stage. If no new information is obtained, the Group assumes that its related financial assets still have only a low credit risk.
Customers are assigned to different risk limits, which are essentially based on the business volume, past experience with and the net worth and financial risk of these respective customers. Management responsible for these customers regularly reviews that their assigned customers comply with these credit limits. There are no significant concentrations of credit risks arising from individual customers or regions.
For some trade receivables, the Group has collateral, such as guarantees, financial securities and suretyship contracts to which the Group can resort in line with the contract modalities should a counterparty default on its payment obligations.
Impairment of Financial Assets
Trade Receivables and Contract Assets
Under IFRS 15, trade receivables and contract assets, in particular, are required to be measured according to the new model for recognition of expected credit losses. The Sartorius Group applies the simplified impairment approach according to IFRS 9 for trade receivables and contract assets, thus taking lifetime expected credit losses into account. The new impairment model starts with an analysis of the actual historical credit loss rates. These are adjusted, taking into consideration forward-looking information and the effects of current changes in the macroeconomic environment, if significant.
Due to the immaterial level of historical credit losses, the Group currently determines the expected credit losses for its portfolio of trade receivables as a whole. However, historical loss rates are analyzed regularly in more detail in order to apply different loss rates to different portfolios. Contract assets refer to projects for typical Sartorius customers so the Group assumes that the loss rates applied to trade receivables appropriately approximate the loss rates of the contract assets. Accordingly, there is no further differentiation between trade receivables and contract assets.

158 Consolidated Financial Statements and Notes Notes to the Statement of Financial Position
On this basis, the allowances for trade receivables and contract assets were determined as follows for the
year ended December 31, 2018, and as of the date of initial application of IFRS 9:
Jan. 1, 2018 € in K Not due
1 - 30 days overdue
31 - 60 days overdue
61 - 90 days overdue
More than 90 days overdue Total
Gross carrying amount of trade receivables 196,490 40,007 15,461 6,879 21,913 280,750
Gross carrying amount of contract assets 4,767 0 0 0 0 4,767
Impairment loss allowance 102 24 136 15 4,808 5,084
Dec. 31, 2018 € in K Not due
1 - 30 days overdue
31 - 60 days overdue
61 - 90 days overdue
More than 90 days overdue Total
Gross carrying amount of trade receivables 191,723 53,456 23,520 9,024 31,828 309,551
Gross carrying amount of contract assets 3,902 0 0 0 0 3,902
Impairment loss allowance 108 54 60 336 5,530 6,087
The expected credit losses are determined based on a loss rate of 0.05%. In addition, impairments are determined on the basis of individual assessments. Days overdue are one essential criterion in this context. A default is generally presumed when there is no reasonable expectation of recovering a financial asset. In such a case, the respective receivables are derecognized.
The movements in the allowance for impairment with respect to trade receivables and contract assets in the reporting year are presented below:
€ in K
Impairment allowances acc. to IAS 39 as of Dec. 31, 2017 –5,511
Adjustment on initial application of IFRS 9 431
Impairment allowances acc. to IFRS 9 as of Jan. 1, 2018 –5,080
Net remesurement of loss allowance recognized in profit or loss –3,257
Derecognition and consumption 859
Recoveries of amounts previosly impaired 1,345
Currency effects 46
Impairment allowances acc. to IFRS 9 as of Dec. 31, 2018 –6,087
Impairment of Other Financial Assets
Besides trade receivables, cash and cash equivalents are the most material financial assets on the Group's statement of financial position as of the reporting date on December 31, 2018. The expected credit losses are monitored at regular intervals. Due to the high creditworthiness of the counterparties and the short maturities or contract terms by definition, the impairment which would theoretically have to be recognized for these financial assets is immaterial. Therefore, no impairment is recognized for cash and cash equivalents.
For the other financial assets measured at amortized cost, no impairment is recognized as of December 31, 2018, for the twelve months of expected credit losses due to immaterial historical credit losses. In the event of a significant increase in credit risk, which is generally presumed when a payment is more than 30 days past due, the lifetime expected credit losses are recognized for the respective financial asset. A default is generally presumed if there is no reasonable expectation of recovering a financial asset. This is generally presumed when payments are more than 90 days past due. As of the reporting date, there are no indications of increases in credit risk to a material extent. The carrying amounts of the financial assets reflect the maximum credit loss for these assets at the end of the fiscal year.

Consolidated Financial Statements and Notes Notes to the Statement of Financial Position 159
40. Other Risks Associated with Financial Instruments
As of the reporting date, the Sartorius Group had not been exposed to any significant risk of volatility in share prices; only vested portions of share-based payments are linked directly to the price development of Sartorius stock.
For details concerning further types of risk, please refer to the Group Management Report.
41. Share-based Payments
Within the Sartorius Group, share-based payments exist in the form of so-called phantom stock units at Sartorius AG and stock option plans at Sartorius Stedim Biotech S.A.
The so-called phantom stocks are virtual options on the shares of Sartorius AG. Specifically, the company’s phantom stock plan credits each member of the Executive Board or GEC at the beginning of every year with phantom stock units valued at an agreed monetary sum. These phantom stock options may be exercised no earlier than four years after this sum has been credited and only if certain conditions with respect to the performance of Sartorius AG shares are met. If an Executive Board member exercises an option, the number of phantom stock units granted is evaluated at the current stock exchange price. The amount paid out is capped at 2.5 times the grant price. For further details, please refer to the Remuneration Report. The fair value of the phantom stock units was measured using a Black-Scholes model and is disclosed as follows:
Components with a long-term incentive effect
Number of phantom stock units
Fair value at year-end
on Dec. 31, 2018
¤ in K
Fair value at year-end on
Dec. 31, 2017 € in K
Paid out € in K
Tranche for fiscal 2014 16,364 0 859 859
Tranche for fiscal 2015 17,632 923 1,064 141
Tranche for fiscal 2016 10,112 729 643 187
Tranche for fiscal 2017 7,980 630 441 75
Tranche for fiscal 2018 5,647 503 0 0
57,735 2,785 3,007 1,262
In fiscal 2018, the expenses relating to granting and valuation of phantom stock units were €1,039 K (2017: €366 K). As in the prior year, no phantom stock units were exercisable on the reporting date. Of the phantom stock units granted in the reporting year, 6,620 units with a fair value of €503 K on the grant date were attributable to members of the Executive Board. For details on phantom stock units, please refer to the Remuneration Report that is an integral part of the Group Management Report.
By resolution of the Supervisory Board on December 16, 2014, Dr. Kreuzburg was granted a supplementary compensation component, which provides for transferring 25,000 ordinary shares and 25,000 preference shares of the company to him. This share-based payment is subject to the rules of IFRS 2 and is deemed to have been granted upon the resolution approved by the Supervisory Board on December 16, 2014. Considering the agreed conditions, the amount resulting as of December 16, 2014, is to be spread as an employee benefits expense over the full vesting period of the plan. In fiscal 2018, an amount of €504 K (2017: €1,241 K) was accordingly recognized as an employee benefits expense resulting from the grant of shares. For further details, please refer to the Remuneration Report.

160 Consolidated Financial Statements and Notes Other Disclosures
The consolidated financial statements were prepared on a going-concern basis.
The exemptions options provided by § 264, Subsection 3, of the German Commercial Code (HGB) were applied to the annual financial statements reported by Sartorius Lab Holding GmbH, Sartorius Weighing Technology GmbH and Sartorius Corporate Administration GmbH, all based in Göttingen, Germany, for the year ended December 31, 2018.
The exemption options provided by § 264 b of the German Commercial Code (HGB) were used in the annual financial statements reported by SIV Weende GmbH & Co. KG, SIV Grone 1 GmbH & Co. KG and Sartorius Lab Instruments GmbH & Co. KG, all based in Göttingen, Germany, for the year ended December 31, 2018.
Material Events after the Reporting Date
No material events occurred up to the end of the preparation of these consolidated financial statements.
Declaration According to § 314, Subsec. 1, No. 8, of the German Commercial Code (HGB)
The declaration prescribed by § 161 of the German Stock Corporation Law (AktG) was submitted on December 6, 2018, and made available to the shareholders of Sartorius AG on the company’s website “www.sartorius.com."
Members of the Supervisory Board and the Executive Board
The members of the Supervisory Board and the Executive Board are listed at the end of this section as are the further disclosures pursuant to § 285, No. 10, of the German Commerical Code (HGB).
Number of Employees
This table shows the average workforce employed during the fiscal year:
2018 2017
Bioprocess Solutions 5,290 4,870
Lab Products & Services 2,563 2,508
Total 7,853 7,379
Auditors' Fee
In fiscal 2017 and 2018, the following fees were incurred by the Group for the auditors, KPMG AG:
2018 ¤ in K
2017 € in K
Audits 828 747
Tax consultation services 0 0
Other attestation services 50 61
Other services 144 74
1,022 882
The fees for statutory audits include the audit review fee of €91 K (2017: €64 K) for the first-half financial report pursuant to § 37w of the German Securities Trading Act (WpHG), as well as other services directly prompted by the audit.
Other Disclosures

Consolidated Financial Statements and Notes Other Disclosures 161
Related Companies and Persons
The Group companies included in the consolidated financial statements carry out business activities and transactions in related party relationships as defined by IAS 24. In particular, this concerns transactions with non-consolidated subsidiaries and are generally concluded according to the customary market terms. A long-term service contract exists with an affiliated company. For this contract, expenses of €6.6 million were incurred and reported in the statement of profit or loss in the reporting year (2017: €7.1 million). Details on the transactions completed in the reporting year and the balances outstanding on the reporting date are provided in the relevant sections of these Notes to the Financial Statements, specifically in Section 28.
According to IAS 24, related persons are those who are responsible for planning, management and control of a reporting entity. In particular, such persons include the members of the Executive Board and of the Supervisory Board of Sartorius AG. In particular, such persons include the members of the Executive Board and of the Supervisory Board of Sartorius AG. In the reporting year, the total remuneration of the Supervisory Board members was €882 K (2017: €922 K); that of the Executive Board, €3,741 K (2017: €3,492 K). The remuneration of former managing directors and members of the Executive Board and their surviving dependents was €608 K (2017: €871 K). The pension obligations to former managing directors and members of the Executive Board and their surviving dependents totaled €8,531 K (2017: €8,098 K). For details on remuneration, please refer to the Remuneration Report, which is an integral part of the combined Group Management Report. Beyond their Supervisory Board remuneration, the employee representatives who are employees within the Sartorius Group receive compensation that is not related to their service on the Supervisory Board.
The total remuneration of the Executive Board members according to IFRS is shown in the following table:
2018 ¤ in K
2017 € in K
Short-term benefits (excl. share-based remuneration) 2,979 2,651
Post-employment benefits 2,355 430
Other long-term benefits 307 375
Share-based payments 455 466
Total remuneration 6,096 3,922
Partial payments on multi-year variable remuneration of the Executive Board members:
2018 ¤ in K
2017 € in K
Balance as of Jan. 1 of a fiscal year 391 387
Partial payments deducted –222 –165
Partial payments effected 185 169
Balance as of Dec. 31 of a fiscal year 354 391
The total remuneration of the Supervisory Board members is as follows:
2018 ¤ in K
2017 € in K
Short-term benefits (excl. share-based remuneration) 882 922
Post-employment benefits 0 0
Other long-term benefits 0 0
Share-based payments 0 0
Total remuneration 882 922
Proposal for Appropriation of Profits
The Supervisory Board and the Executive Board will submit a proposal to the Annual Shareholders’ Meeting to appropriate the retained profit of €136,147,298.29 reported by Sartorius AG for the year ended December 31, 2018, as follows:
€
Payment of a dividend of €0.61 per ordinary share 20,869,456.64
Payment of a dividend of €0.62 per preference share 21,189,162.16
Unappropriated profit carried forward 94,088,679.49
136,147,298.29
Göttingen, February 5, 2019
Sartorius Aktiengesellschaft
The Executive Board

162 Consolidated Financial Statements and Notes Declaration of the Executive Board
We declare to the best of our knowledge that the consolidated financial statements for fiscal 2018 present a true and fair view of the actual net worth, financial situation and profitability of the Group in accordance with the accounting standards used in preparing these statements. We also certify that the progress of the Group’s business, including its business performance and its situation, are represented accurately in the Group Management Report in all material respects and present the most important opportunities and risks of the Group’s future development during the fiscal year.
Göttingen, February 5, 2019
Sartorius Aktiengesellschaft The Executive Board
Dr. Joachim Kreuzburg
Rainer Lehmann
Dr. René Fáber
John Gerard MacKay
Declaration of the Executive Board

Consolidated Financial Statements and Notes Independent Auditors’ Report 163
Report on the Audit of the Consolidated Financial Statements and of the Group Management Report
Opinions
We have audited the consolidated financial statements of Sartorius Aktiengesellschaft, Göttingen, and ist subsidiaries (the Group) – which comprise the consolidated statement of financial position as at December 31st, 2018, and the consolidated statement of comprehensive income, consolidated statement of changes in equity and consolidated statement of cash flows for the financial year from 1 January 2018 to 31 December 2018, and notes to the consolidated financial statements, including a summary of significant accounting policies. In addition, we have audited the group management report of Sartorius Aktiengesellschaft for the financial year from 1 January 2018 to 31 December 2018. In accordance with the German legal requirements we have not audited the content of the non-financial statement and the corporate governance statement which are included in section non-financial statement and section corporate governance statement of the group management report.
In our opinion, on the basis of the knowledge obtained in the audit,
– the accompanying consolidated financial statements comply, in all material respects, with the IFRSs as adopted by the EU, and the additional requirements of German commercial law pursuant to Section 315e (1) HGB [Handelsgesetzbuch: German Commercial Code] and, in compliance with these requirements, give a true and fair view of the assets, liabilities, and financial position of the Group as at 31 December 2018, and of its financial performance for the financial year from 1 January 2018 to 31 December 2018, and
– the accompanying group management report as a whole provides an appropriate view of the Group’s position. In all material respects, this group management report is consistent with the consolidated financial statements, complies with German legal requirements and appropriately presents the opportunities and risks of future development. Our opinion on the group management report does not cover the content of the non-financial statement and the corporate governance statement mentioned above.
Pursuant to Section 322 (3) sentence 1 HGB, we declare that our audit has not led to any reservations relating to the legal compliance of the consolidated financial statements and of the group management report.
Basis for the Opinions
We conducted our audit of the consolidated financial statements and of the group management report in accordance with Section 317 HGB and the EU Audit Regulation No. 537/2014 (referred to subsequently as “EU Audit Regulation”) and in compliance with German Generally Accepted Standards for Financial Statement Audits promulgated by the Institut der Wirtschaftsprüfer [Institute of Public Auditors in Germany] (IDW). Our responsibilities under those requirements and principles are further described in the “Auditor’s Responsibilities for the Audit of the Consolidated Financial Statements and of the Group Management Report” section of our auditor’s report. We are independent of the group entities in accordance with the requirements of European law and German commercial and professional law, and we have fulfilled our other German professional responsibilities in accordance with these requirements. In addition, in accordance with Article 10 (2) point (f) of the EU Audit Regulation, we declare that we have not provided non-audit services prohibited under Article 5 (1) of the EU Audit Regulation. We believe that the evidence we have obtained is sufficient and appropriate to provide a basis for our opinions on the consolidated financial statements and on the group management report.
Key Audit Matters in the Audit of the Consolidated Financial Statements
Key audit matters are those matters that, in our professional judgment, were of most significance in our audit of the consolidated financial statements for the financial year from 1 January 2018 to 31 December 2018. These matters were addressed in the context of our audit of the consolidated financial statements as a whole, and in forming our opinion thereon, we do not provide a separate opinion on these matters.
Independent Auditors’ Report

164 Consolidated Financial Statements and Notes Independent Auditors’ Report
Recoverability of the carrying amount of goodwill
The accounting policies as well as the assumptions made are disclosed in the notes to the consolidated financial statements in note 15. Disclosure of the amount of goodwill is provided in the notes to the consolidated financial statements in note 15.
THE FINANCIAL STATEMENT RISK
As at 31 December 2018, goodwill totalled EUR 662,2 million thereby comprising 26,2% of the balance sheet total and a substantial portion of the assets.
Goodwill is tested for impairment annually at the level of the operating segments Bioprocess Solutions (goodwill of EUR 495,5 million) and Lab Products & Services (goodwill of EUR 166,7 million). The carrying amount is thereby compared with the recoverable amount of the respective operating segments. If the carrying amount exceeds the recoverable amount of the respective operating segment, an impairment is recorded. The recoverable amount is the higher of the fair value less the costs to sell and value in use of the operating segment. The impairment test was carried out as at 30 November 2018.
The goodwill impairment test is complex and is based on a number of judgemental assumptions. These include, among others, the expected business and earnings development of the operating segments for the upcoming 4 years, the assumed long-term growth rates and the discount rate used.
There is the risk for the financial statements that the required impairments were not sufficiently recorded. In addition, there is the risk that the disclosures in the notes associated herewith are not appropriate.
OUR AUDIT APPROACH
With the support of our valuation specialists, we assessed, among other things, the appropriateness of the significant assumptions as well as the Company’s valuation model. This included a discussion of the expected development of the business and results as well as of the assumed underlying long-term growth rates with those responsible for the planning process. In addition, reconciliations were made with the budget 2018 prepared by the Executive Board and which were approved by the Supervisory Board and as well with the planing for the next 4 years. Furthermore, we assessed the consistency of the assumptions with external market assessments.
We also assessed the Company’s planning accuracy by comparing projections for previous financial years with the actual results realised and analysed deviations. As small changes in the discount rate can have a substantial impact on the results of the impairment test, we have compared the assumptions and parameters underlying the discount rate – in particular the risk-free rate, the market risk premium and the beta factor – with own assumptions and publicly available information.
To provide for the mathematical accuracy of the valuation model utilised, we recalculated the Company’s calculations on the basis of elements selected in a risk-orientated manner.
To reflect the existing uncertainty with respect to forecasts as well as the earlier valuation date for the impairment test, we have assessed reasonably possible changes of the discount rate, the expected earnings respectively the long-term growth rate on the recoverable amount (sensitivity analysis) by calculating alternative scenarios and comparing these with the Company’s valuation results.
Finally, we assessed whether the disclosures in the notes with respect to the recoverability of the carrying amount of the goodwill are appropriate.
OUR OBSERVATIONS
The underlying valuation model used in the impairment test of goodwill is appropriate and consistent with the applicable accounting principles.
The Company’s assumptions and parameters underlying the valuation are within an acceptable bandwidth and are, on the whole, balanced.
The disclosures in the notes associated herewith are appropriate.
Other Information
Management is responsible for the other information. The other information comprises:
– the non-financial statement and the corporate governance statement, and
– the remaining parts of the annual report, with the exception of the audited consolidated financial statements and group management report and our auditor’s report.

Consolidated Financial Statements and Notes Independent Auditors’ Report 165
Our opinions on the consolidated financial statements and on the group management report do not cover the other information, and consequently we do not express an opinion or any other form of assurance conclusion thereon.
In connection with our audit, our responsibility is to read the other information and, in so doing, to consider whether the other information
– is materially inconsistent with the consolidated financial statements, with the group management report or our knowledge obtained in the audit, or
– otherwise appears to be materially misstated.
Responsibilities of Management and the Supervisory Board for the Consolidated Financial Statements and the Group Management Report
Management is responsible for the preparation of the consolidated financial statements that comply, in all material respects, with IFRSs as adopted by the EU and the additional requirements of German commercial law pursuant to Section 315e (1) HGB and that the consolidated financial statements, in compliance with these requirements, give a true and fair view of the assets, liabilities, financial position, and financial performance of the Group. In addition, management is responsible for such internal control as they have determined necessary to enable the preparation of consolidated financial statements that are free from material misstatement, whether due to fraud or error.
In preparing the consolidated financial statements, management is responsible for assessing the Group’s ability to continue as a going concern. They also have the responsibility for disclosing, as applicable, matters related to going concern. In addition, they are responsible for financial reporting based on the going concern basis of accounting unless there is an intention to liquidate the Group or to cease operations, or there is no realistic alternative but to do so.
Furthermore, management is responsible for the preparation of the group management report that, as a whole, provides an appropriate view of the Group’s position and is, in all material respects, consistent with the consolidated financial statements, complies with German legal requirements, and appropriately presents the opportunities and risks of future development. In addition, management is responsible for such arrangements and measures (systems) as they have considered necessary to enable the preparation of a group management report that is in accordance with the applicable German legal requirements, and to be
able to provide sufficient appropriate evidence for the assertions in the group management report.
The supervisory board is responsible for overseeing the Group’s financial reporting process for the preparation of the consolidated financial statements and of the group management report.
Auditor’s Responsibilities for the Audit of the Consolidated Financial Statements and of the Group Management Report
Our objectives are to obtain reasonable assurance about whether the consolidated financial statements as a whole are free from material misstatement, whether due to fraud or error, and whether the group management report as a whole provides an appropriate view of the Group’s position and, in all material respects, is consistent with the consolidated financial statements and the knowledge obtained in the audit, complies with the German legal requirements and appropriately presents the opportunities and risks of future development, as well as to issue an auditor’s report that includes our opinions on the consolidated financial statements and on the group management report.
Reasonable assurance is a high level of assurance, but is not a guarantee that an audit conducted in accordance with Section 317 HGB and the EU Audit Regulation and in compliance with German Generally Accepted Standards for Financial Statement Audits promulgated by the Institut der Wirtschaftsprüfer (IDW) will always detect a material misstatement. Misstatements can arise from fraud or error and are considered material if, individually or in the aggregate, they could reasonably be expected to influence the economic decisions of users taken on the basis of these consolidated financial statements and this group management report.

166 Consolidated Financial Statements and Notes Independent Auditors’ Report
We exercise professional judgment and maintain professional skepticism throughout the audit. We also:
– Identify and assess the risks of material misstatement of the consolidated financial statements and of the group management report, whether due to fraud or error, design and perform audit procedures responsive to those risks, and obtain audit evidence that is sufficient and appropriate to provide a basis for our opinions. The risk of not detecting a material misstatement resulting from fraud is higher than for one resulting from error, as fraud may involve collusion, forgery, intentional omissions, misrepresentations, or the override of internal control.
– Obtain an understanding of internal control relevant to the audit of the consolidated financial statements and of arrangements and measures (systems) relevant to the audit of the group management report in order to design audit procedures that are appropriate in the circumstances, but not for the purpose of expressing an opinion on the effectiveness of these systems.
– Evaluate the appropriateness of accounting policies used by management and the reasonableness of estimates made by management and related disclosures.
– Conclude on the appropriateness of management’s use of the going concern basis of accounting and, based on the audit evidence obtained, whether a material uncertainty exists related to events or conditions that may cast significant doubt on the Group’s ability to continue as a going concern. If we conclude that a material uncertainty exists, we are required to draw attention in the auditor’s report to the related disclosures in the consolidated financial statements and in the group management report or, if such disclosures are inadequate, to modify our respective opinions. Our conclusions are based on the audit evidence obtained up to the date of our auditor’s report. However, future events or conditions may cause the Group to cease to be able to continue as a going concern.
– Evaluate the overall presentation, structure and content of the consolidated financial statements, including the disclosures, and whether the consolidated financial statements present the underlying transactions and events in a manner that the consolidated financial statements give a true and fair view of the assets, liabilities, financial position and financial performance of the Group in compliance with IFRSs as adopted by the EU and the additional requirements of German commercial law pursuant to Section 315e (1) HGB.
– Obtain sufficient appropriate audit evidence regarding the financial information of the entities or business activities within the Group to express opinions on the consolidated financial statements and on the group management report. We are responsible for the direction, supervision and performance of the group audit. We remain solely responsible for our opinions.
– Evaluate the consistency of the group management report with the consolidated financial statements, its conformity with German law, and the view of the Group’s position it provides.
– Perform audit procedures on the prospective information presented by management in the group management report. On the basis of sufficient appropriate audit evidence we evaluate, in particular, the significant assumptions used by management as a basis for the prospective information, and evaluate the proper derivation of the prospective information from these assumptions. We do not express a separate opinion on the prospective information and on the assumptions used as a basis. There is a substantial unavoidable risk that future events will differ materially from the prospective information.
We communicate with those charged with governance regarding, among other matters, the planned scope and timing of the audit and significant audit findings, including any significant deficiencies in internal control that we identify during our audit.
We also provide those charged with governance with a statement that we have complied with the relevant independence requirements, and communicate with them all relationships and other matters that may reasonably be thought to bear on our independence, and where applicable, the related safeguards.

Consolidated Financial Statements and Notes Independent Auditors’ Report 167
From the matters communicated with those charged with governance, we determine those matters that were of most significance in the audit of the consolidated financial statements of the current period and are therefore the key audit matters. We describe these matters in our auditor’s report unless law or regulation precludes public disclosure about the matter.
Other Legal and Regulatory Requirements
Further Information pursuant to Article 10 of the EU Audit Regulation
We were elected as group auditor by the annual general meeting on 5 April 2018. We were engaged by the supervisory board on 5 April 2018. We have been the group auditor of the Sartorius Aktiengesellschaft without interruption since the financial year 2015.
We declare that the opinions expressed in this auditor’s report are consistent with the additional report to the audit committee pursuant to Article 11 of the EU Audit Regulation (long-form audit report).
In addition to the consolidated financial statements, we audited the annual financial statements of Sartorius Aktiengesellschaft and carried out various audits of annual financial statements of subsidiaries. Auditing-integrated reviews of interim financial statements and project-accompanying audits of IT-
based accounting-related systems were performed. In addition, other statutory or contractual audits have been carried out, such as the confirmation of compliance with contractual conditions, the review of the non-financial consolidated statement and the investigation of possible non-compliance with internal regulations. In addition, we have supported quality assurance services in connection with the first-time adoption of new accounting principles such as IFRS 9, IFRS 15 and IFRS 16.
German Public Auditor Responsible for the Engagement
The German Public Auditor responsible for the engagement is Frank Thiele.
Göttingen, Germany, February 5, 2019
KPMG AG
Wirtschaftsprüfungsgesellschaft
Tonne Thiele Wirtschaftsprüfer Wirtschaftsprüfer
(German Public Auditor) (German Public Auditor)

168 Consolidated Financial Statements and Notes Executive Board and Supervisory Board
During Fiscal 2018
Executive Board
Dr. rer. pol. Joachim Kreuzburg Dipl.-Ingenieur (Graduate Engineer) CEO and Chairman Executive for Labor Relations Corporate Strategy, Human Resources, Operations, Legal Affairs & Compliance and Corporate Communications Born April 22, 1965 Resident of Hanover, Germany Member since November 11, 2002 “Sprecher” (Spokesman) from May 1, 2003, to November 10, 2005 Chairman since November 11, 2005 Appointed until November 10, 2020
Rainer Lehmann Dipl.-Kaufmann (Graduate in Business Administration) Finance, IT and Business Processes Born March 2, 1975 Resident of Brightwaters, New York, USA Member since March 1, 2017 Appointed until February 29, 2020
Reinhard Vogt Industriekaufmann (Industrial Business Manager) Marketing, Sales and Services Born August 4, 1955 Resident of Dransfeld, Germany Member since July 24, 2009 Appointed until December 31, 2018
Supervisory Board
Dr. Lothar Kappich Dipl.-Ökonom (Graduate Economist) Chairman Freelance Consultant, formerly Managing Director of ECE Projektmanagement GmbH & Co. KG in Hamburg, Germany Resident of Hamburg, Germany
Manfred Zaffke Dipl.-Volkswirt (Graduate Political Economist) Vice Chairman First Authorized Representative of the German Metalworkers’ Union (IG Metall) in the southern Lower Saxony/Harz region in Northeim, Germany Resident of Osterode am Harz, Germany
Annette Becker Personalfachkauffrau (HR Specialist) Chairwoman of the Employees' Council of Sartorius Corporate Administration GmbH in Göttingen, Germany Chairwoman of the Group Employees' Council of Sartorius AG in Göttingen, Germany Resident of Göttingen, Germany
Uwe Bretthauer Dipl.-Ingenieur (Graduate Engineer) Chairman of the Employees' Council of Sartorius Lab Instruments GmbH & Co. KG in Göttingen, Germany Resident of Göttingen, Germany
Michael Dohrmann Feinmechaniker (Precision Engineer) Technical Employee Sartorius Stedim Biotech GmbH in Göttingen, Germany Resident of Reinhausen, Germany
Dr. Daniela Favoccia Attorney and Partner of the Hengeler Mueller partnership of lawyers in Frankfurt a.M., Germany Resident of Frankfurt a.M., Germany
Petra Kirchhoff Dipl.-Volkswirtin (Graduate Political Economist) Head of Corporate Communications and Investor Relations Sartorius Corporate Administration GmbH in Göttingen, Germany Resident of Göttingen, Germany
Executive Board and Supervisory Board

Consolidated Financial Statements and Notes Executive Board and Supervisory Board 169
Karoline Kleinschmidt Dipl.-Sozialwirtin (Graduate Social Economist) Secretary of the German Metalworkers’ Union (IG Metall) of the district management of Lower Saxony and Saxony-Anhalt in Hanover, Germany Resident of Hanover, Germany
Dr. Guido Oelkers President and CEO of Swedish Orphan Biovitrum AB (publ) in Stockholm, Sweden Resident of Wollerau, Switzerland
Ilke Hildegard Panzer Chief Executive Officer of Assurance Laboratories LLC in Milwaukee, Wisconsin, USA Resident of Fredonia, Wisconsin, USA
Prof. Dr. Thomas Scheper Dipl.-Chemiker (Graduate Chemical Engineer) University professor and head of the Institute of Technical Chemistry, Gottfried Wilhelm Leibnitz University in Hanover, Germany Resident of Hanover, Germany
Prof. Dr. Klaus Rüdiger Trützschler Dipl.-Wirtschaftsmathematiker (Graduate Business Mathematician) and Dipl.-Mathematiker (Graduate Mathematician) Resident of Essen, Germany
Committees of the Supervisory Board
Executive Task Committee Dr. Lothar Kappich (Chairman) Manfred Zaffke Uwe Bretthauer Prof. Dr. Klaus Rüdiger Trützschler
Audit Committee Prof. Dr. Klaus Rüdiger Trützschler (Chairman) Manfred Zaffke Uwe Bretthauer Dr. Lothar Kappich
Conciliation Committee Dr. Lothar Kappich (Chairman) Manfred Zaffke Uwe Bretthauer Prof. Dr. Klaus Rüdiger Trützschler
Nomination Committee Dr. Lothar Kappich Dr. Daniela Favoccia Prof. Dr. Klaus Rüdiger Trützschler
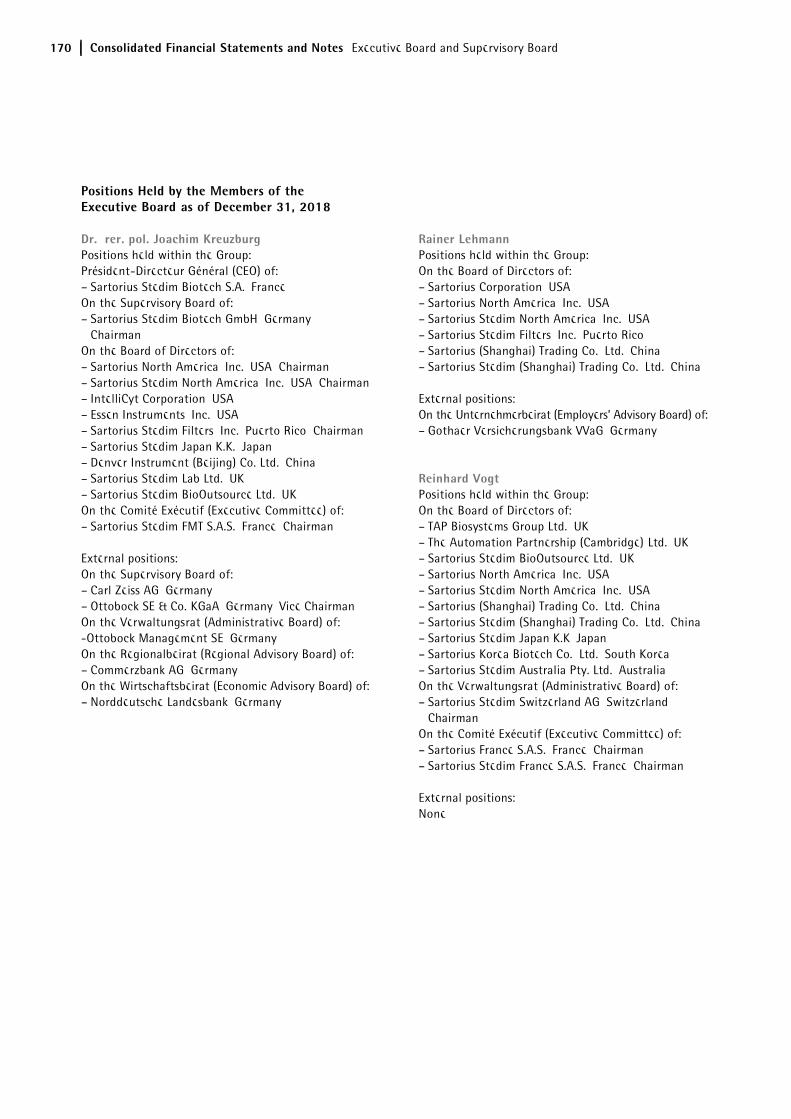
170 Consolidated Financial Statements and Notes Executive Board and Supervisory Board
Positions Held by the Members of the Executive Board as of December 31, 2018
Dr. rer. pol. Joachim Kreuzburg Positions held within the Group: Président-Directeur Général (CEO) of: – Sartorius Stedim Biotech S.A., France On the Supervisory Board of: – Sartorius Stedim Biotech GmbH, Germany,
Chairman On the Board of Directors of: – Sartorius North America, Inc., USA, Chairman – Sartorius Stedim North America, Inc., USA, Chairman – IntelliCyt Corporation, USA – Essen Instruments, Inc., USA – Sartorius Stedim Filters, Inc., Puerto Rico, Chairman – Sartorius Stedim Japan K.K., Japan – Denver Instrument (Beijing) Co. Ltd., China – Sartorius Stedim Lab Ltd., UK – Sartorius Stedim BioOutsource Ltd., UK On the Comité Exécutif (Executive Committee) of: – Sartorius Stedim FMT S.A.S., France, Chairman
External positions: On the Supervisory Board of: – Carl Zeiss AG, Germany – Ottobock SE & Co. KGaA, Germany, Vice Chairman On the Verwaltungsrat (Administrative Board) of: -Ottobock Management SE, Germany On the Regionalbeirat (Regional Advisory Board) of: – Commerzbank AG, Germany On the Wirtschaftsbeirat (Economic Advisory Board) of: – Norddeutsche Landesbank, Germany
Rainer Lehmann Positions held within the Group: On the Board of Directors of: – Sartorius Corporation, USA – Sartorius North America, Inc., USA – Sartorius Stedim North America, Inc., USA – Sartorius Stedim Filters, Inc., Puerto Rico – Sartorius (Shanghai) Trading Co., Ltd., China – Sartorius Stedim (Shanghai) Trading Co., Ltd., China External positions: On the Unternehmerbeirat (Employers’ Advisory Board) of: – Gothaer Versicherungsbank VVaG, Germany
Reinhard Vogt Positions held within the Group: On the Board of Directors of: – TAP Biosystems Group Ltd., UK – The Automation Partnership (Cambridge) Ltd., UK – Sartorius Stedim BioOutsource Ltd., UK – Sartorius North America, Inc., USA – Sartorius Stedim North America, Inc., USA – Sartorius (Shanghai) Trading Co., Ltd., China – Sartorius Stedim (Shanghai) Trading Co., Ltd., China – Sartorius Stedim Japan K.K, Japan – Sartorius Korea Biotech Co., Ltd., South Korea – Sartorius Stedim Australia Pty. Ltd., Australia On the Verwaltungsrat (Administrative Board) of: – Sartorius Stedim Switzerland AG, Switzerland,
Chairman On the Comité Exécutif (Executive Committee) of: – Sartorius France S.A.S., France, Chairman – Sartorius Stedim France S.A.S., France, Chairman
External positions: None

Consolidated Financial Statements and Notes Executive Board and Supervisory Board 171
Positions Held by the Members of the Supervisory Board as of December 31, 2018
Dr. Lothar Kappich Positions held within the Group: On the Conseil d’Administration (Board of Directors) of: – Sartorius Stedim Biotech S.A., France External positions: None
Manfred Zaffke Positions held within the Group: None External Positions: On the Supervisory Board of: – GMH GUSS GmbH, Germany,
Vice Chairman – Demag Cranes & Components GmbH, Germany
Annette Becker None
Uwe Bretthauer None
Michael Dohrmann None Dr. Daniela Favoccia None
Petra Kirchhoff Positions held within the Group: None External positions: On the Supervisory Board of: – AWO Göttingen gGmbH, Germany On the Foundation’s Board of Directors of: – SüdniedersachsenStiftung, Germany On the Stock Exchange Council (Börsenrat) of: – The Hanover Stock Exchange of Lower Saxony
(Niedersächsiche Börse zu Hannover), Germany
Karoline Kleinschmidt None Dr. Guido Oelkers None
Ilke Hildegard Panzer None
Prof. Dr. Thomas Scheper None
Prof. Dr. Klaus Rüdiger Trützschler Positions held within the Group: None External positions: On the Supervisory Board of: – Wuppermann AG, Germany, Chairman – Zwiesel Kristallglas AG, Germany, Chairman On the Advisory Board of: - Odenwald Faserplatten GmbH, Germany

172 Consolidated Financial Statements and Notes Executive Board and Supervisory Board

Supplementary Information

174 Supplementary Information Glossary
Industrial | Product-specific Terms
Bags, single-use Plastic disposable bag used in bioreactors and for storing liquids,
such as culture media, intermediate products and
biopharmaceuticals
Bioreactor In English-speaking countries, a bioreactor is a vessel used for
cultivating animal or human cells in a culture medium. In non-
English-speaking countries, the term bioreactor is also used
synonymously with the term fermenter to denote a system
used to multiply microorganisms. In either case, the vessel is
used to obtain cells, parts of these or one of their metabolites.
Disposable Used synonymously with “single-use"
Downstream processing Collective term for the various steps that follow fermentation
or cell cultivation (upstream processing) in the production of
biopharmaceuticals; for example, separation, purification and
concentration
FDA - Food and Drug Administration U.S. regulatory agency responsible for ensuring the safety and
efficacy of human and veterinary pharmaceuticals, biological
products, medical devices and foods
Fermentation Technical process used to produce or transform intra- or
extra-cellular substances with the help of microorganisms
Fluid management technologies Technologies and systems for the transportation and storage
of biological liquids
Membrane chromatography Selective separation of mixtures of substances by adsorption
to specifically modified membranes (membrane adsorbers) in
a flowing system
Membrane (filter) Thin film or foil made of polymers; because of the porous
structure, this film is suitable for filtration applications.
Monoclonal antibodies Synthetic antibodies used, in particular, in the treatment of
cancer, HIV and autoimmune diseases
PAT - Process Analytical Technology A strategy for the design, analysis and control of manufacturing
processes according to which quality characteristics of
intermediate or finished products are defined and then analyzed
and monitored using the critical process parameters identified
Purification An important step in downstream processing
Scale-up Transfer of scale or increase in size. Used to denote the
progression of a process that increases in a range from lab scale
to pilot scale to process scale, while retaining the same
technology, materials of construction and geometries
throughout
Single-use | Reusable product Disposable product, i.e., for one-time usage. A reusable product
is designed for repeated use.
Upstream processing In the manufacture of biopharmaceuticals, designates the
various steps that take place for seeding and propagating cells
that produce an active pharmaceutical ingredient
Validation Documented verification that systems, devices and processes
reproducibly deliver the desired result
Glossary

Supplementary Information Glossary 175
Business | Economic Terms
Amortization Amortization relates exclusively to potential reductions in the
value of goodwill and the allocation of the purchase price to
intangible assets acquired as carried out according to IFRS 3
Cash flow The amount of cash earned after paying all expenses and taxes;
i.e., the cash balance of inflows and outflows of funds
Compliance Observance of applicable laws, codes and other relevant rules
and regulations
Constant currencies; currency-adjusted In the presentation of figures, identical exchange rates are used
for each of the comparative periods.
DAX®, TecDAX® German stock indexes of the transaction service provider and
marketplace organizer Deutsche Börse AG
D&O insurance Directors’ and Officers’ liability insurance that covers
Supervisory and Executive Board members and managerial
employees
DVFA | SG The Methods Commission of the Society of Investment
Professionals in Germany (DFVA e.V.) and the Schmalenbach-
Gesellschaft (SG)
EBITDA Earnings before interest, taxes, depreciation and amortization;
in this context, amortization refers exclusively to the purchase
price allocation (PPA) to intangible assets acquired according to
IFRS 3.
EBITDA margin The ratio of EBITDA (earnings before interest, taxes, depreciation
and amortization) to sales
Equity ratio The ratio of equity to the balance sheet total
ERP Stands for “Enterprise Resource Planning”;
IT-based system for resource planning
Extraordinary items Exceptional or one-time expenses and income, such as
acquisition costs, restructuring costs and other non-operating
expenses
Fixed assets The sum of intangible assets, property, plant and equipment and
financial assets
Goodwill The difference between the price paid for a company or business
and its net assets; a form of intangible asset
Holding company A parent company that exists for the purpose of owning a
controlling interest or shares in several legally independent
subsidiaries that are subordinate within the organizational
hierarchy; this holding company conducts its business
exclusively through these subsidiaries.
Market capitalization The total number of shares outstanding of both classes issued by
the company, multiplied by the corresponding share price
Normalized financial result Financial result excluding fair value adjustments of hedging
instruments, as well as excluding non-periodic expenses and
income.
Normalized income tax Underlying income tax, based on underlying profit before tax
and on non-cash amortization.
Prime Standard Market segment of the Frankfurt Stock Exchange with high,
internationally accepted transparency requirements to meet the
needs of companies seeking to attract international investors.
Supply chain management Setup and coordination of integrated flows of materials,
information and finances (supply chains) over the entire value-
added process
Treasury Short- and medium-term liquidity management
Underlying Adjusted to eliminate extraordinary items (see definition
extraordinary item)

176 Supplementary Information Glossary
Other Terms
CRM Abbreviation for “Customer Relationship Management”;
practices, strategies and technologies that companies use to
manage and analyze customer interactions and data to improve
customer retention and drive sales growth
EHS Abbreviation for "Environment, Health and Safety”
EMEA The region comprising Europe, the Middle East and Africa; one
of the three reporting regions in the geographical allocation of
the Sartorius Group besides the Americas and Asia / Pacific
ERP Stands for "Enterprise Resource Planning";
IT-based resource planning system
ESG Abbreviation for “Environment, Social and Governance”; refers
to the three major factors of sustainable corporate management.
GEC Stands for the "Group Executive Committee"; the central
management body of the Sartorius Group. It currently is
comprised of six members: the three Executive Board members
of Sartorius AG and further executives with global responsibility
GHG Abbreviation for “Greenhouse Gas Protocol,” the international
standard for measuring and managing greenhouse gas emissions,
including reporting. The WHO stands for the “World Heath
Organization,” the coordination authority of the United Nations
for international public health
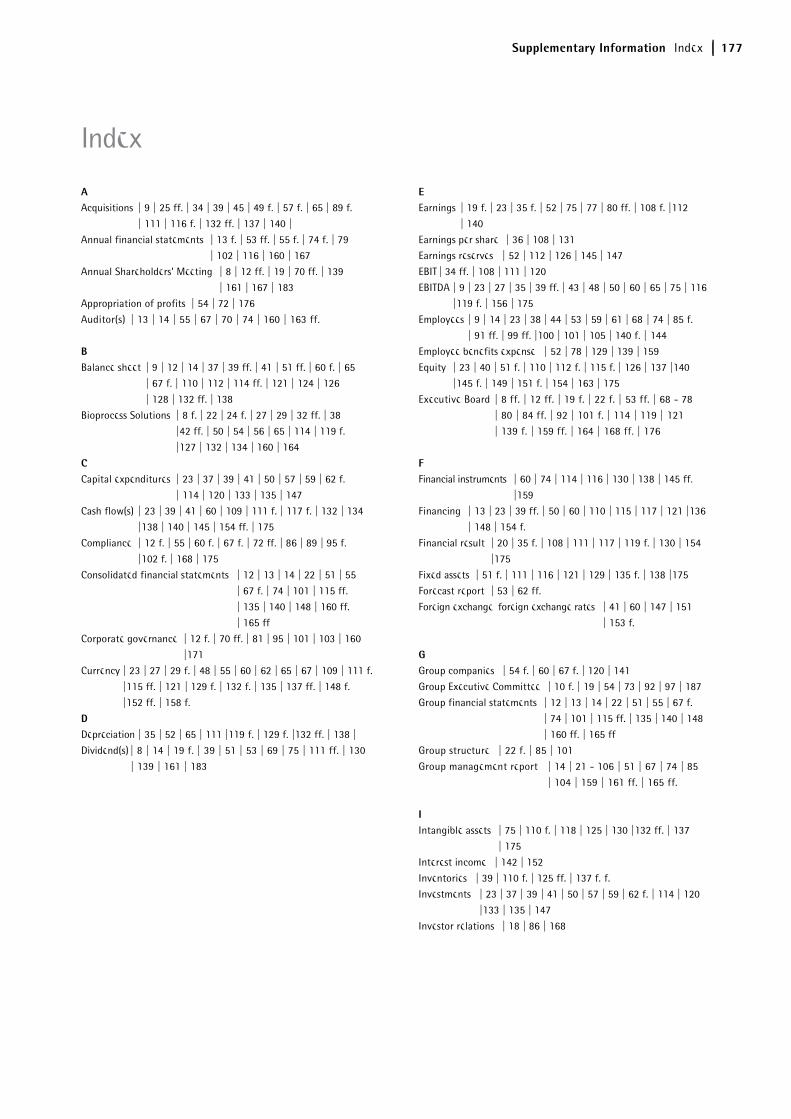
Supplementary Information Index 177
A Acquisitions | 9 | 25 ff. | 34 | 39 | 45 | 49 f. | 57 f. | 65 | 89 f.
| 111 | 116 f. | 132 ff. | 137 | 140 |
Annual financial statements | 13 f. | 53 ff. | 55 f. | 74 f. | 79
| 102 | 116 | 160 | 167
Annual Shareholders’ Meeting | 8 | 12 ff. | 19 | 70 ff. | 139
| 161 | 167 | 183
Appropriation of profits | 54 | 72 | 176
Auditor(s) | 13 | 14 | 55 | 67 | 70 | 74 | 160 | 163 ff.
B
Balance sheet | 9 | 12 | 14 | 37 | 39 ff. | 41 | 51 ff. | 60 f. | 65
| 67 f. | 110 | 112 | 114 ff. | 121 | 124 | 126
| 128 | 132 ff. | 138
Bioprocess Solutions | 8 f. | 22 | 24 f. | 27 | 29 | 32 ff. | 38
|42 ff. | 50 | 54 | 56 | 65 | 114 | 119 f.
|127 | 132 | 134 | 160 | 164
C
Capital expenditures | 23 | 37 | 39 | 41 | 50 | 57 | 59 | 62 f.
| 114 | 120 | 133 | 135 | 147
Cash flow(s) | 23 | 39 | 41 | 60 | 109 | 111 f. | 117 f. | 132 | 134
|138 | 140 | 145 | 154 ff. | 175
Compliance | 12 f. | 55 | 60 f. | 67 f. | 72 ff. | 86 | 89 | 95 f.
|102 f. | 168 | 175
Consolidated financial statements | 12 | 13 | 14 | 22 | 51 | 55
| 67 f. | 74 | 101 | 115 ff.
| 135 | 140 | 148 | 160 ff.
| 165 ff
Corporate governance | 12 f. | 70 ff. | 81 | 95 | 101 | 103 | 160
|171
Currency | 23 | 27 | 29 f. | 48 | 55 | 60 | 62 | 65 | 67 | 109 | 111 f.
|115 ff. | 121 | 129 f. | 132 f. | 135 | 137 ff. | 148 f.
|152 ff. | 158 f.
D
Depreciation | 35 | 52 | 65 | 111 |119 f. | 129 f. |132 ff. | 138 |
Dividend(s) | 8 | 14 | 19 f. | 39 | 51 | 53 | 69 | 75 | 111 ff. | 130
| 139 | 161 | 183
E
Earnings | 19 f. | 23 | 35 f. | 52 | 75 | 77 | 80 ff. | 108 f. |112
| 140
Earnings per share | 36 | 108 | 131
Earnings reserves | 52 | 112 | 126 | 145 | 147
EBIT | 34 ff. | 108 | 111 | 120
EBITDA | 9 | 23 | 27 | 35 | 39 ff. | 43 | 48 | 50 | 60 | 65 | 75 | 116
|119 f. | 156 | 175
Employees | 9 | 14 | 23 | 38 | 44 | 53 | 59 | 61 | 68 | 74 | 85 f.
| 91 ff. | 99 ff. |100 | 101 | 105 | 140 f. | 144
Employee benefits expense | 52 | 78 | 129 | 139 | 159
Equity | 23 | 40 | 51 f. | 110 | 112 f. | 115 f. | 126 | 137 |140
|145 f. | 149 | 151 f. | 154 | 163 | 175
Executive Board | 8 ff. | 12 ff. | 19 f. | 22 f. | 53 ff. | 68 - 78
| 80 | 84 ff. | 92 | 101 f. | 114 | 119 | 121
| 139 f. | 159 ff. | 164 | 168 ff. | 176
F
Financial instruments | 60 | 74 | 114 | 116 | 130 | 138 | 145 ff.
|159
Financing | 13 | 23 | 39 ff. | 50 | 60 | 110 | 115 | 117 | 121 |136
| 148 | 154 f.
Financial result | 20 | 35 f. | 108 | 111 | 117 | 119 f. | 130 | 154
|175
Fixed assets | 51 f. | 111 | 116 | 121 | 129 | 135 f. | 138 |175
Forecast report | 53 | 62 ff.
Foreign exchange, foreign exchange rates | 41 | 60 | 147 | 151
| 153 f.
G Group companies | 54 f. | 60 | 67 f. | 120 | 141
Group Executive Committee | 10 f. | 19 | 54 | 73 | 92 | 97 | 187
Group financial statements | 12 | 13 | 14 | 22 | 51 | 55 | 67 f.
| 74 | 101 | 115 ff. | 135 | 140 | 148
| 160 ff. | 165 ff
Group structure | 22 f. | 85 | 101
Group management report | 14 | 21 - 106 | 51 | 67 | 74 | 85
| 104 | 159 | 161 ff. | 165 ff.
I Intangible assets | 75 | 110 f. | 118 | 125 | 130 |132 ff. | 137
| 175
Interest income | 142 | 152
Inventories | 39 | 110 f. | 125 ff. | 137 f. f.
Investments | 23 | 37 | 39 | 41 | 50 | 57 | 59 | 62 f. | 114 | 120
|133 | 135 | 147
Investor relations | 18 | 86 | 168
Index

178 Supplementary Information Index
L
Lab Products & Services | 8 | 14 | 24 | 26 | 29 | 32 ff. | 38 | 47 ff.
|54 | 65 | 119 f. | 132 | 160 | 164
Liabilities | 35 | 39 ff. | 52 | 60 | 110 f. | 116 ff. | 121 | 125 ff.
| 130 | 137 | 144 | 146 | 1148 ff. | 154 ff.
M
Marketing | 22 | 27 | 34 | 38 | 44 | 54 | 86 | 91 | 129 | 168
N
Net debt | 23 | 39 ff. | 50 | 60 | 156
Net profit | 19 f. | 23 | 35 f. | 52 | 75 | 77 | 80 ff. | 108 f.
|112 | 140.
Note loans | 39 ff. | 69 | 148 | 151 | 156
O
Ordinary shares | 8 | 14 | 16 | 18 ff. | 36 | 53 | 69 | 74 | 108 | 113
| 131 | 138 f. | 159 | 161
P
Pension commitments | 80 | 84 | 118 | 140 f. | 161
Phantom stock, phantom stock units | 75 ff. | 81 f. | 159
Preference share(s) | 8 | 14 | 16 | 18 ff. | 36 | 53 | 69 | 74 | 108
| 113 | 131 | 138 f. | 159 | 161
Procurement | 54 | 56 | 60 f. | 147
Production | 8 | 12 | 22 | 24 f. | 27 | 30 ff. | 37 ff. | 41 | 44 | 46
|49 f. | 55 ff. | 60 f. | 63 f. | 85 f. | 88 - 93 | 97 ff.
|129 | 147 f. | 152 | 174
Products | 8 f. | 22 | 24 ff. | 30 f. | 37 | 44 ff. | 49 | 54 | 57 f. | 60
|64 f. | 71 | 86 | 89 | 91 | 97 f. | 100 ff. | 119| 127 f.
| 132 | 134 | 174
Profit | 12 f. | 18 | 23 | 34 ff. | 37 | 40 | 43 |48 | 50 ff. | 55 f.
| 59 ff. | 65 | 68 | 71 | 76 | 78 | 86 | 89 | 91 | 105 | 108 f.
| 111 f. | 116 ff. | 126 | 130 f. | 137 ff. | 147 | 149 | 152
| 154 f. | 159 | 163 f. | 175
Property, plant and equipment | 39 | 52 | 110 f. | 117 | 119 f.
| 125 | 135 ff.
Provisions | 52 | 110 f. | 118 | 137 | 140 | 143 f.
R
Ratio of Net Debt to Underlying EBITDA | 40
Regions | 8 | 12 | 33f. | 43 | 48 ff. | 62 | 65 | 91 | 96 | 120 | 127
|157 | 176
Remuneration of the Executive Board | 12
Research and Development | 28 | 34 | 37 f. | 53 | 89 f. | 129
Reserves | 52 | 110 f. | 118 | 137 | 140 | 143 f.
Restructuring | 119 | 143 | 175
Results | 12 f. | 18 | 23 | 34 ff. | 37 | 40 | 43 | 48 | 50 ff. | 55 f.
| 59 ff. | 65 | 68 | 71 | 76 | 78 | 86 | 89 | 91 | 105 | 108 f.
| 111 f. | 116 ff. | 126 | 130 f. | 137 ff. | 147 | 149 | 152
| 154 f. | 159 | 163 f. | 175
Retained profit | 52 | 112 | 126 | 145 | 147
Risk management system | 53 ff. | 68
Risk and opportunities report | 53 - 61 | 73 | 101 f.
S
Sales (and distribution) | 8 | 22 | 25 | 27 | 34 f. | 38 | 44 | 49 | 56 f.
| 65 | 86 | 91 | 97 | 108 | 119 | 125 | 127
| 129 | 135 | 138 | 168
Sales revenue | 8 f. | 12 | 16 | 23 | 25 | 27 | 29 | 30 f. | 33 ff.
| 37 | 39 | 43 | 48 | 50 ff. | 58 | 60 | 63 ff. | 75
| 91 | 97 f. | 108 |114 | 118 | 120 | 124 | 126 ff.
| 140 | 148 f. | 152 | 154 | 164 | 175
Sartorius Stedim Biotech | 22 | 35 | 51 | 83 ff. | 90 | 122 | 134
|139 | 168 | 170 f.
Segment reports | 119 f.
Shareholder structure | 19
Share(s) | 9 | 14 | 16 ff. | 22 f. | 35 f. | 53 | 65 | 69 f. | 74 ff.
| 78 f. | 104 f. | 108 | 112 ff. | 121 | 131 | 138 f.| 159
| 161 ff. | 167 | 175
Statement of profit or loss | 35 | 52 | 108 f. | 116 f. | 126 ff.
| 134 f. | 136 | 138 | 140 f. | 153
| 158 | 163
Stedim transaction | 134
Supervisory Board | 8 | 12 ff. | 19 f. | 22 | 53 ff. | 67 ff. | 83 f.
| 104 f. | 114 | 159 ff. | 164 f. | 167 ff.
Supply chain management | 46 | 49 | 56 | 175
Sustainability | 61 | 85 ff. | 101 | 105
T
Taxes | 35 f. | 52 | 95 | 108 ff. | 118 ff. | 125 | 130 | 132 | 137 ff.
| 144 | 154 f. | 175
Treasury | 41 | 152 | 157 | 175
W
Working capital | 23 | 39 ff. | 57 | 148

Supplementary Information Index 179

190 Supplementary Information A Local Presence Worldwide
SalesProduction | Production and Sales
The Americas
Oakville, ON, CanadaBohemia, NY, USABoston, MA, USAAnn Arbor, MI, USAArvada, CO, USANew Oxford, PA, USAAlbuquerque, NM, USAMexico City, MexicoYauco, Puerto RicoSão Paulo, BrazilBuenos Aires, ArgentinaLima, Peru
A Local Presence Worldwide

191Supplementary Information A Local Presence Worldwide
Europe | Africa
Dublin, IrelandRoyston, UKStonehouse, UKEpsom, UKGlasgow, UKBrussels, BelgiumDourdan, FranceAubagne, FranceLourdes, France Florence, ItalyMilan, ItalyMadrid, SpainBarcelona, Spain
Kajaani, FinlandHelsinki, FinlandMalmo, SwedenUmeå, SwedenSt. Petersburg, RussiaGoettingen, GermanyGuxhagen, GermanyLaupheim, GermanyPoznan, PolandBudapest, HungaryVienna, AustriaTagelswangen, SwitzerlandMohamdia, TunisiaBeit Haemek, Israel
Asia | Pacific
Beijing, ChinaShanghai, ChinaHong Kong, ChinaSeoul, South KoreaTokyo, JapanHanoi, VietnamBangkok, ThailandBangalore, IndiaKuala Lumpur, MalaysiaSingapore, SingaporeMelbourne, Australia

182 Supplementary Information A Local Presence Worlwide

Supplementary Information Financial Schedule 183
Contacts
Petra Kirchhoff Head of Corporate Communications & IR
Phone: 0551.308.1686 [email protected]
Ben Orzelek Head of Investor Relations Phone: 0551.308.1668 [email protected]
Katharina Tillmanns-Pelzer Manager Corporate Responsibility Phone: 0551.308.2893 [email protected]
This is a translation of the original German-language annual report.
About This Publication
Published by Sartorius AG Corporate Communications 37070 Goettingen, Germany
Editorial Deadline February 18, 2019
Published on February 19, 2019
Financial Reporting System firesys firesys GmbH Frankfurt | Main, Germany
Photography Peter Ginter
Lohmar, Germany
Frank Stefan Kimmel Goettingen
Financial Schedule
Annual Shareholders’ Meeting in Goettingen, Germany March 28, 2019
Payment of dividends1) April 2, 2019
Publication of first-quarter figures for 2019 April 18, 2019
Publication of first-half figures for 2019 July 19, 2019
Publication of nine-month figures for 2019 October 22, 2019
German Equity Forum in Frankfurt | Main, Germany November 25-27, 2019
Publication of preliminary figures for fiscal 2019 January 2020
Annual press conference in Goettingen, Germany February 2020
Annual Shareholders’ Meeting in Goettingen, Germany March 26, 2020
Publication of first-quarter figures for 2020 April 2020
1) Subject to approval by the Annual Shareholders‘ Meeting

Sartorius AG Otto-Brenner-Strasse 2037079 Goettingen, Germany
Phone: +49.551.308.0Fax: +49.551.308.3289
©Sar
tori
us A
G |
Pri
nted
in G
erm
any
turning science into solutions


![Action-Items - XXXII [Non-Political Levity and Iggles]](https://img.pdfslide.us/doc/110x75/577cd3881a28ab9e78972c65/action-items-xxxii-non-political-levity-and-iggles.jpg)