Embed Size (px)
Citation preview
UBNRDL-TH- 617A401 8 7 5=-ON FLASHTUI. AS SOURCES OF THEM4L, RDIATION
Kehneth A. Lizxcoln
~S TIS# I-
U., S. NAVAL RADIOLOGICAL
-DEFENSE LABOR ATORY
S AN F R A, N C IS C 0 2 4 C A L i F OR.N I A
1,2NDO. P7460
~¶54~O
RADIATION EFFECTS BRANCHR. S.' Alger, Head
NUCLEONICS DIVISIONW. E. Kreger, Head
ADMINISTRATIVE IMFOIMATION
This report covers a facet of the work authorizedduring FY 1961 and: 1962 by the Defense Atomic Sup'-port Agency (NWER Program. A8a, Subtask 12. 006•.,Details of this work are found in the. U, S. Naval Ra-diological Defense Labocatory FY 62 Technical Pro-gram as Program A6, Problem 4, entitled "Ignitionand Fire Propagation by Thermal Radiation," the ob-jective of which is to provide a scientific basis forcontrolling the, incendiary effects of nuclear detona-tions by investigating the thermochemistry of ignitionand, combustion for cellulosic solids exposed to intensethermal radiation. Funds for this work during FT 62were furnished by the. Defense Atomic Support Agency,on MIPR 501-62.
ACKNOLEDGHM
Appreciation is extended to Mr. C. P. Butler forhis contributions to this work among which are included'the construction of the calorimeter elements with at-tendant thermocouples and platinum-black coatings.
Further acknowledgment is due Mr. J.R. Nicholswhose. punctilious design and construction of most. ofthe experimental equipment has resulted in manyhours of trouble-free operation.
........... ............... ................................. .......................
Eu9en* . Cooper E.B. Roth. CA.PrT USNSciewntific Direc'tokr Command'ing Office€r dnd Director
ABSTRACT
Thermal radiative properties of xenon flashtifoes have been
studied by measuring radiant energies per flash and peak irradiances
incident on small objects located at the center of selected helical
flashtubes. Methods are described for determining these properties
by employing black-body calorimeters in conjunction with oscilloscopic
presentation of intensity vs. time. Thermal pulses were found to be
quite reproducible and are of the order of 1.0 to 1.7 cal/cm2 per
thousand joules of electrical input energy depending on the. type of-2 -1
flashtube. Peak irradiances of over 7,000 cal-cm sec were
observed, and the influence of varying the capacitance and voltage was
also determined.
In addition, some electrical characteristics of the flash-
tubes, such as current and resistance were included in the measure-
ments.
SUMMARY
The Problem
With the innovation of xenon flashtubes as sources of thermal
radiation for the continuing experimental studies on ignition of
cellulosic materials, it has been necessary to determine quantitatively
the total energies and peak irradiances to which the exposed samples
are subjected under varying combinationp of flashtube circuit capaci-
tance and voltage.
The Findings
Within the rated values of the flashtubes, the radiant energy
per flash was found to be directly proportional to the electrical
energy dissipated in the discharge regardless of the particular com-
binotion of capacitance and voltage. On the other hand, the peak
irradiance varies linearly with the voltage squared and only slightly
increases with capacitance. Also established has been the influence
of these parameters on pulse shape and (to a mote limited extent) on
the spectral distribution of the radiant energy.
ii•
CONTENTS
PAGE
ADMINISTRATIVE INFORMATION .................... .inside front cover
ACKNOWLEDGMENT ........... ................... .. inside front cover
ABSTRACT .................. ............................ i
SUMMARY ............... .......................... ... ii
LIST OF ILLUSTRATIONS ........ .................. ... iv
LIST OF TABLES . ............... ........................ vi
* INTRODUCTION .......... ....................... .i... 1BACKGROUND ............... ........................ 1PREVIOUS FLASHTUBE STUDIES .......... .............. 2OBJECTIVES . . . . . . . . . . . . . . . . .. .. . .
EQUIPMENT AND TECHNIQUES ............. .................. 3PYROLYZING UNIT .............. ................... 3CHOICE OF FLASHTUBES ............. ................ 4CIRCUITRY ................ ....................... 6EFFECT OF CIRCUIT INDUCTANCE .......... ............. 8MEASUREMENTS .................................. 8
Current and Voltage ........... ............... 8Thermal Irradiance ..... ................ . I.. 10,
Spectral Considerations ... ............ .... 11
DETERMINATION OF IRRADIANCE .................. 11
RESULTS AND DISCUSSION .......... .................... 14
ELECTRICAL CHARACTERISTICS .... ............. ... 14
RADIANT EMISSION ................... .6CORRELATION BETWEEN ELECTRICAL INPUT AND THERMAL OUTPUT 22
PEAK IRRADIANCES ..... .................... 26
TEMPERATURE ............ . ................ 28
ERRORS .... ... ... ..................... 29
REFERENCES ................................ 31
iii
LIST OF ILLUSTRATIONS
FIGURE PAGE
1 The pyrolyzing unit with an FT-625 positionedexternally for illustration ...................... 5
2 Assemblage of most of the experimental equipment
showing the 5 KV power supply sitting atop the
4100 f capacitor bank ........... ................. 73 Oscillogram showing the effect of a series 0.6 mh
choke on the light output from aFT-625 discharge
of 290 ptf at 4.0 KV ..... ........................... 9
4 Typical single-trace double-sweep oscillogram of aphotodetector signal vs. time (50 pisec/cm) ........ .. 13
5 Typical flashtube current pulse ..... ............ ... 15
6 The relationship between current and voltage
during a typical discharge of a FT-625.o ....... ... 15
7 A comparison showing the effect of voltage on therelative amplitudes of wave lengths in theultraviolet and infrared parts of the emissionfrom a FT-625 with a 290 1if capacitance ........... ... 18
8 Oscillograms showing the effect of voltagevariation on the radiant intensity at the UV andIR ends of the spectrum vertical units are notthe same for (a) and (b . ............ ...... 20
9 Simultaneous display of the light output at twowave lengths for a single discharge of a FT-403at 2.0 KV and 96 p gf ......... .................. ... 21
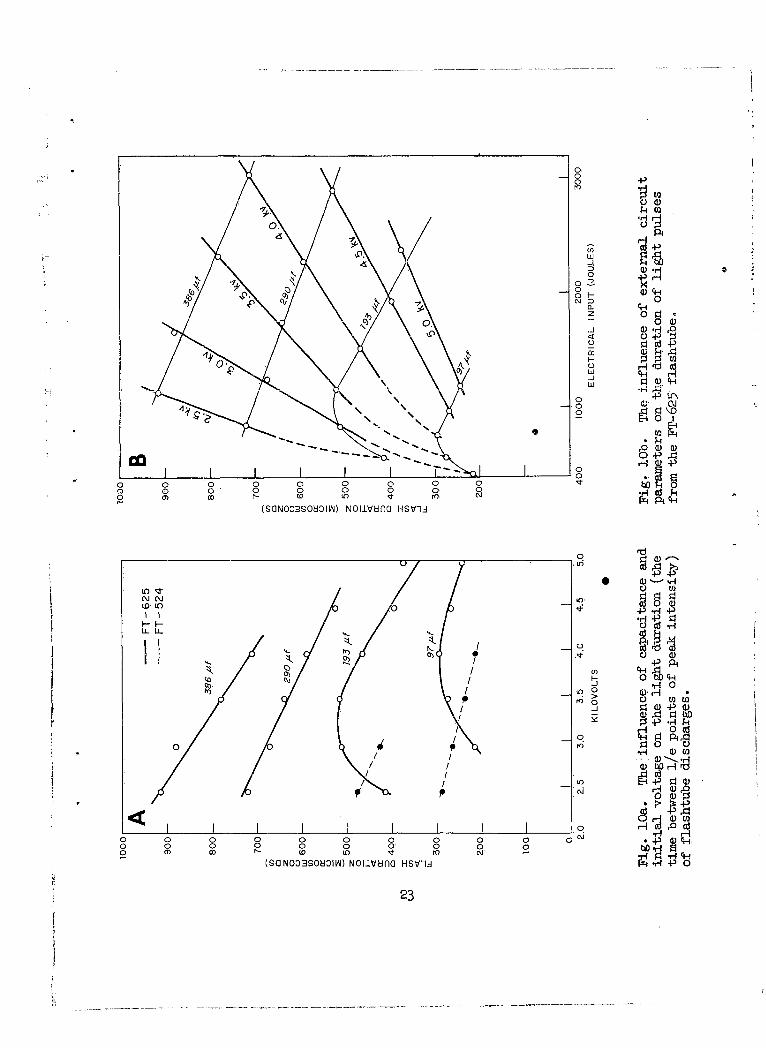
lO The influence of capacitance and initial voltage
on the light duration (the time between l/e points
of peak intensity) of flashtube discharges ........ .. 23
10b The influence of external circuit parameters on
the duration of light pulses from the FT-625flashtube ......... ....................... 23
iv
FIGURE PAGE
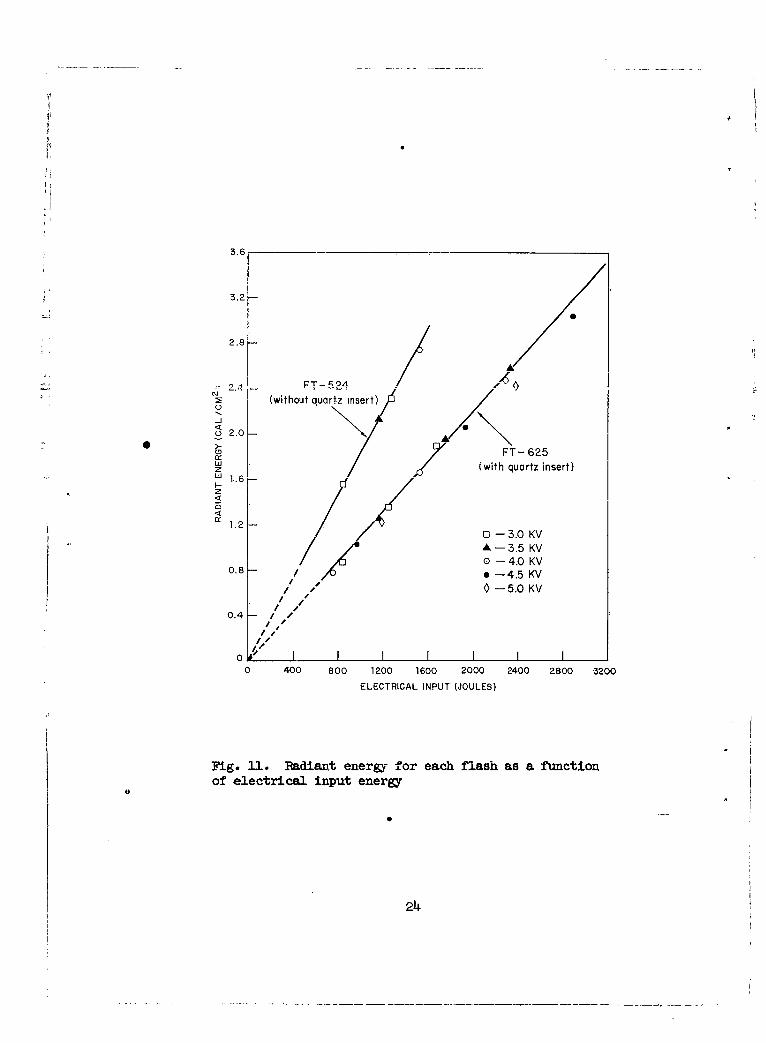
11 Radiant energy for each flash as a functionof electrical input energy ......... .............. 24
12 Influence of electrical parameters on thepeak irradiance from an FT-625 ..... ............ .. 27
v
LIST OF TABLES
TABLE PAGE
1 Per Cent of FT-625 Emission at Wave LengthsLonger than 1.Op .......... ..................... ... 19
2 Values of k Relating Flashtube Radiant Energyto Electrical Input Energy ...... ............... ... 26
vi
INTRODUCTION
BACKGROUND
Continuation of studies in this Laboratory on the flash pyrolysis
of cellulosic materials has led to the requirement for a thermal source
which will heat samples uniformly and rapidly (in less than a second)0
to high temperatures. Because the carbon-arc sources which have been
used extensively in the ignition program fall short of this require-
ment, other possible sources were considered. The feasibility of
dielectric heating of cellulose at microwave frequencies was first
studied, and the report indicates that this technique does have pos-
sibilities as a useful method for heating cellulosic materials. How-
ever, subsequent attention to dielectric heating, which requires com-
plex and expensive equipment, was held in abeyance in view of the out-
standing success reported by Nelson, Lundberg, and Kuebler2- at Bell
Telephone Laboratories who used the illumination from capacitor dis-
charges through flashtubes to instantaneously heat a variety of
materials.
Preliminary experimentation in this Laboratory to determine the
applicability of the flash method to ignition studies consisted of
placing thin strips of blackened cellulose within the helix of a high-
energy xenon flashtube so that both surfaces of the sample were irra-
diated, thus improving the uniformity of the temperature profile. It0
was found that a single discharge of a thousand joules will completely
decompose such a sample in a fraction of a millisecond. The reaction
is so violent that an explosion results which sounds like a gun shot.
This provided quick and dramatic justification for immediately com-
mencing the equipment construction and flashtube evaluation reported
herein.
Of course, one necessary condition for efficient use of such a
thermal source is that the absorptance of the material to be heated
must be reasonably high in the visible and near infrared, because most
of the radiant output from the xenon discharge is in that part of the
spectrum. Inasmuch as most cellulosic materials are white, extensive
earlier work in this Laboratory has shown that the inclusion of approx-
imately 2% carbon black within the bulk of cellulose sheets has ren-
dered them an absorptance close to 100% over this region of the spec-
trum.
PREVIOUS FLASHTUBE STUDIES
0
Over the past couple of decades, flashtubes, particularly those
containing xenon as the discharge gas, have become prominent as illu-
mination sources for photography. This work was pioneered by Edgerton
and a number of others 13- 0,33 who have published papers on the elec.-
trical characteristics and light output of flashtubes. Within the
last decade several investigators21-24 have applied various types of
flashtubes to photochemical studies to provide a source of radiation
in the near ultraviolet. Except for the work at Bell Laboratories and
a series of detonation experiments carried out by Berchtold and
Eggert,25,2 6 there is no record of flashtubes being employed as ther-
mal sources, and until recently, the literature was nearly devoid of
information pertaining to their thermal radiativeo properties. a
*Prior to the completion of this project, results of some thermal
measurements on flashtubes were published by Kuebler and Nelson. 2 7
2
OBJECTIVES
The investigations described here were directed toward providing
the following information about flashtubes pertinent to their utiliza-
tion in the ignition program of this Laboratory:
(1) Establish quantitative relationships between radiant energy
per flash and electrical input energy.0
(2) Determine peak irradiances available and the factors which
control them.
(3) Develop a method for obtaining the above values.
(4) Ascertain the depegdence of thermal pulse shapes on
electrical parameters.
(5) Determine some of the electrical characteristics.
"(6) Gain at least some limited information on spectral
distribution.
(7) Estimate temperatures attainable in samples.
0
EQUIPMENT and TECHNIQUES
PYROLYZING UNIT
A convenient arrangement for flash pyrolyzing a sample of solid
material and subsequently analyzing the pyrolysis products is achieved 0
by placing an open helical flashtube coaxially around a segment of
glass or quartz tubing which contains the sample. The tubing plus
sample can then be incorporated into a gas chromatography unit by
connecting it in series with the helium inlet stream. With this
arrangement, the volatile products are immediately swept into the
chromatography column when the flashtube is discharged. A similar
arrangement is used to pyrolyze solid samples in a mass spectrometer.
0
Here, the sample is contained in the closed-off end of a segment of
glass tubirg which opens into the ion source, and the gaseous products
have only a few inches (a small fraction of the mean-free-path) to
travel before encountering the ionizing electron beam.
With these two applications as objectives, theonecessary features
were incorporated into the design of the compact pyrolyzing unit shown
in Fig. 1. The quartz sleeve (not shown) centered inside of the flash-
tube helix plus the teflon plates on each end are removable. When in
place, they provide an annular space through which hot air can be
circulated outside of the sample-containing tube to prevent condensa-
tion of volatile products inside of it. This also protects the flash.-
tube in case of failure of the sample tube. Aluminum foil is wrapped 0
00externally around the flashtube to serve as a. reflector and as the
trigger electrode to initiate the discharge. The trigger transformer
which produces a sharp 15 KV pulse is located inside of the housingbetween the legs of the flashtube; the housing itself was constructed
of transite and can be mounted in any position. The unit is connected 0
to the capacitor bank and triggering circuit by coaxial cables to
minimize extraneous electrical radiation.0
CHOICE OF FLASHTUBES
Xenon flashtubes have been used exclusively in this work for the
following reasons: (1) the significantly greater luminous efficiency18of capacitor discharges through xenon, (2) the spectral distribution
of their illumination is similar to that of sunlight as well as nuclear
weapons, (3) numerous sizes and configurations are available commer-0
cially. The requirements of this project for an open helical configu-
ration and high energy capability sharply narrowed the choice, and
for this work most of the measurements were made on the General C
Electric FT-625. This is a factory modification of the FT-623, a
0
0@0
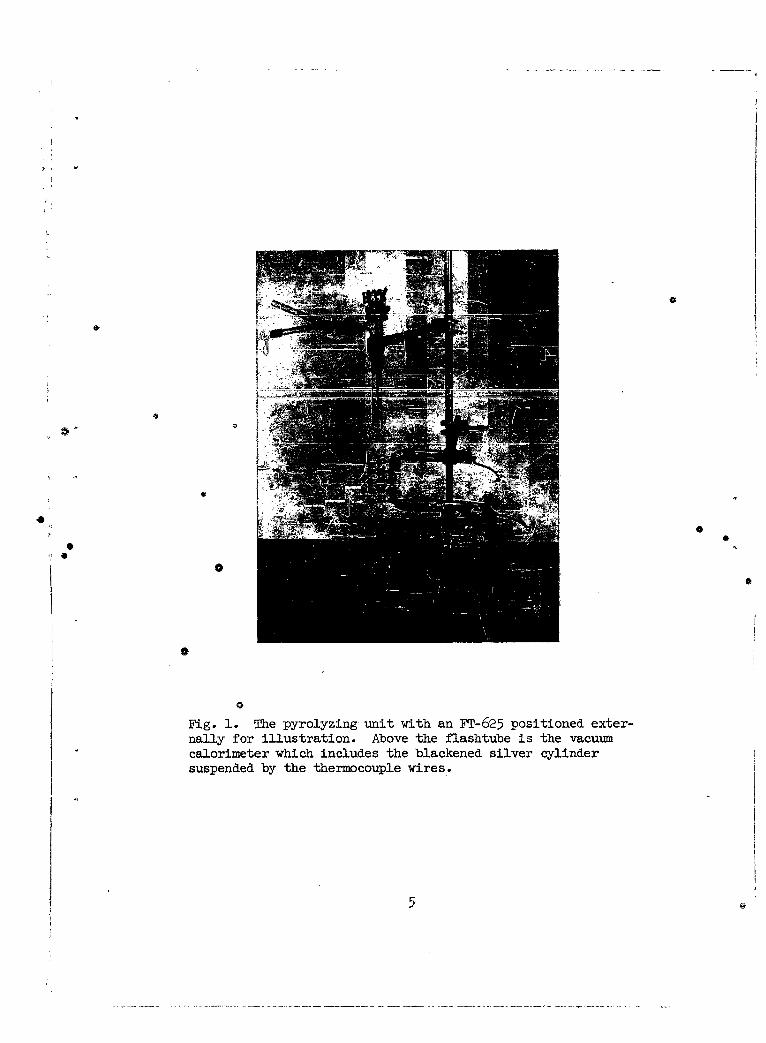
Fig. 1. The pyrolyzing unit with an FT-625 positioned exter-nally for illustration. Above the flashtube is the vacuumcalorimeter which includes the blackened silver cylindersuspended by the thermocouple wires.
five-turn 5.5-cm diameter helix wound from 12-mm o.d. quartz tubing.28
The two are electrically identical, and the only difference is one
of configuration wherein the FT-625 is not mounted on a base and the
legs are perpendicular to the axis of the helix rather than parallel.
The tube has very rugged electrodes and is rated at 24,000 watt-seconds
(joules) per flash maximum.
Some measurements were made on two smaller tubes having helical
configurations, the FT-403 (Pyrex) and the FT-524 (quartz, and same as
FT-503). The FT-524 is rated at 2,000 joules, but can be operated at
3,200 joules for nonrepetitive use. However, it was necessary to
remove these types from their bases to mount them in the pyrolyzing
unit.
CIRCUITRY
Energy is supplied to the flashtube from a portable capacitor
bank containing four 100 tf (approximate value) capacitors rated at
4 KV and mounted so that any number of them can be readily connected
in parallel. The capacitors are charged through a limiting resistor by
a small, high-voltage power supply which has a d.c. output continuously
variable from zero to 5 KV, and the voltages across the capacitors were
read from a calibrated voltmeter to within 20 volts (see Fig. 2). The
thyratron circuit which energizes the primary of the trigger transformer
is included in the power supply unit.
The actual value of each capacitor was checked by an a.c. capacitor
bridge and then calibrated by carefully measuring the RC time constant
of a discharge circuit comprised of precision resistors connected
across the capacitor.
6
iGFS C
0 000
00
00
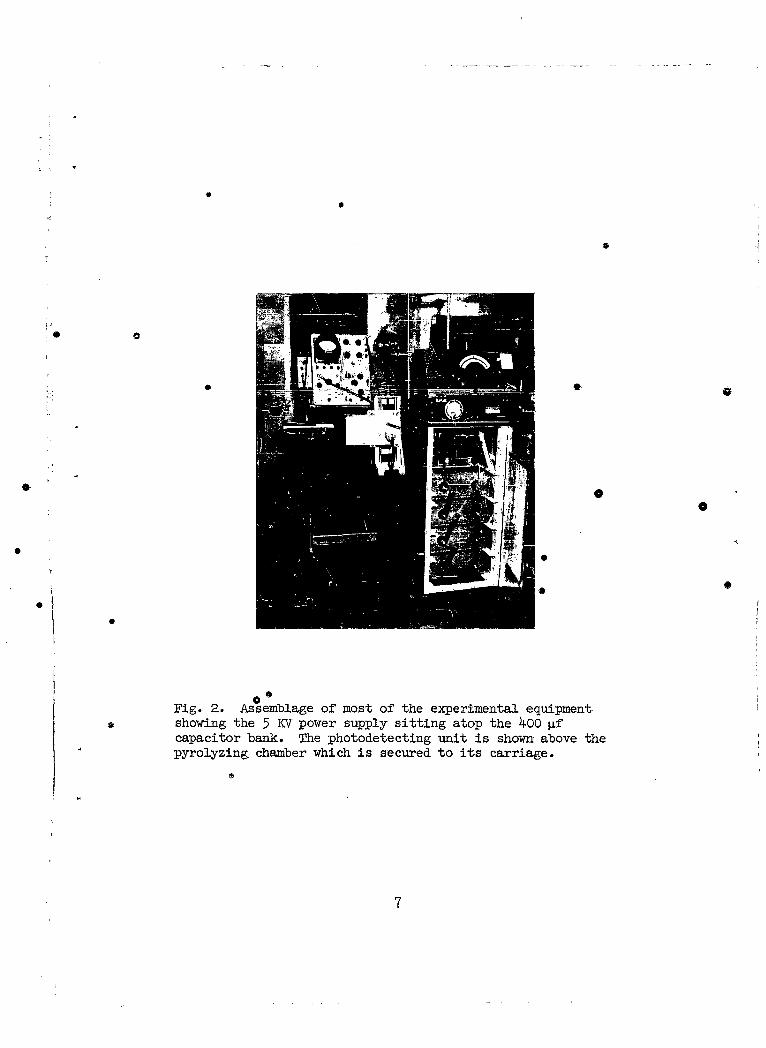
0*Fig. 2. Assemblage of most of the experimental equipmentshowing the 5 KV power supply sitting atop the 400 f
capacitor bank. The photodetecting unit is shown above thepyrolyzing chamber which is secured to its carriage.
7
EFFECT OF CIRCUIT INDUCTANCE
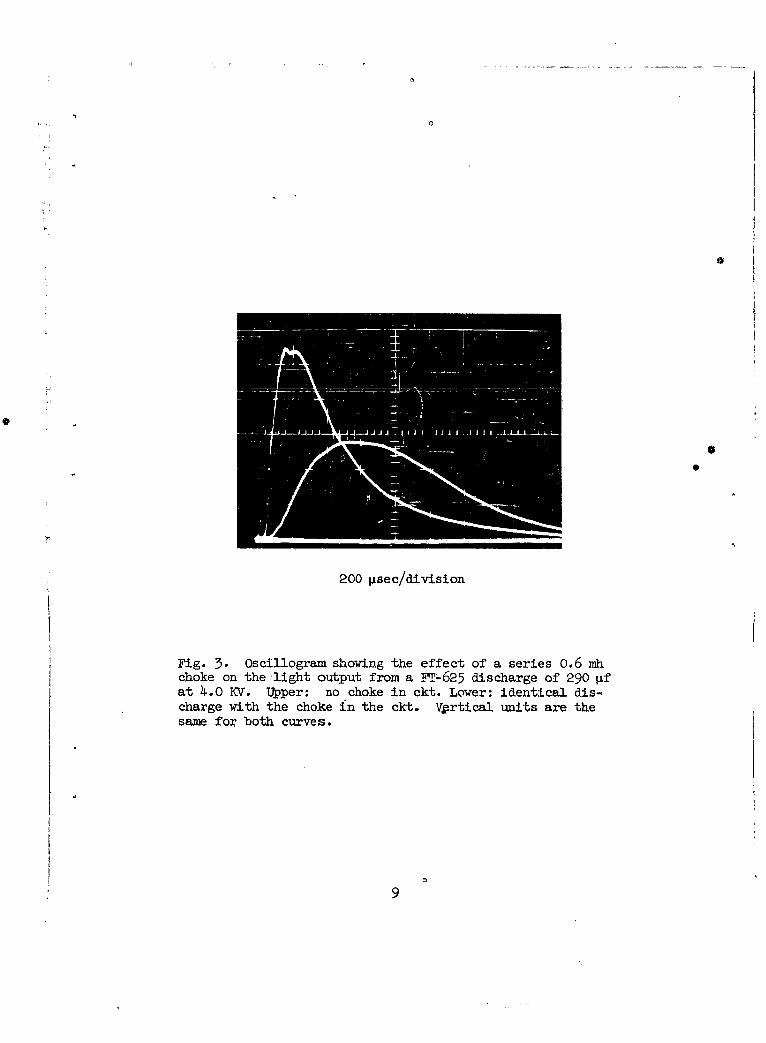
The influence on the shape of the light pulse due to a series
inductance added to the circuit is illustrated graphically in Fig. 3.
The two curves result from identicalparameters except for the inser-
tion of a 0.6 millihenry choke in series between the capacitor and the
flashtube; it is evident that the added inductance reduces the peak
amplitude but increases the pulse duration both electrically and op-0
tically. However, the total energy radiated by the flashtube is not
significantly reduced, if the resistance of the choke is negligible
compared to that of the flashtube. In the circuit associated with
Fig. 3, the ohmic resistance of the choke was 0.5 ohm and not negligi-
ble compared to the 3 ohms of the flashtube. According to Marshak and
Shchoukin, 3 3 circuit inductance less than 100 plh does not significantly
influence the light output from tubular flashtubes, but at 2500 ph the
pulse duration is doubled and the total output is decreased by 30%.
Inasmuch as the present work requires short-duration, high-energy
pulses, circuit inductance has been kept to a minimum and the data
reported herein result with no choke in the circuit.
MEASUREMENTS
Because the primary interest in this work has been confined to the
thermal performance of selected available flashtubes, no measurements
on the effects of varying tubing length or diameter, gas pressure,
voltage gradient, etc. have been included. Extensive studies on these
aspects of flashtube technology have been undertaken by other investi-gators 11,20,33
(1) Current and Voltage. The discharge current through the flash-
tubes was measured by applying to an oscilloscope the voltage drop
across a .001 ohm meter shunt in series between the capacitor bank and
the flashtube.
8
0@
l0
S
200 psec/division
Fig. 3. Oscillogramn showing the effect of a series 0.6 mhchoke on the light output from a FT-625 discharge of 290 itfat 4.0 KV. Upper: no choke in ckt. Lower: identical dis-charge with the choke in the ckt. Vprtical units are thesame for both curves.
9
Similarly, the instantaneous voltage across the flashtubes was
measured by connecting a resistive voltage divider across the tube to
reduce the voltage fed to the oscilloscope by a factor of 500. The
combination of a dual trace oscilloscope and a camera made possible the
simultaneous recording of flashtube voltage and current as a function
of time for single flashes.
In addition, oscillograms showing light output as a function of
flashtube current were obtained by applying the voltage from a photo-
tube circuit to~the vertical amplifier and the voltage resulting from
the flashtube current to the horizontal amplifier of the oscilloscope.
(2) Thermal Irradiance. The chief interest was measurement of
the thermal radiation received by cellulose samples when placed in the
center of the helical flashtubes. A simple, yet accurate calorimeter
for measuring this thermal energy was constructed from a 1.28-cm seg-
ment of .97-cm 0.D. hollow, pure silver cylinder with a wall thickness
approximately 1.0 jm and a total weight of 3.598 gm. Two holes were S
drilled parallel and diametrically opposite to one another in one end
of the cylinder, and a chromel wire was peened into one hole and an
alumel wire into the other to complete the thermocouple circuit through
the element itself. The outer surface only of the cylinder was plati-
nun blackened by deposition from chloroplatinic acid solution. As
shown in Fig. 1, the cylinder was suspended vertically by the thermo-
couple wires and enclosed within a Pyrex jacket which was connected to
a vacuum system and continuously pumped during irradiations. The tem-
perature increment of the calorimeter element resulting from each flash
was measured by connecting the thermocouple leads directly to a Brown-
type potentiometric recorder.
Although the recorder could not follow the temperature increase,
a good cooling curve of the calorimeter element was obtained for each
flash, and this was extrapolated back to the instant of the flash to
give the total temperature increment. Because of the evacuated jacket,
10
the slope of the cooling curves was quite gradual and lent greater
precision to the extrapolations. For the most part, this technique
yielded reasonably good precision in that discharges resulting from
the same settings of voltage and capacity produced temperature incre-
ments reproducible usually within one per cent. The energy absorbed
per square centimeter by the calorimeter from each flash was then cal-
cul'ated from the temperature rise, the known weight of the silver cyl-
inder , its heat capacity, and its surface area. The absorptance of
the Pt black was assumed to be unity. Renewal of. the black was neces-
sary when after about a dozen exposures, the black tended to become
slightly gray. With this experimental technique, it was possible to2
measure cal/cm per flash inside of the helix for numerous combinations
of voltage and capacitance.
(3) Spectral Considerations. Narrow-band interference filters
combined with vacuum phototubes PT-935 and PT-917 were used in con-0
junction with a dual trace scope equipped with a camera to record
simultaneously light intensities at 0.35 and 1.01 microns as a function
of time; this also made it possible to observe any sequential differ-
ence in the short and long wave length portions of the light pulses.
DETIRMINATION OF IRRADIANCE
Ideally, the radiant power as a function of timeewould be measured
using a receiver whose spectral response is flat from 0.3 to 4 micron,
and whose time constant (including leads) is less than 10 ýsec. Unfor-
tunately,black-body radiometers are not that fast. Therefore, to es-0
tablish the time-irradiance characteristics of the flashtubes it is
necessary for each flash to record the light pulse using a photosensi-
tive device whose output is proportional to the irradiance and then
equate the area under this light-time curve to the radiant energy
measured simultaneously by the black-body calorimeter.
i1
In choosing photosensitive detectors to record the shape of the
total radiant pulse from each discharge, the two major factors of con-
cern are spectral response and time response. In general, vacuum photo-
tubes (or multipliers) in circuits having low load resistance are ade-
quately fast, but have poor response in the infrared. Of the possible
phototubes, it was concluded that only those with an S-1 response
(such as the PT-917) give a reasonably close intensity-time represen-
tation of the total thermal pulse. On the other hand, most of the
photoconductors have adequate infrared response, but are much too
slow. Fortunately, one of the lead selenide photoconductors on hand
exhibited =n ade.quately short time response for this work. AJlso, the
PbSe response was assumed to be closer to that of a black-body because
its response extends from below the blue to beyond the infrared limit
of the Pyrex transmission, despite the fact that it is not flat ovfr
this range and tends to exaggerate the longer wave length intensities.
Light measurements for the peak irradiance calibrations described
herein were made by operating the PbSe photoconductor with a series
load of 10 kilohm across 45 volts within the linear range of illumina-
tion vs. current; the output voltage was presented on a Tektronix type
533 oscilloscope and- photographed with a Polaroid Camera.
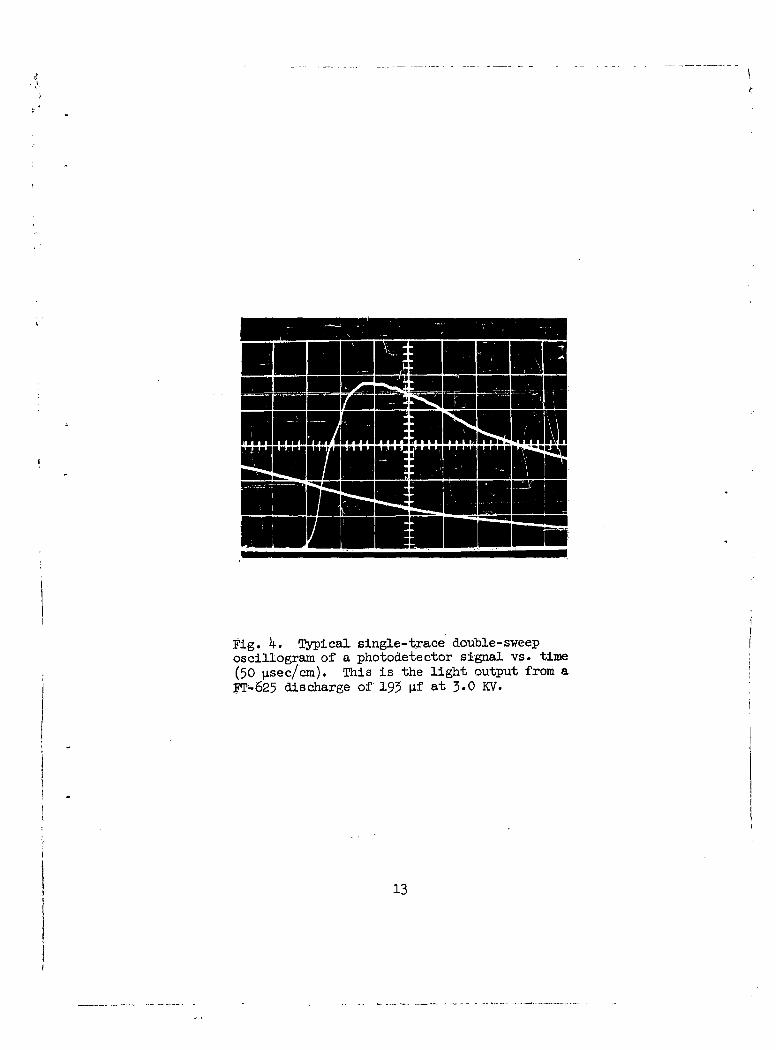
The total area recorded on each oscillogram was doubled by pre-
senting for each flash two sweeps of the scope on one photograph.
This was accomplished by simultaneously triggering the flashtube, the
scope, and a time-delay circuit. The delay circuit tr'iggered a second
sweep on the scope immediately after the first, and thus more of the
tail of the light pulse was recorded; this permitted greater accuracy
in graphical integration of areas under the curves directly from the
oscillograms by the use of a planimeter. Fig. 4 is an example of one
such oscillogram. These areas were determined in units of the divisions
on the oscillograms and equated to the total energy per square centi-
meter received by the calorimeter during the same flash. From this
12
L113
EEEEEE
Fig. 4.Typi cal single-trace double-s weep
13
the irradiance level per vertical division on each oscillogram was-2 -1
calculated and the irradiance in cal-cm sec at any point of time
during the flash could be readily determined.
The order in which identical discharges were repeated for data
acquisition was randomized to avoid systematic errors due to such
causes as loss in calorimeter or photodetector sensitivity. Moreover,
each flash was monitored to verify the reproducibility of the pulse
shape obtained from a given combination of capacitance and voltage.
RESULTS AND DISCUSSION
ELECTRICAL CHARACTERISTICS
In low inductance circuits, the oscilloscopic traces of current
vs. time for the three types of flashtubes show a sharp initial current
or spike which is usually 20 to 80 per cent greater in amplitude than
the main peak. (See Fig. 5.) This spike is the initial cycle of a
highly damped oscillation always present in the ,early portion of the
current pulse; the oscillation is of the order of magnitude of 50 kilo-
cycles and varies with capacitance.
Oscillograms displaying simultaneously the flashtube voltage and
current vs. time show that the resistance of 'the tubes varies somewhat
during discharge, because the current always manifests a faster rate
of decay than the voltage. This non-ohmic relationship is displayed
more clearly in Fig. 6 which presents current as a function of voltage.
At the beginning of the pulse, the resistance is near a minimum and
increases slightly during the discharge. This is in fair agreement
with Carlson.14 Measurements from a number of current-voltage oscillo-
grams show that the average resistance of a FT-625 is nearly independ-
ent of the capacity and voltage and is approximately 2.7 to 3.2 ohms.
14
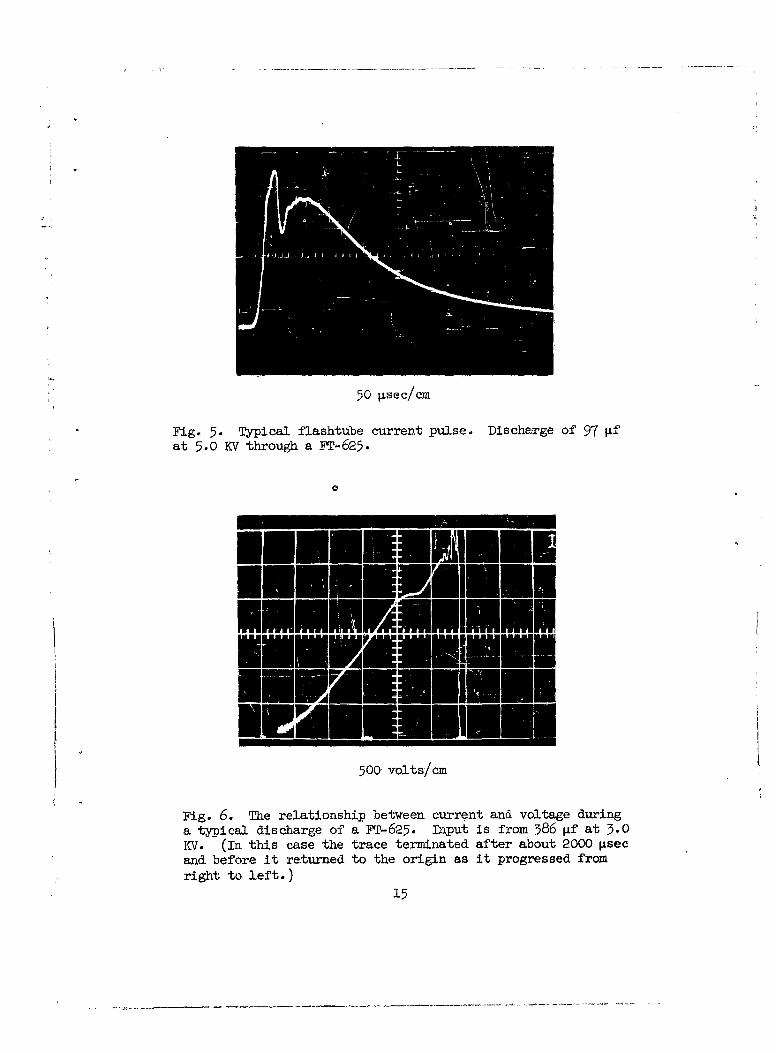
50 tsec/cm
Fig. 5. Typical flashtube current pulse. Discharge of 97 11fat 5.0 KV through a FT-625.
500 volts/cm
Fig. 6. The relationship between current and voltage duringa typical discharge of a FT-625. Input is from 386 ýif at 3.0KV. (In this case the trace terminated after about 2000 ILsec
and before it returned to the origin as it progressed from
right to left.)15
However) a more significant quantity is the dynamic resistance, i.e.,
• the slope of that part of the current-voltage curve which corresponds
to the major portion of the decay. This is about 1.8 to 2.2 ohms for
the FT-625. For any of these discharges, a plot of the logarithm of
the instantaneous current vs. time yields a straight line over most of
the tail, thus showing that at least part of the current flow has an
exponential decay. Moreover, the measured time constant, t, of this
exponential decay agrees with the value calculated from t = RC where
R is the dynamic resistance of the flashtube. The resistance values
of the FT-524 evidence somewhat greater variation with circuit para-
meters. Tntz avcrage resia-cazice 'f-1 .ýihi-, ')c o-~ ;oms
and the dynamic resistance is approximately 2 to 3 ohms.
RADIANT EMISSION
@
Although the behavior of electric discharges within the flash-
tubes is of considerable complexity, 7 ,10,11,15,30,33 it is clear that
the observed light emissions for a given tube are controlled by the
electrical parameters of the external circuit.7,9,13,14,17232428
31,33 The shape, duration, and intensity of the light pulse depends
on several factors including (1) type and shape of flashtube, (2) total
capacitance, (3) voltage to which capacitors are charged, (4) induct-
ance and resistance in the discharge circuit, and (5) per cent of cir-
cuit energy expended in the flashtube. Factors other than circuitry,
such as reflectors and location of specimen with respect to the flash-
tube, also have significance.
Information in the literature on the spectral distribution of the
light emitted by the discharge of flashtubes is meager. Nevertheless,
it is realized that the spectral distribution is a function, primarily,
of the current density which, in turn, is dependent on the voltage
across any given tube. Olsen and Huxford17 have suggested that the
16
densely ionized plasma radiates as a "gray body" and exIibits a spec-
tral maximum which is temperature dependent. Various investigators 1 0'
14,15,16,18,19,30 report information within limited portions of the
spectrum showing that the xenon discharge light is essentially white
and continuous in the visible region; however, at low current densities
or low gas pressures (below about 40 nmm Hg)., the continuum is replaced21 19
by the xenon.line spectrum. Barstow has pointed out that there isadequate IR from the flashtube discharpge to make it a source for the
near IR. One of the best references on spectral distribution is the
General Electric Flashtube Manual.28 These sources agree that the
major spectral peak is aroliad 4500 R and a broad minor peak lies
between 8000 to 10,000 R with only a shallow dip between them. The
relative heights of the two peaks is contingent upon the initial dis-
charge voltage for any given flashtube. At the comparatively high
voltagesthe shorter wave-length peak predominates, but near the mini-
mum operating voltage the longer wave-length peak is nearly equal in
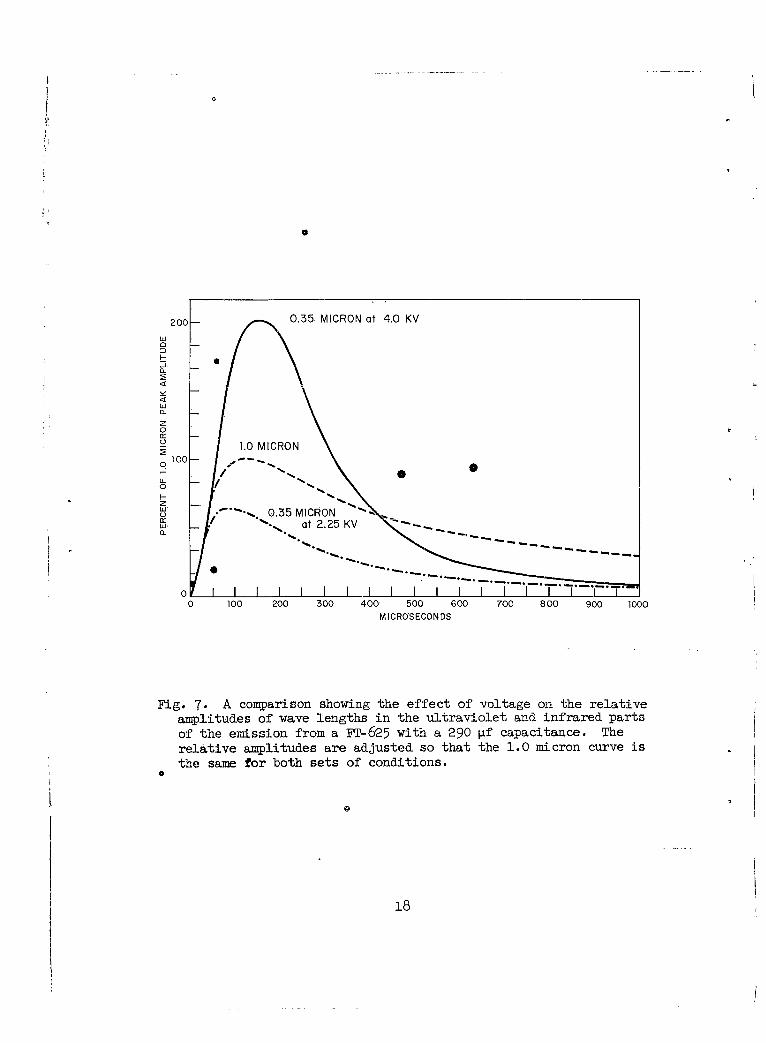
intensity. This effect is shown in Fig. 7, alth6ugh here the dominance
of the blue region is somewhat reduced because the intensity at 3500 R
is less than at the 4500 R peak. Radiations from xenon discharges are
often compared to those of black-body radiators at temperatures of 6000
to 70000K 14,15,16 however, such consideration is usually valid only
for the visible partoof the spectrum.
This effect of voltage on the spectral distribution shows up in
the field calorimeter experiments which determined the amount of energy
at wave lengths longer than 1.0 micron. (See Table I.) Because the
transmission characteristics of the Corning No. 7-56 filter extend to
nearly 2.8 micron, it is reasonable to assume that these values repre-
sent a good approximation to the total energy radiated by a quartz
flashtube beyond 1.0 micron.
17
I0
U-0f
z
W I.".. 0.35 MICRON"\~~U a -. . .t 2.25 KV " - ...... ...0
0 100 200 300 400 500 600 700 800 900 1000MI0CROSECONS
Fig- 7. A comparison showing the effect of voltage on the relativeamplitudes of wave lengths in the ultraviolet and infrared partsof the emission from a FT-625 with a 290 ýLf capacitance. Therelative amplitudes are adjusted so that the 1.0 micron curve isthe same for both sets of conditions.
18
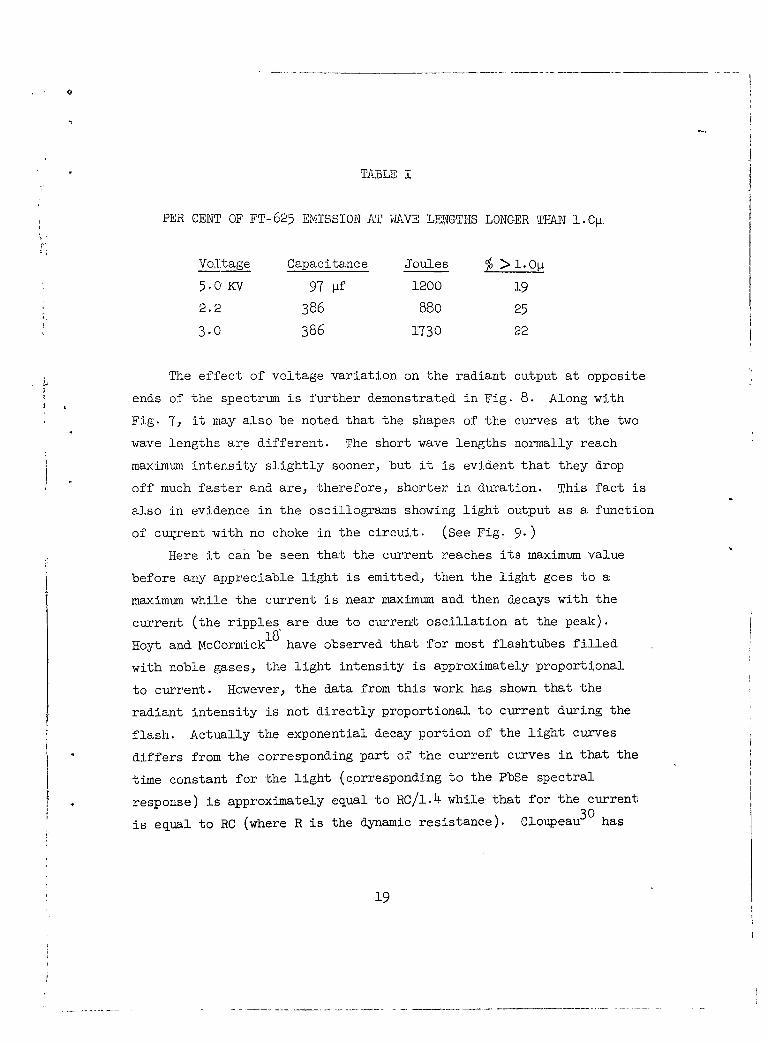
TABLE I
PER CENT OF FT-625 EMISSION AT WAVE LENGTHS LONGER THAN 1. C0.
Voltage Capacitance Joules % > i.O•i
5.0 KV 97 ilf 1200 19
2.2 386 880 25
3.0 386 1730 22
The effect of voltage variation on the radiant output at opposite
ends of the spectrum is further demonstrated in Fig. 8. Along with
Fig. 7, it may also be noted that the shapes of the curves at the two
wave lengths are different. The short wave lengths normally reach
maximum intensity slightly sooner, but it is evident that they drop
off much faster and are, therefore, shorter in duration. This fact is
also in evidence in the oscillograms showing light output as a function
of current with no choke in the circuit. (See Fig. 9.)
Here it can be seen that the current reaches its maximum value
before any appreciable light is emitted, then the light goes to a
maximum while the current is near maximum and then decays with the
current (the ripples are due to curren-t oscillation at the peak).18
Hoyt and McCormickI have observed that for most flashtubes filled
with noble gases, the light intensity is approximately proportional
to current. However, the data from this work has shown that the
radiant intensity is not directly proportional to current during the
flash. Actually the exponential decay portion of the light curves
differs from the corresponding part of the current curves in that the
time constant for the light (corresponding to the PbSe spectral
response) is approximately equal to RC/l.4 while that for the current
is equal to RC (where R is the dynamic resistance). Cloupeau70 has
19
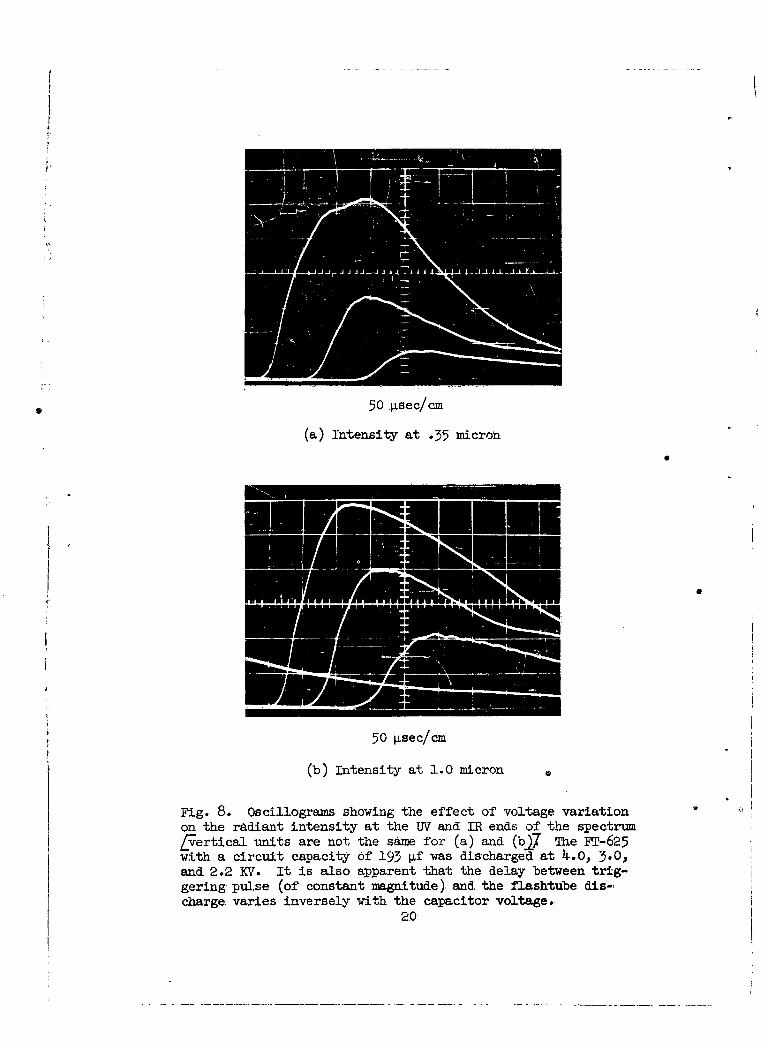
50 gsec/cm
(a) Intensity at 15. micron
*uu~mmum.um
50 Igsec/cm
(b) Intensity at 1.0 micron
Fig. 8. Oscillograms showing the effect of voltage variationon the radiant intensity at the UV and IR ends of the spectrumfyertical units are not the same for (a) and (bJ7 The FT-625with a circuit capacity of 193 pf was discharged at 4.0, 3.0,and 2.2 KM. It is also apparent that the delay between trig-gering pulse (of constant magnitude) and the flashtube dis-charge varies inversely with the capacitor voltage.
20
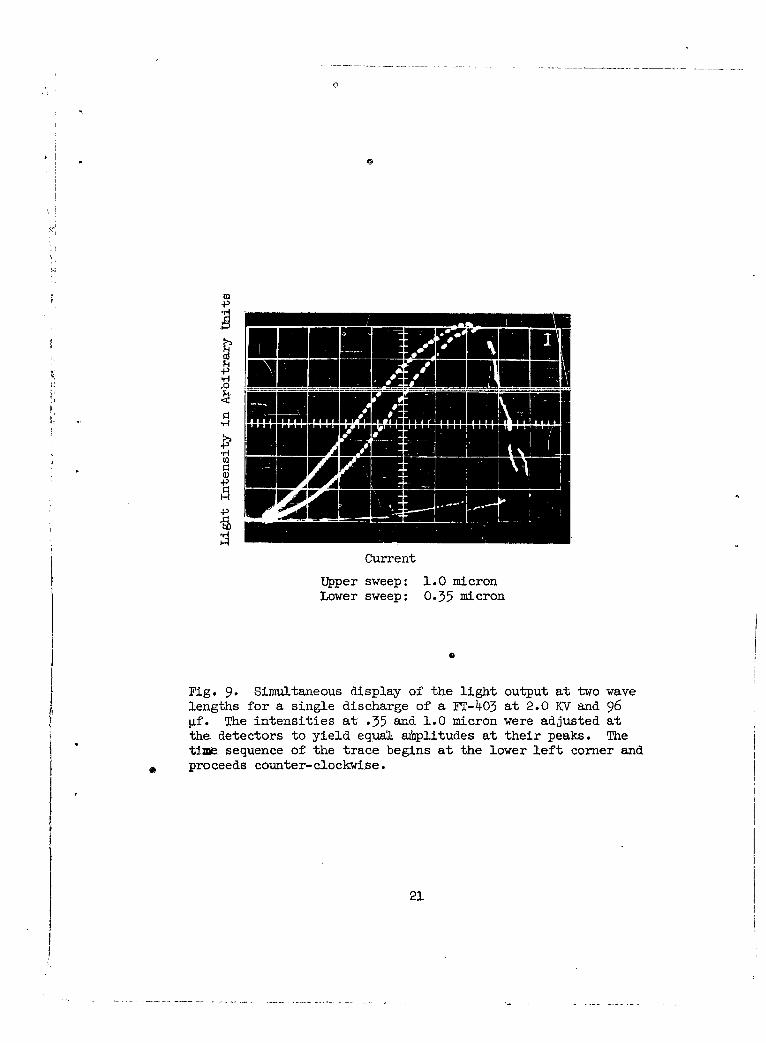
C
S-E
Current
Upper sweep: 1.0 micronLower sweep: 0.35 micron
0
Fig. 9. Simultaneous display of the light output at two wavelengths for a single discharge of a FT-403 at 2.0 KV and 96pf. The intensities at .35 and 1.0 micron were adjusted atthe detectors to yield equal. amplitudes at their peaks. Thetim. sequence of the trace begins at the lower left corner andproceeds counter-clockwise.
21
reported that the light (except in the blue region) continues after
the end of the electric discharge, but this was not observed in the
comparatively long time-duration discharges reported here.
EdgertonA Bonazoli, and Lamb 9 have defined flash duration as the
time lapse between the one-third points of the peak light pulse, and
this has become a widely accepted standard. However, this work has
revealed that pulse width,7-, defined as the time lapse between the
1/f points of the peak is more useful, because the product of the
peak height and ?- is equal to the area under the curve to within 5%.The dependence of 7-on the voltage and capacitance is exhibited in
Fig.-10a and 10b wherein each point represents. an .aveage detexined
from several oscillograms displaying the signal from the PbSe photo-
detector vs. time. From these graphs, it is evident that the circuit
capacitance has predominant influence on the flash duration, and above
approximately 800 joules r varies linearly with the capacitance.
CORRELATION BETWEEN ELECTRICAL INPUT AND THERMAL OUTPUT
Two attractive features of employing flashtubes as sources of
thermal radiation are (1) the good reproducibility obtained from
flash to flash by duplicating the external electrical parameters V
and C and (2) the ease of adjusting the shape, magnitude, and duration
of thermal pulses by simple variation of these same parameters, both
of which are easy to measure. The range over which these thermal
pulses can be varied is dictated, primarily, by the electrical
operating limits for each type of flashtube.
The relationship between the radiant energy incident at the axis
of the helical flashtube and the electrical energy dissipated in the
flashtube is shown in Fig. 11 where each point represents an average
of several flashes. The 4.5 and 5.0 KV points are somewhat low
presumably because at the higher voltages a larger per cent of the
22
P4
p4-
w-4A
'7 0
0.0
N< 0
-J
-PLC
a0) C~)043
O 0 0. 0 0 0 CO 0 O0 0 0 0 4 0 0O ) a o r- t0 o cl- N
(SON003SO~IV) Noli1v~fl HSv-U
I0
4-14
(D -r
100 -P
I I IO L 0L 0 0 0 0 d
o ~~~ id W 4QC
(So OO~S~OIJ) NIJ.fl0 Sa)
23 P
3.6
3.2
2.8 --
2. - FT- 524C /(without quartz insert)/
2.0 -
FT- 625z (with quartz insert)
1.6z
1.2o -- 3.0 KV
A - 3.5 KV0 -4.0 KV
0.8 - * - 4.5 KV
/ // ,, 0 -- 5.0 KV
0.4 -/
/ I
0 400 800 1200 1600 2000 2400 2800 3200
ELECTRICAL INPUT (JOULES)
Fig. U. Radiant energy for each flash as a function
of electrical input energy
24
radiant energy is in that part of the short wave-length region not
transmitted by the Pyrex calorimeter envelope.
The electrical input shown here is only that energy expended in
the circuit:
E is in joules when the voltages are expressed in kilovolts and the
capacitance in microfarads. V. is the initial voltage across the
capacitance and Vf the residual voltage after discharge. This rela-
tionship holds for the flashtube itself only if the ohmic losses in
the external circuit are negligible. The presence of an inductive
component will not alter the relationships shown in Fig. 11, but
because the resistance of a large flashtube is only about three ohms,
a choke with even a small resistance will introduce significant losses
and will reduce the radiant output, thereby decreasing the slope of
the line in Fig. 11. It is evident from this plot that
Q= kE (2)
where Q is the total radiant energy per square centimeter per flash
along the interior axis of the flashtube, and from this it is clear
that Q is directly proportional to both voltage squared and capaci-
tance. Another significant fact here is that with each type of flash-
tube, k has the same value for all combinations of voltage and capaci-
tance, i.e., the radiation efficiency is constant over the ranges of
C and V employed. From Table II, it is apparent that the FT-625 on a
per unit area basis is not the most efficient of the flashtubes, but
its chief advantage is its greater energy handling capability.
* The extinction voltage is about 200 volts for the large flashtubes.
25
TABLE II
VALUES OF k RELATING FIASHTUBE RADIANTENERGY TO ELECTRICAL INPUT ENERGY
G. E. Flashtube k
FT-625 1.10 x 10⁻³ cai cm" 2 Joule- 1
FT-503 1.71 x 10⁻³
FT-403 1.4 x lo-3
The reduction in irradiance due to the Pyrex jacket and the
quartz insert was also measured. It was found that for 3-KV discharges
with no insert present, the k values should be increased 7.0 per cent,
and without the Pyrex tubing, an additional 7.5 per cent should be
added. This is in close agreement with the typical value of 8 per
cent reflective loss through two surfaces. These same increases
should be added to peak irradiances under similar conditions. Apply-
ing these corrections to the FT-625 will give k = 1.27 x 10⁻³ cal.cm-2
joule which is a little higher than the 1.0 x 1-0 value obtained
from the graph of Kuebler and Nelson27 for discharges with their low
inductance capacitor bank and a similar flashtube; however, most of
this discrepancy can be attributed to a difference in reflectors.
Their second and much lower value of k resulting from a circuit which
included a choke indicates that the choke probably had significant
resistance.
PEAK IRRADIANCES
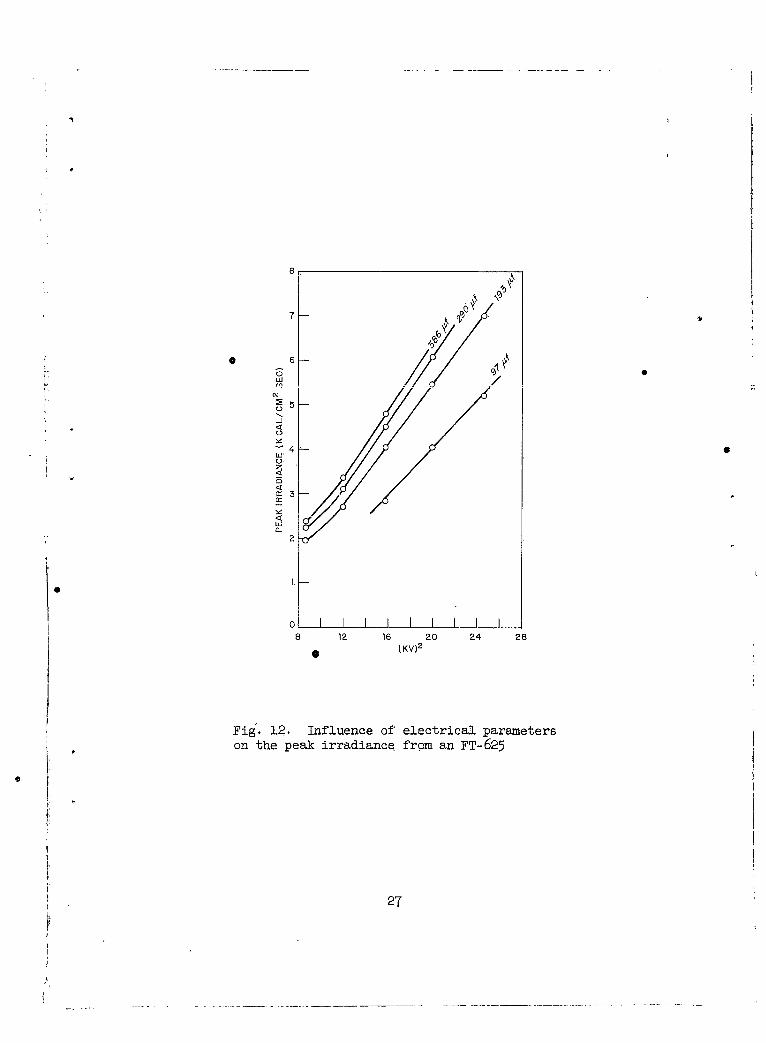
The peak irradiances obtained from the FT-625 (no choke in cir-
cuit) in conjunction with various combinations of electrical parameters
are presented in Fig. 12. As might be expected, the voltage is the
most influential factor on this particular property, and it is a
linear function of the voltage squared and tends to be independent
26
81.
0C-)
7J - 0 /
w'
6
Ch,z<
0~
0 I II I I I I I I
8 12 16 20 24 280 (KV) 2
Fig. 12. Influence of electrical parameterson the peak irradiance from an FT-625
27
JI
of capacitance at the higher values of capacitance.
Although all the values for Fig. 12 were obtained by integrating
the light pulses as previously described, it was found that the rela-
tionship
"H • (3)p
gives results which are very close to these values yet much more
readily obtained., Moreover, by substituting equations (1) and (2)
into (3), a very good approximation to the peak irradiance can be
easily calculated:kC 2 2) (4), .(v. - v )
Here the last term may be neglected and the resulting simplified ex-
pression is"kC 2
Hp 2r i
TEMPERATURE
Nelson and Lundberg3 have calculated some temperature rises of
flash-irradiated finely divided materials and have shown that the
optimi•m size for rod-shaped objects is approximately 10 microns in
diameter. Experimentally, they were able to evaporate tungsten wire
explosively at 5184 Joules. Within this project, the technological
obstacles to the measurement of high temperatures over very short
times have deterred atte:mpts to actually measure the temperatures
attained in irradiated materials. Nevertheless, included in this
work have been some approximate determinations of attainable temper-
atures by utilizing the melting points of several metails. With input
energies of about 1500 joules into the FT-625, single discharges
melted fine copper mesh (1083 0 c), nickel mesh (145200), and 0.5 mil
blackened platinum wire (175500). Additional experiments have dem-
onstrated that the energy required to melt one-mil, platinum-blackened
28
copper foil is 1700 joules which.corresponds to slightly less than
2.0 cal/cm2 radiant energy. Thus, the absorbed energy required to
melt the copper foil is 3.9 cal/cm and this is a reasonable correla-
tion with the value of 3.7 cal/cm calcuated from the specific heat
and hdat of fusion.
Since these temperatures were obtained using only comparatively
low energies and irradiances, it is clear that the heating of solid
materials to considerably higher temperatures is well within the
realm of possibility with this same equipment.
ERRORS
To check for possible errors resulting from either electrical
pick-up or inductive heating of the calorimeter, and opaque dielectric
cylinder was placed around the calorimeter which was within the flash-
tube in its normal position. Discharges of 1730 joules each produced
no perceptible voltage from the calorimeter thermocouple.
One source of error which must be considered is the extrapolation
of cooling curves to determine the temperature increment of the calo-
rimeter element for each flash. However, this was not a serious prob-
lem with the vacuum calorimeter) because the silver cylinder equili-
brated thermally in 4 seconds and the subsequent rate of cooling
normally was approximately 2% per second. The typical standard
deviation on a series of extrapolated temperature increments was a
+ .4%. The absorptivity of the Pt black surface of the Ag calorimeter
element was assumed to be 1.00. The reflectance of Pt black on silver32
has been studied previously and found to be constant at slightly
less than 2% from 0.25 to 2.5-; however, there is a slight absorption
by some of the unblackened portions of the Ag cylinder which are ex-
posed to the radiant flux, and this small contribution was regarded
as making an equivalent net absorptance of close to unity for the
29
blackened surface. Losses due to black body radiation were con-
sidered to be negligible, because the temperature increments were less
than 6o C. Thus, the accuracies for the values of Q are judged to be
within + 3% at least for a specific flashtube.
Values given for peak irradiances suffer inherently from errors
of much greater magnitude than those for total irradiance per flash.
In addition to the errors already mentioned, the graphical determina-
tion of the area under the time-intensity curves is the least accurate.
Moreover, the proximity of the photodetector response to a black-body
receiver is a factor in describing the shape of this curve and the
consecuent rate. at which the energy is delivered. Thus, the values
of irradiance are considered to be accurate only within + 5-10%.
0
00
30
30f
REFERENCES
1. 0. Lundstrom, Varian Associates Engineering Report No. 257-1F(Sept. 1959).
2. J. L. Lundberg, L. S. Nelson, (Bell Labs) Nature 179, 367-8
(Feb. 1957).
3. L. S. Nelson and J. L. Lundberg, J. Phys. Chem. 63, 433-6(Mar. 1959).
4. J. L. Lundberg and L. S. Nelson, Nature 183, 1560-62 (June 1959).
5. Loyd S. Nelson, Chem. Eng. News, (June 8, 1959).
6. L. S. Nelson and N. A. Kuebler, (Conference on Physical Chemistry
"in Aerodynamics and Space Flight, Philadelphia, Pa., Sept. 1-3
1959) Pp. 61-67.
* 7. P. M. Murphy and H. E. Edgerton, J. Appl. Phys. 12, 848-55
(Dec. 1941).
8. H. E. Edgerton, J. Opt. Soc. Am. 36, 390-9 (July 1946).
9. H. E. Edgerton, Robert Bonazoli, J. T. Lamb, J. Soc. MotionPicture and TV Engrs. 63, 15-17 (July 1954).
10. H. E. Edgerton and P. Y. Cathou, Rev. Sci. Instr. 27_, 821-5
(Oct. 1956).
11. G. W. LeCompte and H. E. Edgerton, J. Appl. Phys. 27, 1427-30
(Dec. 1956).
12. H. E. Edgerton, (Second International Conference on Quantum
Electronics, Berkeley, California, 23 March 1961).
13. F. E. Carlson and D. A. Pritchard, Illuminating Engineering, 42,235-48 (Feb. 1947).
14. F. E. Carlson, J. Soc. Motion Picture Engrs. 48, 395-405(May 1947).
15. J. N. Aldington and A. J. Meadowcroft, Inst. Elect. Engrs.
(London) 95, part. Ii, 671-8 (Dec. 1948).
16. A. J. Meadowcroft, Phot. J. 89B, 51-3 (1949).
17. Olsen and Huxford, J. Soc. Motion Pictures and TV Engrs. 55,285-98 (Sept. 1950).
31
*I
18. G. D. Hoyt and W. W. McCormick, J. Opt. Soc. Am. 40, 658-63(Oct. 1950).
19. F. E. Barstow, J. Soc. Motion Picture Engrs. 55, 485-95(Nov. 1950).
20. F. I. Vasiliev, M. S. Levchuk, I. S. Marchak, Optics and Spec-troscopy (USSR Academy of Sciences 11, No. 1, July 1961)pp. 118-22..
21. M. J. Christie and G. Porter, Proc. Roy. Soc. (London) A212,
390-406 (1952).
22. R. G. W. Norrish and Porter, Faraday Soc. Discusns. 17, 40-6
(195 ).
23. S. Claesson and L. Lindqvist, Arkiv Kemi 11, 535159 (1957).S24. So Claesson and L. Lindq~vist, Arkiv Kemi 12, 1-8 (1958).
25. J. Berchtold and J. Eggert, Naturwissenchaften 40, 55-6 (1953).
26. J. Eggert, J6 Phys. Chem. 63, 11-15 (Jan. 1959).
27. N. A. Kuebler and L. S, Nelson, J. Opt. Soc. Am. 51, 1411-16
(Dec. 1961).
28. Flashtube Data Msanual, General Electric Co., Photo Lamp Dept.,Nela Park, Cleveland 12, Ohio.
29, A. Broido and A. B. Willoughby, U. S. Naval Radiological Defense
Laboratory Technical Report 35 (Feb. 1955).
30. M. Cloupeau, Comp. rend. 244, No. 1, 745-6 (1957).
31. D. P. C. Thackery, (Proc. Third Intern. Congress on High-Speed
Photography, Sept. 1956) pp. 21-9.
32. S. B. Martin, U. S. Naval Radiological Defense Laboratory
Technical Memorandu 76 (Oct. 1957).
33. I. S. Mashak and L. I. Shchoukin, J. Soc. Motion Picture Engrs.
70, 169-76 (Mar. 1961).
32
INITIAL DISTRIBUTION
NAVY
3 Chieff, Bureau of Ships (Code 335)1 Chieff, Bureau of Shipe, (Code 320)•2 Chief, Bureau. of Ships (Code 6850)I Chief, Bureau of Naval Weapons (RMA-1I)2 Chief, Bureau of Yards and Docks (Code 74)I1 Chief, Bureau of Yards and Docks (Code C-400)3 Chief of Naval Operations (Op-07T)1 Chief of Naval Research (Code 104)I Commander, New York Naval Shipyard (Nterial Lab-)3 Director, Naval Research Laboratory (Code 2021)I Office of Naval Research (Code 422)10 Office of Naval Research, FPO, New YorkI CO, Office of Naval Research Branch Office, SFi CO, U.S. Naval Civil Engineering laboratoryi. Commander, Naval Air Material Center, PhiladelphiaI Naval Medical Research Institute1 U.S. Naval Postgraduate School, Monterey3. Commander, Naval Ordnance Laboratory, Silver Spring1 0C, Naval Nuclear Ordnance Evaluation Unit (Code 4011)!. Office of Patent Cowisel, San Diego1 Commandant of the Marine Corps (AO3H)
ARMY
I Chiel of Research and Development (Atomic Division)3. Chief of Research and Development (Life Science Division)1 Doputy Chief of Staff for Military Operations (CBR)j Office of Assistant Chief of Staff, G-2! Chief of Engineers (EGOMC-EB)3I Chief of Engineers (EENGMC-D4)1 Chief of Engineers (ZNGCW)I CG, ArmW Materiel Comand (AMCRD-DF-NE)I. c0, Ballistic Research Laboratories.I C0, USA OBR Agency, Maryland
I. 0C, USA CDR Combat Development Agency, A3,abama
33
1 CO, Fort McClellan, Alabama1 Commandant, Chemical Corps Schools (Library)1 CO, Chemical Research and Development Laboratories1 Commander, Chemical Corps Nuclear Defense Laboratory1 Hq., Army Environmental Hygiene Agency1 CG, Aberdeen Proving Ground1 Director, Walter Reed Army Medical Center1 CG, Combat Developments Command (CDCMR-V)1 CG, Quartermaster Res. and Eng. Command1 Hq.,.Dugway Proving Ground3 The Surgeon General (MEDNE)1 CO, Arny Signal Res. and Dev. Laboratory1 CG, Army Electronic Proving Ground1 CG, EAgineer Res. and Dev. Laboratory1 Director, Office of Special Weapons Development
L 1 CO, Army Research Office1 CO, Watertown Arsenal1 CG, Mobility Command1 CG, Munitions Command1 CO, Frankford Arsenal1 CG, Army Ordnance Missile Command
AIR FORCE
1. Assistant Chief of Staff, Intelligence (AFCIN-3B)6 CG, Aeronautical Systems Division (ASAPRD-NS)1 Directorate of Civil Engineering (AFOCE-ES)1 Director,' USAF Project RAND1 Commandant, School of Aerospace Medicine, Brooks AFB1 Office of the Surgeon (SUP3.1), Strategic Air Command1 CG, Special Weapons Center, Kirtland AFB1 Director, Air University Library, Maxwell AFB2 Courander, Technical Training Wing, 3415th TTG1 Commander, Electronic Systems Division (CRZT)
OTHER DOD ACTIVITIES
3 Chief, Defense Atomic Support Agency (Library)1 Commander, FC/DASA, Sandia Base (FCDV)1 Commander, FC/DASA, Sandia Base (FCTG5, Library)1 Commander, FC/DASA, Sandia Base (FCWT)2 Civil Defense Unit, Arny Library10 Armed Services Technical Information Agency1 Director, Armed Forces Radiobiology Research Institute2 Office of Civil Defense, Washington
34
AEC ACTIVITIES AND OTHERS
1 Research Analysis Corporation1 Texas Instruments, Inc. (Mouser)1 Aerojet General, Azusa1 Aerojet General, San Ramon1 Allis-Chalmers Manufacturing Co., Milwaukee1 Allis-Chalmers Manufacturing Co., Schenectady1 Allis-Chalmers Manufacturing Co., Washington1 Allison Division - GMC2 Argonne Cancer Research Hospital10 Argonne National Laboratory1 Armour Research Foundation1 Atomic Bomb Casualty Commission1 AEC Scientific Representative, France1 AEC Scientific Representative, Japan3 Atomic Energy Commission, Washington
S4 Atomic F1ergy of Canada, Limited4 Atomics International2 Babcock and Wilcox Company2 Battelle Memorial Institute2 Beers, Roland F., Inc.4 Brookhaven National Laboratory1 Carnegie Institute of Technology1 Chance Vought Aircraft Corp.1 Chicago Patent Group1 Columbia University (Havens)1 Columbia University (S00-187)1 Combustion Engineering, Inc.I Combustion Engineering, Inc. (NRD)1 Committee on the Effects of Atomic Radiation5 Defence Research Member3 duPont Company, Aiken1 duPont Company, Wilmington1 Edgerton, Germeshausen and Grier, Inc., Las Vegas1 Franklin Institute of Pennsylvania1 Fundamental Methods Association2 General Atomic Division1 General Dynamics/Astronautics (NASA)1 General Dynamics/Convair, San Diego (BuWeps)1 General Dynamics, Fort Worth2 General Electric Company (ANPD)2 General Electric Company, Cincinatti1 General Electric Company, Pleasanton6 General Electric Company, Richland
35
1: i General Electric Company, St. Petersburg1 General Electric Company, San JoseS 1 General Nuclear Engineering Corporation1 General Scientific Corporation1 Gibbs and Cox, Inc.S1 Goodyear Atomic Corporation1 Holmes and Narver, Inc.1 Hughes Aircraft Company, Culver City2 Iowa State University2 Jet Propulsion Laboratory3 Knolls Atomic Power Laboratory"2. Lockheed-Georgia Co.I Lockheed Mis,iles and Space Co. (NASA)2 Los Alamos Scientific Laboratory (Library)1 Lovelace Foundation1 Maritime Administration1 Marquardt Corporation1 Martin Marietta Corp.2 Massachusetts Institute of Technology2 Midwestern Universities Research Association1 Mound Laboratory1 NASA, Landley Research Center1 NASA, Lewis Research Center2 NASA, Scientific and Technical Information Facility1 National Bureau of Standards (Library)2 National Bureau of Standards (Taylor)1 National Lead Company of Ohio'2 Nevada Operations Office1 New Brunswick Area Office1 New York Operations Office1 New York University (Benderson)1 New York University (Richtmeyer)1 Northeastern University1 Nuclear Materials and Fquipment Corporation1 Nuclear Met'als, Inc.1 Oak Ridge Institute of Nuclear Studies1 Office of Assistant General Counsel for Patents1 Pennsylvania State University4 Phillips Petroleum Company (NRTS)1 Power Reactor Development Company3 Pratt and Whitney Aircraft Division1 Princeton University (White)1 Public Health Service, Las Vegas1 Public Health Service, Montgomery2 Public Health Service, Washington1 Purdue University
36
.1 Rensselaer Polytechnic Institute1 Sandia Corporation, Albwquerquei Sandia Corporation, Livermore1 Space Technology Lab., Inc. (NASA)
S1 Stanford University (Slac)1 Stevens Institute of Technology1 Technical Research Group1 Tennessee Valley Authority1 Texas Nuclear Corporation2 Union Carbide Nuclear Company (ORGDP)5 Union Carbide Nuclear Company (ORNL)S1 Union Carbide Nuclear Company (Paducah Plant)2 United Nuclear Corporation (NDA)3 U.S. Coast and Geodetic Survey, Washington1 U.S. Geological Survey, Denver1 U.S. Geological Survey, Menlo Park1 U.S. Geological Survey, Naval Weapons Factory1 U.S. Geological Survey, Washington2 University of California Lawrence Radiation Lab., Berkeley4 University of California Lawrence Radiation Lab., Livermore1 University of California, Los Angeles1 University of Puerto Rico1 University of Rochester (Atomic Energy Project)2 University of Rochester (Marshak)1 University of Washington (Geballe)1 University of Washington (Rohde)1 Western Reserve University (Major)4 Westinghouse Bettis Atomic Power Laboratory-2- Westinghouse Electric Corporation (Rahilly)1 Westinghouse Electric Corporation (NASA)1 Yale University (Breit)1 Yale University (Schultz)1 Yankee Atomic Electric Company25 Technical Information Service, Oak Ridge
UMRDL
30 USRDL, Technical Information Division
DISTRIBUTION DATE: 1 April 1963
37
0
01 0 .
0 I
od
-000~1I
4L) 0 .
00(n z . 04 ()0 '(J4)
'o, 'o I rCl) .0
01) 11 0,
In -) U4 1 -" 2 ;
4'.)0
~_ *> o2 0 4) 4)*
-w 00 a 4.0 U 4,
u ~0'd 'o> 0 0
(d (1) 0.. E4)) 4 c
Id cow E O. 4. E o4
~~~ -co .04) 0
-0 "-). =
0 0
.0 o .0 cd
Pý L0 0C4 00
~~411J)4)o 4)* ) 0 Z
Cd E0 44) 0 4)
to. z S) 0 C4 '*Li) '- 0 40,4 o
0,
to a)
2~
o *.0 01 t q
z ci